government of tamilnadu - …environmentclearance.nic.in/writereaddata/online/... · government of...
TRANSCRIPT
GOVERNMENT OF TAMILNADU
PUBLIC WORKS DEPARTMENT
WATER RESOURCES DEPARTMENT
TRICHY REGION, TRICHY.
ADB IND(44429):CLIMATE ADAPTATION THROUGH SUB-BASIN DEVELOPMENT PROGRAM
PROJECT OF VENNAR SUB-BASIN OF CAUVERY BASIN
Infrastructure Improvements and Reconstruction Works
DETAILED PROJECT REPORT

Contents – Volume I
Chapter Title Page
Check List 1
Salient Features 9
Introduction 19
1.1 Background 19
1.2 Water Resources Issues in the Cauvery Delta 20
1.2.1 Introduction 20
1.2.2 Cauvery River 21
1.2.3 Availability of Water Resources 22
1.2.4 Water Resources Management 24
1.2.5 Climate Change 26
1.3 State Government Responses to Water Resources Issues
27
1.3.1 IAMWARM Project 27
1.3.2 Cauvery Modernisation Proposal 28
1.3.3 Climate Adaptation through Sub basin Development Programme
28
1.4 The Design of CASDP 29
1.4.1 Rationale 29
1.4.2 Impact 30
1.4.3 Outcome 30
1.4.4 Outputs 30
1.4.5 Implementation of CASDP 33
1.4.6 Execution of this Project 35
1.4.7 Execution of CASDP follow on project 37
1.5 River Basins 39
1.5.1 India 39
1.5.2 TamilNadu 40
1.6 The Cauvery Basin 42
1.6.1 Description 42
1.6.2 Drainage Area 42
1.6.3 Population 46
1.6.4 Tributaries of Cauvery 47
1.6.5 Unique Feature of Cauvery 47
1.6.6 Upper Anicut 47
1.6.7 Grand Anicut 48
1.6.8 The delta 48
1.6.9 Tailend Regulator 48
1.6.10 Rainfall 49
1.6.11 Soils 51
1.6.12 Development of Irrigation 52
1.6.13 Storage in the Cauvery Basin 53
1.7 The Cauvery Basin in TamilNadu 58
1.7.1 Extent 58
1.7.2 Irrigation Development 59
1.7.3 Irrigation in 1901-02 63
1.7.4 Irrigation in 1928-29 64
1.7.5 Development between 1928 and 1956 64
1.8 Cauvery Delta System 67
1.8.1 Brief narrative report 67
1.8.2 Land holdings 68
1.8.3 Rainfall 69
1.8.4 Barrage on the Cauvery 69
1.8.5 Grand Anicut 70
1.8.6 Improvements to the Origional structure (G.A) 71
1.8.7 Monsoons and their influence 77
1.8.8 Floods and Drainage on the Delta 78
1.8.9 Floods from the catchment lying between upper anicut and grand anicut
78
1.9 Vennar Basin 81
1.9.1 A brief narration 81
1.9.2 Details of Main drain and stages of drains during the flood 83
1.9.3 Need and necessity of the scheme 86
1.9.4 Vedharanyam Canal 86
1.9.4 The straight cuts 86
1.9.6 Pumping schemes
87
2 Hydrology 96
2.1 Rainfall 96
2.2 River Flow 96
2.3 Droughts 99
2.4 Climate Change 99
3 Reservoir 103
4 Barrages (Anicuts) 104
5 Land Potential 105
5.1 Soils 105
5.2 Land Use 110
6 Cropping Pattern and crop water Requirements 111
6.1 Details of current cropping pattern and crop calendar 111
6.1.1 Current cropping pattern 111
6.1.2 Paddy cultivation in the vennar system 112
6.1.3 Rice water requirements and productivity 112
6.2 Details of original cropping pattern and crop calendar 114
6.3 Future Cropping Patterns 114
6.4 Assessment of Effective Rainfall and Crop Water Requirements 115

6.4.1 Potential evaporation and effective rainfall 115
6.4.2 Agro-climatic zone 118
6.4.3 Water requirement and irrigation schedule 119
6.5 Assumed conveyance efficiecies 120
6.6 Irrigation water requirments 120
7 Aquaculture 121
7.1 Introduction 121
7.2 Area of Shrimp Farming 121
7.3 Water use 123
7.4 Future Development of Shrimp 123
7.5 Best Management Practices 123
8 Horticulture 124
9 Others 125
10 Water Demand 126
10.1 State level 126
10.2 Basin level 126
10.3 Agricultur Demand inVennar system 127
10.4 Water demand for Aquaculture 131
10.4.1 Present water Use 131
10.4.2 Future water Use 131
10.5 Power Generation 132
10.6 Industry 132
10.7 Return flow from Domestic, Commercial and Industrial Water Use
133
10.8 Drinking water Demand 133
10.9 Summary of Demand 134
11 Impact of Proposed Works 135
11.1 Project and Adjoining Area 135
11.2 Project Description and Proposed works 136
11.3 Aims and objectives of the proposed works 136
11.4 Inter – State Aspects 137
11.5 Impact on Upstream Area 137
11.6 Impact on Downstream Area 137
12 International / Interstate Aspects 138
12.1 Agreements 138
12.2 Cauvery Fact Finding Committee 139
12.3 Cauvery water Disputes Tribunal 139
13 Canal System 146
13.1 Climate Resilient Adaptations in the Vennar System 146
13.1.1 Description of the Vennar Irrigation and Drainage System 146
13.1.2 Floods 151
13.1.3 Coastal Zones 158
13.1.4 Impact of Climate Change 162

13.1.5 Proposed Measures to Improve the Performance of Six Project-1 Rivers
163
13.2 Design 165
13.2.1 Design Process 165
13.2.2 Design Criteria 165
13.2.3 Topographic Survey 166
13.2.4 Asset Survey 168
13.2.5 Analysis of Rainfall Data and Climate Changes 168
13.2.6 SWAT Rainfall – Runoff Model 168
13.2.7 Hydraulic Model 171
13.3 Proposals for Adaptation to Climate Change in the Six Project -1 Rivers
174
13.3.1 Introduction 174
13.3.2 Adappar 175
13.3.3 Harichandra 189
13.3.4 Vellaiyar 203
13.3.5 Pandavaiyar 216
13.3.6 Valavanar 220
13.3.7 Vedaraniyan Canal 235
13.4 Surface Water Pumping Schemes 246
13.4.1 Description of Pumping Schemes 246
13.4.2 Project – 1 Pumping Schemes 248
13.4.3 Findings of Survey and Recommendations for this Project Pumping Schemes
251

Volume - II
14 Power 254
15 Navigation 255
16 Ground Water 256
16.1 Introduction 256
16.2 Depth of Ground Water 256
16.3 Assessment of the Ground Water Potential in the command Area
260
16.4 Quality of Groundwater 261
16.5 Assessment of Possible Impact on Ground Water Recharge due to Canal Lining
263
16.6 Groundwater Modelling 265
16.7 Cost Estimate for Modelling 267
17 Drainage and Land Reclamation 268
18 Land Acquisition, Rehabilitation and Resettlement
269
18.1 Introduction 269
18.2 Scope of Resettlement 269
18.3 Policies of the Government and ADB 270
18.4 Screening and Categorisation 270
18.5 Eligibility and Entitlements 271
18.5.1 Eligibility 271
18.5.2 Entitlements 271
18.6 Monitoring 271
18.7 Cost Estimate and Budget 272
19 Water Management and Maintenance 274
19.1 Management of this Project Rivers 274
19.1.1 Management of Irrigation flows 274
19.1.2 Management of Flood flows 275
19.1.3 Maintenance of irrigation canals 275
19.2 Analysis of Current Decision Making 276
19.3 Proposed Decision Support System 277
19.3.1 Management of Irrigation Flows 277
19.3.2 Management of Flood Flows 278
19.3.3 Initial Simple DSS 279
19.3.4 Training of WRD Staff 280
19.4 Costs of the DSS 281
19.4.1 Initial Simplified DSS 281
19.4.2 Monitoring Equipment and Hardware and Database Software 281
19.4.3 Calibration of Regulator Discharges 282

19.4.4 Water Schedule Calendar 282
19.4.5 Summary of DSS Costs 283
20 On Farm Development works 284
21 Construction Programme 285
21.1 Project Area 285
21.2 Major Works 285
21.2.1 Nature of works 285
21.3 Estimated Costs 286
21.4 Project Duration 287
21.5 Procurement of Works 288
21.6 Implementation Schedule 296
22 Construction Organisation 298
22.1 Background 298
22.2 Project Management Unit 300
22.3 Project Consultants 310
22.4 Preparation of CASDP follow on project 318
22.4.1 Approach to the Preparation of follow on project 318
23 Environment, Ecology and Forest Aspects 323
23.1 Anticipated Environmental Impacts and Mitigation Measures 323
23.1.1 Methodology 323
23.1.2 Mitigation Hierarchy 324
23.2 Impacts and Mitigation Measures 325
23.2.1 Ambient Air Environment 325
23.2.3 Soil Environment 326
23.2.4 Water Resources and Quality 327
23.2.5 Wildlife, Biodiversity and Reserved Forest 328
23.2.6 Tree Plantation 328
23.2.7 Land use 329
23.2.8 Archaeological Remains 329
24 Economic Evaluation 349
24.1 Cost Estimates for River Improvements 349
24.2 Cost Estimates for Pumped Irrigation Scheme Improvements 349
24.3 Estimates of Cost 351
24.4 Project Benefits 354
24.4.1 Benefits from Project-1 Improvement Works 354
24.4.2 Agricultural Benefits 355
24.4.3 Flood Protection Benefits 356
24.5 Operation and Maintenance Charges 357
24.5.1 Water Rates for Irrigation 357 24.5.2 Betterment Levy 357 24.5.3 O & M Costs of Pumping Schemes 358 24.5.4 O & M Costs of Groundwater Irrigation 358
24.5.5 Flood Protection Costs 358 24.5.6 Annual Cost of Project-1 358 24.6 Cropping Patterns and Annual Crop Net Benefits 359 24.7 Benefit Cost Ratio 363 24.8 Baseline Survey 363 25 Administrative and Legislative Provisions 365 26 Training 368
27 Conclusion 370 Annexures
Annexure A CPM Table and Activity Network
Annexure B Soil Analysis Reports
Annexure C Testing Results of River Water
Annexure 1 Cropping patterns
Annexure 2 Details of Works
Annexure 9 Data and Analysis for Economic Analysis
Annexure 9.1 Certified Flood damage Data, Thiruvarur
Annexure 9.2 Certified Flood Damage Data, Nagapattinam
Annexure 9.3 Data and Analysis used for Calculating the Cost-Benefit Ratio
Annexure 9.4 ADB Cost Abstracts

Contents
Volume - II
14 Power 254
15 Navigation 255
16 Ground Water 256
16.1 Introduction 256
16.2 Depth of Ground Water 256
16.3 Assessment of the Ground Water Potential in the command Area
260
16.4 Quality of Groundwater 261
16.5 Assessment of Possible Impact on Ground Water Recharge due to Canal Lining
263
16.6 Groundwater Modelling 265
16.7 Cost Estimate for Modelling 267
17 Drainage and Land Reclamation 268
18 Land Acquisition, Rehabilitation and Resettlement
269
18.1 Introduction 269
18.2 Scope of Resettlement 269
18.3 Policies of the Government and ADB 270
18.4 Screening and Categorisation 270
18.5 Eligibility and Entitlements 271
18.5.1 Eligibility 271
18.5.2 Entitlements 271
18.6 Monitoring 271
18.7 Cost Estimate and Budget 272
19 Water Management and Maintenance 274
19.1 Management of this Project Rivers 274
19.1.1 Management of Irrigation flows 274
19.1.2 Management of Flood flows 275
19.1.3 Maintenance of irrigation canals 275
19.2 Analysis of Current Decision Making 276
19.3 Proposed Decision Support System 277
19.3.1 Management of Irrigation Flows 277
19.3.2 Management of Flood Flows 278
19.3.3 Initial Simple DSS 279
19.3.4 Training of WRD Staff 280
19.4 Costs of the DSS 281
19.4.1 Initial Simplified DSS 281
19.4.2 Monitoring Equipment and Hardware and Database Software 281
19.4.3 Calibration of Regulator Discharges 282

19.4.4 Water Schedule Calendar 282
19.4.5 Summary of DSS Costs 283
20 On Farm Development works 284
21 Construction Programme 285
21.1 Project Area 285
21.2 Major Works 285
21.2.1 Nature of works 285
21.3 Estimated Costs 286
21.4 Project Duration 287
21.5 Procurement of Works 288
21.6 Implementation Schedule 296
22 Construction Organisation 298
22.1 Background 298
22.2 Project Management Unit 300
22.3 Project Consultants 310
22.4 Preparation of CASDP follow on project 318
22.4.1 Approach to the Preparation of follow on project 318
23 Environment, Ecology and Forest Aspects 323
23.1 Anticipated Environmental Impacts and Mitigation Measures 323
23.1.1 Methodology 323
23.1.2 Mitigation Hierarchy 324
23.2 Impacts and Mitigation Measures 325
23.2.1 Ambient Air Environment 325
23.2.3 Soil Environment 326
23.2.4 Water Resources and Quality 327
23.2.5 Wildlife, Biodiversity and Reserved Forest 328
23.2.6 Tree Plantation 328
23.2.7 Land use 329
23.2.8 Archaeological Remains 329
24 Economic Evaluation 349
24.1 Cost Estimates for River Improvements 349
24.2 Cost Estimates for Pumped Irrigation Scheme Improvements 349
24.3 Estimates of Cost 351
24.4 Project Benefits 354
24.4.1 Benefits from Project-1 Improvement Works 354
24.4.2 Agricultural Benefits 355
24.4.3 Flood Protection Benefits 356
24.5 Operation and Maintenance Charges 357
24.5.1 Water Rates for Irrigation 357 24.5.2 Betterment Levy 357 24.5.3 O & M Costs of Pumping Schemes 358 24.5.4 O & M Costs of Groundwater Irrigation 358

24.5.5 Flood Protection Costs 358 24.5.6 Annual Cost of Project-1 358 24.6 Cropping Patterns and Annual Crop Net Benefits 359 24.7 Benefit Cost Ratio 363 24.8 Baseline Survey 363 25 Administrative and Legislative Provisions 365 26 Training 368
27 Conclusion 370 Annexures
Annexure A CPM Table and Activity Network
Annexure B Soil Analysis Reports
Annexure C Testing Results of River Water
Annexure 1 Cropping patterns
Annexure 2 Details of Works
Annexure 9 Data and Analysis for Economic Analysis
Annexure 9.1 Certified Flood damage Data, Thiruvarur
Annexure 9.2 Certified Flood Damage Data, Nagapattinam
Annexure 9.3 Data and Analysis used for Calculating the Cost-Benefit Ratio
Annexure 9.4 ADB Cost Abstracts

Volume I
Chapter Title Page
Check List 1
Salient Features 9
Introduction 19
1.1 Background 19
1.2 Water Resources Issues in the Cauvery Delta 20
1.2.1 Introduction 20
1.2.2 Cauvery River 21
1.2.3 Availability of Water Resources 22
1.2.4 Water Resources Management 24
1.2.5 Climate Change 26
1.3 State Government Responses to Water Resources Issues
27
1.3.1 IAMWARM Project 27
1.3.2 Cauvery Modernisation Proposal 28
1.3.3 Climate Adaptation through Sub basin Development Programme
28
1.4 The Design of CASDP 29
1.4.1 Rationale 29
1.4.2 Impact 30
1.4.3 Outcome 30
1.4.4 Outputs 30
1.4.5 Implementation of CASDP 33
1.4.6 Execution of this Project 35
1.4.7 Execution of CASDP follow on project 37
1.5 River Basins 39
1.5.1 India 39
1.5.2 TamilNadu 40
1.6 The Cauvery Basin 42
1.6.1 Description 42
1.6.2 Drainage Area 42
1.6.3 Population 46
1.6.4 Tributaries of Cauvery 47
1.6.5 Unique Feature of Cauvery 47
1.6.6 Upper Anicut 47
1.6.7 Grand Anicut 48
1.6.8 The delta 48
1.6.9 Tailend Regulator 48
1.6.10 Rainfall 49
1.6.11 Soils 51
1.6.12 Development of Irrigation 52

1.6.13 Storage in the Cauvery Basin 53
1.7 The Cauvery Basin in TamilNadu 58
1.7.1 Extent 58
1.7.2 Irrigation Development 59
1.7.3 Irrigation in 1901-02 63
1.7.4 Irrigation in 1928-29 64
1.7.5 Development between 1928 and 1956 64
1.8 Cauvery Delta System 67
1.8.1 Brief narrative report 67
1.8.2 Land holdings 68
1.8.3 Rainfall 69
1.8.4 Barrage on the Cauvery 69
1.8.5 Grand Anicut 70
1.8.6 Improvements to the Origional structure (G.A) 71
1.8.7 Monsoons and their influence 77
1.8.8 Floods and Drainage on the Delta 78
1.8.9 Floods from the catchment lying between upper anicut and grand anicut
78
1.9 Vennar Basin 81
1.9.1 A brief narration 81
1.9.2 Details of Main drain and stages of drains during the flood 83
1.9.3 Need and necessity of the scheme 86
1.9.4 Vedharanyam Canal 86
1.9.4 The straight cuts 86
1.9.6 Pumping schemes
87
2 Hydrology 96
2.1 Rainfall 96
2.2 River Flow 96
2.3 Droughts 99
2.4 Climate Change 99
3 Reservoir 103
4 Barrages (Anicuts) 104
5 Land Potential 105
5.1 Soils 105
5.2 Land Use 110
6 Cropping Pattern and crop water Requirements 111
6.1 Details of current cropping pattern and crop calendar 111
6.1.1 Current cropping pattern 111
6.1.2 Paddy cultivation in the vennar system 112
6.1.3 Rice water requirements and productivity 112
6.2 Details of original cropping pattern and crop calendar 114
6.3 Future Cropping Patterns 114
6.4 Assessment of Effective Rainfall and Crop Water Requirements 115

6.4.1 Potential evaporation and effective rainfall 115
6.4.2 Agro-climatic zone 118
6.4.3 Water requirement and irrigation schedule 119
6.5 Assumed conveyance efficiecies 120
6.6 Irrigation water requirments 120
7 Aquaculture 121
7.1 Introduction 121
7.2 Area of Shrimp Farming 121
7.3 Water use 123
7.4 Future Development of Shrimp 123
7.5 Best Management Practices 123
8 Horticulture 124
9 Others 125
10 Water Demand 126
10.1 State level 126
10.2 Basin level 126
10.3 Agricultur Demand inVennar system 127
10.4 Water demand for Aquaculture 131
10.4.1 Present water Use 131
10.4.2 Future water Use 131
10.5 Power Generation 132
10.6 Industry 132
10.7 Return flow from Domestic, Commercial and Industrial Water Use
133
10.8 Drinking water Demand 133
10.9 Summary of Demand 134
11 Impact of Proposed Works 135
11.1 Project and Adjoining Area 135
11.2 Project Description and Proposed works 136
11.3 Aims and objectives of the proposed works 136
11.4 Inter – State Aspects 137
11.5 Impact on Upstream Area 137
11.6 Impact on Downstream Area 137
12 International / Interstate Aspects 138
12.1 Agreements 138
12.2 Cauvery Fact Finding Committee 139
12.3 Cauvery water Disputes Tribunal 139
13 Canal System 146
13.1 Climate Resilient Adaptations in the Vennar System 146
13.1.1 Description of the Vennar Irrigation and Drainage System 146
13.1.2 Floods 151
13.1.3 Coastal Zones 158
13.1.4 Impact of Climate Change 162

13.1.5 Proposed Measures to Improve the Performance of Six Project-1 Rivers
163
13.2 Design 165
13.2.1 Design Process 165
13.2.2 Design Criteria 165
13.2.3 Topographic Survey 166
13.2.4 Asset Survey 168
13.2.5 Analysis of Rainfall Data and Climate Changes 168
13.2.6 SWAT Rainfall – Runoff Model 168
13.2.7 Hydraulic Model 171
13.3 Proposals for Adaptation to Climate Change in the Six Project -1 Rivers
174
13.3.1 Introduction 174
13.3.2 Adappar 175
13.3.3 Harichandra 189
13.3.4 Vellaiyar 203
13.3.5 Pandavaiyar 216
13.3.6 Valavanar 220
13.3.7 Vedaraniyan Canal 235
13.4 Surface Water Pumping Schemes 246
13.4.1 Description of Pumping Schemes 246
13.4.2 Project – 1 Pumping Schemes 248
13.4.3 Findings of Survey and Recommendations for this Project Pumping Schemes
251

1
CLIMATE ADAPTATION THROUGH SUB-BASIN DEVELOPMENT PROGRAM (CASDP) IN CAUVERY DELTA
Section-I CHECK LIST
SI. No.
Item
1
Was the original project given investment clearance by Planning Commission
Not applicable as most of components of the project were taken up prior to the date when Planning Commission issued circular for clearance of project. Moreover this is a very old system.
2
Has the performance evaluation of the existing project been carried out?
Yes
3
Have the salient features of the project as envisaged at the time of execution of project and as at present, been indicated?
Yes, to the extent as the information is available
4
Have the irrigation potential of the existing project as originally envisaged, potential created and utilised and reasons for variations been indicated?
No change in irrigation potential
5
Has the culturablecommand area been actually assessed and compared with that at the time of planning of the project and shortfalls/excesses, if any, discussed
No change in CCA
6 Has the hydraulic survey of canal/distribution system been carried out?
Yes
7
Have the deficiencies In the existing irrigation system been identified
Yes
8 Has the need for modernisation been justified?
Yes
17
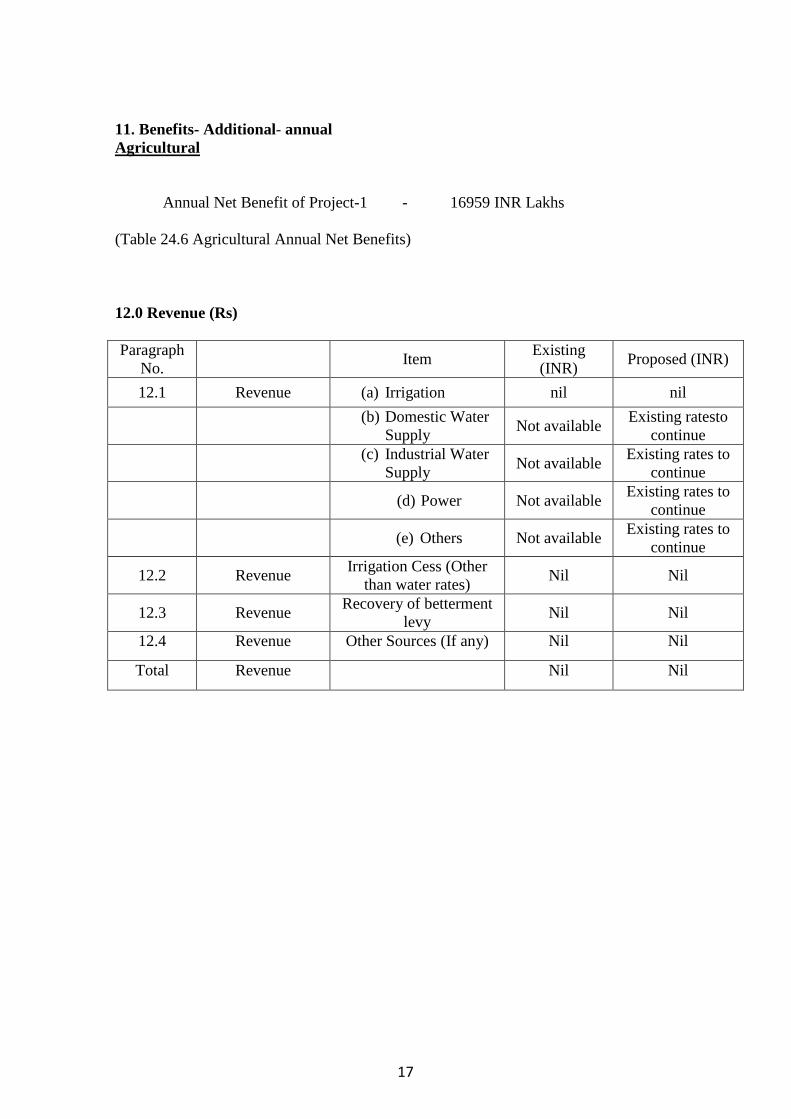
11. Benefits- Additional- annual Agricultural Annual Net Benefit of Project-1 - 16959 INR Lakhs (Table 24.6 Agricultural Annual Net Benefits) 12.0 Revenue (Rs) Paragraph
No. Item
Existing (INR)
Proposed (INR)
12.1 Revenue (a) Irrigation nil nil
(b) Domestic Water
Supply Not available
Existing ratesto continue
(c) Industrial Water
Supply Not available
Existing rates to continue
(d) Power Not available Existing rates to
continue
(e) Others Not available Existing rates to
continue
12.2 Revenue Irrigation Cess (Other
than water rates) Nil Nil
12.3 Revenue Recovery of betterment
levy Nil Nil
12.4 Revenue Other Sources (If any) Nil Nil
Total Revenue Nil Nil

2
9
Have the hydrological studies been reviewed, compared with those made at the time of preparation of the original project if available and reasons for variations recorded in respect of: (i) rainfall (ii) runoff (iii) flood (iv) sediment (v) ground water (vi) Evaporation
Hydrological studies at the time of preparation of original project are not available. Hydrological studies for the six rivers included in the project have been carried out.
10
(a) Have changes in the upstream withdrawals/diversions for industrial use, power generation, drinking requirement andother developments in the upper catchment to the extent which can be collected with reasonable efforts been described? (b) Have the changes in power generation/consumption In power for the lift irrigation scheme been described?
(a) No changes are envisaged. (b) Data on existing and proposed power
projects in the project area has been collected.
(c) Power required for the pumping schemes in the project area has been estimated keeping in view the electrical and mechanical equipment to be installed as replacement of the existing equipment as part of rehabilitation of the schemes.
11
Have the semi-detailed soil surveys been carried out for the entire command (if not entire command then extent covered) and soil and land irrigability classification brought- out in the report? ( For the Project to be acceptable, semi detailed soil survey in at least 50% of command should have been carried out
No. Secondary data available on type of soils in the area have been collected. In the project it is proposed to improve the infrastructure on main channels only and there is no proposal to take up works on distributaries, minors, sub-minors and water courses, field channels and drains (Class A, B, C, D, E, F, and G channels) and OFD works.
12
Is the Crop Water Requirement determined by the modified Penmen method?
Yes, crop water requirement has been estimated as per CWC guidelines.
13
Have water requirements for other uses been worked out?
There is no proposal to alter the existing water availability and utilisation. The improvements to the existing infrastructure will improve the efficiency and performance of the system and also provide flood protection and drainage improvement in the area particularly keeping in view the impact of climate change.
14
Has justification for the proposed cropping pattern been furnished?
The dominant crop in the area is paddy with little area under black/green gram and sugarcane. The climate, soil and water availability do not permit major change in it. However, it is proposed to encourage less water consuming varieties of paddy such as SRI variety.
3
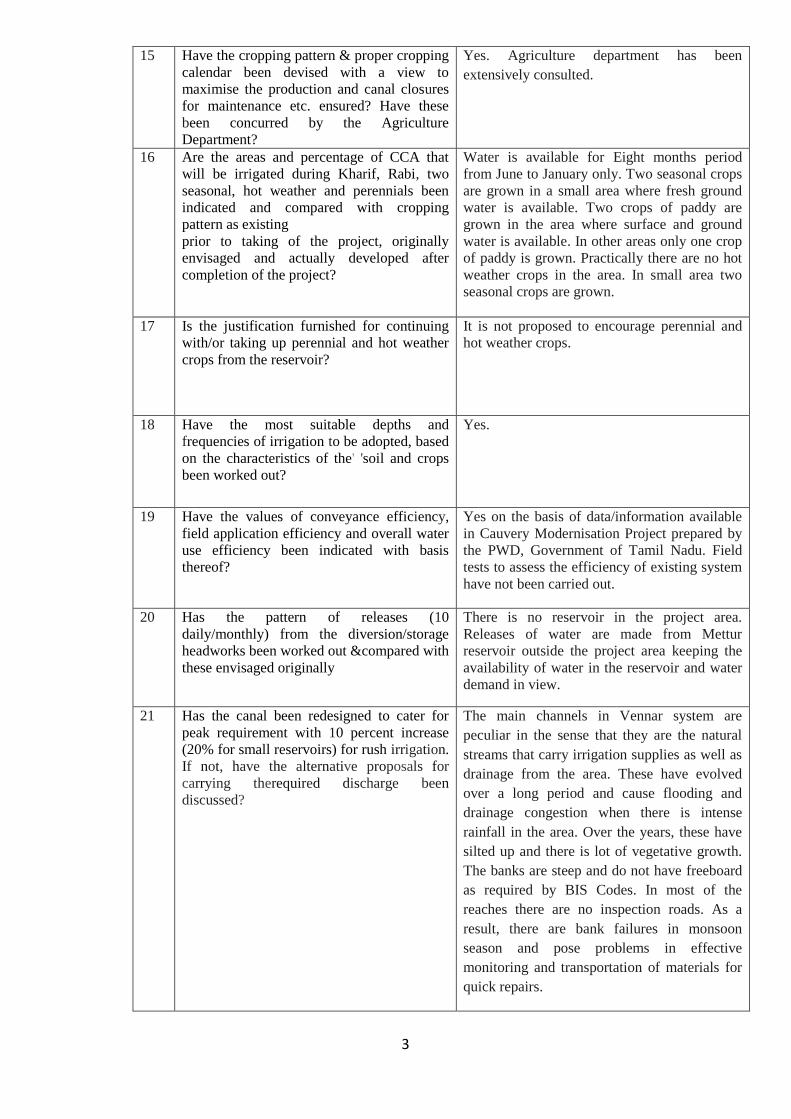
15
Have the cropping pattern & proper cropping calendar been devised with a view to maximise the production and canal closures for maintenance etc. ensured? Have these been concurred by the Agriculture Department?
Yes. Agriculture department has been extensively consulted.
16
Are the areas and percentage of CCA that will be irrigated during Kharif, Rabi, two seasonal, hot weather and perennials been indicated and compared with cropping pattern as existing prior to taking of the project, originally envisaged and actually developed after completion of the project?
Water is available for Eight months period from June to January only. Two seasonal crops are grown in a small area where fresh ground water is available. Two crops of paddy are grown in the area where surface and ground water is available. In other areas only one crop of paddy is grown. Practically there are no hot weather crops in the area. In small area two seasonal crops are grown.
17
Is the justification furnished for continuing with/or taking up perennial and hot weather crops from the reservoir?
It is not proposed to encourage perennial and hot weather crops.
18
Have the most suitable depths and frequencies of irrigation to be adopted, based on the characteristics of the' 'soil and crops been worked out?
Yes.
19
Have the values of conveyance efficiency, field application efficiency and overall water use efficiency been indicated with basis thereof?
Yes on the basis of data/information available in Cauvery Modernisation Project prepared by the PWD, Government of Tamil Nadu. Field tests to assess the efficiency of existing system have not been carried out.
20
Has the pattern of releases (10 daily/monthly) from the diversion/storage headworks been worked out &compared with these envisaged originally
There is no reservoir in the project area. Releases of water are made from Mettur reservoir outside the project area keeping the availability of water in the reservoir and water demand in view.
21
Has the canal been redesigned to cater for peak requirement with 10 percent increase (20% for small reservoirs) for rush irrigation. If not, have the alternative proposals for carrying therequired discharge been discussed?
The main channels in Vennar system are peculiar in the sense that they are the natural streams that carry irrigation supplies as well as drainage from the area. These have evolved over a long period and cause flooding and drainage congestion when there is intense rainfall in the area. Over the years, these have silted up and there is lot of vegetative growth. The banks are steep and do not have freeboard as required by BIS Codes. In most of the reaches there are no inspection roads. As a result, there are bank failures in monsoon season and pose problems in effective monitoring and transportation of materials for quick repairs.

4
It is, therefore, proposed to resection them which includes clearing of vegetation, desilting, flattening of bank slope, raising the height to provide proper freeboard and increase the top width to provide access.
Since these channels also carry surface runoff from the adjoining area, their capacity is much more than the normal irrigation supply. The improvements/reconstruction of head sluices, drainage sluices, drain infalls and cross regulators will help in improving irrigation management. Since these channels outfall in to the sea, there is ingress of sea water inland. To check it, regulators have been constructed near the outfall in to the sea. These also serve for managing irrigation release in to the A and B Class channels. In some cases these are located 10 – 20 km upstream and lot of area is affected by sea water. It is therefore, proposed to construct new regulators near the outfall in to the sea to control ingress of sea water and provide fresh water storage upstream for various purposes.
22
Whether supplementation from ground water has been considered?
The ground water in deep aquifers in most of the project area is saline limiting its use for agriculture. Fresh water is available only in shallow aquifer. It is already fully exploited for supplementing irrigation in times shortage of irrigation supply from Mettur reservoir.
23
Are the supplies available sufficient to meet the requirements for ensuring 75 per cent dependability? If not. have the possibilities of augmenting the supplies been discussed either by increasing the storage or supplementing by ground water etc.?Have the revised reservoir operation tables been furnished?
The availability of water is regulated by Cauvery Water Dispute Tribunal Award which has apportioned available water at 50% dependability among the basin states. There are numerous minor tanks in the area which store surplus water.
24
Has a study of the ground water potential of the command area, the present level of the ground water use and the scope of future ground water utilisation, been carried out and included in the project report?
Yes,
25
Have the economics of ground water development been studied
Yes

5
26
Has the possible impact on ground water recharge on account of lining of the-system been kept-in view in the scheme- of ground water utilisation?
Lining of main channels is not proposed.
27
Has the possibility of the ground water for irrigating areas not commanded by the canal system been considered
Yes. High ground on sea side of Vedharanyam canal is proposed to be irrigated from the new Tail End Regulator proposed on Harichandra river.
28
Has the quality of surface water as also ground water & drainage water, if intended-for irrigation use, been tested?
No. Results on quality of ground water collected from the PWD been used.
29
Have the requirements of drainage in the command area, been studied and a suitable integrated drainage plan drawn- up and provided for in the cost estimate? .
No. The activities in this project are confined to main channels. However the capacity of one of the drain infall on Harichandra river has been reviewed in view of the provisions of IS code on surface drains and it has been proposed that capacity of all the drain infalls and drainage sluices to be reconstructed be reviewed at before construction and construction taken up accordingly.
30
Have the arrangements for the following been considered and provided for? (a) Execution of OFD works (b) Training programmes for field staff and fanners - existing positionand proposals for strengthening . (c) Participatory Irrigation Management (PIM), Water Users Associations (WUA), and turnover of the system to WUAs. (d) Provision of extension services (e) Providing important inputs like seeds, fertilizers etc.
The activities in this project are confined to main channels.
(a) No, OFD works are not proposed as a part of this project
(b) Training programme for field staff and farmers have been discussed in the report.
(c) As above
(d) Yes
(e) Yes
31
Have adequacy of road communication facilities and if not, the necessity of improvements been- discussed and provided for'?
Yes.
32
Have matters about the improvement inreliability/dependability of the annual Irrigation in the existing/proposed command area been discussed in the light of modernisation?
Yes. The availability of water is regulated by Cauvery Water Dispute Tribunal Award which has apportioned available water at 50% dependability among the basin states. There are numerous minor tanks in the area which store surplus water.

6
33
Have the net benefits due to the project been estimated and concurred by the Agricultural Department?
Yes, net benefits have been estimated on basis of inputs received from State Agriculture Deptt.
34
Has the concurrence of the State Finance Department been obtained for taking up the project at the estimated cost
Yes, In the State budjet for the year INR 2000 millions was allotted
35
Whether the scheme has already been started? If so, is the present stage of construction indicated
Yes, In the State likely commencement is in the last quarter of 2014
36
Is the scheme included in the plan? If not, what is the present position regarding its inclusion in the plan?
Yes, included in the state plan
37
Have the year wise requirement of funds been indicated
Yes
38
Is the scheme covered under state sector or Central sector?
State Sector
39
Is the scheme covered or proposed to be covered under any foreign assistance/aid agreement
Yes, 70% of this scheme cost to be met out from loan assistance by Asian Development Bank under Climate Adaptation through Sub-basin Development Program (CASDP)
40
Are the detailed cost estimates included in the Report
Yes
41
Has the benefit-cost ratio been worked out? Whether depreciated cost of completed works has been included in the calculations?
Yes. The existing works are more than 50 years old and have outlived their useful life. The irrigation system is likely to collapse within next 2-5 years if improvements are not undertaken. Therefore, the depreciated cost of existing works has not been considered
42
Whether Internal Rate of Return (IRR) has been worked out?
Yes
43
Are the financial returns attached? Yes
44
Are there any special reasons to undertake the project if it is unproductive and whether these have been recorded in the Report?
The project is economically viable.

7
45
Have the rates of betterment levy proposed, the period of recovery and the estimated total recovery been indicated?
No
46
Are there any charges levied for irrigation facilities as distinct from water charges?
No
47
Are the water rates for different crops indicated?
The Go TN does not collect any water charges except the land revenue.
48
Have the rates of betterment levy, water charges, etc. been compared with those obtained in other regions of the State?
Not applicable
49
Has the concurrence of the State Revenue Department been obtained for these rates
Yes
50
Have the O&M aspects (both financial as well as management) been discussed? How are the O&M costs proposed to be met?
Yes. O&M costs will be met through state budget
51
Have the programme of construction and the expenditure involved been furnished?
Yes
52
Has the requirement of staff been estimated and furnished with justification?
Yes. This has been explained in Chapter 22 of DPR.
53
Has the adequacy of the existing irrigation laws and revision, if any, considered necessary been discussed?
Yes. These are explained in the Main report of CASDP
54
Has the impact of the scheme on the overall development of water resources in the basin/state been discussed?
Yes. This is explained in the Main Report of CASDP
55
Whether views of water users about proposed works in modernisation project been obtained and described in the Report?
Yes. This has explained in the Social Survey Report of CASDP
56
Have environmental/ecological aspects been discussed in the Report & environmental clearance obtained from MOEF
Yes, Initial Environment & Ecological assessment been made. Clearance of MoEF is yet to be obtained.
8
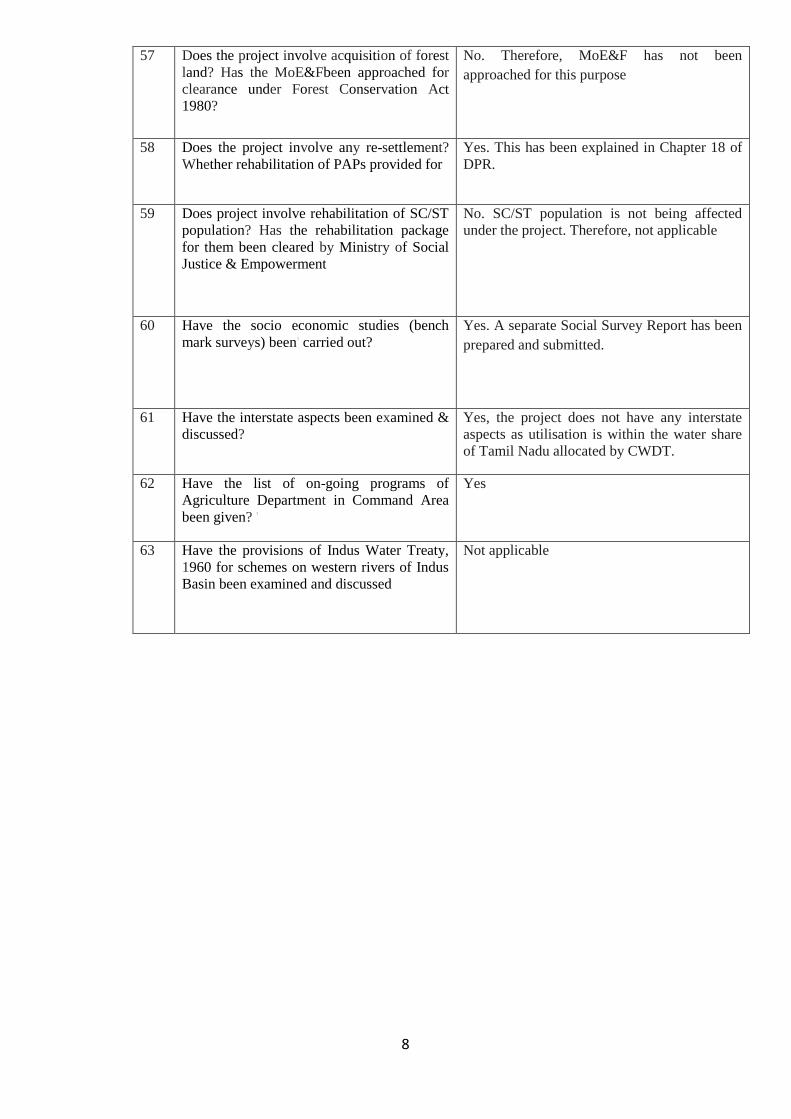
57
Does the project involve acquisition of forest land? Has the MoE&Fbeen approached for clearance under Forest Conservation Act 1980?
No. Therefore, MoE&F has not been approached for this purpose
58
Does the project involve any re-settlement? Whether rehabilitation of PAPs provided for
Yes. This has been explained in Chapter 18 of DPR.
59
Does project involve rehabilitation of SC/ST population? Has the rehabilitation package for them been cleared by Ministry of Social Justice & Empowerment
No. SC/ST population is not being affected under the project. Therefore, not applicable
60
Have the socio economic studies (bench mark surveys) been' carried out?
Yes. A separate Social Survey Report has been prepared and submitted.
61
Have the interstate aspects been examined & discussed?
Yes, the project does not have any interstate aspects as utilisation is within the water share of Tamil Nadu allocated by CWDT.
62
Have the list of on-going programs of Agriculture Department in Command Area been given? '
Yes
63
Have the provisions of Indus Water Treaty, 1960 for schemes on western rivers of Indus Basin been examined and discussed
Not applicable

9
CLIMATE ADAPTATION THROUGH SUB-BASIN DEVELOPMENT PROGRAM (CASDP) IN IN CAUVERY DELTA
Section-Z SALIENT FEATURES
1 Name of the project
The Climate Adaptation through Sub-Basin Development Program (CASDP)
2.0 2.1
General data District(s)
Thanjavur, Thiruvarur and Nagapattinam
2.2
Tehsil(s) / Taluka(s
Eight Talukas in Thanjavur district and seven talukas each in Thiruvarur and Nagapattinam districts
2.3
River / tributary
The Cauvery Delta contains three irrigation systems namely, the Cauvery, Vennar & Grand Anicut and One drainage system Coleroon. The project area covers six branches of Vennar System, namely, Adapar, Harichandra, Pandavayar, Velliayar, Valavanar and Vedharanyam Canal. Pumping schemes in these river basins are also included in the project.
2.4
Location of dam / diversion structures
Mettur dam (11degree 48minute 58second N, 77degree 48minute 38second E): Salem district, Tamilnadu State – Storage reservoir
Upper Anicut (10degree 52minute 58second N, 78degree 34minute 58second E):: Trichinapalli district, Tamilnadu State – Cauvery river branches in to two rivers, namely, the Cauvery and Coleroon
Grand Anicut (10degree 49minute 48second N, 78degree 48minute 36second E):: Thanjavur district, Tamilnadu State – Built in about 200 AD. River Cauvery bifurcates in to two rivers, Cauvery anVennar. It regulates release of water in to Grand Anicut Canal, Vennar and Cauvery rivers and flood water is diverted to Coleroon river through Ullar drain
VVR head Regulator (10degree 49minute 15second N, 79degree 3minute 12second E):: Thanjavur district, Tamilnadu State - The Vennar river branches in to Vettar, Vennar and Vadavar rivers and water is released in to these rivers in fixed proportions. Flood water generated from catchment area between Grand Anicut and VVR head regulator is released in to Vettar branch.
Koriayar Head Regulator (10degree 47minute 25second N, 79degree 23minute 51second E): Thanjavur district, Tamilnadu State – Vennar river branches in to Vennar, Paminiayar and Koriayar rivers

10
Pandavayar Regulator (10degree 45minute 46second N, 79degree 24minute 34second E): Thiruvarur district, Tamilnadu State - Vennar branches in to Pandavayar and Vennar rivers. Velliayar Regulator(10degree 28minute 51second N, 79degree 44minute 50second E)::Vennar branches in to Veilliayar and Vennar rivers. Vennar river joins Harichandra.
Mulliayar Head Regulator(10degree 28minute 51second N, 79degree 44minute 50second E):Thiruvarur district, Tamilnadu State - It is across Koriayar river and this divides the river in to Ayyanar, Harichandra, Mulliayar and Koriayar rivers.
Adapar Regulator: 10degree 36minute 47 seconds N, 79degree 33minute 9seconds E) Thiruvarur district, Tamilnadu State.
Valavanar Origin (10degree 31minutes 42seconds N, 90degree 38minutes 41seconds E) Vedharanyam Canal (10degree 44minutes 38seconds N, 79degree 30minutes 15seconds E)
2.5 Name of river/basin
Cauvery River basin – Vennar Sub Basin
2.6 Longitude &Latitude (at Metturdam) 11º48’58”N
77º48’38”E 3.0
Socio-economic aspects Original Revised
3.1
District(s) benefited
Thanjavur, Thiruvarur,
Nagapattinum
Thanjavur, Thiruvarur, Nagapattinum
Original (annual house hold income)
3.2
a) Farming : b) Agriculture labour: c) Livestock: d) Fisheries: e) Petty trading: f) Artisan : g) Business: h) Service (govt+private) : Source: Social Survey, CASDP (2014)
Rs.44,288 Rs. 19,382 Rs.16,520 Rs.48,856 Rs.23,182 Rs.12,500 Rs.68,820 Rs.78,842
Post – Project assessment to be done to estimate the enhanced
income levels

11
3.3
Land holdings a) landless b) Marginal ( lha) c) Small (1-2 ha) d) Medium (2 – 4ha) e) Large (4-10h) f) Average Source: Social Survey, CASDP (2014)
: 8.4% : 38.7% : 23.5% : 26.9% : 2.4% : 2.0 ha
No Change
Original Revised
3.4
Population benefited Original (2011) Thanjavur Thiruvarur Nagapattinam a)Total for three districts In Project 1 of CASDP about 73% of the population in Thiruvarur and Nagapattinam districts is estimated to be benefited. Project 2 and Project 3 will include Thanjavur District, in addition to Thiruvarur and Nagapattinam Districts b) Scheduled Caste c) Scheduled Tribe d) Other backward castes
: 24,05,890 : 12,34,277 : 16,16,450 : 52,86,617 : NA : NA : NA
No Change
4.0 4.1
Hydrological data Catchment area at dam site(sqkm)
42217 No Change
Original
Revised
4.2
(a) Maximum annual rainfall
1774mm No Change
(b) Minimum annual rainfall
653mm No Change
(c) Mean annual rainfall
1192mm No Change
d) 75% dependable annual rainfall 933mm No Change
4.3 Annual runoff (Thousandmillion cubic feet) (a) Average
508
No change
(b) Maximum
NA No change
(c) Minimum
NA No change
(d) 75% dependability
451.4
No change
4.4
Design flood
12914.6 Cumecs No Change

12
5.0 Ground Water
Present Proposed
5.0
Water utilization(Mcum) (a) Reservation for upstream use
Not applicable, as the ground water utilisation from Vennar basin has been considered
No change
(b) Reservation for downstream use (MCM)
200MCM Present data is not adequate and reliable to estimate availability and present utilisation of ground water accurately
No change. Ground water monitoring is proposed for accurate and reliable estimates of ground water.
(c) Utilisation through the project (mm)
1697
No change. Ground water monitoring is proposed for accurate and reliable estimates of ground water.
(i) Irrigation (mm)
1160 1160
(ii) Power Generation NA Nil (iii) Drinking water and Industrial use
46
46
(v) Others, NA NA (d) Water saved through modernisation
Nil Nil
6.0
Ground water (M cum) (a) Potential
1200
(b) Present use
80% of availability for irrigation and water supply.
(c) Proposed use after modernisation
1200
(d) Balance for future utilisation after modernisation
Nil
Original Revised
7.0
Reservoir data (a) Storage (TMCft) ( i) Gross storage ( ii) Dead storage ( iii ) "Live-Storage ( iv ) Annual carry over
95.66 2.19 93.47 --
No Change
(b) Elevation (El-ft) ( i) .Maximum waterlevel (MWL) (ii) , Full reservoir level (FRL) (iii) Lowest water level (LWL) (iv) Dead storage level (DSL)
(+) 242.620m (+) 240.790m (+) 204.220m (+) 204.220m
No Change

13
(v) River bed level (RBL) (vi) Irrigation outlet level (lOL)
1) Low Level Sluice Level 2) High Level Sluice Level 3) Dam Power House 4) Tunnel Power House
(+) 190.500m (+) 204.220m (+) 219.460m (+) 195.070m (+) 204.220m
(c) Water spread area (sq.km) at (i) Dead storage level (ii) Full reservoir level (iii) Maximum water level
---
138.750 Sq.km
153.460 Sq.km
d) Water Quality Reservoir/Canal/River (downstream) (i)' Physical
Test Results attached
(ii) Chemical
Test Results attached
(iii) Bacteriological
Test Results attached

14
8.0 Canal system (Irrigation) –Information to be furnished for each Main/Branch canal separately .
Sl. No.
Parameter Name of branch rivers (Existing/Proposed)
Adapar Harichandra Velliayar Existing Proposed Existing Proposed Existing Proposed
a Nature of
branch river
Irrigation – cum -
Drainage
Irrigation – cum -
Drainage
Irrigation – cum
Drainage
Irrigation – cum -
Drainage
Irrigation – cum -
Drainage
Irrigation cum -
Drainage b Length (km) 44.5 44.5 43.6 43.6 47.9 47.9
c.1 Normal Supply
Level (m) F +8.210m R +8.010m
F +8.210m R +8.010m
F +12.595m R +12.320m
F +12.595m R +12.320m
F +16.480m R +15.580m
F +16.480m R +15.580m
c.2 Maximum
Water Level F +9.370m R +9.150m
F +9.370m R +9.150m
F +12.790m R +12.595m
F +12.790m R +12.595m
F +16.480m R +15.660m
F +16.480m R +15.660m
c.3 25 year High Flood Level
(m) NA + 8.740m NA + 12.360m NA + 16.900m
d.1
Normal Supply Discharge at canal head (m3/sec)
1.02 1.02 17.188 17.188 26 26
d.2
Maximum Supply
Discharge at canal head (m3/sec)
1.54 1.54 25.678 25.678 NA NA
d.3
25 year High Flood
Discharge (m3/sec)
31.15 31.15 61.99 61.99 32.77 32.77
e.1
Length of A – Class
Channels(in Kms)
60 60 163.80 163.80 161 161
e.2 Length of B –
Class Channels (in Kms)
138 138 346.50 346.50 280 280
e.3 Length of C –
Class Channels 5 5 46.50 46.50 177 177
f No. of villages
covered 28 28 63 63 75 75
g. 1 Gross
Command Area (GCA) (ha)
- - - - - -
g.2 Culturable
Command Area (CCA) (ha)
11548 11548 13822 13822 12622 12622
g.3 Annual
Irrigation (ha) 11548 11548 13822 13822 12622 12622
g.4 Intensity of Irrigation
100 100 100 100 100 100

15
S. No.
Parameter Name of branch rivers (Existing/Proposed)
Pandavayar Valavanar Vedharanyam Canal Existing Proposed Existing Proposed Existing Proposed
a
Nature of branch
river/drainage channel
Irrigation – cum -
Drainage
Irrigation – cum -
Drainage Drainage Drainage
Navigation – cum –
Drainage. Navigation is defunct.
Drainage
b Length (km) 38.2 38.2 19.3 19.3 39.6 39.6
c.1 Normal Supply
Level (m) + 17.000m + 17.000m
Not applicable
Not applicable
Not applicable
Not applicable
c.2 Maximum
Supply Level
+ 18.180m + 18.180m Not
applicable Not
applicable Not
applicable Not
applicable
c.3 25 year
Flood Level (m)
NA + 15.440 m + 1.450m - + 1.600m -
d.1
Normal Full Supply
Discharge at canal head (m3/sec)
- Same as original
Not applicable
Not applicable
Not applicable
Not applicable
d.2
Maximum Full Supply Discharge at canal head (m3/sec)
Same as original
Not applicable
Not applicable
Not applicable
Not applicable
d.3
25 year High Flood Discharge (m3/sec)
78.17 - 324.40 - 52.50 -
e.1 Length of A – Class
Channels 144.85 144.85
Not applicable as
it is a drainage channel. There are tributary drains
NA
Not applicable as it is a drainage channel. There are tributary drains
NA
e.2 Length of B – Class
Channels 297 297 NA NA NA NA
e.3 Length of C – Class
Channels 96.60 96.60 NA NA NA NA
f No. of
villages covered
108 108 22 22 21 21
g. 1
Gross Command
Area (GCA) (ha)
NA NA NA NA NA NA
g.2 CCA/Drainage Area (ha) 11548 11548 15970 15970 19720 -
g.3 Annual
Irrigation (ha)
760 17535 - - - -
g.4 Intensity of Irrigation %
100 100 Not
Applicable Not
Applicable Not
Applicable Not
Applicable

16
9.0 Power S.No. Parameter Existing Proposed a Capacity
This project not connected with this.
i Installed Capacity (MW) ii Unit size iii Size of power house iv Type of turbine v Rated head (m) vi Rated/Design Unit discharge vii Specific speed viii Generator type ix Capacity x Voltage b Power Benifits i Firm Power ii Energy c Evacuation System 10. Cropping pattern (crop wise) - Season wise
Name of Crop Pre-project
(% of CCA)
Planned Originally
(% of CCA)
Actually Achieved(%of
CCA
Proposed (% of CCA)
Remarks
Kharif
Paddy (Kurvai) (May – August)
Not available
Not available
6.3 (Kuruvai and Thaladi)
13.8
Paddy (Thaladi)sepember/Oc
tober – March)
Not available
Not available
Paddy (Sambha) (July/August –
January)
Not available
Not available
56.80% 58.4
Sub-total (Kharif) 63.1 72.2
Summer
Black Gram/Green Gram/Sesame
Not available
Not available
Sub-total (Summer)
Perennial
Sugarcane Not
available Not
available
(Sub-total perenneial) Not
available
Not available
Grand total

18
13.0 Cost
Item Estimated Cost – Financial (INR Million)
@ 2013-2014 SOR Of PWD (a) Irrigation, flood control &
Pumping Schemes 81,77.23
(b) Domestic Water Supply No works are proposed for these items. The cost,
therefore, is nil. (c) Industrial Water Supply
(d) Power (e) Others
Sub – total (INR Million) 81,77.23
Completed works (Original) Works are more than 50 years old. Original cost is
not available.
Completed works (Depreciated) Existing works have outlived their useful life.
Depreciated cost is nil
Total Cost (INR Lakhs) 81,772.25
Maintenance of Head works (1% of Estimated Cost)
817.72
Interest on capital @ 10% 8,177.23
Depreciation on civil works @ 2% 1,635.45
Pumping System Depreciation on Electrical & mechanical works
@8.33% of capital cost 101.92
O&M @ INR 180/ha for 87532 Ha 157.56
Total Annual cost (INR Lakhs) 10,889.87
14.0 Benefit Cost Ratio
Financial Economic
Overall @12% rate of interest
1.69 1.69
As per CWC norms
19
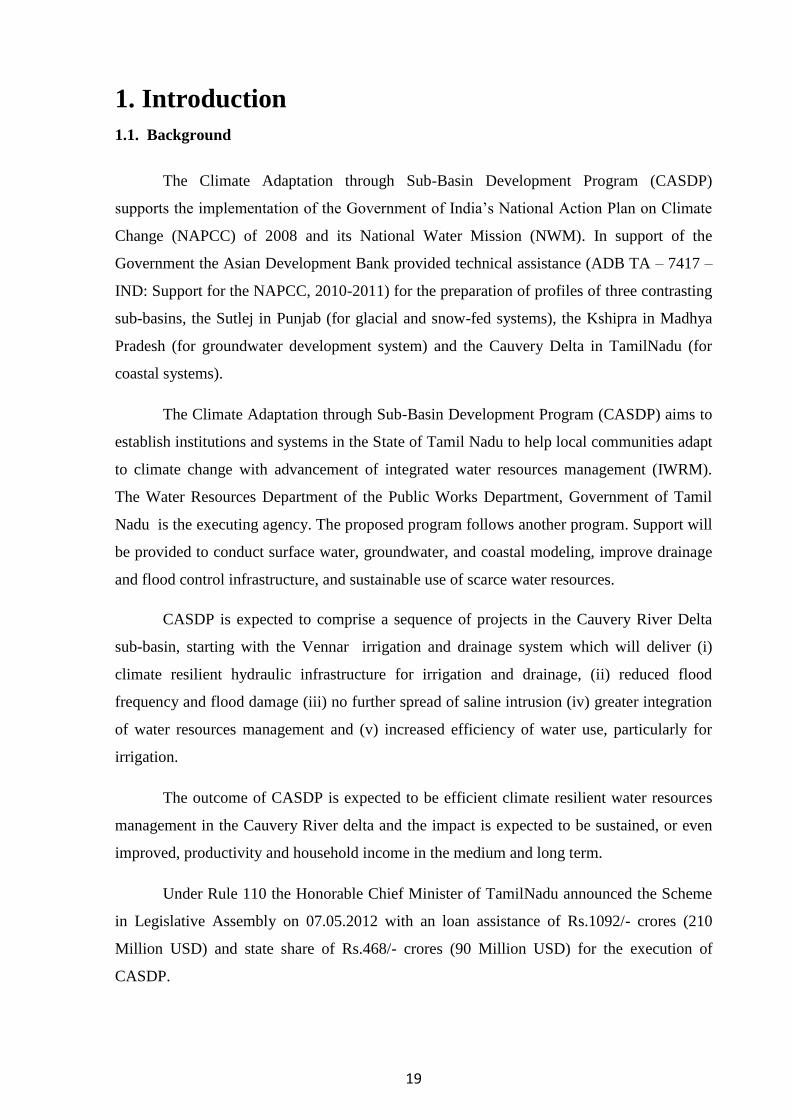
1. Introduction
1.1. Background
The Climate Adaptation through Sub-Basin Development Program (CASDP)
supports the implementation of the Government of India’s National Action Plan on Climate
Change (NAPCC) of 2008 and its National Water Mission (NWM). In support of the
Government the Asian Development Bank provided technical assistance (ADB TA – 7417 –
IND: Support for the NAPCC, 2010-2011) for the preparation of profiles of three contrasting
sub-basins, the Sutlej in Punjab (for glacial and snow-fed systems), the Kshipra in Madhya
Pradesh (for groundwater development system) and the Cauvery Delta in TamilNadu (for
coastal systems).
The Climate Adaptation through Sub-Basin Development Program (CASDP) aims to
establish institutions and systems in the State of Tamil Nadu to help local communities adapt
to climate change with advancement of integrated water resources management (IWRM).
The Water Resources Department of the Public Works Department, Government of Tamil
Nadu is the executing agency. The proposed program follows another program. Support will
be provided to conduct surface water, groundwater, and coastal modeling, improve drainage
and flood control infrastructure, and sustainable use of scarce water resources.
CASDP is expected to comprise a sequence of projects in the Cauvery River Delta
sub-basin, starting with the Vennar irrigation and drainage system which will deliver (i)
climate resilient hydraulic infrastructure for irrigation and drainage, (ii) reduced flood
frequency and flood damage (iii) no further spread of saline intrusion (iv) greater integration
of water resources management and (v) increased efficiency of water use, particularly for
irrigation.
The outcome of CASDP is expected to be efficient climate resilient water resources
management in the Cauvery River delta and the impact is expected to be sustained, or even
improved, productivity and household income in the medium and long term.
Under Rule 110 the Honorable Chief Minister of TamilNadu announced the Scheme
in Legislative Assembly on 07.05.2012 with an loan assistance of Rs.1092/- crores (210
Million USD) and state share of Rs.468/- crores (90 Million USD) for the execution of
CASDP.

20
A PPTA (Project Preparatory Technical Assistance) Consultancy team was set up by
the Asian Development Bank (ADB) to address the Cauvery delta issues and to assist the
TamilNadu Water Resources Department. The Purpose of the PPTA consultancy (ADB
TA – 8166-IND Climate Adaptation through Sub-Basin Development) was to prepare an
investment plan that will deliver the proposed CASDP objectives in the Cauvery River delta.
The Asian Development Bank (ADB) and the Government of Tamil Nadu intend that the
investment plan will be implemented through a stand alone project that will fund over 4 year
period.
The Project area includes six rivers / drains, namely Harichandranathi river, Adappar
river, Pandavayar river, Vellaiyar river, Valavanar drain and Vedaranyam Canal, in the
Vennar irrigation system.
The WRD and PPTA team held discussions about the works to be undertaken for
reconstruction, repair, desilting, standardisation of river banks, construction of new tailend
regulators and dredging etc., in the Project area. Based on the above discussion the cost
estimates are prepared for the above works.
An amount of Rs.20000 Lakhs (US$ 33.333 million) was allotted in the state budget
estimate for the year 2014-2015 for implementation of this work.
1.2 Water Resources Issues in the Cauvery Delta 1.2.1 Introduction
The Cauvery sub-basin in Tamil Nadu has the largest area of agricultural land in
Tamil Nadu and is a significant contributor to total national agricultural output. However the
sub-basin lies in a marginally semi-arid region where the availability of water resources is
limited and variable. Therefore maximum efficiency of water supply and use is a clear
imperative across all water using sectors. The agricultural sector accounts for almost all
water use in the sub-basin, but the irrigation and drainage systems are very old adaptations of
natural drainage systems, particularly in the delta, which for strategic reasons have received
only essential maintenance in the modern era. According to government tests bed losses in
the rivers and main canals are typically 55%.
The consequences of these environmental and infrastructure factors include low
agricultural productivity due to water shortages, insecure rural livelihoods, high vulnerability
to natural disasters such as floods, droughts and tidal surges due to limited and only partially
maintained defences, inefficient water use, over-abstraction of groundwater and disturbed
ecosystems.
21
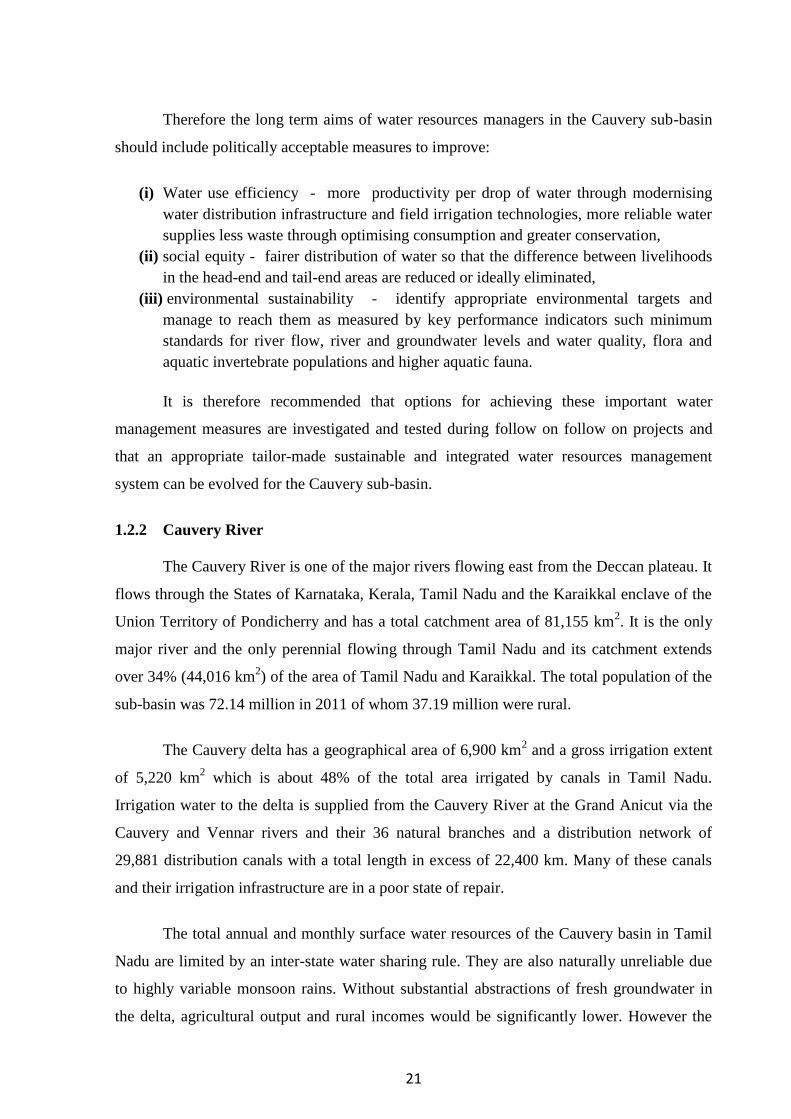
Therefore the long term aims of water resources managers in the Cauvery sub-basin
should include politically acceptable measures to improve:
(i) Water use efficiency - more productivity per drop of water through modernising
water distribution infrastructure and field irrigation technologies, more reliable water supplies less waste through optimising consumption and greater conservation,
(ii) social equity - fairer distribution of water so that the difference between livelihoods in the head-end and tail-end areas are reduced or ideally eliminated,
(iii) environmental sustainability - identify appropriate environmental targets and manage to reach them as measured by key performance indicators such minimum standards for river flow, river and groundwater levels and water quality, flora and aquatic invertebrate populations and higher aquatic fauna.
It is therefore recommended that options for achieving these important water
management measures are investigated and tested during follow on follow on projects and
that an appropriate tailor-made sustainable and integrated water resources management
system can be evolved for the Cauvery sub-basin.
1.2.2 Cauvery River
The Cauvery River is one of the major rivers flowing east from the Deccan plateau. It
flows through the States of Karnataka, Kerala, Tamil Nadu and the Karaikkal enclave of the
Union Territory of Pondicherry and has a total catchment area of 81,155 km2. It is the only
major river and the only perennial flowing through Tamil Nadu and its catchment extends
over 34% (44,016 km2) of the area of Tamil Nadu and Karaikkal. The total population of the
sub-basin was 72.14 million in 2011 of whom 37.19 million were rural.
The Cauvery delta has a geographical area of 6,900 km2 and a gross irrigation extent
of 5,220 km2 which is about 48% of the total area irrigated by canals in Tamil Nadu.
Irrigation water to the delta is supplied from the Cauvery River at the Grand Anicut via the
Cauvery and Vennar rivers and their 36 natural branches and a distribution network of
29,881 distribution canals with a total length in excess of 22,400 km. Many of these canals
and their irrigation infrastructure are in a poor state of repair.
The total annual and monthly surface water resources of the Cauvery basin in Tamil
Nadu are limited by an inter-state water sharing rule. They are also naturally unreliable due
to highly variable monsoon rains. Without substantial abstractions of fresh groundwater in
the delta, agricultural output and rural incomes would be significantly lower. However the
22
quantity and extent of fresh groundwater is limited due to variable recharge and saline
aquifers in the south-east quadrant of the delta. There are signs of over-abstraction of
groundwater.
Damaging floods and droughts are endemic due to erratic monsoon conditions. There
have been three major floods and one major drought in the delta since 2000 causing $70.4
million of damage in Thiravarur and Nagapattinam Districts in the Cauvery delta according
to local Government records. Climate change projections for the delta indicate slightly less
surface water stress during the irrigation season but significantly more flood risk.
1.2.3 Availability of Water Resources
The water resources of the Cauvery River sub-basin in Tamil Nadu, including the
agriculturally important delta, comprise river inflows from neighbouring upstream states,
groundwater from two principal aquifers and direct rainfall, particularly during the north-east
monsoon (November-December). However the availability of each of these sources is
variable.
1.2.3.1 Surface Water
Flow in the Cauvery River and the volume of water stored in the Stanley reservoir are
the major determinants of the annual cropping schedule in the Cauvery River sub-basin. A
poor SW monsoon in Karnataka limits flows in the Cauvery River and the amount of water
stored in the reservoir and therefore reduces the amount of surface water available for
irrigation during the rice growing season (June-January). In the period 1990 to 2013 the
Stanley reservoir filled (93.5 TMC) completely in only 10 years out of 24 years and was less
than half full (46.8 TMC) in 6 years (notably during the severe drought from 2002 to 2004).
The sharing of Cauvery River waters between the riparian states (Karnataka, Kerala,
Tamil Nadu, Pondicherry) had been disputed for many years until February 2013 when the
Supreme Court upheld the water allocation decision of the Cauvery Waters Dispute Tribunal
made in 2007. The allocation to Tamil Nadu, while fair, is insufficient to meet all demands in
the sub-basin. Furthermore there is insufficient storage capacity in the sub-basin in Tamil
Nadu to sustain surface water supplies throughout the year or to conserve excess water.

23
1.2.3.2 Groundwater Groundwater is a vital source that is widely used to compensate for unreliable surface
water supplies. However in the Cauvery delta there are many areas with limited groundwater
availability or with saline groundwater. The characteristics and sustainable yields of the fresh
water aquifers in the Cauvery sub-basin are not fully understood.
There are two principal fresh water aquifers. The upper unconfined alluvial aquifer is
heavily exploited for irrigation and drinking water but records show that it normally recovers
fully each year following the north-east monsoon. The lower confined sandstone aquifer,
which was artesian in the 1960s but has been increasingly exploited since then for irrigation,
has lost pressure and appears to have reached a new equilibrium at a piezometric head 4 to
5m below 1960s levels.
The Central Ground Water Board categorizes the ground water situation by
administrative blocks. Of the 35 blocks in Cauvery delta, 16 are semi-critical, fully exploited
or over-exploited and 8 blocks are unusable due to salinity.
1.2.3.3 Rainfall
Direct rainfall is also a vital additional source of water, but both the south-west and
north-east monsoons are unreliable. Normally the south-west monsoon delivers only light
rains in Tamil Nadu. The north-east monsoon (November to December) is well timed to
supplement surface water in the latter part of the irrigation season when surface water
inflows from the Cauvery River fall but it is notably erratic. Average rainfall during the
north-east monsoon is 750 mm but it is less than 500 mm in 2 out of 10 years. Consequently,
where groundwater is not available, crops are vulnerable at this time of the year.

24
1.2.4 Water Resources Management 1.2.4.1 Policy Framework
The Government of India’s National Water Policy 2012 recognises numerous water
resource issues in India and proposes the introduction of modern water resources
management principles and best practices to address these issues. These include integrating
the planning, development and management of water resources by river basin units, and
treating water as a shared resource on a socially equitable and environmentally sustainable
basis through transparent, informed and participatory decision making.
The policy prioritises safe drinking water, then food security followed by the
maintenance of minimum ecologically acceptable river flows and water levels. After these
priority allocations, remaining water resources should be conserved as much as possible.
Recognising that the availability of water resources is limited and may become more variable
due to climate change, the policy advocates greater control of water use, especially through
more efficient irrigation practices, reduced pollution and reduced net losses.
However in India management of water resources is primarily a state responsibility.
Tamil Nadu has a 1994/2002 state policy which focuses particularly on the government’s
objective to increase agricultural output. The Government of Tamil Nadu prioritises water
supply, particularly for irrigation. Therefore in Tamil Nadu most water services are provided
free of charge to users, especially surface water and groundwater for irrigation with few if
any incentives for efficient use of the water provided.
1.2.4.2 Legislation
The National Water Policy proposes a holistic water framework law that states the
responsibilities of central, state and local governments for the management of water
resources. The policy recognises water as a scarce shared resource that requires careful
management for domestic, agricultural, power generation, navigation and recreational
purposes and ecological sustainability, and also recognises the likely impacts of climate
change. The policy advocates enhanced water availability through greater demand
management, water use efficiency and conservation, and the introduction of water pricing
and improved institutional arrangements for the provision and regulation of water resources.
25
TamilNadu has a set of acts and regulations that has evolved over many years to
govern the supply of water for domestic use and irrigation, maintenance of canals, rainwater
harvesting, protection of riverbanks etc.
1.2.4.3 Water Services
In Tamil Nadu, surface water supply for irrigation is a public service provided by the
Water Resources Department (WRD) of the Public Works Department (PWD) free of
charge. Groundwater abstractions are to be regulated by the state government. Encouraged
by free electricity and subsidised plant, use of groundwater for irrigation by individual
farmers has proliferated over the last 30-40 years.
Surface Water Supply: Surface water for irrigation is distributed across the delta
through a network of natural rivers and man-made canals. Conveyance losses from the main
channels are typically 50% but much of this loss is recovered by infiltration to the
groundwater system. Most of the irrigation infrastructure is old and in need of maintenance.
Channel embankments and some structures are damaged or weak. Flooding by overtopping
and breaching is common. At the operational level, water distribution to the irrigation
systems through the canals are, based mainly on judgement of WRD staff in response to ad-
hoc requests from farmers, with adjustments if any are made in response to rainfall forecasts
or actual rainfall. At the farm level the application of irrigation water by field flooding is
inherently inefficient.
Drainage: Surface water drainage in the irrigation command areas is provided by
drains which discharge back to the rivers or designated main drains. In normal operation,
much of the drainage water is reused in lower command areas. Storm runoff from intense
local rainfall, common during the north-east monsoon in many years, overwhelms the
drainage system causing local inundation of crops and infrastructure. During severe storms,
usually associated with cyclones in the Bay of Bengal, the rivers and main drains become
congested limiting field drainage further. Very high flows in the rivers and drains overtop
and undermine the embankments, causing breaches and further flooding of adjacent land.
Flooding of the Vellaiyar, Harichandra, Adappar and Mullaiyar Rivers and the Valavanar &
Marraka Koraiyar Drains, caused by a cyclonic storm in November 2008, persisted for up to
25 days destroying crops and cutting off rural communities. Other recent major floods
occurred in 2005 and 2010.

26
Water Users: Everybody needs water and therefore the water users comprise society
at large, but there are always clear groupings, e.g. farmers, fishermen, rural households,
urban households, industry, which require different water services in terms of quantity,
quality, frequency, location etc. In the Cauvery basin, the most important current demands
are for:
Annual Water Demand
Irrigation
(Mm3) Aquaculture
(Mm3)
Industrial and domestic
(Mm3)
Power (Mm3)
Total (Mm3)
Present 5007 66 75 18 5166
Future 5007* (4740**) 241 83 18 5349*(5082**)
* The irrigated area is not expected to increase significantly in the future because almost all irrigable land is already in use. Therefore irrigation demand is unlikely to increase.
** If the System of Rice Intensification (SRI) is adopted then irrigation demand will fall significantly.
1.2.5 Climate Change
Climate change studies (Srinivasan, ADB 2013) during the project preparation for
CASDP indicate that moderate increases in mean annual rainfall and temperature can be
expected in the period up to 2050 with corresponding moderate increases in runoff. While
the increase in annual temperature is mirrored in monthly temperature, the increase in annual
rainfall masks reductions of 16-23% in monthly rainfall from January to May and increases
of 13% during the south-west monsoon from June to September and increases of 4% during
the north-east monsoon from October to December. From an agricultural perspective this is a
relatively benign outlook as increases in crop water requirements caused by higher
temperatures may be satisfied by increases in rainfall at the optimum times. However the
projections also show large increases in storm rainfall (19%) and storm runoff (29%).
Therefore more frequent and serious flooding can be expected. In coastal areas flooding will
be gradually exacerbated by rising sea levels of between 0.29m (low scenario) and 0.87m
(high scenario) by 2100 (Dastgheib and Ranasinghe, ADB 2014). The 100-year tidal storm
surge is estimated to be 0.74m.

27
1.3 State Government Responses to Water Resources Issues
The Government of Tamil Nadu’s general response to state-wide water resources
availability and management challenges includes the Irrigated Agriculture Modernization
and Water-Bodies Restoration and Management (IAMWARM) project. But in the Cauvery
River sub-basin, the government’s response has been, until recently, inhibited by the long-
running water sharing dispute with Karnataka and other riparian states. However, following a
Cauvery Waters Dispute Tribunal ruling in 2007, which allocated 57% of the surface water
yield of the Cauvery River basin to Tamil Nadu, the Tamil Nadu Water Resources
Department prepared the Cauvery Modernisation Project (CMP, WRD 2008). Since the
Supreme Court decision in 2013 to uphold the 2007 tribunal ruling the CMP has been
superseded by the Cauvery Modernisation Proposal (WRD, 2013. Proposal for
Improvements and Rehabilitation of Irrigation Systems in the Cauvery Basin for Efficient
Water Management).
1.3.1 IAMWARM Project
The IAMWARM project is a World Bank assisted multi-departmental project
designed to bring positive changes to irrigated agriculture in Tamil Nadu. The project
involves multiple stakeholders both at facilitation and implementation levels and is being
implemented in 60 sub-basins in Tamil Nadu. It aims to expand the area under irrigated
agriculture through effective and efficient water management practices in order not only to
produce more crops, meat, milk, and fish per drop of water but also to generate more income
per drop. The project was formulated with World Bank assistance with a budget of $424.5
million (Rs.2,547 crore) over a period of six years from 2007.
The IAMWARM project aims to improve the service delivery of irrigation systems
and productivity of irrigated agriculture with effective integrated water resources
management in a sub-basin framework. The project has four components (i) irrigation
systems modernisation in a sub-basin framework which seeks to improve bulk water delivery
through modernisation of irrigation systems with a total command area of 617,000 ha, (ii)
agricultural intensification and diversification to increase the productivity of agriculture-
related activities through improved agricultural intensification and diversification of crops,
micro irrigation, animal husbandry and inland aquaculture, (iii) institutional modernisation
for irrigated agriculture which seeks to improve institutional capacity for, and participatory
irrigation management, in irrigation service delivery through the WRD and water users
associations (WUAs), (iv) improved institutional arrangements and capacity for sustainable
water resources management including the creation of the State Water Resources
Management Agency (SWARMA).

28
1.3.2 Cauvery Modernisation Proposal
The WRD has prepared a Proposal for Improvements and Rehabilitation of Irrigation
Systems in the Cauvery Basin for Efficient Water Management (WRD, 2013) which
supercedes an earlier proposal prepared in 2008 (WRO, 2008). This updated proposal for the
rehabilitation of most of the irrigation infrastructure in the Cauvery River sub-basin. The
proposal lists 182 check dams, 11,213 head sluices, 456 regulators, 223 aqueducts, 695
syphons and 679 drop structures and other allied structures in addition to lining of channels
to improve conveyance efficiency. The estimated cost of the WRD proposal is $1.9 billion
(50% from the Central Government; 50% from Tamil Nadu Government of which 45% can
be foreign funded).
The rationale of the proposal is that irrigation infrastructure in the Cauvery sub-basin
has been deprived of major financial investment for many years due to Cauvery waters
dispute. Now that the final award of the tribunal has been legally upheld, this proposal has
been submitted for Government of India financial assistance. During the preparation of
CASDP it was noted that some of the proposed WRD investments overlap with those
proposed under CASDP. This therefore led to the revision of the scope of CASDP outputs to
exclude implementation of on-farm irrigation improvements.
1.3.3 Climate Adaptation through Sub-Basin Development Program (CASDP)
The Climate Adaptation through Sub-Basin Development Program (CASDP)
supports the implementation of the Government of India’s National Action Plan on Climate
Change (NAPCC) of 2008 and it’s National Water Mission (NWM). In support of the
Government, the Asian Development Bank provided technical assistance (ADB TA-7417-
IND: Support for the NAPCC, 2010-11) for the preparation of profiles of three contrasting
sub-basins, the Sutlej in Punjab (for glacial and snow-fed systems), the Kshipra in Madhya
Pradesh (for groundwater dependent systems) and the Cauvery delta in Tamil Nadu (for
coastal systems).
The Cauvery delta was chosen because it potentially provides a good demonstration
site for NWM objectives and the Government of India’s water resources reform agenda and
lies within a river sub-basin where IWRM could address complex water resources issues
such as limited availability of surface water, over-abstraction of groundwater, salinity,
inefficient use of water and the likely impacts of climate change.
29
CADSDP aims to increase water security and decrease flood damage in the Cauvery
delta to help local communities in the Cauvery Delta adapt to climate change. As such it is in
alignment with the Cauvery Modernisation Proposal.
1.4 The Design of CASDP 1.4.1 Rationale
Section 1 explains that communities in the Cauvery delta, particularly in rural areas,
are vulnerable to a number of water resources issues that negatively affect their livelihoods
and well being. Water services for irrigation and domestic use are unreliable due to limited
and variable availability of water resources, the distribution of water irrigation is inequitable
due to the poor physical condition of irrigation infrastructure and the use of water is
generally inefficient due to high distribution and field losses, highly consumptive crops
i.e.paddy and low emphasis on water conservation. Floods and droughts are endemic.
Climate change projections promise an intensification of floods, compounded in coastal
areas by rising sea levels.
The Cauvery Modernisation Proposal (WRD, 2013) to address these issues in the
Cauvery sub-basin includes major investments in the rehabilitation of irrigation systems and
improved water resources management. CASDP has been designed in alignment with this
proposal to make structural and non-structural climate adaptations in the water sector in the
Cauvery sub-basin.
The structural investments will include extensive channel re-sectioning and raised
embankment along the principal rivers, drains and coastal outlets in the Vennar and Cauvery
irrigation systems, according to new engineering design guidelines and climate change
projections, to reduce the frequency and impact of flooding. The structural investments will
also include the repair and reconstruction of existing irrigation infrastructure and the
construction of new infrastructure to improve water supply.
The non-structural investments and interventions will include greater use of decision
support systems for the seasonal planning and operational control of irrigation water
distribution, the assessment of flood risk in the Vennar and Cauvery systems and the
preparation of flood risk maps and flood management plans.

30
1.4.2 Impact
The long term impact of CASDP is expected to be improved resilience to climate
change of communities in the Cauvery delta. The aim is to provide a minimum standard of
flood protection that will contain future floods with return periods up to 25-years and to
improve the security and fair distribution of irrigation water supply and to increase mean
annual crop yields and thereby rural livelihoods for both men and women. Indicators that this
impact has been achieved will be that in 2050 average rural income per household will be
increased from 2015 values and average annual flood damage per household will be reduced
from values in 2015.
1.4.3 Outcome
The medium-term outcome of CASDP is expected to be that by 2025 irrigated
agriculture has been resumed or introduced in currently unproductive land in tail end areas,
sea water ingress into rivers and drains with tail end regulators has been eliminated and the
annualised cost of flood damage has fallen significantly from 2000-10 values.
1.4.4 Outputs
There are two principal outputs of CASDP are: Output 1 - Integrated programs and infrastructure for the management of surface
water, groundwater and salinity.
Output 2 - Improved systems for water resources management. These outputs are discussed in the flowing sections. 1.4.4.1 CASDP Output 1- Integrated programs and infrastructure for the management of surface water, groundwater and salinity
CASDP Output 1 will deliver structural adaptations for optimal use of surface water
so that as many areas of the Cauvery delta are served with irrigation water equally and
efficiently as possible. The programs required to achieve this include essential civil works,
using new design guidelines developed during the preparation of CASDP for irrigation
infrastructure in the Cauvery delta, to rehabilitate dilapidated surface water irrigation
infrastructure so that it is fit for purpose to maintain normal irrigation supply levels in the
surface water distribution system and deliver the correct quantities of irrigation water to as
many areas as possible on a systematic and planned basis.

31
The civil works will include re-sectioning and bank strengthening of main channels
and coastal outfalls to improve their resilience and conveyance capacity, and will include
new, reconstructed and repaired regulators, head sluices, bed dams and other minor
structures. The works will also include the rehabilitation of existing pumped irrigation
schemes.
The civil works will also improve the management of floods through increased
conveyance of the rivers and main drains, strengthened embankments raised to accommodate
at least the 25-year flood and principal regulators designed to pass the at least the 50-year
flood.
The activities and timetables required to deliver Output 1 of CASDP are:
Implement new design guidelines for the drainage system by January 2015. Implement structural improvements to the Vennar and Cauvery systems by December
2018 (4 years).
Rehabilitate the head works of lift irrigation schemes in the Vennar and Cauvery systems by December 2018 (4 years)
The programs also include vital groundwater monitoring and investigations to determine
sustainable yields of the fresh water aquifers, the most effective means of increasing their
recharge and the dynamics of the saline water aquifers. The investigations will be followed
by the development and implementation of conjunctive use plans and viable groundwater
recharge schemes designed to increase the security of water supply in all areas of the delta.
The measurable performance indicators and targets for Output 1 will be that by 2018: Capacities of of principal irrigation and drainage channels are standardised to
withstand 25-year design flows taking climate change impact into account.
90% of regulators and head sluices are in full working order. Existing tail-end regulators are rehabilitated and new tail-end regulators are
constructed.
Coastal outlets are stabilized and maintained. The head works of lift irrigation schemes are rehabilitated.
1.4.4.2 CASDP Output 2- Improved Systems for Water Resources Management
CASDP output 2 will deliver non-structural adaptations designed to deliver more
efficient management through three main initiatives (i) greater coordination of public water
services provided by the Government (particularly the Water Resources Department, the
Groundwater Department and the Agriculture Department), (ii) capacity development of
Government officers in monitoring the availability of groundwater and surface water

32
resources and water use, and in decision making supported by an appropriate decision
support system (DSS) and (iii) flood risk management plans for the most flood prone
catchments.
The activities required to deliver Output 2 of CASDP are: Implement telemetered networks in the Vennar and Cauvery systems to monitor
climate, surface water and groundwater levels and flows by December 2018 (4 years). Implement a decision support system for water resources management in the Cauvery
sub-basin by December 2015.
Implement flood risk management plans for the most flood prone catchments that include measures to raise public awareness and readiness, flood forecasting and warning services, planned government and communal responses and post-disaster damage assessment and reparation procedures.
The measurable performance indicators and targets for Output2 will be that by 2018: Surface water and groundwater monitoring network will be fully operational. The stage-discharge rating of each regulator is calibrated through the flow range and
routinely updated through a programme of direct flow measurements. WRD staff use a DSS to support routine decisions on equitable and efficient
distribution of surface and ground water. WRD field hydrology team perform routine flow measurements, operate and
maintain monitoring stations. WRD AEEs and AEs process, analyse and interpret data using a DSS.
WRD staff perform gender sensitive post-flood surveys and map flood extents in order to determine the depth, duration, water velocity of the floods that will be used to update flood risk assessments and improve the timeliness and precision of flood forecast and warnings.
Once triggered by flood warnings issues by WRD, Flood disaster management plans are implemented in each affected district by the District Collectors , resulting in a significant reduction in flood damage in monetary terms.
Distribution of irrigation water is more equitable use of surface water and the irrigated area in tail end taluks increases significantly.

33
1.4.5 Implementation of CASDP 1.4.5.1 Finance
CASDP will be funded as a stand alone project (ADB, 2008) with a total value of
$152 million (INR 912 crores), $106.4 million from an ADB loan and $46 million from the
GoTN.
Tranche Description Budget
Timetable $ million
INR crores
1
Vennar irrigation system on the Adappar, Harichandra, Vellaiyar and Pandavanar
rivers, the Valavanar Drain and the Vedharanyam Canal and straight cuts.
152.00 912.00 2014-2018
Each project will require feasibility studies and the preparation of Detailed Project
Report (DPRs) for approval by the ADB and GoTN. The DPR for the Project has been
prepared jointly by the Tamil Nadu Water Resources Department (WRD) and ADB’s PPTA
consultants (Mott MacDonald). Preparation of the DPRs for follow on project will be one of
the activities to be carried out during the execution of this project along with essential
preparations such as groundwater investigations, topographic surveys etc.
A Facility Administration Manual (FAM) has been prepared for the day-to-day
administration of the stand alone project and implementation of the Program. The FAM sets
out in detail the implementation plans, project management arrangements, costs, financing
arrangements, financial management procedures, procurement plans, requisite consultancy
services, performance monitoring/evaluation/reporting systems, communication plans and
social, environmental and corruption safeguards.
The Program will be executed by the WRD through a dedicated Project Management
Unit (PMU) under the direction of a Project Director with Superintending Engineer rank and
three Project Implementation Units (PIUs) under the supervision of PMU.
The activities that will take place during the Project are described in Section 3.6.1 and
3.6.2.

34
Activities of follow on projects are briefly outlined in Section 3.6.3. These cannot be
specified precisely until the projects are prepared during this Project, but because of the
broadly similar environmental and water management characteristics across the Cauvery
irrigation systems, they are likely to be broadly similar to the activities during this Project.
1.4.3.2 Management of CASDP
A program management unit (PMU) will be established in the WRD Trichy Regional
Chief Engineer’s office for overall project management which includes implementation of
Project and planning and preparation of follow on projects. The core functions of the PMU
will include (i) design and planning, (ii) procurement of goods, works and services, (iii)
contract supervision and quality assurance control, (iv) program finance management, (v)
implementation of environmental and social safeguards, and (vi) program benefit monitoring
and evaluation.
For this Project three project implementation units (PIU) will be established in
Thiruvarur, Nagapattinam and Thiruthuraipoondi to oversee the day to day implementation
of project activities. The core functions of the PIU will include: (i) construction supervision,
(ii) contract management, (iii) quality assurance control, (iv) monitoring of implementation
of resettlement and environmental management plans, (v) conducting stakeholder
consultations and (vi) addressing any project related grievances.
The Governments of India and Tamil Nadu and the Asian Development Bank (ADB)
intend that the CASDP will be implemented through a stand alone project investment plan
valued at $152 of which $101 million is to be a loan and $51 million is to be provided by the
state government.
1.4.5.3 Social Safeguards
A resettlement framework has been prepared for the entire CASDP Program and a
resettlement plan for this project. A total of 220 residential and commercial structures will be
affected by Project representing 100 residential structures, 17 commercial structures, 6
commercial-cum-residential structures and 97 sheds. All these people are squatters or
encroachers on the public land. The entitlement matrix has addressed the requirements of
ADB and the 2013 land acquisition and resettlement and rehabilitation law of India, and also
refers to resettlement precedents set during the recent World Bank assisted Tamil Nadu Road
Sector Project: Kumbakonam Bypass Extension, 2009. The total number of squatters or
encroachers are to be verified by the Revenue Department.
35
1.4.5.4 Environmental Safeguards
An Environment Assessment Review Framework (EARF) for CASDP and an Initial
Environmental Assessment (IEE) for the Project have been prepared in accordance with the
ADB Safeguard Policy Statement (2009).
Some of the interventions proposed under the Project fall within the coastal
regulation zone and therefore require prior clearance from the Coastal Zone Management
Authority. Therefore, under the Coastal Regulation Zone (CRZ) Notification procedure
(2011) and the EIA Notification procedure (2006), applications for CRZ clearance and TOR
for the necessary EIAs have been prepared.
1.4.6 Execution of Project
A detailed project report (DPR) has been prepared for CASDP Project according to
Government of India Guidelines (CWC, 2010). The structural climate adaptations to be
implemented under Output 1 of this Project comprise and the non-structural climate
adaptations under Output 2 are summarised in the following sections.
1.4.6.1 Project Output 1 - Integrated Programs and Infrastructure for the Management of Surface Water, Groundwater and Salinity
The structural adaptations to be implemented under Output 1 of this Project comprise: Re-sectioning and bank strengthening of six main channels totalling 235km to
improve their resilience and flood conveyance capacity Improved conveyance of three straight cuts between the Vedharanyam canal and the
sea Construction of new regulators, reconstruction of existing dysfunctional regulators
and repair of existing damaged regulators Work (new, reconstruction and repair) on 147 irrigation head sluices off-taking from
the main channels Work on 20 bed dams and grade walls within the main channels Work on 93 other minor irrigation and drainage structures Upgrading of 13 pump stations comprising new pumps and electrical systems and
repairs to pump houses
Additional structural measures (e.g. flood retention areas, new or enlarged drains) are
excluded from this Project because the WRD has determined that new land cannot be
acquired by the government for these purposes.
1.4.6.2 Project Output 2 - Improved Systems for Water Resources Management

36
The non-structural adaptations to be implemented under Output 2 of Project
comprise:
Monitoring: A vital foundation for effective water resources management is
knowledge and understanding of the spatial and temporal availability of water resources
within a coherent hydrologic unit e.g. a river basin. In the Cauvery basin this knowledge and
understanding is incomplete due to shortages of data and information of many types
including:
topographic and drainage network maps, water quality, DEMs sediment loads, cropped areas, irrigation requirements, rainfall intensity, groundwater abstractions, river, canal and drain flows and water
levels, tide levels
groundwater levels,
Therefore, starting in the Cauvery delta with the Harichandra, Vellaiyar and
Pandavayar Rivers and its adjacent command areas, a limited intensification of water
resources monitoring and assessment is proposed on a trial basis during CASDP Project.
This will be delivered as part of the CASDP Project investments together with a simple
decision support system (DSS) comprising hardware and software that will capture the data
automatically and process, analyse, interpret, report and archive it.
Decision Support System (DSS): A simple DSS will be developed during Project
to support WRD in key decision making such as (i) facilitating irrigation planning and
efficient water distribution for the systems (on seasonal and 10-day time scales) based on
actual needs, both for surface water and groundwater, (ii) fine tuning release of water to
actual needs in individual command areas according to antecedent soil moisture and forecast
rainfall, (iii) detecting and responding to distribution system problems and breakdowns and
(iv) integrated operation of dams, head regulators, cross regulators and tail regulators to
maintain appropriate flows and water levels during both normal supply and flood periods.
Initially a simple DSS is proposed on the Harichandra, Vellaiyar and Pandavayar rivers
comprising surface water and groundwater databases containing hydro-meteorological,
hydrological and hydrogeological data and irrigation command area information. Four main
inputs into the proposed simplified DSS are proposed (i) field monitoring equipment, (ii)
computer hardware and database software, (iii) a programme of flow measurements to
calibrate discharges through regulators and (iv) a watering schedule calendar in the form of a
simple spreadsheet.

37
The simple DSS will be accessible to WRD decision makers through a user-friendly
computer interface which will allow them to inspect up-to-date river levels, flows, water
demands throughout an irrigation system and to adjust surface water deliveries to actual
needs considering groundwater availability and recent rainfall in the command areas.
Capacity Development: WRD staff will need regular and intensive capacity
development in monitoring the irrigation systems, updating and maintaining the databases,
use of the information generated, and dissemination of information to farmers and other
stakeholders. Beside this, an overall capacity building program in climate-resilient integrated
water resources management will need to be developed to gain knowledge and upgraded
skills in using climate change projections and new criteria for engineering designs, setting up
and using hydraulic and hydrologic modelling for design and planning, flood forecasting and
warning, and working with farmers to manage surface water and groundwater resources
more efficiently and equitably.
1.4.7 Execution of CASDP follow on projects
The preparation of follow on projects in the balance Vennar and the Cauvery
irrigation systems respectively is expected to take place simultaneously during the
implementation of this Project. The structural climate adaptations required in these irrigation
systems are likely to be broadly similar to those required under Output 1 of this Project in
the lower Vennar system i.e. optimised use of surface water; rehabilitation of dilapidated
surface water irrigation infrastructure including re-sectioning and bank strengthening of main
channels and coastal outfalls; new, reconstructed and repaired regulators, head sluices, bed
dams and other minor structures; rehabilitation of existing pumped irrigation schemes;
increased flood protection.
The non-structural climate adaptations required under follow on projects are likely to
be extensions and elaborations of the adaptations required under the Project i.e. further
upgrading of the surface water, groundwater and meteorological monitoring network and the
DSS with the necessary additional capacity development of Government staff.
Depending on their outcomes during this Project the groundwater sub-projects could
be replicated or expanded in follow on projects.

38
A more sophisticated DSS is recommended to support the maximization of water use
efficiency and fully reap the benefits of integrated water resources management within the
Cauvery Delta. This more sophisticated DSS could include hydrologic and hydraulic models
that would guide the operators of the irrigation and drainage systems on a daily basis and
provide comprehensive assessments of water resources management options on a seasonal
basis. Further development of the DSS could include flood forecasting (using links to the
India Meteorological Department and the CWC) and flood warning.
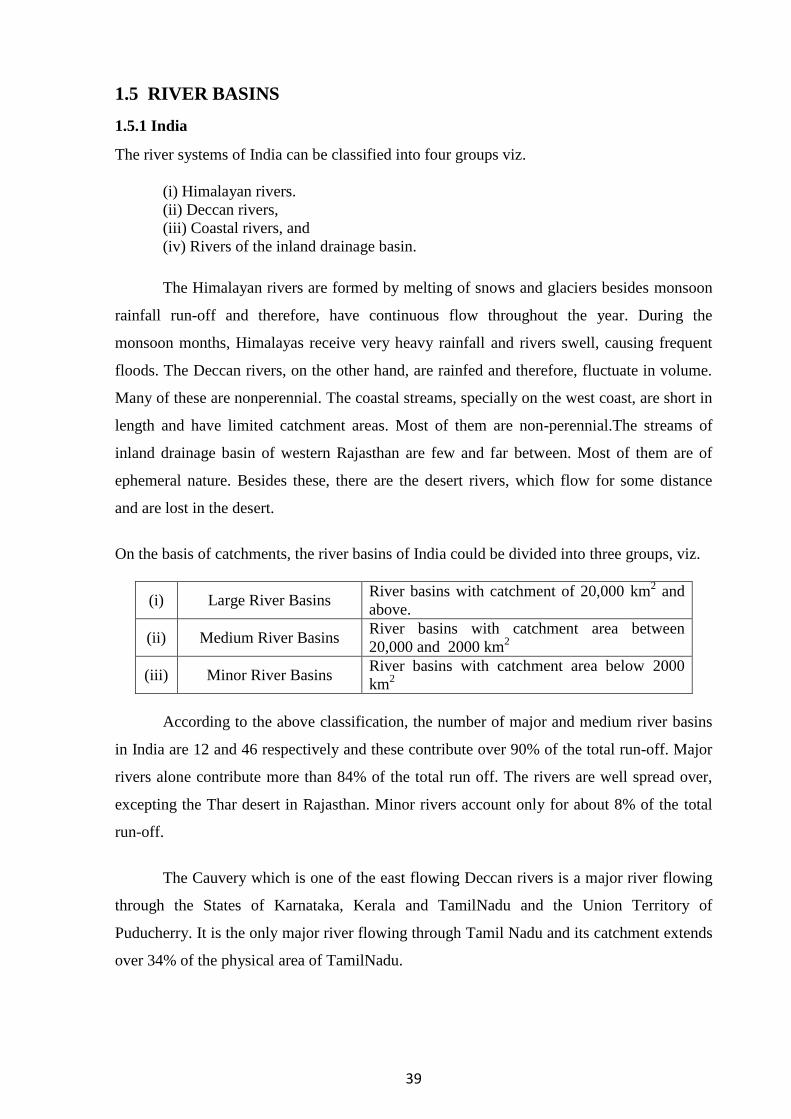
39
1.5 RIVER BASINS
1.5.1 India
The river systems of India can be classified into four groups viz.
(i) Himalayan rivers. (ii) Deccan rivers, (iii) Coastal rivers, and (iv) Rivers of the inland drainage basin.
The Himalayan rivers are formed by melting of snows and glaciers besides monsoon
rainfall run-off and therefore, have continuous flow throughout the year. During the
monsoon months, Himalayas receive very heavy rainfall and rivers swell, causing frequent
floods. The Deccan rivers, on the other hand, are rainfed and therefore, fluctuate in volume.
Many of these are nonperennial. The coastal streams, specially on the west coast, are short in
length and have limited catchment areas. Most of them are non-perennial.The streams of
inland drainage basin of western Rajasthan are few and far between. Most of them are of
ephemeral nature. Besides these, there are the desert rivers, which flow for some distance
and are lost in the desert.
On the basis of catchments, the river basins of India could be divided into three groups, viz.
(i) Large River Basins River basins with catchment of 20,000 km2 and above.
(ii) Medium River Basins River basins with catchment area between 20,000 and 2000 km2
(iii) Minor River Basins River basins with catchment area below 2000 km2
According to the above classification, the number of major and medium river basins
in India are 12 and 46 respectively and these contribute over 90% of the total run-off. Major
rivers alone contribute more than 84% of the total run off. The rivers are well spread over,
excepting the Thar desert in Rajasthan. Minor rivers account only for about 8% of the total
run-off.
The Cauvery which is one of the east flowing Deccan rivers is a major river flowing
through the States of Karnataka, Kerala and TamilNadu and the Union Territory of
Puducherry. It is the only major river flowing through Tamil Nadu and its catchment extends
over 34% of the physical area of TamilNadu.

40
1.5.2 Tamil Nadu
An attempt to demarcate the areas of the main and minor catchment basins of Madras
Presidency was first made by Captain Pennyquick in the year 1884 and a map was also
prepared by him titled as "General Irrigation Map of the Madras Presidency to illustrate the
rainfall and water supply available by River Basins".
In 1978 a River Basin Map of TamilNadu was prepared by the Irrigation Department
demarcating 33 east flowing river basins and one west flowing river basin. Later in 1987, the
State Planning Commission, while wanting to make an assessment of the Water Resources of
TamilNadu, commissioned a Committee of Experts who adopted the same demarcation of 34
river basins.As per the norms of the Central Water Commission for the classification of
River basins referred to above, there is one large River basin, 10 medium River basins and
22 minor River basins in TamilNadu, besides the west flowing river basins, that emanate
from TamilNadu. They are all detailed below in Table 1.5.1 with their catchment extents.
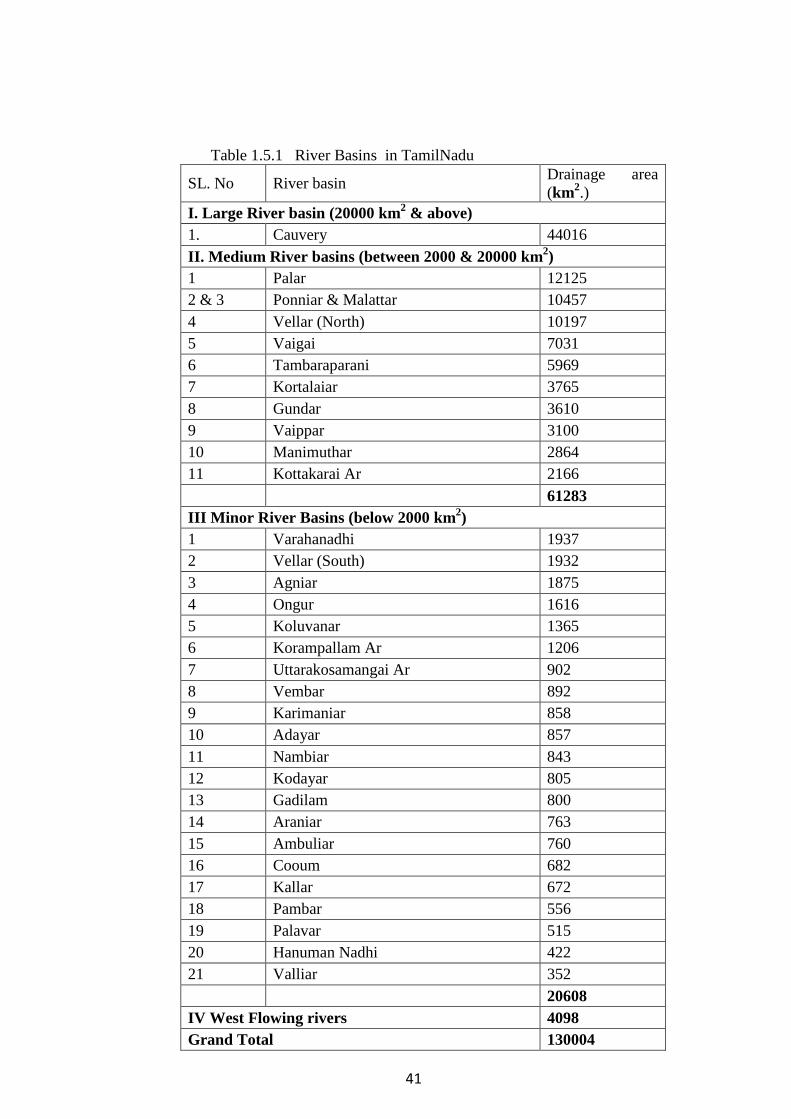
41
Table 1.5.1 River Basins in TamilNadu
SL. No River basin Drainage area (km2.)
I. Large River basin (20000 km2 & above) 1. Cauvery 44016 II. Medium River basins (between 2000 & 20000 km2) 1 Palar 12125 2 & 3 Ponniar & Malattar 10457 4 Vellar (North) 10197 5 Vaigai 7031 6 Tambaraparani 5969 7 Kortalaiar 3765 8 Gundar 3610 9 Vaippar 3100 10 Manimuthar 2864 11 Kottakarai Ar 2166 61283 III Minor River Basins (below 2000 km2) 1 Varahanadhi 1937 2 Vellar (South) 1932 3 Agniar 1875 4 Ongur 1616 5 Koluvanar 1365 6 Korampallam Ar 1206 7 Uttarakosamangai Ar 902 8 Vembar 892 9 Karimaniar 858 10 Adayar 857 11 Nambiar 843 12 Kodayar 805 13 Gadilam 800 14 Araniar 763 15 Ambuliar 760 16 Cooum 682 17 Kallar 672 18 Pambar 556 19 Palavar 515 20 Hanuman Nadhi 422 21 Valliar 352 20608 IV West Flowing rivers 4098 Grand Total 130004
42
The Institute for Water Studies, when they prepared a Report "State Framework
Water Resources Plan of TamilNadu" in 1999, grouped the minor basins together and listed
17 river basins in TamilNadu for study purposes.
1.6 THE CAUVERY BASIN
1.6.1 Description
The river Cauvery rises at Talakaveri on the Brahmagiri ranges of the western ghats
in the Coorg District of Karnataka. Cauvery then passes through Karnataka and TamilNadu.
The length of the main river as it passes through Karnataka and TamilNadu is 800 km, of
which 320 km lies in Karnataka, 416 km in TamilNadu and the remaining length of 64 km
forms the common boundary between the States of Karnataka and TamilNadu. The lengths
of the tributaries of Cauvery in various States is given in the statement in Table 1.5.1.
1.6.2 Drainage Area
The drainage area of the river Cauvery in the three States including the Union
Territory of Puducherry are as under:
in km2. Karnataka 34273 Kerala 2866 Tamil Nadu (including Puducherry) 44016 Total 81155
The Cauvery Water Disputes Tribunal has divided the Cauvery basin upto the Lower
Coleroon Anicut into 16 sub-basins. The Map of Cauvery basin with the 16 sub basins is
given in Figure 1.1. The names of the sub-basins with their catchment area are given below
in Table 1.6.2

43
Cauvery Basin: Basin and Tributaries
Sl. No
River / Tributaries
Total Length (km)
Length (km) /Location (km)
1 Cauvery 802 381 in Karnataka
64 common
boundary
357 in Tamil Nadu
2 Harangi 50 Entirely in Karnataka
3 Hemavathy 245 do
4 Lakshmanathirtha 131 do
5 Kabini 230 60 Kerala
170 Karnataka
6 Suvarnavathy 88 58 Karnataka
30 Tamil Nadu
7 Shimsha 221 Entirely in
Karnataka
8 Arkavathy 161 Entirely in Karnataka
9 Palar 100 60 Tamil Nadu - Karnataka border
40 Tamil Nadu
10 Bhavani 242 32 Kerala
210 Tamil Nadu
11 Noyil 155 Entirely in Tamil Nadu
12 Amaravathy 214 30 Kerala
184 Tamil Nadu
13 Ponnaniar 80 Entirely in Tamil Nadu
Table 1.6.1

44
FIGURE 1.1

45
Table 1. 6.2 Area of the Sub-Basins of Cauvery Fig. in sq.km.
Sl.No Sub-basin Area of the sub-basin (km2)
State wise break - up
Kerala (km2)
Karnataka (km2)
Tamil Nadu (km2)
1 Thala Cauvery 3519 --- 3519 ---
2 Hemavathy 5410 --- 5410 ---
3 Lakshmanathirtha 1690 --- 1690 ---
Total upto KRS 10619 0 10619 0
4 Kabini 7414 1920 5282 212
5 Suvarnavathy 2858 --- 2278 580
6 Shimsha 9700 --- 9700 ---
7 Arkavathy 4351 --- 4184 167
8 Palar 3214 --- 1870 1344
9 Chinnar 4061 --- 100 3961
Total upto Mettur 42217 1920 34033 6264
10 Bhavani 6455 562 240 5653
11 Noyyil 3972 --- 3972
12 Amaravathy 8547 384 8163
13 Thirumanimuthar 5564 --- 5564
14 Ponnaniar 3374 --- 3374
15 Upper Coleroon 3082 --- 3082
Total 15 sub-basins 73211 2866 34273 36072
16 Cauvery Delta 6739 --- --- 6739
Total 16 sub-basins 79950 2866 34273 42811
Area below LCA 1205 1205
Total area of the basin 81155 2866 34273 44016

46
Administration Units in the Cauvery basin - the District wise and sub-district wise
particulars of Cauvery basin in each basin State are as below:-
State Districts or Sub – Districts
Karnataka Kodagu (Coorg), Mysore, Hassan, Mandya, Bangalore, Tumkur, Chickmagalur and Kolar
Kerala Wyanad, Idukki and Palghat.
Tamil Nadu
Nilgiris, Erode, Coimbatore, Salem, Namakkal, Dharmapuri, Karur, Dindugal, Tiruchirapalli, Perambalur, Ariyalur, Thanjavur, Tiruvarur, Nagapattinam, Pudukottai and Cuddalore.
Puducherry Karaikal
1.6.3 Population: The population in the Cauvery basin as per 2011 Census is 166.86 million of which
40% is urban and 60% are rural as follows:
State Urban Rural Total
Karnataka 23578175 37552529 61130704
Kerala 15932171 17455506 33387677
TamilNadu 34949729 37189229 72138958
Puducherry (Karaikal)
98181 102133 200314
Total in the basin 74558256 92299397 166857293

47
1.6.4 Tributaries of Cauvery
The Cauvery river has many tributaries in Karnataka, Kerala and Tamil Nadu. The
tributaries in Karnataka are Harangi, Hemavathi,Lakshmanathirtha, Suvarnavathy,
Shimsha and Arkavathy. One of its main tributaries, Kabini, originates in Kerala, passes
through Karnataka and joins the Cauvery, near T.Narsipur, below the KRS reservoir.
Another tributary in Kerala is the Pambar, which passes through Tamil Nadu and takes the
name of Amaravathy and joins the river Cauvery below Mettur near Karur. The tributary
Bhavani originates in Tamil Nadu, enters Kerala and again re-enters Tamil Nadu to join
Cauvery at Bhavani below Mettur, north of Erode.Another tributary viz., Noyyil,
originates in the Coimbatore district in TamilNadu and joins the river Cauvery near
Kodumudi. There are two other minor tributaries, Palar on the right and Chinnar on the
left, which join the water spread area of Mettur and contribute their flows to Mettur
reservoir.
1.6.5 Unique feature of Cauvery:
The Cauvery enters the State of TamilNadu at one point, which offers good scope
for measuring the flows that enter from the upper State, and is useful for defining the
water share between the States. This is unique in the sense that no other major Inter State
river in the country has its topography so defined that it enters from one State to another
through one single route.
1.6.6 Upper Anicut:
As the river rolls down through the gorge it has itself carved in the Eastern Ghat
ranges, it takes a turn towards south and enters the Mettur reservoir. Thereafter it
continues to flow south until the tributary Bhavani joins and turns to flow by and large
towards the east. Following the general topographical features, the river flows in the
plains, widening its bed and in mild and milder slopes, the slope coming down to as low as
about 1 / 3500 towards the sea end. The river drops the sand and silt in its course and starts
its deltaic sojourn from the Upper Anicut.
At the Upper Anicut 177 km from Mettur, the river splits into two branches,the
northern branch being called the Coleroon, essentially serving as a flood carrier, and the
southern branch retaining the name of the parent river Cauvery, essentially carrying
discharges released for irrigation. The Upper anicut was constructed across Coleroon in

48
1836 at this point to facilitate diversion of the low supplies of the river for irrigation in the
Cauvery Delta. A flood regulator was constructed later on the Cauvery arm also in 1977
for regulation of irrigation flows. Some 30 km below, the surplus of Cauvery released
from the Grand Anicut flows through Ullar, a short link and joins Coleroon, thus forming
an island between Cauvery and Coleroon called Srirangam, which is ranked as the first in
the 108 Divya Desams for Vaishnavites where Lord Sri Ranganatha has his abode in a big
temple, centuries old.
1.6.7 Grand Anicut The Grand Anicut, constructed during the second century A.D. by a Chola King,
Karikala Chola, is really a Grand structure as the name itself implies, but has come up as a
structure constructed in an emergency when the river Cauvery breached its left flank and
rushed down to flow through the adjacent Coleroon on the left with the deltaic lands
served by Cauvery left high and dry.
16.8 The Delta
At the Grand Anicut complex, the river Cauvery splits into two, Cauvery and
Vennar, each provided with Head Regulators. These natural rivers act as the main
irrigation canals for the supply of water to the fields in the Delta. These rivers, in turn,
divide and sub-divide into a number of branches, which form a network all over the Delta,
and distribute the Cauvery waters in the vast irrigation system. These rivers also carry the
local drainages and act as irrigation-cum-drainage rivers in the lower part. Occasionally
these rivers are to carry the floods too which reach the Grand Anicut.The Grand Anicut
canal, whose head regulator also is located in this complex, is the one designed and
executed as the canal component of the Mettur Reservoir Project to irrigate an extent of
2,56,000 acres with its own system of branch canals, distributaries, minors and water
courses. This ayacut is just adjacent to the old Delta to its south.
1.6.9 Tail End Regulators:
There are 26 tail end regulators, of which 15 are on the rivers of the Cauvery arm
and its distributaries and 11 on the rivers of Vennar arm and its distributaries. Of the 15
regulators in the Cauvery arm, 9 are in Tamil Nadu State and 6 in Karaikal area of the
Union Territory of Puducherry. In Vennar arm, all the tail end regulators are in Tamil
Nadu. These Regulators serve the dual purpose of heading up the irrigation waters for
commanding the ayacut and at the same time holding up the saline back waters of the sea.

49
1.6.10 Rainfall: There are in all 224 existing rain gauge stations (reporting to Indian
Meteorological Department) within the Cauvery basin. These rain gauge stations are more
or less uniformly distributed over the entire basin and their number is fairly adequate. In
view of the reasonably good network of rain gauge stations in this basin, sub-catchment
and sub-basin rainfall averages have been worked out as the arithmetic means of the
normals of the rain gauge stations in the respective sub-catchments and sub-basins.
The rainfall in the basin varies from State to State. In the State of Kerala, normal
annual rainfall in the basin is about 2873 mm. In the high ranges of the Western Ghats, it
is as high as 4435 mm at Vayithri in Kozhikode District but is as low as 1349 mm at
Marayur in Kottayam District. Most of the rainfall occurs in that part of the Cauvery basin
in Kerala and Karnataka during the South West Monsoon which commences from June
and lasts till September end. A notable feature of the south west monsoon is that the
coefficient of variation (%) is as low as 15 and is more dependable in the time of onset and
the amounts of rainfall it gives.
In the Coorg District of Mysore lying in the head reach of the Cauvery basin, the
normal annual rainfall is of the order of 2400 mm and most of the rainfall is received
during the South West Monsoon. The variation of normal annual rainfall in the district is
very much marked, as the normal annual of rainfall at Bhagamandala is 6032.3 mm, while
it decreases to 1120.0 mm at Fraserpet in the north of the district. The other districts of the
Karnataka State constituting the Southern Maidans, through which the river flows after
descending from the western ghat hills and which falls in the rain-shadow zone of the
Western Ghats, receive on an average only about 691 mm (Mandya district) to 761.9 mm.
(Mysore district).
In Tamil Nadu, the average annual rainfall in the Cauvery basin upto the
confluence with Amaravathi, is 1010.4 mm. The average annual rainfall is maximum in
the Nilgiris, wherein the average annual rainfall at Devala is 4045.8 mm. The
contributions of both the South West Monsoon and the North East monsoon towards the
rainfall in the basin upto the confluence with Amaravathi are almost equal and are of the
order of 390.4 mm and 387.9 mm respectively. The (undivided) districts of Thanjavur and
Tiruchirapalli are influenced more by the North East monsoon. The rainfall contribution
by the North East monsoon to this portion of the basin from the confluence with
Amaravathi upto the confluence with the Bay of Bengal is 526.7 mm, while South West
monsoon contributes an average rainfall of 299.1 mm only.

50
Both the monsoons are, of course, of importance to the Basin. While the influence
of the South West monsoon rainfall in the hills in the Coorg district of Karnataka and
Wyanad district of Kerala is of prime importance for the water potential in the basin, these
hilly tracks form only a small proportion of the area of the Cauvery catchment, but it is on
the run-off from this small area that in a normal year a large part of the annual flow of the
river is available during the south west monsoon. During the north east monsoon (October
to December), the maidan area below the hilly tracts, more particularly the southern and
eastern parts of the catchment gets its flow. The North East monsoon is the main source of
water supply for the minor irrigation tanks which are numerous in Tamil Nadu, where the
topography and soil types favoured their formation.
Apart from the two monsoon periods, some rainfall takes place in all the districts
of the basin, during the hot months (March - May). In the Karnataka part the pre-monsoon
rains are usually predominant and start in May itself. In the Nilgiris in Tamil Nadu,
substantial rainfall takes place during the period of summer months. The district has a
much higher rainfall and a much better distribution over the year, the average annual
rainfall being about 1930 mm.
The Cauvery basin upto Mettur Dam is mostly under the influence of the South
West monsoon. Downstream of Mettur Dam, the Cauvery catchment is under the
influence of the North East monsoon and the high floods due to this monsoon usually
occur in November.
On account of high intensive rainfall in the Northeast Monsoon, sometimes
recording even 200 to 250 mm in a day, the utilisable rainfall is comparatively low and
floods and drainage congestion ensue. In the Cauvery Delta, the river channels of the
Cauvery and the Vennar sub-basins serve as irrigation-cum-drainage channels in large
extents particularly below one third of the Delta below Grand Anicut. At the tail ends of
these channels, regulators have been constructed to facilitate heading up of the irrigation
waters to serve the channels taking off above from the rivers. The nonutilisable rainfall
passes on to the sea through these tail end regulators,which are kept open when heavy
rainfall occurs and drainage congestion takes place.
51
1.6.11 Soils:
The principal soil types found in the basin are (a) black soils, (b) red soils, (c)
laterites, (d) alluvial soils, (e) forest soils and (f) mixed soils. These are briefly described
below:
Black soils are found in all the districts of Tamil Nadu except the Nilgiris. These
soils generally occur in semi-arid conditions with an annual precipitation of 500 - 1000
mm and are moisture- retentive and fertile.
Red soils occupy large areas in the basin. In Kerala, they are derived from the
micaceous or granite rocks under the influence of weather and climatic conditions. In the
southern maidan in Mysore, they are predominant. In the Madurai, Coimbatore and Salem
districts of Tamil Nadu the red soils cover more than 60 percent of the cultivated area.
Generally, red soils are less fertile but those of Coimbatore district are clayey in nature
which makes them comparatively more fertile. Unlike the heavy black soils, red soils do
not retain moisture well. The normally loamy structure of the red soils or the intermixture
of fine and thick particles makes them suitable for the cultivation of a larger variety of
crops than the black soils.
Laterite soils are found in the Coorg area in Mysore State. These soils exhibit a
loamy or clayey surface with a lot of pellet concretions of varying thickness followed by
laterite horizons. In the highland areas, the top soils have been eroded leaving behind slag-
like masses of laterite. They occur generally on highland plateaus and are sometimes
devoid of the vegetative cover.
Alluvial soils are found in the Cauvery delta. They are also found in the belt along
the river in Tiruchirapalli district. The deltaic alluvium is the most fertile. The alluvial
soils in the coastal reach are known as coastal alluvium. They are generally less fertile and
on account of inundation by sea water, some of the profiles contain an appreciable amount
of salts.
Forest soils occur in the Nilgiri district and are generally porous in texture. In
addition to the distinct soil types described above, combination of these types such as
mixed red and black soils, etc. also occur. The properties of such soils are those of the
constituent soil types.

52
1.6.12 Development of Irrigation:
Irrigation has been in vogue for centuries in the Cauvery basin through tanks and
diversion from anicuts. Several irrigation systems, all in the nature of run-of-the-river
systems leading to open channels taking off on either side from diversion structures, were
created in the Cauvery basin both in Karnataka and Tamil Nadu over a long period of
time. Such systems had an earlier start in the lower regions of the Cauvery basin especially
the Cauvery Delta at the tail end, because of the natural conditions and topography that
were conducive for such systems being created, with the then knowledge of providing
irrigation structures within the purview of the local rulers.
In the upper regions of the Cauvery basin, particularly in the tributaries Hemavathi,
Kabini, Bhavani and Amaravathi, a number of small diversion structures with canals
taking off from either or both the banks to irrigate long, thin, ribbon-like strips of the
command areas were developed over a period of time. With copious supply of water in the
river system through the south west monsoon, the river carried high run-off and some
times even floods inundating the Cauvery Delta at the end which often submerged and
spoiled the cropped areas. With the cessation of the south west monsoon, the flows in the
river used to come down. With such low flows in the river systems, even the crops in the
large Delta in Tamil Nadu suffered for want of adequate supplies at the right times.
Perhaps because of the uncertainties and the large variation in the flow in the river, no
attempts were made to extend the command areas in the upper regions of the basin. In the
lower regions, where a number of large irrigation systems could be created, in the Cauvery
Delta, the crops suffered for want of adequate supplies at the time they were maturing just
after the south west monsoon. The heavy short spells of the north east monsoon could not
also sustain the crops in the large Delta until they matured and there were frequent failures
of crops. Some times with the monsoon rains becoming intense and cyclonic, floods were
created in the lower part of the Cauvery Delta resulting in the submersion and damage to
crops. Thus the need for storages in the Cauvery basin for holding and using the south
west monsoon yield in the river and regulating the flows to ensure irrigation throughout
the crop period in both the States and also in the Cauvery Delta was keenly felt even by
the end of the nineteenth Century.

53
At the start of the last century, irrigation in Mysore (Karnataka) was mainly from
direct diversion channels from the rivers to the extent of nearly one lakh acres. The system
of tank irrigation was widespread and nearly 2 lakh acres were under irrigation from such
tanks in the basin. With the creation of the Krishnarajasagara, development of irrigation
received a fillip and by 1956, the irrigation from major and medium systems had increased
to 3 lakh acres in Karnataka . The minor irrigation increased by 20000 acres to 2.20 lakh
acres. Subsequently, a few other reservoirs like Nugu, Marconahally etc., were formed and
the extent of irrigation under major, medium and minor irrigation schemes in Karnataka
increased to 4.4 lakh acres by 1971. At the same time, the minor irrigation went upto 2.40
lakh acres. Thus the total extent irrigated was nearly 6.8 lakh acres.
The irrigation development in Tamil Nadu started much earlier and some of the
systems like the Cauvery Delta are centuries old. At the end of the 19th century, nearly 14
lakh acres were under major irrigation systems and 2.2 lakh acres under minor irrigation,
totalling to 16.2 lakh acres. With the construction of Mettur Dam in 1934 and coming into
operation of the Lower Bhavani and Amaravathi projects on the tributaries in 1950s, the
area under irrigation increased to 20.7 lakh acres and under minor irrigation, to 2.40 lakh
acres. By 1971, the total area under major and medium irrigation schemes increased to
25.3 lakh acres and under minor irrigation, to 2.90 lakh acres totalling to 28.2 lakh acres.
The utilisation of the Cauvery waters in Kerala was very little and it was only
through minor irrigation. There was no major and medium irrigation use till 1971 in
Kerala.
Thus the total area irrigated in the Cauvery basin was about 35 lakh acres asin
1971. 1.6.13 Storages in the Cauvery basin:
The development of irrigation in the basin upto the pre-independence stage is
mainly through diversion structures, which existed from time immemorial. There were
only two storages one in Karnataka, the KRS with a capacity of 45 TMC (net) [49 TMC
gross] and one in Tamil Nadu, the Mettur, with a capacity of 93.5 TMC (net) [95.6 TMC
gross]. Since independence, more reservoirs were taken up both by Karnataka and Tamil
Nadu under the Five Year Plans. As per the data collected by the Cauvery Water Disputes
Tribunal, the total storage capacity of the reservoirs in the Cauvery basin has increased
from 145 TMC Gross to 330 TMC Gross (139 TMC net to 310 TMC net) as shown
below:-

54
Summary of Storage Capacities in Cauvery basin
Sl.No. Period Capacity (in TMC)
Gross Live
i) Storages built before 1972 206 197
ii) Storages built after 1972 90 82
iii) Storages proposed in Kerala 21 19
iv) Small storages below 1 TMC Capacity 13 12
Total 330 310
The details of the reservoirs are given in the statement in Table 1.6.3
ANNEXURE I - 1

55
Table 1.6.3 Storages built (1.00 TMC and above) before 1972 in the Cauvery Basin
l. No.
Name of Reservoir and Sub-basin
Year of Storage Capacity
(TMC)
Installed Capacity
MW
Start Completion Gross Live
(Effective)
1 2 3 4 5 6 7
I KERALA NONE
II TAMIL NADU
(A) Irrigation
1 Mettur (Cauvery) 1925 1934 95.660 93.500 240
2 Lower Bhavani (Bhavani) 1948 1953 32.800 32.055 8
3 Amaravathy (Amaravathy) 1953 1952 4.047 3.968
Total of (A) 132.507 129.523 248
(B) Power
1 Mukurthi (Bhavani) 1937 1941 1.800 1.792
2 Pykara (Bhavani) 1946 1956 2.000 1.950 72
3 Upper Bhavani (Bhavani) 1956 1962 3.572 3.012
4 Porthimund (Bhavani) 1960 1967 2.123 1.993
5 Emerald (Bhavani) 1956 1962 3.365 3.300
6 Avalanche (Bhavani 1956 1962 2.171 2.136
Kundah P.H. I to V & Moyar :
7 Pillur (Bhavani) 1960 1967 1.568 1.233 491
Total of (B) 16.599 15.416 563
Total of (A) + (B) 149.106 144.939 811
III KARNATAKA
1 Krishnarajasagar (Upper Cauvery) 1911 1931 49.452 45.051
2 Marconahalli (Shimsha) 1938 1940 2.400 2.260
3 Nugu (Kabini) 1946 1959 5.440 4.893
Sub-Total (Karnataka) 57.292 52.204
Grand Total (I + II + III) 206.398 197.143
FIGURE 1.1

56
TABLE 1.6.3 (contd...)
Storages built (1.00 TMC and above) proposed in the Cauvery Basin as on 1972
Sl. No.
Name of Reservoir and Sub-basin
Storage Capacity (TMC)
Gross Live (Effective)
1 2 3 4
I KERALA
1 Noolpuzha (Kabini) 3.030 2.702
2 Thirunelly (Kabini) 3.602 3.496
3 Thonder (Kabini) 2.895 2.225
4 Peringottupuzha (Kabini) 3.355 3.205
5 Kallampathy (Kabini) 2.702 2.502
6 Kadamanthodu (Kabini) 1.805 1.706
7 Cheghat (Kabini) 1.700 1.501
8 Chandalipuzha (Kabini) 2.101 1.992
Total of ( I ) 21.190 19.329
II TAMIL NADU Nil Nil
III KARNATAKA Nil Nil
Grand Total (I + II + III) 21.190 19.329

57
TABLE 1.6.3 (contd...)
Storages built (1.00 TMC and above) after 1972 in the Cauvery Basin
Sl. No.
Name of Reservoir and Sub-basin Year of Storage Capacity
(TMC)
Start Comple-
tion Gross
Live (Effective)
1 2 3 4 5 6
I KERALA
1 Karapuzha (Kabini) 1974 NA 2.700 2.541
2 Attappady (Bhavani 1975 NA 2.295 2.144
3 Banasurasagar (Kabini) 1980 NA 5.889 5.050
Sub-Total - I 10.884 9.735
II TAMIL NADU
1 Palar - Porandalar (Amaravathy) 1970 1978 1.524 1.404
Sub-Total - II 1.524 1.404
III KARNATAKA
1 Kabini (Kabini) 1959 1974 19.520 16.000
2 Harangi (Harangi Upper Cauvery) 1964 1974 8.500 8.073
3 Suvarnavathy (Suvarnavathy) 1965 1984 1.260 1.259
4 Hemavathy (Hemavathy Upper Cauvery)
1968 1979 37.103 35.760
5 Manchanabele (Arkavathy) 1970 - 1.222 1.061
6 Taraka (Kabini) 1970 - 3.940 3.205
7 Arkavathy (Arkavathy) 1975 - 1.587 1.430
8 Votehole (Hemavathy Upper Cauvery)
1976 - 1.510 1.366
9 Yagachi (Hemavathy Upper Cauvery)
1984 - 3.601 3.269
Sub-Total - III 78.243 71.423
Total (I + II + III) 90.651 82.562

58
1.7 THE CAUVERY BASIN IN TAMIL NADU
1.7.1 Extent:
The Cauvery basin area in Tamil Nadu is 44016 sq.km. including Karaikkal region
in the Delta under the Union Territory of Puducherry and this is more than 50% of the
total Cauvery basin area. This basin area in Tamil Nadu constitutes more than one third of
the geographical area of Tamil Nadu. The Cauvery is the only major river basin in the
State and also the only perennial river in the State.
Of the 16 sub-basins in which the Cauvery basin has been divided for discussion
before the Cauvery Water Disputes Tribunal, 7 sub-basins lie in Tamil Nadu.The 7 sub-
basins are spread over 11 districts (undivided) and the percentage of the area of the district
lying in the basin is as below:
S.No Name of District Basin area in the district in sq. km.
percentage to district
area 1 Dharmapuri 3644 38.03
2 Salem 5768 66.80
3 Coimbatore 3927 52.57
4 Nilgiris 2036 80.03
5 Erode 8233 100.00
6 Tiruchirapalli
8333 74.90 7 Perambalur
8 Ariyalur
9 Thanjavur
6551 79.72 10 Thiruvarur
11 Nagapattinam
12 Pudukottai 404 8.66
13 Cuddalore 932 8.55
14 Dindugal 4011 64.00
15 Madurai 29 0.43
Total 43868

59
1.7.2 Irrigation Development:
The Development of irrigation in Tamil Nadu dates back to centuries. It is said that
irrigation in the Cauvery Delta was in practice even when irrigation was in vogue in the
Indus valley in India and the Mesopotamian valley in Persia. The Cauvery being a
perennial river flowing into Tamil Nadu with its vast Delta at its tail end is the main
source of irrigation water in the State.
The Grand Anicut across the Cauvery, deriving the name because it is a Grand old
structure, built by Raja Karikala Chola around 200 AD can be said to be the oldest
structure in the World, built across a flowing river on a sandy river bed, still functioning as
the main regulating structure for the Cauvery facilitating irrigation in about 12 lakh acres.
The Cauvery Delta is served by this Anicut and the rivers Cauvery and Vennar and their
36 branches and 29881 distribution network of main channels and minors running to more
than 14000 miles or 22400 km. The details are given in Table 1.7.1.
In 1863, a private company called the "Madras Irrigation Company" was floated to
develop irrigation in the Cauvery Delta but later on, this was acquired by the British
Government. In the Madras Presidency, about 4.2 M.ha.(10.532 M.acres) was irrigated in
the beginning of the 19th century, out of which 0.54 M.ha. (1.33 M. acres) was in the
Cauvery basin. Apart from the Cauvery Delta, in the upper region of the Cauvery basin in
Tamil Nadu in the tributaries like Bhavani, Amaravathi and Noyyil, a number of small
diversion structures with canals taking off on one or both banks to irrigation long, narrow,
strips of the command areas were developed over a period of time.

60
STATEMENT SHOWING THE NUMBER OF A, B, C, D, ETC., CHANNELS WITH THEIR TOTAL LENGTH IN CAUVERY DELTA.
Cauvery Sub-Basin Vennar Sub-basin Total
No M. F. Ft. No. M. F. Ft. No. M. F. Ft.
A. Class Channel 9 2 2 2 01 1 7 2 74 58 3 14 3 9 1 54 7 1 5 05 3 4 5 1 1 16 1
B. Class Channel 5 8 12 2 93 3 7 23 6 3 9 3 2 24 8 0 4 43 7 9 7 44 5 4 2 3 4 91 3
C. Class Channel 5 8 91 1 95 6 5 61 0 5 1 9 1 19 0 1 7 38 4 1 1 08 2 3 8 5 8 5 33 4
D. Class Channel 2 7 52 7 9 1 4 2 32 2 5 6 6 8 3 8 3 65 4 5 3 18 1 6 3 0 0 22 6
E. Class Channel 9 1 4 2 2 3 7 17 7 83 7 1 9 4 0 29 6 1 7 51 4 1 7 7 47 3
F. Class Channel 2 7 9 7 1 4 1 81 17 8 2 9 7 10 6 4 57 1 0 1 3 28 7
G. Class Channel 2 4 7 2 33 - - - - 24 7 2 3 3
Total 2 98 8 1 1 4 89 0 1 4 4 7
Table 1.7.1

61
Table 1.7.1 (contd...)
LIST OF MAIN RIVERS IN THE CAUVERY DELTA WITH EXTENT OF AYACUT UNDER THEM
Serial number and name of Whether solely irrigation or irrigation - cum - drainage or purely drainage
Length in Miles
Ayacut in acres
I. Cauvery and its branches -
1 . Cauvery river Main River Irrigation. 7 5 - 3- 0 1 ,27,528
2 . Arasalar " Do Irrigation-cum-Drainage 4 4 - 0 - 0 19 ,387
3 . Kudamurutty Do Irrigation. 3 7 - 0 - 0 2 7 ,244
4 . Nattar Branch River do 2 7 - 0 - 0 2 1 ,660
5 . Keerthimanniar Do do 8 - 0 - 0 1 1 ,630
6 . Noolar " Do Irrigation-cum-Drainage 9 - 4 - 0 19 ,985
7 . Vanjiar " Do do 12 - 0 - 0 6 ,227
8 . Nandalar " Do do 33 - 3 - 0 5 ,157
9 . Veerasholan" Do Irrigation 3 2 - 0 - 0 4 2 ,927
1 0 .M anjalar " Do Irrigation-cum-Drainage 2 2 - 0- 0 16 ,453
1 1 .M ahimalayar Do Do 2 5 - 0 - 0 1 1 ,927
1 2 . M anniar " Do Do 36 - 0 - 0 38 ,022
1 3 . Pudumanniar or Palavar III Reach
Do Do 25 - 6 - 0 33 ,355
1 4 . Palavar II Reach Do Drainage 1 2 - 4 - 0 0
1 5 . Palavar I Reach Do Irrigation-cum-Drainage. 1 6 - 6 - 0 4 ,023
1 6 . Vikramanar Do Irrigation. 9 - 4 - 0 2 2 ,952
1 6 (a) Solasundamaniar Do Do 9 - 0 - 0 8 ,686
1 7 . Petharasanar Do Do 3 - 0- 0 2 ,427
1 8 . M udikondan River Do Do 39 - 0 - 0 1 ,488
1 9 . Puthar " Do Do 31 - 0 - 0 15 ,101
2 0 . Velappar " Do Irrigation-cum-Drainage. 21 - 5 - 0 19 ,074
2 1 . Thirumalarajan " Do Do 4 2 - 0 - 0 1 3 ,584
2 2 . South Rajan Channal and Kumukkimaniar
Do 25 ,000
Total 5 7 1- 3 - 0 4 ,93,887

62
II. Vennar and its branches- 23 Vennar River Main River Irrigation-cum-Drainage
2 3 . Vennar Do Do 70 - 0 - 0 1 ,20,042
2 4 . Vettar Do Do 63 - 0 - 0 54 ,361
2 5 . Koraiyar Branch River Do 4 1 - 4 - 0 5 7 ,193
2 6 . Vadavar Do Do 18 - 0 - 0 14 ,859
2 7 . Pamaniar Do Irrigation 3 3 - 0 - 0 3 7 ,344
2 8 . M ulliar Do Irrigation-cum-Drainage 2 5 - 0- 0 2 2 ,034
2 9 . A dappar Do Irrigation 2 5 - 0 - 0 1 3 ,448
3 0 . Ayyanar Do Irrigation-cum-Drainage 2 5 - 0 - 0 3 ,361
3 1 . Harichandranadhi Branch River Irrigation-cum-Drainage 2 3 - 0 - 0 3 1 ,866
3 2 . Vellayar Do Irrigation 2 4 - 3 - 0 2 9 ,438
3 3 . Pandavayar Do Irrigation-cum-Drainage 1 8 - 0- 0 2 3 ,471
3 4 . Shullanar Do Do 24 - 1 - 0 4 ,767
3 5 . Odambogiar Do Do 10 - 0 - 0 32 ,020
3 6 .Ka ttar Do Do 26 - 0 - 0 1 ,666
3 7 . Kaduvayar 19 ,427
Total 4 2 7- 4 - 0 4 ,65,307
Grand Total 9 9 8- 7 - 0 95 9 ,144
(or ) 959,150 acres
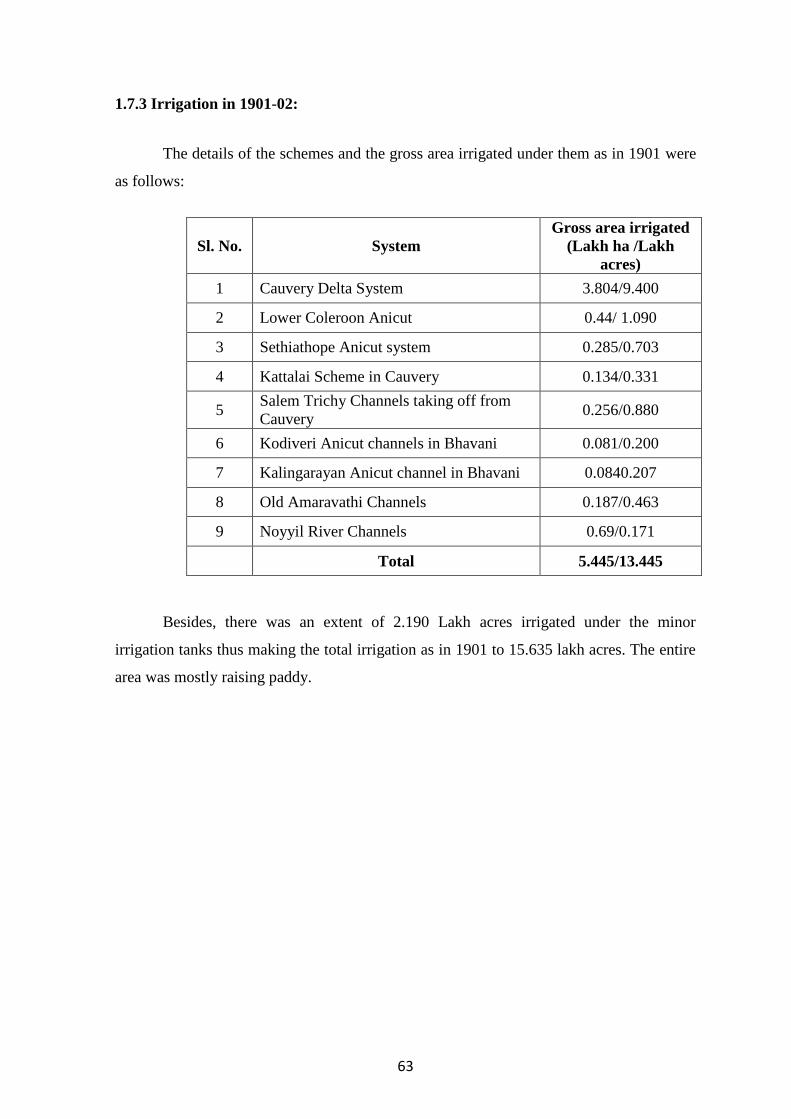
63
1.7.3 Irrigation in 1901-02:
The details of the schemes and the gross area irrigated under them as in 1901 were
as follows:
Sl. No. System Gross area irrigated
(Lakh ha /Lakh acres)
1 Cauvery Delta System 3.804/9.400
2 Lower Coleroon Anicut 0.44/ 1.090
3 Sethiathope Anicut system 0.285/0.703
4 Kattalai Scheme in Cauvery 0.134/0.331
5 Salem Trichy Channels taking off from Cauvery 0.256/0.880
6 Kodiveri Anicut channels in Bhavani 0.081/0.200
7 Kalingarayan Anicut channel in Bhavani 0.0840.207
8 Old Amaravathi Channels 0.187/0.463
9 Noyyil River Channels 0.69/0.171
Total 5.445/13.445
Besides, there was an extent of 2.190 Lakh acres irrigated under the minor
irrigation tanks thus making the total irrigation as in 1901 to 15.635 lakh acres. The entire
area was mostly raising paddy.

64
1.7.4 Irrigation in 1928-29
Since 1901, the anicut and diversion schemes already in operation, were continuing
in 1928-29 with necessary improvements then and there and the area irrigated under them
as in 1928-29 was as follows:
Sl. No. System Gross area irrigated
(Lakh ha/ Lakh acres)
1 Cauvery Delta System 4.13/010.205
2 Lower Coleroon Anicut 0.484/1.196
3 Sethiathope Anicut system 0.285/0.703
4 Kattalai Scheme in Cauvery 0.153/0.379
5 Salem Trichy Channels taking off from Cauvery
0.356/ 0.880
6 Kodiveri Anicut channels in Bhavani 0.088/ 0.217
7 Kalingarayan Anicut channel in Bhavani 0.092/0.226
8 Old Amaravathi Channels 0.187/ 0.463
9 Noyyil River Channels 0.069/0.171
Total 5.844/ 14.440
The area under minor irrigation tanks as in 1928-29 was 2.21 Lakh acres. Thus the
total irrigation as in 1928-29 was 14.440 + 2.210 = 16.65 lakh acres and almost the entire
area was raising paddy.
1.7.5 Development Between 1928 and 1956 1.7.5.1 Kattalai Bed Regulator
The construction of Kattalai Bed Regulator across Cauvery near Mayanur in Karur
district was taken up during 1931 and completed by 1933. This work consists of a bed
regulator across Cauvery at Kattalai and excavation of the South Bank Canal connecting
the river channels existing in the vicinity on the right bank of Cauvery, the North bank
Canal connecting the river channels existing in the vicinity on the left bank of Cauvery
and the Kattalai High Level Canal taking off at Mile 0 / 5 of the South Bank Canal to
irrigate a new extent of 19000 acres lying to the right of South Bank Canal. This Bed
Regulator in the shape of a low weir (anicut) facilitated better drawal through these
channels.

65
1.7.5.2 Mettur Reservoir
Mettur Reservoir was taken up after the conclusion of the 1924 Agreement, in
1925 and the dam was completed in 1934. The reservoir has a capacity of 93.5 TMC and
will remain as the largest reservoir in Tamil Nadu. The waters stored in the reservoir were
intended to stabilise the Delta irrigation. Also, it was envisaged that with the coming up of
a storage reservoir at Mettur it will be possible to hold the river freshes and floods, which
will not only help to regulate the supplies to the Delta irrigation (which was hitherto on the
run-of-the-river basis in an inundation irrigation mode), but also to extend irrigation to a
new area of about 3.01 lakh acres allowed in the 1924 Agreement, possible as a result of
such regulation. The new command was localized adjacent to the Cauvery Delta to the
south, fed by the Canal taking off from the Grand Anicut Complex itself and called the
Grand Anicut Canal.
1.7.5.3 Mettur Canals Scheme
The anticipated development of ayacut under the Grand Anicut Canal of the
Cauvery Mettur Project did not take place even after a period of 10 to 15 years after the
construction of Mettur Project and the actual area developed came to only 2.56 lakh acres
as against 3.01 lakh acres permitted under the 1924 Agreement. To make good the
shortfall of 45,000 acres, the Mettur Canal scheme which was contemplated by Mr. Moses
even in 1904 was taken up for investigation. This scheme was sanctioned and taken up in
1949 with the approval and sanction of the Government of India and completed in 1957 to
extend irrigation to a new extent of 45000 acres in Salem and Periyar Districts. The Canal
system takes off directly from the Mettur reservoir on its right side and has two branches
viz. the East Bank Canal feeding 27000 acres in the Salem District and the West Bank
canal feeding 18000 acres in Periyar District (earlier Coimbatore District).
1.7.5.4 Jedarpalayam Regulator
The Raja Channel, which is one of the several old Cauvery channels forming part
of the “Salem Trichy Channels” was taking off through a leading channel from the left
bank of the river Cauvery, 18 miles below Erode bridge. This channel together with its
branch Kumarapalayam channel irrigates a total extent of about 10000 acres in the Salem
District. As there were no diversion works at the head of the channel, a Korambu, a
temporary nanal grass obstruction was being put up across the river every year to divert
the requisite discharge into the channel.

66
After the construction of Mettur reservoir, the flow in the Cauvery is being
regulated with reference to the demand in the Delta with consequential variations in the
river rendering the maintenance of the Korambu at the head of Raja channel difficult.
Further to ensure full supply to the channel, special issues had to be let down from the
Mettur reservoir even when on account of rains the Delta did not need any supply. To
avoid such situations and also the difficulty in forming and reforming the Korambu year
after year depending on the variations of flow in the river, a bed regulator was constructed
across the river at the head of the leading channel which is known as the Jedarpalayam
Bed Regulator. This work was taken up in 1949 and completed in 1950.

67
1.8 CAUVERY DELTA SYSTEM
1.8.1 A Brief Narration Cauvery Delta lies between upper anicut and Bay of Bengal and it irrigates Trichy,
Thanjavur, Thiruvarur, Nagapattinam and part of Pudukkottai Districts. This Delta consist
of 3 Sub Basins such as Cauvery Sub Basin, Vennar Sub Basin and G.A.Canal system
Basin.
The Cauvery Delta, spread over the physical, geographical area of 6.9 lakh ha.
(17.06 lakh acres) has an irrigation extent of 3.79 lakh ha. (9.34 lakh acres.) net and 5.22
lakh ha (12.90 lakh acres) gross (including Karaikal Region) and holds the most extensive
irrigation system in Tamil Nadu State. This has been known at one time as the "granary of
the Peninsular India". The total net area irrigated in the State as in 2006-07 under various
sources is about 28.9 lakh ha, of which the area under Government canals is about 7.8 lakh
ha. The extent in the Cauvery Delta System alone forms about 48% of the area irrigated
under canals in the State.
The Grand Anicut or 'Kallanai' as locally called in Tamil, constructed by King
Karikala Chola in the Second Century AD, marks the first step in taming the river
Cauvery and bringing irrigation facilities to this large extent in the Delta. The construction
of this anicut more as a breach closing exercise also provided necessary head to draw the
irrigation supply required for the Delta and pass on the flood surplus into the Coleroon
through the Ullar below the Grand Anicut.
The water of Cauvery, Vennar and G.A Canal in Cauvery Delta is regulated for
irrigation. After irrigation, the excess of water drains in to the large drain and finally
confluences in to the sea.
The nearly flat, fan-shaped Delta of the Cauvery river slopes gently towards the
sea over a distance of 160 km (100 miles). The sunlight and temperature are good year-
round for tropical growth. Rice has been raised in the Delta for centuries. The Cauvery
alluvium in the Delta presents minimum of production or utilization problems. Moving
downstream, the low lying soils near the coast pose problem of salinity. In the Cauvery
and Vennar subbasins in the Delta, an extent of 1.90 lakh ha. (4.69 lakh acres) and 1.88
lakh ha. (4.65 lakh acres) respectively are irrigated. The Delta which was wholly located
in the Thanjavur district previously, is now spread over three districts after trifurcation of
Thanjavur district, lying 61% in Thanjavur district and fully covering Tiruvarur and
Nagapattinam districts.

68
As seen above, out of the total workers (workers and marginal workers) in the rural
area, the cultivators and agricultural labour form about 65.6% in Thanjavur and Tiruvarur
districts and 61.3% in Nagapattinam district.
1.8.2 Land Holdings
The operational land holding and sizes in the Delta districts with the percentage to
the total holdings is as below:
Status No. of Holdings
% to the Total Holdings
Total area (ha.)
% to the total Area
Marginal (less than 1 ha) 476729 75.8 182598
34.0
Small (1 to 2 ha) 93451 14.9 131735
24.6
Semi-Medium (2 to 4 ha) 43023 6.8 117000
21.8
Medium ( 4 to 10 ha)
13812 2.2 78102 14.6
Large (10 ha & above)
1565 0.2 27141 5.1
Total 628580 100.0 536576 100.0
Source: Agro Stat - 2006 Published by Commissioner of Agriculture, Department
of Agriculture, Chepauk, Chennai - 5, Page 312
Thus 91% of the holdings, comprising about 58.6% of the area are covered under
marginal and small holdings.

69
1.8.3 Rainfall
The normal rainfall in the Cauvery Delta districts is as follows:
District South west monsoon
North east
monsoon
Other periods Annual
(mm) (mm) (mm) (mm)
Thanjavur 342.0 545.7 165.3 1053.0
Tiruvarur 301.8 665.4 162.7 1129.9
Nagapattinam 274.1 886.4 181.2 1341.7
Source: Season and Crop Report, Tamil Nadu, 2006-07, Department of Economics
& Statistics, Chennai 600 006, Pages 51 - 56.
This shows that as is natural, rainfall decreases from the coast as one travels towards land.
1.8.4 Barrage on the Cauvery Arm
After the construction of KRS and Mettur Reservoir, the floods in the river got
reduced. Since releases in the river for irrigation are controlled at Mettur, diversions
through the Coleroon arm at Upper Anicut considerably reduced and this caused increased
silting on the Coleroon bed. The Cauvery arm which was provided with only a grade wall
at its head began drawing flows beyond its capacity during floods. This necessitated the
construction of a barrage at the head of the Cauvery arm too. This structure is known as
Cauvery Barrage. Thus as at present, at the head of the Delta viz. Upper Anicut, we have
barrage structures both on Cauvery and Coleroon arms giving adequate facilities to
regulate the flows in Aganda Cauvery both in normal times and also during heavy floods.

70
Salient features of the Upper Anicut are: Cauvery Barrage:
Design flood discharge 5100 m3/s (180000 ft3/s)
MFL in front 76.55 m
Sill level of the Barrage 72.00 m (236.22 ft) (same as the crest of the Cauvery Dam)
Pond level 74.45 m (244.24 ft)
Pond storage 2.6 M.cum (91 M.cft)
No. and size of vents 41 Nos. 12.00 m x 2.45 m
Coleroon Regulator:
Maximum flood discharge 7643 m3/s (270000 ft3/s)
MFL front 76.55 m (251.14 ft)
North Branch
Sill level 72.63 m (238.29 ft)
No.& size of vents 10 Nos. 12.19 m x 1.82 m
South Branch
Sill level 72.63 m (235.29 ft)
No.& size of vents 45 Nos. 12.19 m x 1.82 m
1.8.5 Grand Anicut
The two arms of the river Cauvery viz., the Cauvery and the Coleroon, after the
bifurcation at Upper Anicut, flow close to each other for about 32 km below the Upper
Anicut. At this location they are linked by Ullar, which drains the floods of Cauvery into
Coleroon through the Grand Anicut. The landmass in between Coleroon and Cauvery from
Upper Anicut to this Ullar is the famous holy Srirangam island. The Cauvery at this
location branches into two irrigation rivers viz., Cauvery and Vennar. They were earlier
drawing their supplies through open heads. Difficulties caused by the presence of the
interlinking course, Ullar in maintaining the required supplies in Cauvery for irrigation
was overcome by the construction of an Anicut on the left bank of Cauvery. This Anicut
built by Raja Karikala Chola in about the second Century A.D. is known as the "Grand
Anicut". This is located at a distance of about 16 km from Tiruchirapalli town.

71
This structure which is a grand old one as its name itself implies, is a marvellous
piece of hydraulic structure built across a mighty river on its sandy bed at a time when
building science had not developed enough to build safe structures on permeable
foundations. Perhaps this is the oldest such structure of this magnitude still serving the
purpose for which it was made. The credit should go to those builders in that, this structure
is serving to this date excellently well with a few modifications by nature of improvements
to the structure.
No recorded information is available as to how they founded this structure nor the
manner of its construction. It is believed that large cyclopean stones from long distances
would have been brought and dumped across the course and continuously replenished as
these boulders sank into the sandy bed to get lodged well in the clay layer below until the
structure rose above the water level. It has not been possible to explore and detail the
foundation actually. Such a course has not been advised either, considering the importance
of this structure to the Delta irrigation. The foundation base even on date is so stable and
massive that successive generations have thought of only improvements and modifications
to the structure without meddling with the foundation base lest they may disturb the
already settled mass.
The Anicut as seen consists of a core of rough stones buried in the clay bed below
and covered with a facing of rough stone in mortar. A portion of the crest is built with a
curved top and the rest with a series of steps, the foot of the solid dam being protected by a
rough stone apron. The Anicut is 329 m (1080 ft) long, 12.2 to 18.3 m (40 to 60 ft) in
width and 4.75 to 5.49 m (15 to 18 ft) in height.
The construction of the Grand Anicut marks the first step in the taming of the river
Cauvery and ensuring irrigation facilities to the large extent in the Delta. The main
function of the anicut is to provide the necessary head to draw the supply required for the
Delta and pass down the surplus into Coleroon.
1.8.6 Improvements to the Original Structure (G.A.)
In 1804, Captain Coldwell repaired the Anicut and provided dam stones (2'- 3"
high) on the crest and raised the river embankments thus forcing more water into Cauvery
and Vennar.

72
In 1830, ten scouring sluices of size 3' x 4' were built by Sir Arthur Cotton with sill
at 179.60' to scour the silt deposit in front of the Anicut and the canal head.
In 1840, a bridge was built over the Anicut using the existing work as foundations.
In 1886, the dam stones were removed and automatic falling shutters 2' - 10" high
were fitted on the crest of the Anicut.
In the same year Head Regulators were constructed across the Cauvery and Vennar
immediately downstream and at right angles to the Grand Anicut, for distributing the
available flow between these two rivers and also for excluding the flood from these rivers.
In 1889, the falling shutters over the crest of the Anicut were removed and 5 ft.
high lift shutters of 32 ft. span were provided in all the 30 arches of the bridge.
In 1909, three of the Arches in the scouring sluices portion were washed away and
this portion was subsequently restored. Five vents of 20' x 10' provided with radial shutters
were built at the right end of the Grand Anicut to serve as new scouring sluices. To deflect
the low water course away and protect the foundations of the Grand Anicut from scour, a
1100 ft. long grade wall was constructed in the bed, upstream of the Grand Anicut.
In 1924, a record flood of 4.75 lakh c/s passed over the Mettur dam site. A bye-
wash capable of discharging 98600 c/s into Coleroon in the event of extraordinary flood,
was constructed about a mile upstream of the Grand Anicut.
During 1925-34, simultaneously with the construction of the Mettur Dam and the
excavation of the Grand Anicut canal, a new Head Sluice with six vents of 30' x 5 ½' each
was constructed on the right bank of Cauvery to serve as the Head Regulator of the Grand
Anicut Canal.
The Grand Anicut or "Kallanai" as locally called in Tamil is a name loosely applied to
the group of structures in the complex comprising of:
i. The Grand Anicut proper i.e., the dam with the lift gates constructed across Ullar.
ii. A Block of 5 scouring sluices on the right end of the Grand Anicut.
iii. Regulators at the heads of Cauvery and Vennar.
iv. The Regulator at the head of the Grand Anicut Canal.

73
Salient features of the Grand Anicut are: Grand Anicut
Total length 329.2 m (1080 ft).
Surplus vents- No, size & sill 30 Nos. 9.8 x 1.5 m (32' x 5';) +57.7 m(189.30 ft)
Scour vents - No, size & sill 5 Nos. 6.1 x 3.1 m (20' x 10' )+54.6 m(179.25 ft.)
Flood discharging capacity 3327 m3/ s (117500 cusecs)
MFL front and rear 60.8 m (199.60 ft) / 48.6 m(192.25 ft)
Cauvery Head Regulator
Total length 179.5 m (589 ft).
No. & size of vents and sill 42 No 3.1 x 2.7 m (10' x 9'); +56.2 m (184.25 ft)
MFL front and rear 60.8 m (199.60 ft) / 57.7 m (189.15 ft.)
Maximum supply 441 m3/ s (15587 cusecs)
Normal supply 371 m3/ s (10391 cusecs)
Vennar Head Regulator
Total length 141.1 m (463 ft).
No. & size of vents and sill 33 Nos. 3.1 x 3.4 m (10' x 11' 4"); +56.2 m (184.25 ft.)
MFL front and rear 60.8 m (199.60 ft.) / 59.2 m (194.25 ft).
Maximum supply 377 m3/ s (13295 cusecs)
Normal supply 251 m3/ s (8863 cusecs)
G.A.Canal Head Regulator
Total length 66.5 m (218 ft)
No. & size of vents and sill 6 Nos. 9.1 x 1.6 m (30' x 5' 3"); +56.2 m(184.25 ft).
MFL front and rear 60.8 m(199.60 ft). /58.8 m( 192.92 ft).
Maximum supply 116 m3/ s (4100 cusecs)
Normal supply 99.1 m3/ s (3500 cusecs)
The maximum and normal supply to be maintained is worked out adopting a duty
of 30 ac./cusec and 45 ac/cusec respectively for the Cauvery, and 35 ac/cusec and 52½
ac./cusec respectively for the Vennar.

74
It is inevitable that the Cauvery arm below Upper Anicut is also to serve as a flood
carrier for the drainage that flows in between the Upper anicut and the Grand anicut and
dispose of the floods through the Grand Anicut. It is not advisable to send down any flood
flows below Grand Anicut into the Delta which should be disposed of through the Grand
Anicut. All the components of the structure were therefore checked up and strengthened
with this view in 1977.
During the operation of the gates, situations arose when the head discharge had to
be throttled quite frequently. With the head operated through screw gear shutters, the
operation took time and insistence on accuracy of discharges and uniform height of shutter
opening became difficult. Electrification of the hoisting machinery of these regulators
have now been done to overcome these bottlenecks and to improve the operational
efficiency.
The Cauvery at Grand Anicut sub divides into two main irrigation rivers viz.,
Cauvery and Vennar which sub divide further into 21 and 15 rivers respectively to feed the
Delta through a network of main channels and numerous branches distributaries and sub
distributaries. The details of the branch rivers and the canal network of the Cauvery Delta
system have been furnished in figure 1.4. The details of the Tailend Regulators of Various
Rivers of the Cauvery Delta System have been furnished in Table 1.8.1

75
Figure 1.4

76
Table 1.8.1
List of Tail End regulators in the Cauvery sub basin
Sl. No
Name of the river Name of the regulator
1 Mahimalayar Kannappan Moolai
2 Mahimalayar Arabi
3 Cauvery Melayur
4 Pudumanniar Pudumanniar surplus
5 Kittiyanai Uppanar Kittiyani surplus
6 Manjalar Annappanpettai
7 Southrajan Pillpadugal
List of Tail End regulators in the Vennar sub basin
Sl. No
Name of the river Name of the regulator
1 Vettar Odacherry
2 Kaduvaiyar Vadugacherry
3 Vellaiyar Eravaikadu
4 Harichandra river
Brinjimoolai
5 Adappar Umbalacherry
6 Mulliyar Thanikottagam
7 Manankondaner Adahanur
8 Marakkakoriyar Idumbavam
9 Valavanar Thondiyakadu
1 0 Koriyar Jambuvanodai
1 1 Paminiyar Thoppathana-veli
77
1.8.7 Monsoons and their influence : The south west monsoon occurring in June to September does not cause either
drainage or flood problems, as the impact of the monsoon is in the Western Ghats in the
upper reaches of the Cauvery basin. The heavy flows occurring in the river during the
south west monsoon are easily absorbed in the numerous reservoirs that have come up in
the upper reaches of the Cauvery basin in Karnataka and Kerala. The over flows from
these reservoirs are impounded in the Mettur reservoir and even if it surpluses, the flows
are diverted into the Coleroon and partly in Cauvery at the Upper anicut since barrages are
now available both on Cauvery and Coleroon and flood regulation through both Cauvery
and Coleroon is now possible. The flood diverted through Cauvery arm is discharged
through the Grand Anicut to flow back to Coleroon keeping the Cauvery Delta safe except
to drain the rainfall - runoff from the Delta itself.
The Cauvery Delta receives normally about 300 mm of rainfall during the south
west monsoon period. These rains are fully utilized by the crops and there is no problem of
drainage or submersion during this period. Irrigation deliveries are regulated taking into
account the effective rainfall.
The north east monsoon which generally starts in the third week of October gives
normal rainfall of about 700 mm, the highest being in November.
Unlike the south west monsoon which starts from the west and slowly travels
towards the east, gradually dissipating itself into a few haphazard showers by the time it
reaches the East Coast, the storm direction of the north east monsoon is from the Coast
and towards inland gradually weakening as it travels inland. This monsoon is generally
accompanied by depressions which sometime intensify as cyclones. This factor
complicates the drainage problem in the Delta, because by the time the upland catchment
forces the flood waters down the Vennar, the lower reaches of the Delta are already fully
congested with the flood generated in the Delta itself. Far from being able to receive any
part of the vast quantities of waters that the rivers bring down, the fields that drain into
these rivers are themselves in need of adequate drainage during this period of intense north
east monsoon, more because of the vast extent. At this point of time the entire Delta is
covered with standing crops at various stages of growth and harvest.

78
As already detailed earlier, it is the north east monsoon that causes more harm and
damages to crops and property in terms of heavy inundation of the cropped lands towards
the coast. Paddy crop cannot survive submersion for more than 5 to 7 days and there have
been times when large extents of crops have been lost with the flood waters unable to get
drained to the sea, for at that time the sea also will be rough refusing to take in flood
flows.
Historical records of Severe Cyclones which crossed Tamil Nadu during the period
from 1970-1999 are enclosed in Table 1.8.2
1.8.8 Floods and Drainage in the Delta The flood problems in the Delta may be classified under two distinct categories,
the first being that caused by extraneous floods entering the Delta from upland catchments
viz., catchment lying between Upper Anicut and Grand Anicut and the dry upland tracts
lying South West of the Delta and draining directly into the Delta below Grand Anicut,
and the second, caused from the rainfall within the Delta itself.
1.8.9 Floods from the catchment lying between Upper Anicut and Grand Anicut The Cauvery arm below Upper Anicut has to serve as a flood carrier also for the
drainages that flow between the Upper Anicut and Grand Anicut and dispose off the
floods. The upland drainages like Pungal river, Kulithalai Kattuvari, Kodamurutty,
Koraiyar, etc., joining the Cauvery above Grand Anicut swell the river flows. This
generally occurs during the north east monsoon period and is flashy in nature. The
catchment between Mettur Dam and Upper Anicut is also likely to generate some flows
during the north east monsoon but the magnitude is small due to the low intensity of
rainfall in this area. However, these flows combined with the freshes collected from the
catchment between Upper Anicut and Grand Anicut cause a greater impact at the Grand
Anicut Head and in such circumstances the Cauvery and Vennar were heavily charged in
the past. The head regulators of Cauvery and Vennar at Grand Anicut have been vastly
improved during recent years (1972-74), to facilitate diversion of these floods also through
the surplus vents and the Grand Anicut itself into Coleroon, avoiding their impact on the
Delta. It may, therefore, be assumed safely that there is no flood threat to the Cauvery
Delta due to flood flows generated from the catchment areas lying between Upper Anicut
and Grand Anicut.

79
Table 1.8.2
Historical records of Severe Cyclones which crossed Tamil Nadu during the period
from 1970-1999
Sl. No.
Date Landfall/Devastation
1 December 1-8,1972
Crossed Tamilnadu coast close to and north of Cuddalore at 2330 UTC on 5th December and was within 50 km WNW of Cuddalore at 0300 UTC on December 6. Maximum wind speed recorded at Cuddalore was 111 KMPH to 148 KMPH (60-80) between 2230 UTC of 5th & 0230 UTC of 6th.80 People killed and 30,000 people rendered homeless in Madras due to flood.Total loss Rs. 40 crores.
2 November 8-12, 1977
Crossed Tamilnadu coast within 10 km to south of Nagapattinam early in the morning of 12th around 2230 UTC of 11th. Weakened into a cyclonic storm by that evening over interior parts of Tamilnadu and emerged into Laccadives off North Kerala coast on the morning of 13th as a deep depression .Maximum wind recorded about 120 KMPH ( 65 kt) on 12th morning at Thanjavur, Tiruchirapalli and Pudukottai.560 people died and 10 lakh people rendered homeless. 23,000 Cattle heads perished. Total damage to private and public property estimated to be Rs. 155 crores.
3. November 19-24, 1978
Crossed between Kilakkarai and Rochemary and Ramanathapuram District of Tamil Nadu. On 24th.evening as a severe storm and emerged into the Arabian Sea off Kerala coast as a deep depression on 25th morning. Batticola of Sri Lanka reported maximum wind speed northerly 145 KMPH (78 kt).In India 5,000 huts damaged and total damage estimated to be around Rs. 5 crores. In Sri Lanka, 915 people died and one million people affected One lakh Houses were damaged in Sri Lanka.
4. November 9-14, 1984
Crossed between Sriharikota and Durgarajupatnam between 0800 and 0900 IST. Sea water of 2 feet height entered the village Durgarajupatnam on14th and reached 3 km inland from the coast. 54 lives in Tamil Nadu were lost. Live stocks perished were 90650. Number of buildings destroyed completely were 3,20,000 in A.P

80
5. November 27-30, 1984
Crossed south Tamil Nadu coast near Nagapattinam in the afternoon of December 1 near Karaikal. About 35,000 people were affected in East Thanjavur and South Arcot districts of Tamilnadu.50,000 acres of land was submerged in Thanjavur districts.
6. 11-15 Nov. 1991 Crossed Tamil Nadu Coast north of Karaikal 185 people died and 540 cattle perished 16 people died in A. P.
7. 11-17 Nov. 1992 Crossed near Tuticorin ( Tamil Nadu).175 people died and 160 reported missing. Damage to standing crops due to flood was reported
8. 01- 04 Dec. 1993 Crossed on 4th Nov. 30 Km North of Karaikal.100 People died in Tamil Nadu.
9. 28 Nov.-06 Dec1996
Crossed near Chennai around 2100 on 6th Dec.1996.The cyclone persisted for 9 days which is reported to be very long life compared to any cyclone in the Indian Ocean. It caused severe damage to life and property.
Source : http://www.imd.gov.in/section/nhac/static/cyclone-history-bb.htm

81
1.9 VENNAR BASIN
1.9.1 A Brief Narration
The River Vennar originates from Grand Anicut across Cauvery River at
Km 27.26 below upper Barrage. It traverses through Thanjavur, Thiruvarur and
Nagapattinam District and empties in to Bay of Bengal by branching off into number of
rivers. It irrigates an extent of 4.96 Lakhs acres in the above three districts besides serving
as drainage carrier.
The Vennar at LS 55.270 Km at Thenperambur Village (V.V.R. Head)
trifurcates as Vennar, Vettar and Vadavar and again the Vennar at LS 96.120 Km at
Needamangalam Village trifurcates as Vennar, Koraiyar and Pamaniar (Koraiyar Head)
The main Vennar river again bifurcates as Vennar and Pandavayar at LS
108.730 Km. At LS 110.54Km Vennar again bifurcates into Vellaiyar and Vennar. The
Pandavayar river finally infalls into Vellaiyar river. The Koraiyar river at LS 122.150 Km
branches as four river cum drainages namely Koraiyar, Ayyanar, Mulliyar and
Harichandranathi. Mulliyar again bifurcates as Mulliyar and Adappar at LS 130.236 Km
in Kottur Village. All these branch rivers namely Vellaiyar, Harichandranathi, Mulliyar,
Adappar and Koraiyar infalls into Bay of Bengal.
The river network of Vennar Sub-Basin is shown in Figure 1.5. The
Hydraulic Particulars and the details of various regulators in Vennar Sub-Basin is shown
in Table 1.9.1 .
Normally the floods generated from the catchment below Grand Anicut and
a vast area lying south of Grand Anicut Canal surrounded by Kulathur, Gandarvakkottai,
Vallam, Sengipatti and Thiruverumbur spreading over four Taluks in two District, directly
enter river Vennar after crossing Grand Anicut Canal. Whenever heavy downpour occurs
in the above area there will be flash and heavy flood entering Vennar River and spiting it
regularly.
The floods generated in this section through the drainage "varis" crossing
the Delta are the notorious ones as they are carried directly into the Vennar Sub Basin
through the cross masonry structures on the Grand Anicut Canal and cause several
breaches lower down and submerge large extents of irrigated lands. The major drains in
this region and their discharge capacities are as follows:-

82
Adappanpallam vari 254 m3/s/8935 ft3/s
Veliampatti vari 385 m3/s /13596 ft3/s
Sholagampatti vari 844 m3/s /29806ft3/s
Indalur vari 822 m3/s /31148 ft3/s
Mudalamuthu vari 599 m3/s /21154 ft3/s
These are the observed discharges during 1920 floods, when the catchments
were not intercepted and the command areas not fully developed. Over the period of years
since 1920 several Minor irrigation developments have taken place and the Grand Anicut
Canal has been laid across in 1934. The provisions given in this main canal for disposing
the drainage flows at different locations are as follows:
Description G.A.Canal crossing mileage (R.D.)
Discharge (ft3/s)
Sholagampatti vari 4 / 0755 439 m3/s /15500 ft3/s
Ayyanavaram vari 5 / 5354 164 m3/s / 5793 ft3/s
Nandasampatti vari 5 / 9930 78 m3/s / 2747 ft3/s
Chitrakudi vari 8 / 6560 81 m3/s / 2859 ft3/s
Mudalamuthu vari 9 / 9844 203 m3/s / 7163 ft3/s
In order to minimize the danger to the Delta, these floods must either be
detained upland itself during critical periods or be diverted elsewhere.
The drainage of the Cauvery Delta has several to be considered. This one
million plus acre coastal Delta has both favorable and unfavorable ones. Topographically,
the Delta has good drainage gradient for the upper twothirds of the area; the lower portion,
however, is very flat, and faces the sea at the widest portion of the Delta. Some of the
lower Delta areas are actually below mean sea level, which, of course, is an adverse
topographic feature from an agricultural point of view.

83
Almost the entire project area is agriculturally oriented and utilized for the
production of rice. Rice plants do not have the same set of requirements for drainage and
aeration of the root zone which most other field crops have. The immediate drainage
requirements of the area therefore are considered only in the view of protection from
excessive and / or long duration inundation.
Approximately 40,000 acres of agricultural land are subject to acute
flooding and submersion in the lower Delta area. The problem here is to find ways to
dispose expeditiously of this rainfall excess. The sea is the only outlet and is nearby, but
some unfavorable factors are found which, together with the unfavorable topographic
conditions, have compounded the drainage problem. The tidal variation is in the order of
four feet; in flat topography this permits a considerable ingress of seawater inland during
high tides. Further the strong littoral currents, from south to north tend to form bars which
effectively close the drainage outlets and create an obstruction for drainage into the sea,
until the flood inland heaves and is able to cut across the bars, opening their mouths..
Drainage is a complex problem in the old Delta. Of the 1620 kms of river
network in the Cauvery Delta, about 523 km length serves purely as irrigation rivers and
the rest function as irrigation cum drainage system. The topography of the Cauvery sub
basin gently falls towards the sea and also towards Vettar. The percentage drainage of
rainfall run off in the Cauvery sub basin is less than the runoff in the Vennar sub basin.
The Vennar sub basin is hence inundation-prone.
During November 2005 heavy rainfall on a single day and this resulted in a heavy
flood discharge of 851 Cumecs (30061 Cusecs) in to the Vennar below Grand Anicut
Head and above Vennar Vettar Regulator causing extensive damages to Vennar Sub-basin
in all forms viz. Breaches in the river Vennar and its branches, branches in the main
highway from Trichy to Thanjavur, inundation and submersion of thousands of acres of
irrigated and inhabited lands involving heavy expenditure for the Government in carrying
out flood protection and restoration works, relief works etc., Thus the flood menace has
become a regular agonizing feature to Vennar river sub basin during every monsoon
season.
1.9.2 Details Of Main Drain & Stages Of Drains During The Flood

84
In the Delta area total No. of Main Drains are 56, In that 19 Nos. of Drains are in
Cauvery Sub Basin 29 Nos. of Drains are in Vennar Sub Basin and 7 Nos. of drains are in
G.ACanal System..
During the irrigation time there are no damages in Cauvery Delta but in the north
east monsoon period of October to December the heavy rainfall occurs, it causes heavy
damages to the irrigated lands, Roads and public Residence. Since the public and formers
are heavily affected by the flood.
During the last 12 years the following years viz. 1999, 2005, 2008, and 2010 the
rainfall in the delta area is more than the normal. Among the above mentioned drains, the
following drains are badly affected:
1. Sullanar
2. Vettar
3. Odambogiyar
4. Vellaiyar
5. Harichandranathi
6. Koraiyar
7. Paminiyar
8. Mulliyar
9. Manangondanar
10. Marakkakoraiyar
11. Kannanar
12. Sakkilian Voikkal
13. Adappar
14. Kulaiyar
15. Pokkuvoikkal
16. Manankettan Drain
17. Malliyanar
18. Nallar
19. Annapillai Voikkal
20. Valavanar
21. Kilaithangiyar
The drains in Thiruvarur, Nagapattinam & Thanjavur District were heavily
damaged during these floods. Some of the drains originate in the higher lands of

85
Thanjavur & Pudukkottai District and they carry flood water along their channels to
overload the tail end of the drains as they are unable to discharge into the sea.

86
1.9.3 Needs And Necessity Of The Scheme
The existing discharging capacity of the rivers and drains are not sufficient to clear
flood water and the both sides banks of the river saw drainage are below the maximum
flood mark in most of the places.
The existing drainage inlets are having structures which are in completely damaged
condition. It leads the damages to existing banks during North East Monsoon and also
shoals formed in the centre of the rivers and drainages hinder free flow of water.
The existing cross masonries in the rivers and drainages are constructed before
more than 100 years. At present some structures are in fully dilapidated condition and
some structures having major repair. It is essential to desilt the rivers and Standardise the
existing bank by using conveyance of earth.
1.9.4 Vedaranyam Canal and its Function
The Vedaranyam canal, parallel and close to the Bay of Bengal was excavated
between 1863 and 1867 for inland navigation. It enters the sea in Nagapattinam port area
in the north and at the southern end it joins the sea at Thopputhurai. The length of the
canal is 57 km. In the past the canal was used as means of inland water transport and it
was of special use for carrying salt from Vedaranyam to Nagapattinam port. With the
forming of roads between Vedaranyam and Velanganni and availability of other mode of
conveyance such as railways, the importance of the canal as a means of navigation
declined.
1.9.5 The Straight Cuts
The flood waters entering the Vedaranyam canal are at present drained through the
straight cuts to the sea at the following points.
a) Vellaiyar straight cut b) Chakkilian voikkal straight cut c) Lawford straight cut d) Nallar straight cut e) Adappar straight cut f) Mulliyar Straight cut g) Valavanar Straight cut
87
The straight cuts are generally blocked at their outfalls to the sea by sand bars and in some
cases the channels are heavily silted. The straight cuts have received minimal
maintainance during recent decades.
When floods occur during north east monsoon period, water levels in the
Vedaranyam canal rise due to the large volume of flood water entering from the rivers
exceeding the capacity of the poorly-maintained straight cuts,resulting in vast areas of
low-lying land close to the coast. Being inundated.
The problems regarding the south bound drains are that they bring in large volumes
of discharges into the lagoon. The main flood carriers here are the Pamaniar and Koraiyar
which is at the southern most end of the Delta. The other rivers which are infalling into the
lagoon are Valavanar, Marakkakoraiyar, and Kilaithangiar. The drainage flows carried
into the lagoon by these south bound rivers is estimated at 729 m3/s (25,730 ft3/s). In
addition to the above problems, the general elevation of the land very near the coast is
very low (many places being situated below mean sea level) and large areas are prone to
inundation for longer durations. This is another chronic problem. The straight-cuts
mentioned above fail to function at times of high tide levels. An effective solution is to
dredge the straight cuts.
1.9.6 Pumping Schemes
There are 28 Nos pumping schemes and out of it 26 Nos is in operation in the
Cauvery Delta listed separately in Table 1.9.2
All these schemes came into operation between 1951 to 1991. The principle
objective of the pumping schemes is to supply water for irrigating the high level command
area by pumping the tail end river drainage water, which is going waste into the sea. They
provide irrigation facilities to an extent of 21757 acres within the Delta.
1.9.6.1 Operating schedule & Distributaries system
As a general rule, the pumping schemes are expected to commence with the
commencement of the drainage flow, after the development of the Delta ayacut around
15th August. The closure of operation will be around 15th of February.

88
In all the pumping schemes, except the one in Kollukadu, the pumped water is
being conveyed from the delivery sump through main channel and distributed to field
through direct sluices and field bothies and field to field in some places. In the pumping
scheme at Kollukadu, the pumped water is distributed to the field through tanks. The
designed time of pumping is 16 hours per day in two shifts of 8 hours each. Initially the
pumps were operated with qualified pump operators.
Table 1.9.2
LIST OF PUMPING SCHEME
Sl.No. Name of Pumping Scheme 1. Velankanni 2. Vilunthamavadi 3. Aymoor – I 4. Aymoor – II 5. Oradiyampulam 6. Umbalachery 7. Mulliyar (Thagattur) 8. Ayakkaranpulam 9. Manakondanar 10. Thennadar 11. Vanduvanchery 12. Valavanar & Karpaganatharkulam 13. Keelathondiyakadu 14. Karaiyankadu 15. Vilangadu 16. Melathondiyakadu 17. Thillaivilagam 18. Mangal 19. Pamanimullur 20. Segal 21. Korukkaithalaikadu 22. Thenpathi Thalaiyamangalam 23. Moovanallur (Abandoned) 24. Kollukadu 25. Payyundarkudikadu 26. Okkanadukeelaiyur 27. Chinnaparuthikkottai 28. Arasapattu

89
1.9.6.2 Present Status In nearly 1/3 rd of the pumping schemes the ayacut developed is less than 50% of the
registered ayacut. In the Orathanadu block the gap between the ayacut developed and
registered ayacut is more. The problems faced are:
to 40 years old and spares are not available in the market. Since they are very near
to the coastal area, the pipes and other installations are affected with corrosion.
efficiency is about 50% to 60%.
or the
failure of monsoon, the commencement of pumping will be delayed.
water to the high level lands. In the long run, due to settlement of soil, the designed
gradient of the channel is disturbed. Hence there is difficulty in conveying the
pumped water to the entire ayacut in most of the schemes.
difficulty in supplying water to the command area.
absence of the qualified permanent pump operators, it is difficult to
operate and maintain the pumping schemes.
reconstruction.
also in damaged conditions
and need rehabilitation and reconstruction.
the head of 2701 – 01 – 101 – CDS and 2701 – 03 – 121 – CMP. The funds
allotted under the above heads are not sufficient to meet the major repairs of the
equipments and maintenance of the canal system.
1.9.6.3 The improvements proposed
The ayacut now benefited is only 5216 ha (12889 acres) against the design ayacut
of 8805 ha (21757 acres). There is a gap of 3589 ha (8868 acres) in the registered ayacut
itself.

90
In order to revamp the functioning of the schemes to the designed status and bridge
the ayacut gap, rehabilitation of pumping schemes becomes necessary.
The following works are to be carried out in all the 29 pumping schemes in the
Cauvery Delta area, so that assured supply to the high level command area could be
normalized.
1. The motors and the pumps are to be repaired and renewed 2. All the pump rooms are to be repaired / reconstructed. 3. All the lined supply channels to be renovated 4. Cross masonries and cross drainage works are to be repaired / reconstructed 5. Human resources to the required strength to be posted

91
Figure 1.5
Figure 1.5

92
Hydraulic Particulars Of Head Regulators at the VVR Head Regulator
Vennar
Head Regulator
Feature Units Vennar Vettar Vadavar
Sill level (m) 41.450 41.450 41.450
N.S.L. (m) 42.970 43.280 42.970
No. of vents Number 29 17 10
Vent Size (m) 3.05 x 1.52 3.05 x 1.83 3.05 x 1.52
Maximum Discharge (ft3/sec) 8143.00 2845.00 1632.00
(m3/s) 230.58 80.56 46.21
Normal Discharge (ft3/sec) 5429.00 1897.00 1093.00
(m3/s) 153.73 53.71 30.95
Ayacut in Regulator (acres) 288400 100803 58089
(ha) 116711 40793 20270
Table 1.9.3
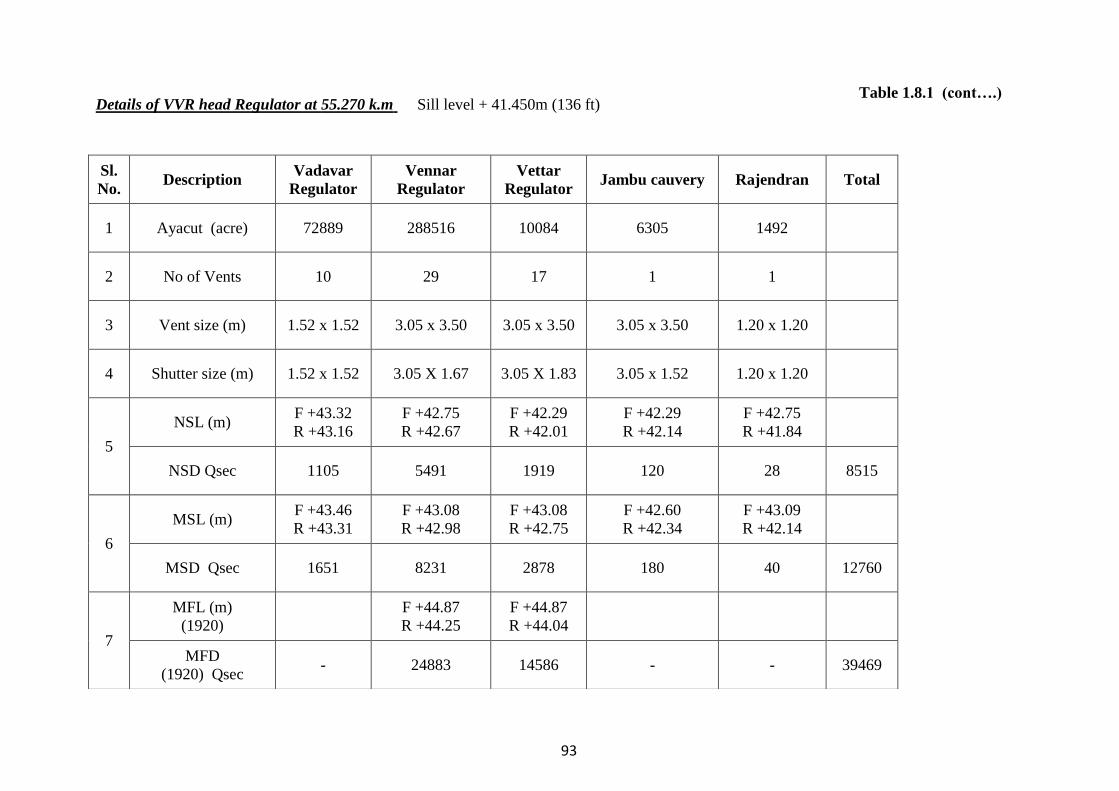
93
Details of VVR head Regulator at 55.270 k.m Sill level + 41.450m (136 ft)
Sl. No.
Description Vadavar Regulator
Vennar Regulator
Vettar Regulator
Jambu cauvery Rajendran Total
1 Ayacut (acre) 72889 288516 10084 6305 1492
2 No of Vents 10 29 17 1 1
3 Vent size (m) 1.52 x 1.52 3.05 x 3.50 3.05 x 3.50 3.05 x 3.50 1.20 x 1.20
4 Shutter size (m) 1.52 x 1.52 3.05 X 1.67 3.05 X 1.83 3.05 x 1.52 1.20 x 1.20
5
NSL (m) F +43.32 R +43.16
F +42.75 R +42.67
F +42.29 R +42.01
F +42.29 R +42.14
F +42.75 R +41.84
NSD Qsec 1105 5491 1919 120 28 8515
6
MSL (m) F +43.46 R +43.31
F +43.08 R +42.98
F +43.08 R +42.75
F +42.60 R +42.34
F +43.09 R +42.14
MSD Qsec 1651 8231 2878 180 40 12760
7
MFL (m) (1920)
F +44.87 R +44.25
F +44.87 R +44.04
MFD (1920) Qsec
- 24883 14586 - - 39469
Table 1.8.1 (cont….)
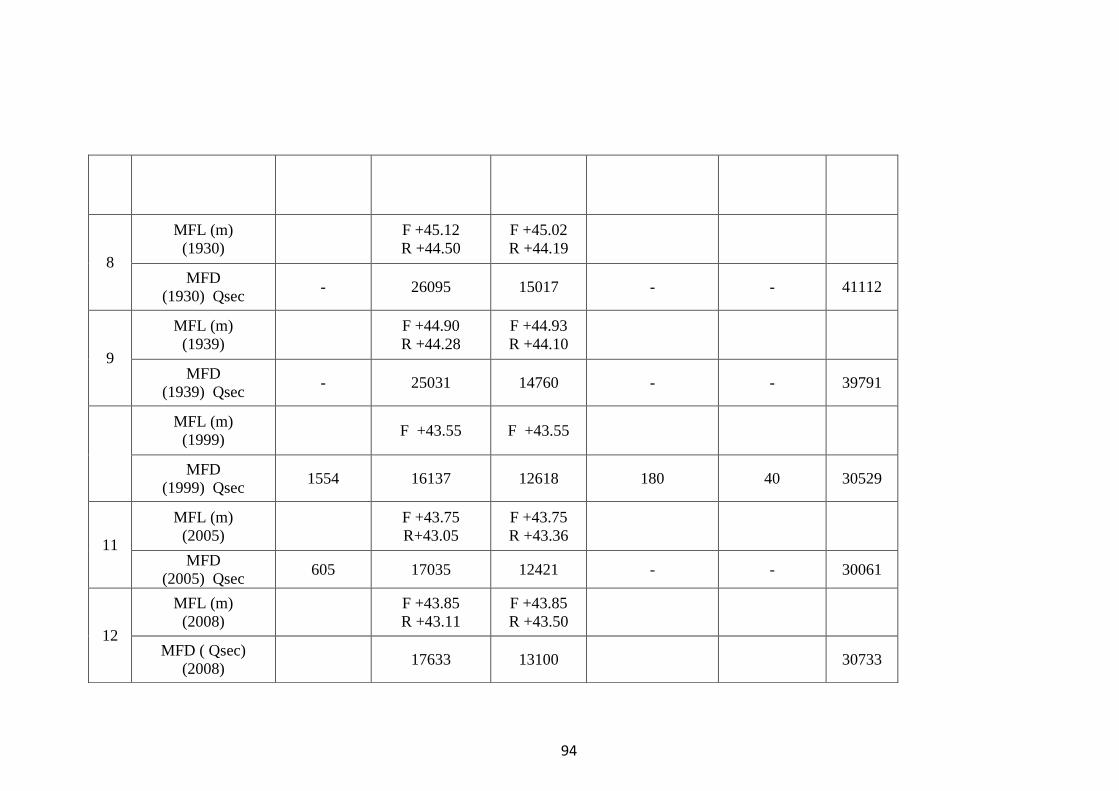
94
8
MFL (m) (1930)
F +45.12 R +44.50
F +45.02 R +44.19
MFD (1930) Qsec
- 26095 15017 - - 41112
9
MFL (m) (1939)
F +44.90 R +44.28
F +44.93 R +44.10
MFD (1939) Qsec
- 25031 14760 - - 39791
MFL (m) (1999)
F +43.55 F +43.55
MFD (1999) Qsec
1554 16137 12618 180 40 30529
11
MFL (m) (2005)
F +43.75 R+43.05
F +43.75 R +43.36
MFD (2005) Qsec
605 17035 12421 - - 30061
12
MFL (m) (2008)
F +43.85 R +43.11
F +43.85 R +43.50
MFD ( Qsec) (2008)
17633 13100 30733

95
Hydraulic Particulars of Rivers at Korayar Head ( 122.150k.m)
Description
Vennar Korayar Pamaniyar
Level (in m)
Depth
Level (in m)
Depth
Level (in m)
Depth
Sill Level 20.610 _ 20.625 _ 20.630 _
N.S.L FRONT 22.660 2.050 22.660 2.035 22.660 2.030
N.S.L REAR 21.945 1.335 22.245 1.620 21.830 1.200
M.S.L FRONT 22.960 2.350 22.965 2.340 22.960 2.330
M.S.L REAR 22.255 1.645 22.115 1.485 22.685 2.060
N.S.Discharge 1795c/s 2304c/s 730c/s
M.S.Discharge 2692c/s 3456c/s 1070c/s
Ayacutes 94219acres 120957acres 38357acres
No.of vents 14Nos 9Nos 4Nos
Size of vents 3.05X3.05+0.60 3.05X3.05+0.60 3.05X1.05
Height of shutter 1.52m 1.91m 1.52m
Table 1.8.1 (cont….)

96
2 Hydrology
2.1 Rainfall
Annual rainfall in the Vennar system is highly variable ranging between 1774 mm
and 653 mm with an average of 1192mm (Figure 2.1). The north-east monsoon (October
to December) ranges between 1331 mm and 316 mm with an average of 782mm,
contributing most of the annual total in many years. Average monthly rainfall (Figure 2.2)
shows the relative importance of the north-east monsoon compared with the south-west
monsoon (June to August) when, typically, monthly rainfall is not significantly different to
that in the dry season (January to May).
Occasional cyclonic storms during the north-east monsoon bring prolonged intense
rain falling causing flooding as rivers overtop their banks and drainage of runoff from
fields is impeded. In recent years serious flooding occurred in November 2008, November
2010 and September 2005 (the 2005 flood was caused by the Cauvery River bursting its
banks and bypassing the Grand Anicut).
In 2008 rainfall over the period 20th-30th November averaged 643mm in the
Vennar system. Individual rain gauge totals ranged from 421mm at Mulliyar Head to
865mm at Muthupettai. The peak of the storm occurred over 5 days (24th-28th November)
when 560mm was recorded across the system. Detailed analysis of the frequency of
annual maximum daily rainfall from 10 rain gauges in the Vennar system over the period
1981-2012, shows that a 5-day total of 560 mm has a return period between 20 and 50
years (see Table 2.1).
Table 2.1: Frequency of Extreme Rainfall in the Vennar System Return Period Years Daily rainfall mm 5-Daily rainfall mm
2 121 259 10 198 441 20 228 511 50 269 601 100 301 668
2.2 River Flow
In the Cauvery River sub-basin in Tamil Nadu, including the Cauvery delta, annual
and seasonal river flow is variable, depending primarily on the quantity of rainfall falling

97
in Karnataka and Kerala states during the south-west monsoon (June to August). The
north-east monsoon (November to January) generates relatively little flow in the Cauvery
River but its contribution to meeting crop water requirements is very important because
river flows normally fall sharply from September onwards.
The average annual yield of the Cauvery River basin is 20,955 MCM (740 TMC)
of which 11,865 MCM (419 TMC) is officially allocated to Tamil Nadu according to the
Cauvery Waters Dispute Tribunal decision (2007). Of this allocation, 5434 MCM (192
TMC) has to be released from Karnataka according to a prescribed monthly schedule
ranging from 1416 MCM (50 TMC) in August to 71 MCM (2.5 TMC) in May. Some of
this water is stored in the Stanley Reservoir upstream of Mettur Dam to provide
supplementary releases according to demand and antecedent rainfall in the irrigation
command areas. Other demands such as municipal water supply and industry are relatively
small. The Stanley Reservoir has an effective storage of 2648 MCM (93.5 TMC).
The irrigated area in the Cauvery sub-basin in Tamil Nadu is approximately
6,94,000 ha of predominantly paddy. Approximately 5,84,000 ha of this area are in the
Cauvery delta in Thanjavur, Thiruvarur and Nagapattinam Districts, of which about
1,88,000 ha are in the Vennar system. A further 1,10,072 ha are located upstream of the
Grand Anicut in Erode, Salem, Namakkla and Tiruchirapalli Districts.
The flow in the Cauvery River and the volume of water in the Stanley
reservoir in June each year are variable and are the major determinants of the cropping
area and, providing the north-east monsoon is sufficient, whether or not two rice crops can
be grown successfully. This variability is reflected in the annual flow in the Vennar River
at the VVR head regulator (Figure 2.3) which, in the period 1996-2011, varied between
1954 MCM (69 TMC) in 2006 and 311 MCM (11 TMC) in 2003 with an average annual
flow of 1260 MCM (44.5 TMC).
The total annual outflow from the Vennar system through the 11
downstream tail-end regulators varies between 2039 MCM (72 TMC) and 425 MCM (15
TMC) with an average of 1218 MCM (43 TMC). Whereas most of the inflow occurs
between June and October (Figure 2.4), during and following the south-west monsoon,
most of the outflow occurs in November and December, during the north-east monsoon,
indicating that the outflow is mostly runoff of local rainfall and that the inflow is mostly
consumed within the system.

98
During normal operations the distribution of water within the Vennar
system mirrors demand. WRD data shows a broadly consistent distribution from the head
regulators. Approximate percentage shares are shown in Table 2.2. During flood situations
however, the system is operated in flood management mode which fully opens head
regulators on all the rivers except the Vadavar, Mullaiyar, Ayyanar and Harichandri Nadi
which are effectively isolated.
Table 2.2: Flow Distribution at Regulators in the Vennar System
Regulator Receiving Channels and Average Percentage Share
Normal Operations
VVR Vettar 28% Vennar 33% Vadavar 39%
Koraiyar Vennar 38% Koraiyar 45% Pamianar 17%
Mulliyar Koraiyar 34% Mulliar 30% Ayyanar 4% Harichandranathi 32%
Pandavayar Vennar 50% Pandavayar 50%
Vellaiyar Vennar 50% Vellaiyar 50%
Pandidhakudi Dam
Vennar 80% Adiveeraramanar 20%
Moovarkottai Vadavar Extension Canal
75% Vadavar surplus 25%
Flood Operations
VVR Vettar 43% Vennar 57% Vadavar 0%
Koraiyar Vennar 60% Koraiyar 38% Paminyar 2%
Mulliyar Koraiyar 100% Mullaiyar 0% Ayyanar 0% Harichandranathi 0%
Pandavayar Vennar 66% Pandavayar 34%
Vellaiyar Vennar 52% Vellaiyar 48%
Pandidhakudi Dam
Vennar 100% Adiveeraramanar -
Moovarkottai Vadavar Extension Canal
0% Vadavar surplus 0%

99
2.3 Droughts
A poor south-west monsoon in Karnataka limits flows in the Cauvery River
and the amount of water stored in the Stanley reservoir and therefore reduces the amount
of surface water available for irrigation during the rice growing season (June-January) in
the Cauvery sub-basin in Tamil Nadu. The potential annual irrigation demand for two rice
crops in the Vennar system is approximately 2407 MCM (85 TMC), but average annual
flow in the Vennar River at the VVR head regulator (Figure 2.3) is only 1260 MCM (44.5
TMC) and is less than 850 MCM (30 TMC) in 2 out of 10 years. Clearly therefore, for two
rice crops to grow successfully it is necessary for the north-east monsoon to contribute an
average of 1147 MCM (40.5 TMC) and as much as 1557 MCM (55 TMC) in 2 out of 10
years.
However the north-east monsoon in Tamil Nadu is notably erratic. Analysis
of rainfall amounts recorded in the Vennar system between October and December
indicates an average of 750 mm with a standard deviation of 241 mm. Typically, less than
500 mm falls on the Vennar system during the north-east monsoon in 2 out of 10 years.
This is equivalent to 325 MCM (11.5 TMC) of effective rainfall. Clearly therefore a poor
south-west monsoon in Karnataka, followed a poor north-east monsoon in Tamil Nadu,
creates a drought situation and has serious consequences for agriculture in the sub-basin.
This was the case in 2002 and 2003.
Where sufficient groundwater is available, the shortfall in surface water can
be made up. However there are many areas in the Cauvery delta with limited groundwater
availability or with saline groundwater. Consequently in such areas drought impacts are
especially severe.
2.4 Climate Change
According to studies carried out during the preparation of CASDP by ADB
(Srinivasan, 2013; Dastgheib and Ranasinghe, 2014) and by the main PPTA team the
following climate changes are expected in the Vennar system by 2050:
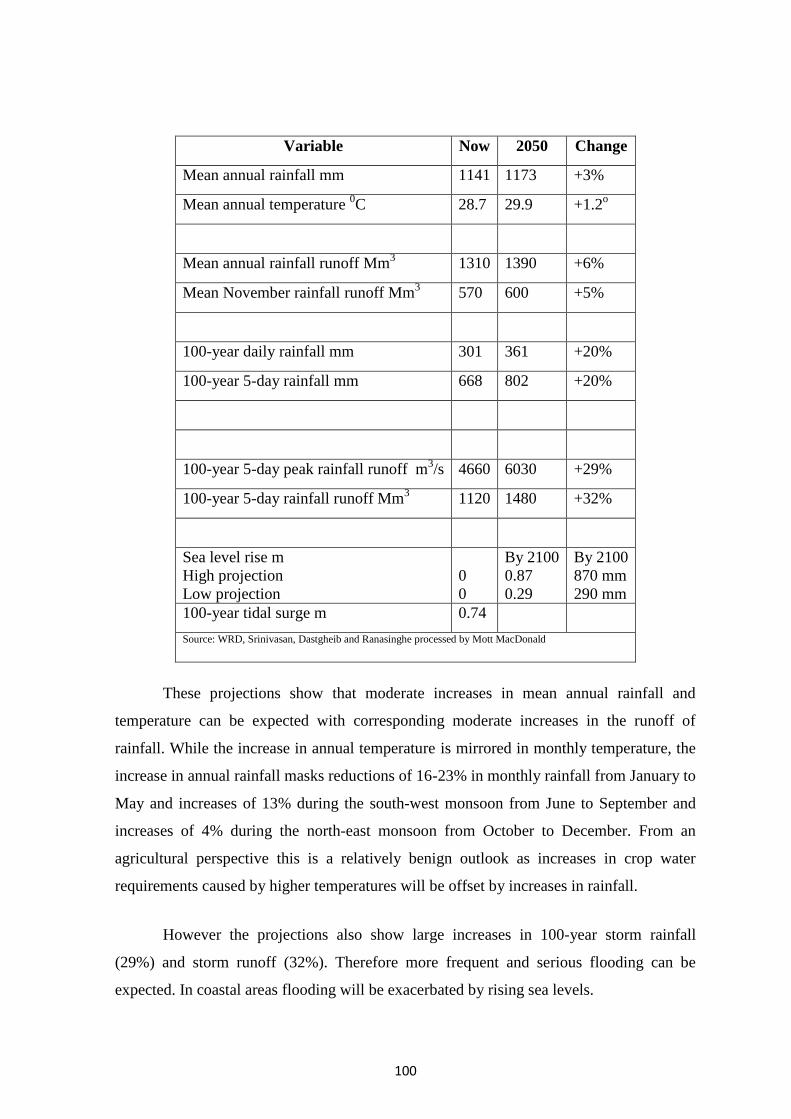
100
Variable Now 2050 Change
Mean annual rainfall mm 1141 1173 +3%
Mean annual temperature 0C 28.7 29.9 +1.2o
Mean annual rainfall runoff Mm3 1310 1390 +6%
Mean November rainfall runoff Mm3 570 600 +5%
100-year daily rainfall mm 301 361 +20%
100-year 5-day rainfall mm 668 802 +20%
100-year 5-day peak rainfall runoff m3/s 4660 6030 +29%
100-year 5-day rainfall runoff Mm3 1120 1480 +32%
Sea level rise m High projection Low projection
0 0
By 2100 0.87 0.29
By 2100 870 mm 290 mm
100-year tidal surge m 0.74
Source: WRD, Srinivasan, Dastgheib and Ranasinghe processed by Mott MacDonald
These projections show that moderate increases in mean annual rainfall and
temperature can be expected with corresponding moderate increases in the runoff of
rainfall. While the increase in annual temperature is mirrored in monthly temperature, the
increase in annual rainfall masks reductions of 16-23% in monthly rainfall from January to
May and increases of 13% during the south-west monsoon from June to September and
increases of 4% during the north-east monsoon from October to December. From an
agricultural perspective this is a relatively benign outlook as increases in crop water
requirements caused by higher temperatures will be offset by increases in rainfall.
However the projections also show large increases in 100-year storm rainfall
(29%) and storm runoff (32%). Therefore more frequent and serious flooding can be
expected. In coastal areas flooding will be exacerbated by rising sea levels.

101
The detailed Hydrology has been provided in Annexure-6 Surface and
Groundwater Modelling.
Figure 2.1
Source: WRD
Figure 2.2:
Source: WRD

102
Figure 2.3
Source: WRD
Figure 2.4 Average Monthly Inflows and Outflows in the Vennar System
Source: WRD

103
3 Reservoirs Prior to the construction of major dams in the Cauvery Basin in the 1930s, farms were
irrigated from run-of-river flows generated mainly during the SW monsoon. After the SW
monsoon ended (generally in September), river flows reduced and irrigated crops,
particularly in the Cauvery Delta, became dependent on rainfall from the NE monsoon during
the latter part of the growing season.
After construction of the Krishna Raja Sagar (KRS) dam in Karnataka (49 TMC
gross) in 1924, and the Mettur dam (95.6 TMC gross) in Tamil Nadu in 1934, it became
possible to regulate flows in the Cauvery River so that surface water irrigation was feasible
throughout the cropping season in years with normal rainfall. Since then a number of other
dams have been constructed and the total storage capacity of the reservoirs in the Cauvery
basin has increased to 330 TMC gross (CMP, 2008).
This Project works will be located downstream of the storage reservoirs in the
Cauvery basin, and hence will not impact them. In addition, there is no water storage
provision on the six Project rivers as the relatively flat topography of the delta and intensive
land use provides little scope for providing storage. The details about the upstream water
storage reservoirs are presented in Chapter 1.

104
4 Barrages (Anicuts) Irrigation water for the Cauvery Delta, including the Vennar system, is provided by
releases from the Mettur Dam. The water is diverted into the Vennar System at the Grand
Anicut through the Vennar-Vettar-Vadavar (VVR) Head Regulator. The Grand Anicut is
operated well and it is adequately maintained.
Flood flows in the Cauvery are diverted at the Grand Anicut into the Coleroon River
through the Ullar Channel. No flood flows are released from the Cauvery River into the
Vennar System at the Grand Anicut unless the anicut is by-passed as happened in 2005.
This Project starts downstream of the Grand Anicut and this Project funds are not
required to continue the successful operation and maintenance of the Grand Anicut. The
details about the Grand Anicut have been furnished in Chapter 1.

105
5. Land Potential 5.1 Soils The Vennar System is located in the southern parts of Nagapattinam and
Thiruvarur Districts and in the east of Thanjavur district (See Figure 1.1). The major soil
types of these three districts are:
Nagapattinam: Sandy Coastal Alluvium and Black Soil types cover 89 per cent and 7
per cent respectively of the district (see Figure 5.1). The soils of the district are mainly of
alluvial origin and vary greatly in quality. The district is mostly a plain, formed by coastal
processes. The land elevation of the eastern part is within a few meters of sea level. The
most fertile soil is found in the north. The least fertile soils are found south of
Nagapattinam where the soil is saline and drainage is very defective. The main source of
irrigation water in the districts is the rivers. There are also a few rainfed tanks and limited
scope for wells due to saline groundwater. The tanks and wells occur mostly in the upland
regions. About 7% of the land is affected by water logging and is marshy land and 56% is
prone to floods. About 4% of the land available for cultivation suffers from
salinity/alkalinity and 18% is coastal sand. Overall about 85% of the land has soil
problem.

106
Figure 5.1 Soils Map of Nagapattinam District

107
Thiruvarur: The soils of the district are mainly alluvial. The plain of Thiruvarur district
is a plain with a gentle slope towards the east in the northern and central parts and towards
south in the southern part. The maximum land elevation is about 30 masl in the western
part of the district. The major part of the district is delta plain. Sedimentary high land
having pediment and buried pediment landforms are found in Mannargudi and towards the
west of the district. Sedimentary plain consists of various landforms like natural levee,
swale and marshes. , Lagoon, back water coastal plain and beach ridges are found in the
southern part of the district.
Figure 5.2 Soils Map of Thiruvarur District

108
Thanjavur: Thanjavur district is made up of cretaceous, Tertiary and Alluvial deposits.
Very deep red soils constitute a major area (37%) of the district, followed by moderately
deep block soils (12%), moderately deep red soils (6%). Deep red soils and very shallow
black soils constitute 4% each, followed by moderately shallow black soils (2%).

109
Figure 5.3 Soils Map of Thanjavur District
110
5.2 Land Use
Nagapattinam: The total area of the district is 2,716 km2. This district has a net cultivated
area of 153,000 hectares which is 57% of the total area. Forest cover is very minimum
accounting for only about 2% of the land. The area of fallow land increased slightly over
the past three years. The land not available for cultivation covering barren and
uncultivable land and land put to non-agricultural uses, accounts for 30%. The other
uncultivated lands including permanent pastures and miscellaneous tree crops and groves
not in the net area sown cover 4 %. The area coming under fallow is about 8 %.
Thiruvarur: The total area of the district is 2,097 km2 of which 237,715 hectares 69 % is
cultivated land. Thiruvarur district is more suitable for cultivation of paddy. Other
important crops grown in the district are black gram, green gram, cotton, sugarcane,
sesame, groundnut etc., and the major cash crops are paddy, black gram, green gram,
cotton. The land use pattern of the district includes land under trees occupies (nearly 18
%), while the area of fallowland is 14 %. The land under non agricultural use is (18
percent) which is a cause for concern as the growth of non-agricultural activities will
reduce the potential for agricultural growth in the district. The current fallow and other
fallow lands occupying 5.5 and 3.5 percent respectively couldbe reduced considerably by
encouraging horticulture.
Thanjavur: This district has witnessed significant changes in the land use over the last
decade which illustrates the nature of the problems confronting the future development in
agriculture. During the period between 2001-02 and 2010-11 the net sown area (NSA)
registered only a marginal change of less than three per cent, the gross cropped area
declined from 270,000 ha in 2001-02 to 259,000 ha in 2010-11. In other words, the share
of GCA to total gross area was reduced from 80 % to 76% within a decade. This was
mainly due to decline in the double cropped area from 67,000 ha to 62,000 ha. In the total
area of the district, the ratio of non-agricultural land has significantly gone up from 23 %
in 2001-2002 to 24 % in 2010-2011, that is around a five per cent increase over the
decade. The increase was due to rapid urbanization and industrialization at the cost of
viable agricultural lands. This has a negative impact on agriculture sector. In addition, the
transfer acted as a catalyst for transfers of water and labour from the agriculture to the
non-agricultural sector. It is important to note that the land under fallow has increased
more than two and half times from 5,759 ha to 13,001 ha during last decade.

111
6. CROPPING PATTERN AND CROP WATER REQUIREMENTS 6.1 Details of Current Cropping Pattern and Crop Calendar
6.1.1 Current Cropping Pattern
The baseline current cropping pattern for the three districts of the Vennar system is
presented in Table 6.1. Paddy predominates with 61 % of land area planted to the crop.
The overall average cropping intensity is 167% with 33% of the area planted with a
double crop of Kuruvai paddy (110-115 days duration) from June to October, followed by
Thaladi paddy (135 days) from October to January/February. On the other 66% of land, a
Samba paddy (155-160 days) is grown from August to January/February. Samba paddy
predominates in the southern part where groundwater is not available because of salinity
problems and farmers are solely reliant on surface water. The samba area includes the
whole of Nagapattinam district and the southern four blocks of Thiruvarur district. The
double cropping of paddy is practiced in all the blocks of Thanjavur that are in the Vennar
System and the northern blocks of Thiruvarur where most farmers have access to tube
wells and hence are able to double crop or very occasionally triple crop rice. The
restrictions on the double cropping of rice applies to over 50% of the cultivated land due
to water constraints in the middle and lower parts of the system, resulting from inadequate
surface water availability in the tail end regions and the prevalence of saline groundwater
negating the use of tubewells. A detailed review of cropping patterns options is presented
in Annexure 1.
Table: 6.1 Current Cropping Pattern for Vennar System (area x1000 ha) by District
Crop Thanjavur Thiruvarur Nagapattinam Total % Total
Area
Rice 150.2 151.6 170.8 472.6 60.7
Pulses 40.2 80.4 85.2 205.8 26.4
Groundnut 15.9 7.8 3.7 27.4 3.5
Sesame 12.8 2.7 - 15.5 2.0
Sugar cane 15.5 - 6.4 21.9 2.8
Coconut 30.3 5.3 - 35.6 4.6
Total 778.8 100.0
Cropping Intensity
130 182 176 167
% of Vennar System
27 55 18 100
% of District 23 66 19 100

112
Source: Agricultural Contingency Plan-District Agricultural Profile (2208-09) Tiru and Water Management Technologies, Water Management Centre, Tamil Nadu Agricultural University, Coimbatore.
The main winter (January to April) crops grown across the system are pulses of
which black gram (crop duration 75-80 days) is preferred to green gram (65-70 days) by
about 2:1, and accounts for 26% of the cropped area. Gram crops rely on residual moisture
and are usually not irrigated, although sometimes where groundwater is available, they are
irrigated. The other major winter crops grown include groundnut (95-115 days), sesame
(75-90 days) and small areas of maize (90-120 days), plus minor vegetables, which
collectively account for only about 6 % of the gross sown area. These crops have an
average duration of 75-90 days and are planted normally in January. A biannual crop of
sugar cane is grown on 3 % of the land, particularly in Thanjavur. Long term perennial
tree crops, mainly coconut but also including banana, mango and other fruit tree crops are
grown on around 5 % of the gross land area especially in Thanjavur where copra is an
important product.
6.1.2 Paddy Cultivation in Vennar System The most common system of lowland paddy cultivation in the Vennar System is
transplanting and also by direct seeding into fields that are continuously flooded with 0.05
to 0.15 m of water throughout the growing season. Land preparation includes soaking,
ploughing and puddling i.e. harrowing until a soft muddy layer of 0.05 to 0.25 m is
formed in saturated conditions. The water requirement for land preparation is estimated at
200±150mm, but can reach as high as 900± 650 mm for long duration paddy. The higher
water requirement for land preparation is required for loamy sandy soils, while clay soils
require less water. Field water application during crop growth periods varies from 500 -
800 mm to more than 3000 mm. Most wet season paddy irrigation is by gravity (cascades
from plot to plot) while dry season paddy cultivation requires pumping in some places.
6.1.3 Rice Water Requirements and Productivity The average total water requirements and specific water use for paddy production
under different conditions can be roughly estimated as 550 to 950 mm/crop, based on an
evapotranspiration, which is the water actually consumed by the plant, plus any additional
water used. The water requirement, yield and specific water use for different types of
paddy production are shown in Table 6.2.

113
Table 6.2 Gross water requirement, yield and specific water use for different types of
paddy production
Production system Total Gross
Water Requirement
Yield Specific
Water Use Water
Productivity
m3/ha t/ha, m3/kg kg of rice/m3 of
water
rainfed upland paddy (evapotranspiration only)
5500 1.25 3.6 0.28
rainfed lowland paddy (evapotranspiration + impounded rainwater)
10,000 2.5 4.0 0.25
irrigated upland paddy (evapotranspiration + supplementary irrigation)
10,000 2.5 4.0 0.25
irrigated lowland/deepwater paddy (evapotranspiration and full irrigation)
16,500 4.5 3.7 0.27
Irrigated lowland is the dominant system in the Vennar System. It is the most
productive in terms of yield and it produces the highest yield per m3 of water but, it is the
least efficient in terms of water use per ha or the amount of water required for
evapotranspiration divided by the amount of water diverted into the system. Water
productivity in the Vennar System is low as the water productivity elsewhere in India is
typically 0.4±0.2 kg per m3 of water. Total water productivity or paddy production can be
increased by better management of water drained from one field to irrigate paddy in
another field.
There is no absolute technique available to measure exact irrigation water
requirement of paddy but literature and research reveals that requirement varies depending
on soil, climate, irrigation system, variety (long duration varieties require more water) and
other management practices.
Typical water requirements and water use for paddy are:
Water requirement: Nursery – 40 mm; main field preparation - 460mm; panicle initiation & flowering – 417; flowering – maturity – 123 mm. Total 1240 mm

114
Water use: land preparation (150-250 mm); evapotranspiration (500-1200 mm); seepage and percolation (200-700 mm); mid season drainage (50-100 mm). Total (900-2250 mm)
6.2 Details of Original Cropping Pattern and Crop Calendar The Cauvery Delta including the Vennar System has been the rice bowl of Tamil
Nadu for millennia. From the early 1800’s, rivers of the Vennar System have been
enhanced to improve the delivery of irrigation water and the removal of floodwater.
Depending on the availability of water, farmers have grown one, two or three rice crops.
Since the construction of storage dams in the upper Cauvery catchment in the early 20th
century, the availability of irrigation water has been more reliable at least in the main
growing season from August to January and rice still is the dominant crop.
6.3 Future Cropping Patterns
Crop and agricultural data was collected from agricultural and irrigation research
facilities and the departments of agriculture in Thanjavur, Thiruvarur and Nagapattinam
Districts.
The selection of an alternative generic cropping pattern for the Vennar system has
been developed based on an empirical analysis of existing data and the results from the
CASDP PPTA Social Survey (Mott MacDonald 2014). Consideration was given to water
use efficiency ("best crop per drop") plus the relative profitability of the various crop
options, as it is no use replacing one crop with another of lower financial return. In
addition, there was the need to determine the aim of the alternative cropping pattern:
whether it is to forecast a cropping system which is more productive under improved
water availability and management, and/or it is to improve water use efficiency (WUE)
where rice is replaced with more water efficient crops.
As a starting point it is useful to consider the water requirement and WUE of major
crops shown in Table 6.3. It should be noted that paddy is probably the best crop to be
grown during the north-east monsoon because of the high rainfall and the related land
inundation. Also the climate can cause causes serious problems with pests/disease for
alternative crops to rice. This leaves the south-west monsoon season where rice could be
replaced to a certain extent by other crops such as pulses, oilseeds (soya bean and
groundnut) and maize, and possibly some high value vegetables. In the summer season,
with irrigation only from groundwater, other crops could include pulses, oilseeds and

115
cotton. If water saving is an aim then the cultivation of long term crops which rely on a
constant supply of irrigation water, for example sugarcane and banana, should not be
proposed.
Table 6.3 Water Requirements and Water Use Efficiency for Different Crops
Crop Duration (days)
No. of Water
applications
Water Requirement
(mm)
Productivity (kg/m3)
Quantity of Water
Required (m3/kg)
WUE (kg/ha/mm)
Rice 110-160 20 1250 (900-2500)
0.41 2.44 4.1
Sugarcane 360 24 2200 4.05 0.25 40.5
Groundnut 105 9 510 0.21 4.26 2.1
Sorghum 105 8 500 0.80 1.25 8.0
Maize 100 12 500 0.93 1.08 9.3
Millet 95 10 310 0.88 1.13 8.8
Cotton 165 10 600 0.33 3.00 3.3
Black gram 65 6 280 0.25 4.00 2.5
Soyabean 85 8 320 0.47 2.13 4.7
Sesame 85 3 114 0.25 4.00 2.5
Source: TNAU (2003). Water Management Technologies.Water Management Centre. Tamil Nadu
Agricultural University. Coimbatore-641 003.
The systems developed for the System of Rice Intensification (SRI) can have a
significant impact on the amount of water required to cultivate the crop while still
maintaining high yields and productivity. In many cases a gross water saving of around
50% can be achieved (8,000 m3/ha for the SRI system as compared to 16,500 m3/ha for the
current traditional systems). This method is already used in some blocks of Thanjavur and
Thiruvarur districts and its further expansion in these locations would have a significant
impact. Also if water management and control are improved in single cropped Samba rice
cultivation areas, the overall saving in water used across the Vennar System could be
significant.
6.4 Assessment of Effective Rainfall and Crop Water Requirements 6.4.1 Potential Evaporation and Effective Rainfall
The general climate regime of the Cauvery delta was described in Chapter 2. The
Cauvery delta has a tropical climate, with mean annual rainfall of around 1200 mm. The
south-west and north-east monsoons are the dominant sources of precipitation providing

116
almost 80% of the total annual rainfall. The north-east monsoon is associated with
cyclonic storms causing widespread damage to crops and property as result of flooding.
Inter-annual rainfall variability also causes significant damage to agriculture as a result of
drought. Intra-seasonal variability also causes frequent crop failures and loss to major
agricultural resources.
The climatic norms in the Cauvery delta and more particularly the Vennar System
were determined using station data at Tiruchirappalli and Nagapattinam plus
meteorological data from the FAO CLIMWAT database. Figure 6.1 and Figure 6.2 show
potential evapotranspiration and effective rainfall for Tiruchchirappalli and Nagapattinam
respectively using the FAO CROPWAT8 package. CROPWAT 8uses the FAO Penman
method in the calculation of ETo, and calculates effective rainfall using the USDA Soil
Conservation Service method.
Figure 6.1: Climatic Norms for Tiruchirappalli
Figure 6.2: Climatic Norms for Nagapattinam

117
Considering each station in more detail: Tiruchirappalli: Mean daily temperatures range from a low of about 25oC in December
to a high of about 32oC in May. April, May and June are the hottest months with mean
daily maximums close to 31oC. The mean daily temperature range is typically about 8oC.
The maximum range occurs in May and the minimum in December. Relative humidity is
at its lowest in June, averaging 60%, and peaks in November at 73%. Wind speeds are
generally in the range of 1.5 to 6.3 m/s, and are highest in June to July. Solar radiation is
at its peak in March and low in November. The climatic parameters combine to give an
annual potential evapotranspiration at of 2191 mm, with peak evapotranspiration in June,
July and August. The peak daily rates of evapotranspiration occur in July with a mean of
8.4 mm/day. It is clear from Figure 6.1 that the effective precipitation is far short of
potential evapotranspiration. Mean annual rainfall is 902 mm, and the computed mean
annual effective rainfall is 726 mm.
Nagapattinam: Mean daily temperatures range from a low of about 25oC in December to
a high of about 31.4oC in May. May and June are the hottest months with mean daily
maximums close to 31oC. The mean daily temperature range is typically about 8oC. The
maximum range occurs in May-June and the minimum range in November-December.
Relative humidity is very high throughout the year, being at its lowest in July when it
averages 76%, and peaking in October at 90%. Wind speeds are generally in the range of
1.7 to 3.6 m/s, and are highest in March to June. Solar radiation is at its peak in March and
lowest in December. The climatic parameters combine to give an annual potential
evapotranspiration at of 1552 mm, with peak evapotranspiration in May and June. The
peak daily rates of evapotranspiration occur in May with a mean of 4.9 mm/day. It is clear
from Figure 6.2, that except for the months of October, November and December, the
effective precipitation is far short of potential evapotranspiration. Mean annual rainfall is
1421 mm, and the computed mean annual effective rainfall is 837 mm.
The main climate parameters for the two stations are summarized in Table 6.4.
Table 6.4 Comparison of Climate Parameters in Tiruchirappalli and Nagapattinam
Parameter Tiruchirappalli Nagapattinam
Mean Daily Temperature
-December 25oC 25oC
-May 32oC 31.4oC

118
Mean daily temperature range 8oC 8oC
Relative Humidity
-June (low) 60%
-July (low) 76%
-October (peak) 90%
-November (peak) 73%
Wind speeds 1.5-6.3 m/s 1.7- 3.6 m/s
Potential ET 2191 mm 1552 mm
Peak daily ET 8.4 mm/day 4.9 mm/day
Mean annual Precipitation 902 mm 1421 mm
Mean effective rainfall 726 mm 837 mm
Temperatures in the two locations are similar. The main climatic difference between the
locations are that the humidity and rainfall are higher at Nagapattinam on the coast. The
higher humidity reduces the coastal potential evapotranspiration. Overall, the effective
precipitation is far short of the potential evapotranspiration in both locations although the
deficit is greater inland.
6.4.2 Agro-climatic Zone
Based on rainfall distribution, irrigation pattern, soil characteristics, cropping
pattern and other physical, ecological and social characteristics, Tamil Nadu State is
classified into seven agro-climatic zones and the Vennar System is located in Zone 4 –
Cauvery Delta Zone. This zone covers the Cauvery Delta area in Thanjavur, Nagapattinam
and Thiruvarur Districts and also the taluks of Musiri, Tiruchirappalli, Lalgudi, Thuraiyur
and Kulithalai in Tiruchirappali District, and the taluk of Aranthangi in Puddukottai
district and the taluks of Chidambram and Kattumannarkoil in Cuddalore District.
The growing season for paddy in the Cauvery delta is generally from June to
February. The first crop, Kuruvai, is of short (105 days) duration and is planted in June /
July and harvested in September / October. The second crop, Thaladi, has about 135 days
duration, and is planted during October / November and harvested in January / February.
The long duration crop, Samba is planted in the single crop lands during August /
September and harvested in December / January and is of about 150 days duration.

119
A cash crop of pulses, either black gram or green gram, is sown, mixed with wild
indigo or wisteria (Sesbaniaspeciosa) as a green manure crop in the lands under paddy,
just prior to harvest of paddy. The pulse and green manure crops grow with residual
moisture and dew in the early stages and with summer rains in the later stages.
Groundwater pumped from tubewells is used for raising advance paddy nurseries
and for supplementing canal flows when they are inadequate. Farmers on the higher delta
land in Thanjavur and to lesser extent Thiruvarur districts, where groundwater is
favourable, are normally double cropping by using groundwater when canal water supplies
are not available.
The Cauvery Waters Dispute Tribunal (CDWT) in its final order in 2007 assumed
the irrigation season is restricted to June to January and that crops grown after 31st
January are irrigated with groundwater.
6.4.3 Water Requirement and Irrigation Schedule
The water requirement and irrigation schedule for the main crops in the Vennar
Basin are shown in Table 6.4
Table 6.4 Water Requirements and Irrigation Schedule for the Main Crops.
Crop Water requirement
(mm)
Irrigation schedule
(IW/CPE)
Irrigation Interval (days)
Critical stages for moisture stress
Rice 1250 (900-2500) 5 cm on disappearance of previously ponded water
4 Tillering, panicle initiation, flowering & milky stages
Maize 500-600 0.8 10-12 Knee-high, tasseling, silking and maturity
Pulses 250-300 0.4 10-12 Vegetative & flowering
Sesame 100-200 0.4 10-12 Vegetative & flowering
Groundnut 450-550 0.6 10-12 Flowering, peg formation & pod development
Cotton 600-650 0.4 10-12 Square formation, flowering & boll formation
Sugarcane 1800-2000 0.75 (0.5) 7-8 Early vegetative, grand growth & maturity phases
Banana 2000-2200 0.8 7-8 Adequate moisture required throughout crop period & especially during fruit development stage
Chillies 650 0.8 7-8 Flowering, fruit setting & enlargement

120
Note: IW is Irrigation Water. CPE is Cumulative Pan Evaporation Source: TNAU (2003). Water Management Technologies .Water Management Centre. Tamil Nadu Agricultural University. Coimbatore-641 003
The dominant rice crop has a high water requirement when compared to other field
crops plus needs frequent irrigations to keep water ponded on the field. Sugar cane and
bananas also have high water requirements as they need year round watering.
6.5 Assumed conveyance efficiencies
Irrigation water is a limited resource and therefore should be used very efficiently.
The main inefficiencies are losses that occur during conveyance, run off, seepage and deep
percolation. Uneven spreading and inadequate filling of the root zone are other causes of
low irrigation efficiency. Application efficiency is defined as the ratio of the water
volume stored in the soil root zone to the water volume applied by the irrigation system.
Thus, water applied by the irrigation system and not being made available to be taken up
by plant roots is wasted and reduces irrigation efficiency. The major causes for reduced
irrigation efficiency are drainage of excess irrigation water to soil layers deeper than the
depth of active roots. Leakage of irrigation water to deep soil layers could result in
pollution of the water table.
From 1983 to 1998, PWD’s Institute of Hydraulics and Hydrology at Poondi
carried out research studies in the Cauvery Delta and determined that average seepage
losses in lined channels was 7 % and in unlined channels was 11% (CMP 2008). In a
separate study, flow particulars were collected from 1978 to 1989 and analysed to
determine that the overall average loss of water in the Vennar River was 10%.
In the Government of Tamil Nadu’s statement of crop water requirements
submitted to the Cauvery Water Disputes Tribunal, the efficiency of the irrigation systems
in the Cauvery basin was taken as 55-60% (CMP 2008).
6.6 Irrigation Water Requirements
Current deliveries of irrigation water are not being altered under CASDP Project.
Irrigation deliveries will be maintained at their present levels as long as the distribution
system is maintained in its present stage.

121
7 Aquaculture
7.1 Introduction Shrimp farming is the major aquaculture activity in the Vennar system and
requires significant amounts of clean water to support the shrimps, replenish oxygen and
remove waste. Land-based aquaculture systems impact the environment by not only using
water and returning it in a more degraded form but also consuming water through
evaporation from the pond surfaces and seepage to groundwater.
Initially Penaeus monodon (Tiger shrimp) was farmed with marine and brackish
water in the Vennar system. As Penaeus monodon grow better in water with a salinity of
15-25 ppt, shrimp farms were located on the coast where sea water or saline groundwater
could be accessed. However, in the late 1990’s, the production of tiger shrimps collapsed
due to disease. Shrimp farming did continue but at a much smaller scale.
In about 2009, a different shrimp variety, L. vannamei, was introduced to India
and shrimp farming again became profitable in the Vennar system. The area of ponds
increased, partly due to the expansion of shrimp farming inland into fresh water areas
because L. vannamei is tolerant to a wider salinity range (0.5 to 35 ppt) than Penaeus
monodon. The best growth of L. vannamei is reportedly in low salinity waters and
therefore inland shrimp farmers put salt into fresh water to maintain water salinity at
0.5ppt.
7.2 Area of Shrimp Farming The estimated area of coastal brackish shrimp farms in the Vennar system is
shown in Table 7.1 The estimate is based on information received from shrimp farmers,
representatives from shrimp farmers’ associations, grass root representatives, NGO’s,
volunteers and others who are involved in shrimp production. However, only about 60%
of the farms in the coastal belt were in operation in March 2014, which means that about
1384 ha of ponds are actively producing at present. The reasons why 40% are inactive
include problems with land ownership, water quality, soil texture, social issues and
financing.
The area of inland shrimp farms that use fresh water is estimated to be about 500
ha.

122
Table 7.1 Shrimp farms in the Vennar System
River/ tributary/canal
Area of Brackish
Water Shrimp Farming (ha)
Valavanar 20 Maraka Koraiyar 15 Jabuwanodai 140 Koraiyar 50 Paminiyar 180 VC Thopputhurai 55 VC Kodiakarai 95 Kodiakadu 30 VC Periakuthagai 30 VC Thethakudi south 15 VC Pushpavanam (Near Marapalam) 15 Periakuthagai RF (Reserved Forest) 5 VC Kallimedu 70 Talainayar RF (Reserved Forest) 30 Maharajapuram east (Opp to Adapar st cut) 70 Vandal – Velankani (Thalainayar Road) 60 Oradiampakkam-Umblacherry (Between Thalainayar Velankani Road)
60
VC Vezhakulam-Thirukulam 35 Vellapallam-Pidarikulaum (Near Thalainayar RF) 50 Karapidagai South 110 Karapidagai North 90 Chinnathumbur 15 Periathumbur 10 Thalaiyamazhai 50 Thandankulam Pond 12 Vettaikaran Iruppu (Near Lawford St Cut ECR both sides) 250 Vilunthamavadi (Near Chkilian Vaikal St Cut ECR both sides) 120 Kannithoppu (ECR both sides between Thirupoondi Kilapadagai-Kannithoppu-Kameshwar Road)
550
Vellaiyar St Cut-Periathumbur 25 Vadakadu (Near Muthupet RF) 50
Total Area Under Shrimp farming 2307 Active Shrimp Farming Area as on March 2014 (60%) 1384
Source: Primary information from farmers and associations
Note: VC denotes Vedharanyam canal

123
7.3 Water Use The average evaporation and infiltration water losses from shrimp ponds are
about 1,500 mm/yr and 2,000 mm/yr respectively, totaling 35,000 m3/ha/year. (M. C. J.
Verdegem and R. H. Bosma / Water Policy 11 Supplement 1 (2009) 52–68). Various
techniques help to reduce infiltration and floating macrophytes or synthetic reflection
covers can diminish evaporation. Unfortunately, such techniques are difficult or costly to
apply; hence farmers seldom try to control infiltration or evaporation losses. The most
practical option to reduce relative water wastage in ponds is to increase the production
per unit surface area, that is to increase the stocking rate.
7.4 Future Development of Shrimp Farms Future development of shrimp farms is dependent on regulations, international
markets and other factors. Inland, the area of shrimp farms may increase due to the
environment being suitable and the high returns when compared to agriculture. In the
coastal zone, only 60% of shrimp farms are currently being utilised and so any future
growth is likely to initially utilize the dormant 40% (about 923 ha). The new tail end
regulators proposed under CASDP Project will provide more fresh water, which could be
used to re-activate about 277 ha (or 30 %) of the inactive shrimp farms.
7.5 Best Management Practices Many aspects contribute to BMP (Best Management Practices) for shrimp
farming. Of primary concern to the protection of water resources are the following:
Aquaculture should be correctly positioned and practiced according to the
suitability of the water resource, any zoning implications, and the integration of the aquaculture activities with other uses of the same water resource;
Quantitative control measures should be put in place to limit production to levels that can be sustained by the water resource;
Effluent discharge and waste control, as these relate to the water resource, should be controlled and monitored;
Consideration should be given to infrastructure safety and the impact of aquaculture infrastructure on other users of common water resources;
Systems should be in place for the detection of water resource degradation and negative impacts on other water resource users;
A clear understanding should be developed regarding accountability associated with the entitlement and authorisation of the sustainable use of water for aquaculture; and
Attention should be given to the potential impact of aquaculture chemicals, feeds, diseases and exotic organisms on water resources.

124
8 Horticulture Horticultural production in the three districts in the Cauvery delta (Thanjavur,
Thiravarur, Nagapattinam) is very small when compared to the production rice or pulses
and other field crops. Horticultural crops are grown on less than 2% of the land area of
the three districts. The main horticultural crops are fruits (especially bananas), vegetables,
plantation crops, spices and condiments. There is scope to expand horticultural
production to meet the needs of the increasing urban population and to be a factor in crop
diversification but it will take decades to change the dominant rice culture of farmers.

125
9 Others In the south-east corner of the Vennar System at the southern end of the
Vedharanyam Canal, there is an extensive area of salt production, based on the hyper-
saline waters of the eastern sea lagoon on the south coast of the Cauvery delta. Salt has
been produced in this location for centuries. The Vedharanyam Canal was built to
facilitate movement of salt from the salt fields by barge to Nagapattinam Port, for
distribution throughout India. This Project will not impact salt production or the salt
fields.

126
10. Water Demand 10.1 State level At the macro level, the State Framework Water Resources Plan (Government of
Tamil Nadu, 2012) places the annual water availability of surface and ground water at
46,540 MCM (1643 TCM) while the demand is assessed as 54,395 MCM (1921 TCM) in
2001. The demand is projected to go up to 57,725 MCM (2021 TCM) by 2050. The
major demand comes from agriculture, domestic and industry.
While the demand for agriculture is likely to remain at 35,917 MCM (1268 TCM)
in the foreseeable future, rapid urbanization will place heavy stress on domestic use,
which is projected to increase by more than 50 per cent from 2222 MCM (78 TCM) in
2001 to 3460 MCM (122 TCM) in 2050.
Industrial water demand is projected to increase by 27 per cent from 1555 MCM
(55 TCM) in 2001 to 1985 MCM (70 TCM) by 2050. Thermal power plants account for
the highest proportion of industrial water use. Other industries include chemicals,
distilleries, oil refinery, textile dyeing, steel, fertilisers, pharmaceuticals, petrochemicals,
paper and pulp, sugar, electroplating etc. The Government of Tamil Nadu has indicated
that water security, i.e. provision of drinking water to the people will be the highest
priority of the Government. The State Framework Water Resources Plan also states that
about 3.5% (1600 MCM) (56.5 TCM) would be kept aside for minimum flow in rivers
for ecological purpose by 2050.
10.2 Basin level As at the state level, water demand in the river basins of Tamil Nadu can be
grouped under three major categories i) water for agriculture and allied livelihood
supporting activities, ii) water for drinking and iii)water for commerce and industries.
While irrigation is primarily controlled and managed by the Water Resources
Department, the constitutional amendments made in 1986 (73rd and 74th amendments of
the constitution of India) empower the local governments (both urban and rural) to
undertake drinking water service delivery.

127
WRD identified eight key environmental concerns in the 17 river basins in the
state (State Framework for Water Resources Plan, GoTN, 2010). The concerns are i)
catchment degradation ii) siltation iii) excessive surface water extraction iv) seawater
intrusion v) municipal sewage pollution vi) industrial affluent pollution vii) weed
growth and viii) water logging & salinity. Based on the magnitude of the environmental
problem, the concerns in each basin were placed into one of three categories: i) severe,
ii) moderate and iii) insignificant.
For the key environmental concerns are shown in Table 10.1. The magnitude of
the impact of each of these concerns was classified as “severe” for six of the eight
concerns, and ‘insignificant’ for the other two concerns. There were no environmental
concerns categorized as ‘moderate’. The environmental concerns in the Vennar system
areare similar to those in Cauvery basin, and some of these concerns including sea water
intrusion, weed growth, over-abstraction of groundwater, water logging and salinity will
be addressed during CASDP.
Table 10.1: Key environmental concerns in Cauvery Basin
Environmental Concern Assessment Environmental
Concern Assessment
Catchment degradation Severe Municipal sewage Severe
Siltation Severe Industrial effluent Severe
Over extraction GW Insignificant Weed growth Severe
Sea water intrusion Severe Water logging and salinity
Insignificant
Source: State Framework for Water Resources Plan, GoTN, 2010 10.3 Agricultural Demand in Vennar System
The crop water requirements for the main paddy crops are shown in Table 10.2.

128
Table 10.2 Gross Crop Water Requirements (CWR)
Month Paddy Kuruvai/Samba/
Thaladai (mm)
Paddy Kuruvai/Samba/
Thaladai with SRI (1)
(mm)
Dry (grains
& pulses)
monsoon (mm)
Dry (grains
& pulses) summer (mm)
Jan
110
Feb
285
Mar
320
Apr
115
May
Jun
Jul 80 77 35
Aug 295 283 97
Sep 304 292 95
Oct 295 283 65
Nov 121 114
Dec
Total 1095 1049 292 830 Less effective rainfall (mm) 482 462 129 365
Total Net CWR (mm) 613 587 163 465
Note (1) SRI : System of Rice Intensification
(2) Ratio of Effective rainfall to total CWR to = 0.44
Source: CROPWAT (FAO)
The water consumption per unit area of crop is summarised below in Table 10.3.
Climate projections for the Cauvery delta made during the PPTA (Srinivasan, 2013)
suggest that the impact of climate change will be to reduce crop water consumption by
6.7% based on projected changes up to 2050 (see Agriculture Systems Report, DFR
Document Nr:19).
Table 10.3: Water Consumption for Main Vennar System Crops
Crop name Diversion at headworks Water consumed
m³/ha m³/ha
Dry (non-paddy grains and pulses) July-December 3,490 1,634
Dry (non-paddy grains and pulses) January-April 0 4,646
Paddy Kuruvai/Samba/Thaladai July-November 18,328 6,131
Paddy Kuruvai/Samba/Thaladai (SRI) July-November 13,838 5,877
Source: Mott MacDonald 2014

129
System water requirements have been calculated for six scenarios and are presented in
Tables 10.4 and 10.5. The six scenarios are:
(i) The existing cropping pattern based on cropping patterns for coastal area of
Vennar System using surface water;
(ii) The existing cropping pattern based on cropping patterns for inland area of
Vennar System where there is conjunctive use of surface and groundwater;
(iii) An increase in the cultivation of SRI paddy replacing traditional paddy cultivation
by 25% in coastal area of system;
(iv) An increase in the cultivation of SRI paddy replacing traditional paddy cultivation
by 25% in inland area of system;
(v) No paddy cultivation across the whole system with the cultivation of semi-dry
crops instead of paddy;
(vi) Improved paddy cultivation using 25% SRI paddy impacted by climate change anticipated in year 2050 for the whole system.
Table 10.4: Water Requirements for Selected Cropping Patterns
Current CP Coastal (i) Current CP Inland (ii) Future CP SRI Coastal (iii)
Area Area Water Vol
Area Area Water Vol
Area Area Water Vol
Crop % ha Mm³ % ha Mm³ % ha Mm³
Semi-dry July-November
0 0 0 0 0 0 0 0 0
Semi-dry January-April
15 12,900 111 40 34,400 296 15 12,900 111
Paddy Kuruvai/Samba/ Thaladai July-
November
100 86,000 1,576 90 77,400 1,419 75 64,500 1,182
Paddy Kuruvai/Samba/ Thaladai (SRI) July-November
0 0 0 0 0 0 25 21,500 298
Total area (gross) 115 98,900 1,687 130 111,800 1,715 115 98,900 1,591
Total area (net) 100 86,000 - 100 86,000 - 100 86,000 -
Note: total irrigated cropland in the Vennar System of 172,000 ha is allocated to 50% as inland (86,000 ha) and 50% as coastal
(86,000 ha), based on available data.
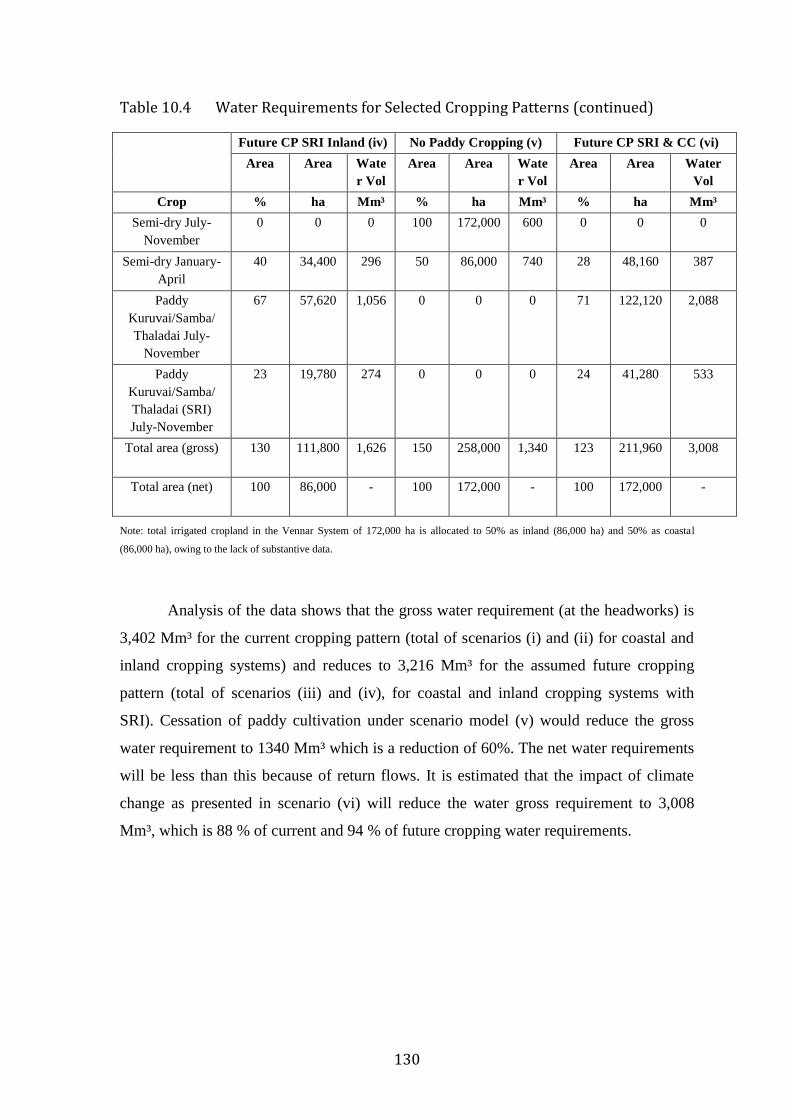
130
Table 10.4 Water Requirements for Selected Cropping Patterns (continued)
Future CP SRI Inland (iv) No Paddy Cropping (v) Future CP SRI & CC (vi)
Area Area Water Vol
Area Area Water Vol
Area Area Water Vol
Crop % ha Mm³ % ha Mm³ % ha Mm³
Semi-dry July-November
0 0 0 100 172,000 600 0 0 0
Semi-dry January-April
40 34,400 296 50 86,000 740 28 48,160 387
Paddy Kuruvai/Samba/ Thaladai July-
November
67 57,620 1,056 0 0 0 71 122,120 2,088
Paddy Kuruvai/Samba/ Thaladai (SRI) July-November
23 19,780 274 0 0 0 24 41,280 533
Total area (gross) 130 111,800 1,626 150 258,000 1,340 123 211,960 3,008
Total area (net) 100 86,000 - 100 172,000 - 100 172,000 -
Note: total irrigated cropland in the Vennar System of 172,000 ha is allocated to 50% as inland (86,000 ha) and 50% as coastal
(86,000 ha), owing to the lack of substantive data.
Analysis of the data shows that the gross water requirement (at the headworks) is
3,402 Mm³ for the current cropping pattern (total of scenarios (i) and (ii) for coastal and
inland cropping systems) and reduces to 3,216 Mm³ for the assumed future cropping
pattern (total of scenarios (iii) and (iv), for coastal and inland cropping systems with
SRI). Cessation of paddy cultivation under scenario model (v) would reduce the gross
water requirement to 1340 Mm³ which is a reduction of 60%. The net water requirements
will be less than this because of return flows. It is estimated that the impact of climate
change as presented in scenario (vi) will reduce the water gross requirement to 3,008
Mm³, which is 88 % of current and 94 % of future cropping water requirements.
131
10.4 Water Demand for Aquaculture 10.4.1 Present Water Use Shrimp farming is the major aquaculture in the Vennar System. Shrimp
production requires a constant depth of 1m to 1.2 m/ha. An average of 75 % additional
water is required to maintain the required to depth during the 120 days of the shrimping
season. Thus, with two shrimp harvestsharvests per year, the annual water requirement is
35,000 m3
In the Vennar System, the area of ponds actively producing L.vennamei, the only
species of shrimp used commercially, is 1884 ha (1384 ha on the coast and 500 ha
inland), which computes to an annual water requirement of 48 Mm3 (1.73 TMC) in
coastal areas and 18 Mm3 (0.9 TMC) inland. 43% of the total water requirement is
actually consumed during production while 57% is returned as drainage downstream.
Therefore, the annual volume of water used in shrimp production is 28 Mm3 (1.0 TMC).
10.4.2 Future Water Use Future aquaculture production is extremely vulnerable to regulations,
international markets, and other factors. Considering these variables, future ndemand
could be:
In 5 years (by 2020), if L.vennamei production continues to be viable, the
estimated increase in the area of shrimp farming will be 5000 ha inland, with land
being converted fromproductive agriculture. The increase in demand will require
175 Mm3 (6.25 TMC) of which 75 Mm3(2.7 TMC) would be consumed
In the coastal zone, the area under shrimp farming has covered almost all the
potential area for shrimp culture, and there are few opportunities to add more
area, expansion in the area of ponds is elikely to be small or negligible.
Currently, there are 923 ha of inactive shrimp farms on the coast because of land
ownership, water quality, soil texture, or social problems. The newtail end
regulators proposed under CASDP Project will make more fresh water, available
which may activate about 277 ha (30 %) of the inactive farms and increase their
productivity.

132
10.5 Power Generation
Use of water in a thermal coal-fired plant is estimated to be in the range of 1.7 to
8.0m3 per MW of power production (Source: Water Balance and Water Conservation in
Thermal Power Stations, Bulletin on Energy Efficiency, Volume 7, Issue 3, December
2006). This puts the total water demand for thermal power plants in the two districts (as
shown in Table 14.1) at a minimum of 16,923 m3 and a maximum of 79,640 m3 per day,
of which 98% is seawater.
10.6 Industry
The TWAD Board Act, 1970 has a provision to execute water supply and
sewerage schemes for industries and institutions. The schemes are executed by the Board
on a commercial basis. The current industrial water supply and the quantity allotted under
the jurisdiction of the Chief Engineer (Thanjavur Circle, TWAD) are shown in Table
10.5.
Table 10.5: Industrial Water Supply
Industry Water source Quantity (litres/day)
TNEB Gas Plant CWSS to Gas Based power project and 77 habitations and Kuthalam UTP in Thanjavur and Nagapattinam Districts
225,000
LANCO (Aban) Power Plant
CWSS to TNEB Gas plant and 77 habitations in Kuthalam Union
100,000
SIDCO Thuvakudi, SIDCO, Valavanthankottai and Food Craft, Thuvakudi
CWSS to Thiuverumbur UTP, Thuvakudi Municipality, Koothappar RTP and 97 other habitations in Thiruverumbur union and 17 private beneficiaries in Trichy District
1,294,000
SIPCOT and Indian Oil Corporation
CWSS to Pudukkottai Municipality, 3 Town panchayats and 15 habitations in Pudukkottai, Trichy and Karur districts
515,000
Total 2,134,000
Source: CE-TWAD Board, Thanjavur

133
The projected domestic and industrial water demand for 2025 is estimated to be
82.46 MCM. The district-wise break-down is indicated in the Table 10.6.
Table 10.6: Domestic and industrial demand District Demand in MCM (Year 2025)
Thanjavur 43.18
Thiruvarur 19.01
Nagapattinam 20.27
Total 82.46
Source: District Estimates, Technical Report Series, CGWB, 2008
10.7 Return flow from Domestic, Commercial and Industrial Water Use
The return flow of domestic, commercial and industrial use is likely to be in the
range of 10 to 30%.%1. There are no major industries in the Vennar sub-basin that
require industrial effluent treatment. However, a number of polluting industries such as
tanneries, chemical and textiles are located upstream of Mettur Dam. The Government of
Tamil Nadu is making an effort to control pollution in Cauvery basin by imposing a ban
on setting up of highly polluting new industries within a radius of five km from the river.
(Source: Tamil Nadu Development Report, 2005, Planning Commission, Government of
India).).
10.88 Drinking water demand:
The population in the three project districts is estimated to grow between 8 to
10% between 2011 and 2021. The population in 2011 and the projected population
(2021) are provided in Table 10.7.
Table 10.7: Projected population of the three Vennar System Districts
District Population (2011) Projected population (2021)
Thanjavur 2,402,781 2,425,025
Thiruvarur 1,264,277 1,390,705
Nagapattinam 1,488,839 1,637,725
Total 5,155,897 5,453,455 Source: Growth of Population Density, T. Sangeetha and R Baskaran, Department of Earth Sciences, Tamil University, Thanjavur, 2010 . District Estimates, Technical Report Series, CGWB, 2008. TWAD Board, Thanjavur, 2011.
1 Prediction of irrigation return flows through a hierarchical modelling approach, Dr. S. Mohan and Vijayalaxmi DP, Department of Civil Engineering, Indian Institute of Technology, Chennai

134
Table 10.8 summarizes the habitations and towns covered by the TWAD Board in
the Vennar system and the source of the water. Cauvery and Coleroon are the two
important rivers from where water is sourced primarily using infiltration wells. In some
locations surface water is supplanted by drawing water from groundwater sources.
Table 10.8 Drinking water status and surface source
District Villages Habitations Drinking water status Towns Surface source for
drinking water
Thanjavur 589 3902 Fully covered=3748 Partly covered=154
25 Cauvery and
Coleroon
Thiruvarur 430 2582 Fully covered=2521 Partly covered=61
11 Cauvery
Nagapattinam 434 2872 Fully covered=2521 Partly covered=351
13 Coleroon
Total for Vennar system
1019 9356 8900 49
Source: TWAD Thanjavur, 2011
The TWAD Board sources drinking water from 8 schemes in Thanjavur and 8
schemes in Thiruvarur and Nagapattinam at a total rate of 236.81 MLD. With increasing
population and increased per capita consumption, the situation is likely to change
significantly and the estimated demand in 2021 will increase by 15 to 20%.
10.9 Summary of Demand
The water demand in the Vennar System is summarised in Table 10.9. Table 10.9 Annual Water Demand
Demand (Mm3)
Irrigation Aquaculture Industrial and domestic
Power Total
Present 5007 66 75 18 5166
Future 4740* 241 83 18 5082
Climate Change 4427* 265 99 18
Note: * Demand reduced due to farmers changing to SRI (see Section 10.3)

135
11. Impact of Proposed Works
11.1 Project and Adjoining Areas
The Cauvery River basin is located in Karnataka, Kerala and Tamil Nadu States
and the enclave of Karaikal in the Union Territory of Pondicherry.
At the Upper Anicut (barrage), 177 km downstream from Mettur dam, the
Cauvery River splits into two branches, the Coleroon and Cauvery Rivers. The Coleroon
River is used to irrigate the northern extremities of the delta and also serves as a flood
carrier.
On the Cauvery River some 30 km downstream of the Upper Anicut, is the Grand
Anicut, where head regulators divide the flow between the Cauvery System, Vennar
System and Grand Anicut Canal System. At the Grand Anicut, surplus flows including
flood flows are diverted through the Ullar channel to the Coleroon. A particular feature of
the Cauvery Delta systems is that the rivers are used to supply irrigation water as well as
to remove drainage water.
The Vennar System has seven head regulators at major river bifurcation points. It
has a number of intermediate regulators, that facilitate the distribution of irrigation flows,
and tail-end regulators that serve the multipurpose of raising water levels to provide
irrigation to low lying command areas and preventing tidal backwater flows into the
system.
Along the eastern coast from Point of Calimers to Nagapattinam, the
Vedharanyam Canal was constructed between 1863 and 1867 as a navigation canal to
transport salt produced in the area south of Thopputharai to the port at Nagapattinam in
the north. Between the Venharanyam Canal and the east coast there is a 3-4 km strip of
sand dunes. Five straight cuts were constructed through the sand dunes to directly link the
Vedharanyam Canal to the sea to supplement the flow through two ‘natural’ outlets at
Vedharanyam in the south and Velankanni in the north. Sections of the Vedharanyam
Canal and some of the straight cuts are heavily silted and sand bars have developed at the
outfalls which obstruct flow to the sea. The canal is no longer used for navigation and is
now solely a drainage carrier for the east bound rivers of the Vennar system. There is
however a government proposal to re-establish navigation on the Vedharanyam Canal.

136
On the southern coast along the Palk Strait from Point Calimers to
Adirampattinam the rivers of the Vennar System cross 4-6 km of tidal sand/mud flats
into one of two large sea lagoons that are connected to the sea through 1-2 km wide
openings. The sea lagoons are an ecologically sensitive area, in part because on the
western side there is the largest extent of mangrove forest in Tamil Nadu.
Outflows from the river channels to the sea are influenced by tidal patterns and
storm surges related to cyclones and tropical depressions and, on rare occasions,
tsunamis. The normal tidal range is relatively small being about 0.6 m. A study of tides
carried out during the PPTA (Dastgheib and Ranasinghe,2014) indicates that sea level is
expected to rise between 0.87 m (high scenario) and 0.29 m (low scenario) and that the
100-year storm surge is approximately 0.74m.
11.2 Project Description and Proposed Works
This Project covers six rivers/drains of the Vennar System, namely the
Pandavayar, Velliayar, Harichandra, Adappar, Valavanar and Vedharanyam. The
proposed works include re-sectioning which includes widening, desilting, removal of
vegetation, smoothening of undulating river bed, standardisation of river banks, and
protection of banks against slides etc.; reconstruction of severely damaged structures,
repairs/rehabilitation of damaged structures, and construction of new structures- the tail
end regulators retaining walls and gated structures at open drainage in-falls in particular.
11.3 Aims and Objectives of the Proposed Works
The main focus of the works is to contain flood waters within the river channels
and prevent bank overtopping and slides. The works will also help to prevent backflow of
flood water into drainage catchments through open in-falls and allow quicker drainage of
water accumulated in the catchments, once the water levels in the rivers decrease. The
standardised banks also provide better access for rescue and relief operations in floods
and for operation and maintenance of various control structures. The works will result in
better management of floods. Flattening of bank slopes, increased freeboard and top
width of the banks will make them sustainable even if flow rates increase as a result of
climate change. Similarly, the river system will be more resilient to sea level rise.
It is envisaged to keep water deliveries for irrigation unchanged, but the repaired,
reconstructed and new irrigation structures will help WRD to manage irrigation deliveries
better. The storage of fresh water in river upstream of the new tail end regulators will
137
increase in availability of fresh water for irrigation in low lying areas by pumping
method.
11.4 Inter-state Aspects
The surface waters of Cauvery basin have been allocated among the basin states
and each state is free to use its share of water in the manner it deems appropriate. The
Mettur dam, in the upper reaches of the Cauvery river in Tamil Nadu, is the main storage
dam in the state. The proposed works do not envisage any change in water utilisation in
the Vennar basin. And thus there are no interstate aspects to the project.
11.5 Impact on Upstream Area
The outcome of this proposed Project works will be a decline in the duration and
levels of floods by increasing the carrying capacity of the channels to discharge
floodwaters more quickly to the sea. This Project will not impact upstream areas or
projects.
11.6 Impact on Downstream area
This Project works cover the entire lengths of the Pandavayar, Velliayar,
Harichandra, Adappar, Valavanar and Vedharanyam channels from their head regulators
to their the open sea to the south. The works are expected to improve drainage and may
even enhance the volume of water being released to the sea lagoons which would benefit
the mangrove forest.

138
12. Interstate and International Aspects The Cauvery River is not an international river. It is however an interstate river
involving Karnataka, Kerala, Tamil Nadu & the Karaikkal District of the Union Territory
of Pondicherry. Allocation of the surface water resources of the Cauvery Basin between
the states has been a contentious issue for many years and the subject of prolonged
tribunal proceedings. In 2007, the Cauvery Water Disputes Tribunal determined that the
water yield of the Cauvery Basin in a normal year is 740 TMC and made annual
allocations of 419 TMC to Tamil Nadu, 270 TMC to Karnataka, 30 TMC to Kerala, 7
TMC to Pondicherry and reserved 14 TMC for environmental protection and flow to the
sea.
The project will not affect these allocations. Indeed in some respects the project is
a consequence of the long tribunal proceeding and the strict water quotas given.
12.1 Agreements:
By the end of 19th century, the Mysore Government began taking steps to
increase the irrigation from the Cauvery and its tributaries, which caused considerable
anxiety to the lower State of Madras (Tamil Nadu), which took up the case with the
Government of Mysore and Government of India. To safeguard the requirements of
Tamil Nadu, an Agreement was reached in 1892 to prevent construction of further works
by Mysore without the consent of Tamil Nadu. In 1924, another Agreement was reached
to construct Krishnarajasagar reservoir and other offset reservoirs in Mysore. The Rules
of Regulation framed to implement the 1924 Agreement prescribe the quantities of flow
to be let down for the use of the lower Riparian State viz., Tamil Nadu on a day-to-day
basis. The 1924 Agreement itself provides for reasonable uses by the upper riparian State
after ensuring the flows due to the lower riparian State. Under this Agreement, the States
are free to extend irrigation facilities effected solely by improvement of duty without any
increase of water use. The 1924 Agreement provides for a review at the end of 50 years,
only to see whether any further surplus quantities would be available beyond what has
been contemplated for use in that Agreement with a view to allocate such surplus.
By the order of the Cauvery Water Disputes Tribunal (CWDT), the 1892
and 1924 Agreements between the then Government of Madras and the Government of
Mysore so far as they related to the Cauvery river system have been superseded.
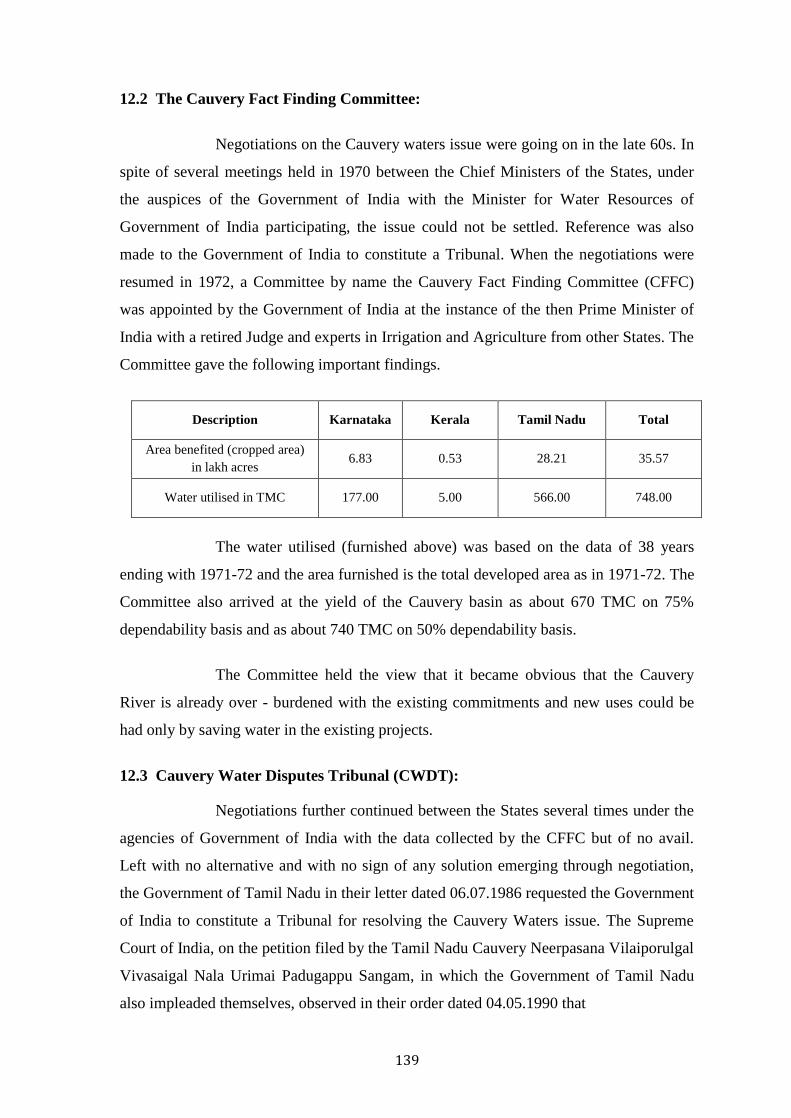
139
12.2 The Cauvery Fact Finding Committee:
Negotiations on the Cauvery waters issue were going on in the late 60s. In
spite of several meetings held in 1970 between the Chief Ministers of the States, under
the auspices of the Government of India with the Minister for Water Resources of
Government of India participating, the issue could not be settled. Reference was also
made to the Government of India to constitute a Tribunal. When the negotiations were
resumed in 1972, a Committee by name the Cauvery Fact Finding Committee (CFFC)
was appointed by the Government of India at the instance of the then Prime Minister of
India with a retired Judge and experts in Irrigation and Agriculture from other States. The
Committee gave the following important findings.
Description Karnataka Kerala Tamil Nadu Total
Area benefited (cropped area) in lakh acres
6.83 0.53 28.21 35.57
Water utilised in TMC 177.00 5.00 566.00 748.00
The water utilised (furnished above) was based on the data of 38 years
ending with 1971-72 and the area furnished is the total developed area as in 1971-72. The
Committee also arrived at the yield of the Cauvery basin as about 670 TMC on 75%
dependability basis and as about 740 TMC on 50% dependability basis.
The Committee held the view that it became obvious that the Cauvery
River is already over - burdened with the existing commitments and new uses could be
had only by saving water in the existing projects.
12.3 Cauvery Water Disputes Tribunal (CWDT):
Negotiations further continued between the States several times under the
agencies of Government of India with the data collected by the CFFC but of no avail.
Left with no alternative and with no sign of any solution emerging through negotiation,
the Government of Tamil Nadu in their letter dated 06.07.1986 requested the Government
of India to constitute a Tribunal for resolving the Cauvery Waters issue. The Supreme
Court of India, on the petition filed by the Tamil Nadu Cauvery Neerpasana Vilaiporulgal
Vivasaigal Nala Urimai Padugappu Sangam, in which the Government of Tamil Nadu
also impleaded themselves, observed in their order dated 04.05.1990 that

140
"26 attempts within a period of four to five years and several more adjournments by this court to accommodate these attempts for negotiation were certainly sufficient opportunity and time to these two States at the behest of the Centre or otherwise to negotiate the settlement. Since these attempts have failed, it would be reasonable undoubtedly to hold that the dispute cannot be settled by negotiations........." and directed the Central Government to constitute a Tribunal within one month for
resolving the Cauvery Water Dispute. In pursuance of this, the Government of India
constituted the Cauvery Water Disputes Tribunal (CWDT) and notified it on 02.06.1990.
The CWDT had its first sitting on 27.07.1990 when the Government of
Tamil Nadu approached it with a petition seeking an Interim Order to restrain the State of
Karnataka from proceeding with their new projects and also to ensure flows to Tamil
Nadu on a monthly basis to safeguard its irrigation, making out a case that the flows to
Tamil Nadu were already dwindling with Karnataka impounding what all they get in their
rivers in their new reservoirs until they are full, and taking a stand that 1924 Agreement
has expired in 1974 and hence Tamil Nadu should be fortified with some Interim Orders
until the CWDT gives its final decision. The CWDT pronounced its Interim Order on
25.06.1991, in which the State of Karnataka was directed to release water from its
reservoirs so as to ensure 205 TMC at the Mettur reservoir in a year from June to May in
a prescribed monthly pattern, of which 6 TMC is to be given to the Karaikal region of the
Union Territory of Puducherry. The Tribunal also directed that Karnataka shall not
increase its area under irrigation beyond the existing 11.2 lakh acres as mentioned in the
K-V statement the Karnataka has filed before the Tribunal.
The Tribunal continued its deliberations. The basin States filed their
Statements of Case with counters and rejoinders and all the technical information called
for. The States also produced their expert witnesses as per the directions of the Tribunal.
In all, 20 witnesses (Tamil Nadu - 9, Karnataka - 6, Kerala - 4 and Puducherry - 1) were
presented and they were extensively cross - examined. The cross examination started in
January 1994 and ended in December 2001. The depositions and cross examination
recordings run to more than 5000 pages. Thereafter the parties advanced their arguments
and counter arguments which were concluded in April 2006. The Tribunal gave its final
Order and Report as per Section 5 (2) of the ISRWD Act on 05.02.2007.
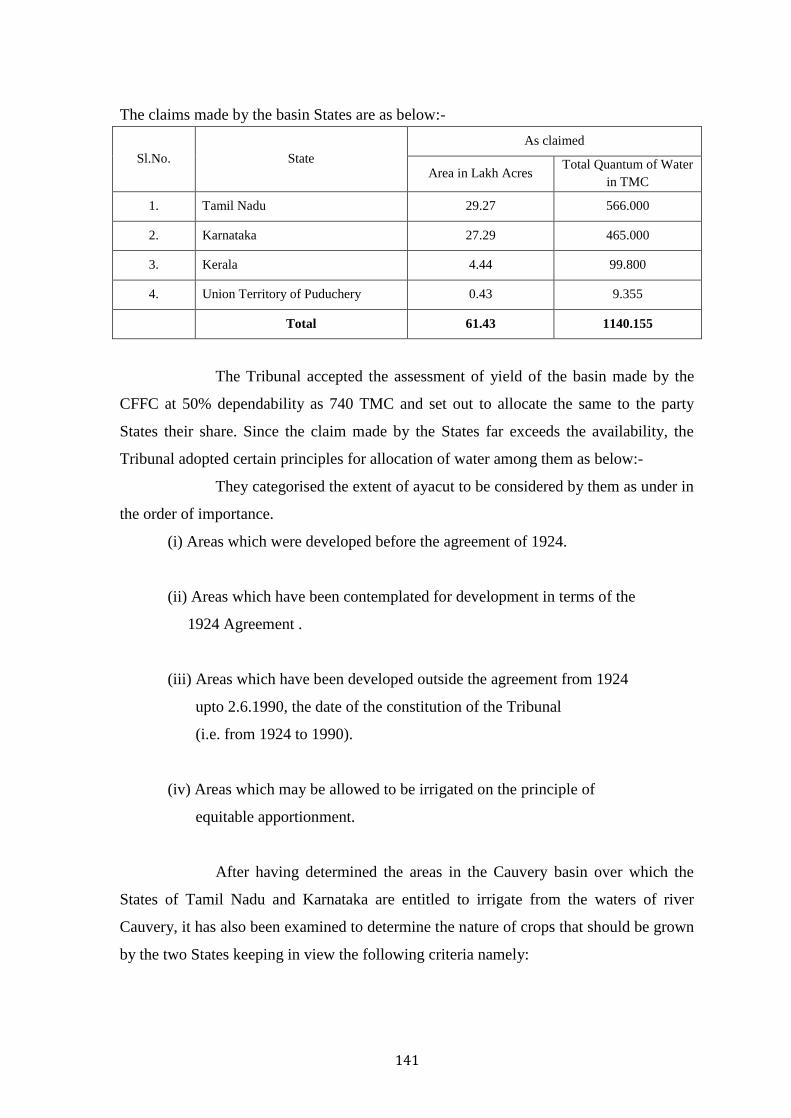
141
The claims made by the basin States are as below:-
Sl.No. State As claimed
Area in Lakh Acres Total Quantum of Water
in TMC
1. Tamil Nadu 29.27 566.000
2. Karnataka 27.29 465.000
3. Kerala 4.44 99.800
4. Union Territory of Puduchery 0.43 9.355
Total 61.43 1140.155
The Tribunal accepted the assessment of yield of the basin made by the
CFFC at 50% dependability as 740 TMC and set out to allocate the same to the party
States their share. Since the claim made by the States far exceeds the availability, the
Tribunal adopted certain principles for allocation of water among them as below:-
They categorised the extent of ayacut to be considered by them as under in
the order of importance.
(i) Areas which were developed before the agreement of 1924.
(ii) Areas which have been contemplated for development in terms of the
1924 Agreement .
(iii) Areas which have been developed outside the agreement from 1924
upto 2.6.1990, the date of the constitution of the Tribunal
(i.e. from 1924 to 1990).
(iv) Areas which may be allowed to be irrigated on the principle of
equitable apportionment.
After having determined the areas in the Cauvery basin over which the
States of Tamil Nadu and Karnataka are entitled to irrigate from the waters of river
Cauvery, it has also been examined to determine the nature of crops that should be grown
by the two States keeping in view the following criteria namely:

142
(i) No note need be taken of the double crop / perennial crop de hors what is
specifically provided in the 1924 Agreement.
(ii) No area for summer paddy need be considered; and
(iii)The area under summer paddy existing prior to 1924 if any may be
allowed a semi-dry crop.
The area permitted and the quantum of water as apportioned by the Tribunal is as
below:-
Area in lakh acres Water requirements in TMC
Description
States
Kerala Karnataka Tamil Nadu
UT of
Puducherry Total
i) Area 1.93 18.85 24.71 0.43 45.92
ii) Irrigation requirement 27.90 250.62 390.85 6.35 675.72
iii) Domestic & industrial water requirement projected for 2011
0.35 1.85 2.73 0.27 5.20
iv) Water requirement for environmental protection
- - - - 10.00
v) Inevitable escapages into sea
- - - - 4.00
vi) Share in balance water (based on population)
1.51 17.64 25.71 0.22 45.08
Total 29.76 270.11 419.29 6.84 740.00
30.00 270.00 419.00 7.00 726.+14
=740.0
The Tribunal also directed that "the use of under groundwater by any
riparian State and UT of Puducherry shall not be reckoned as use of the water of the river
Cauvery." (Clause XII). They have however indicated that the States may have to plan
for use of groundwater to meet at least 50% of their drinking water needs and provided
surface water for drinking waters only for 50% of the need, based on population.
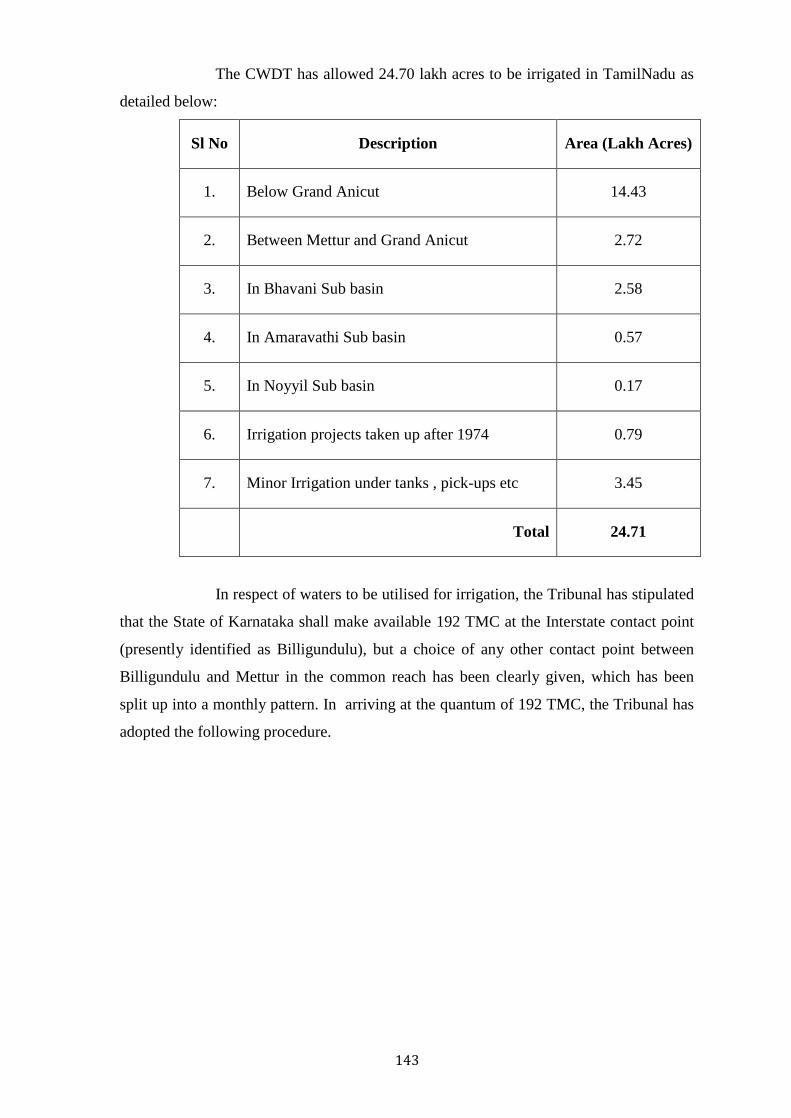
143
The CWDT has allowed 24.70 lakh acres to be irrigated in TamilNadu as
detailed below:
Sl No Description Area (Lakh Acres)
1. Below Grand Anicut 14.43
2. Between Mettur and Grand Anicut 2.72
3. In Bhavani Sub basin 2.58
4. In Amaravathi Sub basin 0.57
5. In Noyyil Sub basin 0.17
6. Irrigation projects taken up after 1974 0.79
7. Minor Irrigation under tanks , pick-ups etc 3.45
Total 24.71
In respect of waters to be utilised for irrigation, the Tribunal has stipulated
that the State of Karnataka shall make available 192 TMC at the Interstate contact point
(presently identified as Billigundulu), but a choice of any other contact point between
Billigundulu and Mettur in the common reach has been clearly given, which has been
split up into a monthly pattern. In arriving at the quantum of 192 TMC, the Tribunal has
adopted the following procedure.

144
Sl.
No Description TMC
1. Total yield of the basin at 50% dependability.(CFFC) 740
2. Yield at Mettur reservoir (CFFC) 508
3. Yield generated in Tamil Nadu area above Mettur reservoir
25
4. (a) Yield available below Mettur (740 - 508) 232
(b) Deducting following uses
(i)
Allocation to Kerala in
Bhavani sub basin 6
20 (ii) (Amaravathy) Pambar sub basin 3
(iii) Allocation to UT of Puducherry 7
(iv) Inevitable escapages into sea 4
20
(c) Balance available for use in Tamil Nadu (232-20) 212
5. Total water available for use in Tamil Nadu (212 + 25) 237
6. Allocated share of Tamil Nadu 419
7.
Balance to be made available at the Interstate contact point
(419 - 237)
182
8. Allocation for environmental protection to be made available at that point
10
9. Total delivery to be made at the Interstate border (182 + 10)
192
As per this procedure, the quantum of flows that would be available at
Mettur would work out as 217 TMC (i.e. 192 at Billigundulu + 25 between Billigundulu
and Mettur) annually exclusively for Tamil Nadu, as against 205 TMC given in the
Interim Order which includes 6 TMC for Puducherry. Out of the yield of 232 TMC below
Mettur, Kerala has been allocated 9 TMC (6 TMC in Bhavani and 3 TMC in Amaravathi)
and Union Territory of Puducherry 7 TMC. Also 4 TMC has been provided for
"inevitable escapages". Thus a quantity of 20 TMC has to be deducted from the yield

145
below Mettur. The quantity available to Tamil Nadu below Mettur will then be (232-20)=
212 TMC.
The total flow available to Tamil Nadu as per the Final decision of the
Tribunal will be 429 TMC which of course includes 10 TMC allotted for environmental
purposes. (419 + 10 TMC).
The CWDT in its final order has retained the cropping pattern in the
Cauvery Delta Zone ie. the Cauvery Delta System the Lower Coleroon Anicut System
and the Cauvery Mettur Project. In respect of other systems above grand anicut the
existing 2nd crop paddy has been replaced by semidry crops. The Irrigation season in
general has been restricted to June to January. The crops grown beyond 31st January will
have to be sustained with Ground Water.
The Cauvery Water Disputes Tribunal (CWDT) forwarded its final order to the
central government for further necessary action.
And Whereas, the Supreme Court has given its direction on 4th February 2013
which reads as under:
“Section 6 of the Inter State River Water Disputes Act, 1956 mandates the
Central Government to publish the decision of the Tribunal in the Official
Gazette. Although no time frame is provided for publication of such decision
by the Tribunal, but in absence thereof, publication has to be done within
reasonable time.
Since more than five years have already elapsed, we direct the Central
Government to publish in Official Gazette the final decision given by Cauvery
Water Disputes Tribunal dated the 5th February 2007 as early as may be
possible and in no case later than the 20th February 2013. Needless to say that
publication of the final decision of CWDT in Official Gazette shall be without
prejudice to the pending proceedings.”
Now, therefore, in exercise of the powers conferred by section 6 of the
said Act, the Central Government published the Order of the Tribunal in the Gazette of
India No. 373 / New Delhi, Tuesday, February 19, 2013 / Magha 30, 1934.

146
13. Canal System 13.1 Climate Resilient Adaptations in the Vennar System
13.1.1 Description of the Vennar Irrigation and Drainage System
The layout of the main channels and drains of the Vennar system is shown
schematically in Figure 13.1. Ten main river channels convey both irrigation and drainage
water and 10 other rivers are primarily drainage channels (for example, the Valavanar and
Nallar Drains).
The main channels of the Vennar System are old river channels that have been
modified and adapted over centuries to carry irrigation, drainage and flood flows. The
physical characteristics of the channels are very variable. Some reaches have a uniform
cross section and a straight alignment while the cross section of other reaches varies within
a short distance and the alignment is winding. Some reaches are overgrown with vegetation
while other reaches are quite open. Many reaches are not accessible by road on either bank.
Irrigation flows into the system come from releases from the Mettur Dam via the
Grand Anicut. Irrigation water is provided for varying periods each year as shown in Table
13-1. Releases are based on the availability of water in the reservoir at Mettur Dam, rainfall
in the system and the demands of farmers. Typical flows in the main channels during the
irrigation season are shown in Figure 13.2. Flows are adjusted throughout each period,
resulting in very variable inflows to the Vennar system at the VVR head regulator, as shown
in Figure 13.3.The changes in flow seems to be in response to the rainfall that is also shown
in Figure 13.3. Balancing the rainfall and irrigation requirements is certainly a major
challenge for WRD.
Water levels and flows in the main channels are managed by adjustable head
regulators (HER) and cross regulators (CRR) plus fixed weirs (bed dams (BED or grade
walls (GRW)). In addition, at the lower end of the channels, adjustable tail end regulators
(TER) manage drainage flows and prevent the backflow of seawater. Discharges are
calculated from the orifice equation using measured upstream water level, areas of gate
openings and number of gates open. For normal conditions, there is usually free (modular)
flow through the gates and use of the orifice equation is appropriate, but for higher flood
flows the gates may become submerged from downstream (non-modular flow) and the use

147
of the orifice equation may overestimate flows. Water levels are not measured along the
river channels or in the Vedharanyam Canal or in the straight cuts.
Irrigation water is distributed from the main channels to fields through irrigation
head sluices (IHS) located on the banks of the main channels. Irrigation head sluices have
one or more vertical moveable gates and are optimally located close to cross regulating
structures although many are remote and subject to variable channel water levels.
Downstream of irrigation head sluices, water is distributed through a network of smaller
canals and field channels distributing water to fields.
Drainage is provided by a network of field and collector drains connected to the
main channels. Flows from some drains to the main channels are managed by drainage
infall sluices (DIS) but many drains have open infalls with no structures.
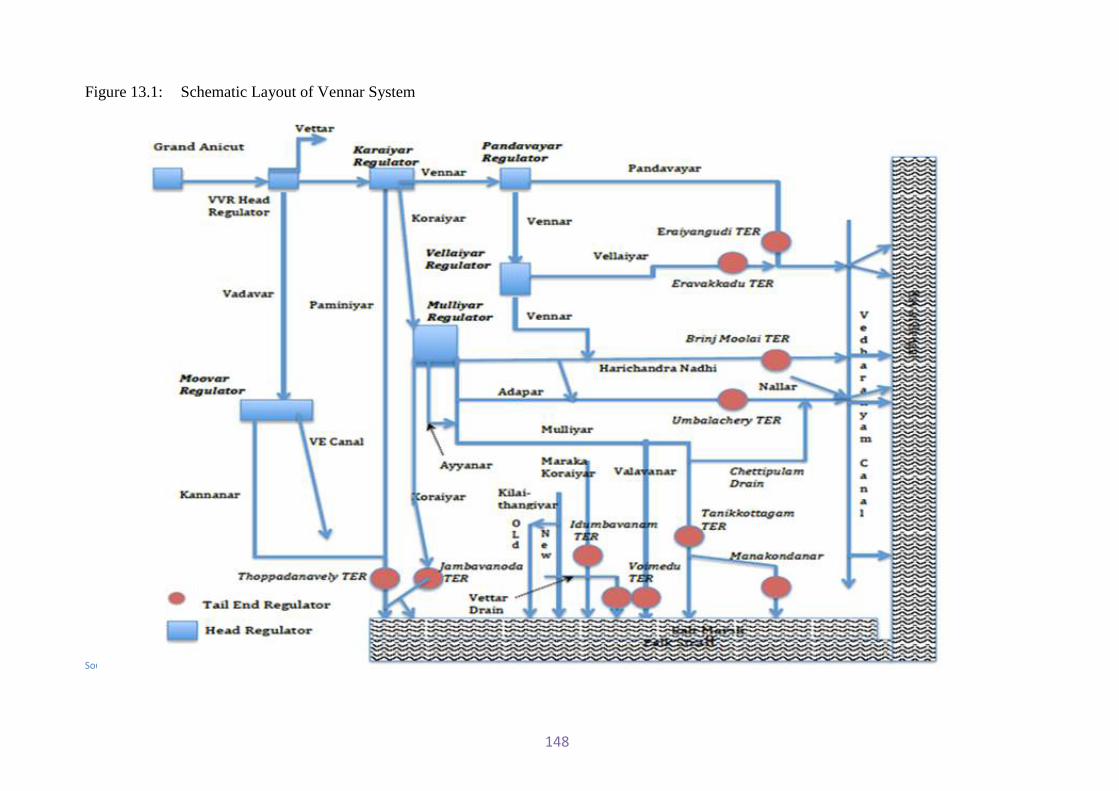
148
Figure 13.1: Schematic Layout of Vennar System
Source: Mott MacDonald

149
Figure 13.2 : Typical Irrigation Flows through Main Channels
Source: Mott MacDonald
1919 Cusecs
5491 Cusecs
1795 Cusecs
2454 Cusecs
730 Cusecs
120 Cusecs
28 Cusecs
1105 Cusecs
8867 Cusecs
576 Cusecs
459 Cusecs
789 Cusecs
456 Cusecs
62 Cusecs
879 Cusecs
561 Cusecs
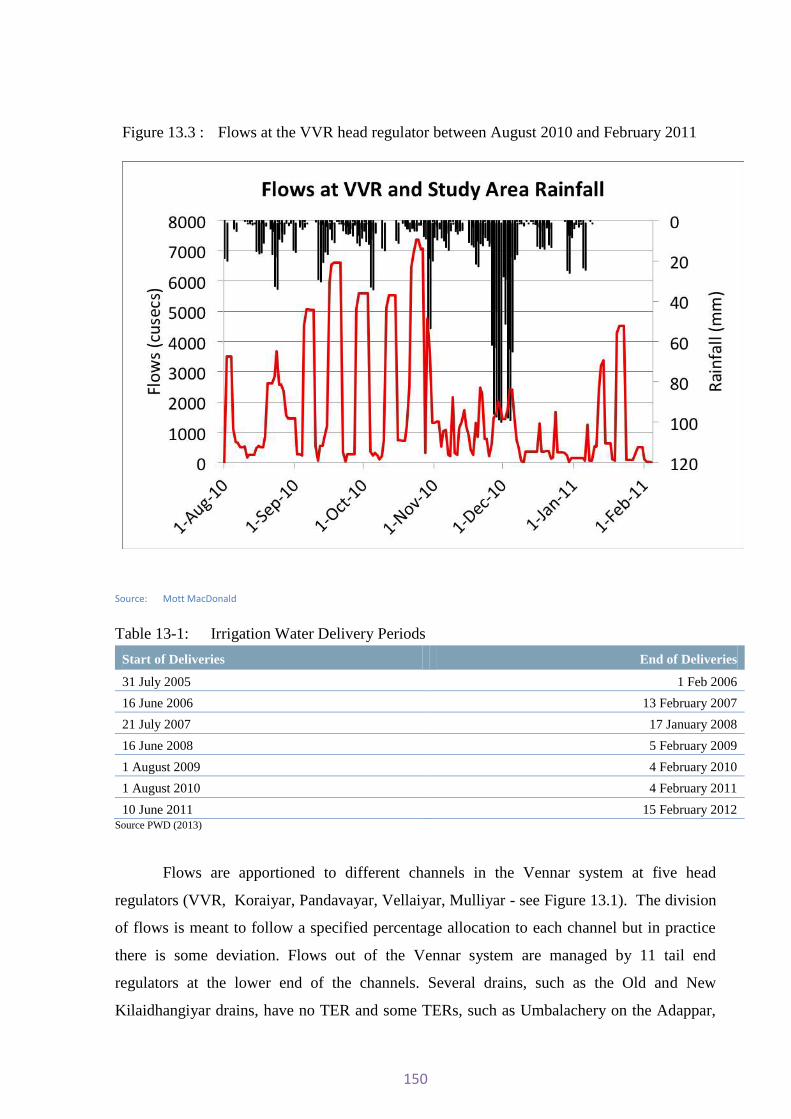
150
Figure 13.3 : Flows at the VVR head regulator between August 2010 and February 2011
Source: Mott MacDonald
Table 13-1: Irrigation Water Delivery Periods
Start of Deliveries End of Deliveries
31 July 2005 1 Feb 2006
16 June 2006 13 February 2007
21 July 2007 17 January 2008
16 June 2008 5 February 2009
1 August 2009 4 February 2010
1 August 2010 4 February 2011
10 June 2011 15 February 2012 Source PWD (2013)
Flows are apportioned to different channels in the Vennar system at five head
regulators (VVR, Koraiyar, Pandavayar, Vellaiyar, Mulliyar - see Figure 13.1). The division
of flows is meant to follow a specified percentage allocation to each channel but in practice
there is some deviation. Flows out of the Vennar system are managed by 11 tail end
regulators at the lower end of the channels. Several drains, such as the Old and New
Kilaidhangiyar drains, have no TER and some TERs, such as Umbalachery on the Adappar,
151
Brinj Moolai on the Harichandra and Thanikkottagam on the Mulliyar, are up to 10 km
upstream of the end of the channel. TERs are kept closed to back up water for irrigation head
sluices immediately upstream, except during the flood season (October to December) when
TERs are opened to allow floodwater to discharge to the sea.
13.1.2 Floods
During floods on the Cauvery River, floodwaters are diverted at the Grand Anicut into
the Coleroon River via the Ullar River and no flood flows are released into the Vennar
System. Hence, any flooding in the Vennar system originates from rain falling within the
system downstream of the Grand Anicut. A rare exception to this rule was in 2005, when the
Cauvery River reportedly breached its banks upstream of the Grand Anicut and flood water
by-passed to the south of the Grand Anicut, before flowing into the Vennar River between the
Grand Anicut and the VVR Head Regulator.
Although there are no planned flood releases into the Vennar at the Grand Anicut,
there can be significant flood flows in the Vennar at the VVR Head Regulator due to storm
drainage from five drains that outfall into the Vennar River between Grand Anicut and the
VVR Head Regulator. For example, on 28 November 2008, the flow in the Vennar at the
Katchamangalam check dam (chainage 11 km downstream of the Grand Anicut) was 14.2
m3/s (500 cusecs) but the flow increased to 841.7 m3/s (29,724 cusecs) at the VVR head
regulator (Chainage 55km downstream of the Grand Anicut). The five drains serve the area to
the south of the Vennar River and the Grand Anicut canal and to the west of Thanjavur city.
They cross the Grand Anicut canal through syphons. They are unregulated and flows are not
measured.
The contribution of flows from the five drains can be significant, as shown in Figure
13.4. Flows between 1 August and late October 2010 were greater at Katchamangalam
Anicut than at VVR indicating seepage losses along the channel. However from late October
through mid-December during the NE monsoon, flows were consistently higher at VVR than
at Katchamangalam indicating an inflow of drainage water along the reach. From mid-
December onwards, flows at Katchamangalam were again higher than flows at VVR,
although less was lost to seepage, due in part probably to the catchment being saturated.
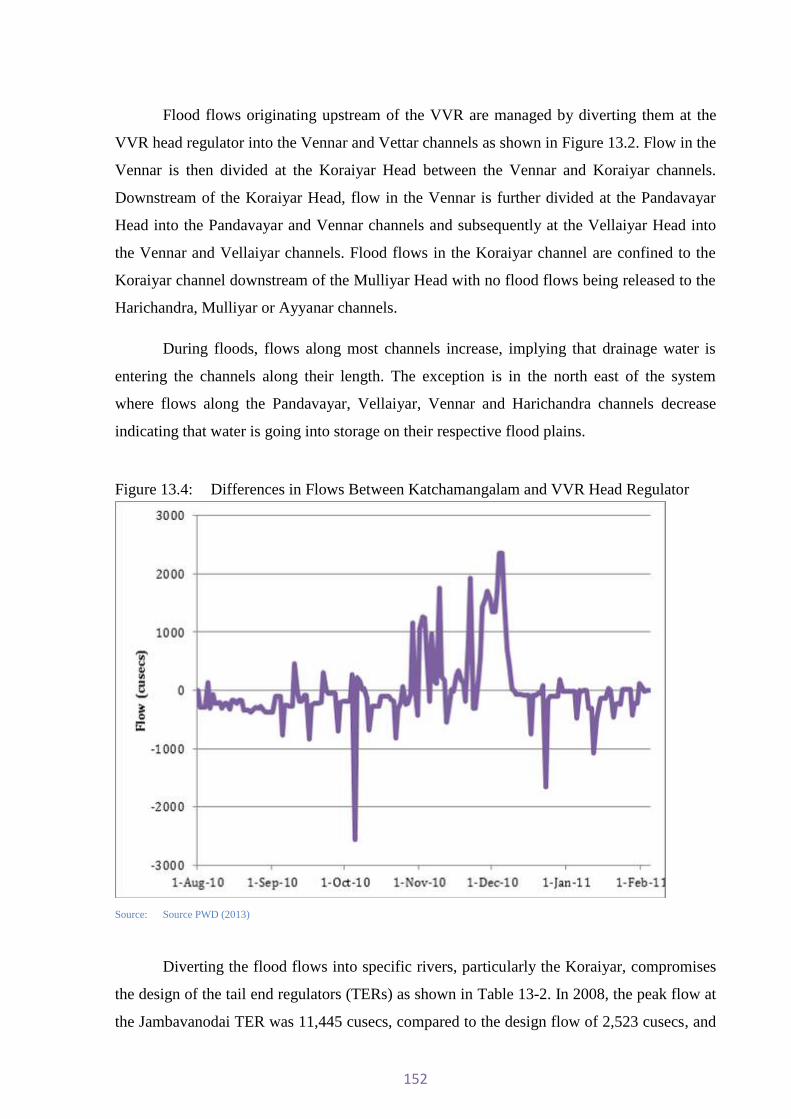
152
Flood flows originating upstream of the VVR are managed by diverting them at the
VVR head regulator into the Vennar and Vettar channels as shown in Figure 13.2. Flow in the
Vennar is then divided at the Koraiyar Head between the Vennar and Koraiyar channels.
Downstream of the Koraiyar Head, flow in the Vennar is further divided at the Pandavayar
Head into the Pandavayar and Vennar channels and subsequently at the Vellaiyar Head into
the Vennar and Vellaiyar channels. Flood flows in the Koraiyar channel are confined to the
Koraiyar channel downstream of the Mulliyar Head with no flood flows being released to the
Harichandra, Mulliyar or Ayyanar channels.
During floods, flows along most channels increase, implying that drainage water is
entering the channels along their length. The exception is in the north east of the system
where flows along the Pandavayar, Vellaiyar, Vennar and Harichandra channels decrease
indicating that water is going into storage on their respective flood plains.
Figure 13.4: Differences in Flows Between Katchamangalam and VVR Head Regulator
Source: Source PWD (2013)
Diverting the flood flows into specific rivers, particularly the Koraiyar, compromises
the design of the tail end regulators (TERs) as shown in Table 13-2. In 2008, the peak flow at
the Jambavanodai TER was 11,445 cusecs, compared to the design flow of 2,523 cusecs, and

153
caused the left bank of the structure to be seriously eroded. The TER structure was
subsequently extended by construction of a fixed weir on its left bank. In the 2008 flood,
flows calculated at regulators upstream of the TERs draining into the Vedharanyam canal
were greater than flows calculated through the TERs. This implies that the TERs were
drowned and that the calculation of flow using the orifice equation was not applicable under
those circumstances. Measurements are only made of water levels upstream of the TER.
During field visits, discussions with local people found that during floods, water levels either
side of TERs were usually similar, indicating that there were no significant head losses
through the TERs and that the capacities of the TER was not the main constraint on outflows.
Table 13-2: Design and Maximum Flows at TERs
Channel TER Design (cusecs)
Maximum Flows (cusecs)
a) Main irrigation-cum-drainage channels
2005 2008 2009 2010 2011 2012
Paminyar/Kannanar Thoppadanaveli 7348 12000 6110 9387 8862 5885
Koraiyar Jambavanodai 2523 11445 4447 10931 8169 2355
Mulliyar Thanikkottagam 1253 475 390 950 632 680
Adappar Umabalachery 905 942 762 914 822 822
Harichandra Brinj Moolai 2097 2178 1487 3305 1622 1904
Vellaiyar Eravakkadu 1124 1424 694 1224 633 877
Pandavayar Eraiyangudio 2050 2050 1505 1840 967 1641
b) Main drainage channels
Valavanar
Maraka Koraiyar 2035 4675 3252 3108 8012 1884
Manankondanar No Data
Kilaidhangiyar (Old) No TER
Kilaidhangiyar (New) No TER
Flows occur through TERs for only a limited number of days each year as shown in
Table 13-3. For example, the number of days flow was recorded at Idumbavanam TER
ranged from 9 days in 2012 to 55 days in 2009. Interestingly, during the peak flood year of
2008, the Idumbavanam TER was open for only 36 days which was less than during the
following three years, presumably because of more but less intense rainfall and runoff in
those years than in 2008. This pattern of opening was similar to most other TERs. The TERs
are closed for the rest of the year to back up water for irrigation head sluices upstream and to
prevent saltwater intrusion.

154
Table 13-3: Number of Days Flow Recorded at TERs
Date
Eraiyangudio
(Pandavayar)
Eravank kadu
(Vellaiyar)
Idumbavanam
(Maraka Koraiyar)
Thanikkottagam
(Mulliyar)
Umabalachery
(Adappar)
Brinj Moolai
(Harichandra)
Jambuvanodai
(Koraiyar)
Thoppathanaveli
(Paminyar)
Oct 08 -Dec 08
25 24 36 33 35 31 36 32
Oct 09 -Jan10
24 30 55 42 49 49 52 53
Oct 10 -Dec10
24 22 49 34 35 43 40 27
Oct 11 -Dec 11
13 16 39 15 37 19 23 23
Oct 12 -Dec 12
13 8 9 10 10 10 8 7

155
Figure 13.5 : Flood Flows through the Main Channels on 28th November 2008

156
Figure 13.6 : Flood Affected Areas 29 November 2008
Source: NRSC

157
The flood-affected areas in the Vennar system on 29 November 2008 are shown in
Figure 13.6. The map is based on an analysis of Radarsat-2 SAR data by the NRSC. It shows
that flooding was concentrated in the central and southern areas of the system. Reportedly, on
this date, there was also extensive flooding along the Vedharanyam Canal, the
Manankondanar Drain and the Valavanar Drain but this is not shown on the map. Figure 13.6
most likely indicates low lying areas where local runoff collected and excludes flooding that
was considered to be tidal. It is evident from this map that while small areas of flooding are
distributed across the study area there is a clustering of flooded areas along the rivers and that
the extent of these flooded areas increases towards the coast. The extent of flooding can be
better defined if an accurate DEM of the project area is made available.
Flooding problems in the Vennar system are compounded by drainage congestion
caused by water levels in the main channels being higher than the level of adjacent land for
extended periods, thereby preventing water draining from the land and collector drains into
the main channels. In addition, there is overtopping of embankments on some channels and
backflow from channels onto adjacent land through un-regulated drainage outfalls. However
the extent of flood flows into and out of the channels is not recorded unfortunately.
Discharges in the rivers are calculated at the head and tail-end regulators from the
orifice equation using measured upstream water level, area of gate openings and number of
gates open. There are no water levels measured at intermediate locations along the channels
or in the Vedharanyam Canal or in the straight cuts. Hence it is difficult to determine
precisely the flooding sequence.
Even during minor floods, water levels in the main channels are reportedly higher
than adjacent land, and the problem becomes much worse during major floods. For example,
the design flow at Jambavanodai TER on the Koraiyar Channel is 2523 cusecs. In 2008, the
flow at the TER exceeded the design flow for nine days (25 November until 5 December),
while in 2005 the flow at the TER exceeded the design flow for four days (27 to 30
November). The main channels do not have sufficient capacity to carry flood flows and allow
land to drain sufficiently quickly to avoid crop loss.

158
13.1.3 Coastal Zones
13.1.3.1 Coastal Processes
The Cauvery Delta is a typical river delta, the land being originally formed from
sediment deposited by river channels with contributions from marine sources. The coastal tip
at Point Calimere exhibits ridge formations typical of coastal spit and cuspate shoreline
development (Komar, 1998) indicating the historic growth of the southern area is likely to
have progressed in a north to south direction; first forming a spit and then infilling behind as
a result of deposition of fluvial and marine sediments. This area is also undergoing post-
glacial isostatic uplift (UNESCO-IHE, 2013) which may have assisted in the historic ridge
formations, and contributed to the shallowing of the Muthupet Lagoon (ICMAM, 2005).
During the 20th century the shoreline along and adjacent to the Cauvery Delta has remained
relatively stable.
A detailed study of coastal erosion for the entire Tamil Nadu Coast has been prepared
(NCSCM, 2011). The study utilised mapping from 1972 and satellite imagery from 1991-
2010 to assess the shoreline position and determine the extent of erosion or accretion. For the
eastern coastal areas immediately south of Nagapattinam, the study found that the shoreline
demonstrated low erosion. Continuing further southwards to around Thiruppoondi-East the
shoreline was increasingly stable, while towards Point Calimere the study shows accretion.
Rounding Point Calimere on to the southern coast along the Palk Straight the eastern portion
of the coast is less stable and shows generally low erosion, further west the shoreline become
stable and is accreting. A study by the Institute of Hydraulics and Hydrology (IHH, 2012)
supported the findings of the NCSCM study.
Outfalls from the drainage channels are at sea level or below. There are two distinct coastal zones:
(i) The Eastern Coast along the Bay of Bengal from Point Calimere to Nagapattinam
The eastern coastline along the Bay of Bengal generally comprises sandy beaches backed by
forest, agricultural land and urbanised areas. Sediment transport along the east coast is highly
variable. Many literature references describe the sediment transport as being from the south
towards the north. North of Nagapattinam this appears to be the case but analysis of satellite
imagery of the coast south of Nagapattinam shows that the sediment transport along the east

159
coast is from north Along the east coast, approximately 4km landwards from the shoreline
runs a channel known as the Vedharanyam Canal. The canal was constructed to provide
navigation for the transport of salt from Vedharanyam to Nagapattinam. It was formed by
utilising existing river channels and lagoons within the delta, connecting them with sections
of formal canal (Imperial Gazetteer of India, 1909). The canal originally had two sea
connections; to the south near Vedharanyam and to the north near Nagapattinam.
The canal also receives flows from inland from the Vennar system through a complex
system of channels. Discharge from the main rivers is controlled through the use of tail-end
regulators which maintain water levels upstream and prevent salt water intrusion from the
Vedharanyam Canal and from drainage outfalls from coastal irrigation command areas.
During the 1960’s to mid-1970’s additional connections to the sea were cut from the
Vedharanyam Canal directly to the Bay of Bengal in an attempt to accelerate the drainage of
the canal during floods. A total of 6 straight cuts were formed along the coast.
An assessment was made of the straight cuts and natural outlets to the east coast south of
Nagapattinam which found that:
There is a high rate of sediment transport from north to south;
Many of the outlets have become restricted or closed completely at their coastal extent;
In general the narrower straight cuts (<30m wide inland) are closed or heavily restricted,
showing that narrower outfalls are more susceptible to sediment transport than wider
outfalls;
The Vennar system generally drains adequately in spite of the restricted and closed
straight cuts, except during heavy rainfalls in the system when the Vedharanyam Canal
and straights cuts fail to discharge the floodwaters rapidly enough to prevent flooding.
Typically, tail-end regulators are fully closed in order to retain as much water as
possible for irrigation because of the variability of rainfall. While the tail-end regulators are
closed the irrigation and drainage system is isolated from the Vedharanyam Canal and the
coastal outlets only deal with the tidal water exchange in to the canal. The tidal range is
relatively small (typically about 0.6 m) along the coast. The canal and outlets have become
silted over time resulting in relatively low flow through the outlets. The low volume of water
passing through the coastal outlets allows sediment to settle and thus the outlets become
restricted and then closed which constrains flows out of the Vedharanyam Canal.

160
When the TERs are shut the canal can cope with this constrained inflow and outflow
of tidal water, but when the TERs are open, due to severe rainfall and runoff in the Vennar
system, the restricted coastal outlets can cause backwater effects within the entire
Vedharanyam Canal and adjacent parts of the Vennar system. The backwater effects are
relative to the amount of rainfall and therefore more severe storms lead to increased
backwater effect which leads to flooding of agricultural land as the system cannot drain.
The impact of flood flows on the coastal outlets is not currently understood in detail
as there is no available data to assess the state and condition of the outlets pre- and post-storm
flows. It is likely that the increased water volumes passing through the outlets would, to some
extent, help to scour and reduce the restrictions in the outlets. However, the low frequency of
these events means that sediment accumulation processes prevails, particularly on the
narrower straight cuts.
Future sea level rise will potentially increase the rate of erosion along the shoreline
and this will lead to increased sediment transport and may cause more rapid closure of the
existing coastal outlets. Conversely the increase in sea level may increase the tidal flows into
and out of the coastal outlets allowing them to naturally scour and maintain their depth,
although the spits at the mouths of the outlets are still likely to migrate southwards. However
if future sea level rise rates are similar to the low rates experienced historically along this
coastline, then they are unlikely to significantly affect the overall coastal processes, with the
exception of worsening the frequency of inundation.
In summary, in years without fluvial floods the sediment process dominates the
hydraulics of the coastal zone causing restriction of the coastal outlets along the east coast.
This causes a reduction in the drainage capacity that is required during periods of heavy
rainfall. The consequences are flooding both along the Vedharanyam Canal and further
upstream within the Vennar irrigation and drainage system. The impact of sea level rise is
uncertain at present given the sparse available data. Further numerical modelling, to be
undertaken during CASDP, will assist in informing further studies.
161
(ii) The Southern Coast from Point Calimere to Adhirampattinam along the Palk Strait
Along the south coast, from Point Calimere to Adhirampattinam, water from the
Vennar System runs into the Kodiakkadu and Muthapet lagoons and intertidal sand/mud flat
areas, known as the Great Vedharanyam Swamp (ICMAM, 2005), which subsequently
discharge to the Palk Strait.
The eastern Kodiakkadu lagoon area consists mainly of sand and mud flats with a
central lagoon which discharges along the southern coast. In the north and northeast of the
lagoon a significant area is utilised for salt-pans, an important industry to the local economy.
Within the lagoon there are significant areas that are cut with fishbone channels for mangrove
replanting.
Discharges from the Vennar System occur at the northwest corner of the lagoon and
there is evidence of straight cut channels through the sand and mud flats as well as naturally
formed channels. The southern reach of the Vedharanyam canal is heavily silted and
presently does not discharge into the northeast corner of this lagoon. There is a stark contrast
between this north-east corner of the Kodiakkadu lagoon where there is little or no vegetation
and the western Muthapet lagoon where mangrove is found. This may be as a result of hyper-
saline conditions within the Kodiakkadu lagoon area (as suggested within the Muthupet
Lagoon ICMAM 2005) caused by reduced inflows of fresh water as irrigation was extended
in the Vennar system. This probably also explains the productivity of the salt pans.
The western Muthupet Lagoon is formed of wetland, tidal creeks and channels which
are bordered by mangroves. The lagoon and its channels contain mainly saline and brackish
waters. Freshwater discharges from the Vennar System enter the northern boundary of the
lagoon through at least four channels, and discharge from the lagoon to the sea passes through
a single opening of width greater than 1km.
Records show that in 1740 the area was covered with mangrove. Since then
significant areas were felled for timber until the forests were taken over by the Tamil Nadu
Forest Department. The remaining mangroves (dominated by Avicennia Marina) are typically
classified as degraded with only 15% being classed as healthy. Degradation of the mangrove
is due to the hyper saline conditions within the lagoon which is compounded by the reduction
in discharge of freshwater due to the retention of waters within the Vennar System (ICMAM,

162
2005). There are currently significant areas of fishbone channels for the reinstatement of the
mangrove forest.
13.1.4 Impact of Climate Change
Based on an analysis of the most relevant recent studies of climate change, inflows to
the Vennar system from the Cauvery River at Grand Anicut are not expected to show
significant change. Inflows generated within the Vennar System, however, are expected to
change as a result of climate changes to the following variables:
Rainfall: Based on an analysis of rainfall events using different models, an increase
of 20% in the volume of storm rainfall is projected. This is in accordance with changes
adopted for many climate change impact studies worldwide. It is likely the future 5-year 24-
hour rainfall will be approximately 442mm, virtually identical to the current 10-year 24-hour
rainfall. The future 10-year and 20-year events will probably be slightly higher than the
current 20-year and 50-year events.
Temperature: Analysis of four climate change scenarios carried out during the
CASDP PPTA shows broad consistency (Srinivasan, 2013). An average increase of 1.5ºC
over 50 years is projected. This represents around 0.03ºC per year, compared with the
observed change of 0.02ºC per year. A slight acceleration of temperature increase is in
keeping with general temperature projections.
Other Climate Data: Climate change may impact on other climate variables used in
the modelling (wind speed, relative humidity and solar radiation) for assessing
evapotranspiration. However, these generally have much less impact on evapotranspiration
than temperature, and for modelling purposes they have been assumed to be unchanged. In
addition, whilst there is consistency in projections of temperature changes, not much has been
published regarding changes in the other variables.
Sea Level Rise: The rate of sea level rise is taken as 1mm/year. This rate is close to
the rate determined for a high climate change scenario from analysis and projection of the
historic tide data at Chennai carried out as part of the CASDP PPTA (Dastgheib and
Ranasinghe, 2013). This rate has been adopted to take account of the accuracy of the
numerical modelling and to provide a conservative approach to the assessment of sea level
rise. Assuming a baseline year of 1990 the total sea level rise is projected to be 60mm by

163
2050. Many of the other studies on the impact of sea level rise along the Tamil Nadu Coast
have adopted global averages of mean sea level rise in the range of 600 to 2000 mm by 2100
rather than the local datasets used by Dastgheib and Ranasinghe.
Storm Surges: ADB commissioned a study of storm surges for the Cauvery Delta
coastline. Due to issues with procurement of tidal data, the study was delayed and completed
in May 2014 (Dastgheib and Ranasinghe, 2014), too late to be included in this analysis.
The implications of sea level rise on coasts in general have been well studied and on
relatively flat coastal plains the physical impacts can be summarised as (UNEP, 2010):
Sea level rise will cause permanent submergence of low-lying areas;
Sea level rise will increase the probability and depths of flooding; this may be
compounded by other changes due to climate change such as increased storminess;
Sea level rise will contribute to increased shoreline erosion rates
‘Coastal Squeeze’ will increase, caused by hard defences preventing movement of the
shoreline
Although these factors will influence the coastal environment of the Cauvery Delta, in
relative terms the amount of sea level rise expected there is significantly lower than the global
average (Dastgheib and Ranasinghe, 2013).
Along the Cauvery Delta coast small increases in mean sea level in the order of 60mm
by 2050 would have a minor impact on the amount of inundation caused during storms, and
this would mean that the coastal settlements along the coast would be at marginally increased
risk. In general for small rises in sea level it is anticipated that the natural processes will adapt
over time, provided that the rise does not cause any critical limit to be exceeded, e.g. water
levels beginning to regularly exceed the top of a beach crest.
13.1.5 Proposed Measures to Improve the Performance of the Six Rivers in this Project
To improve the performance of the six Project-1 rivers, the feasibility of the following
measures was assessed:
Mitigation of Floods: The current drainage capacity of the six rivers of this project is
unable to cope with the floods resulting from present climatic conditions. Man-made
interventions and natural processes combine to impede drainage and aggravate flooding,

164
particularly on low-lying agricultural land. Climate change will increase rainfall intensity and
the frequency of intense storms and there will be small increases in sea level. Improving
drainage to mitigate flooding and adapt to climate change focuses on one or more of the
following:
Management of flood flows in drains entering the Vennar River between the Grand
Anicut and the VVR head regulator.
Improving the conveyance efficiency of channels in the Vennar system.
Improving performance of tail end regulators
Increase discharge of flood flows to the sea.
Provision of storage or additional flood channels or easements to reduce flood peaks
and flood duration was assessed but due to intensive land use within the Vennar System
combined with the problems of acquiring land, the scope for these was found to be very
limited and hence they were not considered further.
Rehabilitation of Pumped Irrigation Schemes: There are 13 government lift pump
irrigation schemes located on the six Project-1 rivers. The electrical and mechanical
equipment has not been replaced since the schemes were constructed in the 1960’s. The
performance of these schemes can be greatly improved by replacing the equipment with more
efficient equipment that uses less energy.
Improving Irrigation Management: The delivery of irrigation flows to farmers is
becoming more erratic and unreliable because the ageing structures and poor condition of the
main rivers impede the efficient management of irrigation flows. Many irrigation
management structures have deteriorated to an extent that they are no longer effective and are
well past their useful life. Leakage through structures is significant. The approach was to
assess the condition of existing structures and the need for reconstruction or repair and
identify the need for additional structures required for more efficient flow management.
Updating River Management Systems: The present management process for floods
and water distribution for irrigation is not entirely satisfactory. It does not utilise modern
technologies to ensure efficiency and transparency. The management needs to become more
systematic, efficient and based on scientific information to inform decision making, with
specific targets that are explicit in terms of cost, water and other resources to meet
environmental requirements.
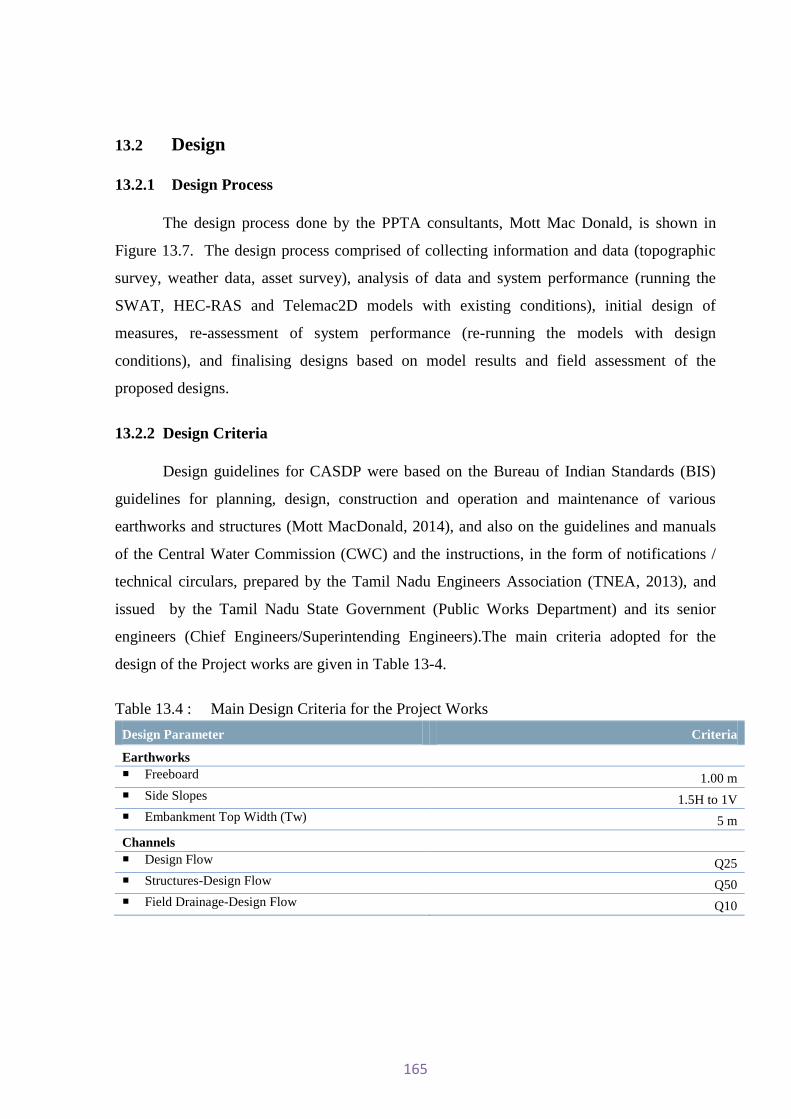
165
13. Canal System
13.2 Design
13.2.1 Design Process
The design process done by the PPTA consultants, Mott Mac Donald, is shown in
Figure 13.7. The design process comprised of collecting information and data (topographic
survey, weather data, asset survey), analysis of data and system performance (running the
SWAT, HEC-RAS and Telemac2D models with existing conditions), initial design of
measures, re-assessment of system performance (re-running the models with design
conditions), and finalising designs based on model results and field assessment of the
proposed designs.
13.2.2 Design Criteria
Design guidelines for CASDP were based on the Bureau of Indian Standards (BIS)
guidelines for planning, design, construction and operation and maintenance of various
earthworks and structures (Mott MacDonald, 2014), and also on the guidelines and manuals
of the Central Water Commission (CWC) and the instructions, in the form of notifications /
technical circulars, prepared by the Tamil Nadu Engineers Association (TNEA, 2013), and
issued by the Tamil Nadu State Government (Public Works Department) and its senior
engineers (Chief Engineers/Superintending Engineers).The main criteria adopted for the
design of the Project works are given in Table 13-4.
Table 13.4 : Main Design Criteria for the Project Works
Design Parameter Criteria
Earthworks Freeboard 1.00 m Side Slopes 1.5H to 1V Embankment Top Width (Tw) 5 m
Channels Design Flow Q25 Structures-Design Flow Q50 Field Drainage-Design Flow Q10

166
Figure 13.7 : Design Process
13.2.3 Topographic Survey
Due to the shortage of accurate and up-to-date information on the river channels, the
Asian Development Bank commissioned Prime Meridian Survey Limited (PMSL) in 2013 to
survey the sections of the river channels shown in Figure 13.8 as part of the PPTA. PMSL
surveyed the alignment, levels and widths of cross sections at about 250 m intervals and also
the main structures across the channels. PMSL prepared reports of the surveys that include

167
geo-referenced alignment maps of the river channels, drawings of cross sections and
drawings showing the main dimensions and levels of the cross structures (PMSL, 2013).
For the river channels not covered by the PMSL survey, WRD provided cross sections
at 500 m intervals. The WRD cross-sections were not geo-referenced.
Figure 13.8 Rivers, Drains and Canal included in this Project
There are discrepancies (such as the chainages along the rivers) between the PMSL
survey data and the WRD historic and recent survey data. The discrepancies were resolved
on a case-by-case basis to try to ensure consistency in the presentation of information. The
discrepancies are discussed for each river in Section 13.3.
The only topographic maps available for the project area are the 1:50,000 Survey of
India maps. The contour interval on these maps is 5 m. There is no existing high-resolution
digital terrain model (DTM) for the flood plain of the six Rivers of this Project, although
selected flood zones are being surveyed as part of the PPTA but the DTMs from these flood
zones are not yet available.

168
13.2.4 Asset Survey
Component Registers listing details of structures are available for Adappar,
Harichandra, Vellaiyar and Pandavayar channels. There are no component registers for the
Valavanar Drain or the Vedharanyam Canal. Furthermore, there are no as-constructed
drawings or design information for the existing structures or channels.
The Vellaiyar and Pandavayar registers were prepared in the 1920’s while the
Adappar and Harichandra registers date from the 1970’s. Since the compilation of the
registers, numerous structures have been added, particularly road bridges and cross
regulators. Details of some of the newer structures have been hand-written into the
component registers.
In the absence of up-to-date records, designs or as-constructed drawings, an asset
survey was carried out by WRD and the PPTA consultants to determine the current
conditions of the physical assets along the channels.
Most of the appurtenant structures are brick masonry and although some are still
functioning satisfactorily, many are in poor repair with subsiding wing walls, collapsed
barrels and cracked brickwork. Many gates are in poor condition and unworkable while the
downstream aprons and side protection on many structures need repair or replacement.
13.2.5 Analysis of Rainfall Data and Climate Change
Information on the analysis of rainfall data and climate change predictions are given
in Chapter 2.
13.2.6 SWAT Rainfall-Runoff Model
During the NE monsoon (October to December) flooding in the Vennar system is
common. The flooding of 2008 is evidence of the extreme nature of the flood events and the
severe impacts on the system. The flooding during this period was caused by intense and
prolonged rainfall resulting in high runoff which exceeded the capacity of the drainage
system. Furthermore, flooding was exacerbated by tidal effects caused by the poor state of the
tail regulators and straight cuts. The 2008 flood was used as the calibration event for
hydrologic and hydraulic modelling by the PPTA team.

169
The hydrologic model chosen was the SWAT model. The primary purpose of the
SWAT rainfall-runoff model is to simulate the transition of the precipitation falling directly
into the Vennar system into surface storage, evaporation, runoff, soil moisture storage and
infiltration to groundwater for a range of climate change scenarios. SWAT outputs provide
inputs to the hydraulic model.
The Map Windows version of SWAT (MWSWAT) was used for this feasibility study.
The model setup and model runs include the following key steps:
Automatic Watershed Delineation (AWD) - DEM files obtained from SRTM and
ASTER satellite imagery were pre-processed in MapWindow to extract a DEM covering
the Vennar System. The ‘Delineate Watershed’ function of MWSWAT was used to
delineate 112 rainfall catchments within the Vennar system. During this stage a stream
network shape file and a shape file showing existing regulators as outlet points of the
sub-basins were added to the 112 catchments. The threshold (minimum) area for
catchment delineation was set at 2000ha. The catchments and stream reaches are shown
in Figure 13.9.
Create Hydrological Response Units (HRUs) - HRUs are used in the SWAT model to
represent particular combinations of land use, soil type and slope range. Land use data for
the Vennar system was derived from the USGS Global Land Cover Characterization
(GLCC) database which has a spatial resolution of 1 km and 24 classes of land use.
Twelve types of land use/land cover categories were identified, as shown in Table 13-5. A
global soil map, produced by the Food and Agriculture Organization of the United
Nations (FAO, 1995) and showing almost 5000 soil types at a spatial resolution of 10 km
and soil properties for two layers (0-30 cm and 30-100 cm), was used to characterise soil
types. The Vennar system typically consists of Sandy Loam, Sandy Clay Loam, Clay
Loam, Loam and Clay soils. Using the HRU function of MWSWAT and applying
threshold values for land use, soil and slope percentages, all delineated rainfall catchments
were divided into multiple HRUs. A total of 471 HRUs in 112 catchments were created.
MWSWAT Setup & Run - This step consisted of:
– Defining the climate data - rainfall, temperature, relative humidity, wind speed and
solar radiation,
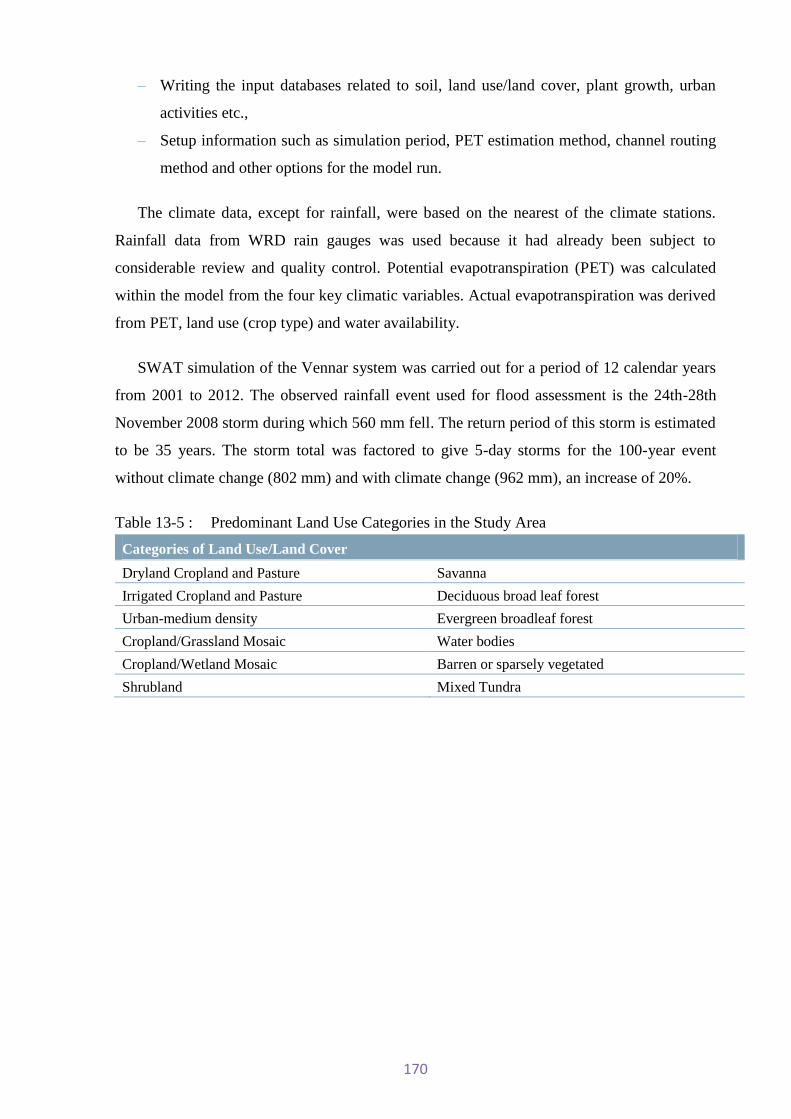
170
– Writing the input databases related to soil, land use/land cover, plant growth, urban
activities etc.,
– Setup information such as simulation period, PET estimation method, channel routing
method and other options for the model run.
The climate data, except for rainfall, were based on the nearest of the climate stations.
Rainfall data from WRD rain gauges was used because it had already been subject to
considerable review and quality control. Potential evapotranspiration (PET) was calculated
within the model from the four key climatic variables. Actual evapotranspiration was derived
from PET, land use (crop type) and water availability.
SWAT simulation of the Vennar system was carried out for a period of 12 calendar years
from 2001 to 2012. The observed rainfall event used for flood assessment is the 24th-28th
November 2008 storm during which 560 mm fell. The return period of this storm is estimated
to be 35 years. The storm total was factored to give 5-day storms for the 100-year event
without climate change (802 mm) and with climate change (962 mm), an increase of 20%.
Table 13-5 : Predominant Land Use Categories in the Study Area
Categories of Land Use/Land Cover
Dryland Cropland and Pasture Savanna
Irrigated Cropland and Pasture Deciduous broad leaf forest
Urban-medium density Evergreen broadleaf forest
Cropland/Grassland Mosaic Water bodies
Cropland/Wetland Mosaic Barren or sparsely vegetated
Shrubland Mixed Tundra

171
Figure 13.9 : MWSWAT Watersheds in the Vennar System
Source: Mott MacDonald
13.2.7 Hydraulic Model
There are two components to the hydraulic modelling. The river network is
represented by a 1-dimensional model (HEC-RAS) while the coastal boundary is represented
by a 2-dimensional model (TELEMAC2D). The TELEMAC2D model provides the
downstream boundary condition for the HEC-RAS model and provides an effective means of
simulating the hydrodynamics of the coastal processes, particularly the interaction with the
Vedharanyam Canal with the sea.
An accurate description of the river network to be modelled is the first and most
important step in developing a reliable hydraulic model. In the case of the Vennar system this
was a challenge due to the high density network of rivers, canals and drains, numerous inter-
linkages (including bifurcations) and structures.

172
A preliminary network was developed and reviewed in detail with WRD before being
finalized. Important linkages were included with the help of WRD as were the specific
layouts at each head regulator.
The HEC-RAS model was constructed in phases to allow for controlled testing and
validation. This section describes the model development for the Harichandra River. It
illustrates the modelling method and the approach taken to assess options for flood
mitigation. It also serves to explain how the available data impacts on the results.
A schematic of the HEC-RAS model is shown in Figure 13.. Lateral inflow
hydrographs are used to represent drainage into the river. The inset illustrates a typical cross
section and the use of lateral weirs to simulate out-of bank flow.
Figure 13.10: A Schematic of the HEC-RAS model for the Harichandra
Source: Mott MacDonald
The Harichandra model has two upstream boundaries and one downstream boundary.
The upstream boundaries are located at the Athiveeramanar and Harichandra head regulators.
The modelled channel extends downstream beyond the Brinjimoolai TER to the sea. The
downstream boundary condition is set at a mean high water spring tide (MHWS) level of
0.6m. This boundary was modified for the options assessment. In addition, the Ambodiyar

173
head sluice is included in the model to control outflow to the Adappar. Lateral inflow
hydrographs are used to represent inflows along the river with the flow distributed in
accordance with command areas given in the component register.
The HEC-RAS model was tested under steady state conditions and then applied to
unsteady state conditions. Currently there is insufficient topographic data available to model
out-of-bank flows. Therefore where these are simulated, they are lost from the model. The
2004 NE monsoon period was selected for model validation.
The 2-dimensional mesh for the TELEMAC2D model is shown in Figure 13.11 .
The density of the grid increases at the outfalls of the rivers where velocity gradients will be
greatest and the terrain will be more variable. The TELEMAC2D model was used to
determine flows in the Vedharanyam Canal and the straight cuts. Flows determined from the
HEC-RAS models of the rivers that cross the canal were used as inputs to TELEMAC2D
model along with tidal data and PMSL cross sections for the Vedharanyam Canal and the
straight cuts.
Figure 13.11 : The TELEMAC2D model grid and the interface with HECRAS
Source: Mott MacDonald
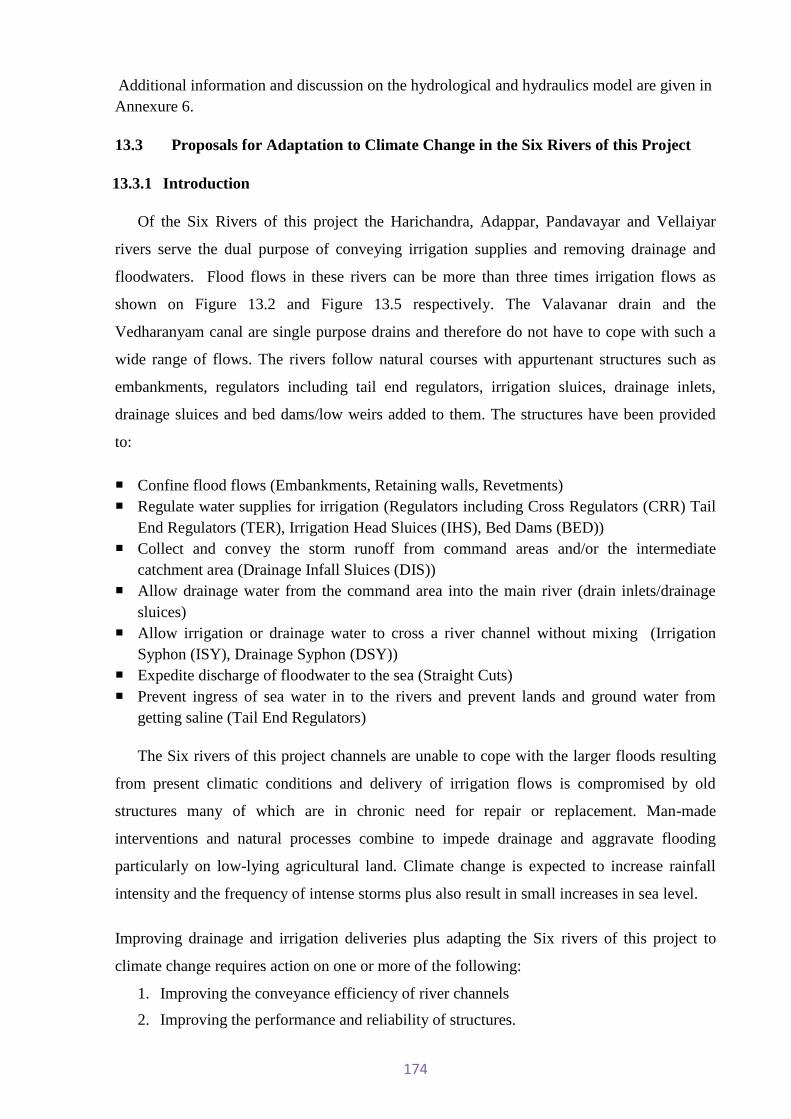
174
Additional information and discussion on the hydrological and hydraulics model are given in Annexure 6.
13.3 Proposals for Adaptation to Climate Change in the Six Rivers of this Project
13.3.1 Introduction
Of the Six Rivers of this project the Harichandra, Adappar, Pandavayar and Vellaiyar
rivers serve the dual purpose of conveying irrigation supplies and removing drainage and
floodwaters. Flood flows in these rivers can be more than three times irrigation flows as
shown on Figure 13.2 and Figure 13.5 respectively. The Valavanar drain and the
Vedharanyam canal are single purpose drains and therefore do not have to cope with such a
wide range of flows. The rivers follow natural courses with appurtenant structures such as
embankments, regulators including tail end regulators, irrigation sluices, drainage inlets,
drainage sluices and bed dams/low weirs added to them. The structures have been provided
to:
Confine flood flows (Embankments, Retaining walls, Revetments) Regulate water supplies for irrigation (Regulators including Cross Regulators (CRR) Tail
End Regulators (TER), Irrigation Head Sluices (IHS), Bed Dams (BED)) Collect and convey the storm runoff from command areas and/or the intermediate
catchment area (Drainage Infall Sluices (DIS)) Allow drainage water from the command area into the main river (drain inlets/drainage
sluices) Allow irrigation or drainage water to cross a river channel without mixing (Irrigation
Syphon (ISY), Drainage Syphon (DSY)) Expedite discharge of floodwater to the sea (Straight Cuts) Prevent ingress of sea water in to the rivers and prevent lands and ground water from
getting saline (Tail End Regulators)
The Six rivers of this project channels are unable to cope with the larger floods resulting
from present climatic conditions and delivery of irrigation flows is compromised by old
structures many of which are in chronic need for repair or replacement. Man-made
interventions and natural processes combine to impede drainage and aggravate flooding
particularly on low-lying agricultural land. Climate change is expected to increase rainfall
intensity and the frequency of intense storms plus also result in small increases in sea level.
Improving drainage and irrigation deliveries plus adapting the Six rivers of this project to
climate change requires action on one or more of the following:
1. Improving the conveyance efficiency of river channels
2. Improving the performance and reliability of structures.

175
3. Increasing flood flows to the sea.
4. Rehabilitating 13 pumping schemes
5. Monitoring groundwater recharge
Specific proposals for each of the Six rivers of this project are analysed and assessed in the
following six sections 13.3.2 to 13.3.7.
13.3.2 Adappar
13.3.2.1 Description of the Adappar River
The Adappar River illustrates the typical characteristics of the rivers of the Vennar
system. The alignment of the Adappar is shown in Figure 13.12 and the location of structures
in the upper and lower reaches of the Adappar are shown schematically in Figure 13.13 and
Figure 13.14 respectively.
The Adappar offtakes from the Mulliyar River at Chainage 130.236 km (see footnote 1). In the 6.14 km upper reach from the Adappar Head Regulator to the Thiruvalanjuli Cross
Regulator (Chainage 136.376 km) there are 4 Class B irrigation head sluices (IHS) supplying
about 1.34 m3/s to 673 ha and 12 infalls providing drainage to 2287 ha. The Head Sluice is
rated as 1.54 m3/s for irrigation flow. Flood flows in the Mulliyar are not diverted through the
Adappar Head Regulator (See Figure 13.5). The combined drainage flows entering the
Adappar upstream of the Thiruvalanjuli Regulator is 10.49 m3/s. At the Thiruvalanjuli
Regulator, all irrigation water is diverted into the B4-Thiruvalanjuli and B3- Kunnur canals
on the right bank. Adjacent to the left bank of the Thiruvalanjuli regulator is the unregulated
Pullithikudhi drain infall that discharges downstream of the regulator. There are no data on
the Pullithikudhi catchment or flow or water level measurements.
From Chainage 136.376 km to Chainage 139.854 km there are no irrigation offtakes
and Adappar serves only as a drain, collecting flows from six infalls with combined
catchments of 339 ha plus the Pullithikudhi catchment. At Chainage139.9 km, the Adappar is
joined by the Ambodiyar Link Canal2 that provides irrigation water diverted from the
Harichandra. Between Chainage 139.854 km and the Pamani Regulator at Chainage 149.469
km, there are seven irrigation head sluices, providing water to 2676 ha and 5 drainage infalls
with combined catchments of 1672 ha.
1 Chainages are measured by WRD as the distance downstream of the Upper Anicut
2 The Ambodoyar Link Canal offtakes from the Harichandra upstream of the Keeranthi Regulator at Chainage 137.54 km. The Ambothirajan Channel also takes off from the Ambodoyir Link Canal/ Harichandra at the Keeranthi Regulator to provide irrigation water to 1360 ha on the left bank of the Adappar River between Chainage 139.854 km and Chainage 147.84 km.

176
Between the Pamani Regulator at Chainage 149.469 km and Umabalachery Tail End
Regulator at Chainage 156.106 km, there are four drainage infalls, two irrigation head sluices
irrigating 2071 ha plus two inlets to pumping stations irrigating 536 ha. Downstream of the
Umabalachery TER until Chainage 169.025 km where the Adappar meets the Vendharanyam
Canal and the Adappar Straight Cut, there are 10 drain infalls. Two of the drains, the
Pokkuvoikkal and Nallar drain an extensive area with catchments of 4322 ha and 1181 ha
respectively. Downstream of Chainage 162.31, the width of the Adappar channel increases
from about 60 m to over 200 m as the river enters the lagoon.
There are few homesteads or habitations close to the Adappar along most of its length,
although downstream of Pamani there are a few built-up areas close to the channel. There is
no road access along the channel from the Head Regulator to the Pamani Regulator, except
for few locations such as between Chainage 143 to 144.80 km.
In 2008, flooding in the Adappar occurred mainly in the middle and lower reaches
(see Figure 13.6). Information about flooding is available from visual observations of where
breaches took place, or anecdotal evidence from affected locals. There are no flow or water
level data on the flood discharges through the numerous drain infalls.

177
Figure 13.12 Alignment of Adappar River

178
Figure 13.11 : Structures on Upper Adappar Distance
(km) Area / Discharge
(ha/m3/s) Area / Discharge
(ha/m3/s)
130.236 Adappar HS Adappar HS 759.75/1.54
130.409 Kottor Drain #1 18.19/0.25
130.434 Kottor Drain #2 0.78/0.01
130.772 Kottor Drain #3 8.03/0.11
130.911 B1 M. Voikal HS 16.79/-
131.181 Road Bridge Road Bridge
131.521 Therku S K Drain 30.30/0.13
131.816 V S Kottur Drain 167.05/0.73
132.476 T. S Kottur Drain 72.00/0.31 72.00/0.31
132.496 Kottur Vadigal 14.48/0.50
132.876 Essankudi Vadigal 98.65/0.43
133.651 Drain 85.21/1.37
133.661 Drain Infall 122.25/0.53
133.926 Drainage PS No details
133.996 Drain 11.65/0.05
134.006 P. Voikel Drain 1658.37/6.07
134.051 B2 Keerakkular HS 134.99/-
134.201 Road bridge Road bridge
136.336 B3 Kunnur HS 260.30/-
136.354 B4Thiruvalanjuli HS 260.30/-
136.376 Thiuvalanjuli Reg. 3651.80/- Thiruvalanjuli Reg 3651.89/-
136.379 Pullithikudhi Drain Infall No data
137.551 Alivalam Drain 206.39/-
138.325 Andankarai Drain No data
138.432 Drain infall no 1 46.45/-
138.734 Drain infall no 2 41.28/-
139.592 Drain infall no 3 44.51/0.65
139.854 Ambodoiyar open fall 195.06/-
139.874 Adandur drainage No data
140.014 SI Railway Bridge SI Railway Bridge
140.094 Tiruvalanjuli Siphon No data Tiruvalanjuli Siphon No data
141.624 Road Bridge Road Bridge
143.153 Ambodiyarajan SS 28.73/0.73
143.233 K. Kottagam Dr 70.41/1.13
143.413 Kunnar Vadigal 296.23/2.91
143.593 Vellar dam (old) 70.41/1.13 Vellar dam (old)
143.983 Kulayar drain 1257.75/7.64
144.802 Bridge
147.397 Attakulam HS 202.35/-
147.397 Pamani HS 151.76/-
147.839 Thiyagaraja Nallur HS 130.72/-
149.066 Subedar Channel HS 116.55/-
149.469 North Rajan HS 911.23/-
149.469 Mullar Channel HS 38.44/-
149.69 South Rajan HS 1125.47/2.21
149.469 Pamani Regulator No data Pamani Regulator No data

179
Figure 13.12: Structures on Lower Adappar Distance
(km)
Area / Discharge (ha/m3/s)
Area / Discharge (ha/m3/s)
149.469 Pamani Reg. Pamani Regulator
149.791 K Kottagam Drain 220.06/2.38
150.651 Pamani Mullar PS 299.48/0.45
150.872 Drain No data
150.912 Drain No data
151.770 Korkkai PS 236/no data
152.240 S Kottogam Drain 414.41/3.61
152.627 Thalakadu f/ bridge
156.867 U South RajanHS 1536.24/3.03
156.087 U North Rajan HS 535.01/1.06
156.106 Umbalachery TER 6940.00/34.61 Umbalachery TER 6940.00/34.61
156.862 Surplus outlet
157.900
Umbalachery
bridge
160.087 M Kanni Reg. No data
163.808
South Rajan
Channel 647.52/7.11
163.310 North Rajan Infall No data
163.470 Pokkuvoikkal Infall 4322.60/25.23
163.490 Nallar Infall 1181.46/22.40
163.634 Drainage infall No data
164.855 Drainage infall No data
166.042 Drainage infall No data
167.494
Palayapokku
Voikkal Infall No data
167.520 Drainage infall No data
168.540 Kallimadu drain No data
168.850
Kallimadu road
bridge
169.025 Junction V Canal
Junction V Canal
Legend
Irrigation outlet
Drainage Inlet
Cross regulator
Road or railway bridge
Drainage Siphon
Main channel

180
13.3.2.2 Modelling to Assess Channel Improvements
Model Domain
The Adappar HEC-RAS model has two upstream boundaries and one downstream
boundary. The upstream boundaries are located at the Adappar Head Regulator (130.236km)
and the off-take of the Kottor channel from the Mulliyar River. The HECRAS model is
terminated at the Vedharanyam Canal providing inflow to the TELMAC2D model of the
canal and the coast. The drainage from surrounding land is derived from the results of the
MWSWAT hydrologic model and is allocated to the appropriate reach of the river based on
the SWAT sub-catchments. The flows are assumed to be distributed uniformly along each
reach. As well as the Adappar head regulator, the Pamani and Umbalacherry tail end
regulators are included in the HEC-RAS model. As PMSL cross sections are only available
downstream of the Pamani Regulator it was necessary to use cross sections provided by WRD
between the head regulator and Pamani Regulator. The WRD cross-sections are between 1km
and 4km apart compared to the 100 to 200m intervals used by PMSL. Therefore the model
results upstream of the Pamani Regulator must be treated with caution.
Validation
The HECRAS model was run for the period 2001 to 2012 and the simulated flow at the
tail end regulator was compared with the flows recorded by WRD. Uncertainties include:
Measurement errors (including the calibration and errors caused by by-pass flow);
SWAT inflows into HEC-RAS;
Assumed gate settings of regulators;
Canal roughness; and
The distance between the cross sections upstream of the Pamani Regulator.
In the absence of recorded level data, the tail end flows were used to adjust the SWAT
inflows and to check on the volume of water that leaves the main channel as spill. The model
does not simulate flood plain storage or the return of water to the main channel. Therefore,
the validation has been limited to the comparison of observed and simulated peak flows as
shown in Figure 13.13.

181
Figure 13.13: Observed and simulated annual maximum flows at Umbalachery Regulator
The comparison of annual observed and simulated peak flows at the Umbalachery
regulator indicates that the simulated peak in the largest event (2008) was too large by 30-
40%. The reason for this was almost certainly an overestimate of the peak runoff from
contributing SWAT catchments caused by assumptions that runoff is not time lagged by
travel time and also impeded by drainage congestion and that all the runoff drains to the
Adappar river. Neither of these assumptions is necessarily correct because of congested
drainage during large floods and the uncertainty over the destination of the runoff i.e.
catchment runoff does not necessarily discharge to the river that irrigates the catchment . For
these reasons the SWAT flows into the Adappar river in 2008 were reduced by 40%. The
reduction in the SWAT flows is supported by the evidence from WRD and the field visits that
the area draining to the river is not always contingent with the natural catchment.
Furthermore, based on information from WRD that the Adappar head regulator is
usually closed during floods, inflows into the Adappar model from the Koraiyar river were
set to 10% of the SWAT flowsThese adjustments provided reasonable simulated levels and
flows for the 2008 flood event.
Results
The model run for the 2008 event with the river in its existing condition indicates that
the peak water levels over-topped the bank levels at several locations. These locations are
broadly similar to the flooded areas indicated on the 2008 flood map (Figure 13.6),

182
particularly the flooding that occurred upstream of Umbalacheri tail regulator and along the
Chettipulam link canal.
The simulated long profile for one scenario is illustrated in Figure 13.14.
Figure 13.14: Simulated Long Profile for the Adappar upstream of the Chettipulam inflow
0 5000 10000 15000 20000 25000 30000 35000-2
0
2
4
6
8
10
Adapper - Final Plan: 1) ada 2008 ex HR 23/03/2014
Main Channel Distance (m)
Ele
vatio
n (
m)
Legend
WS Max WS
Ground
Left Levee
Right Levee
Adappar Adappar
Note: PMSL survey data downstream of Chainage 15000; WRD data upstream of Chainage 15000
The validated model was run for climate change scenarios, and the results are shown in
Figure 13.15 and 13.16.
Figure 13.15: Simulated long profile for the 25, 50 and 100 year events without Climate Change
0 5000 10000 15000 20000 25000 30000 35000-2
0
2
4
6
8
10
Adapper - Final Plan: 1) ada 100 ex HR 23/03/2014 2) ada 50 ex HR 23/03/2014 3) ada 25 ex HR 23/03/2014
Main Channel Distance (m)
Ele
vatio
n (
m)
Legend
WS Max WS - ada 100 ex HR
WS Max WS - ada 50 ex HR
WS Max WS - ada 25 ex HR
Ground
Left Levee
Right Levee
Adappar Adappar
Figure 13.16: Simulated long profile for the 25, 50 and 100 year events with Climate Change
0 5000 10000 15000 20000 25000 30000 35000-2
0
2
4
6
8
10
Adapper - Final Plan: 1) ada 100 cc ex HR 23/03/2014 2) ada 50 ex cc HR 23/03/2014 3) ada 25 ex cc HR 23/03/2014
Main Channel Distance (m)
Ele
vatio
n (
m)
Legend
WS Max WS - ada 100 cc ex HR
WS Max WS - ada 50 ex cc HR
WS Max WS - ada 25 ex cc HR
Ground
Left Levee
Right Levee
Adappar Adappar

183
The simulated water levels appear to be relatively insensitive to the magnitude of the
event as can be seen by the relatively small differences between the water levels shown in the
two figures. This is due to the fact that once the water level exceeds the bank tops it leaves
the main channel and flows onto an extensive flood plain with little change to the level in the
main channel.
Feasibility Proposal for the River Channel
For the feasibility study, the option considered was to improve the conveyance
efficiency of the river channel by re-sectioning3 the channel and standardising4 the banks
(where required) to contain the design flood flow (Q25) with 1.0 to 1.5 m freeboard. The
geometry of the model cross sections was adjusted to accommodate these changes and the
model re-run to determine the impact on flows and water levels.
The results of the re-sectioning the channel are shown in Figure 13.17. In the upper
reach from the head regulator to the Thiruvulanjuli CRR, the channel section is cleaned of
vegetation and sand bars removed. The design channel will be about the same bed width as
the existing channel and hence there is minimal impact on water levels. The width of the
channel is relatively narrow as the flood discharge is small. From Thiruvulanjuli CRR to
Pamini CRR, the bed width is increased to 25 m. From Pamini CRR to Umbalacherry CRR
(existing TER), the design bed width is 30 m while Umbalacherry CRR to Chainage 165.90
km where the Adappar channel abruptly widens as it flows into the lagoon the design bed
width is 40 m. The recommended side slopes are 1.5H to 1V. The impact of the works on
water levels is shown on Figure 13.15.
The calculated discharges for Q25, Q25 with climate change (CC), Q50 and Q50 CC,
and Q100 and Q100 CC and the respective water levels for the existing and post-project
channel are shown in Table 13.6. Q25 discharges increase by about 30% with climate change
and Q25 with climate change is greater than the Q50 without climate. Water levels increase
by about 9 % with climate change.
3 Re-sectioning is defined as increasing the cross sectional area of the channel by clearing vegetation, increasing the bed width and raising
the top level and width of side embankments.
4 Embankment standardisation is defined as reforming the embankment along a river channel to comply with the design section.

184
Improvements to the Adappar Straight Cut were assessed as using the TELEMAC2D
model as discussed in Section 13.3.7.
Discussion and Recommendations
The availability of flow records for this river has allowed validation of the
assumptions pertaining to the SWAT inflows and the bank heights. Furthermore, the
simulated water levels at regulators are not inconsistent with WRD observations during the
2008 event. Finally, there is consistency between the areas flooded in 2008 and the locations
where the model simulates out-of bank flow. The model can therefore be used with
confidence to model the design events and to appraise feasibility options. To improve
confidence in the model it is recommended that water level and flow monitoring instruments
are installed at the head and tail end regulators and selected cross regulators. It is important
that the design and installation of this equipment conforms to current best practice. Improving
the cross sections upstream of the Pamani regulator will give significant improvements in the
prediction of water levels in this reach. The availability of a DEM to define the flood plain
areas is essential for the accurate mapping of flooded areas and to simulate the movement of
water between flood plain storage and the main channel.
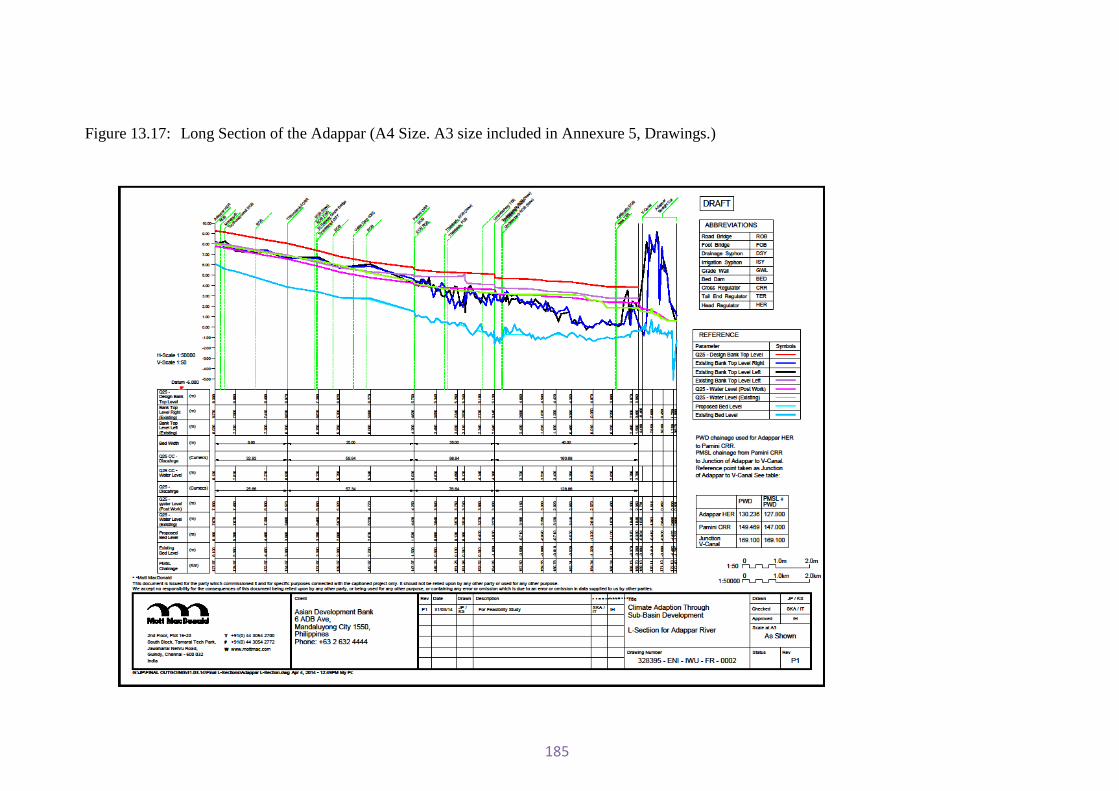
185
Figure 13.17: Long Section of the Adappar (A4 Size. A3 size included in Annexure 5, Drawings.)

186
Table 13.6: Design Discharges and Water Levels for Different Floods, Adappar Scenario Name of
Structure Adappar HER
Tiruvalanjuli CRR
Pamini CRR
Umbalcherry CRR
New TER
Q25 Discharge (m3/s) 6.59 25.66 46.76 76.39 128.86
WL existing (m) 7.97 6.86 5.22 3.28 1.84
WL post Project (m) 7.80 6.57 4.77 3.63 2.36
Q25cc Discharge (m3/s) 8.75 32.38 59.94 98.63 160.68
WL existing (m) 8.24 7.20 5.53 3.65 2.03
WL post Project (m) 8.13 6.93 5.34 4.11 2.78
Q50 Discharge (m3/s) 8.06 30.19 54.69 87.92 145.11
WL existing (m) 8.14 7.07 5.75 3.48 1.94
WL post Project (m) 8.02 6.79 5.62 3.89 2.58
Q50cc Discharge (m3/s) 10.24 38.15 69.08 114.71 167.28
WL existing (m) 8.44 7.45 5.75 3.92 2.18
WL post Project (m) 8.35 7.18 5.62 4.34 2.87
Q100 Discharge (m3/s) 8.78 33.97 62.30 102.88 164.52
WL existing (m) 8.27 7.25 5.57 3.61 2.02
WL post Project (m) 8.16 6.99 5.40 4.19 2.83
Q100cc Discharge (m3/s) 11.70 44.04 79.18 123.28 205.27
WL existing (m) 8.85 7.94 6.01 4.26 2.36
WL post Project (m) 8.61 7.46 5.95 4.79 3.37
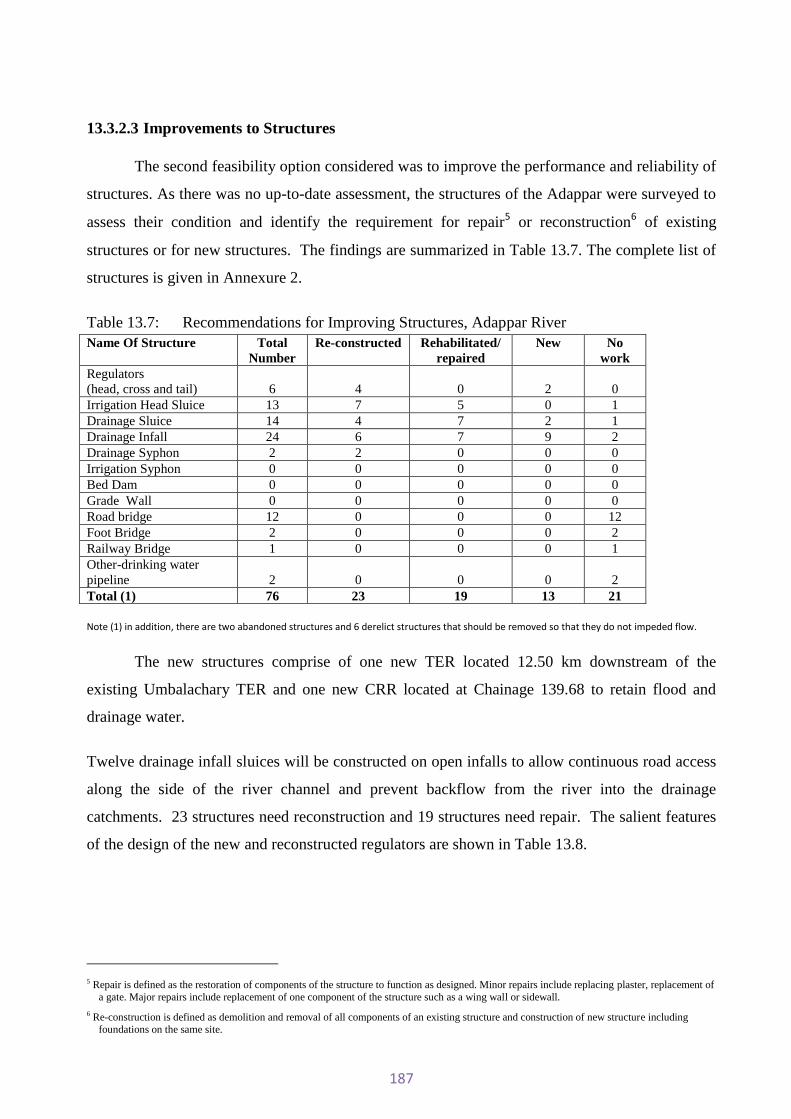
187
13.3.2.3 Improvements to Structures
The second feasibility option considered was to improve the performance and reliability of
structures. As there was no up-to-date assessment, the structures of the Adappar were surveyed to
assess their condition and identify the requirement for repair5 or reconstruction6 of existing
structures or for new structures. The findings are summarized in Table 13.7. The complete list of
structures is given in Annexure 2.
Table 13.7: Recommendations for Improving Structures, Adappar River Name Of Structure Total
Number Re-constructed Rehabilitated/
repaired New No
work Regulators (head, cross and tail) 6 4 0 2 0 Irrigation Head Sluice 13 7 5 0 1 Drainage Sluice 14 4 7 2 1 Drainage Infall 24 6 7 9 2 Drainage Syphon 2 2 0 0 0 Irrigation Syphon 0 0 0 0 0 Bed Dam 0 0 0 0 0 Grade Wall 0 0 0 0 0 Road bridge 12 0 0 0 12 Foot Bridge 2 0 0 0 2 Railway Bridge 1 0 0 0 1 Other-drinking water pipeline 2 0 0 0 2 Total (1) 76 23 19 13 21
Note (1) in addition, there are two abandoned structures and 6 derelict structures that should be removed so that they do not impeded flow.
The new structures comprise of one new TER located 12.50 km downstream of the
existing Umbalachary TER and one new CRR located at Chainage 139.68 to retain flood and
drainage water.
Twelve drainage infall sluices will be constructed on open infalls to allow continuous road access
along the side of the river channel and prevent backflow from the river into the drainage
catchments. 23 structures need reconstruction and 19 structures need repair. The salient features
of the design of the new and reconstructed regulators are shown in Table 13.8.
5 Repair is defined as the restoration of components of the structure to function as designed. Minor repairs include replacing plaster, replacement of a gate. Major repairs include replacement of one component of the structure such as a wing wall or sidewall.
6 Re-construction is defined as demolition and removal of all components of an existing structure and construction of new structure including foundations on the same site.

188
Table 13.8: Salient Features of Designed Structures, Adappar Name Units HER Thiruvalanjuli
CRR New CRR Pamini CRR Umbalcherry CRR New TER
Chainage (km) 130.236 136.37 139.676 145 156.1 163.7 Design Flood (m3/s) 8.82 28.36 39.6 67.76 91.13 155 U/S River bed Level (m) 6.1 4.46 3.55 1.53 -1.63 -0.78 D/S River bed Level (m) 6.1 3.86 3.35 1.41 -1.63 -1.24 U/S FSL (m) 8.74 6.59 6.3 4.34 3.59 2.49 D/S FSL (m) 7.93 6.15 5.84 4.08 3.06 1.9 Channel Width (m) 8 U/S 24m
D/S 24m U/S 25m D/S 25m
U/S 35m D/S 35m
U/S 30m D/S 31m
U/S 40m D/S 55m
Sill Level (m) 6.325 5 4.65 1.82 0.01 0 Clear Waterway (m) 1.8 9 12 18 18 36 No. and Size of Vents 2 vents
Width = 0.9m Height = 3.02 m
3 vents Width= 3 m
Height =2.2 m
4 vents Width= 3 m
Height=2.3 m
6 vents Width = 3m
Height = 3.1 m
6 vents Width = 3m
Height = 4.2 m
9 bay Width = 4m
Height = 3.1 m Overall Waterway (m) 3 11.4 15.6 24 24 45.6 Total Floor Length (m) 7.29 20.36 23.2 19.4 45.26 30.7 U/S Floor Thickness (m) 0.6 0.5 0.5 0.5 0.5 0.5 D/S Floor Thickness - Range
(m) 1.12 Variable from 0.54m to 1.3m
Variable from 0.83 m to 1.36 m
Variable from 1.02m to 1.41m
Variable from 0.98m to 2.66 m
Variable from 0.89m to 1.84m
Cutoff wall depth U/S (m) 3.2 1.31 1.9 1.54 2.34 2.28 Cutoff wall depth D/S (m) 4.01 1.75 2.16 1.94 2.95 2.17
U/S Protection (CC Blocks)
Thickness = 0.9 m Length = 9 m
Thickness = 0.6 m Length =9 m
Thickness = 0.6 m Length =8 m
Thickness = 0.6 m Length =9 m
Thickness = 0.6 m Length = 9 m
Thickness = 0.6 m Length =9 m
D/S Protection (CC Blocks)
Thickness = 0.9 m Length = 11 m
Thickness = 0.6 m Length =9 m
Thickness = 0.6 m Length =9 m
Thickness = 0.6 m Length =10 m
Thickness = 0.6 m Length = 8.5 m
Thickness = 0.9 m Length =11 m
Note: Structures were designed for Q50

189
The locations where fluming7 8 and river training8 9 is provided are shown in Table 13.9.
Table 13.9: Location of Fluming and River Training, Adappar Chainage (km) Length (m) Type of Protection From To 134.100 134.900 800 Retaining Wall 135.100 135.700 600 Retaining Wall 138.390 138.590 200 Retaining wall (Left Bank) 138.790 138.990 200 Retaining wall (Left Bank)
13.3.3 Harichandra River
13.3.3.1 Description of the Harichandra River
The Harichandra takes off from the Koraiyar River at the Harichandra Head Regulator at
Chainage 121.142 km. The length of the river is 40 km and its alignment is predominantly west to
east as shown in Figure 13.20.
The irrigation design discharge at the head regulator is 25.77 m3/s serving an ayacut of
3600 ha through 56 irrigation head sluices. The purpose of the Harichandra as predominantly an
irrigation delivery channel is illustrated by considering the middle reach (From Chainage 134.67
km to Chainage 140.4 km) shown in Figure 13.21. Along this reach, there are 12 irrigation head
sluices of which 11 are on the right bank. Drainage from these 11 ayacuts flows into the Adappar
river, not back to the Harichandra river. The Ambodiar HS provides water to the Adappar to
irrigate 4747 ha in its lower reaches. The Ambodirajan HS irrigates 1360 ha on the Adappar left
bank.
There are several large drainage infalls along the Harichandra. For example, the Vennar
Chitar Infall adjacent to the Harichandra Head Sluice (at Chainage 121.16 km) has a catchment of
979 ha that is upstream of the Harichandra command area. Further downstream at Chainage
131.450 km, there is the Athiveeraramanar Chittar infall with a catchment area of 1193 ha but the
channel is also connected to the Vennar river at the Athiveeramanar Regulator. In addition, the
main Vennar River falls into the Harichandra at Chainage 138.48 km.
8 Fluming is defined as provision of vertical retaining walls either side of a channel. Fluming is provided in reaches where it is not
possible to re-section the channel with the standard trapezoidal section due to physical constraints such as lack of government land for widening the channel.
9River training is defined as provision of hard protection on one bank of the channel to prevent scour. The hard protection can be either inclined block protection or a vertical concrete retaining wall.

190
The upper reach of the Harichandra passes through rural areas with only occasional
settlements nearby and poor road access. From about Chainage 126.03 km downstream, there is
paved road access along at least one side of the river and there are several settlements/built-up
areas close to the river, especially around road bridges.
Flooding on the Harichandra in 2008 took place mainly in the lower reaches where the bed
slope flattens as the river enters the coastal plain (see Figure 13.6).

191
Figure 13.18: Alignment Map, Harichandra

192
Figure 13.19: Structures on Middle Harichandra Distance
(km) Area / Discharge
(ha/m3/s)
Area / Discharge (ha&m
3/s)
121.142 Harichandra HS 3600.58/25.77
134.673 Road bridge Road bridge
135.474 Keeranthi Voikal HS No data
136.007 Andangarai Drainage syphon 2170.42/2.85
136.910 Komal Vadikal Drain
Infall 686.75/4.64
137.600 Keeranthi state seed farm HS No data
137.537 Ambodiar HS 4650.44/9.31
137.537 Ambodirajan HS 1360.672.72
137.537 Keeranthi Regulator 8724.78/12.03
Keeranthi Regulator 8724.78/12.03
137.537 Adanur Drainage Syphon 1822.44/3.90
137.730 Kurumbal HS 163.22/0.34
137.730 Kurumiyur HS 177.36/0.34
137.886 Nattuvoikal Drain Infall 1221.34/7.47
138.469 Railway bridge Railway bridge
138.479 Vennar river infall 604.60/17.19
138.690 RCC road bridge RCC road bridge
139.052 Tholudur HS 26.26/0.05
139.373 Manali HS 150.75/0.32
139.383 Sathanngudi HS 160.60/0.32
139.434 Palayangudi HS 134.53/0.27
139.897 Kodivinayan-gannallur HS 957.88/1.92
140.358 Sembiyaveleur HS 115.14/0.23
140.447
Alathambadi Regulator 6879.31/13.75
Alathambadi Regulator 6879.31/13.75
Legend
Irrigation outlet
Drainage Inlet
Cross regulator
Road or railway bridge
Drainage Siphon
Main channel

193
13.3.3.2 Modelling to Assess Channel Improvements
Model Domain
The Harichandra model has two upstream and one downstream boundary. The
upstream boundaries are located at the Athiveeramana and Harichandra head regulators (see
Figure 13.18). The HECRAS model is terminated at the Brinji Moolai tail end regulator
providing inflow to the TELMAC2D model. The drainage from surrounding land is derived
from the results of SWAT and is allocated to the appropriate reach of the river based on the
SWAT catchments. The flows are assumed to be distributed uniformly along each reach.
PMSL cross-sections and reach lengths are used throughout the model. It was noted that the
bed levels in the Athiveeramanar are higher than in the Harichandra giving a step at the
junction between the two rivers.
Validation
The HECRAS model was run for the period 2001 to 2012 and the simulated flow at the
tail end regulator was compared with the flows recorded by WRD. Uncertainties include:
Measurement errors (including the calibration and errors caused by-pass flow); SWAT inflows; Assumptions about the status of regulators; and Canal roughness.
In the absence of recorded level data the tail end flows were used to adjust the SWAT
inflows and to check on the volume of water that leaves the main channel as spill. The model
does not simulate flood plain storage or the return of water to the main channel. Therefore,
the validation has been limited to the prediction of peak flows. Figure 13.20 shows the
comparison between simulated and recorded peak flows. It was found that the SWAT flows
had to be reduced by 30% and that the inflow to the head of the rivers was limited to 10%.
Although not perfect, this comparison does show a reasonable correlation between simulated
and recorded peak flows, given the dependency on SWAT inflows and the lack of flood plain
topography.

194
Furthermore, a comparison of the simulated and recorded daily flows indicates that the
HECRAS model is a reasonable fit to the recorded values as shown in Figure 13.20.
Moreover, the plot confirms that the simulated recession should be treated with caution as
there is evidence in the recorded flows that the recession is effected by storage and return
flow.
Figure 13.20: Simulated and Recorded maximum flood flows

195
Figure 13.21: Comparison of Simulated and Recorded Flow for November 2008
The reduction in the SWAT flows is supported by the evidence from WRD and field
visits that the area draining to the river is not always contingent with the natural catchment.
The low flow at the head regulators is supported by evidence from WRD who state that the
gates are closed during flood flows.
Channel roughness (Manning’s n values) was set at 0.1 for out of main channel
regions and 0.035 for the main channel.
Results
The model run for the 2008 event with the river in its existing condition indicates that
the peak water levels over-topped the bank levels at several locations. These locations are
broadly similar to the flooded areas indicated on the 2008 flood map (Figure 13.6). In
particular the flooding upstream of Keeranthi, Alathampadi, Alangudi and Brinji Moollai
regulators is replicated in the model.
The simulated long profile for one scenario is illustrated in Figure 13.22 None of the
regulators were drowned or over-topped during the 2008 event which is consistent with the
observations of WRD and evidence gathered during the field visits.

196
Figure 13.22: Simulated Long Profile for the Harichandra in its Existing State
0 10000 20000 30000 40000 50000-4
-2
0
2
4
6
8
10
12
14
16
HN (final) Plan: Plan 21 22/03/2014
Main Channel Distance (m)
Ele
vatio
n (
m)
Legend
WS Max WS
Ground
Left Levee
Right Levee
Harichandranathi Middle Harichandranathi Upper
Feasibility Proposal for the River Channel
For the feasibility study, the first option considered was to improve the conveyance
efficiency of the river channel by re-sectioning the channel and standardising the banks
(where required) to contain the design flood flow (Q25) with 1.0 m freeboard. The geometry
of the model cross sections was adjusted to accommodate these changes and the model re-run
to determine the impact on flows and water levels. After consideration, WRD determined
that this option was not practical as government land was not available to widen the channel
plus it would cause too much disruption to irrigation flows. Therefore a second option of re-
grading9 the bed and standardising the banks was assessed. The geometry of the model cross
sections was adjusted to accommodate these changes and the model re-run to determine the
impact on flows and water levels. This second option was acceptable to WRD.
9 Re-grading is defined as the excavation of the channel bed to remove sand bars and vegetation to restore the channel to a
smooth gradient.

197
The results of re-grading the channel and standardizing the banks are shown in Figure
13.23. The calculated discharges for Q25, Q25 with climate change (CC), Q50 and Q50 CC,
and Q100 and Q100 CC and the respective water levels for the existing and post-project
channel are shown in Table 13.10. Similar to the Adappar, Q25 discharges increase by about
20% with climate change and Q25 with climate change is greater than the Q50 without
climate change. Water levels increase by about 15 % with climate change.

198
Figure 13.23 Long Section of the Harichandra River

199
Table 13.10: Design Discharges and Water Levels for Different Floods, Harichandra
Scenario Name of Structures
HER Kunniyur CRR
Keeranthi CRR Alathambadi CRR
Alangudi CRR
Brinjimoolai CRR
New TER
Q25 Discharge (m3/s) 7.35 37.90 106.30 129.41 139.53 129.41 139.53
WL existing (m) 11.86 11.60 8.01 7.39 6.03 4.22 2.42
WL post Project (m) 11.17 10.96 7.26 6.62 5.65 3.62 1.65
Q25cc Discharge (m3/s) 7.35 54.12 128.04 133.17 151.23 159.45 172.11
WL existing (m) 12.12 11.84 9.22 8.14 6.74 4.95 2.77
WL post Project (m) 11.55 11.14 8.43 7.78 6.40 4.48 2.02
Q50 Discharge (m3/s) 7.35 50.56 120.53 124.94 140.31 147.6 159.02
WL existing (m) 12 11.72 8.82 7.89 6.49 4.69 2.65
WL post Project (m) 11.41 10.97 7.95 7.47 6.12 4.2 1.87
Q50cc Discharge (m3/s) 7.35 62.09 152.12 158.38 178.72 187.74 202.38
WL existing (m) 12.64 12.41 10.39 8.53 7.15 5.42 3
WL post Project (m) 11.9 11.53 9.18 8.43 7.02 5.13 2.35
Q100 Discharge (m3/s) 7.24 56.84 140.64 146.64 166.51 175.64 188.61
WL existing (m) 12.26 12.00 9.55 8.31 6.91 5.14 2.85
WL post Project (m) 11.69 11.31 8.88 8.15 6.75 4.85 2.21
Q100cc Discharge (m3/s) 7.21 70.31 179.03 186.98 213.26 225.38 242.5
WL existing (m) 14.67 14.55 12.98 7.75 6.71 5.12 2.9
WL post Project (m) 12.34 12.01 9.81 9.08 7.66 5.83 2.74

200
Discussion and Recommendations
The availability of flow records for this river has allowed validation of the
assumptions pertaining to the SWAT inflows and the bank heights. Furthermore, the
simulated water levels at regulators are consistent with WRD observations during the 2008
event. Finally, there is consistency between the areas flooded in 2008 and the locations where
the model simulates out-of bank flow. The model can be used with confidence to appraise
feasibility options. To improve confidence in the model for detailed design or the
development of operational rules it is recommended that water levels and flow are recorded
during flood flows and used to improve the calibration
The lower reach of the Harichandra downstream of the existing Brinjimoolai TER
from Chainage154.107 km to the new TER at Chainage 160.020 km are located in CRZ-2
and CRZ-3 (See Figure 3.6A). Dredging would have to stop 100 m from the outfall to the sea
to avoid interference with beach which is located in CRZ-1.
13.3.3.3 Improving Structures
In the absence of an up-to-date component register, the structures of the Harichandra
were surveyed to assess their condition and identify the need for repair or reconstruction and
for new structures. The findings are summarised in Table 13.11 and listed in more detail in
Annex 3.
Table 13.11: Recommendations for Improving Structures, Harichandra River
Name Of Structure Total
Number Re-constructed
Rehabilitated/ repaired
New No
work Regulators (head, cross and tail)
7 2 4 1 0
Irrigation Head Sluice 56 31 18 2 5 Drainage Sluice / Drainage Infall Sluice
19 7 6 6 0
Syphon 7 5 1 0 1 Grade Wall 4 0 2 2 0 Road bridge 13 0 3 0 10 Foot Bridge 12 2 3 0 7 Railway Bridge 2 0 0 0 2 Other-drinking water pipeline
1 0 0 0 1
Total (1) 123 48 38 11 26
Note (1) in addition, there are 8 abandoned structures and 2 derelict structures that should be removed so that they do not impeded flow.

201
The new structures comprise of one new TER located 6 km downstream of the
existing Brinji Moolai TER. The new TER is located as shown in Figure 3.6A. Two new
irrigation head sluices will be constructed just upstream of the new TER to provide
supplementary irrigation water to the lower reaches of the RajanVoikal canal on the right
bank and water for shrimp farms and agriculture on the left bank. In addition, 5 drainage
infall sluices will be constructed on open infalls to allow continuous road access along the
side of the river channel and prevent backflow from the river into the drainage catchments
plus two grade walls. 48 structures need reconstruction and 38 structures need repair.
The salient features of the design of the new and reconstructed regulators are shown in
Table 13.12. In addition to the regulators, sample designs were prepared for a grade wall (at
Chainage 133.70 km) and the Solvadiar Drainage infall (at Chainage 144.117 km) and the
capacity of the Irrigation Head Sluice (at Chainage 144.579 km) was checked. Details of the
two designs and the checking of the Irrigation Head Sluice are given in Annexure 3.

202
Table 13.12: Salient Features of Designed Structures, Harichandra Name Units Keeranthi CRR Brinjmoolai CRR New TER Grade Wall Slovadiar Drainage
Infall Chainage (km) 128.95 154.1 160.01 133.70 144.12 Design Flood (Q50) (m3/s) 117 140 149 106.63 9.2 U/S River bed Level (m) 2.74 -0.43 -1.55 4.56 2.31 D/S River bed Level (m) 1.75 -0.44 -1.52 4.35 2.31 U/S FSL (m) 6.44 4.29 2.74 8.27 6.14 D/S FSL (m) 5.91 3.9 2.48 8.11 6.1 Channel Width (m) U/S 30 m
D/S 30 m U/S 35m D/S 40m
U/S 40m D/S 50m
U/S 30m D/S 30m
U/S 4m D/S 4m
Sill Level (m) 3.95 0.23 0 5.8 2.75 Clear Waterway (m) 27 24 32 30 4 No. and Size of Vents 9 vents
Width = 3 m Height = 3.1 m
8 vents Width= 4 m
Height = 4.7 m
8 vents Width = 4m
Height = 3.3 m
1 vents Width = 30 m
Height =N/A
2 bay Width = 2m Height = m
Overall Waterway (m) 36.6 32.4 40.4 30 5.2 Total Floor Length (m) 39.52 38.37 32.4 29.11 27.52 U/S Floor Thickness (m) 0.5 0.5 0.5 0.6 0.5
D/S Floor Thickness - Range (m) Variable from 1.11 m to 2.39m
Variable from 1.38 m to 2.37m
Variable from 1.48 m to 2.13 m
Variable from 0.96 m to 1.98 m
Variable from 0.86 m to 1.91 m
Cutoff wall depth U/S (m) 1.83 2.17 2.03 1.83 1.88 Cutoff wall depth D/S (m) 2.68 2.77 2.6 2.48 2.5
U/s Protection (CC Blocks)
Thickness = 0.6 m Length = 8 m
Thickness = 0.6 m Length =8 m
Thickness = 0.6 m Length =8 m
Thickness = 0.6 m Length = 7 m
Thickness = 0.9 m Length =5 m
U/s Protection (CC Blocks)
Thickness = 0.6 m Length = 10.5 m
Thickness = 0.6 m Length =10.5 m
Thickness = 0.6 m Length =10 m
Thickness = 0.6 m Length = 9.5 m
Thickness = 0.9 m Length =6.5 m

203
The locations of the fluming and river protection to be provided on the Harichandra are shown in Table 13.13.
Table 13.13: Location of Protection Walls/ Revetments, Harichandra
Chainage (km) Length (m) Type of Protection From To REACH I 123.200 123.500 300 Protection Wall RB&LB 123.500 123.700 200 Protection Wall RB&LB 123.800 124.000 200 Protection Wall RB&LB 126.000 126.300 300 Protection Wall RB&LB 126.500 126.600 100 Protection Wall RB&LB REACH II 126.200 126.260 60 Protection Wall RB&LB 126.970 127.050 50 Protection Wall RB&LB 128.000 128.050 50 Protection Wall RB&LB 128.200 128.250 50 Protection Wall RB&LB 129.330 129.370 40 Protection Wall RB&LB 129.690 129.790 100 Protection Wall RB&LB 131.120 131.170 50 Protection Wall RB&LB 131.440 131.490 50 Protection Wall RB&LB 132.550 132.600 50 Protection Wall RB&LB 135.500 135.550 50 Protection Wall RB&LB 136.950 137.025 75 Protection Wall RB&LB REACH III 139.250 139.500 250 Protection Wall RB&LB 140.200 141.200 1000 Protection Wall RB&LB REACH IV 147.550 148.100 550 Protection Wall RB 147.700 148.030 330 Protection Wall LB 149.600 150.050 450 Protection Wall RB&LB 150.650 150.950 300 Protection Wall LB 154.050 154.160 110 Protection Wall LB 154.250 154.300 50 Protection Wall RB&LB 160.010 160.160 150 Protection Wall RB&LB
13.3.4 Vellaiyar
13.3.4.1 Description of the Vellaiyar River
The Vellaiyar offtakes from the Vennar River at the Vellaiyar head regulator at
Chainage 111.65 km. The alignment of the Vellaiyar River is shown in Figure 13.24.
The upper reach of the Vellaiyar has an interesting feature in that the channel passes
through four 90o bends before following a linear alignment downstream. Close to its
confluence with the Pandavayar River, the channel again goes through a number of 90o
bends. Whether the river’s present alignment is natural or man-made is not known. It is
unfortunate that there are no records of how these rivers evolved. Designs or as-constructed
drawings are not available for any Vennar System works.
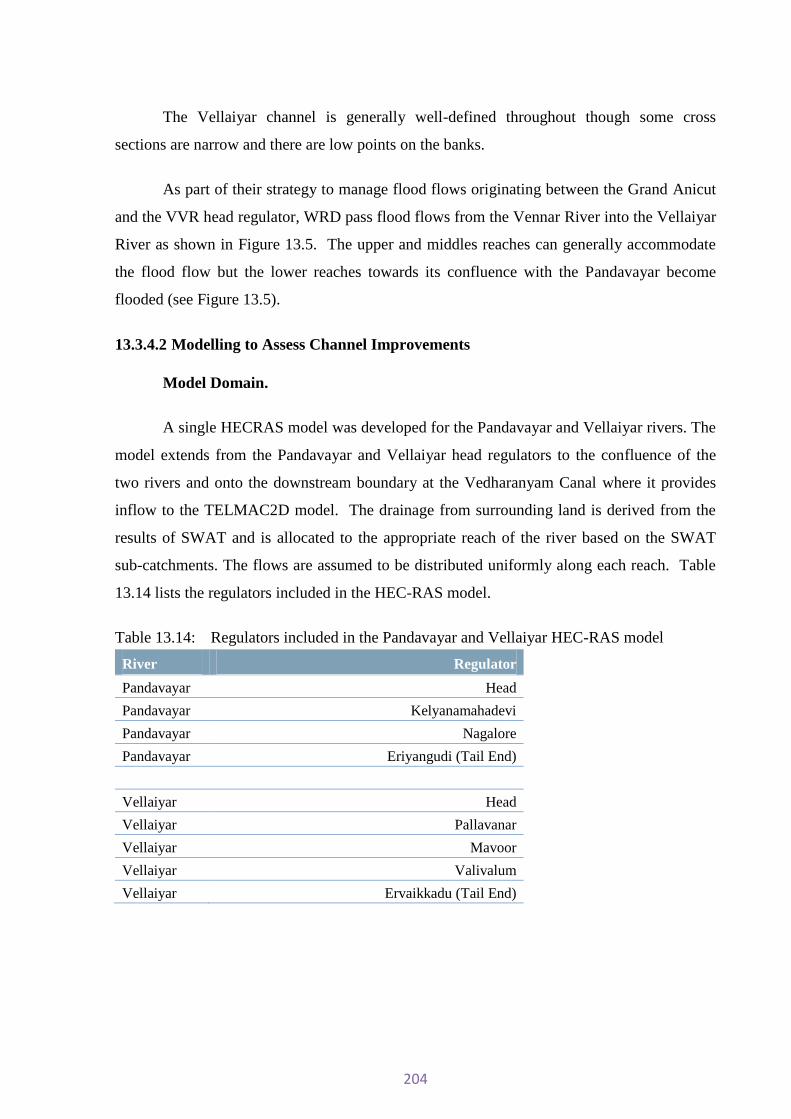
204
The Vellaiyar channel is generally well-defined throughout though some cross
sections are narrow and there are low points on the banks.
As part of their strategy to manage flood flows originating between the Grand Anicut
and the VVR head regulator, WRD pass flood flows from the Vennar River into the Vellaiyar
River as shown in Figure 13.5. The upper and middles reaches can generally accommodate
the flood flow but the lower reaches towards its confluence with the Pandavayar become
flooded (see Figure 13.5).
13.3.4.2 Modelling to Assess Channel Improvements
Model Domain.
A single HECRAS model was developed for the Pandavayar and Vellaiyar rivers. The
model extends from the Pandavayar and Vellaiyar head regulators to the confluence of the
two rivers and onto the downstream boundary at the Vedharanyam Canal where it provides
inflow to the TELMAC2D model. The drainage from surrounding land is derived from the
results of SWAT and is allocated to the appropriate reach of the river based on the SWAT
sub-catchments. The flows are assumed to be distributed uniformly along each reach. Table
13.14 lists the regulators included in the HEC-RAS model.
Table 13.14: Regulators included in the Pandavayar and Vellaiyar HEC-RAS model
River Regulator
Pandavayar Head
Pandavayar Kelyanamahadevi
Pandavayar Nagalore
Pandavayar Eriyangudi (Tail End)
Vellaiyar Head
Vellaiyar Pallavanar
Vellaiyar Mavoor
Vellaiyar Valivalum
Vellaiyar Ervaikkadu (Tail End)

205
Figure 13.24: Alignment of the Vellaiyar and Pandavayar Rivers

206
PMSL cross sections are available downstream of the Vellaiyar head regulator to the
Vellaiyar straight cut. On the Pandavayar River, PMSL cross sections are available only from the
existing TER to its junction with the Vellaiyar River. PWD cross sections were used for the reach
from the Pandavayar Head Regulator to the Existing Pandavayar TER.
Validation
The HEC-RAS model was run for the period 2001 to 2012 and the simulated flow at the tail end
regulator was compared with the flows recorded by PWD. Uncertainties include:
Measurement errors (including the calibration and errors caused by by-pass flow);
SWAT inflows;
Assumed gate settings of the regulators; and
Channel roughness.
Recorded flows at both head regulators were input to the model. SWAT simulated flows were
used to represent drainage that enters the rivers from rainfall catchments between the head and tail
regulators. In the absence of recorded level data the tail end flows were used to adjust the SWAT
inflows and to check on the volume of water that leaves the main channel as spill. The model does
not simulate flood plain storage or the return of water to the main channel. Therefore, the
validation has been limited to the prediction of peak flows and the results were reasonable for the
Vellaiyar, as shown in Figure 13.25.
Figure 13.25 : Observed and simulated annual maximum flows at Eravankkadu Regulator (Vellaiyar)
R² = -0.346
0.0
5.0
10.0
15.0
20.0
25.0
30.0
35.0
40.0
45.0
0.0 2.0 4.0 6.0 8.0 10.0
Ob
serv
ed
(m
3/
s)
Simulated (m3/s)
November 2008

207
The validation for the Pandavayar River at the Erayankudi TER is poor when all annual
maxima are included (see Figure 13.26). This could well be due to the poor data quality and by-
pass flows as well as model set up. Given that for other rivers a reasonable validation could be
achieved it is thought most likely that the large differences are due to measurement error.
Figure 13.26: Observed and simulated annual maximum flows at Eriyangudi Regulator (Pandavanar)
R² = -2.013
0.0
5.0
10.0
15.0
20.0
25.0
30.0
35.0
40.0
45.0
0.0 10.0 20.0 30.0 40.0 50.0 60.0
Ob
serv
ed
(m
3/
s)
Simulated (m3/s)
November 2008
The outliers with very low simulated flows are caused by dubiously low recorded flows at
the head regulator. When these points are removed the validation is quite reasonable as shown in
Figure 13.27.
Figure 13.27: Observed and simulated annual maximum flows at Eriyangudi Regulator (Pandavanar) with dubious values removed
R² = 0.9224
0.0
5.0
10.0
15.0
20.0
25.0
30.0
35.0
40.0
45.0
0.0 10.0 20.0 30.0 40.0 50.0 60.0
Ob
serv
ed
(m
3/
s)
Simulated (m3/s)
November 2008

208
The inflows simulated by SWAT were reduced by 20% for an optimal fit. The recorded inflows at the head regulators were unadjusted. This exercise confirms that the modelled levels are reasonable and that the 2008 event can be used as the basis for design. Channel roughness (Manning’s n values) was set at 0.1 for out of main channel regions and 0.035 for the main channel.
Results
The 2008 flood map indicates that flooding occurred upstream of the regulators for both
rivers and also at their confluence. The NRSC flood map (Figure 13.6) shows very little flooding
associated with the Vellaiyar although it is recognised that the flood map is subject to some
uncertainty. The model run for the 2008 event and the rivers in their existing state indicates that
almost no flooding is simulated for the Pandavayar (see Figure 13.28). The model predicts the
Kelyanamahadevi and Nagdoor regulators were inundated which is consistent with the flood map.
However, these results should be treated with some caution as the model relies on crude idealised
cross sections upstream of the Erayankudi tail end regulator.
Figure 13.28 : Simulated 2008 water levels for the Pandavayar river in its existing state
0 5000 10000 15000 20000 25000 30000 35000 40000-5
0
5
10
15
20
Panadavayar-Vellaiyar-Final_01 Plan: Pan_2008_existing 23/03/2014
Main Channel Distance (m)
Ele
vatio
n (
m)
Legend
WS 28NOV2008 2400
Ground
Left Levee
Right Levee
Panadavayar Panadavayar
The model indicates very little flooding along the Vellaiyar river (See Figure 13.29).
There is some flooding where the embankments are particularly low between the head regulator
and the Pallavanar regulator. Localised flooding is also simulated upstream of the tail end
regulator and the confluence with the Pandavayar river. This is broadly consistent with the 2008
flood map (See Figure 13.6).
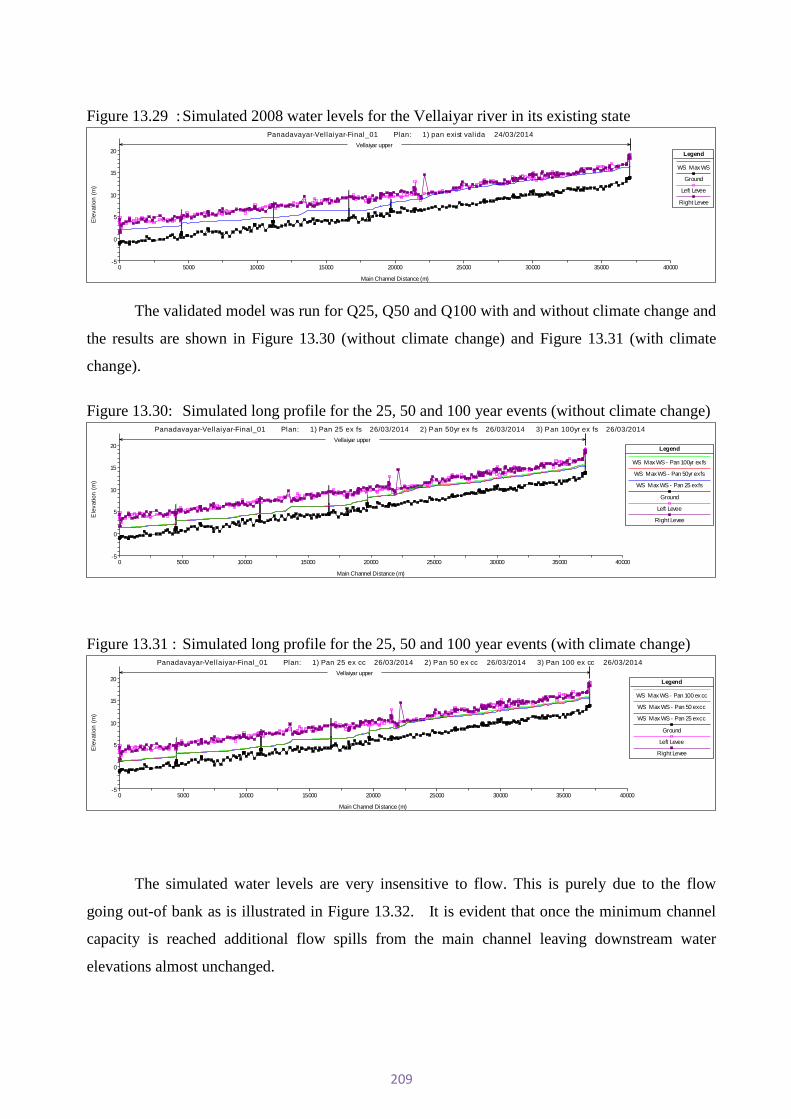
209
Figure 13.29 : Simulated 2008 water levels for the Vellaiyar river in its existing state
0 5000 10000 15000 20000 25000 30000 35000 40000-5
0
5
10
15
20
Panadavayar-Vellaiyar-Final_01 Plan: 1) pan exist valida 24/03/2014
Main Channel Distance (m)
Ele
vatio
n (
m)
Legend
WS Max WS
Ground
Left Levee
Right Levee
Vellaiyar upper
The validated model was run for Q25, Q50 and Q100 with and without climate change and
the results are shown in Figure 13.30 (without climate change) and Figure 13.31 (with climate
change).
Figure 13.30: Simulated long profile for the 25, 50 and 100 year events (without climate change)
0 5000 10000 15000 20000 25000 30000 35000 40000-5
0
5
10
15
20
Panadavayar-Vellaiyar-Final_01 Plan: 1) Pan 25 ex fs 26/03/2014 2) Pan 50yr ex fs 26/03/2014 3) Pan 100yr ex fs 26/03/2014
Main Channel Distance (m)
Ele
vatio
n (
m)
Legend
WS Max WS - Pan 100yr ex fs
WS Max WS - Pan 50yr ex fs
WS Max WS - Pan 25 ex fs
Ground
Left Levee
Right Levee
Vellaiyar upper
Figure 13.31 : Simulated long profile for the 25, 50 and 100 year events (with climate change)
0 5000 10000 15000 20000 25000 30000 35000 40000-5
0
5
10
15
20
Panadavayar-Vellaiyar-Final_01 Plan: 1) Pan 25 ex cc 26/03/2014 2) Pan 50 ex cc 26/03/2014 3) Pan 100 ex cc 26/03/2014
Main Channel Distance (m)
Ele
vatio
n (
m)
Legend
WS Max WS - Pan 100 ex cc
WS Max WS - Pan 50 ex cc
WS Max WS - Pan 25 ex cc
Ground
Left Levee
Right Levee
Vellaiyar upper
The simulated water levels are very insensitive to flow. This is purely due to the flow
going out-of bank as is illustrated in Figure 13.32. It is evident that once the minimum channel
capacity is reached additional flow spills from the main channel leaving downstream water
elevations almost unchanged.
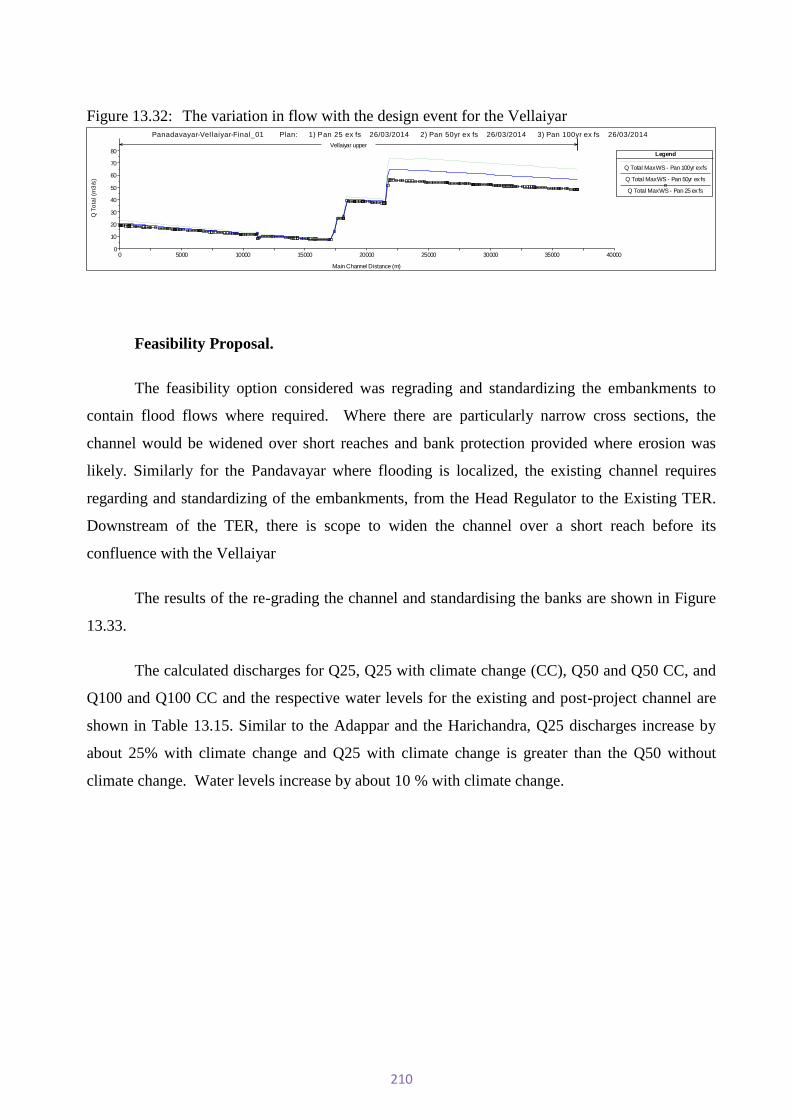
210
Figure 13.32: The variation in flow with the design event for the Vellaiyar
0 5000 10000 15000 20000 25000 30000 35000 400000
10
20
30
40
50
60
70
80
Panadavayar-Vellaiyar-Final_01 Plan: 1) Pan 25 ex fs 26/03/2014 2) Pan 50yr ex fs 26/03/2014 3) Pan 100yr ex fs 26/03/2014
Main Channel Distance (m)
Q T
ota
l (m
3/s
)
Legend
Q Total Max WS - Pan 100yr ex fs
Q Total Max WS - Pan 50yr ex fs
Q Total Max WS - Pan 25 ex fs
Vellaiyar upper
Feasibility Proposal.
The feasibility option considered was regrading and standardizing the embankments to
contain flood flows where required. Where there are particularly narrow cross sections, the
channel would be widened over short reaches and bank protection provided where erosion was
likely. Similarly for the Pandavayar where flooding is localized, the existing channel requires
regarding and standardizing of the embankments, from the Head Regulator to the Existing TER.
Downstream of the TER, there is scope to widen the channel over a short reach before its
confluence with the Vellaiyar
The results of the re-grading the channel and standardising the banks are shown in Figure
13.33.
The calculated discharges for Q25, Q25 with climate change (CC), Q50 and Q50 CC, and
Q100 and Q100 CC and the respective water levels for the existing and post-project channel are
shown in Table 13.15. Similar to the Adappar and the Harichandra, Q25 discharges increase by
about 25% with climate change and Q25 with climate change is greater than the Q50 without
climate change. Water levels increase by about 10 % with climate change.
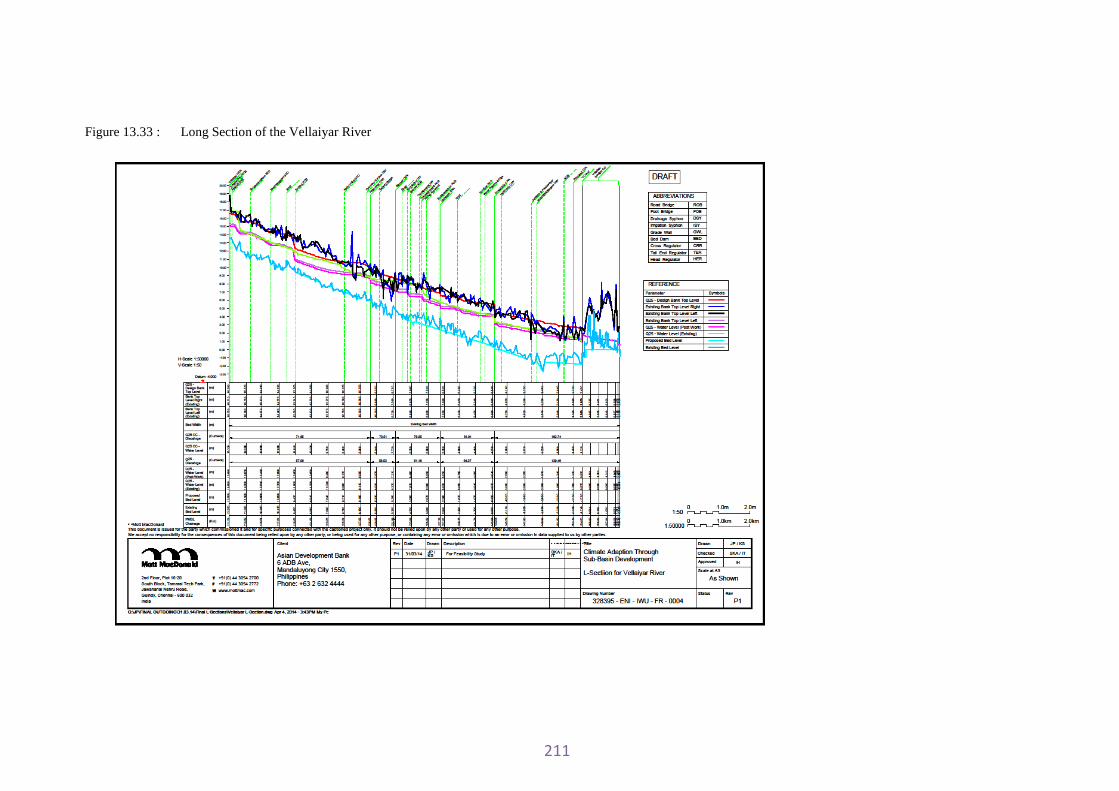
211
Figure 13.33 : Long Section of the Vellaiyar River

212
Table 13.15 Design Discharges and Water Levels for Different Floods, Vellaiyar
Scenario Name of Structures
Vellaiyar HER
Pallavanar CRR Mavoor CRR
Valivalum CRR
Eruvoikadu CRR
New TER
Q25 Discharge (m3/s) 48.46 57.06 58.52 61.16 64.37 129.46
WL existing (m) 16.90 8.78 8.33 5.75 3.94 1.39
WL post Project (m) 16.34 8.60 7.07 5.36 4.03 1.22
Q25cc Discharge (m3/s) 60.96 71.65 73.51 76.85 81.01 162.74
WL existing (m) 17.22 9.62 8.77 6.05 4.15 1.60
WL post Project (m) 16.58 8.90 7.61 5.6 4.26 1.43
Q50 Discharge (m3/s) 56.27 66.33 68.02 71.09 74.91 150.17
WL existing (m) 17.10 9.37 8.6 5.94 4.11 1.53
WL post Project (m) 16.49 8.78 7.44 5.51 4.22 1.36
Q50cc Discharge (m3/s) 71.38 83.31 85.52 89.42 94.28 190.27
WL existing (m) 17.48 10.14 9.15 6.25 4.24 1.74
WL post Project (m) 16.76 9.31 7.98 5.78 4.36 1.57
Q100 Discharge (m3/s) See Note (1) See Note (1) See Note (1) See Note (1) See Note (1) See Note (1)
WL existing (m)
WL post Project (m)
Q100cc Discharge (m3/s) See Note (1) See Note (1) See Note (1) See Note (1) See Note (1) See Note (1)
WL existing (m)
WL post Project (m)
Note (1): HECRAS Model became unstable at higher flows may in part because several cross sections in the Upper Reaches were much narrower than their neighbours. Without further field survey, it was not possible to
refine the model sections further. Hence the results are not given here.

213
Discussion and Recommendations
The availability of flow records for this river has allowed validation of the assumptions about the
SWAT inflows and the bank heights. Furthermore, the simulated water levels at regulators are not
inconsistent with WRD observations during the 2008 event. Finally, there is consistency between
the areas flooded in 2008 and the locations where the model simulates out-of bank flow. The
model can therefore be used with confidence to model the design events and to appraise feasibility
options. To improve confidence in the model it is recommended that water level and flow
monitoring instruments are installed at the head and tail end regulators and selected mid-
regulators. It is important that the design and installation of this equipment conforms to current
bets practise. Improving the cross sections upstream of the Erayankudi tail end regulator will give
significant improvements in the prediction of water levels upstream of this structure. The
availability of a DEM to define the flood plain areas is essential for the accurate mapping of
flooded areas and to simulate the movement of water between flood plain storage and the main
channel. It is particularly important for the comparison of out-of bank events.
13.3.4.3 Improvements to Structures
The existing component register was prepared in 1928 and has not been updated since
then. Hence the structures of the Vellaiyar were surveyed to assess their current condition and
identify the need for repair or reconstruction and for new structures. The findings are summarised
in Table 13.16 and listed in more detail in Annex 3. Many of the structures on the Vellaiyar are in
very poor condition as compared to structures on the Adappar or Harichandra. The lack of regular
maintenance due to non availability of funds has resulted in several structures no longer
functioning as designed due their dilapidated condition including absence of gates or collapsed
barrels.

214
Table 13.16 : Recommendations for Improving Structures, Vellaiyar River Name Of Structure Total
Number Re-constructed Rehabilitated/
Repaired New No work
Regulators (head, cross and tail) 6 2 3 1 0 Irrigation Head Sluice 35 23 12 0 0 Drainage Sluice 13 12 1 0 0 Drainage Infall 6 0 1 4 1 Drainage Syphon 4 2 2 0 0 Irrigation Syphon 0 0 0 0 0 Bed Dam/Grade Wall 7 0 6 1 0 Road bridge 13 0 0 1 12 Foot Bridge 0 0 0 0 0 Railway Bridge 1 0 0 0 1 Aquaduct 1 1 0 0 0
Total 86 40 25 7 14
One new TER will be provided 9km downstream of the existing Vellaiyar TER.
In addition, 4 new drainage infall sluices will be provided one bed dam/ grade wall. 40
structures will be reconstructed including 23 irrigation head sluices, 12 drainage sluices and 2
drainage syphons. 25 structures will be repaired.
The salient features of design of the major new or reconstructed structures are shown in
Table 13.17. Full details of the design are given in Annexure 3.
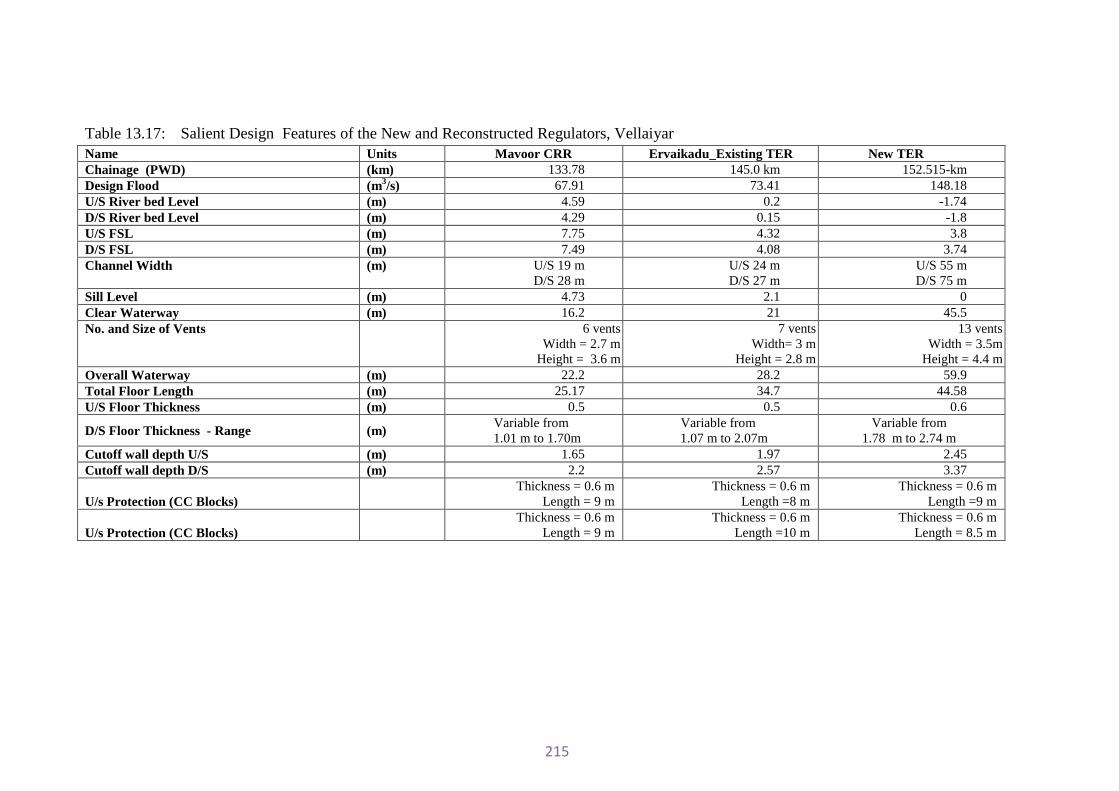
215
Table 13.17: Salient Design Features of the New and Reconstructed Regulators, Vellaiyar Name Units Mavoor CRR Ervaikadu_Existing TER New TER Chainage (PWD) (km) 133.78 145.0 km 152.515-km Design Flood (m3/s) 67.91 73.41 148.18 U/S River bed Level (m) 4.59 0.2 -1.74 D/S River bed Level (m) 4.29 0.15 -1.8 U/S FSL (m) 7.75 4.32 3.8 D/S FSL (m) 7.49 4.08 3.74 Channel Width (m) U/S 19 m
D/S 28 m U/S 24 m D/S 27 m
U/S 55 m D/S 75 m
Sill Level (m) 4.73 2.1 0 Clear Waterway (m) 16.2 21 45.5 No. and Size of Vents 6 vents
Width = 2.7 m Height = 3.6 m
7 vents Width= 3 m
Height = 2.8 m
13 vents Width = 3.5m
Height = 4.4 m Overall Waterway (m) 22.2 28.2 59.9 Total Floor Length (m) 25.17 34.7 44.58 U/S Floor Thickness (m) 0.5 0.5 0.6
D/S Floor Thickness - Range (m) Variable from 1.01 m to 1.70m
Variable from 1.07 m to 2.07m
Variable from 1.78 m to 2.74 m
Cutoff wall depth U/S (m) 1.65 1.97 2.45 Cutoff wall depth D/S (m) 2.2 2.57 3.37
U/s Protection (CC Blocks)
Thickness = 0.6 m Length = 9 m
Thickness = 0.6 m Length =8 m
Thickness = 0.6 m Length =9 m
U/s Protection (CC Blocks)
Thickness = 0.6 m Length = 9 m
Thickness = 0.6 m Length =10 m
Thickness = 0.6 m Length = 8.5 m

216
The length of protection walls to be provided on the Vellaiyar is shown in Table 13.18.
Table 13.18: Location of Fluming and River Training Works, Vellaiyar
Chainage (km) Length of Protection Walls (m) Type of Protection From To
111.650 120.100 1800 Protection walls 120.100 129.950 1400 129.950 139.730 1400 139.730 153.650 800
13.3.5 Pandavayar River
13.3.5.1 Description of the Pandavayar River
The Pandavayar River takes off from the Vennar River at the Pandavayar Head Regulator
at PWD Chainage 109.23 km. The alignment of the Pandavayar River is shown in Figure 13.34.
The Pandavayar River generally follows a well-defined channel with high banks. Sections
of the river are overgrown with vegetation and have sand banks.
The Pandavayar is primarily an irrigation channel as there are 49 irrigation head sluices
and a total ayacut of 8504 ha. The first drainage infall is at Chainage 132.17 km, 25 km
downstream of the Head Regulator. The ayacuts on the right bank drain into the Vellaiyar River.
As part of their strategy to manage flood flows originating between the Grand Anicut and
the VVR head regualtor, WRD pass flood flows from the Vennar into the Pandavayar as shown in
Figure 13.5. The upper and middles reaches can generally accommodate the flood flow but the
lower reaches towards its confluence with the Vellaiyar become flooded (See Figure 13.6).
13.3.5.2 Modelling to Assess Channel Improvements
The Pandavayar model is described in Section 13.3.4.2 as the Pandavayar was modeled as
part of the Vellaiyar model.
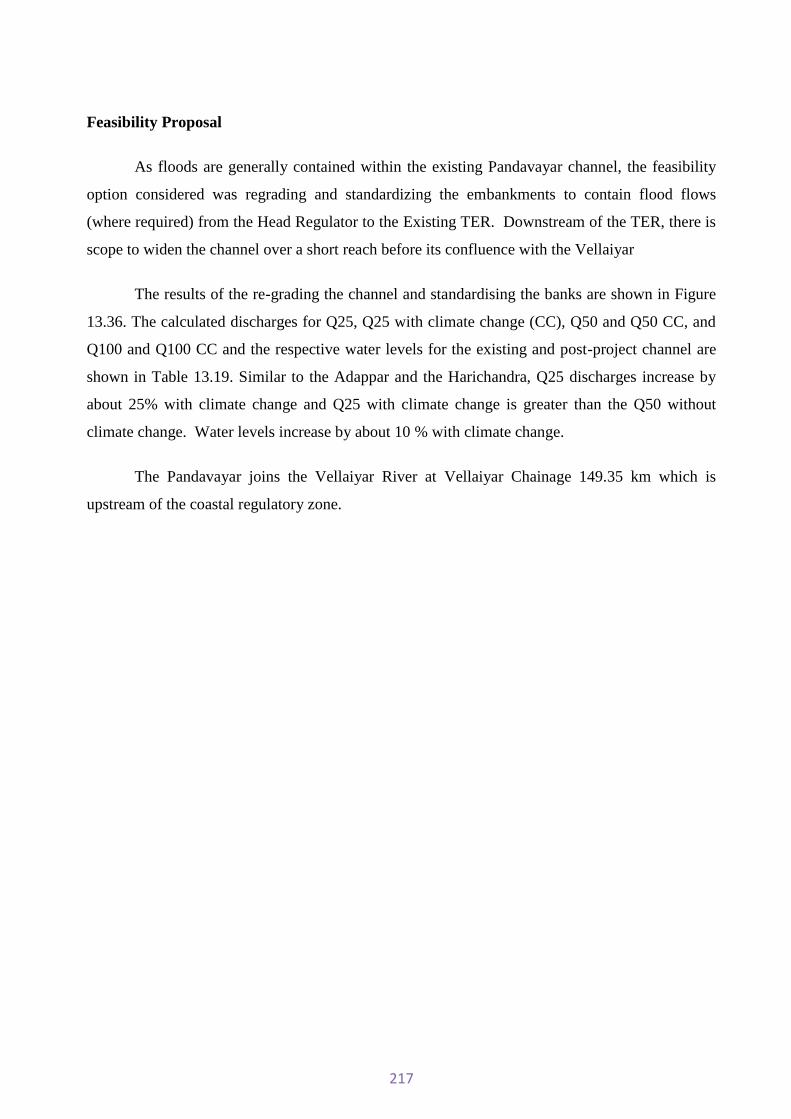
217
Feasibility Proposal
As floods are generally contained within the existing Pandavayar channel, the feasibility
option considered was regrading and standardizing the embankments to contain flood flows
(where required) from the Head Regulator to the Existing TER. Downstream of the TER, there is
scope to widen the channel over a short reach before its confluence with the Vellaiyar
The results of the re-grading the channel and standardising the banks are shown in Figure
13.36. The calculated discharges for Q25, Q25 with climate change (CC), Q50 and Q50 CC, and
Q100 and Q100 CC and the respective water levels for the existing and post-project channel are
shown in Table 13.19. Similar to the Adappar and the Harichandra, Q25 discharges increase by
about 25% with climate change and Q25 with climate change is greater than the Q50 without
climate change. Water levels increase by about 10 % with climate change.
The Pandavayar joins the Vellaiyar River at Vellaiyar Chainage 149.35 km which is
upstream of the coastal regulatory zone.
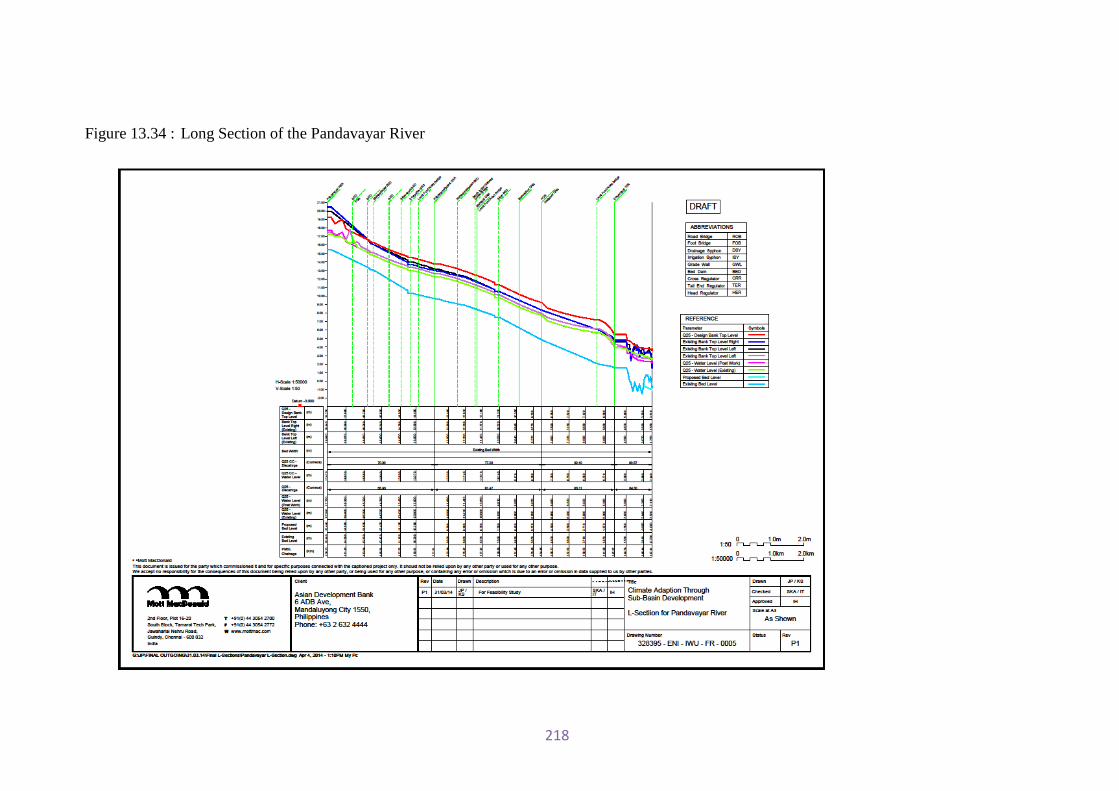
218
Figure 13.34 : Long Section of the Pandavayar River

219
Table 13.19 : Design Discharges and Water Levels for Different Floods, Pandavayar Scenario Name of
Structures Pandavayar
HER Kalyanamahadevi CRR Nagaloor CRR Erayangudi CRR
Infall in Vellaiyar River
Q25 Discharge (m3/s) - 55.93 61.47 65.11 64.3 WL existing (m) 17.29 12.26 7.73 3.99 2.52
WL post Project
(m) 17.75 12.26 7.73 3.99 2.11
Q25cc Discharge (m3/s) 65.76 70.30 77.28 82.1 80.57 WL existing (m) 17.47 12.63 7.94 4.59 2.85
WL post Project
(m) 17.47 12.63 7.94 4.39 2.44
Q50 Discharge (m3/s) 60.72 64.92 71.36 75.81 74.4 WL existing (m) 18.56 12.49 7.87 4.41 2.73
WL post Project
(m) 17.37 12.49 7.87 4.21 2.32
Q50cc Discharge (m3/s) 77.02 82.29 90.39 96.04 94.5 WL existing (m) 17.68 12.97 8.32 4.89 3.08
WL post Project
(m) 17.68 12.97 8.31 4.71 2.68
Q100 Discharge (m3/s) See Note (1) See Note (1) See Note (1) See Note (1) See Note (1) WL existing (m)
WL post Project
(m)
Q100cc Discharge (m3/s) See Note (1) See Note (1) See Note (1) See Note (1) See Note (1) WL existing (m)
WL post Project
(m)
Note (1): HECRAS Model became unstable at higher flows, in part because the PWD Cross Sections were at variable spacing and showed a trapezoidal channel section. Without further field survey, it was not possible to
refine the model sections further. Hence the results are not given here.

220
13.3.5.3 Improving Structures
Similar to the Vellaiyar, the component register for the Pandavayar was prepared in 1928
and has not been updated since then. Hence the structures on the Pandavayar were surveyed to
assess their current condition and assess the need for repair or reconstruction or new structures.
The findings are summarized in Table 13.20 and given in full in Annexure 2.
Table 13.20 : Recommendations for Improving Structures, Pandavayar River Name Of Structure Total
Number Re-constructed Rehabilitated/
repaired New No
work Regulators (head, cross and tail) 6 0 6 0 0 Irrigation Head Sluice 49 25 12 0 12 Drainage Sluice and Infall 13 6 2 2 3 Bed dam/grade wall 8 0 6 1 1 Footbridge 6 6 0 0 0 Road bridge 4 0 0 0 4 Railway Bridge 1 0 0 0 1 Total 86 31 35 3 17
There are no new regulators proposed for the Pandavayar. Two new drainage infalls plus 1
new bed dam/grade wall are proposed. 31 structures will be reconstructed and 35 structures will
be repaired.
13.3.6 Valavanar Drain
13.3.6.1 Description of the Valavanar Drain
The zero chainage point for the Valavanar Drain is taken as the downstream side of the
Thiruthuraipoondi-Vedharanyam road bridge close to Thiruthuraipoondi town. Upstream of the
road bridge, the Valavanar Drain is connected to two smaller drainage channels that are connected
to the tail end of two irrigation channels on the left bank of the Mulliyar River as shown in Figure
13.35. The two smaller drainage channels, the Varambiyam and the Thiruthuraipoondi, pass
under the Mulliyar River through syphons. A third small drain, the Ariyalur, joins the Valavanar
just downstream of the zero chainage point.

221
The Valavanar drain passes through low-lying land and drains local run-off plus drainage from
irrigation and floodwaters from the Mulliyar River to the north and east and the Koraiyar/
Marakka Koraiyar to the west. The total catchment area for the drain is reportedly 15,977 ha
although there is an absence of topographic maps at a suitable scale to verify the catchment area.
The elevation of the land along the Valavanar drain is close to sea level. For example, in
the upper reach, the bed level of the drain at the railway bridge (Chainage 2.290 km) is +0.15 m.
In the middle reach, the drain is above the level of adjacent land (as shown in Figure 13.38). At
the start of the lower reach, the bed level of the bridge at Voimedu (also known as the
Karpaganathar-Killam Road Bridge-Structure #54 at Chainage 16.450 km) is -1.13 m.
The drainage channel is well defined along most of its course, and the alignment is
generally straight as shown in Figure 13.37. In the upper reach, the bed width increases gradually
from about 10 m at the zero point to about 30 m at Chainage +6.570 km. Thereafter, the channel
widens to between 80 m and 250+ m until the Thulasiappattinam Road Bridge at Chainage
+13.700 km. Along this middle reach, the Pitchankottagam drain with bed width of 40 m runs
parallel to the Valavanar drain and collects flows from drainage infalls on the left bank before
discharging into the Valavanar at Chainage +13.450 km. The width of the channel reduces to
about 80 m or less as it passes through higher sand ridges for about 3 km before widening again to
150 m to 250+ m and discharging to the sea lagoon.
The drain passes through mainly agricultural land that is less productive due to heavy
soils, poor drainage and subject to periodic flooding. There are no villages or homesteads close to
the drain, except for where the drain passes through the higher sand ridges between Chainage
13.450 and 16.450 km.

222
Figure 13.35: Schematic of the Head Reach, Valavanar Drain
Mullaiyar River
Tiruthuraipoondi-Vedaranyam Road
Varambain Drain Thiruthuraipoondi Drain
Ariyalur Drain
East Coast By-pass Road
Poondaveli Drain
Singalanthi Drain
Ayyanarukoilpathu Drain
Pamani Drain
PWD zero point
Valavanar Drain
PMSL Zero Point
Tiruthuraipoondi-Vedaranyam Road
The Chainages for features along the Valavanar provided by PWD are different from the
Chainages surveyed by PMSL as shown in Table 13.21. PWD take the zero point of the
Valavanar Drain as the Thiruthuraipoondi-Vedharanyam road bridge (see Figure 13.35). PMSL
took the zero point as the Tiruthuraipoondi-Vedharanyam road bridge across the Pamani Vadikal.

223
The Chainages were checked by measuring the distance between various features on
Google Earth, and the results are also shown in Table 13.21. As the PMSL chainages agreed with
Google Earth measurements, the PMSL chainages were used in the design with an adjustment
made to start the chainages at the PWD zero point, as shown in Table 13.21.
Figure 13.36: Cross Section of Lower Valavanar Drain at Chainage 11.50 km
Valavanar Drain
Retention area for groundwater recharge
Cross Section
There is no component register and a list of structures was prepared following a joint
inspection of the drain. There are seven road bridges and one railway bridge crossing the drain.
At Chainage 3.130 km, there is a derelict bed dam. There are no cross regulators or irrigation
head sluices. Individual farmers pump water from the drain along its length. There are three
WRD pumping schemes, the Valavanar, the Karaiyankadu and the Vanduvancheri schemes
(located at Chainages 16.420, 13.800 and 13.550 km respectively) that lift water from the
Valavanar drain onto the higher land of the sand dunes. The Tail End Regulator is in dilapidated
condition and is no longer functional.

224
There are no flow or water level data for the Valavanar or the drains flowing into it. The
existing TER is derelict and has not been used to measure flows for many years. Catchment data
is also lacking for most of the drain infalls as shown in Annexure 3. There is anecdotal evidence
about flood levels and the extent of flooding during peak events but the absence of data makes
analysing floods and designing improvements extremely challenging.

225
Figure 13.37 : Alignment of the Valavanar Drain

226
Table 13.21 : Comparison of PWD and PMSL Chainages and Adjustment made to Correct Chainage
Location PWD
Chainage
Distance between points
PMSL Chainage (1)
Distance between
adjacent points Google Earth
Distance between adjacent
points
Adjusted chainage for design and for Component Register (2)
(m) (m) (m) (m) (m) (m) (m) Thiruthuraipoondi-Vedharanyam Road Bridge
0 (Zero point)
See Note (1) 0
0
Ariyalur Drain infall Not specified
80
350 ECR Road Bridge 210 430 Pamani Vadikal 480 480 1010 990 1240 1300 1300 Railway Bridge 1720 1780 2310 2290 760 840 Bed dam 2480 Not specified 2070 3150 3130 1200 1240 Pandi Bridge 3680 3850 4390 4380 1950 1990 Temporary Footbridge 5630 Not specified 3920 6380 6370 1830 1890 Ekkal Road bridge 7460 7770 8270 8300 5400 5370
Thulasiappattinam Road Bridge Not specified 13170 13640 13700
14540 2750 2764
Voimedi Road Bridge Not specified 15920 16404 16450
2860 2880 Existing (derelict) TER 22000 18780 19284 19310
(1) PMSL Chainage starts from bridge on Thiruthuraipoondi-Vedharanyam Road across Pamani Vadikal (2) Component Register for Valavanar Drain is given in Annex 2

227
13.3.6.2 Channel Modelling
Model Domain
A HEC-RAS model has been developed for the Valavanar Drain. The model extends
from the bridge on the Thiruthuraipoondi-Vedharanyam road to the derelict tail end regulator
(TER). WRD take the road bridge as the zero point for the Valavanar Drain. The three
channels that connect to the head reach of the Valavanar drain (Varambian, Thiruraipoondi
and Ariyalur) were not surveyed by PMSL and have not been included in the HEC-RAS
model. The drainage from surrounding land is derived from the results of SWAT modelling
and is allocated to the appropriate reach of the river based on the SWAT rainfall catchments.
The flows are assumed to be distributed uniformly along each reach. There are no flow data
for any of the channels and no flow measurement at the head of the Valavanar Drain. There is
anecdotal information on the water levels at the bridges and hence bridges are included in the
model as well as the dilapidated tail end regulator, as listed in Table 13.22.
Table 13.22: Structures included in the Valavanar HEC-RAS model
River Structure
Valavanar Thiruthuraipoondi-Vedharanyam Road Bridge
Valavanar East Coastal Road Bridge
Valavanar Thiritharapundi Railway Bridge
Valavanar Pandi Bridge
Valavanar Ekkal Road Bridge
Valavanar Thulasiappattinam Road Bridge
Valavanar Voimedi Road Bridge
The PMSL survey starts where the Thiruthuraipoondi-Vedharanyam road crosses the
Pamini Voikkal drain. PMSL took the Pamini Voikkal drain to be the main Valavanar
channel. In the absence of surveyed cross sections of the upper reach of the Valavanar drain,
it was assumed that the cross section and bed slope of the initial 990 m reach of the Valavanar
drain upstream of its junction with the Pamini Voikul drain can be approximated by using the
PMSL cross sections of the Pamini Voikul drain as the two drains have similar bed widths.

228
Validation
There are no flow or water level records for the Valavanar drain. Anecdotal
information from WRD indicates that the area around the drain was inundated in 2008
although the bridges were not surcharged. Furthermore the tail end regulator was overtopped
with substantial flow by-passing the structure. The 2008 flood map shows that there was left
and right bank flooding between Pandi Bridge and Ekkal Road Bridge.(see Figure 13.37)
The carrying capacity of the tail end regulator with gates fully opened is of the order of
50m3/sec. But reportedly the water depth is more than the opening size and the regulator is
outflanked almost every year). Thus the total flow may have been almost double of the
calculated capacity. SWAT simulated flows were used to represent drainage that enters the
river between the zero point bridge and the tail end regulator. Given the anecdotal evidence
that areas draining to the river exceed the natural watershed, the SWAT inflows were
increased by 20%. Roughness values (Manning’s n) were set at 0.20 for out of channel flow
and 0.08 for in channel flow. These high roughness values reflect the high degree of
vegetation and relatively poor state of the channel. The simulated water levels for the 2008
event are shown in Figure 13.38. The results show that the water level does not exceed the
bridge invert levels but does exceed the tail end regulator crest. Furthermore significant out-
of bank flow is simulated upstream of the Thulasiappattinam Road Bridge.
Figure 13.38 : The 2008 simulated long profile for the Valavanar River
0 5000 10000 15000 20000-3
-2
-1
0
1
2
3
4
5
Valavanar Final Plan: val_2008_existing 22/03/2014
Main Channel Distance (m)
Ele
vatio
n (
m)
Legend
WS Max WS
Ground
Left Levee
Right Levee
VMr V

229
Results
The results are reasonably consistent with the 2008 flood map (see Figure 13.6) for
the upper reach and indicate that the assumed inflows are acceptable given the lack of flow
and level data. Furthermore the simulation confirms that the 2008 flow was greater than the
channel capacity but that the bridges were not over-topped. However, the model does not
represent flows in the middle reach downstream of about Chainage 12000 (on Figure 13.38)
very well as the drain enters a low-lying depression to which there is considerable overbank
flow. Local people report that during floods the whole low-lying area fills with water and
takes several weeks to drain out via the downstream channel through the sand dunes (between
Chainage 3000 to 6000), the maximum carrying capacity of which is about 40-50 m3/s. Thus
the low-lying area performs as a retention basin that reduces downstream flows. As the bed
slope is almost flat, flood flow is driven slowly by the water level gradient which is very
shallow due the extent of lateral spreading of water in the depression, even with high inflows
from the upper catchment.
The model was run for the 25 and 50-year flood events and the results showed that
there is almost no change in water level. This is because for all return periods the water level
exceeds the bank level at several locations such that the main channel flow is the same for
each scenario. The same results were noted when the model was run for the 25, 50 and 100
year events with allowance for climate change.
Feasibility Proposal
The options to mitigate floods are constrained by:
The absence of flow or water level data for flood or normal events in the Valavanar Drain throughout its length or entering the head reaches.
In the upper reach from the zero chainage point to about Chainage +6.370 km, contrary to
initial information, WRD said that government land is available adjacent to the drain so
standardisation of the banks was possible along the length of the drain..
Bed slopes of the drain are almost flat (0.0013 % or less).
The design proposals considered were the standardisation of the banks and improvement
of the hydraulic performance of the channel by smoothing the channel sides and bed and
removing sand bars and vegetation that impeded flow. The impact of the proposals on water
levels and flows are shown in Table 13.23 and Figure 13.39.

230
Discussion and Recommendations
The lack of flow and water level records for the Valavanar Drain has restricted validation
to a comparison between the simulated water levels, anecdotal information from WRD and a
comparison with the 2008 flood map. The model results are reasonably consistent with these
sources of information for the upper reaches and the model could be used to assess the impact
of alternative design scenarios. The bridges do have sufficient capacity to pass the design
flows. .

231
Figure 13.39: Long Section of the Valavanar Drain
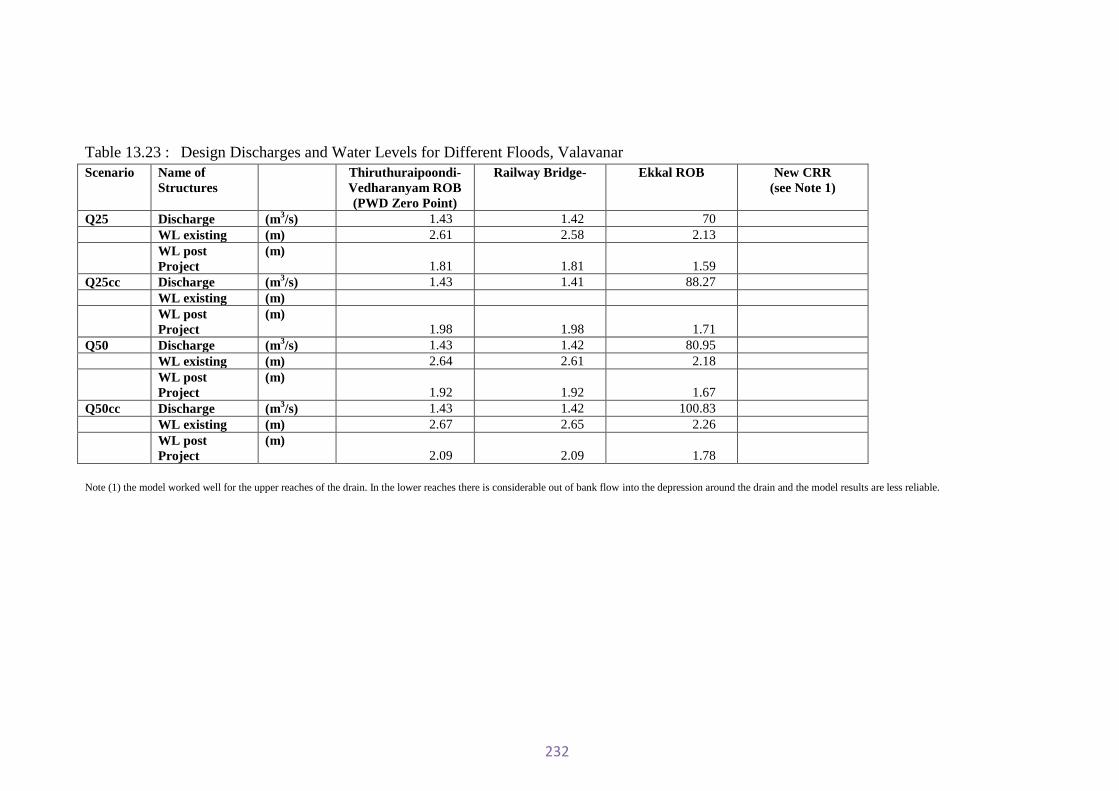
232
Table 13.23 : Design Discharges and Water Levels for Different Floods, Valavanar Scenario Name of
Structures Thiruthuraipoondi-
Vedharanyam ROB (PWD Zero Point)
Railway Bridge- Ekkal ROB New CRR (see Note 1)
Q25 Discharge (m3/s) 1.43 1.42 70 WL existing (m) 2.61 2.58 2.13
WL post Project
(m) 1.81 1.81 1.59
Q25cc Discharge (m3/s) 1.43 1.41 88.27 WL existing (m)
WL post Project
(m) 1.98 1.98 1.71
Q50 Discharge (m3/s) 1.43 1.42 80.95 WL existing (m) 2.64 2.61 2.18
WL post Project
(m) 1.92 1.92 1.67
Q50cc Discharge (m3/s) 1.43 1.42 100.83 WL existing (m) 2.67 2.65 2.26
WL post Project
(m) 2.09 2.09 1.78
Note (1) the model worked well for the upper reaches of the drain. In the lower reaches there is considerable out of bank flow into the depression around the drain and the model results are less reliable.

233
13.3.6.3 Improving Structures
In the absence of a component register, the structures on the Valavanar Drain were
surveyed to assess their current condition and assess the need for repair or reconstruction or new
structures. The findings are summarized in Table 13.24 and full details are given in Annexure 2.
Table 13.24: Existing and Proposed Structures and Channel Features, Valavanar Feature Total Remarks Open Infalls 44 See discussion below - Box Culvert 2 Nos , Drainage Inlets
7 Nos & Infall Bridge 1 No Proposed Bridges 7 No work proposed Footbridges 1 No work proposed Bed Dam 2 1 Needs reconstruction Cross Regulator 1 New Structure at Chainage 16.45 Km Proposed in
Project -2 Tail End Regulator 1 Derelict for over a decade.
Design provided for replacement TER for construction
Several feasibility proposals were considered:
Access to the drain for maintenance. The approach to improving the rivers taken up by
CASDP is to provide access on both sides of channels to facilitate maintenance. At present, there
is no road access along the Valavanar drain . The existing drain embankments are about 1 m wide
and passage along the embankments is interrupted by the numerous drainage infalls shown in
Table 13.24. As the embankment top is below flood level, a significant increase in the size of the
embankment is required to provide the standard 5 m wide access road plus a freeboard of 1.5 m.
In addition, up to 44 structures would be required at the drainage infalls. WRD report that
government land is available either side of the drain to construct standardised embankments.
Hence road access will be provided along the drain.
In the lower reach below Chainage 6.370 km, there is scope to provide road access along
the Valavanar Drain by standardizing the embankment between the Pitchankottagam Drain and
the Valavanar drain. The land within the drains is government land. The embankment could be
formed with material taken from the channel smoothing. Structures would not be required except
at the downstream end where the Pitchankottagam Drain infalls into the Valavanar (at the location
of the existing derelict regulator) as Pitchankottagam Drain was constructed to serve as a collector
drain for the left bank infalls. A road crossing would be provided at this location. At its head,
the Pitchankottagam Drain is not connected to the Valavanar.

234
Bed Dam - There is an existing bad dam located at Chainage 3.130 km and the structure
should be re-constructed. In addition to storing water for irrigation, the structure should be
designed and monitored to measure flows in the upper reach of the drain.

235
Tail End Regulator (TER) - The existing Valavanar TER has been derelict for over a
decade, but there is local demand to reconstruct it or provide a new TER close by in order to
restore about 500 ha of lost irrigation area. The salient features of the replacement TER are
given in Table 13.25.
Table 13.25 : Salient Features of Reconstruction of Tailend Regulator of Valavanar Drain Name Units Replacement TER
Chainage (Adjusted Chainage) (km) 19.284
Design Flood (m3/s) 50
U/S River bed Level (m) -0.80
D/S River bed Level (m) -0.90
U/S FSL (m) 0.69
D/S FSL (m) 0.66
Channel Width (m) U/S 190 m D/S 320 m
Sill Level (m) -0.65
Clear Waterway (m) 63.0
No. and Size of Vents 15 vents Width= 4.2 m
Height = 1.94 m Overall Waterway (m) 79.8 Total Floor Length (m) 12.69 U/S Floor Thickness (m) 0.6
D/S Floor Thickness - Range (m) Variable from
Cutoff wall depth U/S (m) 1.10 Cutoff wall depth D/S (m) 1.38
U/s Protection (CC Blocks)
Thickness = 0.6 m Length = 4.0 m
U/s Protection (CC Blocks)
Thickness 0.9 m Length = 5.0 m
13.3.7 Vedharanyam Canal
13.3.7.1 Description of the Vedharanyam Canal
The Vedharanyam canal runs parallel to the coastline of the Bay of Bengal and is located
about 3-8 km inland. Between the canal and the sea, there are sand ridges that are 2-3 m higher
than the canal.

236
The canal was excavated between 1863 and 1867 for inland navigation and is connected to
the sea at Nagapattinam in the north, Vailankanni in the middle and at Thopputharai in the south.
The length of the canal is 57 km between Nagapattinam and Thopputhurai and 44 km between
Vailankanni and Thopputhurai. The canal reach from between Vailankanni and Thopputhurai
was considered under this Project.
The canal was constructed for inland water transport, specifically for carrying salt from
Vedharanyam to Nagapattinam port. With the subsequent development of railways and roads, the
importance of the canal declined until eventually it became redundant for navigation.
The canal now functions as a drainage carrier for eastward flowing rivers of the Vennar
System, including four of this Project rivers, the Pandavayar, Vellaiyar, Harichandra and Adappar
Rivers. The canal intersects these rivers and also connects a number of remnant sea lagoons. The
canal was not designed as a drainage carrier, and in some reaches, particularly between the
Vellaiyar and the Harichandra/Adappar rivers, the top width of the canal is 20-50 m as compared
to top widths of 100-300 m in the reaches north of the Vellaiyar River and south of the Adappar
straight cut.
In the 1960’s, the following five straight cuts were constructed to facilitate the drainage of
flood flows from the canal and lagoons to the sea:
Harichandra (also known as the Lawford Straight Cut)
Adappar
Chakkliyan Voikal
Vellaiyar
Nallar
The straight cuts are now affected by siltation to varying degrees. They all have sand bars
across their outfalls to the sea, caused by the deposition of coastal sediment by longshore drift.
The channels of the Harichandra and Adappar straight cuts are open while the channels of the
Nallar, Vellaiyar, and Chakkliyan Voikal straight cuts are heavily silted and carry no tidal flows.
The origin of the other two outlets from the Vedharanyam Canal to the sea, the Vellaiyar
Old Course at Vailankanni in the north and the Uppanar Drain (or Vedharanyam River Old
Course) close to Vedharanyam town in the south is less certain. Both are well established
channels. The Vellaiyar Old Course may have been the natural outlet of the Vellaiyar River. The

237
meandering alignment of the Vedharanyam Canal upstream of the Uppanar drain suggests that
this reach was also natural channel with the Uppanar Drain being the sea outlet. There is a straight
cut in the Uppanar Channel to the sea that shortens the length of the channel from about 2.9 km to
1.4 km. At the coastal outlet, a spit is growing on the northern bank and erosion is occurring on
the southern bank indicating that the outlet is migrating southwards.
The coastal and riverine processes are in competition along the Vedharanyam Canal and
its straight cuts and outlets. For most of the year, the tail end regulators are closed and there is no
regular riverine flow in Vedharanyam canal and the canal acts as a tidal channel. However when
there are fluvial floods, the TERs are opened and flood flows reach the canal, but flows from the
canal to the sea are constrained by the diurnal tidal cycle and the low tide range (approximately
+0.3 to -0.3 m).
PWD take zero chainage point for the Vedharanyam Canal as the junction of the
Vedharanyam Canal and the Kaduvayar River. The junction is about 4 km south-west of
Nagapattinam Port. PMSL started their Chainage from the outfall of the Vellaiyar Old Course to
the sea, adjacent to Vailankanni Town. Based on PWD chainages, the length of the canal is 55.7
km. After adjusting the PMSL Chainage to start at the PWD zero point, the length of the canal
from the PMSL Survey is 52.7 km.
The alignment of the Vedharanyam Canal is shown in Figure 13.43.
13.3.7.2 Modelling to Assess Improvements in the Vedharanyam Canal
Flows and water levels in the Vedharanyam Canal were modelled using the TELEMAC2D model.
The grid and length of rivers used for the model are shown in Figure 13.40.

238
Figure 13.40 : Network for Telemac 2D Model and layout of Vedharanyam Canal including Straight Cuts
The main flow outlets for the canal are the Vellaiyar Old Course in the north and Uppanar
Drain in the south. The model was extended in the south to include the southern reach of the
Vedharanyam Canal to the salt flats. The Vellaiyar, Chakklan Voikal, Harichandra and Adappar
straight cuts were also included, along with the lower reaches of the Harichandra, Adappar,
Chakklan Voikal and Vellaiyar rivers. Inflows to the model were taken as the flows from
Harichandra, Adappar and Vellaiyar rivers as determined from the respective HECRAS models.
There are no flow data for the Chakklan Voikal Drain and the river was not modeled so its flows
were not included. The Chakklan Voikal Drain has a much smaller catchment than the other 3
rivers and hence its omission should not influence the results.
Validation
It was not possible to validate the model as there are no flow or water level data.

239
Feasibility Options
Feasibility options were analysed as follows:
Existing condition
Dredging of the Vedharanyam Canal and three straight cuts
The dredging was limited to a channel width of 20 m and a minimum bed level of 0.0 m
(sea level) on the basis that deepening the canal below sea level would lead to additional ingress
of seawater and hence should be avoided. There is a clear partition of flow towards the north and
towards the south at about Chainage 20 km just south of the junction of the Vedharanyam Canal
and the Harichandra/ Lawford Straight Cut. The results of the modelling are discussed for each
component below:
Vedharanyam Canal
The impact of dredging on the Vedharanyam Canal is shown in Figure 13.41 (Water
Surface only) and Figure 13.42 (Water Surface plus Right and Left Bank Levels and bed levels).
Figure 13.41: Impact of Dredging to 0.0 m (sea level) and 20 m bed width along the Vedharanyam Canal
0
0.5
1
1.5
2
2.5
0 10000 20000 30000 40000 50000
Ws-Ex-25
Ws-P1-25
Note: WS-Ex-25 shows water surface for Q25 under existing conditions (blue colour) and WS-P1-25 shows water surface for Q25 under proposed
conditions (dredging) (red colour)
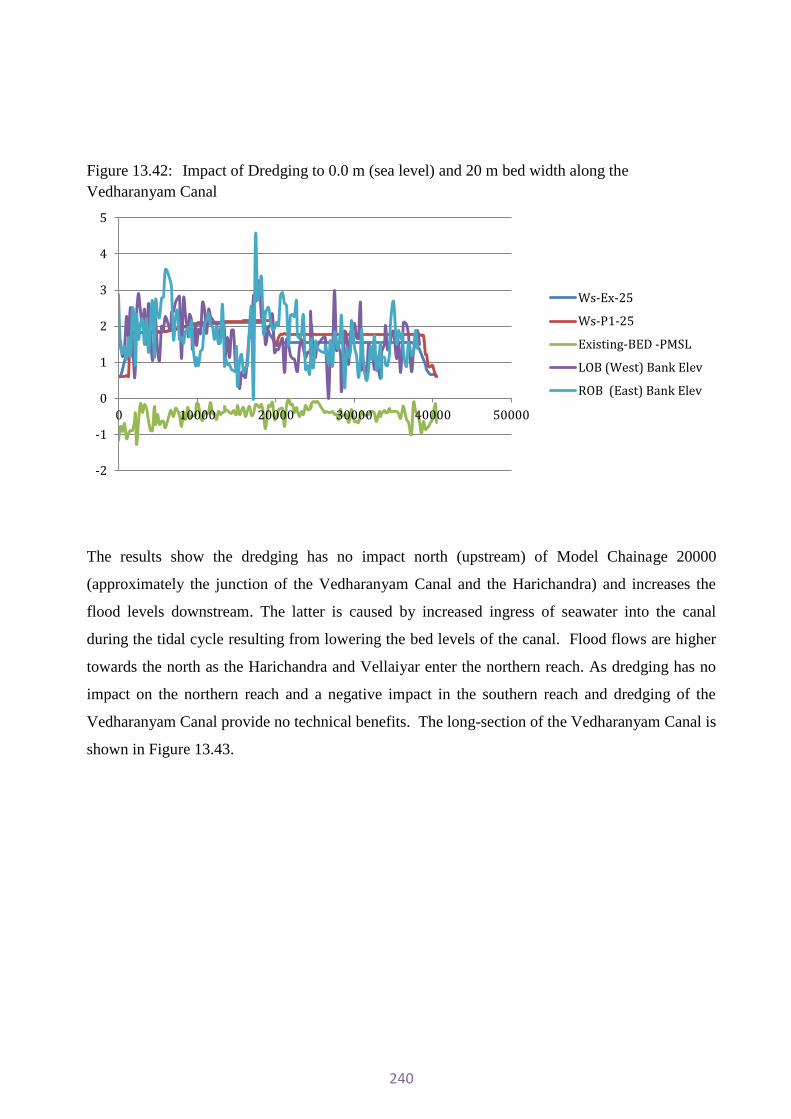
240
Figure 13.42: Impact of Dredging to 0.0 m (sea level) and 20 m bed width along the Vedharanyam Canal
-2
-1
0
1
2
3
4
5
0 10000 20000 30000 40000 50000
Ws-Ex-25
Ws-P1-25
Existing-BED -PMSL
LOB (West) Bank Elev
ROB (East) Bank Elev
The results show the dredging has no impact north (upstream) of Model Chainage 20000
(approximately the junction of the Vedharanyam Canal and the Harichandra) and increases the
flood levels downstream. The latter is caused by increased ingress of seawater into the canal
during the tidal cycle resulting from lowering the bed levels of the canal. Flood flows are higher
towards the north as the Harichandra and Vellaiyar enter the northern reach. As dredging has no
impact on the northern reach and a negative impact in the southern reach and dredging of the
Vedharanyam Canal provide no technical benefits. The long-section of the Vedharanyam Canal is
shown in Figure 13.43.
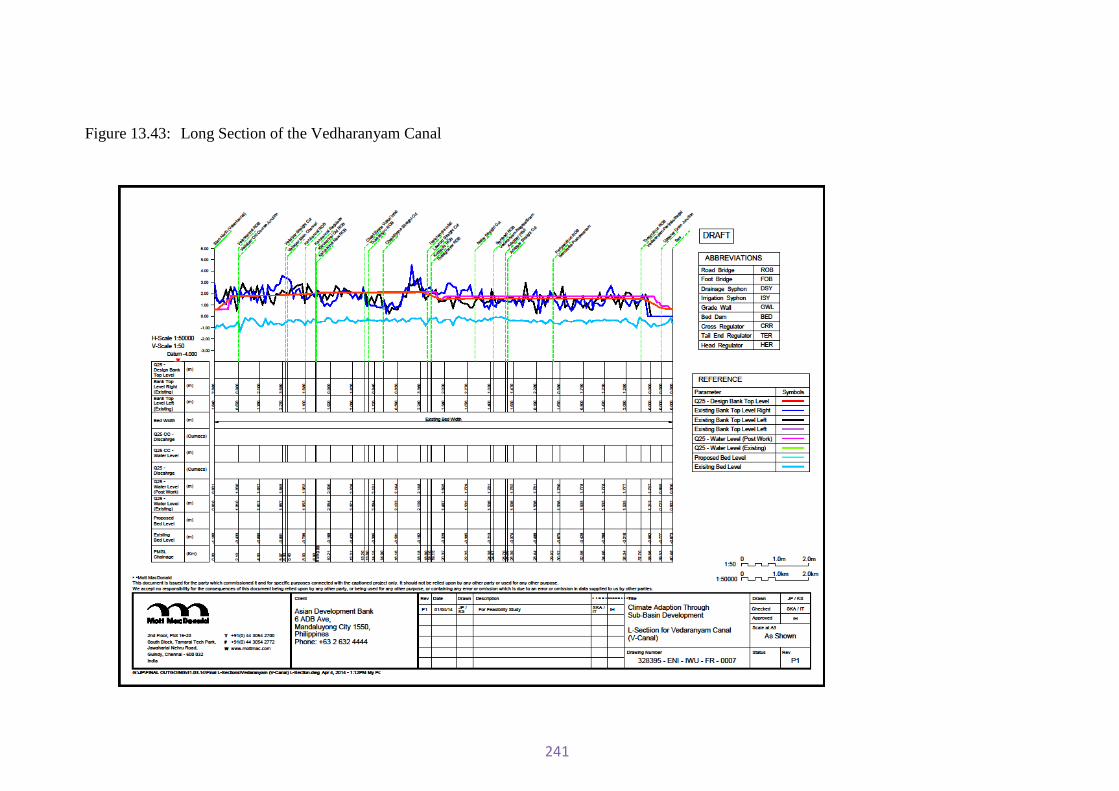
241
Figure 13.43: Long Section of the Vedharanyam Canal

242
Vellaiyar Straight Cut
The impact of dredging on the Vellaiyar Straight Cut is shown in Figure 13.44.
Figure 13.44: Impact of Dredging to 0.0 m (sea level) and 20 m bed width along the Vellaiyar Straight Cut
-2
-1
0
1
2
3
4
5
6
0 1000 2000 3000 4000 5000
WS-P1(dredged)-25
Existing- No flow
BED LEVEL()-PMLS
Dredged bed levels
There is no flow under existing conditions as the straight cut is heavily silted, to the
extent that the existing bed level (green line on Figure 13.44) is above peak flood water level
in the Vedharanyam Canal.
The dredged straight cut allows flows to pass from the canal to the sea,. As with the
Vedharanyam Canal, dredging has been limited to 0.0 m (sea level) as below this level,
seawater ingress will be greater especially under normal conditions.
Conclusion: Dredging opens up the Vellaiyar straight cut to carry flood flows and
reduces peak flood water levels in the Vedharanyam Canal and hence dredging of the
Vellaiyar Straight Cut has technical benefits.

243
Harichandra/Lawford Straight Cut
The impact of dredging on the Lawford Straight Cut is shown in Figure 13.45.
Figure 13.45: Impact of Dredging to 0.0 m (sea level) along the Lawford Straight Cut
-1.5
-1
-0.5
0
0.5
1
1.5
2
2.5
0 1000 2000 3000 4000 5000
WS -Existing-25
Ws-P1-25
Dredged Bed levels
Note: WS-Existing-25 shows water surface for Q25 under existing conditions (blue colour) and WS-P1-25 shows water surface for Q25 under proposed conditions (dredging) (red colour)
Dredging has no impact on water levels in the lower reach of the straight cut (from
about Chainage 2500 to 5000) as the existing bed level is about sea level (0.0 m). From
Chainage 0 to 2500, dredging reduces water levels by about 0.25m.
Conclusion: Dredging of the Lawford Straight Cut reduces peak flood water levels in the
Vedharanyam Canal.

244
Adappar Straight Cut
The impact of dredging on the Adappar Straight Cut is shown in Figure 13.46.
Figure 13.46 : Impact of Dredging to 0.0 m (sea level) along the Adappar Straight Cut
-6
-5
-4
-3
-2
-1
0
1
2
3
0 500 1000 1500 2000 2500 3000 3500 4000WS -Existing-25
WS-P1-25
BedLevels(P1)
Dredging has minimal impact on water levels in the lower reach of the straight cut
(from about Chainage 1500 to 3400) as the existing bed level is below sea level (0.0 m).
From Chainage 0 to 1500, dredging slightly increases water levels during floods. The
increase in water levels may arise from tidal flows in the southern Vedharanyam Canal
having greater influence. At higher flows the influence of tidal flows will be reduced and,
water levels will fall with dredging.
Conclusion: Dredging of the Adappar Straight Cut has a small impact on peak flood water
levels in the Vedharanyam Canal that may increase positively with higher flows or different
tidal conditions. The recommendation is for dredging of the Adappar Straight Cut.
Uppanar Drain (Old Vedharanyam Course)
The channel width of the Uppanar Drain is generally at least 50-70m wide. The
impact of the dredging is shown on the right side of Figures 13.41 and 13.42, for Chainages
in excess of 40000.
Conclusion: Dredging of the Uppanar Drain will reduce peak flood water levels in the
Vedharanyam Canal, Ingress of sea water into the canal may be affected slightly as the bed

245
levels in the drain are already at +0.0 or lower. The recommendation is for dredging of the
Uppanar Drain and the reach of the Canal from the Uppanar Drain to the Thopputharai Road
Bridge (Vedharanayam-Periyakuthagai) at PWD Chainage 44.335 km.
Southern Reach of the Vedharanyam Canal
The Vedharanyam Canal south from the Uppanar Drain (PWD Chainage 46.60 km) to the
Salt Pans (PWD Chainage 57.70 km) has no outlet to the southern sea lagoons as the channel
is completely silted and embankments have been constructed across the channel in several
locations to prevent the ingress of seawater. Hence there is no southern flow exit for the
Vedharanyam Canal and hence dredging the southern reach would not contribute to reducing
peak flood water levels in the Vedharanyam Canal.
Standardized Canal Embankments : The initial proposal was for right embankment (on the
western or inland side) of the canal to be standardized to allow road access from PWD
Chainage 18.5 km to the PWD Chainage 31.200 km. The top of the embankment was to be
designed for the design water level (Q25) plus 1.5 m freeboard. The benefits of the
standardized embankment include:
Providing protection to the land on the west side from tidal surges and high tides,
Providing access along the Canal for operation and maintenance.
13.3.7.3 Improving Structures on the Vedharanyam Canal
There is no component register for the Vedharanyam Canal. Based on the PMSL
survey and PWD’s flow schematic and field visits, the structures were surveyed and assessed
to determine if the requirements were for reconstruction, repair or new structures. A summary
of the structures and their requirements is shown in Table 13.26 and the full list of structures
is given in Annexure 2.

246
Table 13.26 : Summary of Structures on the Vedharanyam Drain Summary Total Reconstruction Repair New No Work Drainage Sluice (DRS) 13 7 0 0 6 Drainage Open infalls 10 0 0 1 9 Irrigation Syphons (IRS) 2 1 0 0 1 Bridges road ROB) 21 0 0 0 21 Footbridges (FOB) 3 0 0 0 3 Other structures 2 0 0 0 2
Total 51 8 0 1 42
There are 21 bridges across the Vedharanyam Canal and only one regulating structure,
the lock at Karunkannai (PMSL Chainage 8.930 km). The lock is derelict and has not
functioned for many years. Reportedly the lock was used to collect tolls from boats using the
canal and may also have been used to regulate north-south flows in the canal as the lock can
hold up to 2.4 m of water on one side during the north east monsoon (CMP 2008).
Several of the road bridges have been constructed with very little headroom above the
high tide water level in the canal, and, where this is the case, the bridge decks would need to
be raised before navigation was again possible.
Six drainage sluices and one irrigation syphon will be reconstructed in the middle
reach. One new drainage infall will be provided.
13.4 Surface Water Pumping Schemes
13.4.1 Description of Pumping Schemes
Within the Vennar System, there are 26 functioning pumping schemes that irrigate
elevated land that cannot be irrigated by gravity directly from the canal system. Most of the
pumping schemes take water from the tail end of drains, although a few take irrigation water
from rivers. The schemes provided irrigation to 8,805 hectares (21,757 acres) and resulted in
an estimated additional production of 16,544 tonnes of food grains. Presently the schemes
irrigate 4,973 hectares (12,289 acres) only, or 56% of the total design command area.
A typical scheme comprises of an intake channel leading to the sump of the pump
house, electrically operated pumps, and a main distribution channel and canal network
downstream to supply water to the fields. In addition, there is an electrical sub-station and
staff quarters. The pumping schemes are listed in Table 13.27 and their location shown in
Figure 13.47.

247
Table 13.27 : List of Pumping Schemes in the Vennar System
Map Number Name of Pumping Scheme Serial No.
Name of Pumping Scheme
1 Velankanni 16 Vilangadu
2 Vilunthamavady 17 Melathondiakkadu
3 Aymoor-I 18 Thillaivilagam
4 Aymoor-II 19 Mangal
5 Oradiyambalam 20 Pamanimullur
6 Umbalachery 21 Sekal
7 Mulliar (Thagattur) 22 Korukaithalaikadu
8 Ayakkarampulam 23 Thenpathy Thalaiyamangalam
9 Manangondanar 24 Moovanallur**
10 Thennadar 25 Kollukadu*
11 Vanduvanchery 26 Poyyundar Kudikadu*/**
12 Valavanar 27 Okkanadukeelaiyur
13 Karpaganatharkulam** 28 Chinnaparuthikkottai*
14 Keelathondiakkadu 29 Arasapattu*
15 Karaiyankadu
The pumping schemes have deteriorated over the 40-50 years that they have been
operational. In addition to the normal wear and tear of the electrical and mechanical
equipment, there has been significant damage to civil works mainly due to deterioration of
construction materials in the saline coastal environment plus penetration by roots and other
vegetation, and the swelling nature of the local soils. Maintenance has been meagre, and
many pumps are beyond repair. In addition, the efficiency of the pumps which are still in
operation has been greatly reduced.

248
13.4.2 Pumping Schemes of this Project
There are 13 pumping schemes located on the six Rivers of this Project or related
channels, as shown in Figure 13.47. The 13 schemes are:
Table 13.28: Pumping Schemes of this Project
Sl.No Name River/Drain
Ayacut
(Design)
(ha) Year of
Construction
1 Velankanni Maravanar 60* 1965
2 Vilunthamavady Chandira North 652 1957
3 Aymoor-I Mallianar 290 1957
4 Aymoor-II Mallianar 202 1957
5 Oradiyambalam Nallar 231 1977
6 Umbalachery Adappar 121 1974
7 Vanduvanchery Valavanar 180 1957
8 Valavanar Valavanar 931 1962
9 Keelathondiakkadu Vettar 283 1977
10 Karaiyankadu Valavanar 153 1957
11 Pamanimullur Adappar 300 1962
12 Sekal Adappar 161 1962
13 Korukaithalaikadu Adappar 236 1974 Note: *Original design area was 511 ha but this has reduced to 60 ha due to urbanization of command area.
The technical details of the pumping schemes are shown in Table 13.29.

249
Figure 13.47 : Location of Pumping Schemes

250
Table 13.29 : Technical Details of the 13 Pumping Schemes
Name
Con-junctive use
Tail-end
Ayacut (Command area)
Static lift
Water Requirement Pumping rate Canal capacity
Pumping time Minimum power rating
Present Renovation Present Renovation Present
Renovation Present Renovation
Present
Renovation
(Y/N) (Y/N) (ac) (ha) (ac) (ha) (m) (m3/y) (l/s) (l/s) (cusec) (h/y) (h/d) (h/y) (h/d) (HP) (HP)
Pamanimullur N Y 651 260 740 296 4.5 2,955,583 3,361,714 456 519 19 1,550 10 1,763 12 54 46
Sekal N Y 360 144 397 159 3.5 1,635,429 1,802,151 252 278 11 1,407 9 1,551 10 23 22
Korukkai Thalaikk. Y N 499 200 584 234 4.5 2,266,431 2,652,529 350 409 15 1,482 10 1,735 12 41 37
Umbalacheri N Y 271 108 300 120 3.1 1,230,433 1,362,857 190 210 16 754 5 836 6 15 27
Oradiyambalam N Y 441 176 554 221 2.6 2,002,946 2,514,926 309 388 16 1,228 8 1,542 10 21 23
Aymoor-I N Y 641 256 717 287 2.9 2,909,927 3,257,229 449 503 16 1,784 12 1,997 13 34 25
Aymoor-II N Y 491 196 500 200 2.9 2,229,634 2,271,429 344 351 16 1,367 9 1,393 9 26 25
Velankanni N Y 0 0 60 24 5.3 454 272,571 0 42 2 2 0 1,337 9 0 6
Vilunthamavadi N Y 981 392 1,611 644 5.8 4,454,953 7,318,543 687 1,129 27 1,619 11 2,659 18 104 85
Karayankadu N Y 361 144 379 152 5.6 1,637,700 1,721,743 253 266 10 1,691 11 1,778 12 37 29
Kela Thondiyakkadu
N Y 549 219 700 280 5.6 2,492,529 3,180,000 385 491 18 1,358 9 1,733 12 56 55
Vanduvanchery N Y 300 120 445 178 3.1 1,363,766 2,021,571 210 312 11 1,176 8 1,743 12 17 19
Valavanar N Y 1,791 716 2,300 920 7.3 8,134,440 10,446,981 1,255 1,612 40 1,995 13 2,562 17 241 160
Total 7,333 2,933 9,286 3,714 33,314,225 42,184,245 17,414 22,627 670 557

251
13.4.3 Findings of Survey and Recommendations for the Project Pumping Schemes
The 13 pumping schemes of this project were surveyed to determine the present
condition of their electrical, mechanical and civil works and identify the specific
requirements for rehabilitating the schemes to restore the irrigated area to their potential
design command area. The main findings and recommendations are summarized in Table
13.30.
The overall efficiency of the outdated and worn out pumping equipment being used is
likely to be about 40-50%. With new up-to-date, energy efficient equipment, the overall
efficiency of the pumping schemes could almost double.
The refurbishment of the pumping schemes also provides an opportunity to train staff
in the operation and maintenance of electrical and mechanical equipment and provide
adequate personal protection equipment (PPE) at each pumping scheme. The recommended
PPE is listed in Table 13.31. Rather than rehabilitating the staff quarters, all of which are now
derelict, a single room with toilet facilities should be provided as an office and rest place for
operators. The room should be within the pump house or attached to the pump house if space
is not available elsewhere.

252
Table 13.30 : Main Findings and Recommendations of Survey of 13 Pumping Schemes of this project
Finding Recommendations
The floor levels at 7 pump house are below natural ground level or below paek flood level resulting in continuous seepage through the pump house. walls and flooding of equipment during peak floods or intense rain storms
The floor level of all pump houses should be above peak flood level or submersible pumps used .
All electrical control equipment should be located above peak flood level
Pump house do not have either dedicated overhead distribution line (OHDL) or transformer
Provide dedicated transformers and new dedicated OHDL to minimize disruption to supply
The oil circuit breakers are difficult to maintain and are completely outdated technology
Provide Moulded Case Circuit Breakers (MCCB)
Fuses inside pump house are unsafe Provide MCCBs with thermo magnetic protection
No optimization of energy consumption Provide heavy duty self healing All Polypropolene (APP) capacitor for reactive power compensation
Motor starting mechanism outdated Provide fully automatic star delta starter or digital soft starter with motor protection relay
Energy meters with 0.5% accuracy are installed but there is no recording of power consumption as WRD/farmers not charged for electricity
Power consumption should be recorded daily to determine usage, volume of water pumped etc.
Prime movers are usually slip ring induction motors that are quite old.
Provide Energy efficient, continuous duty, class F’
insulation, Squirrel cage induction motor (SCIM)
Internal wiring is in poor condition Provide energy efficient lamps and heavy duty uPVC conduits
Pumping equipment used for only six months a year Provide motor Driving End (DE) and Non-driving end (NDE), sealed for life bearings, lubricated for their entire life
Fluctuating voltage Install Servo Voltage Stabiliser
No mechanism to prime pumps Provision made in the electrical panel to feed the priming /dewatering pump motor set.
Outlived power and control cables Replace with latest cross link polyethylene (XLPE) insulated cables
No earth provided Provide specialised pipe in pipe technology with earth enhancing material to maintain the desired earth resistance in different seasons of the year
Training Provide hands-on training for operation and maintenance of electrical and mechanical equipment
No personal protective equipment (PPE) provided Provide PPE to meet current standards (as listed in Table 13.33)
Lack of basic amenities (urinal, toilet, washroom) near pump house
Provide toilet facilities plus office/rest area for operators

253
Table 13.31 : List of Personal Protective Equipment (PPE)
Item Specification
Fire Extinguisher CO2 type- portable Fire extinguisher, of size 5kg each ,manufactured from CRCA sheets in all welded construction, body coated with glossy corrosion resistant epoxy powder coating ,with inbuilt water proof pressure gauge ,with wall bracket ,as per IS 2190 and IS 13849 with latest amendments-1 Number.
Synthetic Insulation Mat
415 V ,A' class, non-skid ,high voltage insulation synthetic mat made from electrometric polymer material ,1000 mm wide , 2.0 mm thick, Dielectric strength 3300V for 1 minute ,fire retardant ,no adverse effect of transformer oil ,diesel, acid ,alkali, High Tensile & Elongation properties, good mechanical strength to withstand load and movement of breaker trolley ,as per IS 15652 with latest amendments -2 m2
Shock Treatment Chart
Laminated Shock treatment chart, duly laminated in Tamil (Local) and English languages.
First aid box First aid box with all essential medicines including wall mounted bracket
Danger Caution Plate
(11000 V)
11000 V, Aluminium, anodised Danger caution plate in Tamil (local) and English languages with the sign of skull and bones in signal red colour on front side, as per IS 2551 with latest amendments
Danger Caution Plate
(415 V)
415 V, Aluminium, anodised Danger caution plate in Tamil (local) and English languages with the sign of skull and bones in signal red colour on front side, as per IS 2551 with latest amendments-2 numbers each.
Fire Bucket Galvanised mild steel sand Fire bucket with lid and handle, 9 Litres capacity. Buckets number to be provided with suitable strand with 4 numbers. hooks to hang sand filled buckets, as per IS 2546 with latest amendments-4 numbers.(1 Set)
Fire Safety: Fire Safety: The requirement of portable fire extinguisher and fire bucket with sand in electrical equipment room and transformer yard shall be provided as per guidelines by Tamil Nadu Fire Service Rules 1990 and Tamil Nadu Generation and Distribution Corporation Ltd. (TANGEDCO).

254
14 Power There are two existing power plants in the Vennar system (one in Nagapattinam
district and the other in Thanjavur district). However, at least seventeen more plants are
being set up at various locations in the two districts, as shown in Table 14-1. The
capacities of the proposed power plants vary from a minimum of 300 MW to a maximum
of 1820 MW and all of them are likely to be commissioned by 2020. The total output
capacity of the plants is expected to be 9955 MW. All these plants are coal based and it is
proposed that seawater will be used for cooling, with the exception of one in Karuppur in
Thanjavur district where cooling water will come from Coleroon river.
Table 14-1: Proposed Thermal Power Plants in the Vennar System
District Location Capacity (MW) Source of Cooling Water
Thanjavur Karuppur 120 MW (existing) Coleroon river
Nagapattinam
Srikali NA Sea water
Perunthottam 1,980 Sea water
Neidavasal 1,320 Sea water
Vanagiri, Keezhaperumpallam, Maruthampallam
1,000 Sea water
Thalachankadu 1,320 Sea water
Thirukadaiyur 325 (existing) Sea water
Erukkattanchery, Kazhiappanallur, Manickapangu
1320 Sea water
Neikuppai, Velangudi 300 Sea water
Vetaikkarannirru, Vizhuthamavadi
NA Sea water
Keezhapidagai 1,820 MW Sea water
Karappidagai 150 MW Sea water
Nagai 300 MW (expansion up to 1320 MW)
Sea water
Total 9,955 MW Source : http://www.solidaritaetsfods.de/http://www/industrialmarinepower.com

255
15 Navigation Five of the six rivers of this project are not used for navigation except in their
lower reaches close to the coastline and even there, boats tend to be designed for the sea
and use the river mouths for shelter from the seas rather than for travel very far inland.
The sixth channel of this project the Vedharanyam Canal was designed for
navigation, as discussed in Section 13.3.7, but the canal is no longer used for this purpose.
As with the other rivers, sea-faring boats use the outfalls at the Vellaiyar Old Course and
Uppanar Drain to shelter from the sea.
The central government plans to re-open the Vedharanyam Canal for inland
navigation.

256
16 Groundwater
16.1 Introduction
The rivers of the Cauvery Delta have supplied water for irrigation for centuries whereas
groundwater use has intensified over the last twenty years to supplement surface water
supplies plus provide water for domestic and other uses.
Groundwater use for irrigation is important because:
Surface water flows are not available throughout the year, and coincidentally when
surface water is not available there is little rainfall
Surface water irrigation supplies are inadequate to meet areas planted for paddy
and other crops, and groundwater is an immediately available additional source of
water
Some areas are not particularly well supplied with surface water, and so in those
areas farmers rely on groundwater to meet their crop water needs.
It is estimated that there are about 135,000 hand dug wells and 90,000 tubewells
constructed in the CASDP project area (CGWB, 2008a, 2008b, 2009). Hand dug wells are
predominantly for household water supply, while the tubewells (also called borewells) are
used for irrigation. Groundwater quality is general good inland but close to the coast, the
groundwater is more saline.
In this chapter, key issues related to groundwater are discussed and recommendations are
made to ensure the sustainability of the resource and improve the availability of good
quality groundwater at specific locations. Background details of the hydrogeology and the
other aspects of groundwater development are discussed in Annexure 6.
16.2 Depth to Groundwater
Water table levels throughout the Cauvery Delta are high, but not restrictively so.
Information on waterlogging in the region is provided by ADB (2011) and the areas with
an identified “waterlogging” problem are shown in the Figure 16.1

257
Figure 16.1: Waterlogged Areas
Source: ADB 2011
Most identified areas are located close to head regulators and appear to be related to local
ponded water and leakage.
In general, water levels in the upper unconfined aquifer are as illustrated in the following
typical groundwater hydrographs in Figure 16.2

258
Figure 16.2: Historical trend of ground water in shallow aquifer
0
1
2
3
4
5
6
Dep
th to
Gro
und
wat
er (m
bgl
)Manali, 43022
0
1
2
3
4
5
6
Dep
th to
gro
und
wat
er (m
bgl
) Kottur, 43025
0.00
1.00
2.00
3.00
4.00
5.00
6.00
7.00
Dep
th t
o G
roun
d w
ater
(m b
gl) Mannargudi, 43070
These show:
pre-monsoon water tables 4 to 5 m below ground level
post-monsoon water tables 1-2 m below ground level.
No long-term trend in water table levels.

259
Depth to water table below ground surface in the Vennar system, during pre-monsoon and
post-monsoon seasons, is shown in Figures 16.3 and 16.4.
Figure 16.3 Depth to ground water table (m below ground surface), pre-monsoon 2008
Figure 16.4 Depth to ground water table (m below ground surface), post-monsoon 2008

260
16.3 Assessment of the Groundwater Potential in the Command Area
The water balance for the three districts in the Vennar System is shown in Table
16.1
Table 16.1: Annual Groundwater Balance by Block as Water Depth (2009)
District Block Net Annual GW availability Mm
Annual Groundwater Draft Groundwater Balance Mm
Irrigation Mm
Domestic & Industrial Use Mm
Total mm
Thanjavur Ammapet 215.4 246.6 6.4 253.07 -37.67
Madukkur # 213.9 78.2 9.3 87.53 126.32
Orathanadu 160.3 257.1 7.0 264.02 -103.69
Thanjavur 222.8 174.2 5.7 179.85 42.99
Thiruvarur Koradachery # 237.3 120.0 0.1 120.09 117.23
Kottur # 119.8 52.8 2.7 55.49 64.28
Mannargudi # 192.2 66.2 6.6 72.82 119.37
Muthupet* Saline Area
Saline Area
Saline Area
Saline Area
Saline Area
Needamanagalam 225.7 75.6 6.7 82.33 143.32
Thiruthuraipoondi*
Saline Area
Saline Area
Saline Area
Saline Area
Saline Area
Thiruvarur 109.3 88.5 1.6 90.07 19.22
Nagapattinam
Keeliyur* Saline Area
Saline Area
Saline Area
Saline Area
Saline Area
Nagapattinam* Saline Area
Saline Area
Saline Area
Saline Area
Saline Area
Thalainayar* Saline Area
Saline Area
Saline Area
Saline Area
Saline Area
Vedranyam* Saline Area
Saline Area
Saline Area
Saline Area
Saline Area
# Part saline area * Saline area – resource not estimated
Source The 2009 Groundwater Assessment (GEC data)
The most recent estimates by the CGWB (2009) indicate that there is an annual
replenishable ground water resource of about 1,187 MCM in the three districts of

261
Thanjavur, Thiruvarur and Nagapattinam. Out of this resource, 80% is presently used for
irrigation and water supply. This resource is reported, in the CGWB assessment, to be
over-exploited to the tune of 122 % (1,450 MCM). The block-wise increase, within
Vennar system, in ground water development is shown in Figure 16.5.
Figure 16.5: Stage of Groundwater Development
Source: PWD
16.4 Quality of Groundwater
Inland, the quality of groundwater is generally suitable for irrigation and
groundwater is used for this purpose without any identified long-term complications.
However, towards the coast, much of the area is underlain by saline water. Figure 16.6
indicates the salinity-affected blocks in the region, and the extent of saline water in the
upper unconfined aquifer and in the deeper artesian aquifer. Information on salinity
within the lower aquifer system is sparse, so the indication in Figure 16.6 of the extent of
saline water within this aquifer is approximate only.

262
The origins and dynamics of the poor quality groundwater in the basin are
uncertain, and yet to be scientifically established. Some reports - such as the Cauvery
Modernisation Report, (WRO, 2008) and the ADB report (ADB, 2011) refer to sea water
intrusion. The Central Groundwater Board report (CGWB, undated) concludes that the
saline water is from the time of deposition of the formation in a marine delta environment,
with incomplete flushing of the salts from fresh water through-flow. There is an on-going
PWD monitoring programme for the groundwater in the coastal area to monitor changes.
Figure 16.6 : Saline Affected Blocks
The salinity in both aquifers is likely to be connate, that is, existing from the time
of deposition of marine sediments. The connate salinity has been flushed out by recharge
waters of lower salinity to a certain degree which is why the upper aquifer has a greater
extent of fresh groundwater than the lower aquifer as the through flow of recharge water
has been greater. Historically the recharged water has emerged within the delta as seepage
into the river distributaries and flushing is less as the coast is approached.

263
Since the location of the interface between the fresh and saline groundwater was
first identified in UNDP studies in the 1960’s, there has been no significant movement of
the interface. Some analysis has suggested that the interface is moving inland, and that
further development of groundwater in the delta could accelerate this movement and result
in salinization of groundwater in areas where the groundwater is fresh. While this is an
acknowledged risk, our analysis of the available data shows little sign of such processes,
which suggests that this risk has been overstated in the past. Nevertheless, it is prudent to
invest in a more complex monitoring system to provide regular updates of the situation
and early warning of any undesirable movement.
16.5 Assessment of Possible Impact on Groundwater Recharge due to Canal
Lining
Works to improve the performance of river channels in this Project do not include
canal lining. Therefore they are unlikely to impact on recharge to groundwater system.
Construction of new Tail End Regulators (TER) will help to recharge aquifers in the
coastal area.
264
Under this Project ground water modelling is proposed to improve the
understanding of the availability and movement of groundwater and to determine the
feasibility of different options for managing groundwater:
Enhancement of recharge of the deeper aquifer using recharge shafts is being
prioritised by the local government in Thiruvarur District so that the groundwater resource
is sustainable and can continue to support irrigation and increasing water demand in other
sectors on a long term basis. At present, the deeper aquifer ( > 100 m bgl) only benefits
through vertical leakage from the upper aquifer because the current recharge shafts are
shallow. With deeper shafts, the deeper aquifer would receive direct recharge. Also the
recharge structures should be maintained on an annual basis to maintain their efficiency
since there is a tendency for clogging after one recharge cycle.

265
16.6.1 Groundwater Modelling
Ground water modelling of the Vennar system has been carried out to simulate the ground
flow system for a broad two aquifer system of alluvium and sandstone. Available data
inputs from existing databases of WRD and CGWB
have been taken into consideration to run the
model. Simulation for ground water quality
distribution is also included due to the
presence of sea water on the eastern and
southern sides.
The modelling study revealed large gaps in the data available for the simulation of
the complex ground water flow and solute transport system in the delta region. These data
gaps in water levels of different layers of aquifers, aquifer parameters, level of resource
utilisation, spatial distribution of resource recharge and utilisation are required to be filled
up for meaningful simulation and understanding of the aquifer system that is being used in
the delta region in conjunction with the surface water supply and rainfall.
Addressing the issue of optimal use of ground water potential of the shallow and
multiple layers of the deeper aquifer should be given priority due to the increasing
dependency on ground water for irrigation and domestic use. Unless the ground water
resource is managed with a more realistic approach based on the study of entire
framework of aquifer system, an irreparable impact on the ground water environment may
creep in. Understanding the realistic availability of ground water resources in space and
time is relevant to address the water demand and management issues in a canal command
area. Three dimensional modelling of the aquifer system shall provide solutions in the
estimation of aquifer wise ground water conditions in its quantity and quality. Availability
of ground water resource in space and time, from the model, helps in the management of
canal water supplies and meet the demand of needy areas.

266
Data Inputs. The modelling studies are intended to develop a three dimensional aquifer
model for evaluating ground water potential in the major aquifers of the area. Delineation
of these aquifers should be based on their geometry, hydraulic characteristics, their
response to external stresses, etc. Due to the non-availability of such data for developing a
3D model, the data has to be collected through new observations and monitoring in the
area.
Model Requirements. For utilising the modelling tool in understanding the process of
ground water in the multi-layer aquifer system and variation in chemical quality and
develop strategies for the management of available resources, equipment (hardware and
software) required is attached in Annexure-1. The software with graphical user interface is
more convenient for pre-processing of data inputs in the form of tables, maps in GIS
format, satellite images and also for testing the model for several scenarios. The software
should also have capability for processing data outputs and managing the outputs to
produce in various presentation formats, graphs, charts and maps.
Staffing. One full-time experienced person in ground water from WRD supported by an
external modelling specialist with good experience in aquifer modelling studies exposed to
similar hydrogeological conditions as that of Cauvery delta region are required to carry out
and develop an aquifer model for ground water flow and solute transport conditions.
Cost Estimate. The cost estimate for implementing the detailed groundwater modelling
study is about INR. 35 lakhs (US$ 60,000), excluding data collection and consulting
services. Details of the cost estimate are given in Table 16.3.

267
Table 16.3 Cost Estimate for Modelling
s.no Item Unit INR Unit cost
INR (Lakhs)
Total cost INR (Lakhs)
1 HARDWARE (Computer, printer) No. 2 2.5 5
2 SOFTWARE (Modflow based GUI software)
No. 2 10 20
3 International consultancy services for groundwater modelling
Month
2 Cost included in implementation support consultancy
4 National consultancy services for groundwater modelling
Month
6
5 Training in groundwater modelling No. 1 10 10
Total cost in INR. Lakhs 35
Total cost in US $ 60,000

268
17. Drainage and Land Reclamation
Four of this six Project channels, namely the Pandavayar, Vellaiyar, Harichandra
and Adappar rivers, are used as delivery channels for irrigation water as well as drainage
channels to remove drain water and flood water. The other two of this Project channels,
namely the Valavanar drain and the Vedharanyam canal, carry flood and drainage flows
only.
Chapter 13 gives a description of the rivers, drains and canal systems. As an
integrated system, irrigation and drainage requirements are discussed together. The
river/canal system is analysed and proposed interventions are identified to alleviate
problems of flooding and drainage congestion.
The proposed interventions aim at reducing the extent, depth and frequency of
flooding and drainage congestion. However, these measures are limited to main channels.
The non-availability of an accurate DEM, system layout and longitudinal and cross
sectional details of other canals and drainage channels, limited the option of analysing the
problem of field drainage in detail and evolving appropriate interventions for alleviation.
Land reclamation is not included in this Project.

269
18. Land Acquisition, Rehabilitation and Resettlement
18.1 Introduction
The Resettlement Framework (RF) guides the resettlement implementation and
management phase of CASDP Project. The document explains the number of families
impacted by the project and specifies implementation procedures including budget and
monitoring and reporting requirements. Finally, all works undertaken are to strictly
adhere to all ADB SPS, 2009 and operational procedures and government policies. The
document provides a framework for assessment of any involuntary resettlement impacts in
the identified subprojects and those of other subprojects for funding in future CASDP
projects.
This Project aims to improve the performance of six rivers in the Vennar System. The
proposed activities do not involve any need for land acquisition. The PPTA field survey of
encroachment estimated that approximately 203 squatters will be affected who may need
to be relocated. The possible impacts can be categorized in three broad groups:
Loss of immovable assets, i.e. agricultural land, homestead, cattle sheds, wells, ponds,
trees, commercial establishments, community infrastructure, etc.
Loss of livelihood or income opportunity on account of loss of agricultural land.
Impact on the community in terms of loss of common property resources, such as
grazing land, other common land, village commons or forests or access to them.
The impacts could be either temporary (for the duration of construction activities) or
permanent. The WRD will ensure that no physical or economic displacement will occur
without providing the entitlements listed in the resettlement plan.
18.2 Scope of Resettlement
There is no land acquisition anticipated in this Project and resettlement impacts are
not significant.

270
The RF describes the details of entitlements and type of assistance to be extended
to the affected persons, which will become the basis for preparing a resettlement plan (RP)
for each CASDP project. All sub projects shall be screened for their likely adverse impacts
in the planning stage. Where land acquisition cannot be avoided, a census of the
potentially affected persons will be carried out. If the issues related to resettlement are
triggered, an RP will be prepared for the concerned tranches of the MFF.
18.3 Policies of the Government and ADB
The principles for this Resettlement Framework are derived from ADB’s
Safeguard Policy Statement (2009) and the Government of India’s Right to Fair
Compensation and Transparency in Land Acquisition, Rehabilitation and Resettlement
Act, 20I3.
18.4 Screening and Categorization
ADB’s Involuntary Resettlement Impact Screening Checklist will be adopted for the
each of the six rivers of this projects. The following criteria for screening and
categorization of subprojects will be followed:
Category A: as a result of the subproject, 200 or more people will experience major
impacts, that is, being physically displaced from housing, or losing 10% or more of
their productive (income-generating) assets;
Category B: as a result of the subproject, fewer than 200 people will be physically
displaced from housing or lose less than 10% of their productive (income-generating)
assets;
Category C: the subproject does not require temporary or permanent land acquisition,
and there are no impacts involving the loss of land, structures, crops and trees,
businesses or income.

271
18.5 Eligibility and Entitlements
18.5.1 Eligibility
All Project Affected Persons (PAP) identified in the project-impacted areas on the cut-off
date will be entitled to compensation for their assets. The cut-off date for the encroachers
will be the date of census survey and cut-off date for the title holders to be defined by the
Land Acquisition Act 2013. The rehabilitation measures will be sufficient to assist them to
improve or at least maintain their pre-project living standards, income-earning capacity
and production levels. The resettlement framework identifies or categorizes project
affected persons under these three broad categories as follows:
Type 1: Legal titleholders of the land that is acquired
Type 2: Those without formal titles, whose claims are recognized/recognizable under
national laws, e.g., communities with traditional land tenure systems having collective
usufruct, tenants and leaseholders; and
Type 3: Squatters, encroachers, sharecroppers and wage labour who have no
recognizable claims but are entitled to assistance if land requirement affects their
livelihoods
18.5.2 Entitlement
The entitlement matrix summarizes the main types of losses envisioned by the
works and the corresponding nature and scope of entitlements in accordance with the
Government of India and ADB policies.
18.6 Monitoring
Resettlement plan implementation will be closely monitored by PMU for
identifying potential difficulties and problems in resettlement plan implementation. Such
monitoring for resettlement plan implementation will be carried out during the entire
Project period with monitoring commencing after three months of project initiation.

272
18.7 Cost Estimate and Budget
The WRD will make the fund available as required to cover all compensation and
Resettlement and Rehabilitation (R&R) costs from the ADB loan. The budget rates, as
well as the costs, are based on field-level information and past experience in resettlement
management. The cost estimates included in this plan also make adequate provision for
20% contingencies as indicated in the Table 18.2. The total cost for this Project will be
Rs.3,03,31,123 (USD $ 505518.72)/-.

273
Table 18.2: Resettlement Costs
S No Description Unit Unit
Rate/(Rs) Quantity Total/(Rs)
1 Cost of Houses to Residential squatters requiring relocation
No 100,000 106 10,600,000
2 Cost of Land for resettlement site sq.m 945 2,275 2,149,748
3 Shifting assistance to Residential squatters requiring relocation
No 25,000 106 2,650,000
4 Subsistence allowance to Residential squatters requiring relocation @ Rs.3,000 p.m for 6 months
No 18,000 106 1,908,000
5 Replacement cost for cattle shed / shed for storage
No 15,000 97 1,455,000
6 Transitional allowance to commercial squatters requiring relocation @ Rs.3,000 p.m for 6 months
No 18,000 17 306,000
7 Shifting assistance to Commercial squatters requiring relocation
No 25,000 17 425,000
8 Replacement cost for commercial structures sq.m
17 2,380,000
Sub Total -A
21,873,748
9 NGO Support for RP implementation LS
2,500,000
10 External Monitoring LS
2,000,000
11 Disclosure / Consultations / Administrative Expenses
LS
1,200,000
Sub Total-B
5,700,000
12 Contingency @ 10% of Sub Total A+B
2,757,375
Total
30,331,123

274
19. Water Management and Maintenance
19.1 Current Management of Project-1 Rivers
The current method of management of the Project-1 Rivers is rudimentary and
mainly based on manual methods. The method responds to requests from farmers for
water. Often farmers’ lobbies raise their demands directly to the WRD or indirectly
through the Agriculture Department, agriculture associations and also through regular
farmer grievance meetings with their District Collectors.
WRD’s management of this Project Rivers involves three main activities:
(i) Management of irrigation flows through the rivers and canals to meet irrigation
requirements. Irrigation water is usually provided over a period of about nine
months from June through to the end of January,
(ii) Management of flood flows through the rivers and drains to minimise flood
damage. Flood flows normally occur during the north-east monsoon (October-
December) but can also occur during the south -west monsoon ,
(iii) Maintenance of irrigation rivers, canals, drains and structures.
19.1.1 Management of Irrigation flows
The current normal operating procedure in the Vennar system is to respond
directly to farmers’ demands for irrigation water. In practice it is sometimes difficult to
satisfy the demands because the inflow into the system are variable, depending on the
volume of water stored in the Stanley Reservoir and releases from Mettur dam, and
because the water distribution system is in poor condition. Consequently, it is difficult
for WRD to achieve equity of supply across the system. Moreover many tail end areas
have saline groundwater and therefore farmers in those areas cannot supplement
surface water supplies with groundwater and are therefore are disadvantaged.
The normal irrigation water distribution procedures are as follows :
(i) Evaluating the volume of water available in Stanley Reservoir, with allowances
for possible further inflows to the reservoir,
(ii) Evaluating the volume of additional inflows into the Cauvery River below
Mettur,
(iii)Estimating the total flows that might be available at the Grand Anicut,

275
(iv) Estimate water availability in the upcoming season and estimate potential
deficits using information on cropped areas, crop water requirements in
normal and dry years and water supply efficiencies,
(v) Sharing any deficits evenly over the entire command area and over the entire
irrigation season,
(vi) Assessing actual water stress by location so that if possible irrigation water can
be supplied to areas suffering more than others
(vii) Determining the optimum scheduling of flows in each canal and what the
gate settings should be.
19.1.2 Management of flood flows
The current operating procedure for flood management in the Vennar irrigation
system is to fully open selected head regulators and all tail end regulators in order to
minimise damage to infrastructure and flooding of the flood plains, as shown in Figure
13.5. Nevertheless owing to the limited capacity of many of the rivers and drains flood
damage is unfortunately endemic in the system.
Major floods in the Vennar system are usually caused by intense local cyclonic
rainfall during the north-east monsoon, lasting several days. The largest floods in recent
times were in September 2005, November 2005, November 2008 and again in
November 2010. Very occasionally floods are caused in the Cauvery delta by distant
storms in Karnataka, Kerala and highland Tamil Nadu during the south-west monsoon,
the runoff from which exceeds the capacity of the Grand Anicut. This occurred in
September 2005 and possibly once in the preceding 20 years.
19.1.3 Maintenance of irrigation canals
Generally, the maintenance of irrigation systems in the Cauvery sub-basin is
carried out by WRD according to urgency and fund availability. Periodic inspection is
done by WRD Engineers to assess the condition of the irrigation structures and other
assets and the need for maintenance work. Cost estimates are then prepared for
maintenance. Funds for maintenance are allocated annually according to the cost
estimates and the availability of funds. The funds are released quarterly. The average
annual allocation of maintenance funds per division in the Vennar system is roughly
about INR 60 million/year. Maintenance work is normally carried out during the dry
season (February to June), except for emergency works.

276
Downstream of the main rivers, irrigation channels are categorized into six
different classes, namely A, B, C, D, E, and F. In the absence of formal Water User
Associations (WUAs) in the Cauvery sub-basin, the maintenance of all classes of
channels is taken up directly by the WRD. The number of channels in each class and
their length is shown in Table 19.1.
Table 19.1 Length of Different Classes of Channel, Vennar System Channel type in Vennar
System Number Length (km)
A Class 583 2316.21 B Class 3932 3992.11 C Class 5191 3060.89 D Class 2566 1349.43 E Class 837 312.20 F Class 178 48.11 Total 13287 11079.04
This Project works will facilitate maintenance by making six channels more
accessible through provision of standardised embankments. The dredging of the
straight cuts will require a commitment to an annual maintenance expenditure on
dredging to keep the straight cuts open.
19.2 Analysis of Current Decision Making
Surface water supply to the Cauvery Delta during June to October is determined
largely by the flows in the Cauvery River and amount of water stored in the
Stanley Reservoir at Mettur Dam. Estimates of irrigation demand are prepared
by the WRD sub-divisional engineers according to irrigated farm areas and
standard water duties. The sub-divisional estimates are aggregated by the
Executive Engineers and Superintending Engineer and used to decide the
necessary releases of water from Mettur Dam.
Operation of head regulators in the Cauvery Delta determines the distribution of
surface water. In the Vennar system the gate operators at the VVR head
regulator release the necessary discharges to maintain normal supply levels in
the Vettar, Vennar and Vadavadar Rivers simultaneously, if sufficient water is
available. If sufficient water is not available then a 6-day rotation system is
adopted, based on the normal travel time of 6 days between Mettur Dam and the
tail end of the rivers.

277
Formal control rules and structure ratings, published in 1937, are still referred to
by local WRD staff. These instruct the operators how to determine appropriate
gate settings to maintain normal supply levels.
WRD review gate settings on a six-day cycle using information on irrigation
demands and recent rainfall to decide appropriate discharges and gate settings
for the next 6 days. This procedure is based on the experience and judgment of
WRD Engineers.
Actual discharges through the head regulators are considered by WRD to be less
than those indicated by the 1937 structure ratings because of the influence of
vegetation and sediment on flow characteristics in the vicinity of the regulators.
Therefore the gate operators decide to adjust gate openings based on their
judgment in order to maintain normal supply levels in the system.
During flood conditions inflows into the delta from the Cauvery River are
stopped at the Grand Anicut. In order to discharge storm runoff generated
within the delta to the sea as quickly as possible, specific regulators are opened
fully. During widespread flooding, flood waters are directed preferentially down
the Vettar River, then the Vennar River.
The conclusion is that (i) there is a need for greater accuracy of discharge
measurements at all regulators through updated calibrations of the gates, (ii) linking
gate operation with rainfall forecasts could improve the management of the irrigation
systems by reducing irrigation requirements increasing water use efficiency and
securing crop production, (iii) some irrigation head sluices are unregulated because
they are blocked or stuck partially open, or fully open, due to lack of maintenance and
therefore some farmers probably receive too much water, others too little, (iv) the use
of groundwater by farmers is not taken into account in channel operations.
19.3 Proposed Decision Support System
19.3.1 Management of Irrigation Flows
To improve the management of irrigation flows in the Project 1 area it is
recommended that operational and planning decision making by WRD is supported by
an appropriate decision making tool.

278
The architecture of this DSS will comprise a host computer server located in
WRD offices, locally in the Cauvery Delta area or remotely in the PWD Surface Water
and Groundwater Data Centre in Chennai, linked to workstations in the offices of the
divisional Executive Engineers and/or the sub-divisional Assistant Executive
Engineers. The databases will be linked through mobile phone networks or other
suitable means to selected rainfall, groundwater and river monitoring stations
distributed at key locations in the delta. The monitoring stations will deliver data into
the databases automatically on a daily basis and will be immediately available for
quality control and archiving by specially trained WRD technicians and also for
operational decision making by key WRD engineers.
Key decisions that could be supported include:
• Facilitate irrigation planning and efficient water distribution for the systems (on
seasonal and 10-day time scales) based on actual needs, both for surface water
and groundwater.
• Fine tuning water supply to actual needs in individual command areas.
• Integrated operation of dams, head regulators, cross regulators and tail
regulators to maintain appropriate flows and water levels during normal supply
periods and during floods.
• Detect and respond to distribution system problems and breakdowns.
19.3.2 Management of Flood Flows
For the management of flood flows it is essential to have real time data.
Therefore a network of telemetered rain gauges, weather stations and flow gauges and a
data acquisition system is required including:
Water levels and flows within the canal system to inform decisions on the
timely operation of control structures
Expected inflows to the system – both at the head of the system (main river) and
the drainage from land within the irrigated area
Sea water levels or downstream water levels as appropriate
The state of groundwater and surface water storage in the catchment

279
These could then be used in a set of forecasting models (rainfall-runoff, hydraulic
and water balance models) to forecast water levels and flows within the system
(forecasts would be updated as real time data is updated). The flood management
element of the DSS would:
(i) Provide links to rainfall estimates from appropriate web-sites for best estimate
forecast rainfall over next (say) 6 days
(ii) Calculate current flows within the canal / drainage system (with facility to
improve prediction using adjustment from present reported water levels and
flows within the system)
(iii)Calculate likely flows in the Cauvery River at Grand Anicut over next (say) 6
days – implying that a routing model is required (either a hydrodynamic
model or a routing model)
(iv) Estimate runoff hydrographs within the irrigated area over next 6 days for
forecast rainfall using rainfall runoff modelling such as SWAT, HEC-HMS
or NAM (models such as HEC-HMS or NAM become more appropriate at
short time intervals)
(v) For assumed flood management flow distribution for this 6 day period, and
assumed operation of tail sluices, estimated water levels within the canal /
drainage system at key locations and for the three day forecast
(vi) Identify areas where water levels are expected to collect in the drainage area
and to exceed bank top levels together with the predicted depth and duration
of flooding
(vii) Allow operators to alter operation of main controls at key distribution points
so that flows are re-directed manually to minimise overall impact of flooding
(viii) Once preferred operation of flow distribution has been selected, the RTDSS
would identify areas in danger of flooding and providing warnings to those
likely to be affected and mobilising contingency plans and actions.
19.3.3 Initial Simple DSS
Recognising the challenges and constraints facing WRD, a simple DSS
comprising surface water and groundwater databases containing hydrometeorological,
hydrological and hydrogeological data and irrigation command area (ayacut)
information is proposed initially. This simple DSS will be accessible to WRD decision
280
makers through a user-friendly computer interface allowing them to inspect up-to-date
river levels, flows, water demands throughout each irrigation and drainage system and
to adjust surface water deliveries to actual needs considering groundwater availability
and recent rainfall.
While it is recommended that a simple DSS will improve operational decision
making for water distribution, it is also recommended that, after a sufficient period of
familiarisation and confidence building, which will establish the usefulness of the DSS,
consideration should be given to the development of the simple DSS into a more
sophisticated tool that will support the maximisation of water use efficiency and fully
reap the benefits of integrated water resources management within the Cauvery Delta.
This more sophisticated DSS could include hydrologic and hydraulic models that
would guide the operators of the irrigation and drainage systems on a daily basis and
provide comprehensive assessments of water resources management options on a
seasonal basis. Further development of the DSS could include flood forecasting (using
links to the India Meteorological Department and the CWC) and flood warning.
19.3.4 Training of WRD Staff
WRD staff will receive regular and intensive training on monitoring the
parameters used as input to the DSS, updating and maintaining the databases, using the
information generated, and communicating this information to farmers and other
stakeholders. The training program would also include intensive training for key WRD
staff on the hydrologic and hydraulic models, operation and maintenance of the field
equipment and the database software and hardware.
Beyond this, an overall capacity building program in climate-resilient integrated water
resources management would be provided for WRD staff. In addition to training on the
DSS tools, WRD staff would gain knowledge and additional skills in using climate
change projections, using the new criteria for engineering designs prepared through the
PPTA, setting up and using hydraulic and hydrologic modelling for design and
planning, flood forecasting and warning, and working with farmers to manage their
surface water and groundwater resources.

281
19.4 Costs of the DSS
19.4.1 Initial Simplified DSS
Four main inputs into the simplified DSS are proposed (i) field monitoring
equipment, (ii) computer hardware and database software, (iii) programme of flow
measurements to calibrate discharges through regulators and (iv) a watering schedule
calendar in the form of a simple spreadsheet. In consultation with WRD it is agreed to
pilot the simplified DSS for one channel of Vennar system (the Harichandra River)
during the first phase and, based on its performance, it may be extended to cover other
rivers.
19.4.2 Monitoring Equipment and Hardware and Database Software
Table 19.2 lists the hydrometric field equipment and office based hardware and
software that would be needed to link the monitoring stations to the DSS and
implement the DSS under this Project.
Table 19.2: Equipment and Indicative Costs of DSS
Equipment Phase I
(Harichandra River) Nr Estimated Cost $
Field Equipment Recording raingauges 5 $5,000 Check raingauges 5 $1,500 Surface water level recorders 10 $10,000 Groundwater level recorders 5 $5,000 Gate openings recorders 5 $5,000 Ultrasonic Flow meter 1 $25,000 SIM cards and cell phone contracts 20 $6,000 Training of WRD field engineers $5000
Sub-Total $62,500
Office Equipment Database + User Interface 1 $10,000 Server + Back-Up Facility 1 $2500 Workstations + UPSs 5 $5000
Sub-Total $17,500
TOTAL $80,000

282
19.4.3 Calibration of Regulator Discharges
To make decisions on releasing precise flows through the irrigation network it is
important to calibrate the regulators accurately. The calibration of the regulator gates
involves measuring the actual discharge directly at a river cross-section close to the
regulator over the widest possible range of flows. For the matrix of flow measurements
and gate openings, coefficients of discharge Cd (the ratio of actual discharge to
theoretical discharge) are calculated.
A calibration programme could be developed by a national expert working
alongside WRD staff. A tentative cost for expert support for recalibration of regulators
for the Harichandra River under this Project, including training of WRD staff, is
$10,000.
19.4.4 Water Schedule Calendar
This is a spreadsheet-based approach that will assist in a practical way the
management of irrigation systems in the Vennar system using a projected crop water
requirement calendar to forecast irrigation scheduling well in advance.
The spreadsheet is a calendar of irrigation requirements for the crops under
consideration which can be used to estimate future water requirements at any particular
point in irrigation season to come. From inputs of planned areas of Kuruvai, Samba and
Thalladi paddy and their respective sowing dates, the spreadsheet would output
irrigation requirements according to the growth stage of the crop using the standard
Penman-Monteith equation for evapotranspiration, making allowances for rainfall and
alternative water sources such as tanks, ponds and groundwater. This output from the
spreadsheet would assist facilitate decision making with reasonable confidence about
the release of water without risking future water scarcity.
Tentative cost for expert support for development of spread sheet based approach under
this project including training of WRD staff of Cauvery basin would be about $25,000
and for the software would be about $50,000.

283
19.5 Summary of DSS Costs
The estimated cost for developing and implementing the simplified DSS for the
first phase is about $80,000 the major portion of which would be towards field and
office equipment.

284
20 On-Farm Works
On-farm works are not included in this Project.

285
21 Construction Programme 21.1 Project Area
The six rivers in this Project area are the worst affected by flooding and the most
in need of improvement as per water resources management. The six rivers are
representative of the water problems of the Cauvery Delta and have been selected with
the intention of scaling up and applying this Project interventions throughout the Delta.
The six rivers of this Project are:
Adappar
Harichandra Vellaiyar
Pandavayar Valavanar Drain
Vedharanyam Canal
21.2 Major Works
21.2.1 Nature of Works
The following works are included in Project:
Re-sectioning of the river which includes increasing the width and depth of the river.
Desilting of the river which includes excavation of the channel bed to remove sand bars and other impediments to restore the channel to its design section.
Standardisation of banks which includes raising and strengthening of the embankments, restoring the bank side slopes, top width, construction of road etc. to bring the embankment bank to BIS standards.
Repairs of Head Regulators, Cross or Intermediate Regulators, Tail End Regulators, Irrigation Sluices, Drainage Sluices, Drainage Infalls, Irrigation Syphons, Drainage Syphons, Bed Dams and Grade Walls. Repairs are defined as the restoration of the components of the structures to function as designed.
Reconstruction of existing and construction of new Head Regulators, Cross or Intermediate Regulators, Tail End Regulators, Irrigation Sluices, Drainage Sluices, Drainage Infalls, Irrigation Syphons and Drainage Syphons, Bed Dams, Grade Walls. Reconstruction is defined as the demolition and removal of all components of the existing structure and construction of new structure including foundations on the same site.
Fluming and River Training. Bank revetment/pitching and masonry walls depending upon severity of the problem of bank failure and non availability of land

286
The works to be constructed on each river may include one or more of these works.
The total length of the six Project river channels to be re-sectioned or re-graded is
234.5 km. The number of new structures and the existing structures to be reconstructed
and repaired/rehabilitated is given in Table 21-1.
Table 21-1: New Structures and Structures to be Reconstructed and Repaired
Type of Structure New Reconstruction Repair
Regulators (Head, Cross and Tail) 5 8 13
Irrigation Head Sluice 2 86 47
Drainage Sluice / Drainage Infall 33 42 26
Drainage Syphon / Irrigation Syphon 0 11 3
Bed Dam/Grade wall 4 1 15
Total 44 148 104
21.3 Estimated Costs
Total estimated cost of works only is INR 9120 million (US $ 152.00 million).
The estimated cost for each river is shown in Table 21-2
.
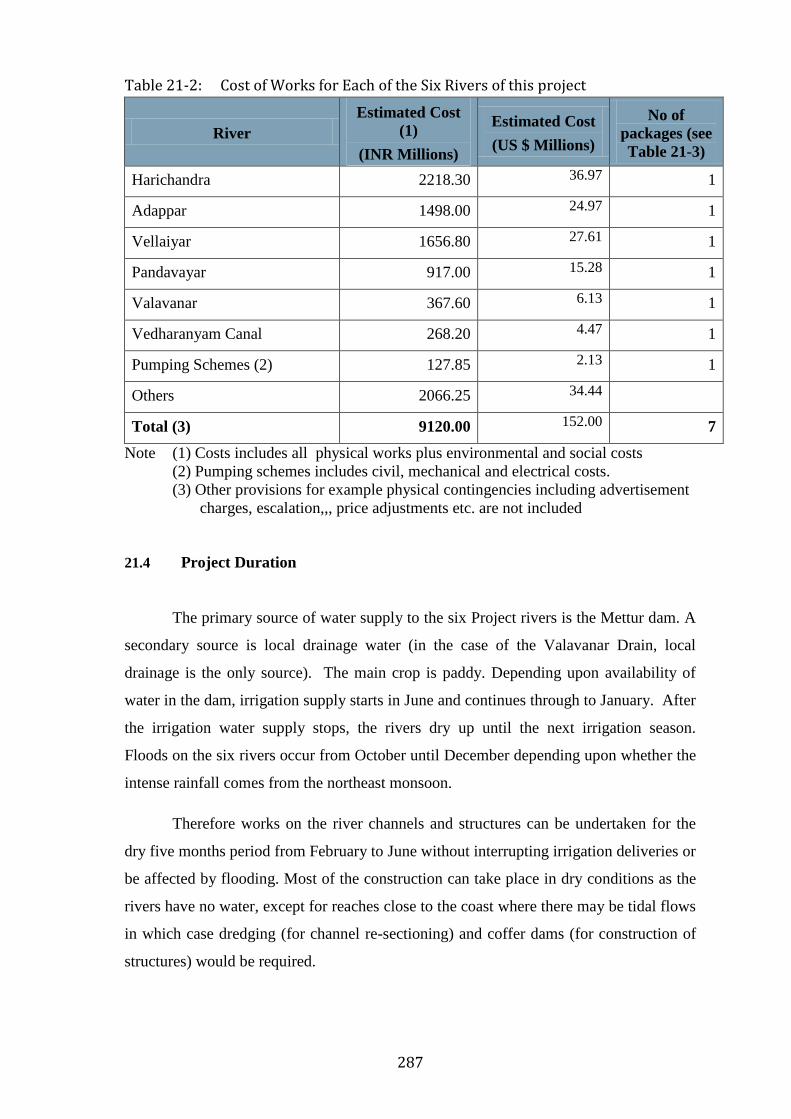
287
Table 21-2: Cost of Works for Each of the Six Rivers of this project
River Estimated Cost
(1)
(INR Millions)
Estimated Cost
(US $ Millions)
No of packages (see Table 21-3)
Harichandra 2218.30 36.97 1
Adappar 1498.00 24.97 1
Vellaiyar 1656.80 27.61 1
Pandavayar 917.00 15.28 1
Valavanar 367.60 6.13 1
Vedharanyam Canal 268.20 4.47 1
Pumping Schemes (2) 127.85 2.13 1
Others 2066.25 34.44
Total (3) 9120.00 152.00 7
Note (1) Costs includes all physical works plus environmental and social costs (2) Pumping schemes includes civil, mechanical and electrical costs. (3) Other provisions for example physical contingencies including advertisement
charges, escalation,,, price adjustments etc. are not included
21.4 Project Duration
The primary source of water supply to the six Project rivers is the Mettur dam. A
secondary source is local drainage water (in the case of the Valavanar Drain, local
drainage is the only source). The main crop is paddy. Depending upon availability of
water in the dam, irrigation supply starts in June and continues through to January. After
the irrigation water supply stops, the rivers dry up until the next irrigation season.
Floods on the six rivers occur from October until December depending upon whether the
intense rainfall comes from the northeast monsoon.
Therefore works on the river channels and structures can be undertaken for the
dry five months period from February to June without interrupting irrigation deliveries or
be affected by flooding. Most of the construction can take place in dry conditions as the
rivers have no water, except for reaches close to the coast where there may be tidal flows
in which case dredging (for channel re-sectioning) and coffer dams (for construction of
structures) would be required.
288
Most of the structures except the tail end regulators are small and can be
completed within a period of three months. At the new tail end regulators, the bed levels
of the rivers are below sea level. As there is tidal flow into these reaches, arrangements
are required to stop the backflow from the sea.
The total duration of this Project is 36 months.
21.5 Procurement of Works
Based on the type of construction, the layout of the rivers and the availability of
the sites, it is proposed to have 7 tender packages. Details of the seven tender packages
are given in Table 21.3.
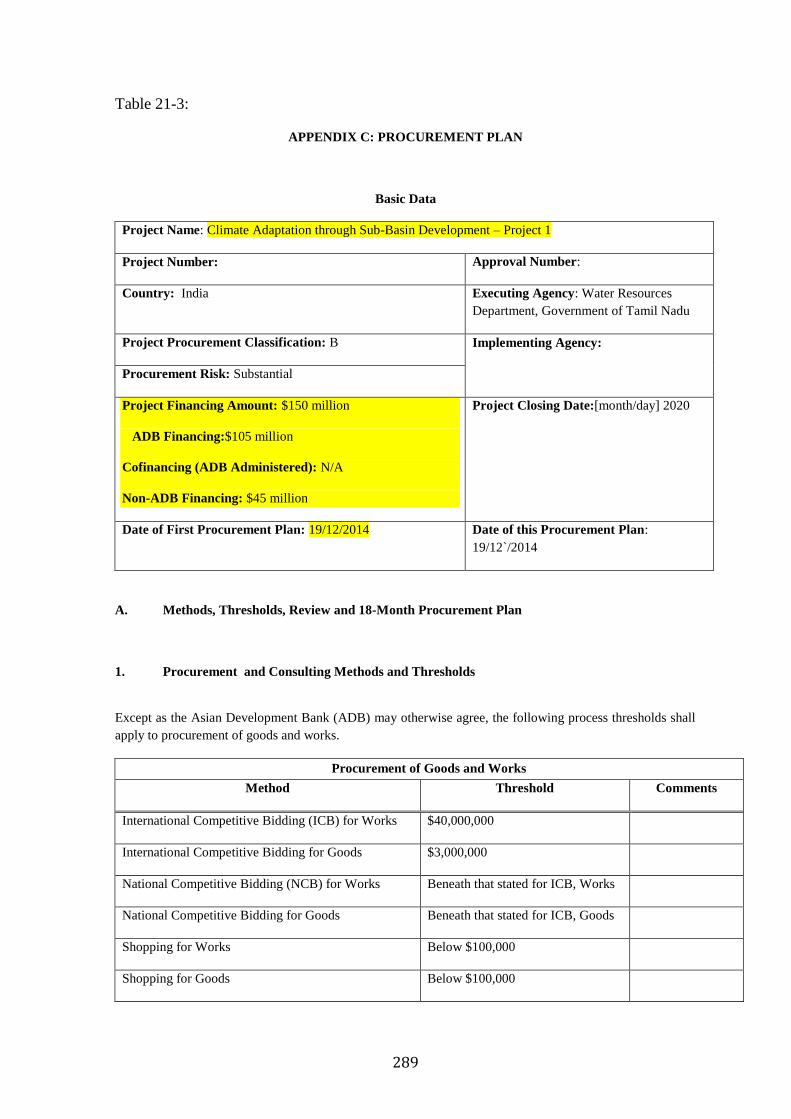
289
Table 21-3:
APPENDIX C: PROCUREMENT PLAN
Basic Data
Project Name: Climate Adaptation through Sub-Basin Development – Project 1
Project Number: Approval Number:
Country: India Executing Agency: Water Resources Department, Government of Tamil Nadu
Project Procurement Classification: B Implementing Agency:
Procurement Risk: Substantial
Project Financing Amount: $150 million
ADB Financing:$105 million
Cofinancing (ADB Administered): N/A
Non-ADB Financing: $45 million
Project Closing Date:[month/day] 2020
Date of First Procurement Plan: 19/12/2014 Date of this Procurement Plan: 19/12`/2014
A. Methods, Thresholds, Review and 18-Month Procurement Plan
1. Procurement and Consulting Methods and Thresholds
Except as the Asian Development Bank (ADB) may otherwise agree, the following process thresholds shall apply to procurement of goods and works.
Procurement of Goods and Works
Method Threshold Comments
International Competitive Bidding (ICB) for Works $40,000,000
International Competitive Bidding for Goods $3,000,000
National Competitive Bidding (NCB) for Works Beneath that stated for ICB, Works
National Competitive Bidding for Goods Beneath that stated for ICB, Goods
Shopping for Works Below $100,000
Shopping for Goods Below $100,000

290
Consulting Services
Method Comments
Quality and Cost Based Selection (QCBS) 90:10 quality-cost ratio will be used
Quality Based Selection
Consultants’ Qualifications Selection
Least-Cost Selection
Fixed Budget Selection
Individual Consultant Recruitment

291
2. Goods and Works Contracts Estimated to Cost $1 Million or More
The following table lists goods and works contracts for which the procurement activity is either ongoing or expected to commence within the next 18 months.
Package Number6
General Description
Estimated Value
Procurement Method
Review
[Prior / Post/Post (Sample)]
Bidding Procedure7
Advertisement
Date (quarter/year)
Comments8
CW 1 - CASDP/TN
/HRN/ /2014
Infrastructure Improvements and Reconstruction Works on Harichandranathi from LS 121.142 Km to 160.200 Km &Lawford Straight Cut from LS 0 to 3.900 Km.
Rs.2218.30M, $36.97M
NCB Prior 1S2E Q1/2015 Small Works SBD
CW 2 - CASDP/TN/ADP/ /2014
Infrastructure Improvements and Reconstruction Works on Adappar River from LS 130.236 Km to 169.025 Km &Adappar Straight Cut from LS 0 to 2.40 Km.
Rs 1498.00M, $24.97M
NCB Prior 1S2E Q1/2015 Small Works SBD
CW 3 - CASDP/TN
/VLR/
2014
Infrastructure Improvements and Reconstruction Works on Vellaiyar River from LS 111.650 Km to 153.650 Km.
Rs.1656.80M, $27.61M
NCB Prior 1S2E Q1/2015 Small Works SBD
CW 4 - CASDP/TN/PDR /2014
Infrastructure Improvements and
Reconstruction Works on
Pandavaiyar River from LS 109.270 Km to 148.020
Km.
Rs.917.00M. $15.28M
NCB Prior 1S2E Q1/2015 Small Works SBD
CW 5 - CASDP/TN
Infrastructure Improvements and
Reconstruction
Rs.367.60M, $6.13M
NCB Prior 1S2E Q1/2015 Small Works SBD

292
/VNR /2014 Works on Valavanr Drain
from LS 0 Km to 16.450 Km.
CW 6 - CASDP/TN
/VRM
/2014
Infrastructure Improvements and
Reconstruction Works on V.Canal
and Uppanar.
Rs.268.20M, $4.47M
NCB Prior 1S2E Q1/2015 Small Works SBD
Pump 1 - CASDP/TN
/PS
/2014
Design, Supply, Installation, Testing and
Commissioning of Various pumping
machinery including associated electrical,
Mechanical and civil works.
Rs.127.85M, $2.13M
NCB Prior 1S2E Q1/2015 Plant SBD

293
3. Consulting Services Contracts Estimated to Cost $100,000 or More
The following table lists consulting services contracts for which the recruitment activity is either ongoing or expected to commence within the next 18 months.
Package Number
General Description
Estimated Value
Recruitment Method
Review
(Prior / Post)
Advertisement Date
(quarter/year)
Type of Proposal
Comments
TBD Project Implementation Consultants (PIC)
$632,000 ICS Prior Q1/2015 N/A National individuals (8)
TBD Project Technical Assistance Consultants (PTAC)
$1.1 million QCBS Prior Q2/2015 Full technical
For feasibility study, detailed design, and loan preparation for subsequent MFF tranches, conducting groundwater pilot, flood mapping, and DSS set-up. International. 90:10 quality-cost ratio.
TBD Environmental consultants to undertake EIA to obtain CRZ clearance
$220,000 CQS Prior Q1/2015 Bio-data National
Lump sum contract
TBD MIS Development and Maintenance
$300,000 QCBS Prior Q3/2015 Bio-data National. Lump sum contract
TBD Topography Survey- Vennar
$400,000 QCBS Prior Q3/2015 Bio-data National. Lump sum contract
TBD Topography Survey- Cauvery
$475,000 QCBS Prior Q3/2015 Bio-data National. Lump sum contract

294
4. Goods and Works Contracts Estimated to Cost Less than $1 Million and Consulting Services Contracts Less than $100,000 (Smaller Value Contracts)
The following table groups smaller-value goods, works and consulting services contracts for which the activity is either ongoing or expected to commence within the next 18 months.
Goods and Works
Package Number
General Description
Estimated Value
Number of Contracts
Procurement Method
Review
[Prior / Post/Post (Sample)]
Bidding Procedure
Advertisement
Date (quarter/
year)
Comments
Vehicles 1 Vehicles (19) $260,000 1 NCB Prior 1S1E Q1/2015 Multiple lots for different types of vehicles
Equipment 1 Field hydro-meteoro-logical
equipment
$137,500 1 NCB Prior 1S1E Q1/2015 Provider will provide training on equipment use
Equipment 2 DSS Office equipment
$22,500 1 Shopping Post N/A Q1/2015
Equipment 3 PMU Office Equipment
$240,000 Multiple Shopping Post N/A Q1/2015
Consulting Services
Package Number
General Descripti
on
Estimated Value
Number of
Contracts
Recruitment
Method
Review
(Prior / Post)
Advertisement
Date (quarter/
year)
Type of Proposal
Comments
TBD NGO for resettleme
nt plan implement
ation
$42,000 1 CQS Prior Q1/2015 Bio-data National
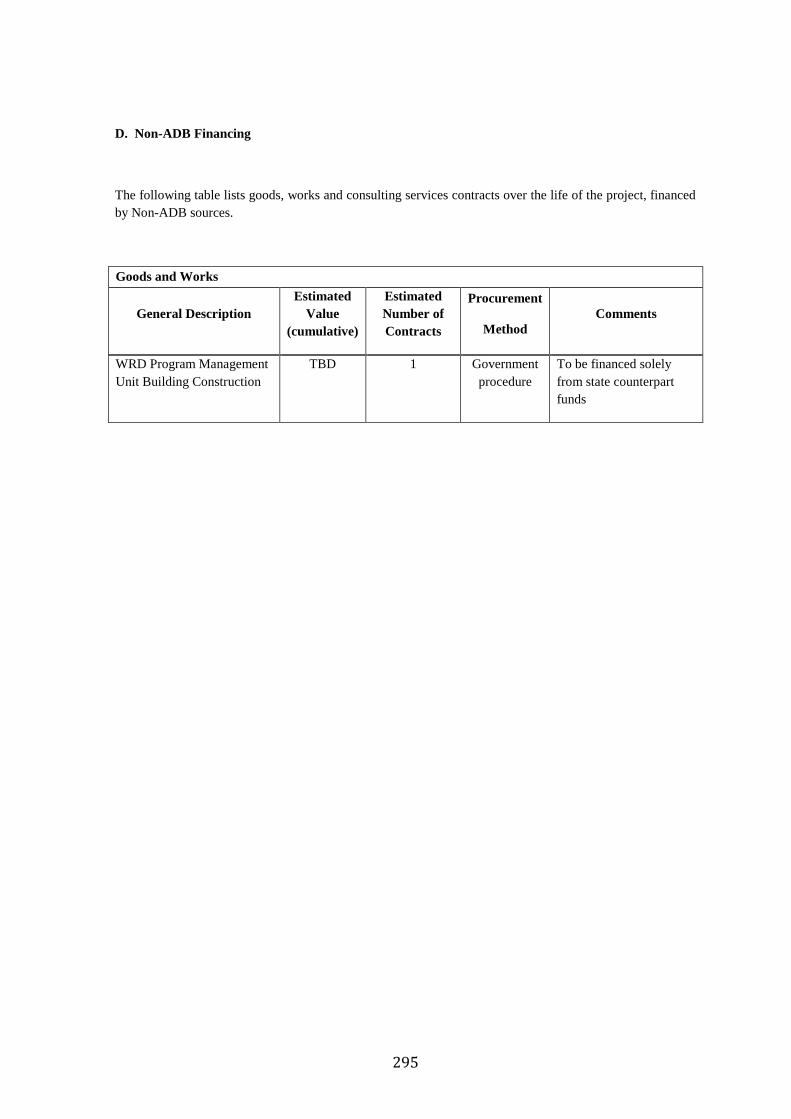
295
D. Non-ADB Financing
The following table lists goods, works and consulting services contracts over the life of the project, financed by Non-ADB sources.
Goods and Works
General Description Estimated
Value (cumulative)
Estimated Number of Contracts
Procurement
Method Comments
WRD Program Management Unit Building Construction
TBD 1 Government procedure
To be financed solely from state counterpart funds

296
Procurement packages have been planned in such a manner that works in each
package will be constructed over two working seasons, with one working season being 6
months from February to July.
21.6 Implementation Schedule
Based on the above procurement plan for 7 works packages, the preparation of the
procurement documents is proposed to be done one team. Preparation of bidding
documents will be done by
Correcting mistakes from previous bidding process.
Absorbing the workload and in getting acquainted with bidding procedures in a
systematic manner.
Streamlining contract management and payments to the contractors based on the
experience of the World Bank project.

297
The time for bidding and tender award will be 4 to 6 months. The activities involved from
preparation of bidding documents to award of bid are as follows:
Preparation of documents
Invitation and Submission of bids (8 weeks)
Receipt of bids and Technical Evaluation (2 weeks)
Submission Technical Bid Evaluation to ADB for approval (1 week)
Open financial offers and their Evaluation (1 week)
Submission Financial Bid Evaluation to ADB for approval (1 week)
Approval of Government of Tamil Nadu and ADB (1 week)
Submission to State Level Award Committee (2 weeks)
Letter of Acceptance (1 week)
Contract Agreement and Submission of Performance Security (4 weeks).
Issue of Notice to Proceed (Date of Commencement)
The Implementation plan is shown in Table 21-4 and the responsibilities for implementing
the plan are shown in Table 21.5.
Table 21.4 Implementation Plan
Sl.No Packages
No. Start of bidding
End of bidding
Start of construction
of works
End of construction
of works Remarks
I Package 1, Q1/2015 Q2/2015 Q3/2015 Q3/2018 In the working season of February to July in a year, Q1 will have 2 months (Feb to March), Q2 will have 3 months (April to June) and Q3 will have 1 month (July) for construction activity.
II Package 2 Q1/2015 Q2/2015 Q3/2015 Q3/2018
III Package 3 Q1/2015 Q2/2015 Q3/2015 Q3/2018
IV. Package 4 Q1/2015 Q2/2015 Q3/2015 Q3/2018
V. Package 5 Q1/2015 Q2/2015 Q3/2015 Q3/2018
VI. Package 6 Q1/2015 Q2/2015 Q3/2015 Q3/2018
VII. Package 7 Q1/2015 Q2/2015 Q3/2015 Q3/2018

298
22 Construction Organisation
22.1 Background
The current organisational arrangement within the WRD is hierarchical with its head
office located in Chennai, headed by an Engineer-in-Chief, who in turn reports to the
Secretary (see Figure 22.1). The Engineer-in-Chief is the custodian of all technical
responsibilities related to irrigation. The office of the Engineer-in-Chief in Chennai has five
specialist wings each headed by a Chief Engineer. The sixth wing, the Irrigation
Management Training Institute (IMTI) in Trichy, is also headed by a Chief Engineer and is
entirely dedicated to training. Four Regional Chief Engineers based in Chennai, Trichy,
Coimbatore and Madurai report to the Engineer-in-Chief. The Regional Chief Engineer in
Trichy is the in-charge of the CASDP project area and is also the Project Director.
Typically the Regional Chief Engineer’s office is organized into Circles, Divisions,
Sub-divisions and Section Offices. Under the control of Trichy region there are three circles
(see Figure 22.2). The Lower Cauvery Basin Circle, Thanjavur, will be involved in the
implementation of CASDP Project.
Figure 22.1 Organisation of WRD at the state level
Note: Blue boxes show functional divisions; Orange boxes show Operational Divisions

299
Figure 0.1: Organisation structure of CE Office, Trichy
The existing staffing numbers at the Circle Office in Thanjavur and at seven
divisional offices are shown Table 22.1. The staffing numbers at the two Vennar divisional
offices (Thiruvarur and Thanjavur) reflect the actual staff strength on March 2014. These two
divisions are expected to be the implementing divisions for CASDP Project.
It is evident from Table 22.1 that across the circle, the ratio between technical and
non-technical is skewed towards non-technical staff. The gaps in technical and non-technical
staff numbers are particularly wide in Thanjavur division where only about 48% of the non-
technical cadre are in post. This is a usual feature of a public sector organization, but it is
pertinent to note that efforts to build the WRD staff skills have been limited. A more detailed
assessment of the WRD staff should be made during this Project.
CE-Trichy
SE-Salem Upper Cauvery Basin Circle
2 Divisions
Sub-Divisions
Section offices
SE-Trichy Middle Cauvery Basin
Circle
6 Divisions
Sub-Divisions
Section offices
SE-Thanjavur Lower Cauvery Basin Circle
7 Divisions
Sub-Divisions
Section offices
Deputy - CE

300
Table 22.1 Current Staff Strength of Thanjavur Lower Cauvery Circle
Designation Circle Office, Thanjavur
Vennar Division
Thiruvarur
Vennar Division
Thanjavur
Other Five Divisions
(see Note 1) Total
Superintending Engineer (SE)
1 0 0 0 1
Deputy Superintending Engineer (SE)
1 0 0 0 1
Executive Engineer 0 1 0 5 6
Assistant Executive Engineer (AEE)
1 4 1 20 26
Assistant Engineer (AE) /Junior Engineer (JE)
1 10 4 66 81
Irrigation Inspector 0 1 18 89 108
Drafting Section 16 2 4 20 42
Technical staff Sub-total
20
(35%)
18
(35%)
27
(47%)
200
(33%)
265
(34%)
Accounts/Admin 3 4 0 18 25
Office Support Staff 34 21 22 262 339
Other Support Staff 0 8 8 124 140
Non-technical staff sub-total
37
(65%)
33
(65%)
30
(53%)
404
(67%)
504
(66%)
Total 57
(100%)
51
(100%)
57
(100%)
604
(100%)
769
(100%) Note (1) An additional division has recently been added to Thanjavur Lower Cauvery Circle but has yet to become operational.
22.2 Project Management Unit
This Project will result in a significant increase in the funds being handled by
WRD’s divisional offices and the offices will need support to implement this Project
efficiently. There is also a need to set up steering and technical committees and working
groups for this Project (and other CASDP projects) at i) state level ii) regional level and
iii) project level. Given the current vertical organization structure, layered decision
making processes, and locations of the divisional offices, setting up committees at two
levels and a Project Management Unit (PMU) at the project level will be a necessity. The
recommended organisational structure of this Project, committee membership and mandates
are presented in Figure 22-3.

301
Figure 22.3 Project-1 Organisation
Project implementation organizations
Management Roles and Responsibilities
Water Resources Department (Executing Agency)
Establish the Project Management Unit in Trichy and Project Implementation units at three locations
Overall responsibility for executing the program/project and ensuring achievement of project objectives
Prepare annual work plan and budget and ensure counter part fund availability
Monitor and ensure compliance of loan covenants and environmental and social safeguards and facilitate implementation of corrective action
Manage project finances and accounts, arrange for financial audits and implement recommended financial management improvement actions.
Ensure all stakeholders are effectively consulted and information disseminated as required during project implementation.
Program Steering Committee
The PSC will be established in the State with Principal Secretary, Public Works Department as chair. The committee members will include PD CASDP, Engineer in Chief WRD, Chief Engineer Plan Formulation, WRD, CE Groundwater WRD, CE Trichy, heads of key stakeholder departments (Department of Finance, Revenue Department, Department of Agriculture, Department of Fisheries, Department of Highways and Rural Works, Department of Environment and Forest), State Disaster Management Authority, and Director SWARMA.
Functions of the PSC will be to: Provide policy guidance and support Facilitate inter-departmental co-ordination for implementation
at the state level Facilitate co-ordination with central government ministries
and departments Oversee compliance to covenants of loan agreements and
central government requirements Approve annual project plans Monitor program progress including achieving development
objectives and safeguard compliance Meet every quarter
Field Implementation Coordination Committee
The FICC will be established at the division level. The committee will be chaired by the Program director and will include Project Managers (3 EEs), Heads of relevant stakeholder departments (district), and District Collector.
Mandate of the committee includes: Monitor progress at field level Ensure coordination at field level among various departments Take up any unresolved issues to PSC Meet once every two months
Technical Advisory Committee
The TAC will provide overall technical oversight to the program
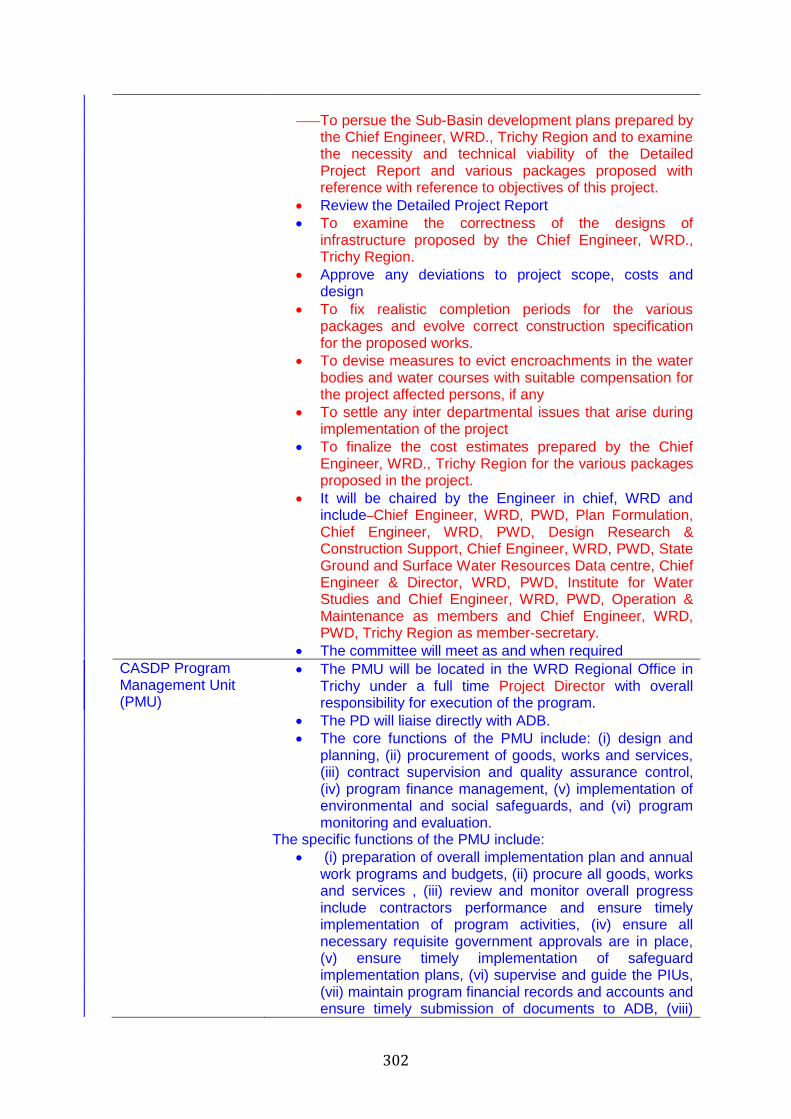
302
To persue the Sub-Basin development plans prepared by
the Chief Engineer, WRD., Trichy Region and to examine the necessity and technical viability of the Detailed Project Report and various packages proposed with reference with reference to objectives of this project.
Review the Detailed Project Report To examine the correctness of the designs of
infrastructure proposed by the Chief Engineer, WRD., Trichy Region.
Approve any deviations to project scope, costs and design
To fix realistic completion periods for the various packages and evolve correct construction specification for the proposed works.
To devise measures to evict encroachments in the water bodies and water courses with suitable compensation for the project affected persons, if any
To settle any inter departmental issues that arise during implementation of the project
To finalize the cost estimates prepared by the Chief Engineer, WRD., Trichy Region for the various packages proposed in the project.
It will be chaired by the Engineer in chief, WRD and include Chief Engineer, WRD, PWD, Plan Formulation, Chief Engineer, WRD, PWD, Design Research & Construction Support, Chief Engineer, WRD, PWD, State Ground and Surface Water Resources Data centre, Chief Engineer & Director, WRD, PWD, Institute for Water Studies and Chief Engineer, WRD, PWD, Operation & Maintenance as members and Chief Engineer, WRD, PWD, Trichy Region as member-secretary.
The committee will meet as and when required CASDP Program Management Unit (PMU)
The PMU will be located in the WRD Regional Office in Trichy under a full time Project Director with overall responsibility for execution of the program.
The PD will liaise directly with ADB. The core functions of the PMU include: (i) design and
planning, (ii) procurement of goods, works and services, (iii) contract supervision and quality assurance control, (iv) program finance management, (v) implementation of environmental and social safeguards, and (vi) program monitoring and evaluation.
The specific functions of the PMU include: (i) preparation of overall implementation plan and annual
work programs and budgets, (ii) procure all goods, works and services , (iii) review and monitor overall progress include contractors performance and ensure timely implementation of program activities, (iv) ensure all necessary requisite government approvals are in place, (v) ensure timely implementation of safeguard implementation plans, (vi) supervise and guide the PIUs, (vii) maintain program financial records and accounts and ensure timely submission of documents to ADB, (viii)

303
ensure compliance of loan covenants, (ix) establish and maintain a program management information system, (x) submit quarterly progress reports, annual progress reports, semin annual resettlement monitoring reports, and annual environmental monitoring reports to ADB and government and (xi) oversee the preparation and timely submission of PFRs to ADB.
CASDP Project Implementation Units (PIU) at the executive engineers offices
Three PIUs will be established in Thiruvarur, Nagapattinam, and Thiruthuraipoondi. Day to day management of the PIUs will be undertaken by the Executive Engineers/Project Managers of the three divisions. The core functions of the PIU will include: (i) construction supervision, (ii) contract management, (iii) quality assurance control, (iv) monitoring of implementation of resettlement and environmental management plans, (v) conducting stakeholder consultations and (vi) addressing any project related grievances.
The operational costs for the PMU/PIU are shown in Table 22.3 and the equipment
costs are shown in Table 22.4.
To assist the PMU and PIU in project management, reporting and monitoring, a few
individual national consultants will be recruited. The PMU will be set up as soon as the
project is approved.

304
Table 22.2 Staffing of PMU and PIU
Task PMU-Trichy Project Implementation Units
Overall project management
Project Director
Design and Planning Design and planning wing of CE’s office
Procurement
1 EE and 2 AE’s technical staff
Finance and Administration
1 head of Finance (of Chief Account officer rank) supported by 2 deputy accountants
1 Divisional accountant from AG’s office for each EE’s office. 3 divisional accountants in total
Quality Assurance Quality assurance wing within the WRD
Construction Supervision EE and 2 AE’s responsible for procurement will also supervise construction
1 EE, 3 AEEs, 9 AEs per EE’s office. Total 3 EE, 9AEE, and 27 AEs
Resettlement monitoring 2 AEE Nagapatinam and Thiruvarur
Environmental Monitoring AE from Project formulation wing trained as an environment officer
MIS/DSS manager 1 AEE , 2 AE
Public relations/Liaison officer
1 AEE, 2 AE

305
Table 22.4 PMU/PIU Equipment List
PMU/PIU Set up Cost
Item UOM Quantity Rate Value
PMU
Building for PMU at Trichy(land not valued ; in kind contibution) sft 10,000 6,000
60,000,000
No of Workstations No 18 40,000
704,000
Desktops/Laptops No 13 50,000
660,000
Airconditioners No 5 45,000
225,000
Vehicles- PD No 1 1,900,000
1,900,000
Vehicle- Corrdinator No 1 1,100,000
1,100,000
Vehicle- EE,Environment, Social Development officer No 2 800,000
1,600,000
Printers No 1 15,000
15,000
Telephones/Mobiles No 2 5,000
10,000
Printer No 2 15,000
30,000
Photocopier No 1 150,000
150,000
66,394,000
Office of Deputy Project Director at Tanjavur
Existing Building sft
-
No of Workstations No 39 40,000
1,558,000
Desktops/Laptops No 12 50,000
615,000
Airconditioners No 3 45,000
135,000
Vehicles- SE- Multi Utulity Vehicle No 1 1,100,000
1,100,000
Vehicle- EE- Multi Utility Vehicle No 1 800,000
800,000
Printers No 1 15,000
15,000
Telephones/Mobiles No 2 5,000
10,000
Printer No 2 15,000
30,000

306
Photocopier No 1 150,000
150,000
Total
4,413,000
PIU- Thirvaroor, Nagapattinam and Thirutharaipundi
Building(4000 sft per PIU) No 12,000 5,000
60,000,000
Workstations No 174 40,000
6,954,000
Desktops/Laptops No 43 50,000
2,173,125
Airconditioners No 6 45,000
270,000
Vehicles- Multi Utility Vehicle -1 No 3 800,000
2,400,000
Vehicles- Multi Utility Vehicle 2 10 800,000
8,000,000
Printers No 3 15,000
45,000
Telephones/Mobiles 15 5,000
75,000
Large Format Scanner 3 641,000
1,923,000
Large format Plotter 3 300,000
900,000
Photocopier 3 150,000
450,000
Fax 3 20000
60,000
Total
83,250,125
Grand Total
154,057,125
INR in Mln
154.06
Building value in Mln
120.00

307
PMU /PIU Addiitonal Adminstration Expenses 2. Building rentals, Utilities, Maintenance and Overheads
Item No of Months Cost/month Total Cost
Total cost including taxes
Utilities and overheads 48 75,000 3,600,000 4,044,960
Vehicle running & maintenance
48 1,000,000 48,000,000 53,932,800
Miscellaneous
48 200,000 9,600,000 10,786,560
Total 61,200,000 68,764,320
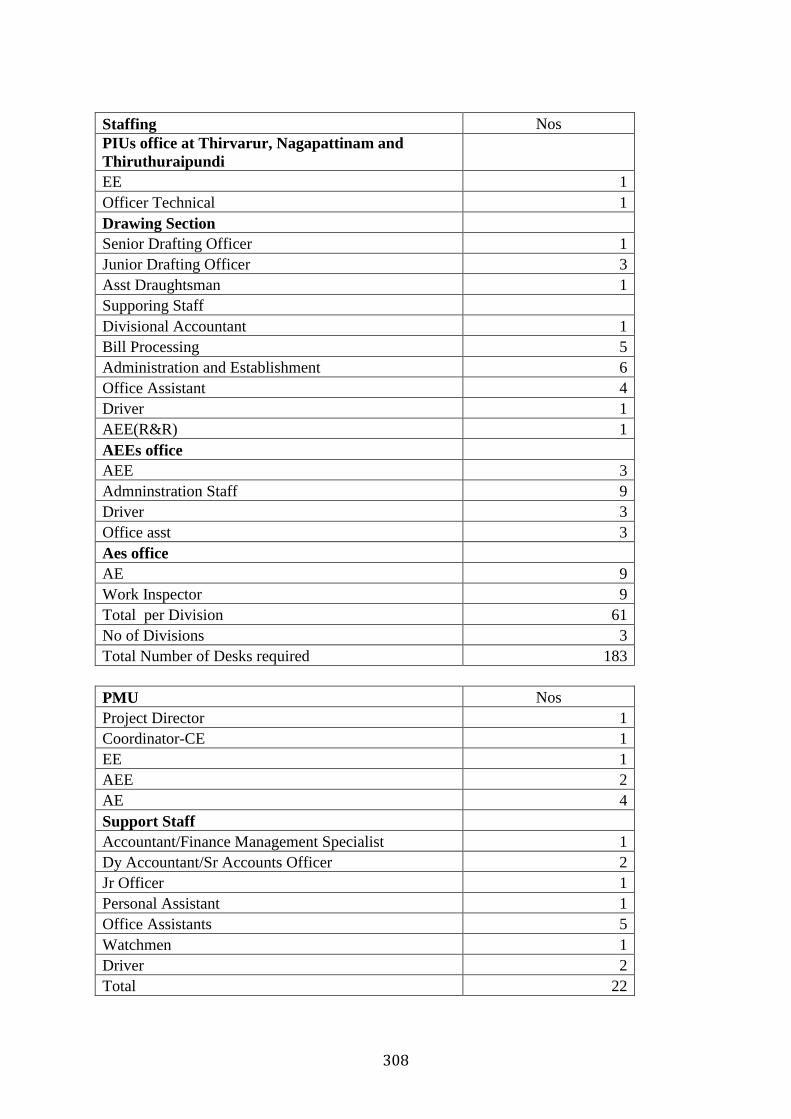
308
Staffing Nos PIUs office at Thirvarur, Nagapattinam and Thiruthuraipundi EE 1 Officer Technical 1 Drawing Section Senior Drafting Officer 1 Junior Drafting Officer 3 Asst Draughtsman 1 Supporing Staff Divisional Accountant 1 Bill Processing 5 Administration and Establishment 6 Office Assistant 4 Driver 1 AEE(R&R) 1 AEEs office AEE 3 Admninstration Staff 9 Driver 3 Office asst 3 Aes office AE 9 Work Inspector 9 Total per Division 61 No of Divisions 3 Total Number of Desks required 183
PMU Nos Project Director 1 Coordinator-CE 1 EE 1 AEE 2 AE 4 Support Staff Accountant/Finance Management Specialist 1 Dy Accountant/Sr Accounts Officer 2 Jr Officer 1 Personal Assistant 1 Office Assistants 5 Watchmen 1 Driver 2 Total 22
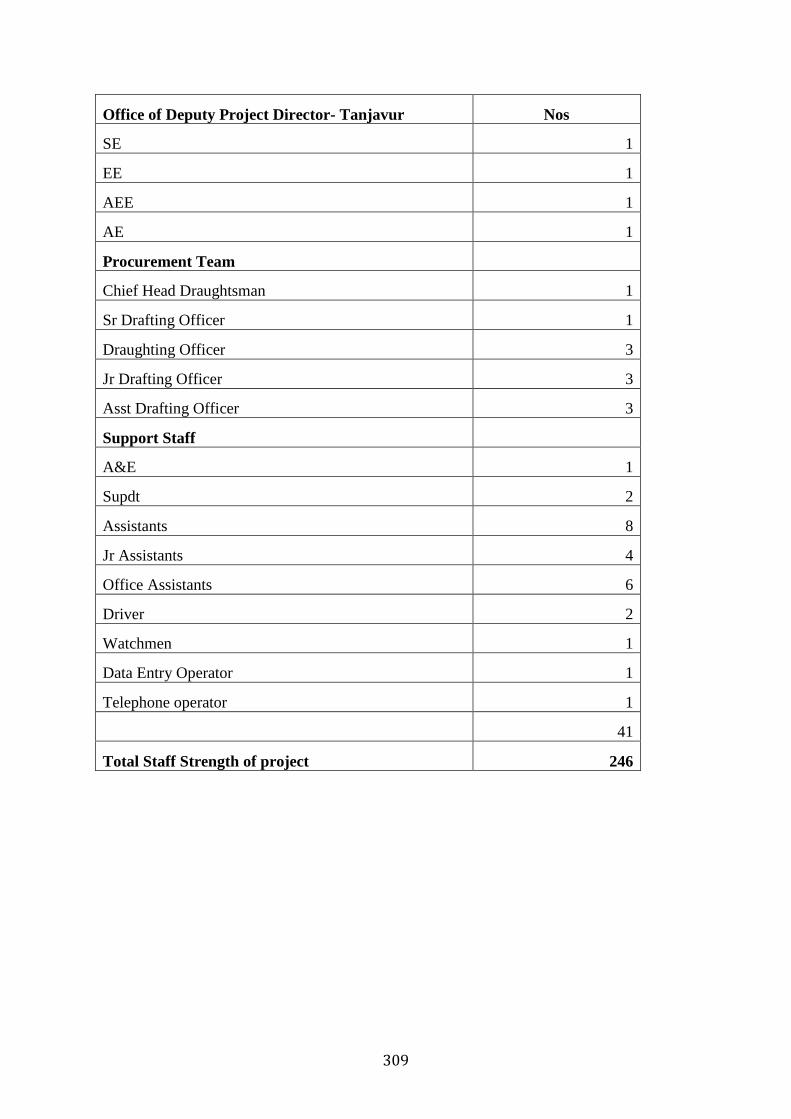
309
Office of Deputy Project Director- Tanjavur Nos
SE 1
EE 1
AEE 1
AE 1
Procurement Team
Chief Head Draughtsman 1
Sr Drafting Officer 1
Draughting Officer 3
Jr Drafting Officer 3
Asst Drafting Officer 3
Support Staff
A&E 1
Supdt 2
Assistants 8
Jr Assistants 4
Office Assistants 6
Driver 2
Watchmen 1
Data Entry Operator 1
Telephone operator 1
41
Total Staff Strength of project 246

310
22.3 Project Consultants
To assist the PMU and PIU in project management, reporting, monitoring and
implementation of specific components of the Project and to help design a follow on project
for the remainder of the Vennar and Cauvery System the following consultancy services are
required: : (i) project implementation consultants (comprising seven individual national
consultants for a total of 96 person months), (ii) project advisory consultants (consultancy
firm comprising of 24 international person months, and 96 national person months) to help
support implementation of the soft components under the project and support the design of
the follow on project, (iii) environmental consultants to undertake the environmental impact
assessment required to obtain clearances under the Coastal Zone Regulatory act (a
government accredited firm comprising of national consultants for a total of 11 person
months), (iv) a firm to undertake a topographic survey for design of follow on project and
(iv) a NGO to support the implementation of the resettlement plan comprising 50 person
months (the costs of these have been included in the resettlement budget).
The cost of the Project Implementation Consultants are shown in Table 22.6.

311
Table 22.6 Cost of Project Implementation Consultants
Summary of Consultants for PIC Man months
Cost per month(USD)
Value excluding
taxes
Value including taxes
Value in Mln in INR
Implentation Individual consultants(details below)
631,368 709,405 42.56 NGO for resettlement(details below)
42,525 47,781 2.87
CRZ Clearance(lumpsum)
190,559 214,112 12.85 Audit firm 48 5,000 240,000 269,664 16.18
MIS Implemntation firm(lumpsum)
300,000 337,080 20.22
Total Consultants Cost
1,404,451 1,578,041 94.68

312
Program Technical Assistance – Individual
Travelling Cost
Calculations Travel
Man
mo
nth
s
Co
st p
er
mo
nth
(USD
)
Trav
el a
nd
Sub
sist
en
ce
Tota
l
Trav
el f
or
team
Ad
mn
co
sts
Co
nti
nge
nci
es
Tota
l
No
of
day
s
Rat
e p
er d
ay
To
tal
Tra
vel
Gra
nd
to
tal
No
of
trip
s
Co
st p
er t
rip
To
tal
Co
st &
per
die
m
Tra
velli
ng
Project management specialist
36 5,000 53,100 233,100 38,400 2,500 11,655 285,655 1080 45 48,600 4500 53100 18 250 4500 228,600 4500
Procurement Specialist 6 4,000 8,850 32,850
1,643 34,493 180 45 8,100 750 8850 3 250 750 32,100 750
Social Development Specialist
12 4,000 17,700 65,700
3,285 68,985 360 45 16,200 1500 17700 6 250 1500 64,200 1500
Environment Specalist 6 4,000 8,850 32,850
1,643 34,493 180 45 8,100 750 8850 3 250 750 32,100 750
Construction quality assurance
18 4,000 26,550 98,550
4,928 103,478 540 45 24,300 2250 26550 9 250 2250 96,300 2250
Financial Management Specialist
6 4,000 8,850 32,850
1,643 34,493 180 45 8,100 750 8850 3 250 750 32,100 750
Construction Engineer 12 4,000 18,450 66,450
3,323 69,773 360 45 16,200 2250 18450 9 250 2250 64,200 2250
Total
562,350 38,400 2,500 28,118 631,368 549,600 12,750
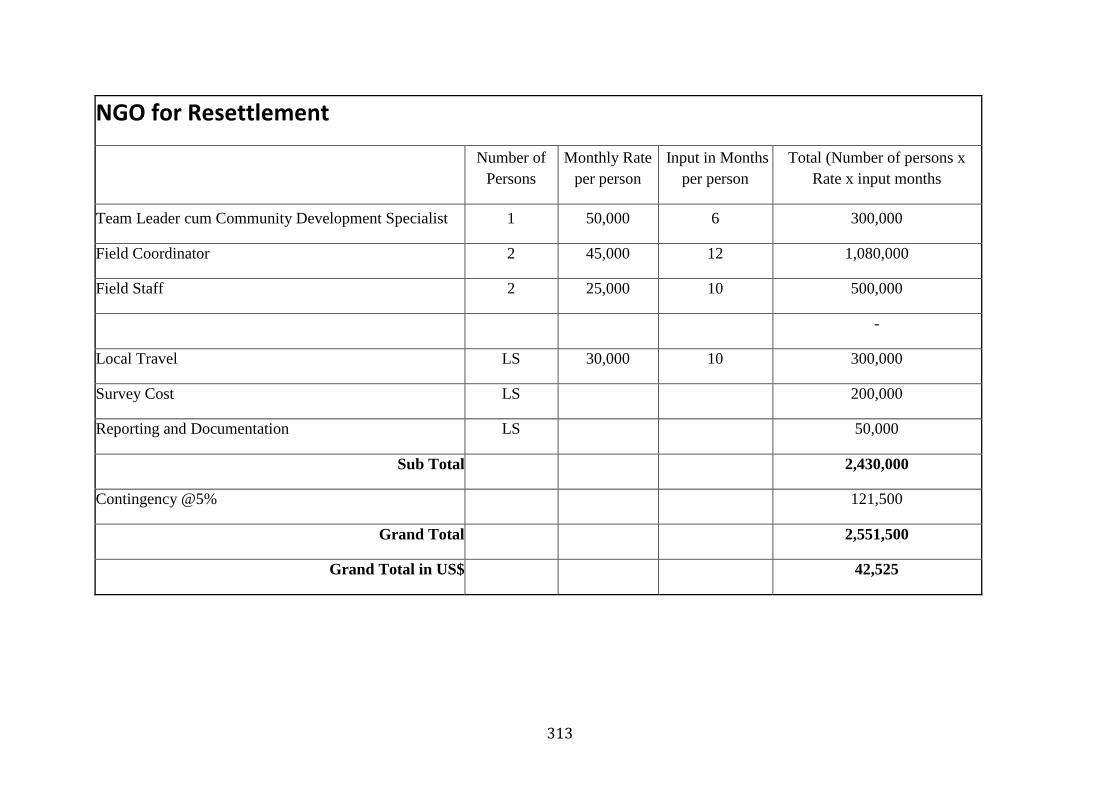
313
NGO for Resettlement
Number of Persons
Monthly Rate per person
Input in Months per person
Total (Number of persons x Rate x input months
Team Leader cum Community Development Specialist 1 50,000 6 300,000
Field Coordinator 2 45,000 12 1,080,000
Field Staff 2 25,000 10 500,000
-
Local Travel LS 30,000 10 300,000
Survey Cost LS
200,000
Reporting and Documentation LS
50,000
Sub Total
2,430,000
Contingency @5%
121,500
Grand Total
2,551,500
Grand Total in US$
42,525

314
Summary- PTAC- follow on Project
Consultants PTAC Survey EIA by
authorised agency
Total Costs Total Costs including
taxes
Total Costs including taxes in Mln INR
Remuneration and Per Diem International Consultants 504,000
National Consultants 406,600
International and Local Travel 63,750
Reports and Communication 10,000
Provisional sums - survey and data
collection 59,100
Miscellaenous and Administration support
costs 10,000
Contingencies 52,673
Total Cost(excluding local taxes) 1,106,123 875,000 334,000 2,315,123 2,601,271.64 156.08

315
Environmental survey for CRZ Clearance
S.No. INR
Remuneration of the Experts 2,093,520
Travel Cost including Air / Rail / Road 879,000
Survey Cost (Terrestial, Aquatic, Air, water, soil and Social) 3,968,000
HTL / LTL demarcation survey 4,030,000
Purchase of Sattelite Imageries and documents 100,000
Reports and Communication 350,000
Misc 13,000
Total Cost(excluding local taxes) 11,433,520
Summary of Consultants for PIC Man months Cost per Month (USD)
USD
Implentation Individual consultants(details above) 631,368
NGO for resettlement(details above) 42,525
CRZ Clearance(lumpsum) 190559
Audit firm 48 5000 240000
Total Consultants Cost
1,104,452
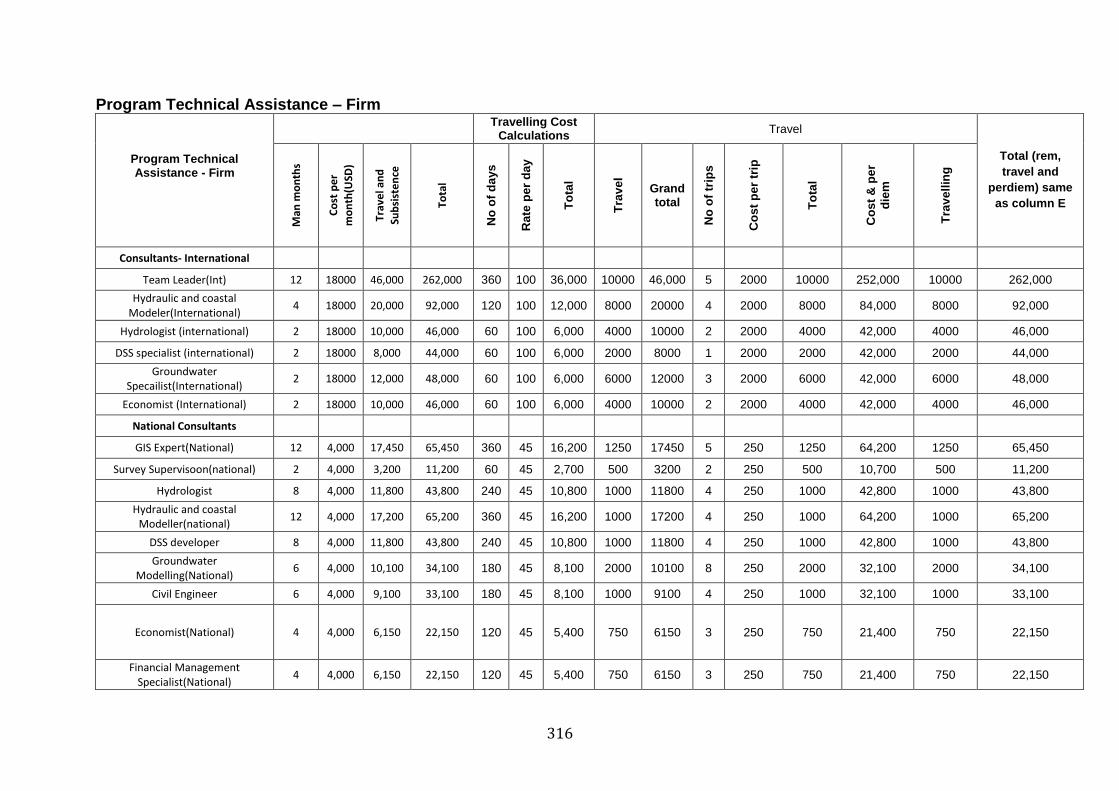
316
Program Technical Assistance – Firm
Program Technical Assistance - Firm
Travelling Cost
Calculations Travel
Total (rem, travel and
perdiem) same as column E
Man
mo
nth
s
Co
st p
er
mo
nth
(USD
)
Trav
el a
nd
Sub
sist
en
ce
Tota
l
No
of
day
s
Rat
e p
er d
ay
To
tal
Tra
vel
Grand total
No
of
trip
s
Co
st p
er t
rip
To
tal
Co
st &
per
d
iem
Tra
velli
ng
Consultants- International
Team Leader(Int) 12 18000 46,000 262,000 360 100 36,000 10000 46,000 5 2000 10000 252,000 10000 262,000
Hydraulic and coastal Modeler(International)
4 18000 20,000 92,000 120 100 12,000 8000 20000 4 2000 8000 84,000 8000 92,000
Hydrologist (international) 2 18000 10,000 46,000 60 100 6,000 4000 10000 2 2000 4000 42,000 4000 46,000
DSS specialist (international) 2 18000 8,000 44,000 60 100 6,000 2000 8000 1 2000 2000 42,000 2000 44,000
Groundwater Specailist(International)
2 18000 12,000 48,000 60 100 6,000 6000 12000 3 2000 6000 42,000 6000 48,000
Economist (International) 2 18000 10,000 46,000 60 100 6,000 4000 10000 2 2000 4000 42,000 4000 46,000
National Consultants
GIS Expert(National) 12 4,000 17,450 65,450 360 45 16,200 1250 17450 5 250 1250 64,200 1250 65,450
Survey Supervisoon(national) 2 4,000 3,200 11,200 60 45 2,700 500 3200 2 250 500 10,700 500 11,200
Hydrologist 8 4,000 11,800 43,800 240 45 10,800 1000 11800 4 250 1000 42,800 1000 43,800
Hydraulic and coastal Modeller(national)
12 4,000 17,200 65,200 360 45 16,200 1000 17200 4 250 1000 64,200 1000 65,200
DSS developer 8 4,000 11,800 43,800 240 45 10,800 1000 11800 4 250 1000 42,800 1000 43,800
Groundwater Modelling(National)
6 4,000 10,100 34,100 180 45 8,100 2000 10100 8 250 2000 32,100 2000 34,100
Civil Engineer 6 4,000 9,100 33,100 180 45 8,100 1000 9100 4 250 1000 32,100 1000 33,100
Economist(National) 4 4,000 6,150 22,150 120 45 5,400 750 6150 3 250 750 21,400 750 22,150
Financial Management Specialist(National)
4 4,000 6,150 22,150 120 45 5,400 750 6150 3 250 750 21,400 750 22,150

317
Agriculture Specialist(national) 2 4,000 3,200 11,200 60 45 2,700 500 3200 2 250 500 10,700 500 11,200
Envrironmentalist(national) 6 4,000 9,100 33,100 180 45 8,100 1000 9100 4 250 1000 32,100 1000 33,100
Social development specialists (national)
6 4,000 9,100 33,100 180 45 8,100 1000 9100 4 250 1000 32,100 1000 33,100
Local Conveyance for the above group
24 750
18,000 18,000 18,000
Total
974,350 910,600 63,750 974,350
Project preperation work
Asset Survey equipment and logistics
Lump sum
1,000
Environmental Baseline survey Time
6,000
Socio Economic Survey
20,000
Total
59,100
Preparation of EIA by authorised agency
Time
334,000
Topo Survey (separate from PTAC consultants two packages for Vennar and Cauvery- total of both packages)
Topographic Survey
Lump sum
400,000
Topgraphic Surey(flood Plains)
Lump sum
100,000
Additional Topogrpahic Surveys for ground control
Lump sum
300,000
Stereo image purchase and processing
Lump sum
75,000
875,000

318
22.4 Preparation of follow on project
As stated above this project will help design a follow on project for the remainder of
the Vennar and Cauvery system. This Project for six rivers / drains in Lower Vennar
System has been prepared and is the subject of this DPR. DPRs for follow on Project
will be prepared during the ongoing project and submitted for approval during
implementation of this project.
22.4.2 Approach to the Preparation of follow on project
This project will include financing to prepare a follow on project. The approach will
be to build on the experience gained from the preparation of this project and take a similar
approach for preparation of the DPRs for subsequent project including the use of
hydrological (rainfall-runoff) and hydraulic (channel flows and water levels) modelling. The
rationale for following this approach is:
The Need for Modelling
An integrated model provides the framework for collating and assessing data essential for the assessment of flooding and engineering design. Key gaps in data and the primary source of uncertainty are identified.
The model represents the current knowledge of the hydrology, hydraulics and river network. It makes clear any lack of knowledge in the network of drains and rivers. It can be improved upon as further information becomes available.
All approaches depend on calibration whether a modelling approach or a more traditional manual approach. Calibration not only provides a check on the model parameters it is also a valuable way of testing the quality of observed data for identifying the need for further observations.
The calculation of drainage flows is the most uncertain component when estimating flows in the river network. It is therefore important to use a tried and tested approach that is based on available rainfall and climate data and can reflect the hydrologic response of a catchment.

319
SWAT Catchment Modelling
The hydrological model (SWAT) is well tested model in India and has been accepted by CWC for the Hydrology Design Aids (HDA) being developed under Hydrology Project II. It objectively simulates runoff based on observed meteorological inputs (primarily rainfall) and the catchment characteristics. It can be calibrated to available flow records. The model is the only objective way to estimate the runoff from the catchments that contribute to a river. There is no easy alternative to calculating drainage flows.
The model relies on the derivation of sub-catchment boundaries. These are derived using the best available DEM and can be adjusted to reflect the actual drainage areas when they differ from the topographic catchment.
SWAT once set-up enables the quick generation of alternative scenarios such as the impact of climate change or a change in land use or cover.
Hydraulic Modelling
The use of a one-dimensional hydraulic model (HECRAS in this case) ensures that hydraulic analysis reflects variations in the channel form, over-topping during high flows, structures and variable boundary conditions.
HECRAS was set up using cross sections at 250m and the dimensions of the cross regulators as surveyed by PMSL. The downstream boundary condition was a variable sea level and out of bank flow was based on the embankment levels at 250m centres. The level of detail built into the model far exceeds the detail that can be used for alternative methods such as Manning’s “n” calculations or simple backwater analysis.
Once set up HECRAS can be used to rapidly assess numerous scenarios including dredging, bank raising and the re-design of structures. Numerous alternative scenarios can be run using the batch facility.
The model allows steady and unsteady state analysis and provides the user with a full set of results including velocity, depth, flow and Froude number. Critical sections are identifiable and instabilities are evident. The modelling can determine peak flows more accurately than analysis based on the recorded daily average flows.
HECRAS is easy to set up and easy to run. It is open-access software and supported by USGS manuals, on-line training material and examples.

320
Integrated Modelling
The integration of SWAT and HECRAS gave a powerful tool for assessing the impact of alternative design hydrographs on the water level and flow in the river system. In addition, the generation of time series at any HECRAS cross section would allow the validation of the model at any location where flow or level data is available (now or in the future).
The integrated model also gives a tool for quantifying the impact of changes in the location or timing of drainage flows and the interaction with river flows.
The model together with a DEM allows flood maps to be easily generated for any number of scenarios.
Traditional Design not using Models
The hydrological analysis relies on simple assumptions (e.g. runoff coefficients) and simple average rainfall. This results in less accurate estimates of runoff and a cumbersome method not well suited to the assessment of multiple scenarios. It is also reliant on the derivation of sub-catchments.
The hydraulic analysis cannot account for the small scale (250m) variations in channel form and therefore may not identify critical sections (e.g. with a sudden reduction in flow area or rise in bed level). The analysis cannot easily combine the analysis of open channel sections with flow control structures, bridges, in-falls, off-takes and variable boundary conditions.
Traditional design methods are cumbersome for evaluation of multiple options. It is likely that HECRAS would be quicker and easier to set up than a non-modelling approach.
In summary, without modelling the approach may not be objective, is not suited to the assessment of numerous scenarios and cannot easily be interfaced with a DEM for flood mapping.
There are some differences with the approach used for the preparation of this project and that
proposed for the preparation of follow on project namely,
(i) A separate feasibility study would not be prepared, only DPRs;
(ii) WRD staff would be fully responsible for engineering designs;
(iii)The additional survey being done under this Project to inform the flood mapping would not be needed because a DEM would be procured; and

321
(iv) Consultants would be used wherever the expertise does not currently exist within WRD, and would be engaged by and report to Project Director.
The preparation tasks and the resources needed are shown in Table 22.7. this Project will
include approximately USD 1.6 million to prepare follow on project.
As the topographical survey and initial model covers the entire Vennar system, this approach
allows WRD to build on the work of the PPTA. This project will also support overall
Program management and detailed design of follow project.

322
Consultancy services required to support the preparation of the follow on Project are included under the Project Advisory Consultants ToRs (cost of
consultancy service described above). In addition the topography survey contracts described in the earlier section are also to support the project
preparation of the follow on project.
In addition WRD has committed the following staff resources to support the preparation of the follow on project.
Activity
WRD staffing resources
Topographic survey of channels and establishment of ground control points for flood plains
Supervision of Topographic Surveys in remainder of vennar and Cauvery- 2 AEE
Asset survey Collect data on all flow regulators and structures including:
- Location - Type - State and maintenance issues - Dimensions - Operation - Performance
Includes a review of existing registers and a site survey
2 Assistant engineers leading 2 teams for three months
Design Includes:Assessment of structures
- Channel alignment - Additional surveys - Geotechnical survey and analysis
4 engineers for 48 months
Prepare detailed cost estimates 16 engineers for 4 months each
DPR preparation 2 EEs supported by 4 AEEs
Preparation of bid documents Procurement team of the PMU

323
23. Environment, Ecology and Forest Aspects
23.1 Anticipated Environmental Impacts and Mitigation Measures
The Initial Environmental Examination is based on baseline environmental
attributes and the interactions of the project components with the attributes. The
environmental attributes relevant to the assessment of the impacts are air quality, noise
level, soil, water resources, water quality, vegetation cover, land use, local infrastructures
etc. The construction and operation of the project may have positive and negative
impacts on the said environmental attributes. The assessment of impacts defines whether
they are significant, irreversible, or reversible.
Mitigation measures are incorporated into the design phase and the construction
and operation phases of the project. The design phase incorporates important
considerations like selection of location of Regulators, whether reconstruction or
rehabilitation of the structure is to be executed. The construction impacts are mainly
limited to the locality of the construction works and last for short period. The operation
stage impacts are expected to be positive and extend to the catchment area of the river
channel concerned.
23.1.1 Methodology
The methodology followed was:
i. Review of Documents
An extensive literature search was carried out, with the following documents being
reviewed:
Environmental Protection Act, 1986
EIA notification, 2006 and amendments
CRZ Notification, 2011 and 1996 and amendments
Forest Conservation Act, 1980 and amendments and Tamil Nadu Forest
Conservation Rules.
Consolidated data of Full Climatic Stations in Tamil Nadu, Government of Tamil
Nadu,

324
EIA Report of Reconstruction and Modernisation of PAZHAYAR Fishing
Harbour (World Bank Aided), Fisheries Department, Government of Tamil Nadu,
2010
Environmental Impact Assessment Study for Bar Mouth Opening at
Tirumullaivasal in Nagapattinam District, WAPCOS, Govt of India
Report of EIA and EMP of 2.96 MLD sewage treatment plant in Nagapattinam
Municipality.
ii. Surveys and Site investigation
Site investigations were conducted during following schedule by PPTA team
December 4-11, 2013
February 10-21, 2014,
March 24-31, 2014
The following surveys were also carried out:
Enumeration of trees along the rivers
Investigation of river bed silt, Water and ground water for availability of
pesticides.
iii. Public Consultation and Stakeholders’ consultation by PPTA team
Consultation with local people was conducted to determine the impacts and
mitigation measures. The stakeholder consultation was also held with the Fisheries
Department, Agricultural Department, Water Resources Department, Forest Department
and district level Pollution Control Board.
23.1.2 Mitigation Hierarchy
The mitigation hierarchy implemented in this project are given below
Minimisation – The minimisation of impacts such disturbance to the soil and water
turbidity.
Restoration - The restoration of impacts which cannot be avoided like felling of trees on
embankments or opening up of borrow areas. The restoration of borrow areas will be

325
done according to the prevailing guidelines and compensatory trees will be planted in
lieu of felling of trees.
23.2 Impacts and Mitigation Measures
23.2.1 Ambient Air Environment
23.2.1.1 Construction Stage Impacts and Mitigation Measures.
Air emissions during the construction stage arise from the operation of
construction vehicles, equipment, haulage of material and earth, and dust generation
from earthwork. The re-sectioning of channels and construction of embankments are
included in the works on all 6 rivers of this project. The cumulative lengths of all six
rivers are 234 km. The construction of embankments will generate dust locally which
may impact nearby residential, commercial and sensitive locations like schools adjacent
to the boundary of the rivers. However these impacts will not be significant, being less
than the impact of dust created from agricultural land during ploughing.
Mitigation measures for suppression of dust near the residential, commercial and
area of socially important places like temples and churches are required through
sprinkling of water on the construction site. The transportation of silt will be done in
covered trucks through residential and commercial areas. The wheels of truck will be
washed at the construction site so that they do not carry dust to the residential areas.
Regular checking of pollution emission from the construction vehicles exhaust will be
done by the relevant authorised agency and a Pollution under Control (PUC) certificate
will be obtained.
23.2.1.2 Operation Stage Impact and Mitigation Measures
Operation stage emissions and air pollution are not anticipated in this project.

326
23.2.2 Noise Level
23.2.2.1. Construction Stage Impacts and Mitigation Measures
Noise generation during construction may arise from operation of construction
vehicles, equipment, haulage of material and earth. The impacts are not significant and
are limited to construction hours in day time only. There are two schools identified at
chainage 129.00 km on the Harichandra River and chainage 13.2 km on the Vellaiyar
River. The main source of noise is de-silting and re-sectioning from the operation of
construction vehicles, and drivers will be instructed to avoid using pressure horns. ‘No
horn’ signage will be provided near schools.
Mitigation measures also include the proper maintenance of construction vehicles to
minimise the amount of noise during operation.
23.2.3 Soil Environment
23.2.3.1. Construction Stage Impacts and Mitigation Measures
The construction stage impacts on soil are mainly due to re-sectioning, desilting of
channels and construction of embankments. The re-section and de-silting involve the
removal of silt from the river bed. Testing of silt has been conducted for rivers near head
regulators and tail end regulators. The results show that pesticides are below detectable
limits. Excavated soil and silt will be taken to specified locations for re-use wherever
possible.
The other impact on the soil environment will be from the construction of borrow
areas. Borrow areas will be identified by the contractor and will be operated and closed
as per the contract. Soil quality will not be affected.
There is a risk of water borne soil erosion due to disturbance of soil during de-silting,
re-sectioning of rivers and construction of embankments will be avoided as the
construction work will be done when there are no flows in the channels. Air borne soil
erosion will be prevented by applying water during placement and compaction.
Soil suitable for constructing embankments will be identified by laboratory tests. The
excess silt and soil not suitable for construction will be used for gardening or

327
landscaping. Areas suitable for disposal of excess silt and soil will be identified by the
contractor.
The dredged material from the Vellaiyar, Lawford, Adappar and Uppanar Straight cuts
will be saline and will not be suitable for disposal on agricultural land but will be
disposed of in old meanders or stored near the embankment of the straight cuts.
Arrangements for locating the source of supply of material for embankment as well
as compliance to environmental requirements, as applicable, shall be the sole
responsibility of the contractor. The environmental personnel shall be required to inspect
every borrow area location prior to approval. The operation and rehabilitation of borrow
areas shall be according to the Madras Detailed Standard Specification (MDSS) and
Environmental Code of Practices. The borrow areas shall be located at least 500 m away
or suitably sufficient distances from schools and village access roads. The Contractor
shall not borrow earth from the selected borrow area until a formal agreement is signed
between the landowner and contractor and a copy of this agreement is submitted to the
PIU. Planning of haul roads for accessing borrows materials shall be undertaken during
this stage. The haul roads shall be routed to avoid agricultural areas. In case agricultural
land is disturbed, the contractor shall rehabilitate it to its original condition. Haul roads
shall be maintained throughout the operation period of the borrow areas by undertaking
required maintenance and repair works, which may include strengthening, pot hole
repairing and diversions. Improvements shall be done to reduce inconvenience to users
of these roads, residents living along the haul roads and minimize air and water
pollution. All borrow areas whether in private, community or government land shall be
restored either to the original condition or as per the approved rehabilitation plan.
23.2.4 Water Resources and Quality
23.2.4.1. Construction stage Impacts and Mitigation Measures
As construction will take place when the river beds are dry, there will be no impact
on water quality of de-silting and re-sectioning of the rivers. The overall quality of the
river water will not change.
Water pollution may be caused due to spill of grease and oil from heavy machinery
being used for the construction.
328
Embankment construction will take place during the dry season and stabilisation of
embankments immediately after construction will avoid soil erosion if there is rain.
23.2.4.2. Operation Stage Impacts and Mitigation Measures
The flow of fresh water will be improved after de-silting and re-sectioning of the
river channels which will have positive impact on the agricultural land and aquaculture
upstream of the new and reconstructed tail end regulators.
23.2.5 Wildlife, Biodiversity and Reserved Forest
The project does not fall within or near any reserved forest, bio-diversity or wildlife area.
Mangrove plantations exist downstream of the proposed Tail End Regulator on left bank
of the Harichandra River but are not impacted by the project. Mangrove plantations on
the Adappar river are remote from the river channel where re-sectioning is proposed.
There are no globally or nationally threatened species in the rivers.
23.2.6 Tree Plantation
23.2.6.1. Construction Stage Impacts and Mitigation Measures
There are 5468 trees on the banks of Vellaiyar, Harichandra, Adappar, Valavanar and
Pandavayar Rivers. They are mainly teak, neem, coconut, tamarind and karuve trees
planted by either the Forest Department or the Water Resource Department. Since these
plantations are not natural ecosystem of woodland or forest and have agricultural land on
both sides, the impact of felling of trees will not be significant.
The existing trees on the bank of the river are of two types:
Type – 1 – Trees planted by the Forest Department
Type – 2 – Remaining trees planted by the Water Resource Department or
naturally grown.
The cutting, removal and compensatory plantation for felling of type-1 trees will be done
by the Forest Department. The cutting, removal and compensatory plantation for felling
of type-2 trees will be done by the Water Resource Department through contractors on
permission of the Revenue Department.
329
Right of salvage of the felled trees are with the owner agency. The removal of felled
trees planted by the Forest Department will be done by the Forest Department. The
removal of felled trees which are not planted by the Forest Department, will be done by
the WRD through the contractor. The wooden part of the trees will be sold. Other shrubs
and grass will be disposed of along with the waste of clearance and grubbing of the site.
The compensatory plantation will be 3:1 i.e. plantation of three trees in lieu of cutting of
one tree. The species of trees for compensatory plantation should be native or the same
as previously planted and also should be determined in consultation with the local office
of Forest Department. These plantations can be placed on the outer side toe of the
constructed embankments.
A consultation has been done with the Forest Department for the permission of felling of
trees. Forest Department will conduct its survey on receipt of proposal of felling of trees
and then the valuation of compensatory afforestation will be done. On payment of the
compensation amount the Forest Department will give permission of felling.
23.2.7 Land use
23.2.7.1. Construction Stage Impacts and Mitigation Measures
The land use of the project area will not change.
23.2.7.2. Operation stage Impacts and Mitigation Measures
The proposed project will positively influence the agricultural productivity due to
increased supply of fresh water especially throughout the area and near the proposed new
tail end regulators.
23.2.8 Archaeological Remains
There are no archaeological sites within or near the proposed project site. Any chance
finding will be taken care according to Archaeological Survey of India guidelines. These
chance finds can be ruined structures buried underground. This is not expected because
there are no deep excavations.

330
23.2.9 Environmental Management Plan
Sl
No
Project
Activity
Resource Impact Mitigation Measures Location Responsibility Cost
Design and Pre-Construction Stage
Approval and
NoC
Regulatory and
Statutory
Requirement
Obtain CRZ Clearance
Obtain Approval from
Forest Department and
Revenue Department for
Felling of Trees
PMU/WRD PMU/
WRD
WRD to
bear the cost
Selection of
Construction
Camp for site
office and
storage of
material,
parking of
Conflict with local
community,
Additional load on
water supply,
sewerage, solid waste
management
Since establishment of
construction camp and
labour camp are the decision
of contractor. Selection of
Construction camp and
workers’ camp away from
the habitation area,
Location of
Construction
Camp and
Labour camp.
The number of
these camps
depends on the
Contractor PMU/
WRD
Contractor’s
cost.

331
Sl
No
Project
Activity
Resource Impact Mitigation Measures Location Responsibility Cost
vehicles and
Workers’ Camp
for labour to
stay during non-
working hours.
Contractor to provide safe
drinking water as per IS
10500 standards for
drinking water.
Provide sanitation for male
and female workers.
Collection and disposal of
solid waste of the worker’s
camp
contract. 17
construction
camp and 17
workers’ camp
depending on
number of
construction
packages are
expected.
Identification of
borrow pits and
quarry area
Impact from haulage
and degraded surface
during construction
Unsafe condition near
the borrow area
Selection of Borrow pits for
earth should be away from
residential area, sensitive
location, and local roads.
Before selection of borrow
area, the contractor will take
written consent from the
Borrow pits, and
quarry area
Contractor PMU/WRD Contractor’s
cost.

332
Sl
No
Project
Activity
Resource Impact Mitigation Measures Location Responsibility Cost
environmental officer of
PMU.
Selection of sand, stone and
other quarry material will be
only government approved
sites only.
Intervention
with Utility
Utility like water
supply, electricity,
access to other side of
the river
The contractor will identify
water supply pipes,
electrical poles, cables and
access roads and bridges
All project
location
Contractor PMU/WRD Incorporated
in the
contractor
cost
Construction Stage
Ambient Air Quality and Noise
1 De-silting and
resection of
Generation of dust
having impact on
Dust suppression by Habitation area,
schools, temples,
Contractor PMU/WRD EMP

333
Sl
No
Project
Activity
Resource Impact Mitigation Measures Location Responsibility Cost
river habitation and
agricultural land
sprinkling of water
Provide dust curtain or
geotextile membrane to
cover soil.
churches as
given in table D-
1 to D-6,
Agricultural
field throughout
the project area
Budget
2 Transportation
of construction
material, earth
Generation of dust Provide covered
transportation of material
and earth,
Avoid haulage rout in
residential area and sensitive
locations
Habitation area
as given in table
D-1 to D-6,
Village roads
Contractor PMU/WRD Contractor
cost
3 Operation of
construction
equipment’s and
Emission of
pollutants like NOx,
SO2, HC ets
Maintenance of vehicles and
equipment as per
manufacturers guidelines
and monitor emissions of
Construction
camp
Contractor PMU/WRD Contractor
cost
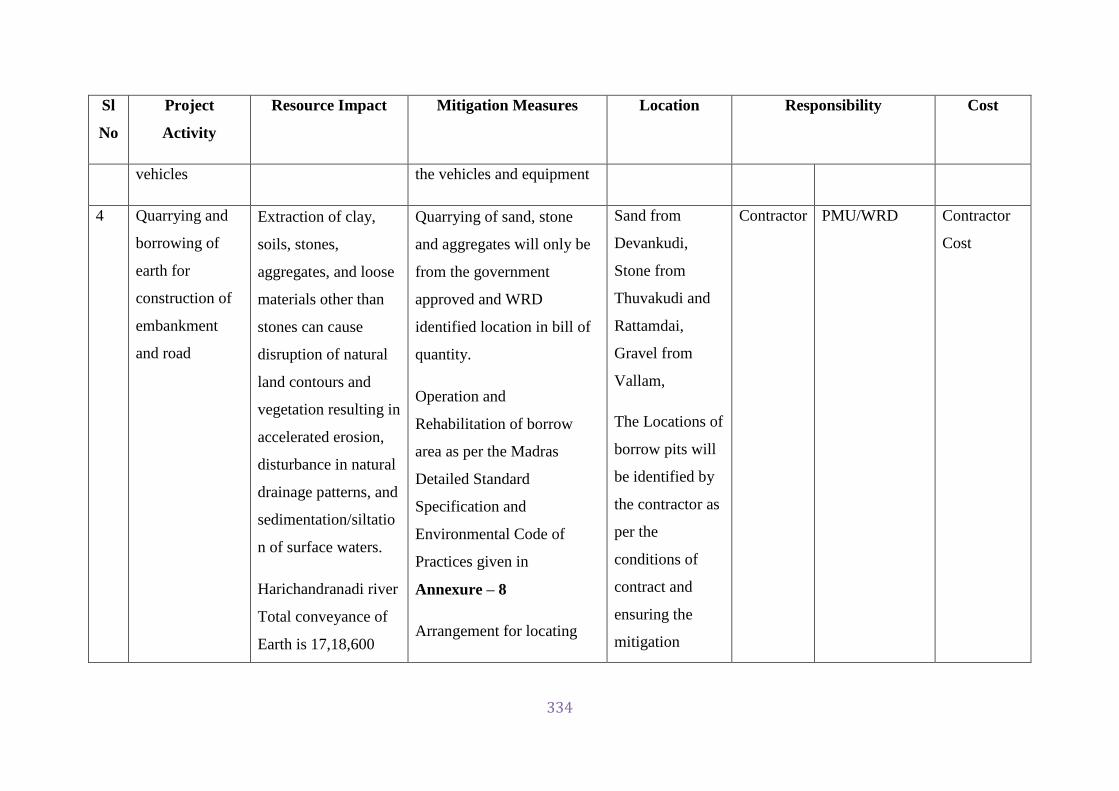
334
Sl
No
Project
Activity
Resource Impact Mitigation Measures Location Responsibility Cost
vehicles the vehicles and equipment
4 Quarrying and
borrowing of
earth for
construction of
embankment
and road
Extraction of clay,
soils, stones,
aggregates, and loose
materials other than
stones can cause
disruption of natural
land contours and
vegetation resulting in
accelerated erosion,
disturbance in natural
drainage patterns, and
sedimentation/siltatio
n of surface waters.
Harichandranadi river
Total conveyance of
Earth is 17,18,600
Quarrying of sand, stone
and aggregates will only be
from the government
approved and WRD
identified location in bill of
quantity.
Operation and
Rehabilitation of borrow
area as per the Madras
Detailed Standard
Specification and
Environmental Code of
Practices given in
Annexure – 8
Arrangement for locating
Sand from
Devankudi,
Stone from
Thuvakudi and
Rattamdai,
Gravel from
Vallam,
The Locations of
borrow pits will
be identified by
the contractor as
per the
conditions of
contract and
ensuring the
mitigation
Contractor PMU/WRD Contractor
Cost
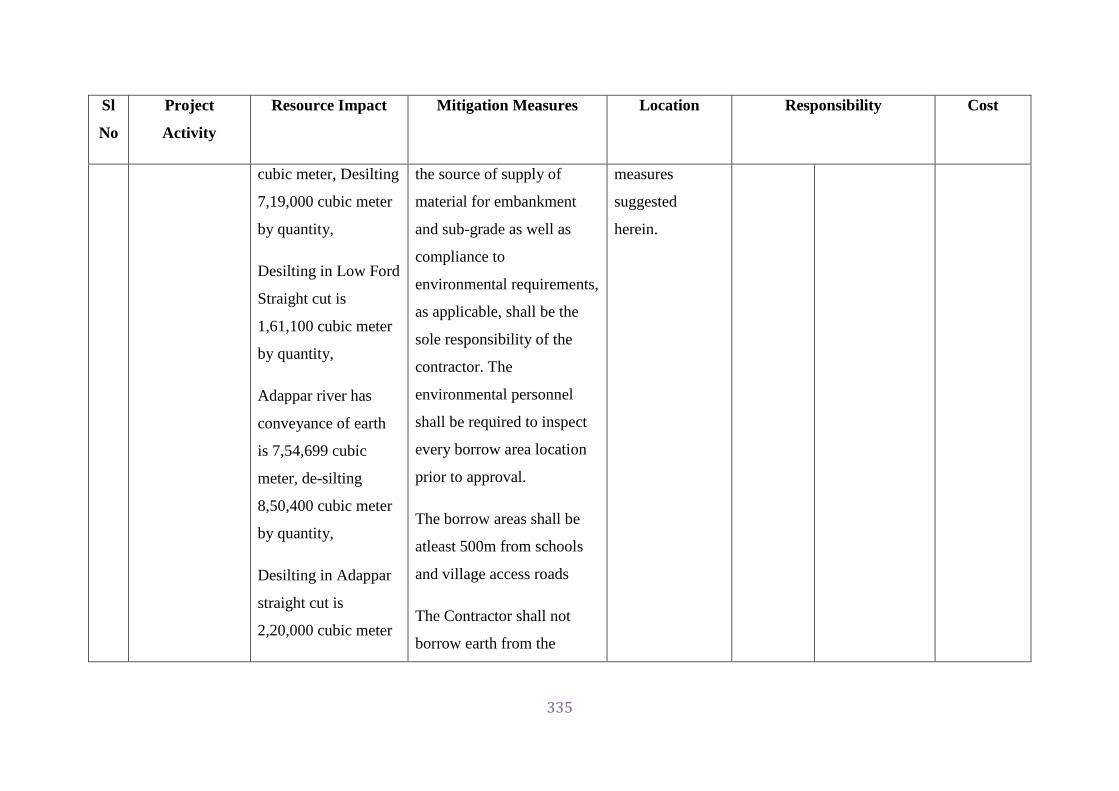
335
Sl
No
Project
Activity
Resource Impact Mitigation Measures Location Responsibility Cost
cubic meter, Desilting
7,19,000 cubic meter
by quantity,
Desilting in Low Ford
Straight cut is
1,61,100 cubic meter
by quantity,
Adappar river has
conveyance of earth
is 7,54,699 cubic
meter, de-silting
8,50,400 cubic meter
by quantity,
Desilting in Adappar
straight cut is
2,20,000 cubic meter
the source of supply of
material for embankment
and sub-grade as well as
compliance to
environmental requirements,
as applicable, shall be the
sole responsibility of the
contractor. The
environmental personnel
shall be required to inspect
every borrow area location
prior to approval.
The borrow areas shall be
atleast 500m from schools
and village access roads
The Contractor shall not
borrow earth from the
measures
suggested
herein.
336
Sl
No
Project
Activity
Resource Impact Mitigation Measures Location Responsibility Cost
by quantity selected borrow area until a
formal agreement is signed
between land owner and
Contractor and a copy of
this agreement is submitted
to the concerned officer of
WRD/Supervision
Consultant.
Planning of haul roads for
accessing borrow materials
shall be undertaken during
this stage. The haul roads
shall be routed to avoid
agricultural areas. In case
agricultural land is
disturbed, the Contractor
shall rehabilitate as

337
Sl
No
Project
Activity
Resource Impact Mitigation Measures Location Responsibility Cost
approved by the WRD/
Supervision Consultant
Haul roads shall be
maintained throughout the
operation period of the
borrow areas by undertaking
the required maintenance
and repair works, which
may include strengthening,
pothole repairing and
diversions. Improvements
shall be done to reduce
inconvenience to users of
these roads, residents living
along the haul roads and
minimize air and water
pollution.

338
Sl
No
Project
Activity
Resource Impact Mitigation Measures Location Responsibility Cost
Such measures shall include,
but not limited to, frequent
sprinkling of water,
repairing of the road, road
safety provisions (warning
and informatory signage,
flagmen etc.), and ensuring
covering of loaded vehicles
by waterproof tarpaulin;
consultation with public and
special precautions are
required when measures are
implemented near schools,
health centers and
settlement areas.
All borrow areas whether in
private, community or govt.

339
Sl
No
Project
Activity
Resource Impact Mitigation Measures Location Responsibility Cost
land shall be restored either
to the original condition or
as per the approved by
WRD/ Supervision
Consultant
Soil Environment
6 Standardisation
of embankment
and delisting of
river and
construction of
road on one side
embankment.
Operation of
borrow pits and
transportation of
Water and air born
soil erosion,
After cutting and filling
embankment will be
immediately stabilized
Avoid de-silting within the
flow of water.
Encourage utilisation of
river silt in gardening and
other agricultural purpose
identified in consultation
All location of
resectioning of
Vellaiyar,
Pandavayar,
Harichandranadi,
Adappar and
Valavanar rivers.
Vellaiyar,
Lawford,
Adappar and
Contractor PMU/WRD Contractor
Cost

340
Sl
No
Project
Activity
Resource Impact Mitigation Measures Location Responsibility Cost
material with farmers.
Disposal of silt and sand
from the Vellaiyar,
Lawford, Adappar and
Uppanar straight cut will be
disposed or stored near the
embankment of the straight
cut
Uppanar straight
cut
7 Disposal of
construction
debris
Improper disposal of
construction debris in
agricultural land and
resulting loss of
agricultural and
reduced productivity
and landscape and
loss of aesthetic
Prohibition of throwing of
construction debris in any
sites other then the
designated disposal sites
identified at the detailed
design stage
Construction
zone
Contractor PMU/WRD Contractor
Cost

341
Sl
No
Project
Activity
Resource Impact Mitigation Measures Location Responsibility Cost
beauty
Water Resource and Quality
Resection and
de-silting of
river
Construction of
Tail end
regulators,
Irrigation head
sluices, drainage
infalls, syphons,
Bed dam, Grade
dam,
Chance spillage
Increased turbidity in
downstream of river,
Spillage on
construction site,
construction camp.
Since the most of the
construction work will take
place in the lean season so
mitigation measure of
avoidance of de-silting
within the flow of water will
minimise soil erosion and
increase in turbidity in the
downstream.
Construction
zone and
construction
camp
Contractor PMU/WRD Contractor
cost

342
Sl
No
Project
Activity
Resource Impact Mitigation Measures Location Responsibility Cost
of oil, grease
from heavy
machinaries,
construction
vehicles and
equipments
Biological Environment
Clearance and
grubbing of site
for construction
of embankment
There are 5468 trees
available on the river
banks of Vellaiyar,
Harichandranadi,
Adappar, Valuvanar
and Pandavayar
rivers. Removal of the
trees planted by
Forest Department
will require
Cut trees will be removed
by the Forest Department
and stored. The Forest
Department can later sell
the trees according to their
rules. The trees which are
not planted by the Forest
Department will be cut and
removed by the contractor
on permission of district
River banks of
Vellaiyar,
Harichandranadi,
Adappar,
Valuvanar and
Pandavayar
rivers.
Adjacent and
foot of the
Contractor PMU/WRD EMP budget

343
Sl
No
Project
Activity
Resource Impact Mitigation Measures Location Responsibility Cost
permission from the
Forest Department.
revenue officer.
Compensatory Plantation of
3:1 ratio meaning plantation
of 3 trees in lieu of felling of
1 tree.
embankment
Occupation Health and Safety
Occupational
Health and
Safety of
labours at
construction site
and Labour
camps
Provide personal protective
equipment to the labours.
Ensure the labours are
trained to work on the
specific project.
For untrained labour –
training should be provided
before permission to work
on the site.
Construction
site;
Labour Camp;
Construction
Camp.
344
Sl
No
Project
Activity
Resource Impact Mitigation Measures Location Responsibility Cost
The contractor shall provide,
if required, erect and
maintain necessary
(temporary) living
accommodation and
ancillary facilities during the
progress of work for labour
to standards and scales
approved by the Engineer-
In charge.
Contractor shall follow all
relevant provisions of the
Factories Act, 1948 and the
Building & other
Construction Workers
(Regulation of Employment
and Conditions of Service)

345
Sl
No
Project
Activity
Resource Impact Mitigation Measures Location Responsibility Cost
Act, 1996 for construction
& maintenance of labor
camp.
Construction camps shall
not be proposed within
1000m or sufficiently away
from nearest habitation to
avoid conflicts and stress
over the infrastructure
facilities, with the local
community. The location,
layout and basic facility
provision of each labour
camp shall be submitted to
Engineer prior to their
construction.
Safety and sanitation facility
346
Sl
No
Project
Activity
Resource Impact Mitigation Measures Location Responsibility Cost
should be provided in the
labour camp.
Uncontaminated water shall
be supplied to the
construction workers at
labour camps.
The contractor shall arrange
for - a readily available first
aid unit including an
adequate supply of sterilized
dressing materials and
appliances as per the
Factories Rules in every
work zone, Availability of
suitable transport at all times
to take injured or sick
person(s) to the nearest

347
Sl
No
Project
Activity
Resource Impact Mitigation Measures Location Responsibility Cost
hospital
Equipment and trained
nursing staff at construction
camp.
Community Health and Safety
Construction
activity of
excavation and
closure of road
Risk of accident on or
near construction site
and inconvenience to
the local commuters
Provide information about
the construction schedule
and construction activity
Barricading construction site
Display signage of diversion
at construction road on
embankment
Location of
earthwork near
habitation given
in table number
D-1 to D-6.
Contractor PMU/WRD Contractor
cost
Operation Stage

348
Sl
No
Project
Activity
Resource Impact Mitigation Measures Location Responsibility Cost
No operation stage negative impacts are envisaged. The construction of water flow control structure, standardisation of river embankment will
bring positive impacts with the supply of fresh water to the farmers. This will also bring benefit to the aquaculture farming for shrimps by
reducing salinity. This is also envisaged the salinity of ground water will also reduce.

349
24 Economic and Financial Analysis
24.1 Cost Estimates for River Improvements
The river channels of Project have been used to convey irrigation and floodwaters for
centuries and many of the existing water management structures were constructed more than
100 years ago. Detailed field surveys were carried to assess the condition of the structures
(See Annexure 2) and to identify the need for reconstruction or repair of existing structures or
providing new structures. Extensive hydrologic and hydraulic modelling of the channels
identified the need for re-sectioning or re-grading or dredging and standardising the banks to
improve their hydraulic performance, reduce the risk of flooding and improve access along
the channels. After surveying the river channels and structures, designs were prepared for the
reconstruction or repair of structures or construction of new structures. In addition, designs
were prepared for re-sectioning, re-grading and dredging the channels and standardising the
banks of the river channels. WRD then prepared costs estimates for the proposed works. For
the estimates, PWD used the Schedule of Rates published by the Public Works Department
Tamil Nadu (2014-2015). The cost estimates are given in Annexure 8.
24.2 Cost Estimates for Pumping Schemes
Each pumping scheme in this Project area was inspected to assess the condition of the
electrical and mechanical equipment and identify the need for their replacement. In addition,
the condition of pump houses and other civil works was also assessed and the need for repairs
identified. The inspection found that all of the electrical and mechanical equipment needed
to be replaced, as it was generally about 30-50 years old.
Concerning the civil works, the inspection found that the pump houses were in
reasonable condition and could be repaired but that the residential quarters of pumping
scheme operators were derelict. A provision of INR 60,000 has been made to provide for a
room with a toilet attached to the pump house for the use of operators during their shift.

350
The capacity of the pumps was calculated with following assumptions:
1. Crop water requirement of samba paddy (m3/ha): 12,500 (1,250 mm)
2. Effective rainfall (m3/ha): 4550 (455 mm, 80% exceedance)
3. Irrigation efficiency (%): 70
4. Pump efficiency after Renovation (%): 75
5. Dynamic head factor: 1.1
6. Irrigation season (days): 150
7. The cost of the electrical components and the pumps were determined from
current quotations from reputed suppliers. To arrive at the financial costs
12.5% Service Tax/VAT has been added for the electrical and mechanical
components. For the pumps, 5% transport & installation charges have also
been added.
8. For Civil Works the cost estimates have been made as for works of river
improvements.

351
24.3 Estimates of Costs
This Project Costs used for the Cost/Benefit analysis are summarised in Table 24.1.
CASDP Assisted by ADB
TOTAL ABSTRACT
Sl. No
Description Amount in Crores
1 Civil Works 678.22
2 Mechanical and Equipment Work 6.24
3 Establishment and setup of PMU 15.41
4 Decision support System (DSS) 1.92
5 Consultancy for Project Implementation & Monitoring 9.47
6 Consultancy for follow on Project feasbility studies and survey works including environmental clearances
15.61
7 Capacity Development - Training 0.94
8 Enviornmental and Resettlement 5.48
9 Program Management Costs 6.88
10 Physical Contingencies 15.44
11 Price Contingencies 130.10
12 Interest 26.30
TOTAL 912.00
The general abstract of costs for this Project is shown in Table 24.1. Detailed cost
estimates of each river are given in Annexure 8. The costs for the pumping schemes are
shown in Table 24.2.

352
Table A9.4
Cost Abstract for this Project Works
No. Description of Work
Project Components Other Costs
Total Harichandra Adappar Pandavayar Vellaiyar Valavanar V. Canal
Pumping schemes
A Direct Charges (INR lakhs)
I Works
A Preliminaries (See Note 1) 0 0 0 0 0 0 0 817.6 817.6
B Lands ( Resettlement ) (See Note 2) 0 0 0 0 0 0 0
0
C Works 2,181.69 6594.94 5,491.55 9,606.25 355.72 959.1 599.82
25789.07
D Regulators & Measuring Device (For Canal Only)
2,041.44 2898.62 319.11 957.91 672.67 0 0
6889.75
E Falls ( For Canal Only ) 0 0 0 0 0 0 0
0
F Cross Drainage Works ( For Canal Only ) 613.78 200.84 0.0 0.0 50 83.67 0.0
948.29
G Bridges ( For Canal Only ) 652.84 0 0 0 141 0 0
793.84
H Escapes ( For Canal Only )
0 0 0 0 0 0
0
I Navigation Works ( Dredging Works ) 330.05 495 0.0 158 707.63 759.22 0.0
2449.9
J Power Plant 0 0 0 0 0 0 0
0
K Buildings 0 0 0 0 0 0 0
0
L Earthwork, Lining and Service Road 15,280.40 4061.82 2,911.70 5,053.37 1,570.48 749.93 0
29627.7
M Plantation 0.0 0.0 0.0 0.0 0.0 0.0 0.0
0
N Tanks 0.0 0.0 0.0 0.0 0.0 0.0 0.0
0
O Miscellaneous (See Note 3) 1005.7 676.59 415.5 735.07 164.81 120.9 51.73 192 3362.30

353
P Maintenance 0 0 0 0 0 0 0
0
Q Special Tools & Plants 0 0 0 0 0 0 0
0
R Communications 0 0 0 0 0 0 0
0
S Power Plant/ Electrical /Mechanical 0 0 0 0 0 0 623.75
623.75
T Water Supplying Works 0 0 0 0 0 0 0
0
U Distributies 0 0 0 0 0 0 0
0
V Water Course 0 0 0 0 0 0 0
0
W Drainage (included in X) 0 0 0 0 0 0 0
0
X Environment and Ecology 76.7 52.19 32.34 56.4 12.79 9.78 4.7
244.9
Y Losses on Stock 0.0 0 0 0 0 0 0
0
Total I Works (including physical contingencies) (See Note 4)
22,182.60 14,980.00 9,170.20 16,567.00 3,675.10 2,682.60 1,280.00 1,009.60 71,547.10
Total cost (excluding physical contingencies) 21,176.90 14,303.41 8,754.70 15,831.93 3,510.29 2,561.70 1,228.27 817.60 68,184.80
II Establishment
i) Establishment Charges including leave and Pensionary Charges etc., @ 12 % of Project- I Works less B - Land.
8,585.65
III Tools and Plants @ 1 % on I - Works
681.85
IV Suspense
V Receipts & Recoveries on Capital Account (75% of Q )
B Indirect Charges
I) Audit & Account Charges @ 1 % on I - Works
681.85
Total 22,182.60 14,980.00 9,170.20 16,567.00 3,675.10 2,682.60 1,280.00 11,776.55 82,314.05
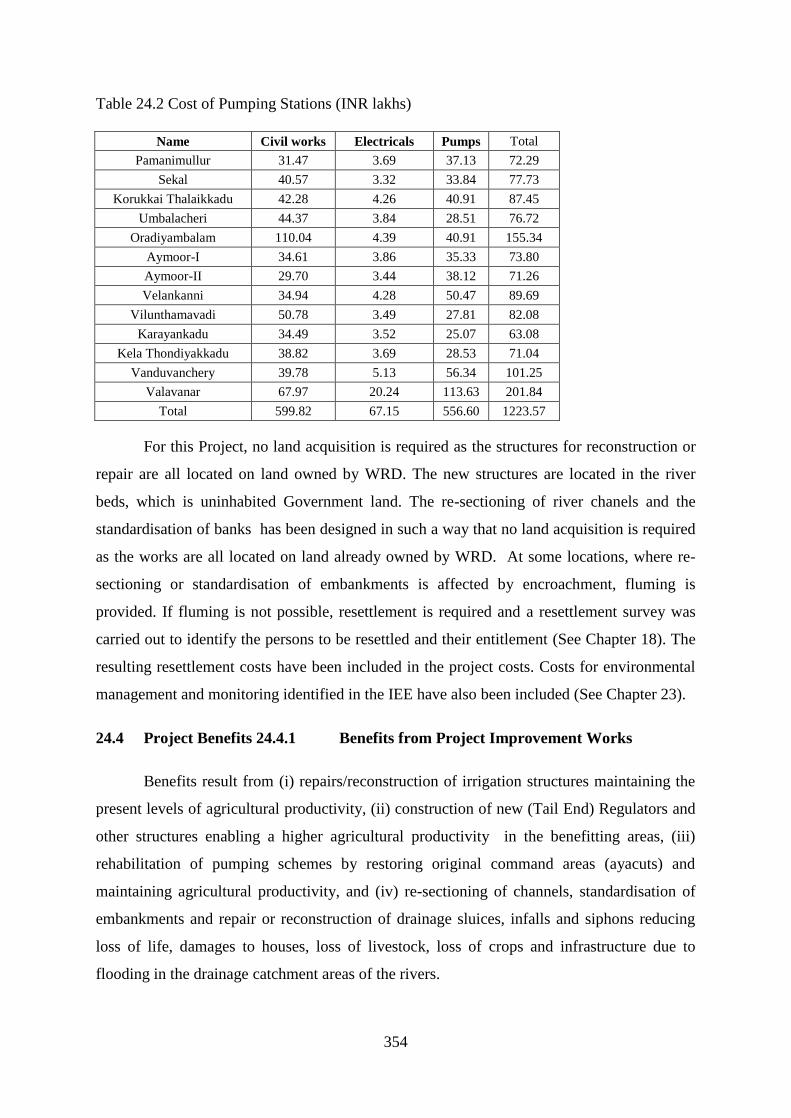
354
Table 24.2 Cost of Pumping Stations (INR lakhs)
Name Civil works Electricals Pumps Total
Pamanimullur 31.47 3.69 37.13 72.29
Sekal 40.57 3.32 33.84 77.73
Korukkai Thalaikkadu 42.28 4.26 40.91 87.45
Umbalacheri 44.37 3.84 28.51 76.72
Oradiyambalam 110.04 4.39 40.91 155.34
Aymoor-I 34.61 3.86 35.33 73.80
Aymoor-II 29.70 3.44 38.12 71.26
Velankanni 34.94 4.28 50.47 89.69
Vilunthamavadi 50.78 3.49 27.81 82.08
Karayankadu 34.49 3.52 25.07 63.08
Kela Thondiyakkadu 38.82 3.69 28.53 71.04
Vanduvanchery 39.78 5.13 56.34 101.25
Valavanar 67.97 20.24 113.63 201.84
Total 599.82 67.15 556.60 1223.57
For this Project, no land acquisition is required as the structures for reconstruction or
repair are all located on land owned by WRD. The new structures are located in the river
beds, which is uninhabited Government land. The re-sectioning of river chanels and the
standardisation of banks has been designed in such a way that no land acquisition is required
as the works are all located on land already owned by WRD. At some locations, where re-
sectioning or standardisation of embankments is affected by encroachment, fluming is
provided. If fluming is not possible, resettlement is required and a resettlement survey was
carried out to identify the persons to be resettled and their entitlement (See Chapter 18). The
resulting resettlement costs have been included in the project costs. Costs for environmental
management and monitoring identified in the IEE have also been included (See Chapter 23).
24.4 Project Benefits 24.4.1 Benefits from Project Improvement Works
Benefits result from (i) repairs/reconstruction of irrigation structures maintaining the
present levels of agricultural productivity, (ii) construction of new (Tail End) Regulators and
other structures enabling a higher agricultural productivity in the benefitting areas, (iii)
rehabilitation of pumping schemes by restoring original command areas (ayacuts) and
maintaining agricultural productivity, and (iv) re-sectioning of channels, standardisation of
embankments and repair or reconstruction of drainage sluices, infalls and siphons reducing
loss of life, damages to houses, loss of livestock, loss of crops and infrastructure due to
flooding in the drainage catchment areas of the rivers.

355
24.4.2 Agricultural Benefits
24.4.2.1 Agricultural Benefits of Improvements to Irrigation and Drainage Structures
and River Sections
The without-project situation would be that the productivity of command areas of this
Project rivers would decline as the already poor condition of the water management
structures would continue to deteriorate, thereby reducing their effectiveness to manage
flows. Ayacuts would gradually lose their water supply and would become more dependent
on rainfall. In the project area rainfall is unpredictable and insufficient for crop water
requirements.
The effect of the repairs and reconstruction of structures or the provision of new
structures will be that the present productivity level will be maintained for another 50 years
assuming the condition of the irrigation canals remains the same. Cross Regulators and Tail
end Regulators do not have command areas of their own, but enable the more efficient
operation of irrigation head sluices upstream.
Data on crop area coverage, crop yields, requirement of inputs (seeds and other inputs
such as fertilisers, labour, machine hire etc., and current prices was collected from District
Agriculture Offices of Thiruvarur and Nagapattinam districts. The agricultural data are given
in Annexure 1 and analysed in Annexure 9. The data is not complete as, for example, the
productivity or production costs were not provided for all crops.
Based on this data, average cropping pattern, average crop yield per hectare, average
price of crop per kg and average requirement of seeds and other inputs per ha for these
districts have been calculated for the two districts and applied to the Project area. Net value
of produce after deducting cost of inputs from value of output was estimated. Wherever data
was not available, appropriate assumptions were made. The net value of agricultural produce
from the total area in these two districts was reduced by the ratio of the culturable cropped
area (CCA) in this Project area to the total geographical area of the districts (See Table A9.3).
It has further been assumed that, in case proposed improvements in this Project area
are not undertaken, agricultural productivity would gradually reduce by 15% due to reduced
delivery of irrigation water. This reduction also takes into account the missing agricultural
data.

356
Agricultural benefits are discussed further in Section 24. 7.
24.4.3 Flood Protection Benefits
Flood protection benefits consist of avoided flood damages. These damages happen at
irregular intervals and at different levels, depending on the severity, timing and duration of
the flood. Flood damage data for the period 2004-2013 was collected from the District
Collectors of Nagipattinam and Thiruivarur and the data provided is shown in Annexure 9.1
for Thiruvarur and Annexure 9.2 for Nagapattinam. The data included the loss of life, loss
of livestock, and damages to crops, irrigation infrastructure, houses and roads.
Based on anecdotal and field information, the flood damage data appears to be
incomplete and the extent of flood damage under-reported (See Annexure 9 Tables A9.9 to
A9.11). For example, there were two major floods in 2005 and yet no flood damages have
been reported for road reconstruction, crop losses or repair of irrigation and municipal
structures in Nagapattinam or Thiruvarur. Similarly, in 2008, when there was significant
flooding in the lower reaches of this Project rivers in Nagipattinam (See Figure 13.6) there
are no reported road damages or crop loses .
The total flood damages for the combined Nagipattinum and Thiruvarur districts over
the 10 year period from 2004 to 2012 was INR 74932 lakh, as shown in Table 24.3. The
average annual flood damage over the ten year period was INR7493.3 lakh. . The annual
average flood damamge equivalent to the annual reduction in direct flood damages due to this
Project works was calculated to be INR1498.6 lakh after taking into account the relative size
of this Project area.

357
Table 24.3 Average Annual Flood Protection Benefits Description Total Flood Damages over 10 years Annual Average over ten year
period
Source Nagapattinam Thiruvarur Combined Thiruvarur and Nagapattinam
Districts
(INR) (INR) (INR) (INR lakh)
Human Lives From Tables A9.9 and A9.10 26,908,306 28,281,178 55,189,484.10 5,518,948.41 55.19
Houses From Tables A9.9 and A9.10 489,041,847 3,431,997,402 3,921,039,248.70 392,103,924.87 3921.04
Crops From Tables A9.9 and A9.10 1,281,942,759 1,389,442,153 2,671,384,912.68 267,138,491.27 2671.38
Livestock From Tables A9.9 and A9.10 29,024,500 13,018,000 42,042,500.00 4,204,250.00 42.04
Roads and Bridges
From Tables A9.9 and A9.10 437,442,635 74,338,195 511,780,830.32 51,178,083.03 511.78
Water Supply From Tables A9.9 and A9.10 0 30,652,683 30,652,683.20 3,065,268.32 30.65
Irrigation Infrastructure
From Tables A9.9 and A9.10 21,074,433 240,122,818 261,197,250.51 26,119,725.05 261.20
Total Direct Damages
2,285,434,480 5,207,852,430 7,493,286,909.51 749,328,690.95 7493.29
Adjustment for the relative size of this Project area
1498.66
24.5 Operation and Maintenance Charges
24.5.1 Water Rates for Irrigation
The Tamil Nadu Government policy is that farmers are not charged for surface
irrigation water.
24.5.2 Betterment Levy
In Tamil Nadu, government policy is that farmers are not charged a betterment levy
when they receive a new or modernised irrigation scheme. Therefore it is expected that this
policy will be applied to the improvements made to this Project rivers and farmers will not be
charged a betterment levy.

358
24.5.3 O & M Costs of Pumping Schemes
In Tamil Nadu, all operation and maintenance costs including power costs are paid for
by the Government. The power utility is reimbursed by the Government for the power
consumed.
24.5.4 O & M Costs of Groundwater Irrigation
For groundwater irrigation, farmers use their own funds to construct the well and for
the connection to the power distribution system, and the Government pay for the power
consumed.
24.5. 5 Flood Protection Costs
Households located on flood plains in Tamil Nadu, including those located on this six
Project rivers, are not charged for flood defences or flood mitigation measures.
24.5.6 Annual Cost of Project
The annual cost for this Project works was worked out according to guidelines laid
down by the Central Water Commission (CWC 2010). The following norms have been
adopted:
1. Interest charges @ 10% of the Cost
2. O & M cost @ INR 180/ha of culturable command area (CCA)
3. Depreciation @ 2% of estimated project costs excluding cost of electrical and
mechanical equipment for pumping schemes. This is based on the assumption
that life of the civil works is 50 years.
4. Maintenance of Headworks (Regulators and Tail end Regulators) @ 1% of
estimated costs.
5. Electrical and Mechanical equipment for pumping systems along with rising
mains @ 8.33% of estimated costs. This is based on the assumption that these
require replacement every 12 years.
6. Power consumption charges have not been considered as per policy of the
government of Tamil Nadu.

359
The average annual cost of the Project was calculated to be 11245.83 Lakhs).
24.6 Cropping Patterns and Annual Crop Net Benefits
The seasons and possible crops per season in the project area are (i) Kuruvai (May-
August) with paddy, (ii) Thaladi (September/October-March) with paddy, (iii) Samba
(July/August-January) with paddy, followed by (iv) Summer (February-July) with black
gram/green gram/gingelly (sesame), using residual moisture or groundwater irrigation,
depending on availability, and (v) Annual with sugarcane (one year). The area covered by
different crops is shown in Tables 24.4 for Nagapattinam and 24.5 for Thiruvarur.
Based on the areas under different crops, the production costs and the parameters
discussed in Section 24.4.2.1, the average annual agricultural benefits for this Project were
calculated to be $ 12.71 million (INR 7268 lakh) as shown in Table 24.6.
Table 24.4 Area with Different Crops, Nagapattinam
Crop
Area (ha)
2008-09 2009-10 2010-11 2011-12 2012-13 2013-14 Average Annual
Kuruvai 35197 27950 27313 42848 17115 22682 28851
Samba - Thaladi 136034 130774 132793 135829 131246 135767 133741
Kodai 1161 927 1840 2445 69 977 1237
Blackgram 61858 52007 53215 65930 31391 49900 52384
Greengram 35186 29476 28020 38000 23999 42000 32780
Sugarcane 0 0 0 3200 3298 3200 1616
Gingilly 0 0 0 132 740 400 212
Groundnut 0 0 0 1650 2598 1900 1025
Cotton 0 0 0 110 262 287 110 Source: Department of Agriculture, Nagapattinam (See Annexure 1 and 9)
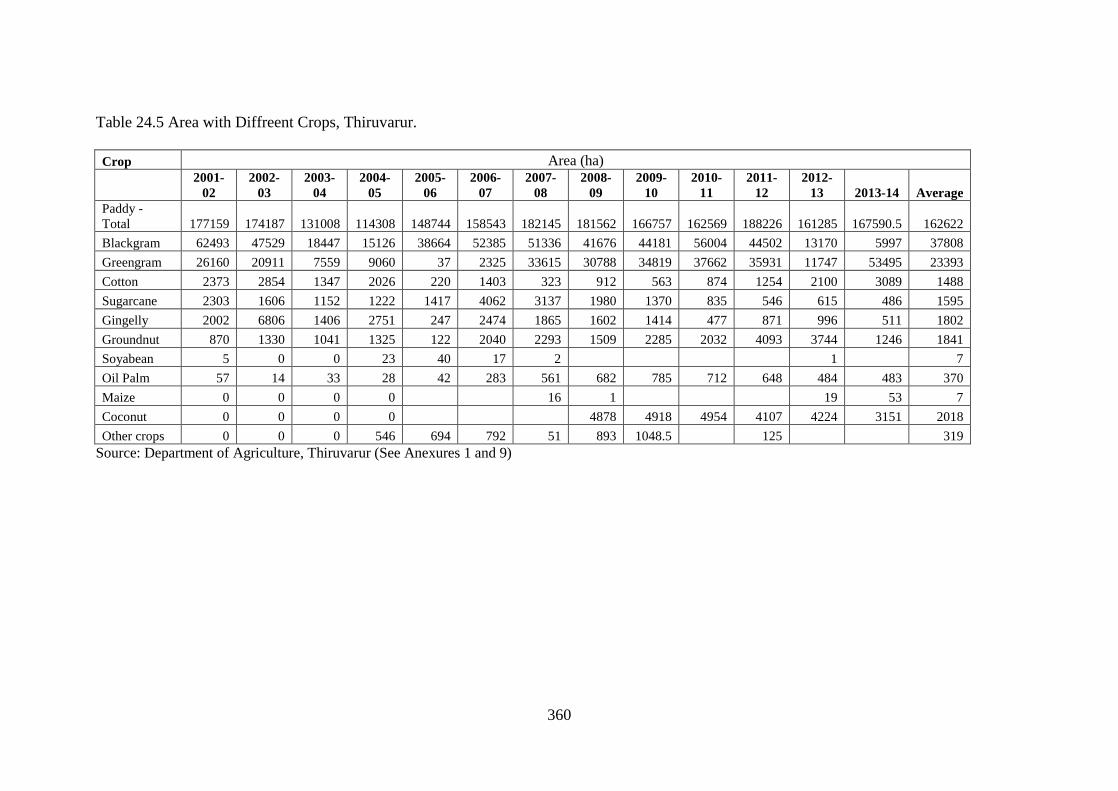
360
Table 24.5 Area with Diffreent Crops, Thiruvarur. Crop Area (ha)
2001-
02 2002-
03 2003-
04 2004-
05 2005-
06 2006-
07 2007-
08 2008-
09 2009-
10 2010-
11 2011-
12 2012-
13 2013-14 Average Paddy - Total 177159 174187 131008 114308 148744 158543 182145 181562 166757 162569 188226 161285 167590.5 162622
Blackgram 62493 47529 18447 15126 38664 52385 51336 41676 44181 56004 44502 13170 5997 37808
Greengram 26160 20911 7559 9060 37 2325 33615 30788 34819 37662 35931 11747 53495 23393
Cotton 2373 2854 1347 2026 220 1403 323 912 563 874 1254 2100 3089 1488
Sugarcane 2303 1606 1152 1222 1417 4062 3137 1980 1370 835 546 615 486 1595
Gingelly 2002 6806 1406 2751 247 2474 1865 1602 1414 477 871 996 511 1802
Groundnut 870 1330 1041 1325 122 2040 2293 1509 2285 2032 4093 3744 1246 1841
Soyabean 5 0 0 23 40 17 2 1 7
Oil Palm 57 14 33 28 42 283 561 682 785 712 648 484 483 370
Maize 0 0 0 0 16 1 19 53 7
Coconut 0 0 0 0 4878 4918 4954 4107 4224 3151 2018
Other crops 0 0 0 546 694 792 51 893 1048.5 125 319 Source: Department of Agriculture, Thiruvarur (See Anexures 1 and 9)

361
Table 24.6 Agricultural Annual Net benefits
Crop Thiruvarur Nagapattinam Combined Annual
Average Area T
+N
Average Yield
Average Price
Value of
produce
Inputs Seeds
Inputs except seeds
Total Inputs
Annual Net
Benefit
Annual Net
benefit of
Project (See Note
1)
Average Annual
Area
Average Annual Area
Cost per
hectare
Total cost
Cost per hactare
Area Total Cost
(ha) (ha) (tonnes/ ha)
(INR/kg) (INR Lakh)
(INR lakh /ha)
(INR lakh
(INR lakh/ha)
(ha) (INR lakh)
(INR/ lakh)
(INR lakh)
(INR Lakh)
Paddy - Total 162622 162592 325214 6.4 13.99 291184 0.02 6052.9
Blackgram 37808 52384 90192 0.94 49 41542.4 0.02 1423.7
Greengram 23393 32780 56173 0.86 52.5 25362.1 0.02 886.69
Cotton 1488 110 1598 0 0.00 0
Sugarcane 1595 1616 3211 97.5 2.75 8609.49 0.19 621.33
Gingelly 1802 212 2014 0.45 81.5 738.63 0.00 7.05
Groundnut 1841 1025 2866 0
Soyabean 7 7 0
Oil Palm 370 370 0
Maize 7 7 0
Coconut 2018 2018 0
Other crops 319 1237 1556 0
Straw and Stalk 162622 162592 325214 10 5.38 174965
All crops 0.6 485226 291136
Total 485226 542401 8991.6 291136 300127 242274 16959
1. Project-covers 20% of the area of Thiruvarur and Nagapattinam districts and Project works will prevent productivity reducing by 35%
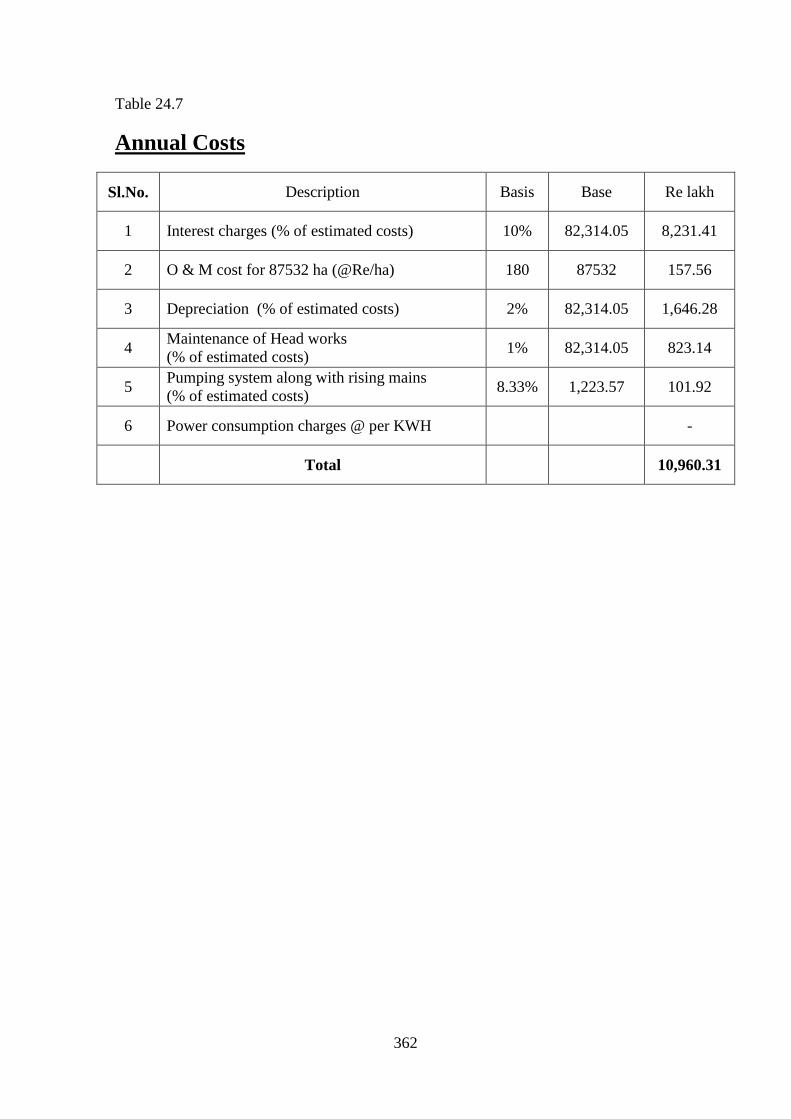
362
Table 24.7
Annual Costs
Sl.No. Description Basis Base Re lakh
1 Interest charges (% of estimated costs) 10% 82,314.05 8,231.41
2 O & M cost for 87532 ha (@Re/ha) 180 87532 157.56
3 Depreciation (% of estimated costs) 2% 82,314.05 1,646.28
4 Maintenance of Head works (% of estimated costs)
1% 82,314.05 823.14
5 Pumping system along with rising mains (% of estimated costs)
8.33% 1,223.57 101.92
6 Power consumption charges @ per KWH
-
Total
10,960.31

363
24.7 Benefit Cost Ratio
The cost-benefit ratio was calculated for this Project works as shown in Table 24.7.
All existing irrigation and drainage infrastructure that is not included in the project,
such as irrigation and drainage canals, were considered to be in operational condition and
have been treated as 'sunk costs'.
The benefit cost ratio for the works on this Project including pumping schemes is
1.69. The analysis shows that overall financial feasibility of this Project rivers/drainage
works, including flood protection works, and the pumping schemes are satisfactory.
Table 24.7 Cost Benefit Ratios
Benefits River Works (1)
Remarks (INR Lakhs)
Average Annual Flood Damage Prevention
1499 Refer Table 24.6
Average Annual Net Agriculture Benefit
16959 Refer Table 24.6
Total Annual Benifit 18458
Costs
Benefits Remarks
Annual Costs of Project - 1 including cost of environment and Rehabilitation & Resettlement
10960 Refer Table 24.1 & 24.7
Benefit - Cost Ratio 1.68
Note
(1) Costs Include of environment and resettlement costs
24.9 Baseline Survey
Environmental and re-settlement field surveys were carried out during the
preparation of this Project. Flood damage and agricultural data was collected from District
Collectors and District Agriculture Officers in Nagapattinam and Thiruvarur districts
respectively.

364
The CASDP PMU will undertake a baseline survey and develop parameters for
evaluation of the performance of this Project during implementation of this Project and
then at regular intervals of 5 years after commencement of the project.

365
25. Administrative and Legislative Provisions
The Government of India has drafted a legal frame work titled “National Water Framework
Law”, which is governed by some key principles including IWRM. It empowers the states to
develop, regulate and manage basins of inter-state rivers using a legislative route. It is expected that
the National Water Framework Law will be enacted within the period of this CASDP Project and, if
Tamil Nadu complies, the Law will provide an enabling environment for this Project to introduce
appropriate IWRM practices in the Vennar system.
Currently water regulation in Tamil Nadu is characterized by a divergent set of state acts
and rules adopted over many years. In terms of statutory development, irrigation laws constitute
historically the most developed part of state water law. For example, Tamil Nadu has legislation to
regulate water supplies, irrigation and canals, rainwater harvesting, protection of riverbanks etc.
The key features of some of the legislative provisions in Tamil Nadu and their significance to
CASDP are described in Table 25.1.
Table 25.1: Legislative provisions
Regulations Key features Significance to CASDP and IWRM
in the Vennar system
National Water
Framework Law
(proposed)
Provides a framework for IWRM and for
management of droughts and floods,
provides a framework for urban water
management and industrial water supply,
provides for statutory powers to WUAs
(collect and retain water charges)
Yet to be enacted. Once enacted, will
provide a legal framework to transform
IWRM concepts into practices at the
basin level
The Tamil Nadu
Panchayats Act, 1994
Food and agriculture standing committee
at the District Panchayats , Maintenance of
irrigation works, execution of
kudimaramat, District Planning
Committees, Minor irrigation, water
management and watershed development
Agriculture and agriculture extension,
Animal husbandry and fisheries, Drinking
water
Since provision for drinking water
supply is the constitutional mandate of
local governments, this Act has
significance in terms of water supply
for domestic purpose
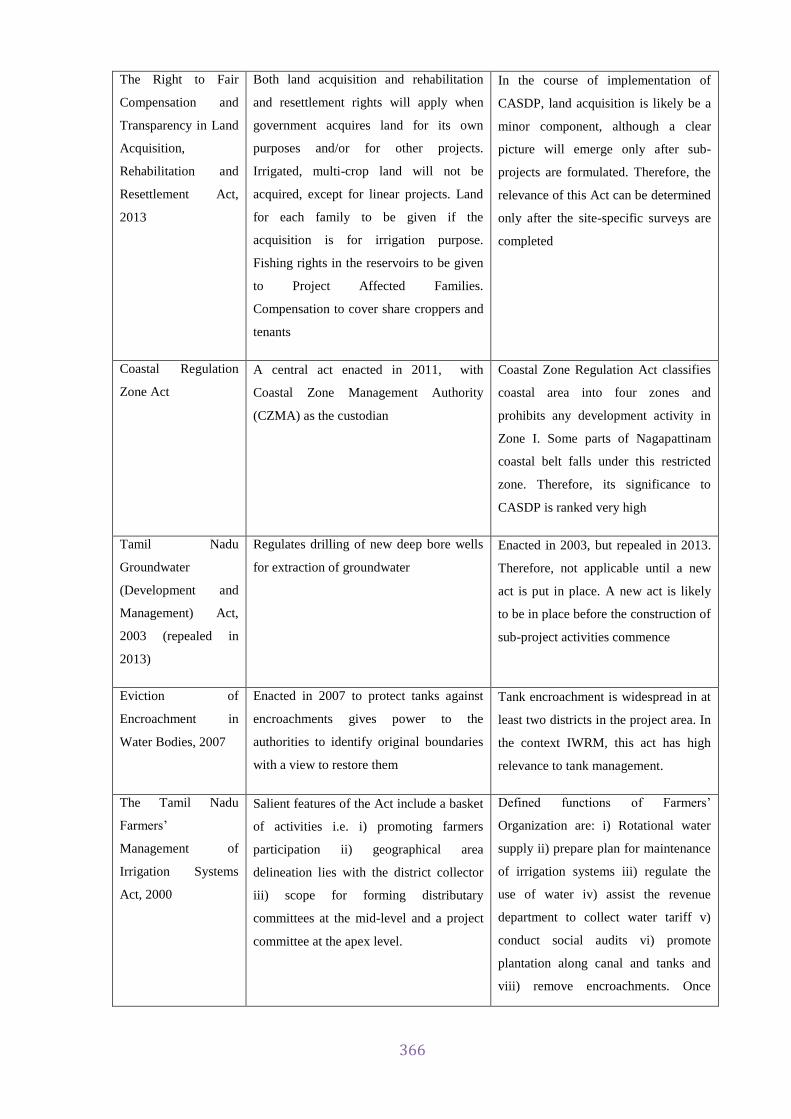
366
The Right to Fair
Compensation and
Transparency in Land
Acquisition,
Rehabilitation and
Resettlement Act,
2013
Both land acquisition and rehabilitation
and resettlement rights will apply when
government acquires land for its own
purposes and/or for other projects.
Irrigated, multi-crop land will not be
acquired, except for linear projects. Land
for each family to be given if the
acquisition is for irrigation purpose.
Fishing rights in the reservoirs to be given
to Project Affected Families.
Compensation to cover share croppers and
tenants
In the course of implementation of
CASDP, land acquisition is likely be a
minor component, although a clear
picture will emerge only after sub-
projects are formulated. Therefore, the
relevance of this Act can be determined
only after the site-specific surveys are
completed
Coastal Regulation
Zone Act
A central act enacted in 2011, with
Coastal Zone Management Authority
(CZMA) as the custodian
Coastal Zone Regulation Act classifies
coastal area into four zones and
prohibits any development activity in
Zone I. Some parts of Nagapattinam
coastal belt falls under this restricted
zone. Therefore, its significance to
CASDP is ranked very high
Tamil Nadu
Groundwater
(Development and
Management) Act,
2003 (repealed in
2013)
Regulates drilling of new deep bore wells
for extraction of groundwater
Enacted in 2003, but repealed in 2013.
Therefore, not applicable until a new
act is put in place. A new act is likely
to be in place before the construction of
sub-project activities commence
Eviction of
Encroachment in
Water Bodies, 2007
Enacted in 2007 to protect tanks against
encroachments gives power to the
authorities to identify original boundaries
with a view to restore them
Tank encroachment is widespread in at
least two districts in the project area. In
the context IWRM, this act has high
relevance to tank management.
The Tamil Nadu
Farmers’
Management of
Irrigation Systems
Act, 2000
Salient features of the Act include a basket
of activities i.e. i) promoting farmers
participation ii) geographical area
delineation lies with the district collector
iii) scope for forming distributary
committees at the mid-level and a project
committee at the apex level.
Defined functions of Farmers’
Organization are: i) Rotational water
supply ii) prepare plan for maintenance
of irrigation systems iii) regulate the
use of water iv) assist the revenue
department to collect water tariff v)
conduct social audits vi) promote
plantation along canal and tanks and
viii) remove encroachments. Once
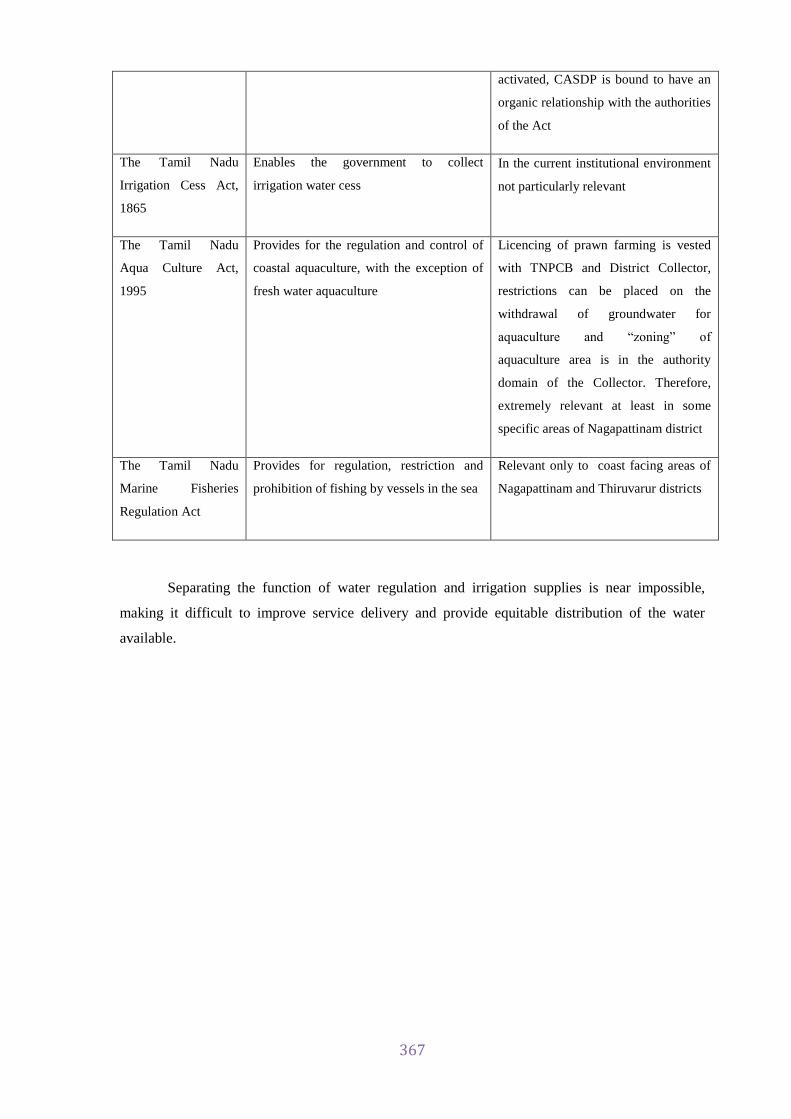
367
activated, CASDP is bound to have an
organic relationship with the authorities
of the Act
The Tamil Nadu
Irrigation Cess Act,
1865
Enables the government to collect
irrigation water cess
In the current institutional environment
not particularly relevant
The Tamil Nadu
Aqua Culture Act,
1995
Provides for the regulation and control of
coastal aquaculture, with the exception of
fresh water aquaculture
Licencing of prawn farming is vested
with TNPCB and District Collector,
restrictions can be placed on the
withdrawal of groundwater for
aquaculture and “zoning” of
aquaculture area is in the authority
domain of the Collector. Therefore,
extremely relevant at least in some
specific areas of Nagapattinam district
The Tamil Nadu
Marine Fisheries
Regulation Act
Provides for regulation, restriction and
prohibition of fishing by vessels in the sea
Relevant only to coast facing areas of
Nagapattinam and Thiruvarur districts
Separating the function of water regulation and irrigation supplies is near impossible,
making it difficult to improve service delivery and provide equitable distribution of the water
available.

368
26. Training
To maximize the returns from this CASDP Project investments, it is necessary to manage
water and land in a systematic and scientific way. This requires capacity building of government
staff as well as other stakeholders including water users. To identify the capacity building required,
a training needs assessment will be carried out by the PMU during this Project.
Fortunately this Project will be located close to WRD’s Irrigation Management Training
Institute in Tiruchirappalli. The Institute was established 30 years ago and provides training
courses on various aspects of irrigation and water resources management for professionals,
government staff, and water users including farmers.
One training need that has been identified during the preparation of this Project is to
address WRD’s limited capacity for hydrologic and hydraulic modelling and for use of a DSS.
Therefore basic training on the development and use of models of the Vennar system created during
the preparation of this Project and on the further development of the DSS will be provided in a
series of tutorials at the end of this Project preparation period. The training will be reinforced
during the implementation of this Project. The total cost of this training during this Project is
approximately US million $ 9.44

369
Training Program- Details of Costs
Indicative Training Cost per participant
No of participants
No of courses Total Cost
Project Management & Monitoring 15000 10 2 300,000
IWRM concepts and practices 15000 15 3
675,000
DSS concept design and implementation 20000 5 1 100,000
Flood forecast and flood modelling 15000 4 2 120,000
Flood rescue, relief and rehabilitation, including estimating losses to assets 10000 15 2
300,000
ADB procurement procedures 10000 5 2 100,000
FIDIC style contract management 15000 20 1
300,000
Community engagement in resettlement 2000 100 2
400,000
Channel level stakeholder participation 500 200 6 600,000
Financial Management Systems and reporting 20000 6 1
120,000
Overseas training and exposure visits to best practice locations 300000 10 1
3,000,000
GIS applications and remote sensing 10000 5 1 50,000
IEE/EIA/Environment management related training 10000 5 2
100,000
Unallocated 2,235,000
Total 8,400,000
Cost includint taxes
9,438,240.00
Cost in Miln
9.4382

370
27. Conclusion The Asian Development Bank (ADB) has provided development assistance to
Tamil Nadu under various sectors that ranged from Tourism, Tsunami Rehabilitation to
Urban Development. The proposed Climate Adaptation through Sub-basin Development
is the first of its kind ADB investment in the water resources sector in the State. The
World Bank through several urban and rural sector projects has invested in projects in
the State in water resources and irrigation.
The Government of TamilNadu implementing the programs like accelerated
Irrigation Benefit Program (AIBP), the Command Area Development program (CADP),
Flood Management Program (FMP), and National Water Mission (NWM) etc. In 2012,
the Government of Tamil Nadu released a policy document called Vision 2023, in which
assurance of timely irrigation is an important component. The document estimates that
between 2012 and 2023 an investment of INR 40,000 crore in the water resources sector
will be needed. The launching of the Climate Adaptation for Sub basin Development
Program (CASDP), with 30% contribution from the state budget is timed well to make a
significant contribution to this new initiative.
Tamil Nadu aims to achieve the goal of “Doubling Food Production” by 2015.
To achieve this goal, the State Government has formulated an agricultural policy, which
has three specific components i.e. i) developing a scientific approach to support the
development of the rural economy and preservation of ecological balance based on the
requirements of agro climatic zones; ii) to increase productivity, production and
profitability; and iii) implement of farmers welfare schemes such as integrated watershed
development, land management, development of water resources, organic farming, value
addition to agricultural produce, promotion of crops with export potential etc. It is the
third component that has direct relevance to CASDP.

371
Summary and Recommendations It is amply evident through specific agriculture policy and water resource funding
initiatives that the Government of Tamil Nadu is committed to develop climate resilient
irrigation infrastructure, thereby achieving higher water efficiency and improved
agriculture productivity.

ADB COST ABSTRACTS

CASDP Assisted by ADB
TOTAL ABSTRACT
Sl. No Description Amount in Crores
1 Civil Works 678.22
2 Mechanical and Equipment Work 6.24
3 Establishment and setup of PMU 15.41
4 Decision support System (DSS) 1.92
5 Consultancy for Project Implementation & Monitoring 9.47
6 Consultancy for follow on Project feasbility studies and survey works including environmental clearances
15.61
7 Capacity Development - Training 0.94
8 Enviornmental and Resettlement 5.48
9 Program Management Costs 6.88
10 Physical Contingencies 15.44
11 Price Contingencies 130.10
12 Interest 26.30
TOTAL 912.00

CASDP Assisted by ADB
BREAK UP DETAILS FOR
CIVIL, MECHANICAL & EQUIPMENT WORKS
Sl.
No. Description
Amount
in Rs.Cr.
I. Civil Worls 678.22
II. Mechanical & Equipment Works 6.24
Total 684.46
BREAK UP
1 Work Value / Contract Value
(Civil & Mechanical) 671.22
2 Contract related Costs
a Payment of Contribution to TN labour welfare
board 6.52
b Advertisement Charges 0.33
c Photographic, Video graphic & Name board
charges 0.65
d Environmental & CRZ Clearance 1.50
e Shifting of Power post & transformer 0.98
f Documentation Charges 0.33
g Materials Testing Charges 0.33
h Temporary building charges 1.30
i Dewatering and diversion works 0.65
j Procurement of Tools & Plants 0.65
Sub Total 13.24
Grand Total 684.46

CASDP Assisted by ADB
TOTAL ABSTRACT
Amount in Rs.Lakhs
Sl.
No
Name of River /
Drain
Work Value /
Contract
Value
Paym
en
t o
f C
on
trib
uti
on
to
TN
lab
ou
r w
elf
are b
oard @
0.9
3%
on
wo
rks
Ad
verti
sem
en
t C
harg
es
(0
.05
%)
Ph
oto
grap
hic
, V
ideo
grap
hic
& N
am
e b
oard
ch
arg
es
(0
.09
%)
En
vir
on
men
tal
Cle
aran
ce
(0
.21
%)
Sh
ifti
ng
of
Po
wer p
ost
&
tran
sfo
rm
er (
0.1
4 %
)
Do
cu
men
tati
on
Ch
arg
es
(0
.05
%)
Mate
ria
ls T
esti
ng
Ch
arg
es
(0
.05
%)
Tem
po
rary b
uil
din
g
ch
arg
es
( 0
.18
%)
Dew
ate
rin
g a
nd
div
ersio
n
wo
rks (
0.0
9 %
)
Pro
cu
rem
en
t o
f To
ols
&
Pla
nts
(0
.09
%)
Total
1 Harichandranathi 21100.20 206.38 10.30 20.60 47.50 30.87 10.30 10.30 41.15 20.60 20.60 21518.80
2 Adappar 14251.22 139.24 7.00 13.90 32.00 20.85 7.00 7.00 27.80 13.90 13.90 14533.81
3 Pandavayar 8722.36 85.20 4.20 8.50 19.58 12.76 4.20 4.20 17.02 8.50 8.50 8895.02
4 Vellaiyar 15775.53 151.00 7.50 15.06 34.63 22.62 7.50 7.50 30.15 15.06 15.06 16081.61
5 Valavanar Drain 3497.50 34.00 1.73 3.40 7.83 5.12 1.73 1.73 6.82 3.40 3.40 3566.66
6 Vedaranyam Canal
2551.92 24.50 1.25 2.50 5.72 3.73 1.25 1.25 5.00 2.50 2.50 2602.12
7 Pumping Schemes - 13 Nos
1223.57 11.40 0.60 1.20 2.74 1.79 0.60 0.60 2.38 1.20 1.20 1247.28
Total 67122.30 651.72 32.58 65.16 150.00 97.74 32.58 32.58 130.32 65.16 65.16 68445.30
or 684.46 Cr.

TOTAL ABSTRACT
Amount in Rs.Lakhs
3.Establishment and Setup of PMU

Table 22.4 PMU/PIU Equipment List PMU/PIU Set up Cost
Item UOM Quantity Rate Value
PMU
Building for PMU at Trichy(land not valued ; in kind contibution) sft 10,000 6,000
60,000,000
No of Workstations No 18 40,000
704,000
Desktops/Laptops No 13 50,000
660,000
Airconditioners No 5 45,000
225,000
Vehicles- PD No 1 1,900,000
1,900,000
Vehicle- Corrdinator No 1 1,100,000
1,100,000
Vehicle- EE,Environment, Social Development officer No 2 800,000
1,600,000
Printers No 1 15,000
15,000
Telephones/Mobiles No 2 5,000
10,000
Printer No 2 15,000
30,000
Photocopier No 1 150,000
150,000
66,394,000
Office of Deputy Project Director at Tanjavur
Existing Building sft
-
No of Workstations No 39 40,000
1,558,000
Desktops/Laptops No 12 50,000
615,000
Airconditioners No 3 45,000
135,000
Vehicles- SE- Multi Utulity Vehicle No 1 1,100,000
1,100,000
Vehicle- EE- Multi Utility Vehicle No 1 800,000
800,000
Printers No 1 15,000
15,000
Telephones/Mobiles No 2 5,000
10,000
Printer No 2 15,000
30,000
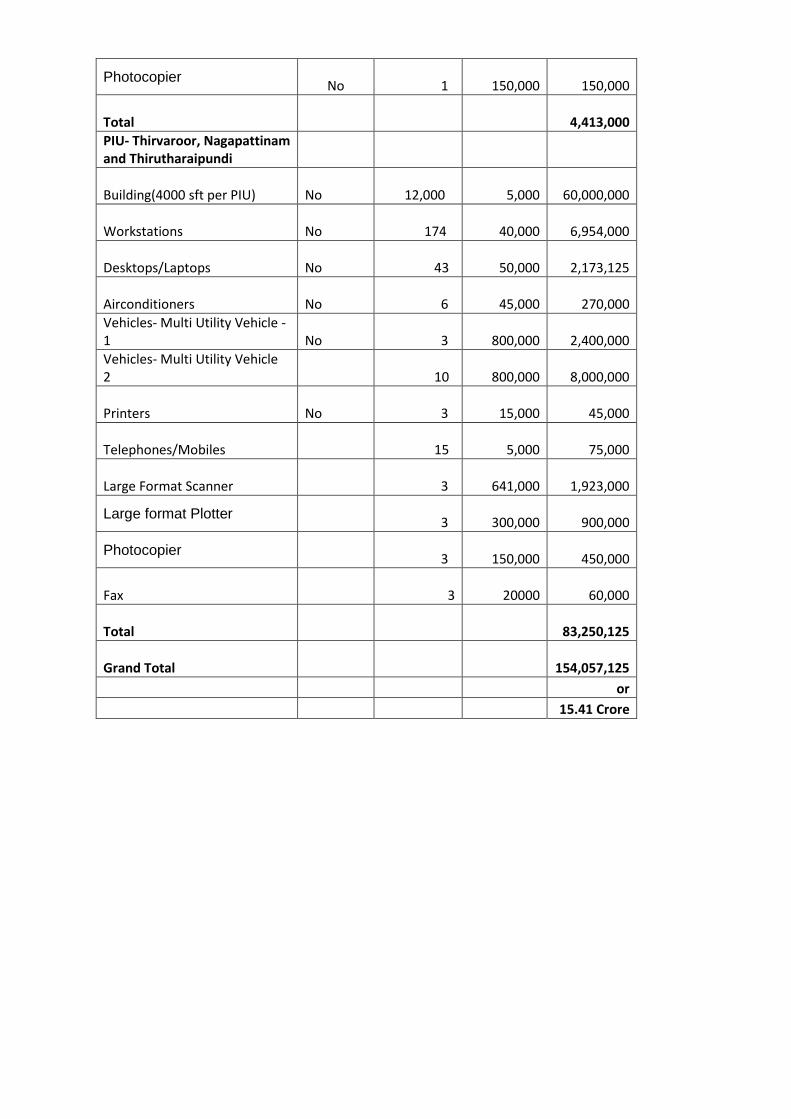
Photocopier No 1 150,000
150,000
Total
4,413,000
PIU- Thirvaroor, Nagapattinam and Thirutharaipundi
Building(4000 sft per PIU) No 12,000 5,000
60,000,000
Workstations No 174 40,000
6,954,000
Desktops/Laptops No 43 50,000
2,173,125
Airconditioners No 6 45,000
270,000
Vehicles- Multi Utility Vehicle -1 No 3 800,000
2,400,000
Vehicles- Multi Utility Vehicle 2 10 800,000
8,000,000
Printers No 3 15,000
45,000
Telephones/Mobiles 15 5,000
75,000
Large Format Scanner 3 641,000
1,923,000
Large format Plotter 3 300,000
900,000
Photocopier 3 150,000
450,000
Fax 3 20000
60,000
Total
83,250,125
Grand Total
154,057,125
or
15.41 Crore
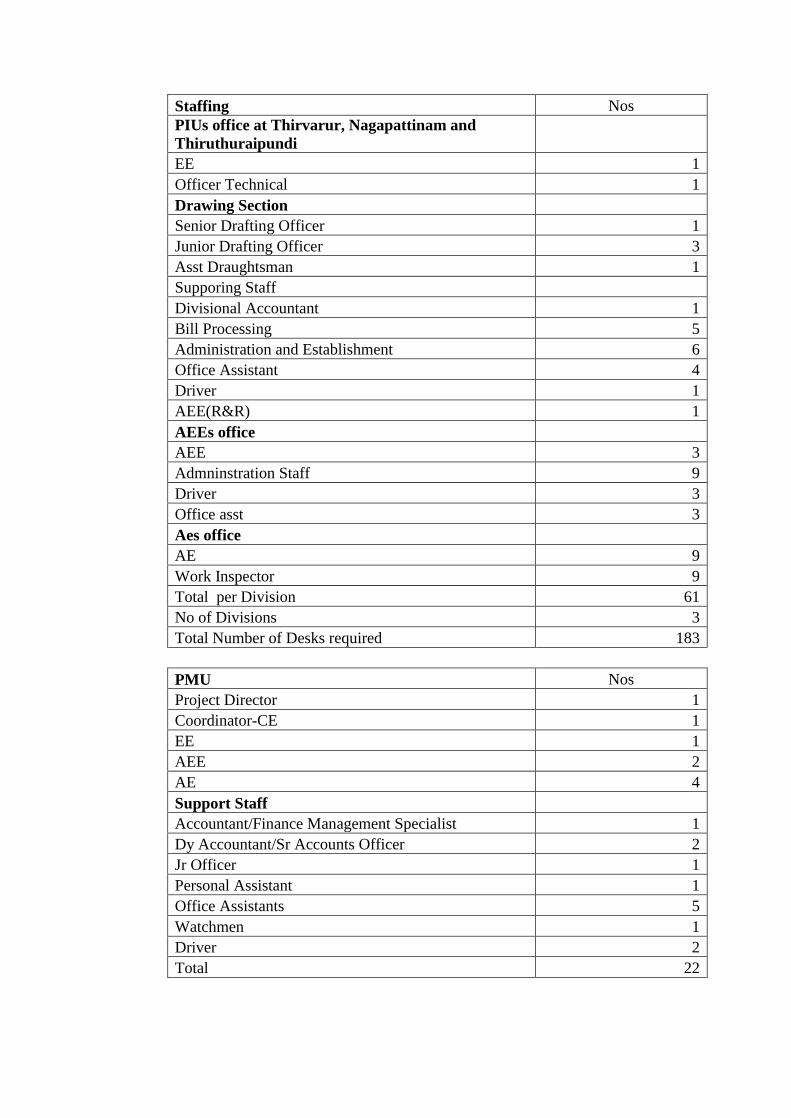
Staffing Nos PIUs office at Thirvarur, Nagapattinam and Thiruthuraipundi EE 1 Officer Technical 1 Drawing Section Senior Drafting Officer 1 Junior Drafting Officer 3 Asst Draughtsman 1 Supporing Staff Divisional Accountant 1 Bill Processing 5 Administration and Establishment 6 Office Assistant 4 Driver 1 AEE(R&R) 1 AEEs office AEE 3 Admninstration Staff 9 Driver 3 Office asst 3 Aes office AE 9 Work Inspector 9 Total per Division 61 No of Divisions 3 Total Number of Desks required 183
PMU Nos Project Director 1 Coordinator-CE 1 EE 1 AEE 2 AE 4 Support Staff Accountant/Finance Management Specialist 1 Dy Accountant/Sr Accounts Officer 2 Jr Officer 1 Personal Assistant 1 Office Assistants 5 Watchmen 1 Driver 2 Total 22

Office of Deputy Project Director- Tanjavur Nos
SE 1
EE 1
AEE 1
AE 1
Procurement Team
Chief Head Draughtsman 1
Sr Drafting Officer 1
Draughting Officer 3
Jr Drafting Officer 3
Asst Drafting Officer 3
Support Staff
A&E 1
Supdt 2
Assistants 8
Jr Assistants 4
Office Assistants 6
Driver 2
Watchmen 1
Data Entry Operator 1
Telephone operator 1
41
Total Staff Strength of project 246

4.Decision Support System (DSS)

Table 19.2: Equipment and Indicative Costs of DSS
Equipment For One River)
Nr Estimated Cost $ Field Equipment
Recording raingauges 5 $5,000 Check raingauges 5 $1,500 Surface water level recorders 10 $10,000 Groundwater level recorders 5 $5,000 Gate openings recorders 5 $5,000 Ultrasonic Flow meter 1 $25,000 SIM cards and cell phone contracts 20 $6,000 Training of WRD field engineers $5000
Sub-Total $62,500
Office Equipment Database + User Interface 1 $10,000 Server + Back-Up Facility 1 $2500 Workstations + UPSs 5 $5000
Sub-Total $17,500
TOTAL $80,000
For four rivers - $80,000 X 4 = $ 3,20,000 X 60 = Rs.1,92,00,000
(or) 1.92 Crore

5. Consultancy for Project
Implementation & Monitoring
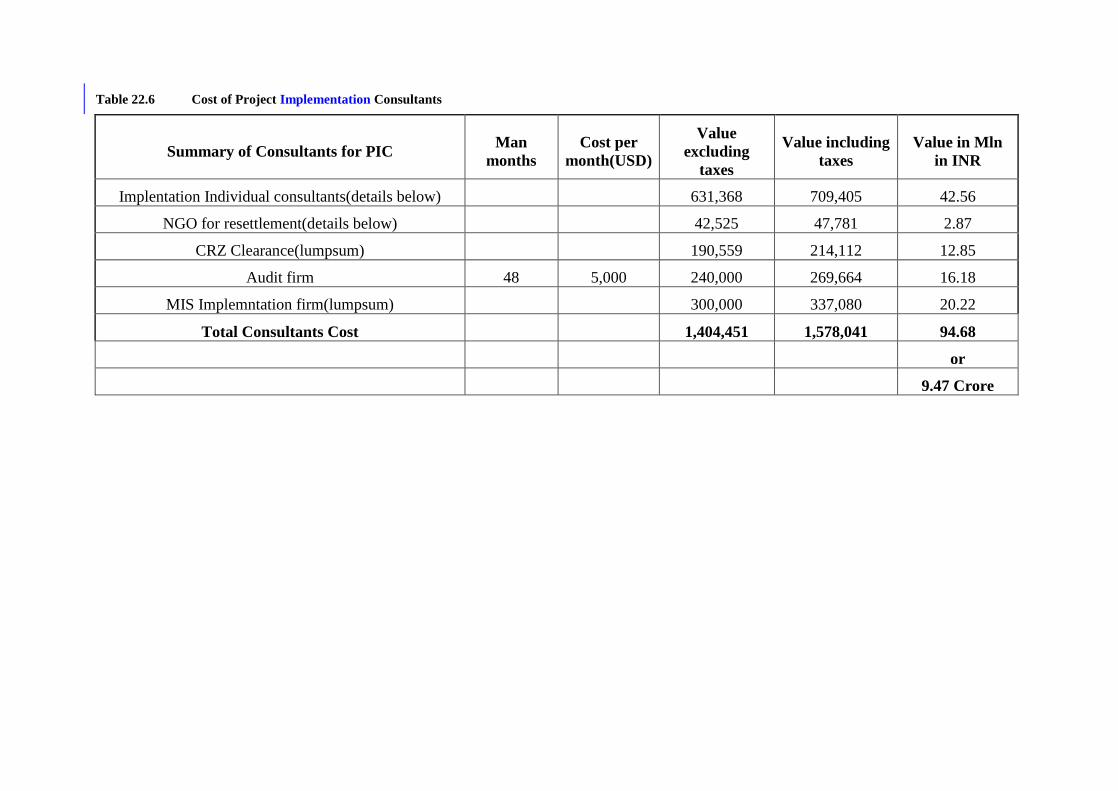
Table 22.6 Cost of Project Implementation Consultants
Summary of Consultants for PIC Man
months Cost per
month(USD)
Value excluding
taxes
Value including taxes
Value in Mln in INR
Implentation Individual consultants(details below)
631,368 709,405 42.56
NGO for resettlement(details below)
42,525 47,781 2.87
CRZ Clearance(lumpsum)
190,559 214,112 12.85
Audit firm 48 5,000 240,000 269,664 16.18
MIS Implemntation firm(lumpsum)
300,000 337,080 20.22
Total Consultants Cost
1,404,451 1,578,041 94.68
or
9.47 Crore

Program Technical Assistance – Individual
Travelling Cost
Calculations Travel
Man
mo
nth
s
Co
st p
er
mo
nth
(USD
)
Trav
el a
nd
Sub
sist
en
ce
Tota
l
Trav
el f
or
team
Ad
mn
co
sts
Co
nti
nge
nci
es
Tota
l
No
of
day
s
Rat
e p
er d
ay
To
tal
Tra
vel
Gra
nd
to
tal
No
of
trip
s
Co
st p
er t
rip
To
tal
Co
st &
per
die
m
Tra
velli
ng
Project management
specialist 36 5,000 53,100 233,100 38,400 2,500 11,655 285,655 1080 45 48,600 4500 53100 18 250 4500 228,600 4500
Procurement Specialist
6 4,000 8,850 32,850
1,643 34,493 180 45 8,100 750 8850 3 250 750 32,100 750
Social Development
Specialist 12 4,000 17,700 65,700
3,285 68,985 360 45 16,200 1500 17700 6 250 1500 64,200 1500
Environment Specalist
6 4,000 8,850 32,850
1,643 34,493 180 45 8,100 750 8850 3 250 750 32,100 750
Construction quality assurance
18 4,000 26,550 98,550
4,928 103,478 540 45 24,300 2250 26550 9 250 2250 96,300 2250
Financial Management
Specialist 6 4,000 8,850 32,850
1,643 34,493 180 45 8,100 750 8850 3 250 750 32,100 750
Construction Engineer
12 4,000 18,450 66,450
3,323 69,773 360 45 16,200 2250 18450 9 250 2250 64,200 2250
Total
562,350 38,400 2,500 28,118 631,368 549,600 12,750

NGO for Resettlement
Number of Persons
Monthly Rate per person
Input in Months per person
Total (Number of persons x Rate x input months
Team Leader cum Community Development Specialist 1 50,000 6 300,000 Field Coordinator 2 45,000 12 1,080,000 Field Staff 2 25,000 10 500,000
-
Local Travel LS 30,000 10 300,000 Survey Cost LS
200,000
Reporting and Documentation LS
50,000 Sub Total
2,430,000
Contingency @5%
121,500 Grand Total
2,551,500
Grand Total in US$
42,525

6. Consultancy for follow on Project
feasibility studies and survey works

Summary- PTAC- follow on Project
Consultants PTAC
US $
Survey
US $
EIA by authorised
agency
US $
Total Costs
US $
Total Costs including
taxes
US $
Total Costs including taxes in Mln INR
Remuneration and Per Diem
International Consultants 504,000
National Consultants 406,600
International and Local Travel 63,750
Reports and Communication 10,000
Provisional sums - survey and data collection
59,100
Miscellaenous and Administration support costs
10,000
Contingencies 52,673
Total Cost(excluding local taxes) 1,106,123 875,000 334,000 2,315,123 2,601,271.64 156.08
(OR) 15.61 Crores
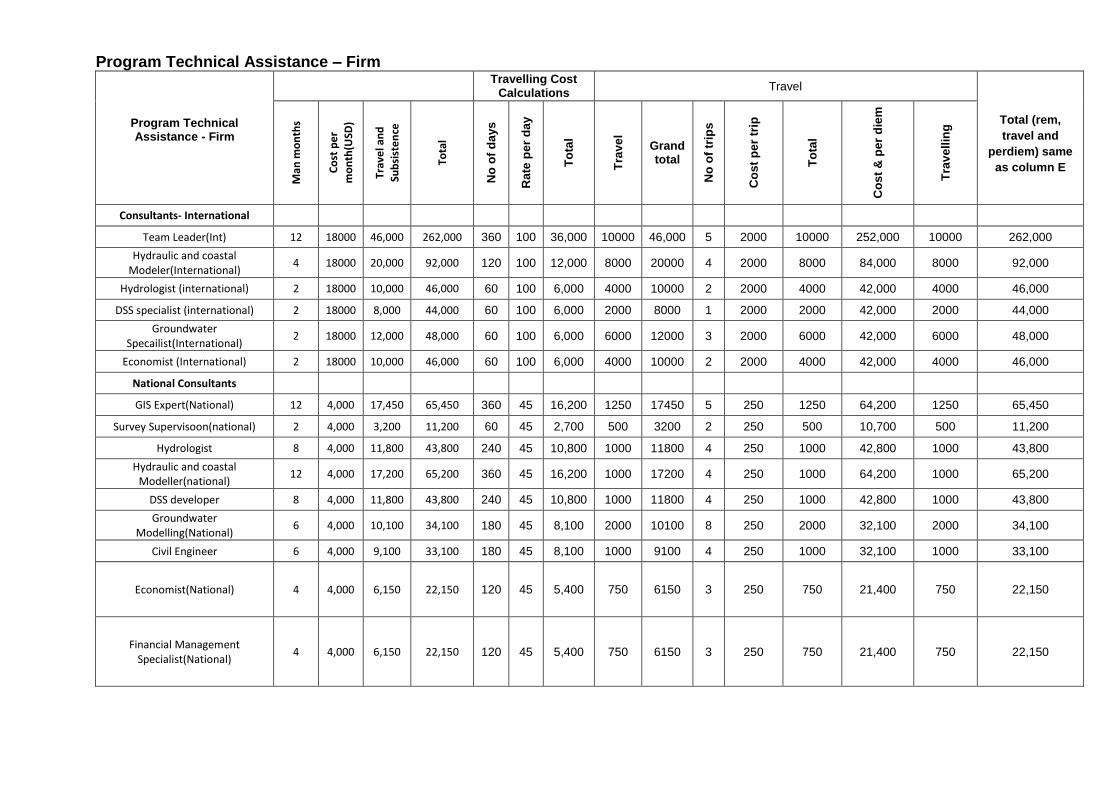
Program Technical Assistance – Firm
Program Technical Assistance - Firm
Travelling Cost
Calculations Travel
Total (rem, travel and
perdiem) same as column E
Man
mo
nth
s
Co
st p
er
mo
nth
(USD
)
Trav
el a
nd
Sub
sist
en
ce
Tota
l
No
of
day
s
Rat
e p
er d
ay
To
tal
Tra
vel
Grand total
No
of
trip
s
Co
st p
er t
rip
To
tal
Co
st &
per
die
m
Tra
velli
ng
Consultants- International
Team Leader(Int) 12 18000 46,000 262,000 360 100 36,000 10000 46,000 5 2000 10000 252,000 10000 262,000
Hydraulic and coastal Modeler(International)
4 18000 20,000 92,000 120 100 12,000 8000 20000 4 2000 8000 84,000 8000 92,000
Hydrologist (international) 2 18000 10,000 46,000 60 100 6,000 4000 10000 2 2000 4000 42,000 4000 46,000
DSS specialist (international) 2 18000 8,000 44,000 60 100 6,000 2000 8000 1 2000 2000 42,000 2000 44,000
Groundwater Specailist(International)
2 18000 12,000 48,000 60 100 6,000 6000 12000 3 2000 6000 42,000 6000 48,000
Economist (International) 2 18000 10,000 46,000 60 100 6,000 4000 10000 2 2000 4000 42,000 4000 46,000
National Consultants
GIS Expert(National) 12 4,000 17,450 65,450 360 45 16,200 1250 17450 5 250 1250 64,200 1250 65,450
Survey Supervisoon(national) 2 4,000 3,200 11,200 60 45 2,700 500 3200 2 250 500 10,700 500 11,200
Hydrologist 8 4,000 11,800 43,800 240 45 10,800 1000 11800 4 250 1000 42,800 1000 43,800
Hydraulic and coastal Modeller(national)
12 4,000 17,200 65,200 360 45 16,200 1000 17200 4 250 1000 64,200 1000 65,200
DSS developer 8 4,000 11,800 43,800 240 45 10,800 1000 11800 4 250 1000 42,800 1000 43,800
Groundwater Modelling(National)
6 4,000 10,100 34,100 180 45 8,100 2000 10100 8 250 2000 32,100 2000 34,100
Civil Engineer 6 4,000 9,100 33,100 180 45 8,100 1000 9100 4 250 1000 32,100 1000 33,100
Economist(National) 4 4,000 6,150 22,150 120 45 5,400 750 6150 3 250 750 21,400 750 22,150
Financial Management Specialist(National)
4 4,000 6,150 22,150 120 45 5,400 750 6150 3 250 750 21,400 750
22,150

Agriculture Specialist(national) 2 4,000 3,200 11,200 60 45 2,700 500 3200 2 250 500 10,700 500 11,200
Envrironmentalist(national) 6 4,000 9,100 33,100 180 45 8,100 1000 9100 4 250 1000 32,100 1000 33,100
Social development specialists (national)
6 4,000 9,100 33,100 180 45 8,100 1000 9100 4 250 1000 32,100 1000 33,100
Local Conveyance for the above group
24 750
18,000 18,000 18,000
Total
974,350 910,600 63,750 974,350
Project preperation work
Asset Survey equipment and logistics
Lump sum
1,000
Environmental Baseline survey Time
6,000
Socio Economic Survey
20,000
Total
59,100
Preparation of EIA by authorised agency
Time
334,000
Topo Survey (separate from PTAC consultants two packages for Vennar and Cauvery- total of both packages)
Topographic Survey
Lump sum
400,000
Topgraphic Surey(flood Plains)
Lump sum
100,000
Additional Topogrpahic Surveys for ground control
Lump sum
300,000
Stereo image purchase and processing
Lump sum
75,000
875,000

7. Capacity Development – Training

Training Program- Details of Costs
Indicative Training Cost per participant
No of participants
No of courses Total Cost
Project Management & Monitoring 15000 10 2 300,000
IWRM concepts and practices 15000 15 3
675,000
DSS concept design and implementation 20000 5 1 100,000
Flood forecast and flood modelling 15000 4 2 120,000
Flood rescue, relief and rehabilitation, including estimating losses to assets 10000 15 2
300,000
ADB procurement procedures 10000 5 2 100,000
FIDIC style contract management 15000 20 1
300,000
Community engagement in resettlement 2000 100 2
400,000
Channel level stakeholder participation 500 200 6 600,000
Financial Management Systems and reporting 20000 6 1
120,000
Overseas training and exposure visits to best practice locations 300000 10 1
3,000,000
GIS applications and remote sensing 10000 5 1 50,000
IEE/EIA/Environment management related training 10000 5 2
100,000
Unallocated 2,235,000
Total 8,400,000
Cost includint taxes
9,438,240.00
Cost in Miln
9.4382
Or 0.94 Crore

8. Environmental Improvements and ResettlementCost
1. Resettlement Cost (Table enclosed) – Rs. 3.03 Crore 2. Environmental Management and Monitoring Cost (Table enclosed) – Rs. 2.45 Crore Total - Rs.5.48 Crore

Resettlement Costs
S No Description Unit Unit
Rate/(Rs) Quantity Total/(Rs)
1 Cost of Houses to Residential squatters requiring relocation
No 100,000 106 10,600,000
2 Cost of Land for resettlement site sq.m 945 2,275 2,149,748
3 Shifting assistance to Residential squatters requiring relocation
No 25,000 106 2,650,000
4 Subsistence allowance to Residential squatters requiring relocation @ Rs.3,000 p.m for 6 months
No 18,000 106 1,908,000
5 Replacement cost for cattle shed / shed for storage
No 15,000 97 1,455,000
6 Transitional allowance to commercial squatters requiring relocation @ Rs.3,000 p.m for 6 months
No 18,000 17 306,000
7 Shifting assistance to Commercial squatters requiring relocation
No 25,000 17 425,000
8 Replacement cost for commercial structures sq.m
17 2,380,000
Sub Total -A
21,873,748
9 NGO Support for RP implementation LS
2,500,000
10 External Monitoring LS
2,000,000
11 Disclosure / Consultations / Administrative Expenses
LS
1,200,000
Sub Total-B
5,700,000
12 Contingency @ 10% of Sub Total A+B
2,757,375
Total
30,331,123
or
3.03 Crore

Environmental management and monitoring costs
Item Quantity Unit Cost in INR
Total Cost in INR
Generation of Baseline Environmental parameters
Ambient Air Quality 10 location X 1 season X 3 samples each = 30 samples
15,000 450,000
Noise level 10 location X 1 season X 3 samples each = 30 samples
8,000 240,000
Surface Water 18 location X1 season 10,000 180,000
Ground Water 4 locations X 1 season 10,000 40,000
Trees marking and inventory
Sum 500,000
Sub-Total 1,370,000
Implementation of EMP
Ambient air quality during construction
10 location X 3 season X 3 years X 3 sampls each = 180 samples
15,000 4,050,000
Noise quality during construction
10 location X 3 season X 3 years X 3sampls each = 180 samples
8,000 2,160,000
Surface Water 18 location X3 season X 3 Years 10,000 1,620,000
Ground Water 4 Locations X 3 Season X 3 Years 10,000 360,000
Dust Suppression by sprinking of water
2 years 5,000 3,600,000
Physical fencing of stock piles of earth and silt at disposal site
lumpsum 1,000,000
Tree Plantation Compensatory Plantation of 16404 trees in ratio of 1:3 for felling of 5468 trees
350 5,741,400
Training (For WRD/PMU )
Sum - 1,000,000
Sub Total 19,171,400
Operation Stage
Ambient Air Qaulity during Operation Stage
10 location X 3 season X 1 years X 3 sampls each = 180 samples
15,000 1,350,000
Ambient Noise Level 10 location X 3 season X 1 years X 3sampls each = 180 samples
8,000 720,000
Surface Water 18 location X3 season X 1 Years 10,000 540,000
Sub Total 2,610,000
Total 23,151,400
Grand Total 24,521,400

9. Program Management Costs

PMU /PIU Addiitonal Adminstration Expenses
2. Building rentals, Utilities, Maintenance and Overheads
Item No of Months Cost/month Total Cost Total cost including taxes
Utilities and overheads 48 75,000 3,600,000 4,044,960
Vehicle running & maintenance 48 1,000,000 48,000,000 53,932,800
Miscellaneous 48 200,000 9,600,000 10,786,560
Total 61,200,000 68,764,320
or
6.88 Crore

10. Physical Contingencies

ABSTRACT FOR PHYSICAL CONTINGENCIES
Sl. No Name of River / Drain
Work Value / Contract
Value
Unf
ores
een
item
s (1
.04
%)
Pet
ty s
uper
visi
on c
harg
es &
co
ntin
genc
ies
(1.1
6 %
)
Remarks
1 Harichandranathi 21100.20 230.79 257.81
2 Adappar 14251.22 155.50 173.84
3 Pandavayar 8722.36 95.25 105.97
4 Vellaiyar 15775.53 169.04 188.75
5 Valavanar Drain 3497.50 37.99 42.70
6 Vedaranyam Canal 2551.92 28.02 30.62
7 Pumping Schemes -
13 Nos 1223.57 13.24 14.78
Sub-Total 67122.30 729.83 814.47
1 Unforcing Item = 729.83 Lakhs
2
PS Charges & Contingencies = 814.47 Lakhs
Total = 1544.30 Lakhs
or
15.44 Crore

11. Price Contingencies &
12. Interest

Project Cost for the Project by Expenditure Category
Description INR USD Million
Total 2015 2016 2017 2018 Total 2015 2016 2017 2018
I. Investment Costs
A) Civil Works 6,782.15
684.45
2,053.36
2,053.36
2,053.36
113.04
11.41
34.22
34.22
34.22
B) Mechanical and Equipment 62.38
6.24
28.20
34.44
1.04
0.10
0.47
0.57
-
C)Establishment and set up of PMU 154.06
106.06
48.00
2.57
1.77
0.80
-
-
D) Consulting Services -
-
-
-
-
a) Project Impementation and Monitoring
94.68
9.47
28.40
28.40
28.40
1.58
0.16
0.47
0.47
0.47
b) Follow on Project feasbility studies and survey works including environmental clearances
156.08
9.47
28.40
28.40
2.60
0.16
0.47
0.47
-
Sub- Total 250.76
18.94
56.81
56.81
28.40
4.18
0.32
0.95
0.95
0.47
E.DSS 19.20
-
9.60
9.60
-
0.32
-
0.16
0.16
-
F.Capacity Development- Training 9.44
0.94
4.72
3.78
-
0.16
0.02
0.08
0.06
-
G. Environment and Resettlement 54.79
54.79
-
-
-
0.91
0.91
-
-
-
H. Program Management Costs 68.76
6.88
20.63
20.63
20.63
1.15
0.11
0.34
0.34
0.34
Total Investment Costs 7,401.54
878.29
2,211.72
2,169.01
2,102.39
123.36
14.64
36.86
36.15
35.04
Total Base Line Costs 7,401.54
878.29
2,211.72
2,169.01
2,102.39
123.36
14.64
36.86
36.15
35.04
Physical Contingencies 154.43
15.44
46.33
46.33
46.33
2.57
0.26
0.77
0.77
0.77

Price Contingencies 1,301.03
64.35
300.79
415.48
521.20
21.68
1.07
5.01
6.92
8.69
Sub Total 1,455.46
79.79
347.12
461.81
567.53
24.26
1.33
5.79
7.70
9.46
Total Project Costs 8,857.00
958.09
2,558.84
2,630.82
2,669.92
147.62
15.97
42.65
43.85
44.50
Interest and Commitment charges during implementation
a) Interest 263.00
8.23
38.57
83.79
130.75
4.38
0.14
0.64
1.40
2.18
b)Commitment Charges -
-
-
-
-
Sub- Total 263.00
8.23
38.57
83.79
130.75
4.38
0.14
0.64
1.40
2.18
Total Project Cost to be financed 9,120.00
966.31
2,597.40
2,714.61
2,800.67
152.00
16.11
43.29
45.24
46.68
Funding required
ADB 70% 676.42
1,818.18
1,900.23
1,960.47
106.40
11.27
30.30
31.67
32.67
Government of Tamilnadu 30% 289.89
779.22
814.38
840.20
45.60
4.83
12.99
13.57
14.00
Total 100% 966.31
2,597.40
2,714.61
2,800.67
152.00
16.11
43.29
45.24
46.68
Interest during Construction period
Opening Balance 676.42
2,494.60
4,394.83
11.27
41.58
73.25
Disbursement during the year 676.42
1,818.18
1,900.23
1,960.47
106.40
11.27
30.30
31.67
32.67
Closing Balance 676.42
2,494.60
4,394.83
6,355.30
106.40
11.27
41.58
73.25
105.92
Average Balance 338.21
1,585.51
3,444.72
5,375.07
53.20
5.64
26.43
57.41
89.58
Interest 8.23
38.57
83.79
130.75
1.29
0.14
0.64
1.40
2.18
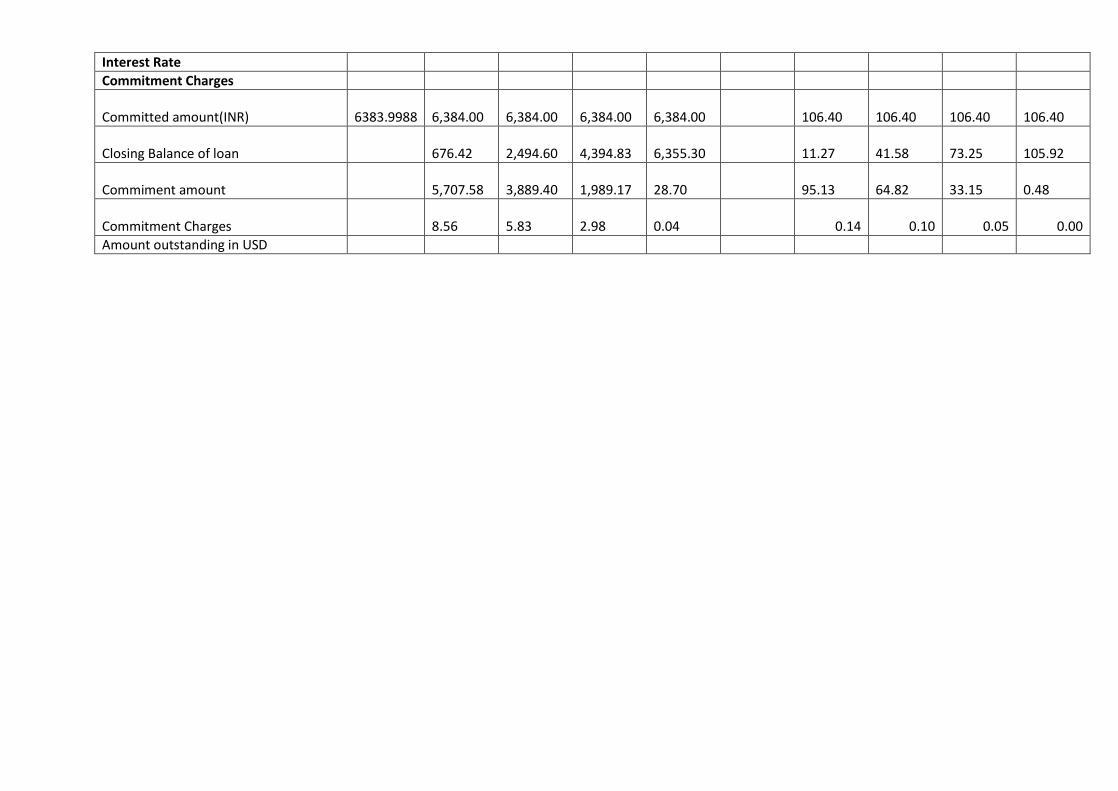
Interest Rate
Commitment Charges
Committed amount(INR) 6383.9988 6,384.00
6,384.00
6,384.00
6,384.00
106.40
106.40
106.40
106.40
Closing Balance of loan 676.42
2,494.60
4,394.83
6,355.30
11.27
41.58
73.25
105.92
Commiment amount 5,707.58
3,889.40
1,989.17
28.70
95.13
64.82
33.15
0.48
Commitment Charges 8.56
5.83
2.98
0.04 0.14 0.10 0.05 0.00
Amount outstanding in USD

Assmptions
Base Year 2014
Inflation and Exchange rates
Item 2014 2015 2016 2017 2018
Domestic Inflation* 7.50% 7.00% 6.50% 6.50%
Cumulative Inflation 7.50% 15.03
% 21.98% 28.90%
International Inflation* 0.30% 1.40% 1.50% 1.40%
Cumulative Inflation International 0.30% 1.70% 3.23% 4.65%
Differential inflation 7.20% 13.32
% 18.75% 24.26%
Exchange Rate** 60 64.32 67.99 71.25 74.55
* Source: ADB estimates
** Source: Economic Analysis
Intrest rate on Loan
Libor 5 year swap(***) 1.78%
Margin 0.50%
Maturity Premium 0.1525%
Total 2.4325%
Commitment charges 0.15%
Financing Plan
ADB 70.00%
GOTN 30.00%
Tax Rates Services 12.36%
Physical Contingency(only on Civil Works) 2.75%
Million 1,000,000
source: https://ycharts.com/indicators/5_year_swap_rate
***5 Year Swap Rate:
1.78% for Dec 30 2014

CASDP Assisted by ADB TOTAL ABSTRACT
Sl. No
Name of River / Drain
Work Value /
Contract Value
Res
ettl
emen
t C
harg
es
(0.5
0%)
Env
iron
men
tal I
mpr
ovem
ents
(0
.23
%)
Pay
men
t of
Con
trib
utio
n to
TN
la
bour
wel
fare
boa
rd @
0.9
3% o
n w
orks
Adv
erti
sem
ent
Cha
rges
(0
.05
%)
Pho
togr
aphi
c, V
ideo
gra
phic
&
Nam
e bo
ard
cha
rges
(0
.09
%)
Env
iron
men
tal C
lear
ance
(0
.21
%)
Shif
ting
of
Pow
er p
ost
&
tran
sfor
mer
(0.
14 %
)
Doc
umen
tati
on C
harg
es
(0.0
5 %
)
Mat
eria
ls T
esti
ng C
harg
es
(0.0
5 %
)
Tem
pora
ry b
uild
ing
char
ges
(
0.18
%)
Dew
ater
ing
and
dive
rsio
n w
orks
(0
.09
%)
Pro
cure
men
t of
Too
ls &
Pla
nts
(0.0
9%)
Unf
ores
een
item
s (1
.04
%)
Pet
ty s
uper
visi
on c
harg
es &
co
ntin
genc
ies
(1.1
6 %
)
Estimate Value in Lakhs
1 Harichandranathi 21100.2 98.50 76.70 206.38 10.3 20.60 47.50 30.87 10.30 10.30 41.15 20.60 20.60 230.79 257.81 22182.60
2 Adappar 14251.22 64.66 52.19 139.24 7.00 13.90 32.00 20.85 7.00 7.00 27.8 13.90 13.90 155.50 173.84 14980.00
3 Pandavayar 8722.36 41.62 32.34 85.2 4.20 8.50 19.58 12.76 4.20 4.20 17.02 8.50 8.50 95.25 105.97 9170.20
4 Vellaiyar 15775.53 71.20 56.4 151 7.50 15.06 34.63 22.62 7.50 7.50 30.15 15.06 15.06 169.04 188.75 16567.00
5 Valavanar Drain 3497.5 14.96 12.79 34 1.73 3.40 7.83 5.12 1.73 1.73 6.82 3.40 3.40 37.99 42.70 3675.10
6 Vedaranyam Canal 2551.92 12.06 9.78 24.5 1.25 2.50 5.72 3.73 1.25 1.25 5.00 2.50 2.50 28.02 30.62 2682.60
7 Pumping Schemes - 13 Nos
1223.57 4.7 11.4 0.60 1.20 2.74 1.79 0.60 0.60 2.38 1.20 1.20 13.24 14.78 1280.00
Sub-Total 67122.30 303.00 244.90 651.72 32.58 65.16 150.00 97.74 32.58 32.58 130.32 65.16 65.16 729.83 814.47 70537.50
8 Others 20662.50
Total 67122.30 303.00 244.90 651.72 32.58 65.16 150.00 97.74 32.58 32.58 130.32 65.16 65.16 729.83 814.47 91200.00