government of puerto rico department of labor …government of puerto rico department of labor and...
TRANSCRIPT

Government of Puerto RicoGovernment of Puerto Rico Department of Labor and Human ResourcesDepartment of Labor and Human Resources
Bureau of Labor StatisticsBureau of Labor Statistics
Honorable Miguel RomeroHonorable Miguel Romero SecretarySecretary

2
Table of Content
Page
I. Trends and Developments
A. Economic Overview 2
B. Labor Force Trends and Developments 8
Labor Force Statistics
Labor Force Participation Employment Unemployment Employment by Industry Wages
C. Other Indicators 17
Insured Unemployment Characteristics of the Insured Unemployed
Gender Age Industry
Price Index
II. Projections
Population 21 Federal Grants 25
III. Economic Perspectives 26

3
I. Trends and Development A. Economic Overview
Puerto Rico’s economy is currently in a recession that began in FY (fiscal year) 2006
(July 1st to June 30th), a FY in which the real gross national product grew by only 0.5%.
For FYs 2007 and 2008, the real gross national product contracted by 1.9% and 2.5%,
respectively. This contraction has continued into FY 2009, for which the Planning Board
expects a reduction of 5.5% in real gross national product. Although the economy of
Puerto Rico is closely linked to the United States economy, the Island’s current deep
recession preceded the economic recession on the US mainland by three years. Most
of the external factors that affect the Puerto Rico economy are determined by the
policies and performance of the mainland economy.
Figure 1Puerto Rico Gross National Product
Fiscal Years Years Constant Prices 1954 = 100
-5.5
1.5
-2.5
-1.9
0.5
1.9
2.7
2.1
-0.3
3.0
-6.0
-5.0
-4.0
-3.0
-2.0
-1.0
0.0
1.0
2.0
3.0
4.0
2000 2001 2002 2003 2004 2005 2006r 2007r 2008p 2009*
r = revisedp = preliminary* = project ed
The Planning Board’s preliminary reports on the performance of the Puerto Rico
economy for FY 2008 indicate that real gross national product decreased 2.5% (3.8% in
current dollars) over FY 2007. Nominal gross national product was $60,787.2 million in
FY 2008, compared to $58,563.0 million in FY 2007. At current prices, personal income
rose from $52,294.7 million in FY 2007 to $56,201.0 million in FY 2008. The personal
income per capita increased from $13,269 in FY 2007 to $14,237 in FY 2008 ($11,341
in 2000 prices). The significant increase in personal income in FY 2008 is due in part to
the tax rebate program implemented by the Bush Administration during that FY.

4
Table 1
Gross National Product – Current Prices
(millions dollars-fiscal years)
2007-2006 2008-2007 2009-2008 2007-2006 2008-2007 2009-2008
Gross Domestic Product 86,157.5 88,902.3 93,262.9 95,128.0 2,744.8 4,360.6 1,865.1 3.2 4.9 2.0
Gross National Product 56,732.3 58,563.1 60,787.2 60,605.0 1,830.8 2,224.1 -182.2 3.2 3.8 -0.3
Domestic Demand goods & services 72,200.8 74,501.9 76,055.5 75,912.0 2,301.1 1,553.6 -143.5 3.2 2.1 -0.2
Personal Income 50,842.3 52,294.7 56,201.4 55,855.0 1,452.4 3,906.7 -346.4 2.9 7.5 -0.6
Personal Consumption Expenditure 49,660.0 52,009.0 54,354.3 55,918.0 2,349.0 2,345.3 1,563.7 4.7 4.5 2.9
durable 5,650.2 5,652.7 5,564.5 n/a 2.5 -88.2 n/a 0 -1.6 n/a
non-durable 19,434.0 20,723.8 21,893.9 n/a 1,289.8 1,170.1 n/a 6.6 5.6 n/a
services 24,575.8 25,632.6 26,895.8 n/a 1,056.8 1,263.2 n/a 4.3 4.9 n/a
2006r 2007r AbsoluteChange
PercentageIndicator 2008p 2009*
Table 2 Gross National Product – Constant Prices
(million dollars-fiscal years)
2007-2006 2008-2007 2009-2008 2007-2006 2008-2007 2009-2008
Gross Domestic Product 11,073.2 10,920.0 10,770.0 10,487.0 -153.2 -150.0 -283.0 -1.4 -1.4 -2.6
Gross National Product 7,055.5 6,918.8 6,742.4 6,370.0 -136.7 -176.4 -372.4 -1.9 -2.5 -5.5
Domestic Demand goods & services 13,197.4 13,267.5 12,967.7 12,454.0 70.1 -299.8 -513.7 0.5 -2.3 -4.0
Personal Income 9,555.0 9,560.0 9,783.0 9,282.0 5.0 223.0 -501.0 0.1 2.3 -5.1
Personal Consumption Expenditure
9,333.0 9,507.5 9,461.4 9,283.0 174.5 -46.1 -178.4 1.9 -0.5 -1.9
durable 1,709.2 1,740.5 1,634.8 n/a 31.3 -105.7 n/a 1.8 -6.1 n/a
non-durable 3,578.4 3,716.3 3,693.9 n/a 137.9 -22.4 n/a 3.9 -0.6 n/a
services 4,045.4 4,050.8 4,132.7 n/a 5.4 81.9 n/a 0.1 2.0 n/a
PercentageIndicator 2006r 2007r 2008p 2009*
ChangeAbsolute
r = revised p = preliminary * = projected Source: Planning Board

5
Among the variables contributing to the decrease in gross national product were the
continuous contraction of the manufacturing and construction sectors, as well as the
current contraction of U.S. economic activity. The persistent high level of the price of oil
and its derivatives (such as gasoline) during that period served to reduce the income
available for other purchases and, thereby, negatively affected domestic demand. In
addition, the current difficulties associated with the financial crisis resulted in lower
short-term interest rates, but this did not translate into an improvement in the
construction sector.
Manufacturing is the largest sector of the Puerto Rico economy in terms of gross
domestic product. The Planning Board figures show that in FY 2008 manufacturing
generated $38,457.7 million, or 41.2%, of gross domestic product. In FY 2008, the 90%
of the total manufacturing in Puerto Rico was concentrated in two major industries,
pharmaceuticals and other chemical products, and machinery and metal products.
There are several reasons that explain this sector’s job shrinkage: the end of the phase-
out of Section 936 of the U.S. Code, the net loss of patents on certain pharmaceutical
products, the escalation of manufacturing production costs (particularly labor and
electricity), the increased use of job outsourcing, and, currently, the effects of the global
economic decline. Puerto Rico’s manufacturing sector is facing increased international
competition, and new ideas and initiatives are needed to improve it.
The service sector in Puerto Rico has expanded in terms of both income and
employment over the past decade, following the general trend of other industrialized
economies, but with differences on the magnitudes of those changes. During the period
between FYs 2004 and 2008, the payroll employment in this sector increased at an
average annual rate of 0.8%. In the Puerto Rico labor market, self-employment,
represents approximately 15% of total employment according to the Household Survey.
Most of the self-employment is concentrated in the service and construction sectors.
The service sector ranks second to manufacturing in its contribution to gross domestic
product, and it is the sector with the greatest employment. In FY 2008, the service
sector generated $37,068.4 million of gross domestic product, or 40% of the total.

6
During FY 2009, the number of persons registered in hotels and paradores was
1,935,733, a decrease of 5.4% over the same period of FY 2008. The occupancy rate in
hotels and paradores during FY 2009 was 63.2%. The number of non-resident tourists
registered in tourist hotels during FY 2009 drop by 4.3%. The daily average of rooms
available in hotels and paradores during FY 2009 increased by 1.6% compared to FY
2005.
In the past decade, the construction industry had made significant contributions to the
growth of economic activity due to its multiplier effect on the whole economy. During FY
2009, the total value of construction permits drop by 28.0% as compared to FY 2008,
total value of new housing units decreased by 48.6%, and the total sales of cement
decreased by 25.4% %, the largest decline during the last decade.
Puerto Rico is experiencing a fiscal crisis as a result of the structural imbalance
between recurring government revenues and expenses. The structural imbalance has
been exacerbated during FYs 2008 and 2009, with recurring government expenses
significantly higher than recurring revenues. The estimated structural deficit for FY 2009
is projected to be $3.2 billion. The new administration has developed a multi-year Fiscal
Stabilization and Economic Reconstruction Plan that seeks to achieve fiscal balance
and restore economic growth. The administration believes that fiscal stabilization is
central to safeguarding the Puerto Rico’s investment-grade credit rating and restoring
Puerto Rico’s economic growth and development. During the first quarter of 2009, the
Legislative Assembly enacted three bills providing for the implementation of this plan,
which is composed of two main elements: the Fiscal Stabilization Plan (the Fiscal Plan)
and the Economic Reconstruction Plan (the Economic Plan).
The Fiscal Plan, which is generally contained in Act No. 7 of March 9, 2009 (Act 7) and
includes operating expense-reduction measures, tax revenue enforcement measures,
tax increases, seeks to achieve budgetary balance on or before FY 2013, while
addressing expected fiscal deficits in the intervening years through the implementation
of a number of indicatives, including, (i) a $2 billion operating expense-reduction plan
during FY 2010, through government reorganization and reduction of operating
expenses, including payroll which is the main component of government expenditures;

7
(ii) a combination of temporary and permanent tax increases, coupled with additional tax
enforcement measures; (iii) a bond issuance program through Puerto Rico Sales Tax
Financing Corporation (COFINA, by its Spanish-language acronym).
The Fiscal Plan establishes a government-wide operating expense-reduction program
aimed at reducing payroll and other operating expenses by $2 billion. And will be
implemented in three phases: Phase I: Incentivized Voluntary Resignation and
Voluntary Permanent Workday Reduction Programs: The Incentivized Voluntary
Resignation Program offered public employees a compensation incentive based on the
time of service in the government and was available to public employees with 20 or
more years of service reducing two regular workday every month, which is equivalent to
approximately a 10% reduction; Phase II: Involuntary Layoff Plan: As provided in Act 7,
Phase II will go into effect if the objective of reducing $2 billion in expenses was not
achieved after implementation of Phase I and Phase III. Under Phase II, all employees
with non-permanent positions will be terminated. In addition, Phase II provides for one
or more rounds of involuntary layoffs and applies to all public employees unless
specifically excluded by Act 7; and, Phase III: Temporary Suspension of Certain
Provisions of Laws, Collective Bargaining Agreements, and Other Agreements: Imposes
a temporary freeze of salary increases and other economic benefits included in laws,
collective bargaining agreements for a period of two years.
The Fiscal Plan also seeks to increase tax revenues by implementing a more rigorous
and ongoing tax enforcement and compliance strategy. Specific tax enforcement
initiatives include: (i) enhancements to federal grants and fund receipts, (ii) stronger
collections and auditing efforts on Puerto Rico’s sales and use tax, and (iii) a voluntary
tax compliance program.
To balance the impact of the Fiscal Plan, the administration has developed an economic
reconstruction program to stimulate growth in the short term and lay the foundation for
long-term economic development. The Economic Plan consists of three main
components: (i) two economic stimulus programs, (ii) Public-Private Partnerships, and
(iii) a supplemental stimulus plan.

8
� Federal Stimulus Program: Puerto Rico expects to receive up to $5 billion in
stimulus funds from the American Recovery Act of 2009 (ARRA). The funds will be
distributed in four main categories: relief to individuals, budgetary and fiscal relief,
taxpayers’ relief, and capital improvements. In terms of government programs, the
Federal Stimulus allocates funds to education, agriculture and food assistance, health,
housing and urban development, labor, and transportation, among others.
� Local Stimulus Program: The administration has formulated the Local
Stimulus to supplement the Federal Stimulus and improve specific local challenges
associated with the local mortgage market, the availability of credit, and the
infrastructure and construction sectors. Despite the fact that the Local Stimulus amounts
to a $500 million investment by the government, it has been estimated that its effect will
be greater due to its loan-guarantee programs, which will be coordinated in
collaboration with commercial banks in Puerto Rico.
Public-Private Partnerships: For the present administration, the Public-Private
Partnerships (PPPs) represent an important tool for economic development. PPPs are
collaborations between government and non-governmental entities such as private-
sector, non-profit organizations, credit unions, and township corporations
(corporaciones municipales) to develop infrastructure projects, manage government
assets or provide services. The non-governmental partner takes on certain
responsibilities and risks related to the development of the project in exchange for
receiving the benefits of operating it.
Supplemental Stimulus Plan: The Economic Plan includes a Supplemental Stimulus
Plan, which will provide investment in strategic areas with the objective of laying the
foundations for long-term growth in Puerto Rico. Specifically, the Supplemental Stimulus
will target critical areas such as the banking system, key infrastructure projects, public
capital improvement programs, private-sector lending to specific industries, and the
export and research-and-development knowledge industries. The Supplemental
Stimulus will take into account the strategic needs that Puerto Rico must fulfill in order
to become a more competitive player in its region and in the global economy.

9
B. Labor Force Trends and Developments
1. Labor Force Statistics
Table 3
Employment Status of the Civilian Non-Institutional Population
Average Fiscal Years 2007 to 2009
(thousands of persons)
Civilian non-institutional population 3,057 3,036 3,001 21 35
Participation rate 1 44.1 45.1 47.0 -1.0 -1.9
Labor Force 1,349 1,368 1,409 -19 -41
Employment 1,168 1,218 1,263 -50 -45
Unemployment 181 151 147 30 4
Unemployment rate 2 13.4 11.0 10.4 2.4 0.6
2/ Percentage of unemployed persons in the labor force.
Net ChangeEmployment Status 2009 2008 200720082009
Source: Household Survey
1/ Percentage of the civilian population 16 years old and over in the labor force.
a. Labor Force Participation
The population constitutes a very important element of the economic development
dynamics. From a broad point of view, the human resources can be defined like
equivalent to the total population for his double nature as consumer population and as
producer of good and services.
The Household Survey is designed so that each person age 16 and over who is neither
in an institution (for example, correctional facilities and residential nursing and mental
health care facilities) nor on active duty in the Armed Forces is counted and classified in
only one group. The sum of the employed and the unemployed constitutes the civilian

10
labor force. Persons not in the labor force combined with those in the civilian labor force
constitute the civilian non-institutional population 16 years and over.
In Puerto Rico the non institutional population has increased consistently through the
decades. In FY 2009, it was estimated in 3,057,000 persons, representing a rise of
21,000 persons or 0.7%. During the last ten years this variable has showed an average
annual growth of 1.0%.
In FY 2009, the group not in the labor force represented 56% of the non institutional
population; this is a larger proportion than the labor force which represented 44%. The
labor force reflected a reduction of 1,400 persons in FY 2009. Since FY 2000 to FY
2009, the labor force has registered an increase of 0.4%. The present recessionary
period has had a negative impact on the workforce. The fall in the labor force caused a
decrease in the participation rate of 44.1%, representing a drop of 1.0 percentage points
compared with FY 2008 (45.1%).
The participation rate is an indicator of the propensity of the persons to participate in the
labor market. The FY 2009 registered the lowest point, 44.1% since FY 2000, 46.2%.
There is a relationship between the participation rate and the economic activity. Due to
various factors, among them, the flow for decades of federal incentives to the population
under different programs has affected the participation rate in the labor force.
There are some differences between the participation rate in the labor force of men and
women. In FY 2009 the rate for women diminished only by 0.4% and for men in 1.9%.
The male participation rate showed three sharp consecutive declines, from 59.2% in FY
2006 to 53.8% in FY 2009, the lowest male participation rate recorded in 45 years. The
female rate also declined in the last four fiscal years, from 38.5% in 2006 to 36.1% in
FY 2009. Some factors that can influence the behavior of the participation rate of
women are the changes in the civil status and the level of education.

11
b. Employment
In the Household Survey, people are considered employed if they did any work at all for
pay or profit during the surveyed week. This includes all part-time and temporary work,
as well as regular full-time, year-round employment. In FY 2009, the number of
employed persons reached a total of 1,168,000. According to the Survey, total
employment began to decline on a yearly basis in June 2006. The decrease registered in
June 2009 (93,300), represents 25 consecutive months showing a decline in employment.
The local economy has lost 94,700 employees in the last two years, 45,000 in FY 2008
and 49,300 in FY 2009. This figure represents a loss of 50,000 jobs over the year.
Another 95,000 jobs were lost over the two year period as compared to FY 2007.
Since FY 2000, the employment has increased annually at a rate of 0.2%, compared
with 2.1% registered in the last decade. Between FY 2006 and 2009, it showed a
reduction of 85,200.
c. Unemployment According to the Household Survey, persons are classified as unemployed if they do
not have a job, have actively looked for work in the prior 4 weeks, and are currently
available for work. In FY 2009, unemployment registered 181,000 or 30,000
jobseekers less than in 2008. However, the over two year’s comparison reveals a loss
of 34,000 job seekers when compared with FY 2009. The number of unemployed
began to increase on a year to year basis since July 2008 and has continued with this
trend for 12 consecutive months. This apparently descending unemployment trend is
supported by percent rates of 13.4% in 2009, 11.0% in 2008 and 10.4% in 2007. In
the period between FY 2006 and FY 2009, the unemployment rate has increased
annually at a rate of 1.7 percentage points.

12
Laja
s 40
.5
San
Ger
mán
43
.1
Agu
adill
a 41
.5
Agu
ada
44.7
42.8
Isab
ela
42.2
A
reci
bo
40.4
Utu
ado
34.0
Jayu
ya
33.4
Ponc
e 45
.8
Juan
a D
íaz
43.2
Coa
mo
39.7
Salin
as
37.3
36
.5
Río
G
rand
e 41
.5
Gua
yam
a 43
.7
San
Nag
uabo
40
.5
Adj
unta
s 37
.0
Cia
les
33.8
May
agüe
z 40
.3
Cab
o R
ojo
48.4
Lare
s 40
.4
San
Seba
stiá
n 41
.5
Moc
a 44
.8
Oro
covi
s 29
.1
Bar
ranq
uita
s
Aña
sco
Veg
a B
aja
41.5
Aib
onito
37
.5
Mar
icao
40
.0
Las M
aría
s 45
.8
Peñu
elas
41
.7
Vill
alba
40
.5
Cay
ey
42.9
Vie
ques
45.
2
Cul
ebra
50.5
41.3
44.1
Saba
na
Gra
nde
Yau
co
44.3
Guá
nica
37
.4
47.4
Hor
mig
uero
s
39.6
Cam
uy
41.4
Quebradillas
42.2 Barceloneta
Gua
yani
lla
38.8
33.0
Flor
ida
33.8
Sant
a
Isab
el
53.5
Rincón
Yab
ucoa
35
.4
Patil
las
39.9
Mor
ovis
38.2
40.6 Arroyo
Las
Hum
acao
43
.7
Pied
ras
Toa
Alta
48
.2
Bayamón 47.3
Cei
ba
42.9
Fajar
do
Hat
illo
38.1
Cag
uas
48.2
Agua
s 3
8.8
Buen
as
Gur
abo
46.6
Cid
ra
41.8
Com
erío
32
.5
46.5
Caro
lina
51.9
Toa
Baj
a 48
.5
41.0 Canóvanas
San
Juan
49
.6
Truj
illo
Alto
5
1.3
Cat
año
39.
8 Guaynabo 53.7
Junc
os
42.4
Vega
Al
ta
Cor
ozal
35
.4
Mau
nabo
35.0
Lo
íza
Lore
nzo
41.3
37.4
N
aran
jito
Man
atí
38.1
41.7
46.0
Luqu
illo
45.1
Dorado 45.8
25.0
- 34
.9
35.0
- 44
.9
45.0
- 55
.0
Sour
ce: L
AU
S P.
R.
Figu
re 2

13
Figu
re 3
-
Laja
s 16
.1
San
Ger
mán
15
.3
Agu
adill
a 14
.0
Agu
ada
14.7
14.4
Isab
ela
14.4
A
reci
bo
13.4
Utu
ado
20.3
Jayu
ya
17.7
Ponc
e 13
.0
Juan
a D
íaz
14.4
Coa
mo
18.6
Salin
as
19.2
23
.5
Río
G
rand
e 14
.9
Luqu
illo
17.0
Gua
yam
a 16
.4
San
Lor
Nag
uabo
20
.3
A
djun
tas
16.7
Cia
les
22.7
May
agüe
z 15
.1
Cab
o R
ojo
11.8
Lare
s 15
.9
San
Seba
stiá
n 15
.8
Moc
a 14
.1
Oro
covi
s 18
.6
Bar
ranq
uita
s
14.6
A
ñasc
o
Veg
a B
aja
15.7
Aib
onito
16
.5
Mar
icao
14
.8
Las M
aría
s 17
.4
Peñu
elas
17
.0
Vill
alba
17
.4
Cay
ey
15.3
Vie
ques
20.
5
Cul
ebra
10.9
13.
9
16.1
Sa
bana
G
rand
e
Yau
co
14.3
Guá
nica
16
.2
13.8
Hor
mig
uero
s
13.9
Cam
uy
12.5
Quebradillas
18.0 Barceloneta
Gua
yani
lla
17.7
14.7
Flor
ida
16.1
Sant
a
Isab
el
15.0
Rincón
Yab
ucoa
20
.8
Patil
las
18.8
Mor
ovis
18.4
.4
18.8 Arroyo
Las
Hum
acao
17
.2
Pied
ras
Toa
Alta
10
.4
Bayamón 11.0
Cei
ba
15.4
Faja
rdo
Hat
illo
13.9
Cag
uas
12.9
Agu
as 1
4.9
Bue
nas
Gur
abo
12.8
Cid
ra
14.0
Com
erío
18
.5
14.8
Car
olin
a 10
.5
Toa
Baj
a 11
.0
17.2 Canóvanas
San
Juan
9.
6
Tru
jillo
Alto
8.9
Cat
año
Guaynabo 8.3
Junc
os
15.4
Dor
ado
11.5
Veg
a A
lta
Cor
ozal
14
.7
Mau
nabo
17.9
Lo
íza
Lore
nzo
14.9
15.5
N
aran
jito
Man
atí
16.5
15.8
10.0%
- 19
.9%
0.0%
- 9.9
%
20.0%
- 30
.0%
-
Laja
s 16
.1
San
Ger
mán
15
.3
Agu
adill
a 14
.0
Agu
ada
14.7
14.4
Isab
ela
14.4
A
reci
bo
13.4
Utu
ado
20.3
Jayu
ya
17.7
Ponc
e 13
.0
Juan
a D
íaz
14.4
Coa
mo
18.6
Salin
as
19.2
23
.5
Río
G
rand
e 14
.9
Luqu
illo
17.0
Gua
yam
a 16
.4
San
Nag
uabo
20
.3
Adj
unta
s 16
.7
Cia
les
22.7
May
agüe
z 15
.1
Cab
o R
ojo
11.8
Lare
s 15
.9
San
Seba
stiá
n 15
.8
Moc
a 14
.1
Oro
covi
s 18
.6
Bar
ranq
uita
s
14.6
A
ñasc
o
Veg
a B
aja
15.7
Aib
onito
16
.5
Mar
icao
14
.8
Las M
aría
s 17
.4
Peñu
elas
17
.0
Vill
alba
17
.4
Cay
ey
15.3
Vie
ques
20.
5
Cul
ebra
10.9
13.
9
16.1
Sa
bana
G
rand
e
Yau
co
14.3
Guá
nica
16
.2
13.8
Hor
mig
uero
s
13.9
Cam
uy
12.5
Quebradillas
18.0 Barceloneta
Gua
yani
lla
17.7
14.7
Flor
ida
16.1
Sant
a
Isab
el
15.0
Rincón
Yab
ucoa
20
.8
Patil
las
18.8
Mor
ovis
18.4
18.8 Arroyo
Las
Hum
acao
17
.2
Pied
ras
Toa
Alta
10
.4
Bayamón
Cei
ba
15.4
Faja
rdo
Hat
illo
13.9
Cag
uas
12.9
Agu
as 1
4.9
Bue
nas
Gur
abo
12.8
Cid
ra
14.0
Com
erío
18
.5
14.8
Car
olin
a 10
.5
Toa
Baj
a 11
.0
17.2 Canóvanas
San
Juan
9.
6
Tru
jillo
Alto
8.9
Cat
año
Guaynabo 8.3
Junc
os
15.4
Dor
ado
11.5
Veg
a A
lta
Cor
ozal
14
.7
Mau
nabo
17.9
Lo
íza
Lore
nzo
14.9
15.5
N
aran
jito
Man
atí
16.5
15.8
10.0%
- 19
.9%
0.0%
- 9.9
%
20.0%
- 30
.0%
Sour
ce: L
AU
S P.
R.

14
d. Employment by Industry
The total non farm employment shows a decreasing pattern since 2007. The decline of
June 2009 represents the 35th consecutive monthly reduction. In FY 2009 according to
the Establishment Survey, the employment was 993,700, reflecting a decrease of 2.5%.
An over the year comparison reveals a 26,000 employees reduction. All of the industries
except Educational and Health Services and Government reported annual losses. The
largest job losses in FY 2009 were in, construction, 7,200; manufacturing, 6,400; trade,
transportation and utilities, 5,700; and professional and business services, 5,200. In
contrast, the government increased by 2,400 employees.
Table 4
Total Non Farm Employment in Puerto Rico
Fiscal Years 2007 to 2009
(In Thousands)
Total Non Farm 993.7 1,019.7 1,034.4 -2.5 -1.4
Mining, Logging and Construction 52.8 60.0 64.7 -12.0 -7.3
Manufacturing 97.8 104.2 107.9 -6.1 -3.4
Trade, Transportation and Utilities 176.1 181.8 184.0 -3.1 -1.2
Information 19.9 21.3 22.6 -6.6 -5.8
Financial Industries 45.5 48.1 49.1 -5.4 -2.0
Professional and Bussiness Services 103.5 108.7 108.8 -4.8 -0.1
Educational and Health Services 109.1 108.7 105.2 0.4 3.3
Leisure and Hospitality 73.0 73.8 73.6 -1.1 0.3
Other Services 15.9 17.4 18.2 -8.6 -4.4
Government 300.1 297.7 298.1 0.8 -0.1
Source: Current Employment Survey (CES).
2009
Net ChangeIndustrial Group2009 2008 2007 2008
The total employment showed an average decrease of 0.1% in this decade. Between
FY 2006 and FY 2009, the decline was of 55,600. There have been key changes in the

15
sector’s composition in the past years. Among them, the percentage representation of
the manufacturing sector from 18.0% in FY 1991 to 9.8% in FY 2009. During FY 2009,
payroll employment for the manufacturing sector was 97,800, a decrease of 6.1%
compared with FY 2008. The total employment in the manufacturing sector has
decreased by 10,100 from FY 2006 to FY 2009.
The payroll employment in the construction sector during FY 2009 was 52,800, a
reduction of 12.0% from FY 2008. In average terms, between FY 2006 and FY 2009
this employment decreased by 11,900. The percentage representation of the
construction sector in total employment, declined from 7.2% in FY 2002 to 5.3% in FY
2009.
The government sector of Puerto Rico plays an important role in the economy. In FY
2008, the government accounted for $8,762.2 million, or 9.4%, of Puerto Rico’s gross
domestic product. The Puerto Rico government is also a significant employer, providing
jobs for 285,400 workers (state and local), or 28.7% of total, non-farm, payroll
employment in FY 2009. From FY 2006 to FY 2009, the government employment
(states and local) has been reduced by approximately 2,300 positions. The percentage
representation of the government sector increase from 26.3% in FY 2000 to 28.7% in
FY 2009.
e. Wages In terms of employment and wages by major occupational group, the office and
administrative support occupational group had the highest employment coverage with
191,710 workers, which represent 19.2% of total employment. Management was the
occupational group with the highest mean and median wage per hour ($31.43 and
$25.96, respectively).
In 2008 the top ten (10) highest paying occupations were professional and managerial.
The highest mean wage was reached by chief executives with $51.05 per hour. Other
occupations with high mean wages per hour were: anesthesiologists with $50.53, and
engineering managers with $45.25.

16
The ten (10) occupations with the highest employment shows that retail salespersons
was the occupation with the highest employment with 42,470 workers (4.3% of total
employment). The mean wage for this occupation was $8.09 per hour.
The industrial groups and the percent of distribution they represent of total employment
shows that Services (including health and educational services) was the industrial group
with the highest employment: 362,660 (36.3%) workers. Public administration follows
with 219,930 workers; and wholesale and retail trade with 164,560. These three (3)
industrial groups combined represent 74.8% of total employment.
Respect to the ten (10) industries with the highest estimated employment, Public
administration was the industry with the highest number of workers with 219,930 that
represents 22.0% of total employment. Educational services; and Administrative and
support services follow with 87,310 (8.7%) and 65,870 (6.6%) workers, respectively.

17
Table 5
Employment and Wages by Wages by Mayor Occupational Group, 2008
Total Hourly Annual
Mean Mean
Totals 999,010 $11.85 $24,650
Office and administrative support 191,710 19.2 10.43 21,690Sales and related 108,140 10.8 9.75 20,270Production 80,150 8.0 9.95 20,690Education, training, and library 68,340 6.8 15.38 31,990Protective service 67,190 6.7 10.40 21,620Food preparation and serving related 67,140 6.7 7.47 15,540Construction and extraction 62,440 6.3 9.19 19,120Transportation and material moving 60,460 6.1 8.82 18,340Healthcare practitioners and technical 45,400 4.5 14.79 30,760Building and grounds cleaning and maintenance 44,990 4.5 7.91 16,440Retail salespersons 42,470 4.3 8.09 16,830Business and financial operations 42,310 4.2 16.56 34,440Management 35,740 3.6 31.43 65,370Installation, maintenance, and repair 34,580 3.5 12.35 25,700Security guards 31,350 3.1 7.62 15,840Janitors and cleaners, except maids and housekeeping cleaners 29,140 2.9 7.79 16,200Cashiers 28,900 2.9 7.04 14,650Office clerks, general 26,610 2.7 8.99 18,690Secretaries, except legal, medical, and executive 25,710 2.6 9.05 18,830
Source: Occupational Employment Survey (OES)
Wages
Percent
Distribution
Employment
Occupations
Table 6
Highest Paying Occupations, 2008
Occupation
Chief executives $51.05 $106,170 Anesthesiologists 50.53 105,100 Physicians and surgeons, all other 49.53 103,030 Engineering managers 45.25 94,120 Industrial production managers 44.66 92,890 Obstetricians and gynecologists 44.07 91,670 Dentists, general 43.77 91,040 Psychiatrists 43.72 90,930 Marketing managers 39.95 83,100 General and operations managers 39.90 82,980
Source: Occupational Employment Survey (OES)
Annual MeanHourly Mean

18
C. Other Indicators
1. Insured Unemployment
Table 7
Unemployment Insurance Benefits
Weeks Claimed 2,287,004 2,118,045 2,091,939
Claimants 547,470 411,772 461,017
Exhausters 48,438 46,820 46,920
2008 2007 2006Item
Source: B.L.S. – P.R. Department of Labor and Human Resources Research and Statistics Division www.ows.doleta.gov/unemploy/claimssum.asp
a. Characteristics of the Insured Unemployed
The increment in overall unemployment is reflected by the upward trend in total weeks
claimed since 2006 (2,091,939) to 2008 (2,287,004) weeks. The same pattern is
observed in the number of claimants registered climbing from 461,017 two years ago to
547,470 in 2008. The number of exhausters however, presented a contrasting pattern
as it declined from 46,920 in 2006 to 46,820 in 2007 and increased by 48,438 in year
2008. A sample averaging 46,072 unemployment insurance claimants during FY 2009
discloses the following industrial background and characteristics for the insured
unemployed.

19
Table 8 Characteristics of the Insured Unemployed
Puerto Rico
Fiscal Year 2008-2009
Gender and Age
Total 46,072 100.0
Male 25,968 56.4Female 20,104 43.6
Total 46,072 100.0
<22 2,495 5.422-24 4,451 9.725-34 15,212 3335-44 11,037 2445-54 8,070 17.555-59 2,638 5.760-64 1,527 3.3>65 642 1.4
Age
Average PercentGender
Source: B.L.S. – P.R. Department of Labor and Human Resources Research and Statistics Division
b. Gender
The gender distribution of the sample was 25,968 males or 56.4% and 20,104 females
or 43.6% of the total. This has been a consistent pattern for the past years as the
number of unemployed men collecting unemployment insurance benefits is usually
higher than for women.
c. Age In relation to age of both sexes, persons between 25 to 34 years comprised the most
significant group with an average of 33.0% for the PY 2008-09. It was followed by the

20
age cohort between 35 to 44 years representing 24.0% of all claimants. The group with
the smallest representation was 65 years or more with 1.4%.
d. Industry
The industry reporting the greatest workers loss was Services, as it holds 22.5% of all
claimants in FY 2009. In Services category, restaurants and entertainment declined as
people reduce leisure activities from their immediate priorities. Trade industry was
second with 16.6% of all unemployed claimants. Auto Dealers (trade) are facing a
reduction in sales as a result of the economic slowdown. Both industries are
characterized by a high labor turnover, entry level positions and low pay jobs. These
industries are highly vulnerable to economic changes. Manufacturing recorded an
11.8% of the total claimants. The 14.2% in the construction industry is typical since this
industry lays off workers as it moves from one building phase to another.
Figure 4
Characteristic of the Insured Unemployed Industrial Category
Puerto RicoFiscal Year 2008-2009
Percent
Others1.6%
Local Government11.5%
Information Not Available*
16.4%Agriculture & Mining
0.2%Construction
14.2%Manufacturing
11.8%
Utilities2.3%
Services22.5%
Finance, Insurance & Real Estates
2.8%
Trade16.6%
Source: Current Employment Survey
P.R. Department of Labor and Human Resources
21
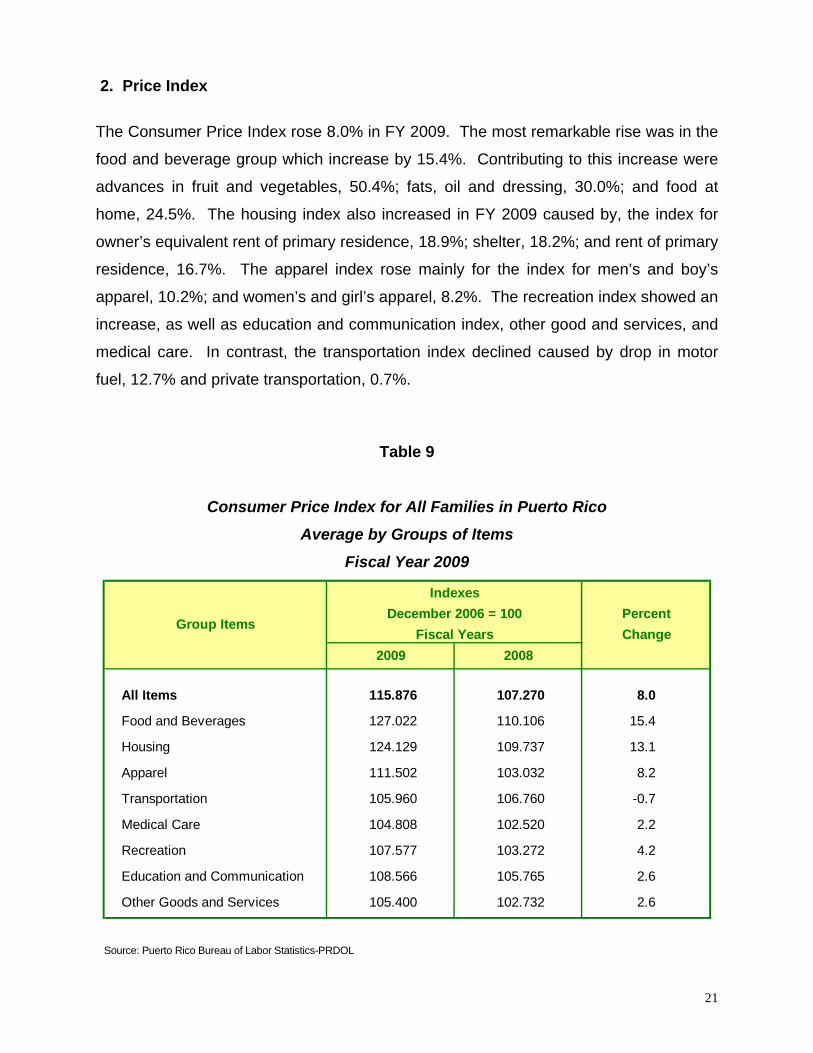
2. Price Index The Consumer Price Index rose 8.0% in FY 2009. The most remarkable rise was in the
food and beverage group which increase by 15.4%. Contributing to this increase were
advances in fruit and vegetables, 50.4%; fats, oil and dressing, 30.0%; and food at
home, 24.5%. The housing index also increased in FY 2009 caused by, the index for
owner’s equivalent rent of primary residence, 18.9%; shelter, 18.2%; and rent of primary
residence, 16.7%. The apparel index rose mainly for the index for men’s and boy’s
apparel, 10.2%; and women’s and girl’s apparel, 8.2%. The recreation index showed an
increase, as well as education and communication index, other good and services, and
medical care. In contrast, the transportation index declined caused by drop in motor
fuel, 12.7% and private transportation, 0.7%.
Table 9
Consumer Price Index for All Families in Puerto Rico
Average by Groups of Items
Fiscal Year 2009
All Items 115.876 107.270 8.0
Food and Beverages 127.022 110.106 15.4
Housing 124.129 109.737 13.1
Apparel 111.502 103.032 8.2
Transportation 105.960 106.760 -0.7
Medical Care 104.808 102.520 2.2
Recreation 107.577 103.272 4.2
Education and Communication 108.566 105.765 2.6
Other Goods and Services 105.400 102.732 2.6
2009
PercentChange
2008Fiscal Years
December 2006 = 100Indexes
Group Items
Source: Puerto Rico Bureau of Labor Statistics-PRDOL

22
II. Projections 1. Population
Activity in a market economy is highly determined by population change. Puerto Rico’s
future economic development depends on the population’s participation in the labor force
during the coming years. Population projections for the 2005 to 2025 period indicate
labor shortages over the next lustrums as a slow overall growth rate is expected.
This reduced rhythm of expansion is reflected by declining percentage rates from 11.0%
in 2010 to 1.8% in 2015, 1.3% in 2020 and 0.7% in 2025. This decline in population could
mean shortage of human capital in some occupational areas.
Contrary to the overall declining trend is the expansion rate of the aging population. In
fact, the Islands’ population is growing older. This trend is supported by statistics showing
an increase of persons 50 years and over which in 2005 presented an increase of
11.8% over year 2000. This expansion is expected to continue all the way trough year
2025, the last projected lustrum.
As the baby boomers cohort ages, and the number of younger individuals decreases, a
shortage of skilled labor will likely surface.

23
Figure 5
Distribution by Age and Sex 2000, 2008
0
50,000
100,000
150,000
200,000
250,000
300,000
350,000
Under5
years
5 to 14years
15 to24
years
25 to34
years
35 to44
years
45 to54
years
55 to64
years
65 to74
years
75 to84
years
85yearsandover
2008 Male2008 Female 2000 Male 2000 Female
Source: Populat ion Division U.S. Census Bureau
A study conducted by the AARP office in Puerto Rico (2009) indicates that the
biggest challenge facing Puerto Rico employers will be retaining and recruiting skilled
and qualified employees.
An important finding is that seven in ten (69%) Puerto Rican workers indicate it is likely
that they will put off complete retirement. The concept of traditional retirement seems to
be fading as workers 55 years old and over expect to work at their current jobs as long as
possible or as a consultant on as needed basis. Others anticipate working part time.
This trend will help lessen, to a certain degree, the effect of scarcity of skill workers.
Nonetheless, the economy will require a skilled labor force and sufficient jobs to prevent
further instability.

24
Table 10
Puerto Rico
Population Projections
Age 15 – 29
Years 2000 – 2025
Census
2000 2005 2010 2015 2020 2025
Total 919,725 895,841 888,436 869,264 853,703 834,845
15 - 19 313,436 304,610 300,894 288,586 286,644 270,425
20 - 24 301,191 305,098 297,380 295,141 283,186 284,719
25 - 29 305,098 286,133 290,162 285,537 283,873 279,701
2005 2010 2015 2020 2025
15 - 19 -8,826 -12,542 -24,850 -26,792 -43,011
20 - 24 3,907 -3,811 -6,050 -18,005 -16,472
25 - 29 -18,965 -14,936 -19,561 -21,225 -25,397
2005 2010 2015 2020 2025
15 - 19 -2.8% -4.0% -7.9% -8.5% -13.7%
20 - 24 1.3% -1.3% -2.0% -6.0% -5.5%
25 - 29 -6.2% -4.9% -6.4% -7.0% -8.3%
Source: Puerto Rico Planning Board Bureau Labor Statistics
Per Cent Change 2000 to:
AgeProjection to July 1
Net Change 2000 to:

25
Table 11
Puerto Rico
Population Projections
Years 2000-2025
Census
2000 2005 2010 2015 2020 2025
0-4 295,406 293,461 276,225 270,312 266,094 261,872
5-9 305,162 291,095 289,192 273,103 267,591 264,511
10-14 305,800 301,449 289,111 287,266 271,519 266,058
15-19 313,436 304,610 300,894 288,586 286,644 270,425
20-24 301,191 305,098 297,380 295,141 283,186 284,719
25-29 305,098 286,133 290,162 285,537 283,873 279,701
30-34 262,825 259,717 273,220 279,364 275,903 279,210
35-39 264,849 256,453 254,505 267,677 274,330 271,365
40-44 250,814 260,945 253,792 251,730 264,577 269,842
45-49 233,120 248,033 257,981 250,739 248,698 259,565
50-54 229,916 231,111 245,546 254,722 247,610 242,953
55-59 188,883 225,516 227,047 240,477 249,454 239,744
60-64 160,564 184,925 218,413 219,151 232,106 237,823
65-69 134,281 153,636 175,868 206,786 207,404 216,276
70-74 106,670 122,304 139,706 159,597 187,619 186,181
75 and over 184,186 205,399 233,404 265,454 302,683 346,832
Total 3,842,201 3,929,885 4,022,446 4,095,642 4,149,291 4,177,077
Change 3.2% 11.0% 1.8% 1.3% 0.7%
50-54 229,916 231,111 245,546 254,722 247,610 242,953
55-59 188,883 225,516 227,047 240,477 249,454 239,744
60-64 160,564 184,925 218,413 219,151 232,106 237,823
65-69 134,281 153,636 175,868 206,786 207,404 216,276
70-74 106,670 122,304 130,706 159,597 187,619 186,181
75 and over 184,186 205,399 233,404 265,454 302,683 346,832
Total 1,004,500 1,122,891 1,230,984 1,346,187 1,426,876 1,469,809
Change 11.8% 10.4% 8.6% 6.0% 3.0%
Source: Puerto Rico Planning Board Bureau Labor Statistics
AgeProjection to July 1 rst.

26
2. Federal Grants
Puerto Rico receives grants under numerous federal programs. Federal grants to agencies
and instrumentalities of the Commonwealth government are estimated in $5.750 billion for
fiscal year 2010, an increase of $1.097 billion, or 23.5%, from fiscal year 2009. The following
table presents revenues from federal grants by broad program areas, registered in the
central accounting system of the Puerto Rico Department of the Treasury. The figures for
fiscal years 2006 through 2008 are actual figures, for fiscal year 2009 are estimates based
on the information submitted by each agency to Office of Management and Budget (OMB),
and the figures for fiscal year 2010 are the amounts included in the recommended budget.
Puerto Rico expects to receive approximately $5 billion in stimulus funds from ARRA, of which
$229.6 million and $1.332 billion are expected to be received by the government during fiscal
years 2009 and 2010, respectively. Such amounts are reflected in the table below.
Table 12
The Commonwealth of Puerto Rico Federal Grants* (in thousands)
Items 2006 2007 2008 2009(1) 2010(2) Education $1,004,138 $986,574 $992,087 $1,050,756 $1,789,484Social Services 1,888,150 1,923,845 2,054,897 2,206,944 2,452,216 Health 432,868 436,892 465,466 539,633 545,405 Labor and Human Resources(3) 197,296 183,228 140,186 216,809 224,302 Crime 41,461 29,631 20,319 28,394 58,158
Housing(4) 371,104 375,581 363,589 490,852 504,955 Drug and Justice 36,979 35,321 19,394 37,164 46,200
Agriculture and Natural Resources 11,402 12,484 11,054 17,867 45,198 Contributions to Municipalities 53,744 48,531 49,543 48,414 60,495 Other 18,251 17,095 15,782 16,422 23,760
Total $4,055,393 $4,049,182 $4,132,317 $4,653,255 $5,750,173 * Does not include grants received by agencies whose accounting systems are not centralized in the Treasury. (1) Approved budget. (2) Estimated. (3) Amounts include grants to the Right to Work Administration and the Occupational Development and Human Resources Council. (4) Amounts include grants to the Public Housing Administration. Source: Office of Management and Budget

27
III. Economic Perspectives
Strategic Model for a New Economy
The new administration took office on January 2009. Since then it has formulated a
vision for Puerto Rico and a strategic model to reach its Plan for the Strategic
Sustainable Development of Puerto Rico (“PIDES”, for its acronym in Spanish), Tools of
Sustainable Strategic Action and Coordination (“HACES” for its acronym in Spanish)
Economic Development Infrastructure Development Social Development Strategic
Model for a New Economy *VisionAction*. As part of developing PIDES, 52 round
table meetings and 6 public hearings were held throughout the Island. Its Spanish
acronym is MENE = Modelo Estratégico para la Nueva Economía.
Restoring economic growth is based on the effective implementation of short-term
stimuli and the long-term development of the productive base. The goals of this
Strategic Model are:
•GROWTH: To achieve Real GNP growth of 1.8% by 2013 and 3.0 % by 2017.
•COMPETTITIVENESS: To raise the credit rating of General Obligation debt to “A” and
our global ranking in the World Economic Forum to 25 by 2017.
•JOBS: To reduce the unemployment rate to 12.7% by 2013 and 10% by 2017 by
creating 125,000 new jobs by 2013 and a total of 260,000 jobs by 2017.
Restoring economic growth is based on the effective implementation of short term
stimuli and the long term development of the productive base. Long and short term
measures for all sectors:
Short Term Growth Measures Federal Stimulus Plan (ARRA)
• Objective: Invest a total of $6,044 million into the Puerto Rico economy, of which 14%
have been disbursed and will create 42,065 jobs in the next two years.

28
Local Stimulus Plan (PEC)
• Objective: Invest $500 million in stimuli at the local level of which approximately $100
million are in the process of being disbursed.
Long Term Growth Measures for all sectors Integration into the Global Economy
• Objective: Foster the development and strengthening of local companies capable of
exporting competitive goods and services.
Transition to a Knowledge based Economy
• Objective: Leverage the industrial base to create new jobs and businesses by creating
new clusters and consortia with a focus on innovation.
The strategic model includes fostering strategic sectors, emphasizing competitiveness
and sustainable growth:
Focus on strategic sectors that will enhance production capacity Tourism and Entertainment
• Objective: To retain, expand and diversify the current industrial base and attract
manufacturing of high-value products based on R&D and high tech.
Manufacturing
• Objective: To foster a strong and healthy financial system in order to ease the efficient
flow of capital in the economy.
Banking, Insurance and Credit Unions
• Objective: To develop new and attractive offers in order to retain and attract new
tourist segments.
Agriculture
• Objective: To foster entrepreneurship and improve the value proposition for the
consumer by emphasizing diversification and competition.

29
Commerce
• Objective: To develop an entrepreneurial and hard working culture that is based on
quality and competitiveness, and to maximize the yield of soils of high agricultural
potential.
Film and Creative Services
• Objective: To develop a film and creative services industry that is financially viable in
the long-term.
Strategic projects will generate investments in all the regions of the Island to foster
balanced economic development.
Strategic investments in infrastructure will expand the Island’s productive capacity
• Objective: The redevelopment of areas of Old San Juan, Puerta de Tierra, Isla
Grande, the Convention District and Condado, among others ($1,538 million / 24,685
jobs).
Golden Triangle
• Objective: To develop a tourism complex, related to the concept of destinations of
entertainment and gambling ($1,900 million / 30,495 jobs).
Caribbean Riviera
• Objective: To create a district to position Puerto Rico at the forefront of the science,
technology and R&D industries ($1,765 million / 28,328 jobs).
Science City
• Objective: To create an international trans-shipment port of global caliber with value-
added zones in the southern region of Puerto Rico ($750 million / 12,038 jobs).

30
Aguadilla Airport
• Objective: To redevelop the Aguadilla airport as the second most important
international airport of P.R. and as a regional logistical center ($21.8 million / 350
jobs).
Mayagüez 2010
• Objective: To develop the infrastructure to hold the XXI Central American and
Caribbean Games in the summer of 2010 ($332 million / 5,329 jobs).
Table 13
Objectives and Indicators in the mid-and long-term (4 and 8 years, respectively)
IInnddiiccaattoorr
AAccttuuaall
22001133
22001177
GROWTH
Economic Activity Index 133.9 145.1 160.5
GNP Annual Growth Rate (5.5 %) 1.8 % 3.0 %
Participation Rate 44.1 % 45.6 % 48 %
Unemployment Rate 15.8 % 12.7 % 10 %
New Jobs (Accumulative since August 2009) --- 125,000 260,000
Internet Users per each 100 Individuals 37.5 60 80
Budget Surplus / (Deficit) ($3,200 MM)
-balanced - -balanced -
INFRASTRUCTURE
# of PPP Projects (Accumulative) --- 13 21
Private Investment in PPPs (Accumulative) --- $4,537 MM $6,214 MM
% of Energy Dependence on Oil-based Sources 68 % 55 % 32 %
% of Energy Dependence on Renewable Sources 0.7 % 6 % 13 %
COMPETITIVENESS
Central Government Credit Ranking BBB- BBB+ A
Competitiveness Ranking (WEF) 42 35 25
Energy Price (cents/kWh)* 21.52 18 14
Source WWW.BGFPR.com

31
Conclusion: Growth, Competitiveness and Jobs
This Strategic Model establishes the measures to reactivate the economy in the short-
term, while creating the foundations to rebuild the Puerto Rico’s economy in the long-
term.
Achievement of Growth, Competitiveness and Jobs by:
• Re-igniting existing industries
• Attracting and creating new industries and jobs
• Developing world-class infrastructure projects
• Implementing institutional reforms that make us more competitive
• This model establishes a clear implementation strategy with defined Performance
Metrics and with a Steering Committee to ensure compliance and results
• The collaboration of all the sectors of the economy and all Puerto Ricans is an
integral component of the success of this Strategic Model.
Green Jobs Profile Recently, the US Department of Labor (DOL) published the availability of funds
providing incentives for job creation and training for activities geared to reduce
dependency on fossil fuels and lowering the effect on green house gas emissions under
President Obama’s Green Jobs initiative. Puerto Rico is being affected by both, high
energy production costs and a deteriorating environmental quality. Aware of this
situation, Puerto Rico needs external funding to obtain the statistical and research
information necessary for the decision making process in the development of the green
industry. This will require the integration of the different sources or data bases within the
Puerto Rico Department of Labor (PRDOL) and its partners, to create the products that
will provide the market and the general public with the information for development
activities and career decision process. Federal funds are also needed to develop and

32
modify the existing information systems, to gather Green Jobs data and comply with the
initiative requirements.
An information system will allow the development of the activities that will enhance the
feasibility of the green jobs industry. With federal funds, the PRDOL, as a single State
applicant, will be able to identify green activity characteristics and develop the
mechanisms for its conversion to a solid and effective workforce. The objectives and
needs to be addressed by the proposed information system are:
• Develop a “Green Economy” Industry Profile and roadmap to support planning and
development process
• Research and identification of human resources and capabilities needed for target
industries
• Identify the industry’s educational and skill requirements from private, public,
community, and non-profit organization initiatives and research
• Transitional requirements needed in declining industries to emerging industries
• Coordination with educational institutions for curriculum development
• Information leading to the reduction of production cost alternative
• Promote a fertile environment for target industries by providing the necessary
regional and state information thus increasing its feasibility
• Identify green jobs creation potential in the target industries
• Identify renewable energy sources to reduce dependency on fossil fuels
• Competitiveness and innovation create industry clusters through the supply chain
required for its sustainability; identify and develop profile of supply chain for each
industry
• Develop incumbent worker training and employment
• Diversify the employment ladder
• Align of information systems within different agency components of the PRDOL
The policy framework for the selection of these industries include: The Puerto Rico
Energy Policy Act of 1993, currently under revision by the Governor’s Administrative
Order No. OE-2009-23 of July 2009, and the Governor’s Assurance for the ARRA State

33
Energy Plan. The table below presents the specific energy efficiency and renewable
energy industries and occupations identified as target “green” industries for this project.
The main occupations are presented in three main categories:
Table 14
Professional Skilled Unskilled Energy Efficient building construction and retrofit industries · Engineers · Electricians · Electric, Plumbing Assistants
· Architects · Plumbers · Handyman· Auditors · A/C Technicians · Installers· Inspectors · Assemblers · Masons· Managers · Mechanics · Roofers· Contractors · Contractors · General Construction Workers
· Maintenance Workers
Renewable Electric Power Industry · Engineers · Electricians · Electric, Plumbing Assistants· Scientist · Assemblers · Handyman· Auditors · Mechanics · Installers· Inspectors · Contractors · General Construction Workers· Managers · Maintenance Workers· Contractors
Biofuels Industry · Engineers · Assemblers · Agricultural Workers· Scientist · Mechanics · Maintenance & Repair Workers · Auditors · Operators · Transportation and Distribution· Inspectors · Distributors · Plant Operators· Managers
Energy Efficiency Assessment Serving Residential, Commercial or Industrial Sectors · Engineers · Contractors · Helpers-Installation, Maintenance
and Repair Workers· Architects · Technicians· Scientist· Auditors· Inspectors· Managers· Consultants
Main OccupationsIndustries

34
NOTES
1. The picture of the Golden Triangle that appears in the front page was obtained
from The Caribbean Business newspaper.
2. Parts of the Economic Overview were extracted from the 2009 Financial
Information and Operating Data Report on the Puerto Rico Government
Development Bank (www.bgfpr.com).
3. For more information about the Strategic Model for a New Economy please
access www.bgfpr.com.

35
Hon. Miguel Romero Secretary of Labor
Elvira M. Cancio
Deputy Secretary of Labor
Neida Abraham Lourido Assistant Secretary for
Planning and Federal Affairs
Elda Ivelisse Parés Rosado
Director Bureau of Labor Statistics
Fernando Alverio Díaz
Supervisor Research and Statistics Division
Bureau of Labor Statistics 17 Floor Prudencio Rivera Martínez Building
505 Muñoz Rivera Ave. Phone: 787-754-5300
Fax: 787-772-9439