government of liberia - amazon s3 · government of liberia ... the general public outlining the...
TRANSCRIPT
GOVERNMENT OF LIBERIA
ANNUAL FISCAL OUTTURN REPORT
FISCAL YEAR 2014/2015
JULY 1, 2014 – June 30, 2015
MINISTRY OF FINANCE & DEVELOPMENT PLANNING
September 2015
FY2014/15 2
Annual Fiscal Outturn I Ministry of Finance & Development Planning
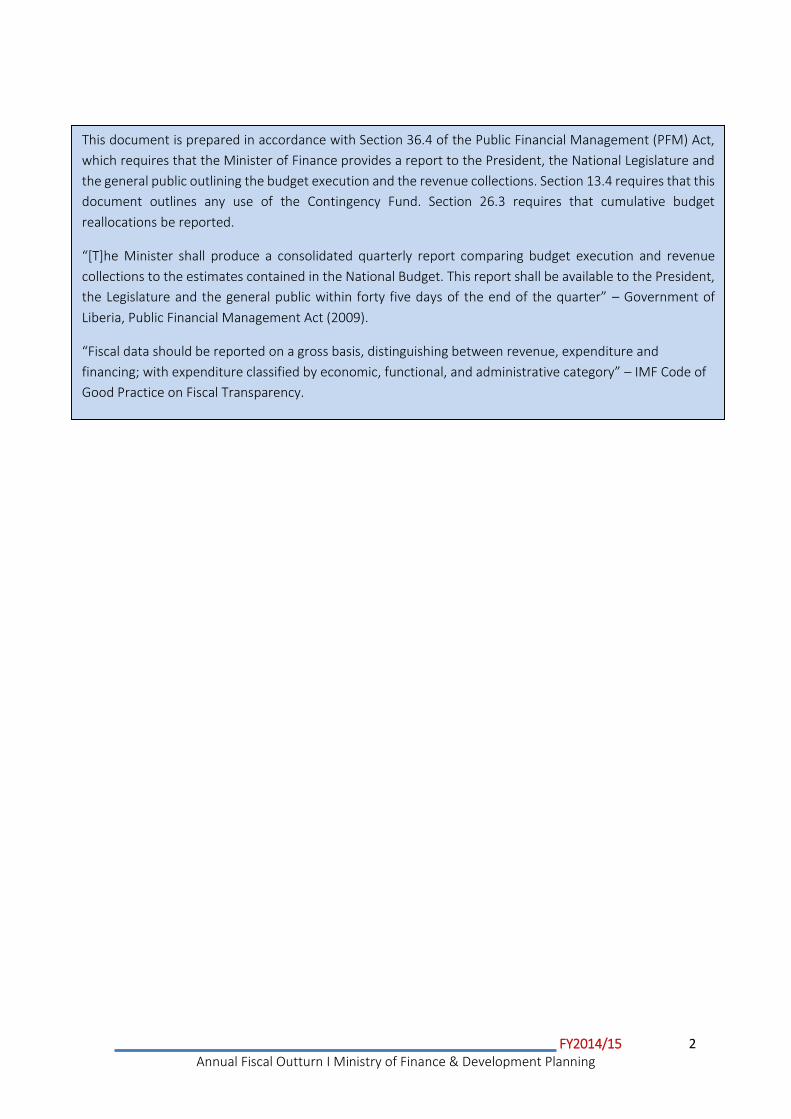
This document is prepared in accordance with Section 36.4 of the Public Financial Management (PFM) Act,
which requires that the Minister of Finance provides a report to the President, the National Legislature and
the general public outlining the budget execution and the revenue collections. Section 13.4 requires that this
document outlines any use of the Contingency Fund. Section 26.3 requires that cumulative budget
reallocations be reported.
“[T]he Minister shall produce a consolidated quarterly report comparing budget execution and revenue
collections to the estimates contained in the National Budget. This report shall be available to the President,
the Legislature and the general public within forty five days of the end of the quarter” – Government of
Liberia, Public Financial Management Act (2009).
“Fiscal data should be reported on a gross basis, distinguishing between revenue, expenditure and
financing; with expenditure classified by economic, functional, and administrative category” – IMF Code of
Good Practice on Fiscal Transparency.
FY2014/15 3
Annual Fiscal Outturn I Ministry of Finance & Development Planning
Contents
ACRONYMS .............................................................................................................................................. 5
DEFINITIONS ............................................................................................................................................ 6
EXECUTIVE SUMMARY ............................................................................................................................. 7
SECTION 1: MACROECONOMIC DEVELOPMENTS.................................................................................... 8
SECTION 2: BUDGET FY 2014/15 ............................................................................................................. 8
Public Sector Investment Program ...................................................................................................... 9
Stages of the MTEF Budget Process .................................................................................................. 10
Fiscal Measures ................................................................................................................................. 10
MTEF Budget Sectors ........................................................................................................................ 11
FY 2014/15 Appropriations ............................................................................................................... 11
SECTION 3: OUTTURN AND DEVELOPMENTS ........................................................................................ 13
Government Finance Statistics (GFS) ................................................................................................ 14
Flow of Funds .................................................................................................................................... 14
Revenue............................................................................................................................................. 15
Tax Expenditures ............................................................................................................................... 16
Financing ........................................................................................................................................... 17
Allotments ......................................................................................................................................... 18
Commitments .................................................................................................................................... 19
Budget Execution .............................................................................................................................. 20
Public Debt ........................................................................................................................................ 22
SECTION 4: PROSPECTS AND CHALLENGES ........................................................................................... 23
Table 1: Budgetary Appropriation - FY2014/15 (millions USD).............................................................. 12
Table 2: GFS Table, July 1, 2014 - June 30, 2015 (millions USD) ............................................................ 14
Table 3: Flow of Funds (July 1, 2014 – June 30, 2015) (millions USD) ................................................... 15
Table 4: Revenue Performance (July 1 2014 – June 30, 2015) (millions USD) ....................................... 16
Table 5: Tax Expenditure Summary (July 1, 2014 – June 30, 2015) (millions USD) ................................ 17
Table 6: FY2014/15 Aid Disbursement by Sectors (July 1, 2014 - June 30, 2015) ................................. 17
Table 7: Aid Disbursement by Development Partners (July 1, 2014 - June 30, 2015) ........................... 18
Table 8: Budgetary Allotment (July 1, 2014 – June 30, 2015) (millions USD) ........................................ 19
Table 9: Commitment (July 1, 2014 – June 30, 2015) (millions USD) .................................................... 19
Table 10: Summary of Budget Execution (July 1, 2014 – June 30, 2015) (millions USD) ....................... 20
Table 11: Summary of Percentage Budget Execution (July 1, 2014 – June 30, 2015) ........................... 21
Table 12: Public Debt Stock as at end-June 2015 .................................................................................. 22
Table 13: Public Debt Service as at end-June 2015 ............................................................................... 22
FY2014/15 4
Annual Fiscal Outturn I Ministry of Finance & Development Planning
Figure 1: Comparative Analysis of Budgetary Appropriation for FY2013/14 and FY2014/15 ................ 13
FY2014/15 5
Annual Fiscal Outturn I Ministry of Finance & Development Planning
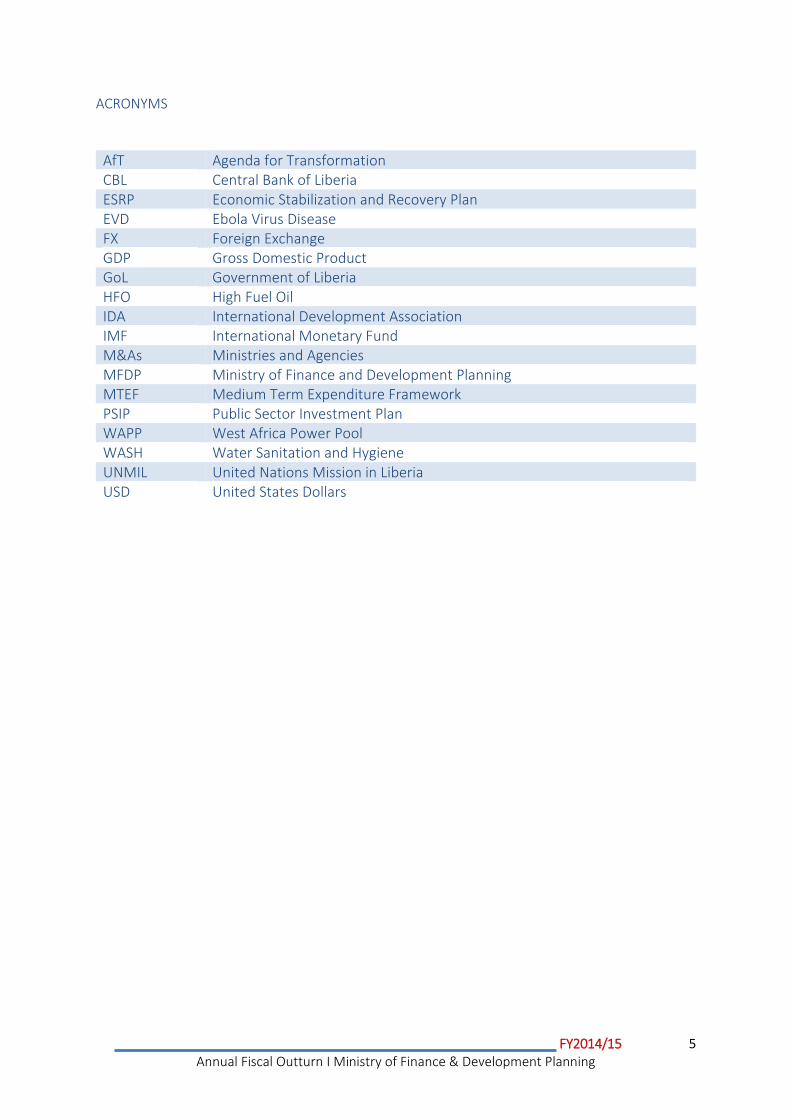
ACRONYMS
AfT Agenda for Transformation CBL Central Bank of Liberia ESRP Economic Stabilization and Recovery Plan EVD Ebola Virus Disease FX Foreign Exchange GDP Gross Domestic Product GoL Government of Liberia HFO High Fuel Oil IDA International Development Association IMF International Monetary Fund M&As Ministries and Agencies MFDP Ministry of Finance and Development Planning MTEF Medium Term Expenditure Framework PSIP Public Sector Investment Plan WAPP West Africa Power Pool WASH Water Sanitation and Hygiene UNMIL United Nations Mission in Liberia USD United States Dollars
FY2014/15 6
Annual Fiscal Outturn I Ministry of Finance & Development Planning
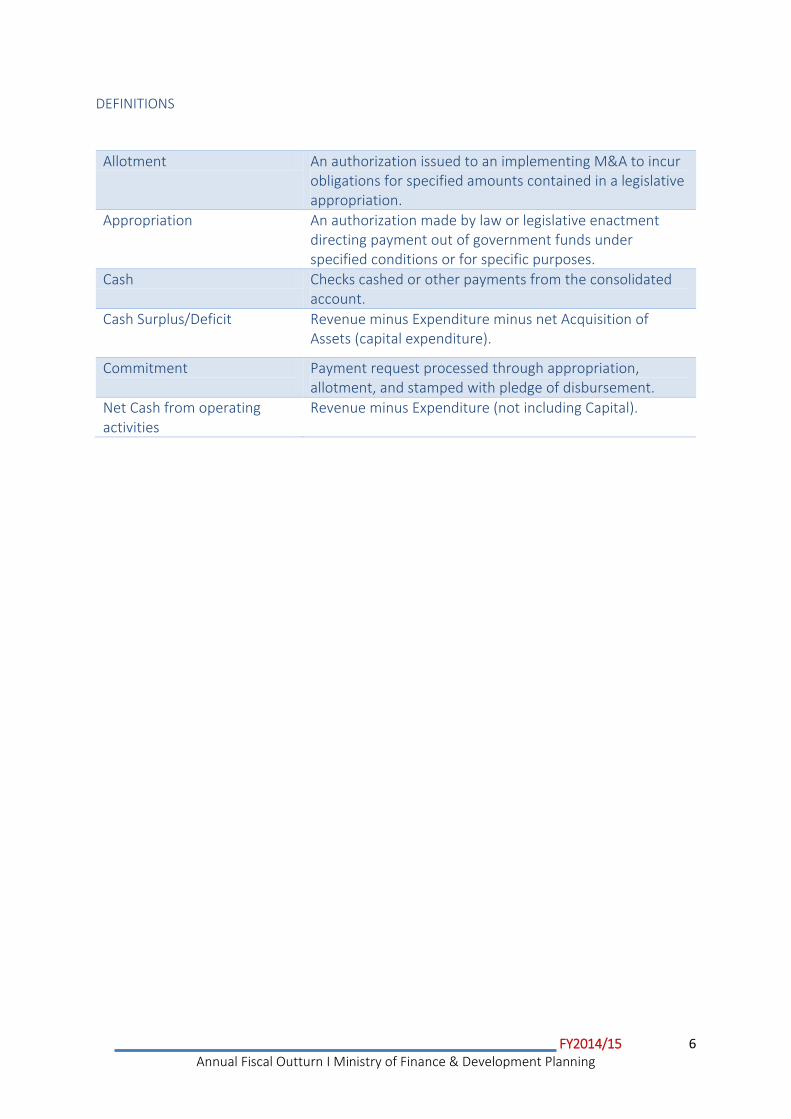
DEFINITIONS
Allotment An authorization issued to an implementing M&A to incur obligations for specified amounts contained in a legislative appropriation.
Appropriation An authorization made by law or legislative enactment directing payment out of government funds under specified conditions or for specific purposes.
Cash Checks cashed or other payments from the consolidated account.
Cash Surplus/Deficit
Revenue minus Expenditure minus net Acquisition of Assets (capital expenditure).
Commitment
Payment request processed through appropriation, allotment, and stamped with pledge of disbursement.
Net Cash from operating activities
Revenue minus Expenditure (not including Capital).
FY2014/15 7
Annual Fiscal Outturn I Ministry of Finance & Development Planning
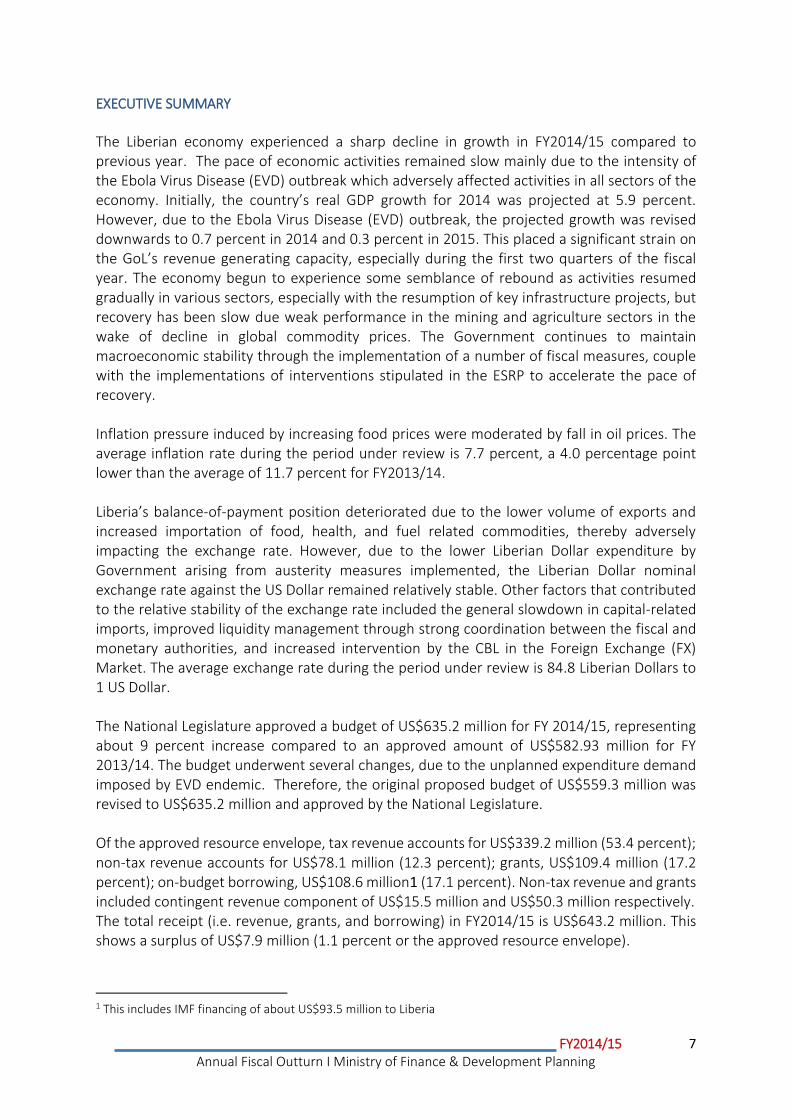
EXECUTIVE SUMMARY
The Liberian economy experienced a sharp decline in growth in FY2014/15 compared to previous year. The pace of economic activities remained slow mainly due to the intensity of the Ebola Virus Disease (EVD) outbreak which adversely affected activities in all sectors of the economy. Initially, the country’s real GDP growth for 2014 was projected at 5.9 percent. However, due to the Ebola Virus Disease (EVD) outbreak, the projected growth was revised downwards to 0.7 percent in 2014 and 0.3 percent in 2015. This placed a significant strain on the GoL’s revenue generating capacity, especially during the first two quarters of the fiscal year. The economy begun to experience some semblance of rebound as activities resumed gradually in various sectors, especially with the resumption of key infrastructure projects, but recovery has been slow due weak performance in the mining and agriculture sectors in the wake of decline in global commodity prices. The Government continues to maintain macroeconomic stability through the implementation of a number of fiscal measures, couple with the implementations of interventions stipulated in the ESRP to accelerate the pace of recovery. Inflation pressure induced by increasing food prices were moderated by fall in oil prices. The average inflation rate during the period under review is 7.7 percent, a 4.0 percentage point lower than the average of 11.7 percent for FY2013/14. Liberia’s balance-of-payment position deteriorated due to the lower volume of exports and increased importation of food, health, and fuel related commodities, thereby adversely impacting the exchange rate. However, due to the lower Liberian Dollar expenditure by Government arising from austerity measures implemented, the Liberian Dollar nominal exchange rate against the US Dollar remained relatively stable. Other factors that contributed to the relative stability of the exchange rate included the general slowdown in capital-related imports, improved liquidity management through strong coordination between the fiscal and monetary authorities, and increased intervention by the CBL in the Foreign Exchange (FX) Market. The average exchange rate during the period under review is 84.8 Liberian Dollars to 1 US Dollar. The National Legislature approved a budget of US$635.2 million for FY 2014/15, representing about 9 percent increase compared to an approved amount of US$582.93 million for FY 2013/14. The budget underwent several changes, due to the unplanned expenditure demand imposed by EVD endemic. Therefore, the original proposed budget of US$559.3 million was revised to US$635.2 million and approved by the National Legislature. Of the approved resource envelope, tax revenue accounts for US$339.2 million (53.4 percent); non‐tax revenue accounts for US$78.1 million (12.3 percent); grants, US$109.4 million (17.2 percent); on‐budget borrowing, US$108.6 million1 (17.1 percent). Non-tax revenue and grants included contingent revenue component of US$15.5 million and US$50.3 million respectively. The total receipt (i.e. revenue, grants, and borrowing) in FY2014/15 is US$643.2 million. This shows a surplus of US$7.9 million (1.1 percent or the approved resource envelope).
1 This includes IMF financing of about US$93.5 million to Liberia
FY2014/15 8
Annual Fiscal Outturn I Ministry of Finance & Development Planning
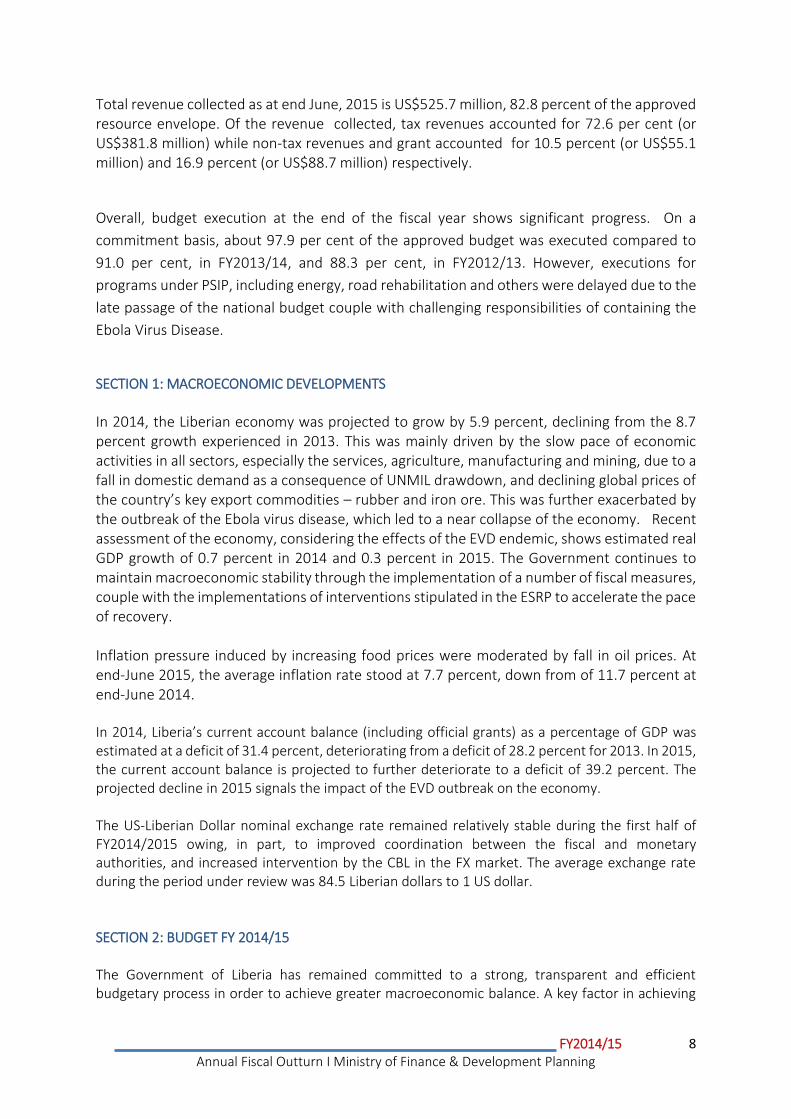
Total revenue collected as at end June, 2015 is US$525.7 million, 82.8 percent of the approved resource envelope. Of the revenue collected, tax revenues accounted for 72.6 per cent (or US$381.8 million) while non‐tax revenues and grant accounted for 10.5 percent (or US$55.1 million) and 16.9 percent (or US$88.7 million) respectively.
Overall, budget execution at the end of the fiscal year shows significant progress. On a
commitment basis, about 97.9 per cent of the approved budget was executed compared to
91.0 per cent, in FY2013/14, and 88.3 per cent, in FY2012/13. However, executions for
programs under PSIP, including energy, road rehabilitation and others were delayed due to the
late passage of the national budget couple with challenging responsibilities of containing the
Ebola Virus Disease.
SECTION 1: MACROECONOMIC DEVELOPMENTS
In 2014, the Liberian economy was projected to grow by 5.9 percent, declining from the 8.7 percent growth experienced in 2013. This was mainly driven by the slow pace of economic activities in all sectors, especially the services, agriculture, manufacturing and mining, due to a fall in domestic demand as a consequence of UNMIL drawdown, and declining global prices of the country’s key export commodities – rubber and iron ore. This was further exacerbated by the outbreak of the Ebola virus disease, which led to a near collapse of the economy. Recent assessment of the economy, considering the effects of the EVD endemic, shows estimated real GDP growth of 0.7 percent in 2014 and 0.3 percent in 2015. The Government continues to maintain macroeconomic stability through the implementation of a number of fiscal measures, couple with the implementations of interventions stipulated in the ESRP to accelerate the pace of recovery. Inflation pressure induced by increasing food prices were moderated by fall in oil prices. At end-June 2015, the average inflation rate stood at 7.7 percent, down from of 11.7 percent at end-June 2014. In 2014, Liberia’s current account balance (including official grants) as a percentage of GDP was estimated at a deficit of 31.4 percent, deteriorating from a deficit of 28.2 percent for 2013. In 2015, the current account balance is projected to further deteriorate to a deficit of 39.2 percent. The projected decline in 2015 signals the impact of the EVD outbreak on the economy. The US-Liberian Dollar nominal exchange rate remained relatively stable during the first half of FY2014/2015 owing, in part, to improved coordination between the fiscal and monetary authorities, and increased intervention by the CBL in the FX market. The average exchange rate during the period under review was 84.5 Liberian dollars to 1 US dollar. SECTION 2: BUDGET FY 2014/15 The Government of Liberia has remained committed to a strong, transparent and efficient budgetary process in order to achieve greater macroeconomic balance. A key factor in achieving

FY2014/15 9
Annual Fiscal Outturn I Ministry of Finance & Development Planning
this goal is fiscal discipline attained by prudent management of the available but meager resource envelope. This has necessitated the adoption of the Medium Term Expenditure Framework (MTEF) budget, which contains a revenue outlook and expenditure plan covering a period of three years with FY2014/15 being the final implementation year of the first round of a rolling MTEF budget. The use of the MTEF budgetary process informs and improves the inter- and intra-sectoral allocation of resources based on priorities set in the Agenda for Transformation (AfT), thereby linking the MTEF to the Country’s medium term development agenda. It furthermore ensures greater budgetary predictability for line Ministries and Agencies (M&As) and Commissions, and the efficient use of public funds; and renders the budget more predictable, comprehensive, transparent, and capable of producing measurable results. The FY2014/15 approved National Budget reasonably highlights crucial national priorities, particularly expenditures that are geared towards curbing the current public health crisis, helping to maintain macroeconomic stability and placing the country back on the trajectory of achieving its development objectives as set out in the AfT and National Vision 2030.
Public Sector Investment Program
The MTEF budget (FY2014/15) highlighted the GoL’s commitment to achieve sustained pro-poor and inclusive economic growth and development through people, products and processes. In an effort to enhance macroeconomic stability and expand the horizons of economic growth and development, the budget focuses on programs which were necessary to address the immediate impacts of the Ebola epidemic, and invests in critically needed infrastructure in order to ensure that the economic recovery creates jobs and improves welfare conditions in Liberia. Though many of these infrastructural development projects were at risk, their implementations were essential to improving the infrastructure capacity of the country and enhancing medium-to-long-term economic development. These investments were in two categories: A. National High Priority Level Projects: These are national investment priorities designed to meet
the goals and objectives of the AfT, and are ranked as follows:
Priority 1: Ports, Energy, Transport and Information Technology – these include the rehabilitation of the Mt. Coffee Hydroelectric Dam, the West African Power Pool (WAPP), the Heavy Fuel Oil (HFO) Plant, the development and maintenance of major roads, and the installation of the fiber optic backbone in Liberia;
Priority 2: Health – to support programs and projects implemented by the Ministry of Health;
Priority 3: Education – to enhance education levels and develop human capacity; Priority 4: UNMIL Drawdown – to ensure that national security is enhanced and
sustained; Priority 5: Capacity Development in line with the National Capacity Development
Strategy; Priority 6: WASH – supporting and enhancing access to clean water, sanitation and
hygiene; Priority 7: Youth Empowerment – to create jobs for new entrants into the country’s
labor force through gainful employment generation; Priority 8: Reconciliation – to promote national unity among Liberians; Priority 9: Agriculture – to promote agricultural rehabilitation for smallholder farmers
and rural entrepreneurs; and
FY2014/15 10
Annual Fiscal Outturn I Ministry of Finance & Development Planning
Priority 10: Economic Enhancement – to provide support for domestic investment and activities that enhance economic growth and poverty reduction.
B. Sector Level Investment Projects: These are projects developed by M&As to meet specific AfT objectives aimed at:
Maintaining the stability and sustainability of financial systems; Promoting equitable access to infrastructure and basic social services; Improving the standard of living for the majority of Liberians; and Facilitating economic development and growth.
Sector-level projects are selected based on social and economic returns such as the impact on job
creation, revenue generation and contribution to public good and sector goals that are consistent
with the AfT and their geographical distribution.
Stages of the MTEF Budget Process
The MTEF budgetary process and structure encompasses the following phases:
Strategic Phase –M&As present plans and strategies linking resources to policy
priorities based on the Agenda for Transformation;
Operational Phase – M&As prepare their detailed budgets and
Budgeting Phase – the budget is structured into the eleven economic sectors consisting
of groups of M&As that share common functions. It is also disaggregated into policy
areas based on groups of administrative departments and projects within M&As that
have common functions.
Fiscal Measures
The key drivers of the FY2014/15 approved national budget were the responses to the EVD endemic and the GoL’s commitment to keeping its development agenda on course. Therefore, a number of fiscal measures were adopted to ensure the effective and efficient use of the country’s meager resources. These measures allowed GoL to manage the economic impacts of the Ebola crisis, while investing in the needed infrastructure and programs. The major fiscal measures governing the FY 2014/15 budget were the following:
Prioritization of spending on activities crucial to the fight against Ebola. These included spending on social welfare services such as feeding of patients in hospitals, clinics, and treatment (isolation) centers, etc.; and the provision of safe drinking water and sanitary supplies to quarantined communities;
The placement of a moratorium on all non-essential purchases including vehicles, furniture, fixtures, office supplies, etc.;
The placement of a moratorium on all non-essential foreign and domestic travels: o Reduction in foreign travels of all agencies of Government by 40 percent, with all
foreign travel across government subjected to written Presidential approvals; o Placement of a cap of two-person per delegation, and a limited number of days for all
foreign travel, with exceptions expressly granted by the President; o The purchase of economy-class tickets only, for all officials on government trips, with
the exception of the President, Vice President, Speaker and President Pro-Tempore;
FY2014/15 11
Annual Fiscal Outturn I Ministry of Finance & Development Planning
the Chief Justice, and the Ministers of Foreign Affairs and Finance and Development Planning.
The automatic reduction in fuel and lubricant costs by 25 percent in all Ministries and Agencies (M&As) and Commissions that are not directly engaged in the fight against Ebola.
MTEF Budget Sectors
The formulation of the budget on a sector-specific basis highlights the policy direction of the budget and simplifies the budgetary process. This guides the GoL in measuring the impact of the budget on different sectors, and improves the coordination among M&As within each sector during the budget preparation and execution. The MTEF budget is divided into the following sectors:
Agriculture
Education
Energy and Environment
Health
Industry and Commerce
Infrastructure & Basic Services
Public Administration
Security and Rule of Law
Social Development Services
Transparency and Accountability
FY 2014/15 Appropriations
The Executive Branch of the Government submitted a draft budget of US$559,349,000 to the National Legislature on April 30, 2014 for consideration and approval for the fiscal period beginning July 1, 2014 and ending June 30, 2015. The budget was revised considering the potential impact of the EVD outbreak. The National Legislature approved a budget of US$635,236,000 or L$53,359,824,0002 for the fiscal period. The approved national budget shows a 9 percent increase, compared to FY2013/14; a 13.6 percent increase, compared to the draft submission of US$559,349,000; and a 22.8 percent increase, compared to the FY13/14 outturn (excluding borrowing).
The 13.6 percent increase compared to the draft submission was mainly driven by increased public expenditure demands arising from the Ebola crisis.
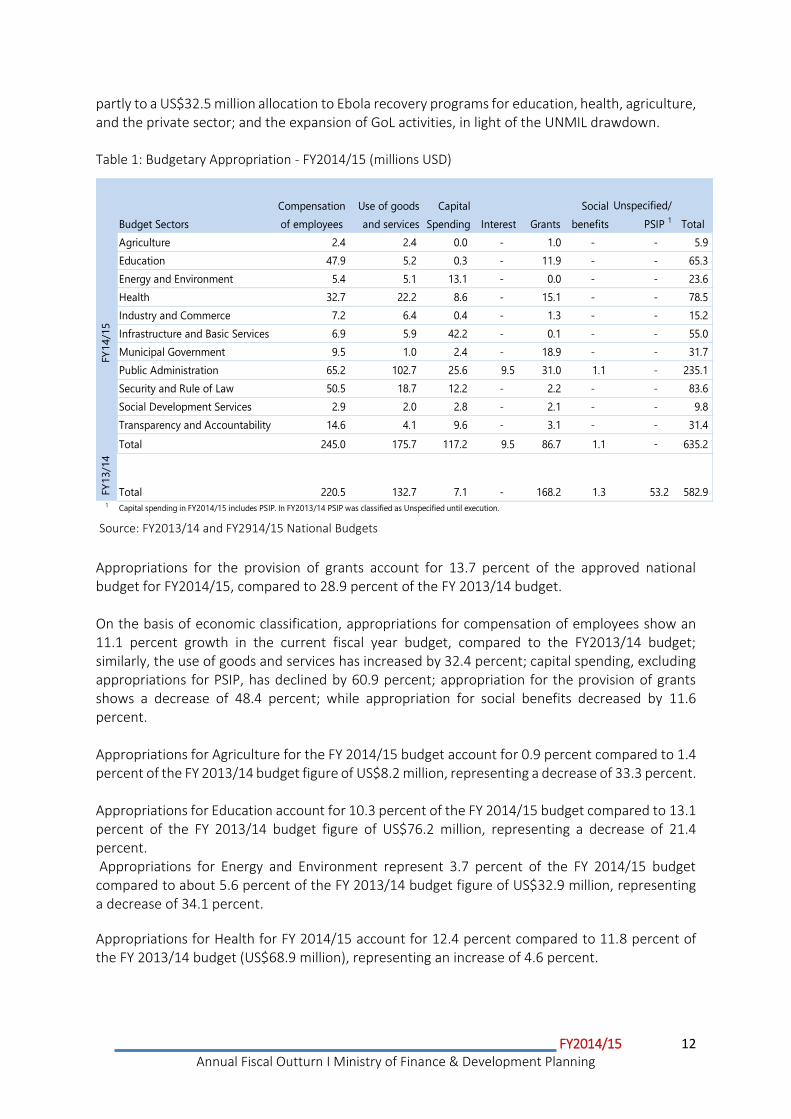
On the basis of the MTEF, Table 1 shows a breakdown of appropriations in the FY2014/15 budget by sector and economic classification, compared to the economic classification totals for the FY2013/14 budget. The GoL appropriated wage bill accounts for 38.6 percent of the current budget (FY2014/15) compared to about 37.8 percent of the FY2013/14 budget. The increased wage bill can be partly attributed to the scheduled UNMIL drawdown, as the GoL expands its presence across the country to provide coverage previously provided by UNMIL, and the payment of compensation for health-care workers previously funded through other streams.
Appropriations for capital expenditure seem higher in FY2014/15 as they include appropriations for PSIP spending. Excluding appropriations of US$114.4 million for PSIP spending, capital expenditure shows a decline of 60.9 percent, compared to the FY2013/14. Appropriations for goods and services account for 27.7 percent of the FY2014/15 budget, compared to 22.8 percent of the FY2013/14 budget. The increased appropriation can be attributed
2 The exchange rate is 84.00 Liberian dollars to 1 US Dollars
FY2014/15 12
Annual Fiscal Outturn I Ministry of Finance & Development Planning
partly to a US$32.5 million allocation to Ebola recovery programs for education, health, agriculture, and the private sector; and the expansion of GoL activities, in light of the UNMIL drawdown. Table 1: Budgetary Appropriation - FY2014/15 (millions USD)
Source: FY2013/14 and FY2914/15 National Budgets
Appropriations for the provision of grants account for 13.7 percent of the approved national budget for FY2014/15, compared to 28.9 percent of the FY 2013/14 budget. On the basis of economic classification, appropriations for compensation of employees show an 11.1 percent growth in the current fiscal year budget, compared to the FY2013/14 budget; similarly, the use of goods and services has increased by 32.4 percent; capital spending, excluding appropriations for PSIP, has declined by 60.9 percent; appropriation for the provision of grants shows a decrease of 48.4 percent; while appropriation for social benefits decreased by 11.6 percent.
Appropriations for Agriculture for the FY 2014/15 budget account for 0.9 percent compared to 1.4 percent of the FY 2013/14 budget figure of US$8.2 million, representing a decrease of 33.3 percent.
Appropriations for Education account for 10.3 percent of the FY 2014/15 budget compared to 13.1 percent of the FY 2013/14 budget figure of US$76.2 million, representing a decrease of 21.4 percent. Appropriations for Energy and Environment represent 3.7 percent of the FY 2014/15 budget compared to about 5.6 percent of the FY 2013/14 budget figure of US$32.9 million, representing a decrease of 34.1 percent.
Appropriations for Health for FY 2014/15 account for 12.4 percent compared to 11.8 percent of the FY 2013/14 budget (US$68.9 million), representing an increase of 4.6 percent.
Budget Sectors
Compensation
of employees
Use of goods
and services
Capital
Spending Interest Grants
Social
benefits
Unspecified/
PSIP 1
Total
Agriculture 2.4 2.4 0.0 - 1.0 - - 5.9
Education 47.9 5.2 0.3 - 11.9 - - 65.3
Energy and Environment 5.4 5.1 13.1 - 0.0 - - 23.6
Health 32.7 22.2 8.6 - 15.1 - - 78.5
Industry and Commerce 7.2 6.4 0.4 - 1.3 - - 15.2
Infrastructure and Basic Services 6.9 5.9 42.2 - 0.1 - - 55.0
Municipal Government 9.5 1.0 2.4 - 18.9 - - 31.7
Public Administration 65.2 102.7 25.6 9.5 31.0 1.1 - 235.1
Security and Rule of Law 50.5 18.7 12.2 - 2.2 - - 83.6
Social Development Services 2.9 2.0 2.8 - 2.1 - - 9.8
Transparency and Accountability 14.6 4.1 9.6 - 3.1 - - 31.4
Total 245.0 175.7 117.2 9.5 86.7 1.1 - 635.2
FY
13/1
4
Total 220.5 132.7 7.1 - 168.2 1.3 53.2 582.9 1 Capital spending in FY2014/15 includes PSIP. In FY2013/14 PSIP was classified as Unspecified until execution.
FY
14/1
5
FY2014/15 13
Annual Fiscal Outturn I Ministry of Finance & Development Planning
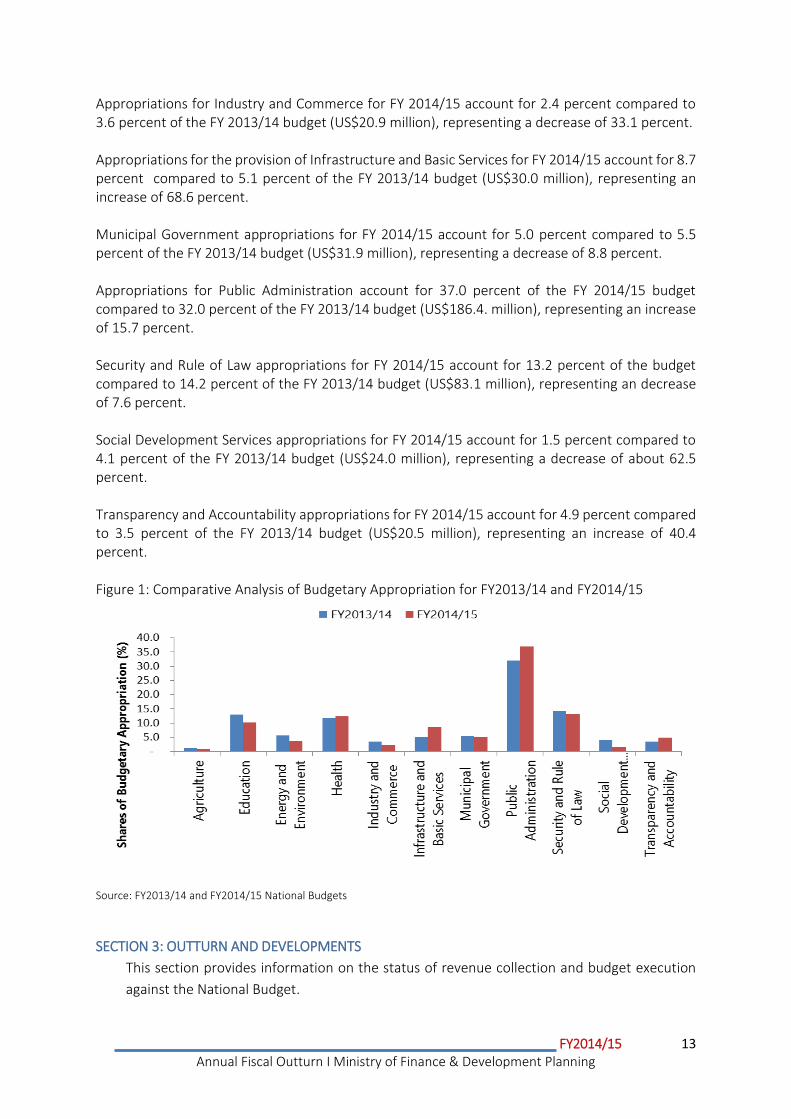
Appropriations for Industry and Commerce for FY 2014/15 account for 2.4 percent compared to 3.6 percent of the FY 2013/14 budget (US$20.9 million), representing a decrease of 33.1 percent. Appropriations for the provision of Infrastructure and Basic Services for FY 2014/15 account for 8.7 percent compared to 5.1 percent of the FY 2013/14 budget (US$30.0 million), representing an increase of 68.6 percent. Municipal Government appropriations for FY 2014/15 account for 5.0 percent compared to 5.5 percent of the FY 2013/14 budget (US$31.9 million), representing a decrease of 8.8 percent. Appropriations for Public Administration account for 37.0 percent of the FY 2014/15 budget compared to 32.0 percent of the FY 2013/14 budget (US$186.4. million), representing an increase of 15.7 percent. Security and Rule of Law appropriations for FY 2014/15 account for 13.2 percent of the budget compared to 14.2 percent of the FY 2013/14 budget (US$83.1 million), representing an decrease of 7.6 percent. Social Development Services appropriations for FY 2014/15 account for 1.5 percent compared to 4.1 percent of the FY 2013/14 budget (US$24.0 million), representing a decrease of about 62.5 percent. Transparency and Accountability appropriations for FY 2014/15 account for 4.9 percent compared to 3.5 percent of the FY 2013/14 budget (US$20.5 million), representing an increase of 40.4 percent. Figure 1: Comparative Analysis of Budgetary Appropriation for FY2013/14 and FY2014/15
Source: FY2013/14 and FY2014/15 National Budgets
SECTION 3: OUTTURN AND DEVELOPMENTS
This section provides information on the status of revenue collection and budget execution
against the National Budget.
FY2014/15 14
Annual Fiscal Outturn I Ministry of Finance & Development Planning
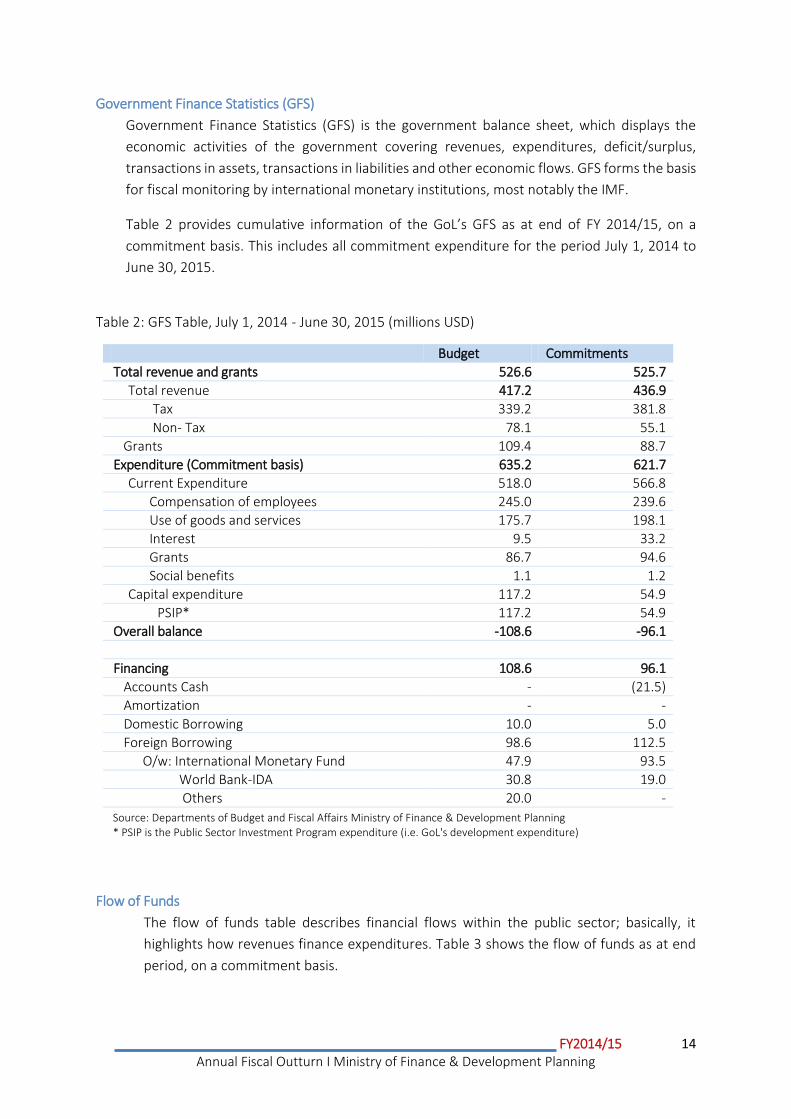
Government Finance Statistics (GFS)
Government Finance Statistics (GFS) is the government balance sheet, which displays the
economic activities of the government covering revenues, expenditures, deficit/surplus,
transactions in assets, transactions in liabilities and other economic flows. GFS forms the basis
for fiscal monitoring by international monetary institutions, most notably the IMF.
Table 2 provides cumulative information of the GoL’s GFS as at end of FY 2014/15, on a
commitment basis. This includes all commitment expenditure for the period July 1, 2014 to
June 30, 2015.
Table 2: GFS Table, July 1, 2014 - June 30, 2015 (millions USD)
Budget Commitments
Total revenue and grants 526.6 525.7
Total revenue 417.2 436.9
Tax 339.2 381.8
Non- Tax 78.1 55.1
Grants 109.4 88.7
Expenditure (Commitment basis) 635.2 621.7
Current Expenditure 518.0 566.8
Compensation of employees 245.0 239.6
Use of goods and services 175.7 198.1
Interest 9.5 33.2
Grants 86.7 94.6
Social benefits 1.1 1.2
Capital expenditure 117.2 54.9
PSIP* 117.2 54.9
Overall balance -108.6 -96.1
Financing 108.6 96.1
Accounts Cash - (21.5)
Amortization - -
Domestic Borrowing 10.0 5.0
Foreign Borrowing 98.6 112.5
O/w: International Monetary Fund 47.9 93.5
World Bank-IDA 30.8 19.0
Others 20.0 -
Source: Departments of Budget and Fiscal Affairs Ministry of Finance & Development Planning * PSIP is the Public Sector Investment Program expenditure (i.e. GoL's development expenditure)
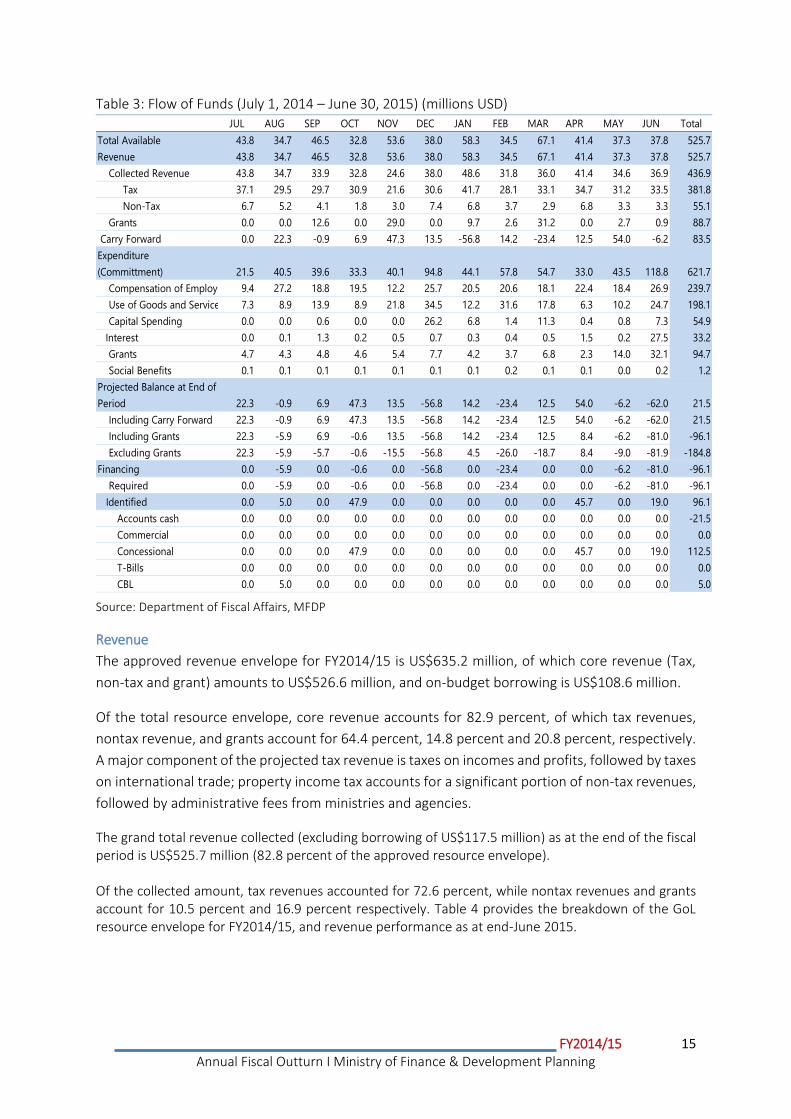
Flow of Funds
The flow of funds table describes financial flows within the public sector; basically, it
highlights how revenues finance expenditures. Table 3 shows the flow of funds as at end
period, on a commitment basis.
FY2014/15 15
Annual Fiscal Outturn I Ministry of Finance & Development Planning
Table 3: Flow of Funds (July 1, 2014 – June 30, 2015) (millions USD)
Source: Department of Fiscal Affairs, MFDP
Revenue
The approved revenue envelope for FY2014/15 is US$635.2 million, of which core revenue (Tax,
non-tax and grant) amounts to US$526.6 million, and on-budget borrowing is US$108.6 million.
Of the total resource envelope, core revenue accounts for 82.9 percent, of which tax revenues,
nontax revenue, and grants account for 64.4 percent, 14.8 percent and 20.8 percent, respectively.
A major component of the projected tax revenue is taxes on incomes and profits, followed by taxes
on international trade; property income tax accounts for a significant portion of non-tax revenues,
followed by administrative fees from ministries and agencies.
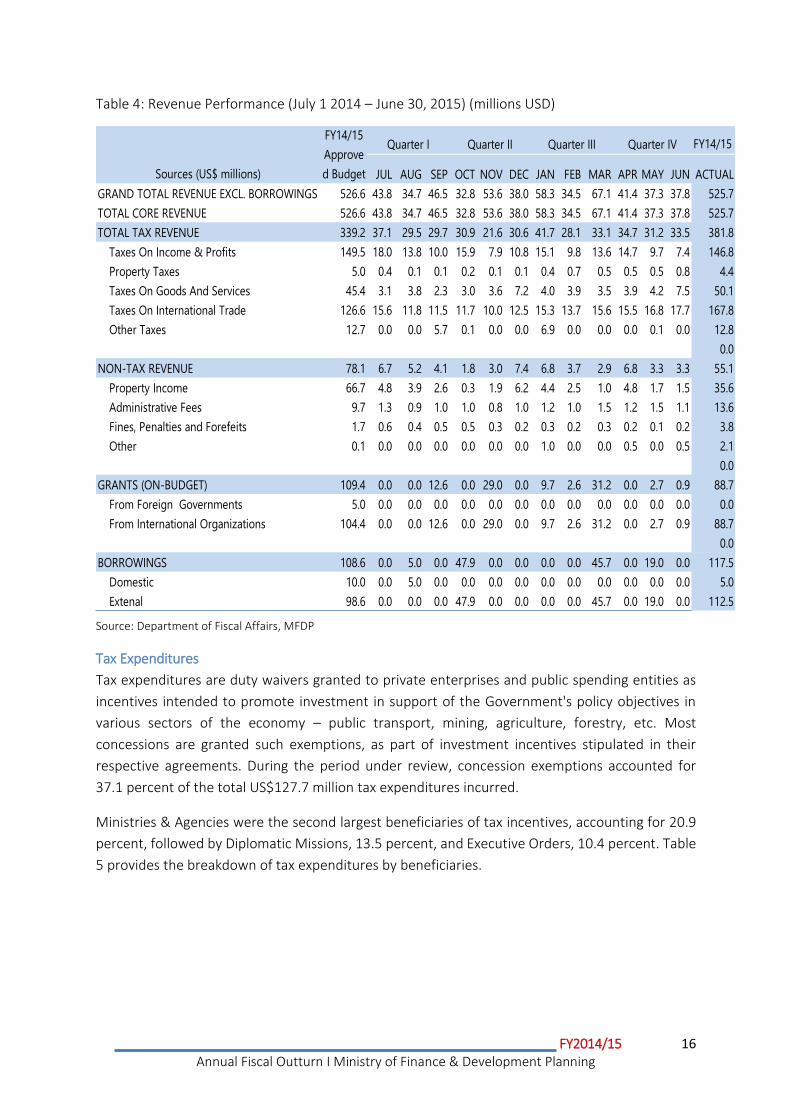
The grand total revenue collected (excluding borrowing of US$117.5 million) as at the end of the fiscal period is US$525.7 million (82.8 percent of the approved resource envelope). Of the collected amount, tax revenues accounted for 72.6 percent, while nontax revenues and grants account for 10.5 percent and 16.9 percent respectively. Table 4 provides the breakdown of the GoL resource envelope for FY2014/15, and revenue performance as at end-June 2015.
JUL AUG SEP OCT NOV DEC JAN FEB MAR APR MAY JUN Total
Total Available 43.8 34.7 46.5 32.8 53.6 38.0 58.3 34.5 67.1 41.4 37.3 37.8 525.7
Revenue 43.8 34.7 46.5 32.8 53.6 38.0 58.3 34.5 67.1 41.4 37.3 37.8 525.7
Collected Revenue 43.8 34.7 33.9 32.8 24.6 38.0 48.6 31.8 36.0 41.4 34.6 36.9 436.9
Tax 37.1 29.5 29.7 30.9 21.6 30.6 41.7 28.1 33.1 34.7 31.2 33.5 381.8
Non-Tax 6.7 5.2 4.1 1.8 3.0 7.4 6.8 3.7 2.9 6.8 3.3 3.3 55.1
Grants 0.0 0.0 12.6 0.0 29.0 0.0 9.7 2.6 31.2 0.0 2.7 0.9 88.7
Carry Forward 0.0 22.3 -0.9 6.9 47.3 13.5 -56.8 14.2 -23.4 12.5 54.0 -6.2 83.5
Expenditure
(Committment) 21.5 40.5 39.6 33.3 40.1 94.8 44.1 57.8 54.7 33.0 43.5 118.8 621.7
Compensation of Employees 9.4 27.2 18.8 19.5 12.2 25.7 20.5 20.6 18.1 22.4 18.4 26.9 239.7
Use of Goods and Services 7.3 8.9 13.9 8.9 21.8 34.5 12.2 31.6 17.8 6.3 10.2 24.7 198.1
Capital Spending 0.0 0.0 0.6 0.0 0.0 26.2 6.8 1.4 11.3 0.4 0.8 7.3 54.9
Interest 0.0 0.1 1.3 0.2 0.5 0.7 0.3 0.4 0.5 1.5 0.2 27.5 33.2
Grants 4.7 4.3 4.8 4.6 5.4 7.7 4.2 3.7 6.8 2.3 14.0 32.1 94.7
Social Benefits 0.1 0.1 0.1 0.1 0.1 0.1 0.1 0.2 0.1 0.1 0.0 0.2 1.2
Projected Balance at End of
Period 22.3 -0.9 6.9 47.3 13.5 -56.8 14.2 -23.4 12.5 54.0 -6.2 -62.0 21.5
Including Carry Forward 22.3 -0.9 6.9 47.3 13.5 -56.8 14.2 -23.4 12.5 54.0 -6.2 -62.0 21.5
Including Grants 22.3 -5.9 6.9 -0.6 13.5 -56.8 14.2 -23.4 12.5 8.4 -6.2 -81.0 -96.1
Excluding Grants 22.3 -5.9 -5.7 -0.6 -15.5 -56.8 4.5 -26.0 -18.7 8.4 -9.0 -81.9 -184.8
Financing 0.0 -5.9 0.0 -0.6 0.0 -56.8 0.0 -23.4 0.0 0.0 -6.2 -81.0 -96.1
Required 0.0 -5.9 0.0 -0.6 0.0 -56.8 0.0 -23.4 0.0 0.0 -6.2 -81.0 -96.1
Identified 0.0 5.0 0.0 47.9 0.0 0.0 0.0 0.0 0.0 45.7 0.0 19.0 96.1
Accounts cash 0.0 0.0 0.0 0.0 0.0 0.0 0.0 0.0 0.0 0.0 0.0 0.0 -21.5
Commercial 0.0 0.0 0.0 0.0 0.0 0.0 0.0 0.0 0.0 0.0 0.0 0.0 0.0
Concessional 0.0 0.0 0.0 47.9 0.0 0.0 0.0 0.0 0.0 45.7 0.0 19.0 112.5
T-Bills 0.0 0.0 0.0 0.0 0.0 0.0 0.0 0.0 0.0 0.0 0.0 0.0 0.0
CBL 0.0 5.0 0.0 0.0 0.0 0.0 0.0 0.0 0.0 0.0 0.0 0.0 5.0
FY2014/15 16
Annual Fiscal Outturn I Ministry of Finance & Development Planning
Table 4: Revenue Performance (July 1 2014 – June 30, 2015) (millions USD)
Source: Department of Fiscal Affairs, MFDP
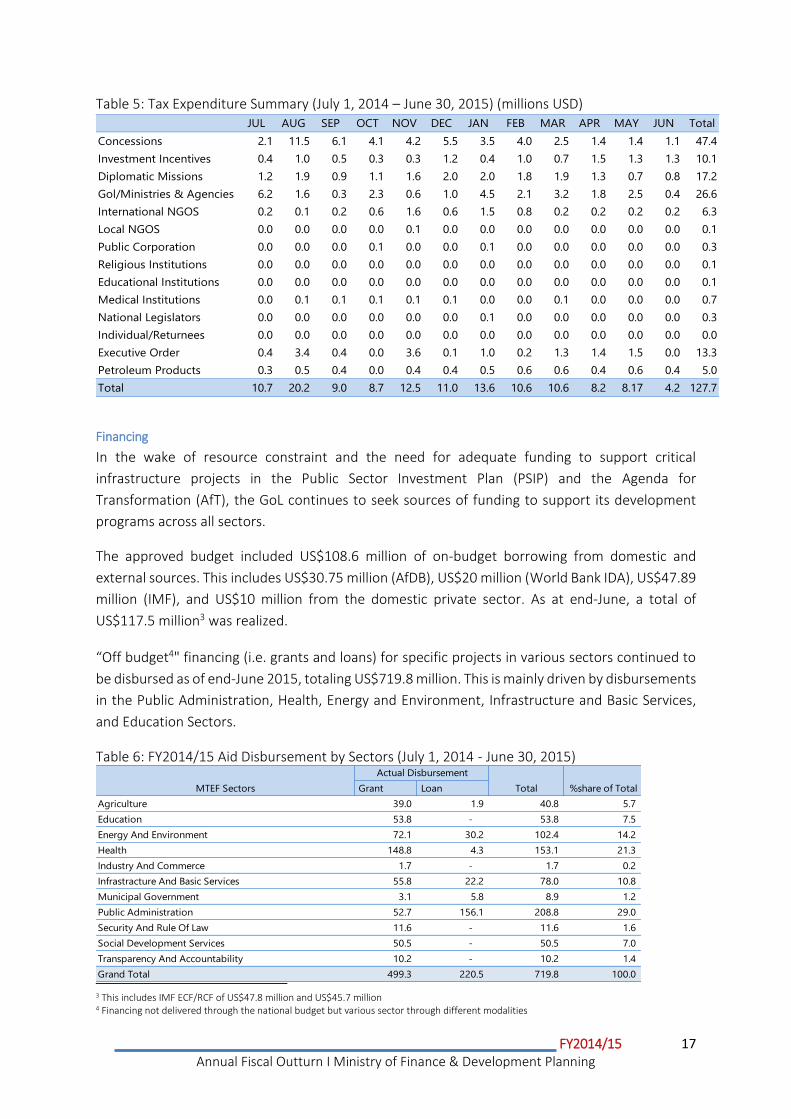
Tax Expenditures
Tax expenditures are duty waivers granted to private enterprises and public spending entities as
incentives intended to promote investment in support of the Government's policy objectives in
various sectors of the economy – public transport, mining, agriculture, forestry, etc. Most
concessions are granted such exemptions, as part of investment incentives stipulated in their
respective agreements. During the period under review, concession exemptions accounted for
37.1 percent of the total US$127.7 million tax expenditures incurred.
Ministries & Agencies were the second largest beneficiaries of tax incentives, accounting for 20.9
percent, followed by Diplomatic Missions, 13.5 percent, and Executive Orders, 10.4 percent. Table
5 provides the breakdown of tax expenditures by beneficiaries.
FY14/15
JUL AUG SEP OCT NOV DEC JAN FEB MAR APR MAY JUN ACTUAL
GRAND TOTAL REVENUE EXCL. BORROWINGS 526.6 43.8 34.7 46.5 32.8 53.6 38.0 58.3 34.5 67.1 41.4 37.3 37.8 525.7
TOTAL CORE REVENUE 526.6 43.8 34.7 46.5 32.8 53.6 38.0 58.3 34.5 67.1 41.4 37.3 37.8 525.7
TOTAL TAX REVENUE 339.2 37.1 29.5 29.7 30.9 21.6 30.6 41.7 28.1 33.1 34.7 31.2 33.5 381.8
Taxes On Income & Profits 149.5 18.0 13.8 10.0 15.9 7.9 10.8 15.1 9.8 13.6 14.7 9.7 7.4 146.8
Property Taxes 5.0 0.4 0.1 0.1 0.2 0.1 0.1 0.4 0.7 0.5 0.5 0.5 0.8 4.4
Taxes On Goods And Services 45.4 3.1 3.8 2.3 3.0 3.6 7.2 4.0 3.9 3.5 3.9 4.2 7.5 50.1
Taxes On International Trade 126.6 15.6 11.8 11.5 11.7 10.0 12.5 15.3 13.7 15.6 15.5 16.8 17.7 167.8
Other Taxes 12.7 0.0 0.0 5.7 0.1 0.0 0.0 6.9 0.0 0.0 0.0 0.1 0.0 12.8
0.0
NON-TAX REVENUE 78.1 6.7 5.2 4.1 1.8 3.0 7.4 6.8 3.7 2.9 6.8 3.3 3.3 55.1
Property Income 66.7 4.8 3.9 2.6 0.3 1.9 6.2 4.4 2.5 1.0 4.8 1.7 1.5 35.6
Administrative Fees 9.7 1.3 0.9 1.0 1.0 0.8 1.0 1.2 1.0 1.5 1.2 1.5 1.1 13.6
Fines, Penalties and Forefeits 1.7 0.6 0.4 0.5 0.5 0.3 0.2 0.3 0.2 0.3 0.2 0.1 0.2 3.8
Other 0.1 0.0 0.0 0.0 0.0 0.0 0.0 1.0 0.0 0.0 0.5 0.0 0.5 2.1
0.0
GRANTS (ON-BUDGET) 109.4 0.0 0.0 12.6 0.0 29.0 0.0 9.7 2.6 31.2 0.0 2.7 0.9 88.7
From Foreign Governments 5.0 0.0 0.0 0.0 0.0 0.0 0.0 0.0 0.0 0.0 0.0 0.0 0.0 0.0
From International Organizations 104.4 0.0 0.0 12.6 0.0 29.0 0.0 9.7 2.6 31.2 0.0 2.7 0.9 88.7
0.0
BORROWINGS 108.6 0.0 5.0 0.0 47.9 0.0 0.0 0.0 0.0 45.7 0.0 19.0 0.0 117.5
Domestic 10.0 0.0 5.0 0.0 0.0 0.0 0.0 0.0 0.0 0.0 0.0 0.0 0.0 5.0
Extenal 98.6 0.0 0.0 0.0 47.9 0.0 0.0 0.0 0.0 45.7 0.0 19.0 0.0 112.5
FY14/15
Approve
d BudgetSources (US$ millions)
Quarter I Quarter II Quarter III Quarter IV
FY2014/15 17
Annual Fiscal Outturn I Ministry of Finance & Development Planning
Table 5: Tax Expenditure Summary (July 1, 2014 – June 30, 2015) (millions USD)
Financing
In the wake of resource constraint and the need for adequate funding to support critical
infrastructure projects in the Public Sector Investment Plan (PSIP) and the Agenda for
Transformation (AfT), the GoL continues to seek sources of funding to support its development
programs across all sectors.
The approved budget included US$108.6 million of on-budget borrowing from domestic and
external sources. This includes US$30.75 million (AfDB), US$20 million (World Bank IDA), US$47.89
million (IMF), and US$10 million from the domestic private sector. As at end-June, a total of
US$117.5 million3 was realized.
“Off budget4" financing (i.e. grants and loans) for specific projects in various sectors continued to
be disbursed as of end-June 2015, totaling US$719.8 million. This is mainly driven by disbursements
in the Public Administration, Health, Energy and Environment, Infrastructure and Basic Services,
and Education Sectors.
Table 6: FY2014/15 Aid Disbursement by Sectors (July 1, 2014 - June 30, 2015)
3 This includes IMF ECF/RCF of US$47.8 million and US$45.7 million 4 Financing not delivered through the national budget but various sector through different modalities
JUL AUG SEP OCT NOV DEC JAN FEB MAR APR MAY JUN Total
Concessions 2.1 11.5 6.1 4.1 4.2 5.5 3.5 4.0 2.5 1.4 1.4 1.1 47.4
Investment Incentives 0.4 1.0 0.5 0.3 0.3 1.2 0.4 1.0 0.7 1.5 1.3 1.3 10.1
Diplomatic Missions 1.2 1.9 0.9 1.1 1.6 2.0 2.0 1.8 1.9 1.3 0.7 0.8 17.2
Gol/Ministries & Agencies 6.2 1.6 0.3 2.3 0.6 1.0 4.5 2.1 3.2 1.8 2.5 0.4 26.6
International NGOS 0.2 0.1 0.2 0.6 1.6 0.6 1.5 0.8 0.2 0.2 0.2 0.2 6.3
Local NGOS 0.0 0.0 0.0 0.0 0.1 0.0 0.0 0.0 0.0 0.0 0.0 0.0 0.1
Public Corporation 0.0 0.0 0.0 0.1 0.0 0.0 0.1 0.0 0.0 0.0 0.0 0.0 0.3
Religious Institutions 0.0 0.0 0.0 0.0 0.0 0.0 0.0 0.0 0.0 0.0 0.0 0.0 0.1
Educational Institutions 0.0 0.0 0.0 0.0 0.0 0.0 0.0 0.0 0.0 0.0 0.0 0.0 0.1
Medical Institutions 0.0 0.1 0.1 0.1 0.1 0.1 0.0 0.0 0.1 0.0 0.0 0.0 0.7
National Legislators 0.0 0.0 0.0 0.0 0.0 0.0 0.1 0.0 0.0 0.0 0.0 0.0 0.3
Individual/Returnees 0.0 0.0 0.0 0.0 0.0 0.0 0.0 0.0 0.0 0.0 0.0 0.0 0.0
Executive Order 0.4 3.4 0.4 0.0 3.6 0.1 1.0 0.2 1.3 1.4 1.5 0.0 13.3
Petroleum Products 0.3 0.5 0.4 0.0 0.4 0.4 0.5 0.6 0.6 0.4 0.6 0.4 5.0
Total 10.7 20.2 9.0 8.7 12.5 11.0 13.6 10.6 10.6 8.2 8.17 4.2 127.7
Grant Loan
Agriculture 39.0 1.9 40.8 5.7
Education 53.8 - 53.8 7.5
Energy And Environment 72.1 30.2 102.4 14.2
Health 148.8 4.3 153.1 21.3
Industry And Commerce 1.7 - 1.7 0.2
Infrastracture And Basic Services 55.8 22.2 78.0 10.8
Municipal Government 3.1 5.8 8.9 1.2
Public Administration 52.7 156.1 208.8 29.0
Security And Rule Of Law 11.6 - 11.6 1.6
Social Development Services 50.5 - 50.5 7.0
Transparency And Accountability 10.2 - 10.2 1.4
Grand Total 499.3 220.5 719.8 100.0
MTEF Sectors
Actual Disbursement
Total %share of Total
FY2014/15 18
Annual Fiscal Outturn I Ministry of Finance & Development Planning
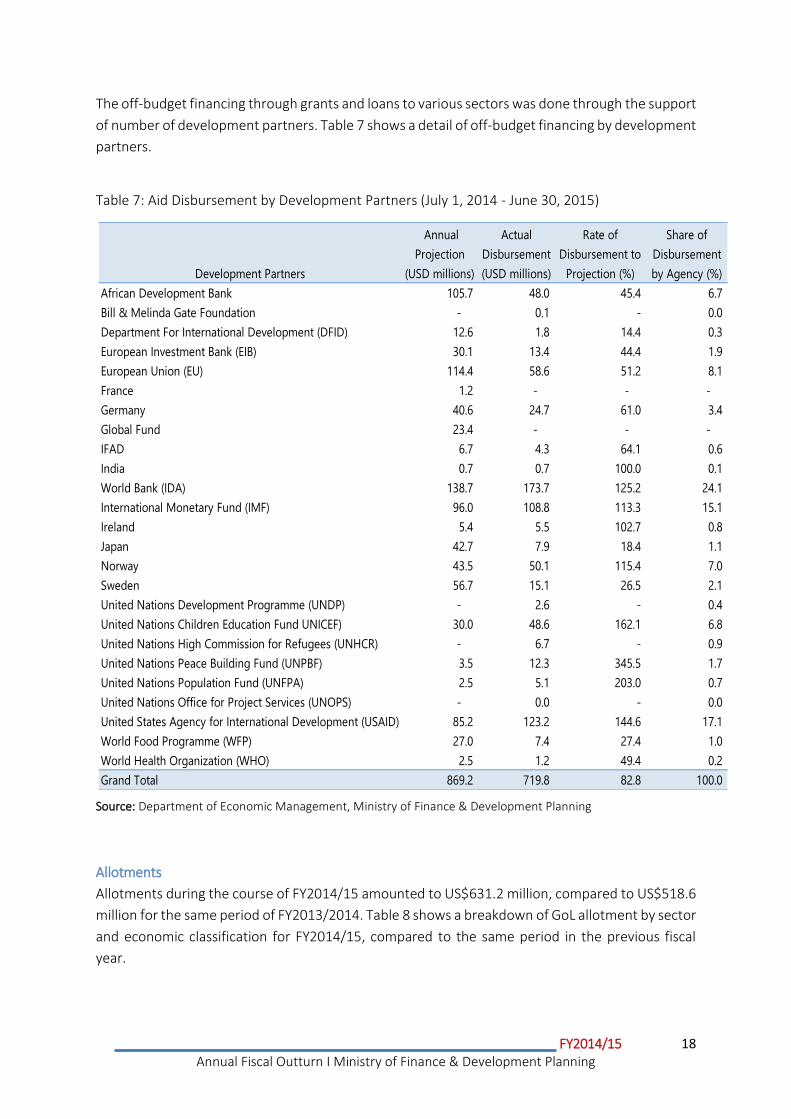
The off-budget financing through grants and loans to various sectors was done through the support
of number of development partners. Table 7 shows a detail of off-budget financing by development
partners.
Table 7: Aid Disbursement by Development Partners (July 1, 2014 - June 30, 2015)
Source: Department of Economic Management, Ministry of Finance & Development Planning
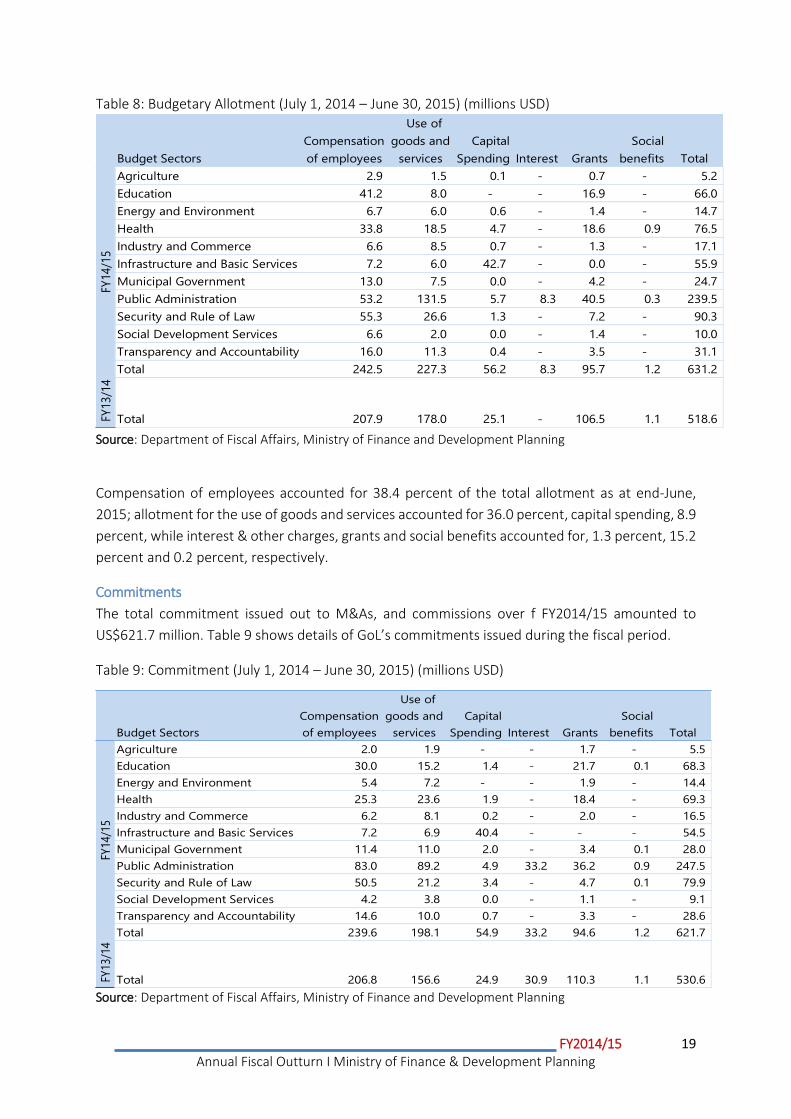
Allotments
Allotments during the course of FY2014/15 amounted to US$631.2 million, compared to US$518.6
million for the same period of FY2013/2014. Table 8 shows a breakdown of GoL allotment by sector
and economic classification for FY2014/15, compared to the same period in the previous fiscal
year.
African Development Bank 105.7 48.0 45.4 6.7
Bill & Melinda Gate Foundation - 0.1 - 0.0
Department For International Development (DFID) 12.6 1.8 14.4 0.3
European Investment Bank (EIB) 30.1 13.4 44.4 1.9
European Union (EU) 114.4 58.6 51.2 8.1
France 1.2 - - -
Germany 40.6 24.7 61.0 3.4
Global Fund 23.4 - - -
IFAD 6.7 4.3 64.1 0.6
India 0.7 0.7 100.0 0.1
World Bank (IDA) 138.7 173.7 125.2 24.1
International Monetary Fund (IMF) 96.0 108.8 113.3 15.1
Ireland 5.4 5.5 102.7 0.8
Japan 42.7 7.9 18.4 1.1
Norway 43.5 50.1 115.4 7.0
Sweden 56.7 15.1 26.5 2.1
United Nations Development Programme (UNDP) - 2.6 - 0.4
United Nations Children Education Fund UNICEF) 30.0 48.6 162.1 6.8
United Nations High Commission for Refugees (UNHCR) - 6.7 - 0.9
United Nations Peace Building Fund (UNPBF) 3.5 12.3 345.5 1.7
United Nations Population Fund (UNFPA) 2.5 5.1 203.0 0.7
United Nations Office for Project Services (UNOPS) - 0.0 - 0.0
United States Agency for International Development (USAID) 85.2 123.2 144.6 17.1
World Food Programme (WFP) 27.0 7.4 27.4 1.0
World Health Organization (WHO) 2.5 1.2 49.4 0.2
Grand Total 869.2 719.8 82.8 100.0
Development Partners
Annual
Projection
(USD millions)
Actual
Disbursement
(USD millions)
Rate of
Disbursement to
Projection (%)
Share of
Disbursement
by Agency (%)
FY2014/15 19
Annual Fiscal Outturn I Ministry of Finance & Development Planning
Table 8: Budgetary Allotment (July 1, 2014 – June 30, 2015) (millions USD)
Source: Department of Fiscal Affairs, Ministry of Finance and Development Planning
Compensation of employees accounted for 38.4 percent of the total allotment as at end-June,
2015; allotment for the use of goods and services accounted for 36.0 percent, capital spending, 8.9
percent, while interest & other charges, grants and social benefits accounted for, 1.3 percent, 15.2
percent and 0.2 percent, respectively.
Commitments
The total commitment issued out to M&As, and commissions over f FY2014/15 amounted to
US$621.7 million. Table 9 shows details of GoL’s commitments issued during the fiscal period.
Table 9: Commitment (July 1, 2014 – June 30, 2015) (millions USD)
Source: Department of Fiscal Affairs, Ministry of Finance and Development Planning
Budget Sectors
Compensation
of employees
Use of
goods and
services
Capital
Spending
Interest Grants
Social
benefits Total
Agriculture 2.9 1.5 0.1 - 0.7 - 5.2
Education 41.2 8.0 - - 16.9 - 66.0
Energy and Environment 6.7 6.0 0.6 - 1.4 - 14.7
Health 33.8 18.5 4.7 - 18.6 0.9 76.5
Industry and Commerce 6.6 8.5 0.7 - 1.3 - 17.1
Infrastructure and Basic Services 7.2 6.0 42.7 - 0.0 - 55.9
Municipal Government 13.0 7.5 0.0 - 4.2 - 24.7
Public Administration 53.2 131.5 5.7 8.3 40.5 0.3 239.5
Security and Rule of Law 55.3 26.6 1.3 - 7.2 - 90.3
Social Development Services 6.6 2.0 0.0 - 1.4 - 10.0
Transparency and Accountability 16.0 11.3 0.4 - 3.5 - 31.1
Total 242.5 227.3 56.2 8.3 95.7 1.2 631.2
FY
13/1
4
Total 207.9 178.0 25.1 - 106.5 1.1 518.6
FY14/1
5
Budget Sectors
Compensation
of employees
Use of
goods and
services
Capital
Spending
Interest Grants
Social
benefits Total
Agriculture 2.0 1.9 - - 1.7 - 5.5
Education 30.0 15.2 1.4 - 21.7 0.1 68.3
Energy and Environment 5.4 7.2 - - 1.9 - 14.4
Health 25.3 23.6 1.9 - 18.4 - 69.3
Industry and Commerce 6.2 8.1 0.2 - 2.0 - 16.5
Infrastructure and Basic Services 7.2 6.9 40.4 - - - 54.5
Municipal Government 11.4 11.0 2.0 - 3.4 0.1 28.0
Public Administration 83.0 89.2 4.9 33.2 36.2 0.9 247.5
Security and Rule of Law 50.5 21.2 3.4 - 4.7 0.1 79.9
Social Development Services 4.2 3.8 0.0 - 1.1 - 9.1
Transparency and Accountability 14.6 10.0 0.7 - 3.3 - 28.6
Total 239.6 198.1 54.9 33.2 94.6 1.2 621.7
FY
13/1
4
Total 206.8 156.6 24.9 30.9 110.3 1.1 530.6
FY14/1
5
FY2014/15 20
Annual Fiscal Outturn I Ministry of Finance & Development Planning
Compensation of employees accounted for about 38.5 percent of the total commitments issued as
at end-June 2015, while the use of goods and services accounted for 31.9 percent; capital
spending 8.8 percent; interest 5.3 percent; grants and social benefits accounted for 15.2
percent and 0.2 percent, respectively.
Budget Execution
Overall, budget execution at the end of the fiscal year shows significant progress. On a
commitment basis, about 97.9 per cent of the approved budget was executed compared to
91.0 per cent, in FY2013/14, and 88.3 per cent, in FY2012/13. However, executions for
programs under PSIP, including energy, road rehabilitation and others were delayed due to the
late passage of the national budget couple with challenging responsibilities of containing the
Ebola Virus Disease.
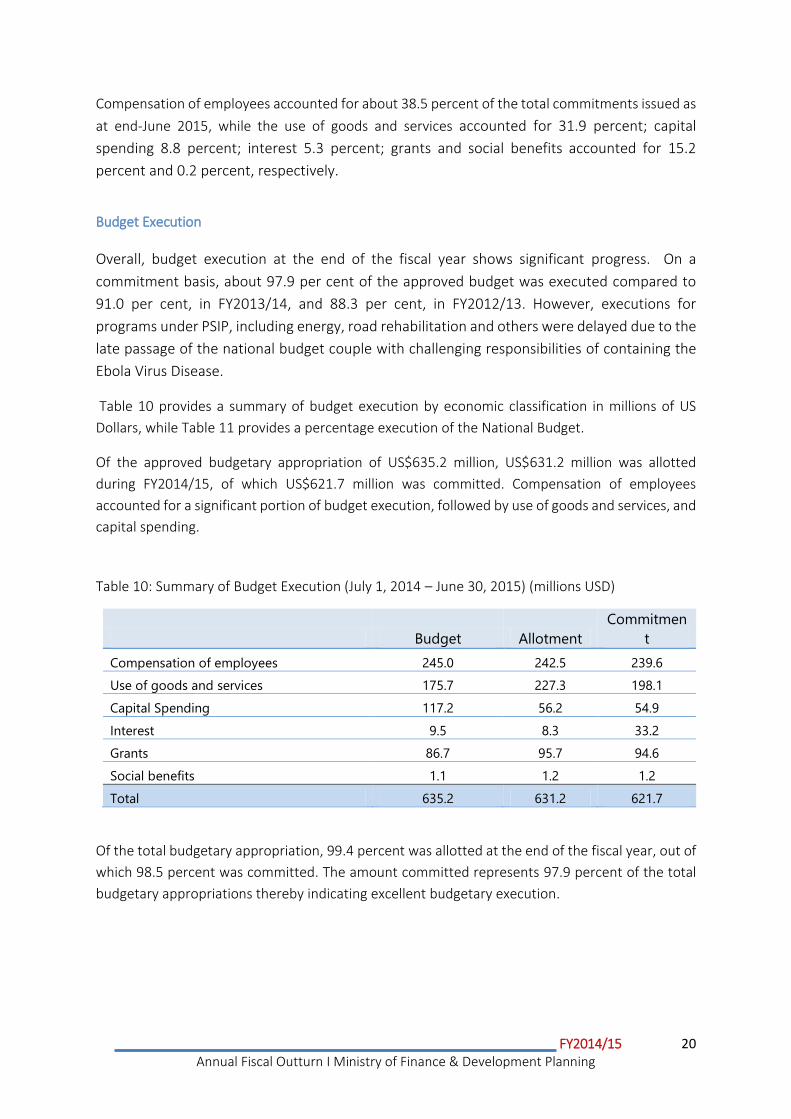
Table 10 provides a summary of budget execution by economic classification in millions of US
Dollars, while Table 11 provides a percentage execution of the National Budget.
Of the approved budgetary appropriation of US$635.2 million, US$631.2 million was allotted
during FY2014/15, of which US$621.7 million was committed. Compensation of employees
accounted for a significant portion of budget execution, followed by use of goods and services, and
capital spending.
Table 10: Summary of Budget Execution (July 1, 2014 – June 30, 2015) (millions USD)
Budget Allotment
Commitmen
t
Compensation of employees 245.0 242.5 239.6
Use of goods and services 175.7 227.3 198.1
Capital Spending 117.2 56.2 54.9
Interest 9.5 8.3 33.2
Grants 86.7 95.7 94.6
Social benefits 1.1 1.2 1.2
Total 635.2 631.2 621.7
Of the total budgetary appropriation, 99.4 percent was allotted at the end of the fiscal year, out of
which 98.5 percent was committed. The amount committed represents 97.9 percent of the total
budgetary appropriations thereby indicating excellent budgetary execution.
FY2014/15 21
Annual Fiscal Outturn I Ministry of Finance & Development Planning
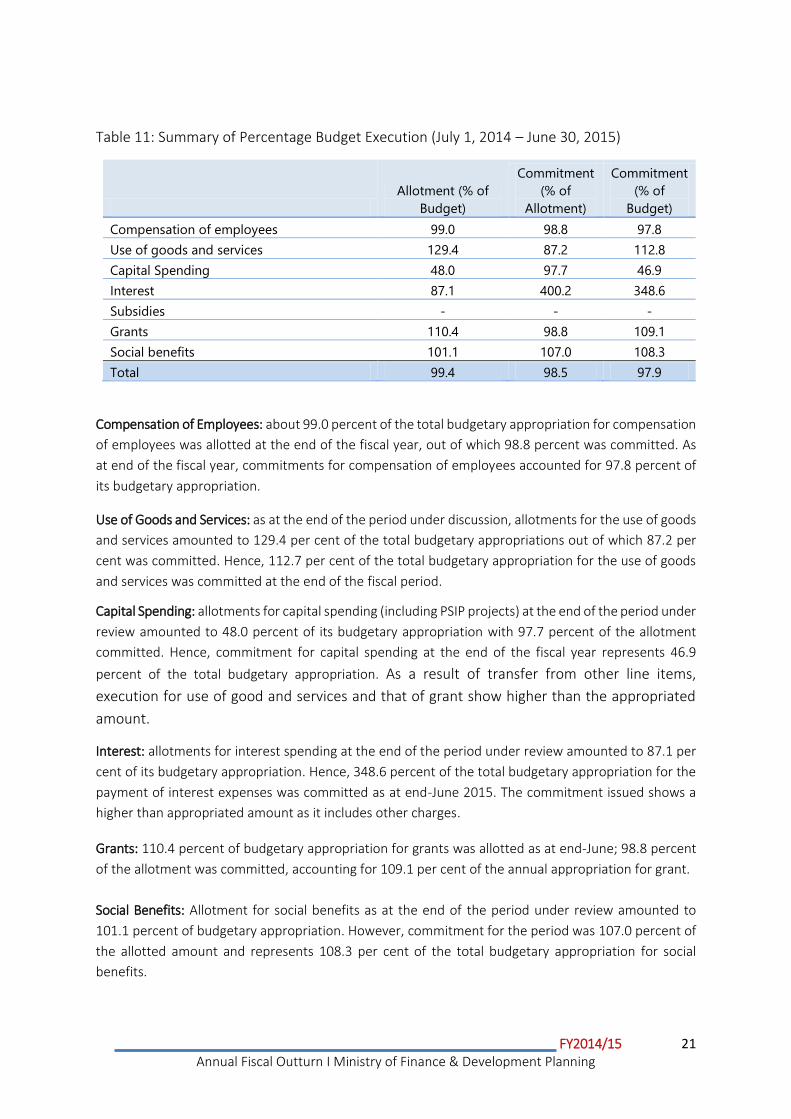
Table 11: Summary of Percentage Budget Execution (July 1, 2014 – June 30, 2015)
Allotment (% of
Budget)
Commitment
(% of
Allotment)
Commitment
(% of
Budget)
Compensation of employees 99.0 98.8 97.8
Use of goods and services 129.4 87.2 112.8
Capital Spending 48.0 97.7 46.9
Interest 87.1 400.2 348.6
Subsidies - - -
Grants 110.4 98.8 109.1
Social benefits 101.1 107.0 108.3
Total 99.4 98.5 97.9
Compensation of Employees: about 99.0 percent of the total budgetary appropriation for compensation
of employees was allotted at the end of the fiscal year, out of which 98.8 percent was committed. As
at end of the fiscal year, commitments for compensation of employees accounted for 97.8 percent of
its budgetary appropriation.
Use of Goods and Services: as at the end of the period under discussion, allotments for the use of goods
and services amounted to 129.4 per cent of the total budgetary appropriations out of which 87.2 per
cent was committed. Hence, 112.7 per cent of the total budgetary appropriation for the use of goods
and services was committed at the end of the fiscal period.
Capital Spending: allotments for capital spending (including PSIP projects) at the end of the period under
review amounted to 48.0 percent of its budgetary appropriation with 97.7 percent of the allotment
committed. Hence, commitment for capital spending at the end of the fiscal year represents 46.9
percent of the total budgetary appropriation. As a result of transfer from other line items,
execution for use of good and services and that of grant show higher than the appropriated
amount.
Interest: allotments for interest spending at the end of the period under review amounted to 87.1 per
cent of its budgetary appropriation. Hence, 348.6 percent of the total budgetary appropriation for the
payment of interest expenses was committed as at end-June 2015. The commitment issued shows a
higher than appropriated amount as it includes other charges.
Grants: 110.4 percent of budgetary appropriation for grants was allotted as at end-June; 98.8 percent
of the allotment was committed, accounting for 109.1 per cent of the annual appropriation for grant.
Social Benefits: Allotment for social benefits as at the end of the period under review amounted to
101.1 percent of budgetary appropriation. However, commitment for the period was 107.0 percent of
the allotted amount and represents 108.3 per cent of the total budgetary appropriation for social
benefits.
FY2014/15 22
Annual Fiscal Outturn I Ministry of Finance & Development Planning
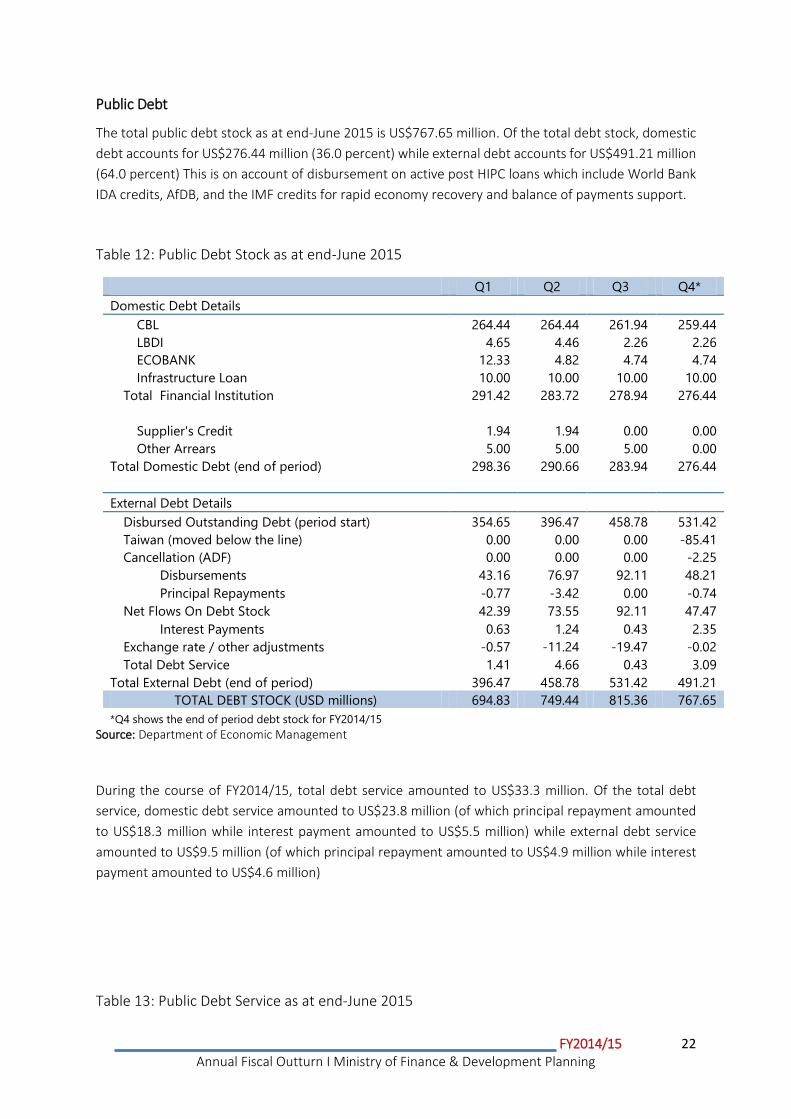
Public Debt
The total public debt stock as at end-June 2015 is US$767.65 million. Of the total debt stock, domestic
debt accounts for US$276.44 million (36.0 percent) while external debt accounts for US$491.21 million
(64.0 percent) This is on account of disbursement on active post HIPC loans which include World Bank
IDA credits, AfDB, and the IMF credits for rapid economy recovery and balance of payments support.
Table 12: Public Debt Stock as at end-June 2015
Q1 Q2 Q3 Q4*
Domestic Debt Details
CBL 264.44 264.44 261.94 259.44
LBDI 4.65 4.46 2.26 2.26
ECOBANK 12.33 4.82 4.74 4.74
Infrastructure Loan 10.00 10.00 10.00 10.00
Total Financial Institution 291.42 283.72 278.94 276.44
Supplier's Credit 1.94 1.94 0.00 0.00
Other Arrears 5.00 5.00 5.00 0.00
Total Domestic Debt (end of period) 298.36 290.66 283.94 276.44
External Debt Details
Disbursed Outstanding Debt (period start) 354.65 396.47 458.78 531.42
Taiwan (moved below the line) 0.00 0.00 0.00 -85.41
Cancellation (ADF) 0.00 0.00 0.00 -2.25
Disbursements 43.16 76.97 92.11 48.21
Principal Repayments -0.77 -3.42 0.00 -0.74
Net Flows On Debt Stock 42.39 73.55 92.11 47.47
Interest Payments 0.63 1.24 0.43 2.35
Exchange rate / other adjustments -0.57 -11.24 -19.47 -0.02
Total Debt Service 1.41 4.66 0.43 3.09
Total External Debt (end of period) 396.47 458.78 531.42 491.21
TOTAL DEBT STOCK (USD millions) 694.83 749.44 815.36 767.65
*Q4 shows the end of period debt stock for FY2014/15
Source: Department of Economic Management
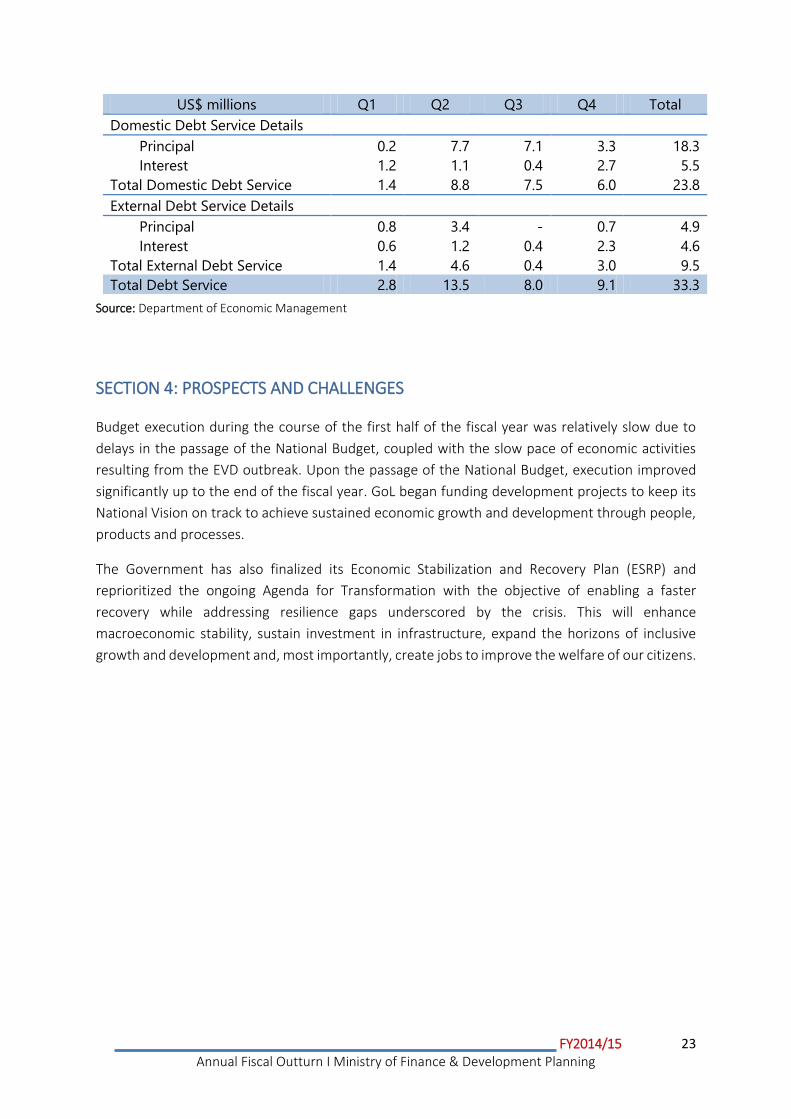
During the course of FY2014/15, total debt service amounted to US$33.3 million. Of the total debt
service, domestic debt service amounted to US$23.8 million (of which principal repayment amounted
to US$18.3 million while interest payment amounted to US$5.5 million) while external debt service
amounted to US$9.5 million (of which principal repayment amounted to US$4.9 million while interest
payment amounted to US$4.6 million)
Table 13: Public Debt Service as at end-June 2015
FY2014/15 23
Annual Fiscal Outturn I Ministry of Finance & Development Planning
US$ millions Q1 Q2 Q3 Q4 Total
Domestic Debt Service Details
Principal 0.2 7.7 7.1 3.3 18.3
Interest 1.2 1.1 0.4 2.7 5.5
Total Domestic Debt Service 1.4 8.8 7.5 6.0 23.8
External Debt Service Details
Principal 0.8 3.4 - 0.7 4.9
Interest 0.6 1.2 0.4 2.3 4.6
Total External Debt Service 1.4 4.6 0.4 3.0 9.5
Total Debt Service 2.8 13.5 8.0 9.1 33.3
Source: Department of Economic Management
SECTION 4: PROSPECTS AND CHALLENGES
Budget execution during the course of the first half of the fiscal year was relatively slow due to
delays in the passage of the National Budget, coupled with the slow pace of economic activities
resulting from the EVD outbreak. Upon the passage of the National Budget, execution improved
significantly up to the end of the fiscal year. GoL began funding development projects to keep its
National Vision on track to achieve sustained economic growth and development through people,
products and processes.
The Government has also finalized its Economic Stabilization and Recovery Plan (ESRP) and
reprioritized the ongoing Agenda for Transformation with the objective of enabling a faster
recovery while addressing resilience gaps underscored by the crisis. This will enhance
macroeconomic stability, sustain investment in infrastructure, expand the horizons of inclusive
growth and development and, most importantly, create jobs to improve the welfare of our citizens.