government of jamaica ministry of...
TRANSCRIPT

GOVERNMENT OF JAMAICA
MINISTRY OF ECONOMIC GROWTH AND JOB CREATION
BIENNIAL UPDATE REPORT OF JAMAICA

2
Executive Summary
Introduction and Context
As a signatory to the United Nations Framework Convention on Climate Change (UNFCCC) and in accordance with Article 4.1(a) of the UNFCCC, all parties to the convention are requested to update and report periodically on their inventory of anthropogenic emissions and removals of greenhouse gases (GHGs) not controlled by the Montreal Protocol.
Non-Annex I Parties (Developing Counties) are required to prepare Biennial Update reports (BURs) on the basis of the guidelines adopted by the 17th Conference of the Parties (COP17), in 2012, which are contained in annex III to decision 2/CP.17.
National Circumstances
Jamaica is a Small Island Developing State (SIDS) situated in the Caribbean Sea, comprising the third-largest island of the Greater Antilles with an area of 10,990 square kilometres (4,240 square miles) and population of approximately 2.7 million persons.
Jamaica is a parliamentary constitutional monarchy with legislative power vested in the bicameral Parliament of Jamaica consisting of an appointed Senate and a directly elected House of Representatives.
The Climate Change Division established under the ministry with responsibility for the environment is responsible for Jamaica’s obligations as a Party to the United Nations Framework Convention on Climate Change, (UNFCCC). These include the preparation of national GHG inventories, other reporting requirements for National Communications and Biennial Update Reports as well as the coordination and facilitation of mitigation and adaptation actions nationally, regionally and internationally.
There is a warming trend in Jamaica’s surface air temperature data, evident from data collected at the stations at the two international airport, Norman Manley in Kingston and Donald Sangster in Montego Bay.
Recent studies have indicated that the frequency of tropical storms and hurricanes may decrease due to decreases in vertical wind shear in a warmer climate. In several of these studies however the intensity of hurricanes still increases despite decreases in frequency (CARIBSAVE Climate Change Risk Atlas – Jamaica (2011).

Biennial Update Report of Jamaica
Figure ES1: Temperature anomalies – Norman Manley International Airport
Greenhouse Gas Emission Estimates Emission estimates were compiled for: CO2, CH4, N2O and HFC’s for the years 2006-2012 inclusive. There were no quantifiable emission sources of PFC’s, SF6 or NF3 identified in Jamaica. Emissions of indirect GHGs (CO, NOx, NMVOC, and SO2) were also included in the inventory.
The Revised 2006 IPCC Guidance was used to provide emission estimate methodologies. Tier 1 methodologies were used extensively, and in particular in estimating emissions from the Energy sector. Tier 2 methodologies were used where input data allowed, and in particular in some of the sub-sectors of: Industrial Processes and Product Use, Agriculture and Waste. The following table presents the greenhouse gas (GHG) emission totals by pollutant. The data are also presented in the figure below.
Table ES1. Emissions of Greenhouse Gases (Gg CO2 EQ)
2006 2007 2008 2009 2010 2011 2012
CO2 21,819 19,187 20,727 15,304 14,113 15,264 14,296
CH4 818 835 841 857 847 831 852
N2O 3,870 4,985 6,874 6,662 6,643 4,426 6,594
HFC 87 92 95 95 93 92 89
LULUCF -1,685 -1,638 -1,631 -1,622 -1,618 -1,616 -1,626
Total excluding LULUCF 26,595 25,100 28,537 22,919 21,696 20,614 21,831
Total including LULUCF 24,910 23,462 26,906 21,298 20,078 18,998 20,205

4
Figure ES2. Total GHG Emissions (Gg CO2 EQ)
The large year to year fluctuations are due to substantial changes in annual CO2 emissions in the mining/bauxite industry. This is due to global economic factors, and in particular the price of aluminium.
In addition, there are some large changes in the N2O emissions from the agriculture sector. This is driven by changes in the annual livestock numbers. The livestock data have been compiled from a number of different sources, and the quality of the data is less than optimal. As a result, the livestock data may not provide a true representation of the real world year to year variations. Each of the tables below presents a summary of the emissions for each of the direct GHGs.
Table ES2. Emissions of CO2 (Gg CO2)
2006 2007 2008 2009 2010 2011 2012
Public electricity and heat production
3,004 3,171 3,062 3,130 3,093 3,062 2,825
Mining/Bauxite 4,600 2,964 4,146 1,547 1,239 1,673 1,525
Other Industrial Combustion 361 457 573 393 264 434 465
Road Transport 2,062 1,993 1,889 1,979 1,886 1,876 1,726
Other Transport/Mobile 49 42 39 19 25 18 17
Commercial, Residential (inc. Agriculture/Forestry)
539 703 361 319 321 332 351
Energy 10,614 9,330 10,070 7,387 6,828 7,394 6,909
Cement & Lime 542 478 535 482 414 433 435
Other (Flaring, Non-E Prod Agriculture, Waste)
49 49 53 49 43 43 43
Total Excluding LULUCF 21,819 19,187 20,727 15,304 14,113 15,264 14,296
Land-Use Change - Forest remaining Forest
-1,834 -1,786 -1,779 -1,770 -1,767 -1,766 -1,777
Land-Use Change - Other 148 148 147 148 149 150 151
LULUCF -1,685 -1,638 -1,631 -1,622 -1,618 -1,616 -1,626
Total including LULUCF 20,134 17,549 19,096 13,683 12,495 13,648 12,670

Biennial Update Report of Jamaica
Table ES3. CH4 emissions (Gg CO2 EQ)
2006 2007 2008 2009 2010 2011 2012
Fuel Combustion 35 33 35 34 31 30 30
Enteric Fermentation
173 181 174 168 161 154 173
Manure Management
92 101 107 103 99 85 92
Agriculture – Other 5 6 5 5 5 5 5
Landfill 400 412 422 456 468 468 463
Waste - Other 113 102 97 92 83 89 89
TOTAL 818 835 841 857 847 831 852
Table ES4. N2O emissions (Gg CO2 EQ)
2006 2007 2008 2009 2010 2011 2012
Fuel Combustion 94 88 91 87 77 79 76
Manure Management
1,230 1,606 2,243 2,175 2,164 1,413 2,118
Agricultural Soils – Other
1,298 1,626 2,155 2,078 2,073 1,425 2,072
Agriculture - Indirect 1,202 1,620 2,338 2,277 2,285 1,464 2,284
Waste 46 46 47 46 45 45 45
Total 3,870 4,985 6,874 6,662 6,643 4,426 6,594
Table ES5. HFCs emissions (Gg CO2 EQ)
2006 2007 2008 2009 2010 2011 2012
HFC-23 4.31 5.47 6.60 7.70 8.78 9.84 10.89
HFC-125 12.43 12.94 13.09 12.92 12.49 11.83 11.49
HFC-134a 44.32 49.14 52.22 53.82 54.15 53.42 52.39
HFC-143a 16.04 18.14 19.16 19.29 18.64 17.35 16.31
HFC-152a 0.00 0.00 0.00 0.00 0.00 0.00 0.00
HFC-227ea 1.69 1.43 1.22 1.03 0.88 0.75 0.64
HFC-236fa 0.28 0.24 0.20 0.17 0.15 0.13 0.11
Total 79.07 87.36 92.49 94.94 95.10 93.32 91.81
Climate Change Mitigation Actions Taken
Jamaica has undertaken several activities to address its mitigation concerns, several of these projects are listed in Table ES6 below.
Table ES6: Approved Mitigation Projects
APPROVED NATIONAL PROJECTS (Global Environmental Facility)
Project Name Agency GEF Grant (USD)
Co-financing (USD)
Demand Side Management Demonstration World Bank 3,800,00 8,700,000
Enabling Jamaica to Prepare its First National Communication
UNDP 232,780 120,000*
Climate Change Enabling activity UNDP 100,000 0

6
Promoting Energy Efficiency and Renewable Energy in Buildings
UNEP 2,361,000 4,700,000
Second National Communication of Jamaica UNDP 450,000 110,000*
Third National communication and Biennial Update Report
UNDP 852,000 200,000*
Deployment of renewable Energy and Improvement of Energy Efficiency in the Public Sector
UNDP 1,254,987 10,784,754
*in kind
APPROVED REGIONAL AND GLOBAL PROJECTS (GEF)
Project Name Agency GEF Grant (USD)
Co-financing (USD)
Caribbean Renewable Energy Development Programme
UNDP 4,076,000 12,450,000
Jamaica’s first Nationally Appropriate Mitigation Action, (NAMA) template was developed by the Ministry with responsibility for energy, in collaboration with the Organización Latino Americana de Energía (OLADE), and the Climate Change Division. Other NAMAs are to be developed including through the USAID supported project, Climate Economic Analysis for Development, Investment and Resilience, (CEADIR). Constraints and Gaps, and Related Financial, Technical and Capacity Needs
There were several constraints and gaps and related financial, technical and capacity needs that were encountered in the preparation of this report. The main being that of having the right institutional arrangements in place. The establishment of a Climate Change Division and a Network of Climate Change Focal Points in each of the key ministries, departments and agencies moves in the right direction. The Climate Change Division however needs a full complement of staff so that it can fully achieve its mandate of the body that coordinate and facilitate all activities of Jamaica’s response to climate change. The Government of Jamaica fully supported these efforts but some assistance will be required from the global community. The country is already receiving through the multilateral process from the UNFCCC mainly for reporting requirements but also from the Climate Technology Centre and Network, the Adaptation Fund, the Green Climate Fund, the Global Environment Facility and the constituted bodies such as the Consultative Group of Experts. Support has come from international organizations such as the United Nations Development Programme, (UNDP) and the United Nations Environment Programme, (UNEP), the Global support Programme and the Food and Agricultural Organization. Bilateral support has been provided by the United States Agency for International Development, (USAID), European Union, (EU), the Governments of Germany, United Kingdom and Japan amongst others. At the region level, the Caribbean Development Bank, the Caribbean Climate Change Centre and the Caribbean Community Secretariat have also provide support for climate change related activities.

Biennial Update Report of Jamaica
Units and Conversions Emissions of greenhouse gases presented in this report are normally given in Gigagrammes (Gg). Global Warming Potential (GWP) weighted emissions are also provided. To convert between the units of emissions, use the conversion factors given on next page. Table 0.1Prefixes and Multiplication Factors
Multiplication factor Abbreviation Prefix Symbol
1,000,000,000,000,000 1015 peta P
1,000,000,000,000 1012 tera T
1,000,000,000 109 giga G
1,000,000 106 mega M
1,000 103 kilo k
100 102 hecto h
10 101 deca da
0.1 10-1 deci d
0.01 10-2 centi c
0.001 10-3 milli m
0.000,001 10-6 micro μ
1 kilotonne (kt) = 103 tonnes = 1,000 tonnes 1 Mega tonne (Mt) = 106 tonnes = 1,000,000 tonnes 1 Gigagramme (Gg) = 1 kt 1 Teragramme (Tg) = 1 Mt
Conversion of carbon emitted to carbon dioxide emitted To covert emissions expressed in weight of carbon, to emissions in weight of carbon dioxide, multiply by 44/12. Conversion of Gg of greenhouse gas emitted into Gg CO2 equivalent Gg (of GHG) * GWP = Gg CO2 equivalent. The GWP is the Global Warming Potential of the greenhouse gas. The GWPs of greenhouse gases used in this report are given in Table 1.1 of Chapter 1.
Greenhouse Gas & Chemical Compound Abbreviations
Table 0.2 Pollutant Names and Formulae
type of greenhouse gas
Formula or abbreviation
Name
Direct CH4 Methane
Direct CO2 Carbon dioxide
Direct N2O Nitrous oxide
Direct HFCs Hydrofluorocarbons
Direct PFCs Perfluorocarbons
Direct SF6 Sulphur hexafluoride
Indirect CO Carbon monoxide
Indirect NMVOC Non-methane volatile organic compound
Indirect NOx Nitrogen oxides (reported as nitrogen dioxide)
Indirect SO2 Sulphur oxides (reported as sulphur dioxide)

8
Glossary
AR4 Fourth Assessment Report of the Intergovernmental Panel on Climate Change
AR5 Fifth Assessment Report of the Intergovernmental Panel on Climate Change
BAU Business –As-Usual
CDM Clean Development Mechanism
CER Certified Emission Reduction
CO2eq Carbon Dioxide equivalent
EE Energy Efficiency
FAO Food and agriculture Organization
GCF Green Climate Fund
GEF Global Environmental Facility
Gg Giga grams
GHG Greenhouse Gas
GWh Giga Watts/Hour
GWP Global Warming Potential
HFCs Hydro fluorocarbons
ICAO International Civil Aviation Organization
IMO International Maritime Organization
LDCs Least Developed Countries
LNG Liquefied Natural gas
LPG Liquefied Petroleum Gas
NAMAs Nationally Appropriate Mitigation Actions
NGOs Non-Governmental Organizations
PV Photovoltaic
UNDP United Nations Development Programme
UNEP United Nations Environment Programme
UNFCCC United Nations Framework Convention on Climate Change
WHO World Health Organization
WMO World Meteorological Organization
DEFINITIONS
Adaptation Adjustment in natural or human systems in response to actual or expected climatic stimuli or their effects, which moderates harm and exploits beneficial opportunities
Mitigation In the context of climate change, a human intervention to reduce the sources or enhance the sinks of greenhouse gases.

Biennial Update Report of Jamaica
Report Title Biennial Update Report of Jamaica, Covering GHG Emissions for 2006-2012
Author(s) Mr Clifford Mahlung and Dr Chris Dore Contributions from: Mr Gerald Lindo (Climate Change Division) Mr Conroy Watson and Mr Omar Alcock (Energy) Mr Adrian Wright (Industrial Processes & Product Use) Mr Eistein McLean (Agriculture) Mr Owen Evelyn (Land Use, Land Use Change & Forestry) Mrs Ianthe Smith and Ms Natalya Downie (Waste)
Reviewed by United Nations Development Programme National Support Programme
Acknowledgements The emissions inventory chapter of this report has been prepared as part of the contract “Third National Communication (TNC) and Biennial Update Report (BUR) to the United Nations Framework Convention on Climate Change (UNFCCC)” IC/2015/1, funded UNDP. The authors wish to thank the UNDP for their support throughout this project, and the local experts who contributed to the work.

10
Table of Contents 1. Introduction…………………………..…………………………………………………………………………………………….14 Context………………… ............................................................................................................. 14 2. BUR Reporting Guidelines .................................................................................................... 14 3. Structure of this Report........................................................................................................ 15 4. National Circumstances ....................................................................................................... 15 5. Government Structure ......................................................................................................... 16 6. Population Profile ................................................................................................................ 16 Demographic……………….. ...................................................................................................... 16 Population Growth .............................................................................................................. 16 7. Literacy Rate ........................................................................................................................ 18 8. Fertility rate ........................................................................................................................ 18 9. Health………….……………………………………………………………………………………………………………………….18 10. Mortality rate ...................................................................................................................... 19 11. Life Expectancy .................................................................................................................... 19 12. Electricity ............................................................................................................................ 19 13. Local Access to water ........................................................................................................... 19 14. Waste Disposal .................................................................................................................... 20 15. Geographic and Climate Profile ............................................................................................ 20 16. Climate…………………………………………………………………………………………………………………………………20 17. Temperature ....................................................................................................................... 21 18. Rainfall………………………………………………………………………………………………………………………………….21 19. Wind Speeds ....................................................................................................................... 21 20. Sunshine Hours.................................................................................................................... 21 21. Sea-Surface Temperatures ................................................................................................... 22 22. Hurricanes, Storm Surges and Sea Level rise ......................................................................... 22 23. Temperature Trends ............................................................................................................ 22 24. Rainfall………………………………………………………………………………………………………………………………….23 25. Other Variables ................................................................................................................... 24 26. Economic Profile .................................................................................................................. 25 27. Sectoral Information ............................................................................................................ 26 The Energy Sector ................................................................................................................ 26 The Industrial Processes and Product Use Sector .................................................................. 28 Agriculture……… ................................................................................................................... 29 Land Use, Land Use Change and Forestry .............................................................................. 30 The Waste Sector ................................................................................................................. 31 28. National Priorities ............................................................................................................... 31 Development Priorities ........................................................................................................ 31 Priorities Related to the Mitigation of Climate Change .......................................................... 31
Adaptation……….. ................................................................................................................. 32 29. Institutional Arrangements .................................................................................................. 33 Overall Co-ordination of MRV .............................................................................................. 33 Institutional Arrangements for the GHG Inventory System .................................................... 33 Institutional Arrangement for Mitigation Actions (including NAMAs) .................................... 35 Institutional Arrangement for Clean Development Mechanism ............................................. 35 Support Required ................................................................................................................. 35 Support Received ................................................................................................................. 35 Institutional Arrangements for BUR and NC .......................................................................... 36 30. GHG Emissions Inventory ..................................................................................................... 37 31. Summary Table Emissions Estimates for 2012 ....................................................................... 37

Biennial Update Report of Jamaica
32. Sector and Pollutant Coverage ............................................................................................. 39 33. Temporal Coverage .............................................................................................................. 40 34. Methodology, Parameters and Emission Factors................................................................... 40 35. Activity Data ........................................................................................................................ 41 36. The National System ............................................................................................................ 42 37. Emissions of Direct GHGs ..................................................................................................... 42 38. Emissions of CO2 .................................................................................................................. 43 39. Emissions of CH4 .................................................................................................................. 45 40. Emissions of N2O ................................................................................................................. 47 41. Emissions of HFC.................................................................................................................. 48 42. Emissions of PFC, SF6 and NF3 ............................................................................................... 50 43. Energy Sector ...................................................................................................................... 51 Methodological Overview .................................................................................................... 51 Activity Data……. .................................................................................................................. 51 44. Sectoral and Reference Approaches ..................................................................................... 54 45. Calculation Methodologies .................................................................................................. 55 46. Sectoral Emission Estimates ................................................................................................. 62 47. Memo Items ........................................................................................................................ 65 48. Sectoral Uncertainties ......................................................................................................... 67 49. Quality Assurance and Quality Control ................................................................................. 68 50. Recommendations for Improvement .................................................................................... 69 51. Industrial Processes and Product Use ................................................................................... 70 Methodological Overview .................................................................................................... 70 52. Calculation Methodologies .................................................................................................. 70 Sectoral Uncertainties .......................................................................................................... 75 Quality Assurance and Quality Control ................................................................................. 75 Recommendations for Improvement .................................................................................... 76 53. Waste……………………………………………………………………………………………………………………………………76 Solid Waste Disposal ........................................................................................................... 76 Red Mud as a Carbon Sink ................................................................................................... 79 Biological Treatment of Solid Waste .................................................................................... 79 Waste Incineration – Medical and Industrial Waste .............................................................. 80 Open Burning of Waste ........................................................................................................ 82 Domestic wastewater – CH4 ................................................................................................. 83 Industrial Wastewater ......................................................................................................... 85 Domestic Wastewater - N2O ................................................................................................. 89 Sectoral Uncertainties .......................................................................................................... 90 Quality Assurance and Quality Control ................................................................................. 93 Recommendations for Improvement .................................................................................... 93 54. Uncertainty Analysis ............................................................................................................ 94 Introduction…………… ........................................................................................................... 94 Methodology……… .............................................................................................................. 95 55. CO2 Uncertainty Analysis ..................................................................................................... 97 56. CH4 Uncertainty Analysis ..................................................................................................... 99 57. N2O Uncertainty Analysis .................................................................................................. 101 58. HFC Uncertainty Analysis .................................................................................................. 103 59. Key Category Analysis ....................................................................................................... 104 Introduction……………… ...................................................................................................... 104 KCA Results…….. ................................................................................................................ 104 60. Prioritisation of Improvement Activities ............................................................................. 105 61. Mitigation Actions…………......................................................................................................108

12
62. Overview ........................................................................................................................... 108 63. Constraints and Gaps, and Related Financial and Capacity Needs ........................................ 112 64. Financial Support Received ................................................................................................ 112 65. Technology and Capacity Building Support Received........................................................... 112 66. Support Required .............................................................................................................. 112 67. Support Received for the Preparation of BURs.................................................................... 112 68. References ........................................................................................................................ 129 69. Appendix 1: Emission Estimate Table (CRF Format) ............................................................. 113 70. Appendix 2: Emissions of Indirect GHGs ............................................................................. 120 Emissions of NOx ................................................................................................................ 120 Emissions of NMVOC .......................................................................................................... 121 Emissions of CO .................................................................................................................. 122 Emissions of SO2 ................................................................................................................. 123 Methodology - Indirect GHG Emissions from Road Transport ............................................... 125 Methodology - NMVOC Emissions from 2G Food and Beverage Manufacture ....................... 126 Methodology - NMVOC Emissions from 3 Solvent Use ......................................................... 127
List of Tables Table ES1. Emissions of Greenhouse Gases (Gg CO2 EQ) ................................................................ 3 Table ES2. Emissions of CO2 (Gg CO2) ............................................................................................ 4 Table ES3. CH4 emissions (Gg CO2 EQ) ........................................................................................... 5 Table ES4. N2O emissions (Gg CO2 EQ)........................................................................................... 5 Table ES5. HFCs emissions (Gg CO2 EQ) ......................................................................................... 5 Table 3.1 Summary Table of Emissions – 2012 ............................................................................. 38 Table 3.2List of categories and emissions estimated ........................... Error! Bookmark not defined. Table 3.3 Emissions of Greenhouse Gases (Gg CO2 EQ) ................................................................ 43 Table 3.4 Emissions of CO2 (Gg CO2) ............................................................................................ 43 Table 3.5 CH4 emissions (Gg CO2 EQ) ........................................................................................... 45 Table 3.6. N2O emissions (Gg CO2 EQ) ......................................................................................... 47 Table 3.7. HFCs emissions (Gg CO2 EQ) ........................................................................................ 48 Table 3.9 Fuel Consumed by Inventory Sector (TJ, except Barrels of oil for Refinery Flaring). ........ 52 Table 3.10 Fuel Properties – Calorific Values. .............................................................................. 53 Table 3.11. Emission Sources in the Energy Sector by CRF (Mg CO2) ............................................. 54 Table 3.12. Domestic Commercial Aircraft Movements (LTOs) ..................................................... 58 Table 3.13. GHG Emissions from Road Transport (Mg) ................................................................. 59 Table 3.15 CO2emissions (Mg CO2) .............................................................................................. 63 Table 3.16 CH4 emissions (Mg CH4) ............................................................................................. 64 Table 3.17 N2O emissions (Mg N2O) ............................................................................................ 65 Table 3.18. International Aircraft Movements (LTOs) and Derived Fuel Use ................................. 66 Table 3.19. International Aircraft Emissions (Mg) ........................................................................ 66 Table 3.20. International Aircraft Emissions (Mg) ........................................................................ 67 Table 3.22 Production of Clinker and Lime (tonnes) .................................................................... 71 Table 3.23 Emissions of CO2 from Cement and Lime Production (Mg CO2) .................................... 71 Table 3.24 Consumption of Lubricants and Grease (Mg of product) ............................................. 72 Table 3.25 Asphalt production (Mg) ............................................................................................ 73 Table 3.26 HFC Emissions (tonnes of CO2 EQ) .............................................................................. 74 Table 3.59. Bauxite Industry Waste (Tonnes) .............................................................................. 78 Table 3.60. CH4 emissions from Municipal and Industrial SWDS (Gg CH4) ..................................... 78

Biennial Update Report of Jamaica
Table 3.61. Estimated Methane and Nitrous Oxide Emissions from Biodigesters (Gg) ................... 80 Table 3.62 Regional Categorisation of Hospitals .......................................................................... 80 Table 3.63. Default Emission Values for CO2 EFs for Incineration.................................................. 81 Table 3.64. Emission factors for Indirect Greenhouse Gases. Waste incineration .......................... 81 Table 3.65. Total emissions from Incineration of Medical and Industrial Waste (Gg) .................... 81 Table 3.66. EFs for Open burning of waste (indirect GHGs) .......................................................... 83 Table 3.67. Emissions from the Open Burning of Waste at Landfills (Gg of gas) ............................ 83 Table 3.68. Emissions from the Open Burning of Waste in Backyards (Gg of gas) .......................... 83 Table 3.69. Population Data for 2011 .......................................................................................... 84 Table 3.70. CH4 emissions from Domestic Wastewater Treatment Facilities (Gg) .......................... 85 Table 3.71. Annual Production, Wastewater Generation and COD values for Primary Industries in Jamaica ..................................................................................................................................... 87 Table 3.72 CH4 Emissions from Industrial Wastewater Treatment Plants (Gg) .............................. 88 Table 3.73. N2O Emissions from Wastewater treatment (Gg) ....................................................... 89 Table 3.74 Uncertainties in Emissions Estimates in Waste Sector ................................................. 92 Table 3.75 GHG Emission Uncertainties (Absolute and Trend) ..................................................... 95 Table 3.76 Uncertainties CO2 Emissions Estimates ....................................................................... 97 Table 3.77 Uncertainties in CH4 Emissions Estimates ................................................................... 99 Table 3.78 Uncertainties in N2O Emissions Estimates................................................................. 101 Table 3.79 Uncertainties in HFC Emissions Estimates ................................................................. 103 Table 3.80 Key Category Analysis .............................................................................................. 105 Table 9.79. NOx emissions (Gg NO2) ......................................................................................... 120 Table 9.82. NMVOC emissions (Gg NMVOC) .............................................................................. 121 Table 8.83. CO emissions (Gg CO) ............................................................................................. 122 Table 8.84. SO2 emissions (Gg SO2) ........................................................................................... 123 Table 3.14. “On the Road” Vehicle Numbers ............................................................................. 125 Table 8.85. Indirect GHG Emissions from Road Transport (Mg) .................................................. 125 Table 8.86 Food and Beverage Production Data (tonnes) ........................................................... 126 Table 8.87 NMVOC Emissions from Food and Beverage Production Data (tonnes)...................... 127 Table 8.88 Sources Involving Solvent Use .................................................................................. 127 Table 8.89 Consumption of Solvents for Domestic Activities ...................................................... 128 Table 8.90 Emissions of NMVOC from Solvent Use (Mg NMVOC) ............................................... 128
List of Figures Figure 3.2. Total GHG Emissions (Gg CO2 EQ) ............................................................................... 43 Figure 3.3. Emissions of CO2 (Gg CO2) .......................................................................................... 45 Figure 3.4. Emissions of CH4 (Gg CO2 EQ) ..................................................................................... 46 Figure 3.5 Emissions of N2O (Gg CO2 EQ) ..................................................................................... 48 Figure 3.6 Emissions of HFC (Gg CO2 EQ) ..................................................................................... 50 Figure 3.7 Fuel Consumption in the Road Transport Sector (TJoules) ........................................... 59 Figure 8.3 Emissions of NMVOC (Gg NMVOC) ............................................................................ 122 Figure 8.4 Emissions of CO (Gg CO) ........................................................................................... 123 Figure 8.5 Emissions of SO2 (Gg SO2) ......................................................................................... 124
14
1. Introduction
Context
As a signatory to the United Nations Framework Convention on Climate Change (UNFCCC) and in accordance with Article 4.1(a) of the UNFCCC, all Parties to the Convention are requested to update and report periodically on their inventory of anthropogenic emissions by sources and removals of greenhouse gases (GHGs) not controlled by the Montreal Protocol.
Jamaica, a Developing Country and Non - Annex 1 Party to the Convention, submitted its Second National Communication in 2011. It included Jamaica’s GHG emissions inventory for the period 2000 to 2005 complied using the 2006 IPCC Guidelines.
The concept of Measurement, Reporting and Verification (MRV) with regards to emissions inventories was first considered at the 13th Conference of the Parties (COP) in 2007. This was then developed in 2010 at the 16th Conference of the Parties, where some key elements were agreed. It was decided that Parties to the UNFCCC should submit a Biennial Update Report every two years, with the aims of increasing the transparency of mitigation actions and their effects. In adopting the decisions, the COP decided that developing country Parties should, consistent with their capabilities and the level of support provided for reporting, submit their first BUR by December 2014. However it was also agreed that Least Developed Country Parties and Small Island Developing States (SIDs), such as Jamaica, may submit their first BUR at their discretion. BURs are intended to provide updates on actions undertaken by a Party to implement the Convention, including the status of its greenhouse gas emissions and removals by sinks, as well as on the actions to reduce emissions or enhance sinks, and support needed and received to implement these actions. Developing Countries are required to prepare their BURs on the basis of the BUR guidelines adopted by the 17th Conference of the Parties, (COP 17) in 2012, which are contained in annex III to decision 2/CP.17.
2. BUR Reporting Guidelines
In using the BUR Guidelines, Developing Countries need to take into account their development priorities, objectives, capacities and national circumstances.
The objectives of the BUR guidelines are similar to those of the National Communication Guidelines:
To assist in meeting their reporting requirements under Article 4, paragraph 1(a), and Article 12 of the Convention and decision 1/CP.16;
To encourage the presentation of information in a consistent, transparent, complete, accurate and timely manner, taking into account specific national and domestic circumstances;
To enable enhanced reporting on mitigation actions and their effects, needs and support received, in accordance with their national circumstances, capacities and respective capabilities, and the availability of support;
To provide policy guidance to an operating entity of the financial mechanism for the timely provision of financial support needed by developing country Parties in order to meet the agreed full costs of preparing their biennial update reports (to the Global Environment Facility (GEF) in the case of first BUR);

Biennial Update Report of Jamaica
To facilitate the presentation of information on finance, technology and capacity-building support needed and received, including for the preparation of BURs;
To facilitate reporting to the extent possible, on any economic and social consequences of response measures.
3. Structure of this Report
The national circumstances of Jamaica are presented in Section 2 of this report. An overview of the national GHG emissions inventory is presented in Section 3. GHG emissions are summarised in Sections 3.1 and on a pollutant basis in Sections 3.8 to 3.12. The methodologies used to derive the emission estimates are included in Sections 3.13 to 3.17. Tables of detailed emissions estimates are presented in Appendix 1. An uncertainty analysis and key category analysis were conducted on the inventory, and results are presented in Sections 3.18 and 3.19. Section 4 of this report presents the steps being taken in Jamaica to Implement the Convention. Section 5 presents an overview of the existing constraints and gaps, highlighting the need for continued financial and technical support. 4. National Circumstances
Jamaica is a Small Island Developing State (SIDS) situated in the Caribbean Sea, comprising the third-largest island of the Greater Antilles with an area of 10,990 square kilometres (4,240 square miles) and population of approximately 2.7 million persons. The island was named Xaymaca, which meant “land of wood and water” by the Tainos, who were the first settlers, hence the name Jamaica. A British colony for 307 years, Jamaica became independent in 1962.
Source: https://www.welt-atlas.de/datenbank/karten/en/karte-0-9011-en.gif

16
5. Government Structure
Jamaica is a parliamentary constitutional monarchy with legislative power vested in the bicameral Parliament of Jamaica, consisting of an appointed Senate and a directly elected House of Representatives. Queen Elizabeth II is its monarch and head of state and her appointed representative in the country is the Governor-General of Jamaica. The Parliamentary system is that of the Westminster System. Jamaica effectively has a two-party system with two dominant political parties, and it is difficult for other parties to achieve electoral success. Members of the House of Representatives are elected for a 5 year term in a single constituency. The Cabinet is the centre of the system of Government. It initiates Government policies and programmes, and is responsible for the general direction and control of the Government. The Cabinet must consist of the Prime Minister and not less than 11 other ministers (no upper limit is specified). Not more than four ministers must be appointed from the Senate, and they may have portfolio responsibilities. The other Cabinet Ministers are appointed from the House of Representatives. The Climate Change Division established under the ministry with responsibility for the environment is responsible for Jamaica’s obligations as a Party to the United Nations Framework Convention on Climate Change, (UNFCCC). These includes the preparation of national GHG inventories, other reporting requirements for National Communications and Biennial Update Reports as well as the coordination and facilitation of mitigation and adaptation actions.
6. Population Profile
Demographic
Population Growth
Figure 1: Total population and growth

Biennial Update Report of Jamaica
Figure2: Population Growth Rate
Source: IndexMundi
Jamaica’s population for 2016 is given as 2,798,802 persons a growth rate of 0.38% from 1,419,874 in 1951 based on information sourced from the United Nations Department for Economic and social Affairs. The annual growth rate ranges from 0.46% in the year 2000 to a high of 0.8% in 2006 however from 2007 to 2014 the population growth rate has decline as shown above in Figure 2.
Migration continues to impact the size of the population, its growth and structure and other socioeconomic factors. It is largely younger highly skilled persons who constitute this group and most of eventually migrate mainly to the United States of America1
Figure 3: Population density and distribution of the population
Source: CIA World Factbook
1 Economic and Social Survey Jamaica, 2012, Published by the Statistical Institute of Jamaica, 16 Oxford Road, Kingston 5,Jamaica, West Indies

18
Figure 3 depicts the population density and distribution where the male and females in the age group 20-24 years is the most dominant. 7. Literacy Rate
Jamaica enjoys a relatively high literacy rate which has improved from 86% in 2007 to 91% in 2012. This is a result of the premium investment that the Government has made in the education sector. A 2011 Gleaner article reported that the Ministry of Education spent over J$70 billion dollars, which is the same as previous years.2
8. Fertility rate
Data from the 2012 Economic and Social Survey revealed that there have been no changes in the birth rate from the last reporting period (2006). There are currently 17 births per 1000 population in the 15-49 year old group. This is considered low in many quarters; however these figures are attributed to the work of the many institutions such as the National Family Planning Board which has been aggressively campaigning locally for better family planning, sexual and reproductive health practices. It is also representative of a worldwide trend where women prefer to delay having children, in pursuit of further career development in their child bearing years.
9. Health
While the latest available data on health in Jamaica as reported in the Jamaica Survey of Living Conditions 2012 revealed that 84.7% of Jamaicans were reported as having generally good or very good health, there was an increase in admissions and length of stay in hospitals. There was also a decline in the number of discharges. Climate change however threatens the health of the population and national economic viability. Increasing temperatures, humidity and dust has been linked to an increase in hospital admissions for respiratory related illnesses like asthma and bronchitis. Air pollution which releases harmful chemicals from activities such as the open burning of waste also contributes to an increase in these respiratory problems.3 The extended drought periods and the resulting declining water supply has led to an increase in the cases of vector borne diseases like Dengue Fever and more recently the Chikungunya Virus (disease carried by the same vector - Aedes Aegypti mosquito) .This is due to necessary water storage, which creates the ideal conditions for the breeding of vectors like the Aedes Aegypti mosquito (SNC, 2011). This virus which affected 60% of the Jamaican population, cost the Jamaican economy in 2014, some thirty million Jamaican dollars, due to work stoppage of the Jamaican labour force and the recovery time of 5-10 days4 (Gammon, 2014). Extended periods of droughts will also lead to malnutrition due to
2 Hill, K. (2011,April 7) The Gleaner “Educate Them To Stay”. Retrieved on October 8, 2015 from http://jamaica-gleaner.com/gleaner/20110417/lead/lead4.html 3 Bailey, W., Chen, A.A., and Taylor, M.A. ,2009, Review of Health Effects of Climate Variability and Climate Change in the Caribbean, Climate Studies Group ,Mona, University of the West Indies, Mona in association with the Caribbean Environment and Health Institute for the Mainstreaming Adaptation to Climate Change Project of the Caribbean Community Climate Change Centre (CCCCC), 2nd Floor Lawrence Nicholas Building Bliss Parade, P.O. Box 536, Belmopan City, Belize, 85 p. 4 Gammon, K. 2014, October 8. The Jamaica Observer : “The Cost of Chikungunya to Jamaica”, Retrieved from http://www.jamaicaobserver.com/columns/The-cost-of-chikungunya-to-Jamaica_17772229

Biennial Update Report of Jamaica
decline in food availability and production5 (Caribsave, 2009). Jamaica is particularly affected by this because the agricultural sector is largely rain fed. 10. Mortality rate
The 2012 Economic and Social Survey reveals Jamaica’s death rate is 5.7 per 1000 population. This has remained unchanged from 2006. This mortality rate is influenced by deaths due mainly to lifestyle, diseases, homicides and traffic accidents, which are all preventable causes of death. 11. Life Expectancy
The Life Expectancy figure of 72.7 years has remained the same generally for the Jamaican population, during the 2006-2012 reporting period (Jamaica’s Survey of Living Conditions 2012)6. However, the Jamaican woman’s life expectancy is far higher than the male, reported at 76 years (World Bank Statistics) Even though Jamaicans are living longer, these golden years are not so golden for this demographic of elderly people (60 years and older) who represents 10.6% of the population, because most of them live in poverty( 2006 Economic and Social Survey)7. Unfortunately, their socioeconomic circumstances from the 2006 Survey has not improved because the latest studies from the 2012 Economic and Social Survey revealed that the elderly represent 71.2% of the beneficiaries (most of whom were male) from Indoor Poor Relief Programme which is a component of the Programme of Advancement through Health and Education (PATH) . This programme is a social protection programme aimed at delivering benefits by way of cash grants to the most needy and vulnerable in the society, which is managed primarily by the ministries with responsibility for Labour, Social Security and Education.
12. Electricity
According to the 2012 Jamaica Survey of Living Conditions, 92% of Jamaican households are powered by the Jamaica Public Service Company; however 4.3% of Jamaican households rely on kerosene oil as a lighting source. This is a significant improvement from 7.1% from 2006. 13. Local Access to water
As the Table below suggests, most households in Jamaica have access to water which is piped into their dwelling (2011 Census of Population and Housing). Most of the exploitable water that is consumed locally is largely rain fed. Jamaica has been experiencing periods of drought for the past few years and this resulting decline in water has implications for the quality of water available for hygiene and sanitation purposes.
Table 1: Number of Households by source of water for domestic use
Source of water for domestic use Number of households
Piped into dwelling 438,014
Piped into yard 145,269
Access to standpipe 62,161
5 CARIBSAVE, 2009, CARIBSAVE Final Report: Negril-Jamaica (Report can be downloaded from the websitewww.caribsave.org; go to Projects and scroll down to DIFD Seed Funding Stage: Full Destination Profile for Negril, Jamaica – Download) (April 24, 2012) 6 Jamaica Survey of Living Conditions,2012, A Joint Publication of the Planning Institute of Jamaica and the Statistical Institute of Jamaica, 16 Oxford Road, Kingston 5, , and 7 Cecelio Avenue, Kingston 10 , Jamaica, West Indies 7 Economic and Social Survey Jamaica, 2006, Published by the Statistical Institute of Jamaica, 16 Oxford Road, Kingston 5, Jamaica, West Indies

20
Catchment 19,348
All of Jamaica 881,089
Source: Jamaica’s 2011 Census of Population and Housing
14. Waste Disposal
Proper waste disposal is critical to sanitation and public health. Data from the 2012 Jamaica Survey of Living Conditions reported that In Jamaica, 67.6% of households used a public or private garbage collection system which was presumably serviced by the National Solid Waste Management Authority (NSWMA) which has those responsibilities. However, 27.8% of the population dispose of their garbage by burning. This activity has public health consequences because it releases harmful chemicals into the atmosphere that can result in respiratory problems and contribute to climate change.
15. Geographic and Climate Profile
Jamaica lies between latitudes 17° and 19°N, and longitudes 76° and 79°W. The island are dominated by mountains, including the Blue Mountains which peaks at 2,256 meters above sea level, and is surrounded by a narrow coastal plains8. Chief towns and cities include the capital Kingston, Portmore, Spanish Town, Mandeville, Ocho Ríos, Port Antonio, Negril, and Montego Bay. Kingston Harbour is the seventh-largest natural harbour in the world9, which contributed to the city being designated as the capital in 1872. Besides the beaches there are many attractions for visitors including Dunn's River Falls in St. Ann, YS Falls in St. Elizabeth and the Blue Lagoon in Portland. The ecosystem includes dry and wet limestone forests, rainforest, riparian woodland, wetlands, caves, rivers, sea-grass beds and coral reefs. Among the island's protected areas are the Cockpit Country, Hellshire Hills, and Litchfield forest reserves, Jamaica's first marine park in Montego Bay, the Portland Bight Protected Area and the Blue and John Crow Mountains National Park10
There are considerable resources of fresh-and saltwater fish11. These include kingfish, jack, mackerel, whiting, bonito, tuna, snapper and mullet. The lionfish has become a significant threat.12 16. Climate
The climate is tropical, with hot and humid weather, although higher inland regions are more temperate13. Some regions on the south coast, such as the Liguanea Plain and the Pedro Plains, are relatively dry rain-shadow areas14. Jamaica lies in the hurricane belt of the Atlantic Ocean and because of this, the island sometimes suffers significant storm damage.15 Jamaica is also located in a seismically-active part of the world. The Enriquillo–Plantain Garden fault zone (EPGFZ), which is a system of strike-slip faults, runs along the southern side of the
8 "Geography of Jamaica". Jamaica Gleaner 9 Port Authority History". Port Authority of Jamaica 10 https://en.wikipedia.org/wiki/Jamaica 11 http://www.fishbase.org/Country/CountryChecklist.php?c_code=388&vhabitat=all2&csub_code= 12 http://www.reefresilience.org/lionfish-invasion-in-the-caribbean/ 13 Second National Communication of Jamaica, Government of Jamaica 14 Climate of Jamaica". Jamaica Gleaner 15 2102 State of the Jamaican Climate

Biennial Update Report of Jamaica
Dominican Republic and Haiti, and through the Plantain Garden River region in Jamaica. Seismic activity therefore creates additional risks for the island’s infrastructure, including the energy infrastructure. The report provided projections for the Caribbean and specifically Jamaica from the Global Circulation Models. The projections are compiled primarily from three sources:
a) The IPCC Fourth and Fifth Assessment Reports. b) The UNDP Climate Change Country Profiles c) The CARIBSAVE Climate Change Risk Atlas for Jamaica.
17. Temperature
Jamaica’s mean annual surface air temperature was projected to increase across all models in a 15 GCM ensemble and across all scenarios by 1.1 to 3.2 ˚C degrees by the 2090s. The range of increase was 0.7 to 1.8˚C by the 2050s and 1.0-3.0˚C by the 2080s. Projected mean surface air temperatures increase most rapidly over Jamaica in June, July and August.
The frequency of ‘hot’ Jamaican days and nights should continue to increase, reaching 30-98% of days annually by the 2090s. It is to be noted that the rate of increase varies substantially between models for each scenario. ‘Hot’ days/nights were projected to increase most rapidly in the period June, July and August (JJA) and September, October and November (SON), occurring on 60 to 100% of days/nights in JJA and SON by the 2080s. ‘Cold’ days/nights were projected to diminish in frequency, occurring on a maximum of 2% of days/nights by the 2080s. Cold days/nights decrease in frequency most rapidly in JJA. 18. Rainfall
Global Circulation Model (GCM) projections of future rainfall for Jamaica span both overall increases and decreases, but most models project decreases, especially by the end of the century. Projected rainfall changes range from -44% to +18% by the 2050s and -55% to +18% by the 2080s. The overall decrease in annual rainfall was strongly impacted by decreased JJA (early wet season) and SON (late wet season) rainfall. The drying will firmly establish itself somewhere in the middle of the current century. Until then, inter-annual variability will be a strong part of the rainfall pattern i.e. superimposed upon the drying trend. There was a tendency for decreases in rainfall extremes particularly in March, April and May (MAM). By the 2080s the range of changes is -19 to +9% for the proportion of rainfall during heavy events and -29 mm to +25 mm for 5-day maximum rainfall.
19. Wind Speeds
The GCM projections generally indicated an increase in mean wind speeds over Jamaica. Changes in annual average wind speeds ranged between -0.1 and +0.5 ms-1 by the 2080s across all models and emission scenarios. The greatest increases are expected to occur in MAM and JJA, ranging between -0.5 and +1.3ms-1 and -0.2 to 1.2ms-1 respectively by the 2080s.
20. Sunshine Hours
Most models projected an increase in sunshine hours over Jamaica by the end of the century. This likely reflects reductions in average cloud cover fractions as the country tends towards drier conditions. Under the A2 scenario, the changes in annual average sunshine hours span -0.2 to +0.9

22
hours per day, with largest increases in June, July and August (JJA) (-0.9 to +1.9 hours per day by the 2080s). 21. Sea-Surface Temperatures
GCM projections indicated continuing increases in sea-surface temperatures for the waters surrounding Jamaica. Projected increases ranged between +0.9˚C and +2.7˚C by the 2080s. Increases tended to be fractionally higher in September, October and November than in other seasons (1.0˚ to 2.9˚C by 2080).
22. Hurricanes, Storm Surges and Sea Level rise
Several recent studies have indicated that the frequency of storms may decrease due to decreases in vertical wind shear in a warmer climate. In several of these studies, intensity of hurricanes still increases despite decreases in frequency (CARIBSAVE Climate Change Risk Atlas – Jamaica (2011). This is supported by a simulation of current and future Category 3-5 storms based on downscaling of an ensemble mean of 18 global climate change models. The results show a doubling of the frequency of Category 4 and Category 5 storms by the end of the 21st century, despite a decrease in the overall frequency of tropical cyclones (Bender et al., 2010).
Changes to the frequency or magnitude of storm surge experienced at coastal locations in Jamaica are likely to occur as a result of the combined effects of:
a) increased mean sea level in the region, b) changes in storm surge height, or frequency of occurrence, resulting from changes in the
severity or frequency of storms and physical characteristics of the region (bathymetry and topography).
There was a high degree of uncertainty in projecting potential changes in sea level and hurricane intensity that might be experienced in the region under (global) warming scenarios.
The IPCC’s AR4 report summarised a range of SLR (Sea Level Rise) projections under each of its standard scenarios, for which the combined range spanned 0.18-0.59 metres by 2100 relative to 1980-1999 levels but these estimates have since been challenged for being too conservative by a number of studies.
Jamaica lies in the hurricane belt of the Atlantic Ocean and because of this, the island sometimes suffers significant storm damage.16
Jamaica is also located in a seismically-active part of the world. The Enriquillo–Plantain Garden fault zone (EPGFZ), which is a system of strike-slip faults, runs along the southern side of the Dominican Republic and Haiti, and through the Plantain Garden River region in Jamaica. Seismic activity therefore creates additional risks for the island’s infrastructure, including the energy infrastructure. 23. Temperature Trends
There was a warming trend in Jamaica’s surface air temperature data, evident from data collected at the airport stations. From 1992 to 2012 the trend at the two airport stations located on the coast, shown in the figures below was approximately 0.1 degrees Celsius/decade. This is less than the all island value quoted in the CARIBSAVE Risk Atlas which indicates a statistically significant annual trend of 0.27 degrees Celsius/decade. CARIBSAVE values show that the annual and seasonal rate of surface air temperature increase, ranged from 0.20 – 0.31 °C per decade.
16 2102 State of the Jamaican Climate

Biennial Update Report of Jamaica
It was also suggested that observed increases had been most rapid in June, July and August (JJA) at a rate of 0.31˚C per decade. It is not only mean surface air temperatures that increased. Data for Jamaica shows that the frequency of very hot days and nights had increased by 6% (an additional 22 days per year) every decade. The frequency of hot nights increased particularly rapidly in June, July and August when their frequency has increased by 9.8% (an additional 3 hot nights per month in JJA) per decade. As for the Caribbean region, the frequency of ‘cold’ nights decreased at a rate of 4% fewer ‘cold’ nights (14 fewer cold nights in every year) per decade. Figure 3: Annual temperature anomalies for Norman Manley (top panel) and Sangster (bottom panel) International Airports with respect to 1992-2010. Units are degrees Celsius.
Data source: Meteorological Service of Jamaica.
24. Rainfall
The mean Jamaica rainfall record shows no statistically significant trend. This was not surprising given the large inter-annual variability in rainfall. However if a linear trend is fitted to data from individual stations across Jamaica, areas of increasing rainfall over the 1992-2010 period may be identified over the centre of the island and areas of decreasing rainfall over the eastern and western parishes, as shown on the next page.

24
Figure 4: Map of rainfall trend (1992-2010)
Data source: Meteorological Service of Jamaica
Trends in rainfall extremes were largely been negative (decreasing) over the recent past. On an annual basis statistically significant decreases were observed in the proportion of total rainfall that occurred in ‘heavy’ events at a rate of -8.3% per decade over the observed period 1973-2008. There were also decreases in 1- day and 5-day maxima. These ‘trends’ should however be interpreted cautiously given the relatively short period over which they are calculated, and the large inter-annual variability in rainfall and its extremes.
25. Other Variables
Significant increases over the period were noted in the annual and seasonal values of wind speed around Jamaica in all seasons over the period 1960-2006. The increasing trend in mean annual marine wind speed is 0.26 ms-1 per decade.
There was no significant trend in Relative Humidity (RH) over Jamaica. The observed number of sunshine hours indicated statistically significant increases in sunshine hours in March, April, May, (MAM) and June, July, August (JJA) for Jamaica over recent years (1983-2001). Sea surface temperatures from gridded dataset indicated statistically significant increasing trends in June, July, August (JJA) and September, October and November (SON) of +0.7˚C per decade in the waters surrounding Jamaica. The mean annual increase is +0.4˚C per decade. Sea level measurements at Port Royal between 1955 and 1971 also indicate a 0.9 mm/year rising trend.

Biennial Update Report of Jamaica
26. Economic Profile
The main impediments to Jamaica’s development have often been described as ‘crime and corruption, poor governance, high energy costs, shortages of skilled labour, slow and dysfunctional government bureaucracy, and a poorly-performing judicial system.’17 While the country attempts to overcome these barriers through multifaceted programs, climate change is now recognized as a major development problem.
Figure 5: Annual GDP growth rate
Figure 6: Unemployment rate
17http://www.se4all.org/wp-content/uploads/2015/05/Jamaica_RAGA.pdf

26
Figure 7: Debt to GDP
Table 2: Poverty rate
KMA –
Kingston Metropolitan Area (Parishes of Kingston and St. Andrew)
27. Sectoral Information
The Energy Sector
The energy sector encompasses a wide range of different sources, and is typically the largest contributor to a GHG emissions inventory. The energy sector can be regarded as consisting of four primary areas. The following types of activities, as outlined below, represent the categories:
Exploration and development of primary energy sources;
Transmission and distribution of fuels;
Conversion of primary energy sources into more usable energy forms, both in the refining and in the electricity power plant;
Use of fuels in both stationary and mobile application.

Biennial Update Report of Jamaica
From these activities, various forms of emissions arise, as a result of combustion. In addition emissions can occur as fugitive emissions18, and the use of fuel in non-combustion activities – although both of these emission types are typically very small when compared with emissions from the combustion of fuels. The largest emission sources of almost all national GHG emissions inventories are the emission of CO2 from fuel combustion in stationary and mobile sources. The Common Reporting Format (CRF) for reporting GHGs provides a clear reporting format that allows comparability across countries. The table below provides a summary of emissions arising in Jamaica in the Energy sector, and how these are allocated to categories of the CRF.
Table 0. Emission Sources in the Energy Sector by CRF
CRF CRF Category Name Present in Jamaica
1A1 Fuel Combustion Activities – Energy Industries
1A1a Public Electricity and Heat Production Y – electricity generating stations
1A1b Petroleum Refining Y - emissions from the refinery
1A1c Manufacture of Solid Fuels and Other Energy Industries
N
1A2 Fuel Combustion Activities - Manufacturing Industries and Construction
1A2a Iron and Steel N
1A2b Non-Ferrous Metals Y – fuel used for bauxite/aluminium manufacture (mining activities also included in this sector)
1A2c Chemicals N
1A2d Pulp, Paper and Print N – This may occur, but fuel use was not resolved from other industrial sectors
1A2e Food Processing, Beverages and Tobacco Y – Fuel used for sugar and other food & drink manufacture
1A2f Non-Metallic Minerals Y – fuel used for cement manufacture
1A2g Other Industrial Mobile Machinery and Other stationary
Y – Fuel used for mobile machinery and industrial sectors not allocated to specific sectors
1A3 Transport
1A3a Civil Aviation Y – domestic aviation
1A3b Road transport Y – emissions from all road vehicle types
1A3c Railways (Y) – fuel use, & hence emissions included in the inventory, but included elsewhere
1A3d Domestic shipping/National Navigation Y – domestic shipping and fishing
1A3e Other Navigation N – No specific sources identified. Any emissions are expected to be captured in 1A3d
1A4 Fuel Combustion Activities – Commercial, Institutional, Residential, Agriculture/Forestry/Fishing
1A4a Commercial / Institutional Y – stationary and mobile machinery
1A4b Residential Y – residential stationary combustion
18Fugitive emissions occur as leaks or other unintended or irregular emission.

28
1A4c Agriculture / Forestry / Fishing Y – emissions from mobile machinery
1A5 “Other” Fuel Combustion N
1B1 Fugitive Emissions - Solid N
1B2 Fugitive Emissions - Oil and Natural Gas
1B2a Fugitive Emissions from Fuels – Oil &Natural Gas – Oil
Y – Flaring from the refinery
1B2b Fugitive Emissions from Fuels – Oil & Natural Gas - Natural gas
N
1C CO2 Transport and Storage N
Activities in the energy sector that are/aren’t present in Jamaica have not significantly changed across the last decade, although there have been significant changes to emissions from some sources with time:
1A1 Electricity generation and Refinery emissions: There has not been any substantial change, in that electricity generating stations in Jamaica are oil fired, and refinery activities continue in parallel with the importation of oils and other fuels.
1A2 Fuel Combustion in Industry: There is little heavy industry in Jamaica. The emissions from this sector are very much dominated by the bauxite/aluminium industry. It has not been possible to resolve these activities from mining, and hence mining and bauxite are included together. There have been significant changes in the activity levels of the bauxite/aluminium plant across the time series.
1A3 Transport: Whilst there have been changes to emissions across the time series from transport sources, there have not been any new sources introduced in recent years, and none of the existing sources have ceased. Aviation has fluctuated, depending on a number of factors including tourism (very much influenced by the health of the global economy). Fuel used in the road transport sector has shown a steady decline.
1A4 Commercial, Institutional, Residential: In the residential sector, wood and LPG are main fuel types, being used primarily for cooking, and small amounts for heating. LPG and charcoal are the main fuel types used in the Commercial/Institutional sector.
1A4 Agriculture/Forestry/Fishing: The main fuel use in these sectors is gasoline and diesel oil for a wide variety of types of mobile machinery.
The Industrial Processes and Product Use Sector
The Industrial Processes and Product Use (IPPU) sector addresses emissions that are released from industrial applications that physically or chemically transform inputs into emissions or from the use of products that contains GHGs that are released into the atmosphere. It does not include those processes related to energy combustion, processing, extraction and transport of fuels as those are estimated under the relevant sub-category under the Energy Sector.
Industries such as Cement and Lime production release CO2 into the atmosphere from the manufacturing process, as well as from fuel combustion. So corresponding emissions are reported in source categories under 1A Energy, as well as under 2 IPPU.
Emissions of CO2 arise from the unintentional oxidation of products such as lubricants and grease. These are captured in the emissions inventory. The use of various household products, chemicals and solvents are a significant source of NMVOC (an indirect GHG) into the air. Hence emission estimates from these sources are also included in the emissions inventory.
Refrigerators and Air Conditioning (AC) units (including AC in road vehicles), are also a source of GHGs, releasing hydrofluorocarbons (HFCs) into the atmosphere. Emissions arise from several

Biennial Update Report of Jamaica
stages: during manufacture (not relevant for Jamaica), leakage that arises during the use of the product, emissions during refilling/recharging of the HFC, and emissions during the disposal of the product. The magnitude of the emissions are very much dependent on the processes in place to minimise emissions to air.
NMVOC emissions are produced from a wide variety of processes in other manufacturing industries. Most are not relevant for Jamaica, but emissions arise during the manufacture of a range of food and beverages. Emissions are included in the emissions inventory. The table below provides a summary of source sectors where emissions arise (of GHGs and indirect GHG) and are included in the inventory.
Table 4: Emission Sources in the IPPU Sector by CRF
CRF CRF Category Name Present in Jamaica
Industrial Processes and Product Use
2A Mineral industry
2A1 Cement production Y - emissions from cement manufacture
2A2 Lime production Y – emissions from lime manufacture
2A3 Glass production N
2A4 Other process uses of carbonates N
2B Chemical industry N
2C Metal industry N
2D Non-energy products from fuels and solvent use
2D1 Lubricant use Y – use of lubricants (non-combustion)
2D2 Paraffin wax use N
2D3 Other Y – use of solvents
2E Production of Halocarbons and SF6 N
2F Consumption of Halocarbons and SF6
2F1 Refrigeration and air conditioning Y – emissions from refrigeration & air conditioning
2F2 Foam blowing agents N
2F3 Fire protection N
2F4 Aerosols N
2F5 Solvents N
2F6 Other applications N
2G Other
2H1 Pulp and paper N
2H2 Food and beverages industry Y
2H3 Other (please specify) N
Agriculture
The agricultural sector is considered to be one of Jamaica’s main drivers of economic growth, as it contributed approximately 6.8% to the island’s gross domestic product (GDP) in 2012. However in 2012 the agriculture sector suffered damages of Jamaican $1.452B from the effects of Hurricane Sandy. Jamaica has a decentralised agriculture sector, with over one hundred and seventy thousand registered farmers.
30
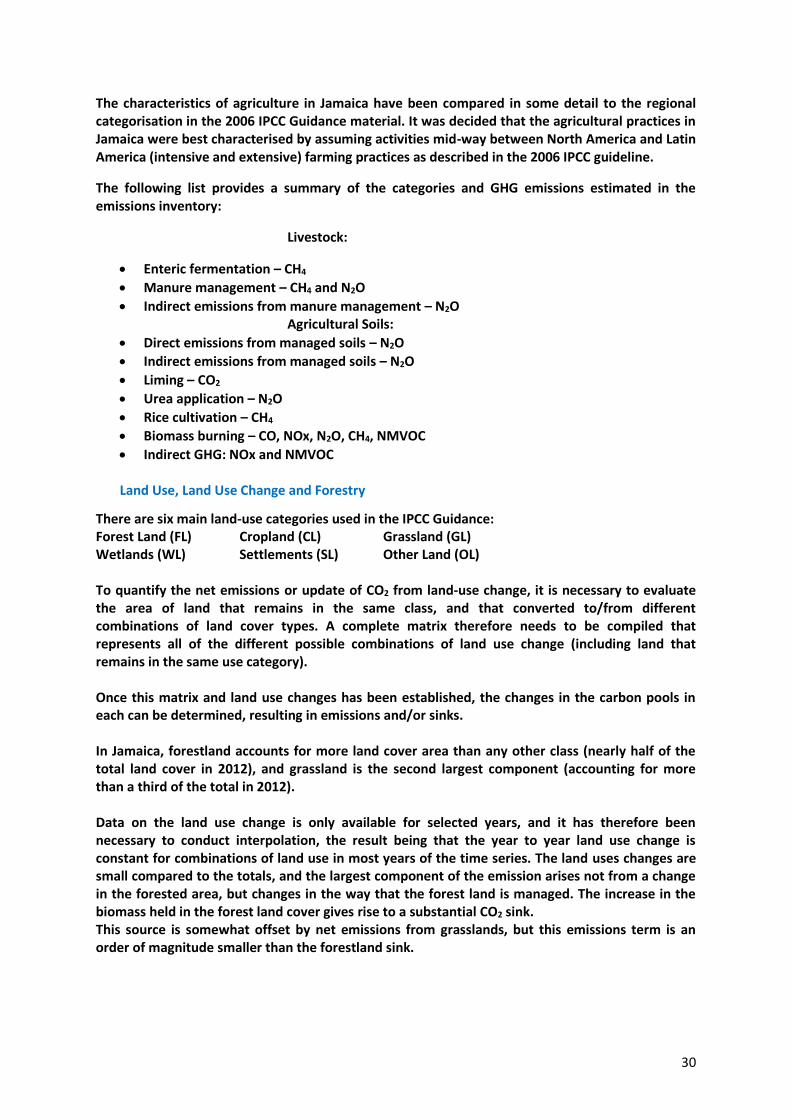
The characteristics of agriculture in Jamaica have been compared in some detail to the regional categorisation in the 2006 IPCC Guidance material. It was decided that the agricultural practices in Jamaica were best characterised by assuming activities mid-way between North America and Latin America (intensive and extensive) farming practices as described in the 2006 IPCC guideline.
The following list provides a summary of the categories and GHG emissions estimated in the emissions inventory:
Livestock:
Enteric fermentation – CH4
Manure management – CH4 and N2O
Indirect emissions from manure management – N2O Agricultural Soils:
Direct emissions from managed soils – N2O
Indirect emissions from managed soils – N2O
Liming – CO2
Urea application – N2O
Rice cultivation – CH4
Biomass burning – CO, NOx, N2O, CH4, NMVOC
Indirect GHG: NOx and NMVOC
Land Use, Land Use Change and Forestry
There are six main land-use categories used in the IPCC Guidance: Forest Land (FL) Cropland (CL) Grassland (GL) Wetlands (WL) Settlements (SL) Other Land (OL)
To quantify the net emissions or update of CO2 from land-use change, it is necessary to evaluate the area of land that remains in the same class, and that converted to/from different combinations of land cover types. A complete matrix therefore needs to be compiled that represents all of the different possible combinations of land use change (including land that remains in the same use category).
Once this matrix and land use changes has been established, the changes in the carbon pools in each can be determined, resulting in emissions and/or sinks.
In Jamaica, forestland accounts for more land cover area than any other class (nearly half of the total land cover in 2012), and grassland is the second largest component (accounting for more than a third of the total in 2012).
Data on the land use change is only available for selected years, and it has therefore been necessary to conduct interpolation, the result being that the year to year land use change is constant for combinations of land use in most years of the time series. The land uses changes are small compared to the totals, and the largest component of the emission arises not from a change in the forested area, but changes in the way that the forest land is managed. The increase in the biomass held in the forest land cover gives rise to a substantial CO2 sink. This source is somewhat offset by net emissions from grasslands, but this emissions term is an order of magnitude smaller than the forestland sink.

Biennial Update Report of Jamaica
The source and sink terms show little variation across the time series, but this is a reflection of the limitations of the available input datasets, rather than representing accurate year to year variations.
The Waste Sector
Waste management in Jamaica has been receiving a lot of public and political attention in recent years. There are general calls to improve the current solid waste management infrastructure, and recent landfill fires have given profile to some of the existing challenges associated with management of municipal solid waste (MWS). Some waste material is sent to anaerobic digestion, but the vast majority is sent to landfill. There is increasing pressure on this waste management route due to predicted population growth, and increases in the waste generated per capita. Emission estimates have been made for all of the known waste management routes:
Solid waste disposal of MSW land, i.e. landfill and subsequent emissions from the anaerobic breakdown of the waste.
Industrial waste: Some waste is sent to landfill, but much of the waste generated is inert material.
Biological treatment of solid waste: Some waste is sent to anaerobic digestion.
Incineration: An incinerator at the hospital is used to dispose of medical and some industrial waste.
Open burning of waste: This occurs at the landfill as well as in back yards.
Domestic and industrial wastewater: Emissions were calculated from the treatment plant.
28. National Priorities
Development Priorities
Vision 2030 Jamaica – Our Road to Sustainable Prosperity Vision 2030 Jamaica is our country’s first long-term National Development Plan which aims to put Jamaica in a position to achieve developed country status by 2030. It is based on a comprehensive vision: “Jamaica, the place of choice to live, work, raise families, and do business”. This envisages a major transformation from a middle income developing country to one which affords its citizens a high quality of life and world-class standards in critical areas including education, health care, nutrition, basic amenities, access to environmental goods and services, civility and social order. In the Jamaican context, these elements are fundamental to the achievement of progress towards a more sustainable society which integrates and balances the economic, social, environmental, and governance components of national development - a development that “meets the needs of the present without compromising the ability of future generations to meet their own needs.”
Priorities Related to the Mitigation of Climate Change
Jamaica submitted its Intended Nationally Determined Contribution to the UNFCCC in November 2015. Jamaica’s intended nationally determined contribution will mitigate the equivalent of 1.1 million metric tons of carbon dioxide per year by 2030 versus the BAU scenario. This is a reduction of 7.8% of emissions versus BAU. This target is predicated on the current level of implementation of the National Energy Policy and the existing pipeline of renewable energy projects.

32
Adaptation
Jamaica Initial National Communication submitted to the UNFCCC in 2000 and its Second National Communication submitted in 2011 contains information on the measures that the country will need to undertake to facilitate adaptation to climate change. These measures are for the five sectors that were identified through national consultations as the most vulnerable to the negative impacts of climate change. The sectors are water resources, agriculture, human health, coastal resources including human settlements and tourism.
Impact of Climate Change on Jamaica’s Coastal Areas
Change Factor Potential Impact on the Coast
Sea Level Rise 1. Flooding and inundation of low lying areas and coastal communities
2. Dislocation of coastal communities
3. Land loss
4. Saltwater intrusion
Hurricanes/Storm Surge
1. Increased coastal erosion and damage to coastal infrastructure and buildings
2. Loss of Tourism Investments and subsequent negative impact on employment
3. Increased likelihood of flooding
4. Increased risk to human life and risk of infectious disease
5. Damage to coastal resources such as coral reefs, sea-grasses and mangroves
Temperature 1. Coral bleaching from higher sea surface temperatures
Rainfall 1. Increased rainfall duration/intensity may result in higher incidence of flooding
Source: “Presentation on The Impact of climate Change on Coastal Areas in Jamaica”, Ms. Leiska Powell
APPROVED NATIONAL PROJECTS (Global Environmental Facility)
Project Name Agency GEF Grant (USD)
Co-financing (USD)(In-kind)
Enabling Jamaica to Prepare its First National Communication
UNDP 232,780 120,000
Climate Change Enabling activity UNDP 100,000 0
The Second National Communication of Jamaica UNDP 450,000 110,000
Third National communication and Biennial Update Report
UNDP 852,000 200,000
APPROVED NATIONAL PROJECT (Adaptation Fund)
Enhancing the Resilience of the Agricultural Sector and Coastal Areas to Protect Livelihoods and Improve Food Security
Planning Institute of Jamaica
9,965,000 5,980,360
APPROVED REGIONAL AND GLOBAL PROJECTS (GEF)
Project Name Agency GEF Grant (USD)
Co-financing (USD)
Building Capacity for Conducting Vulnerability and Adaptation Assessments in the Caribbean Region
UNDP 117,744 0
Caribbean Planning for Adaptation to Global Climate Change (CARICOM)
World Bank 6,500,000 0
Caribbean Renewable Energy Development UNDP 4,076,000 12,450,000

Biennial Update Report of Jamaica
29. Institutional Arrangements
Overall Co-ordination of MRV
The Climate Change Division of the Ministry of Economic Growth and Job Creation is responsible for the coordination and facilitation of all climate change related activities in Jamaica. These include the preparation, compilation and submission of Biennial Update Reports and National Communications as well as other related activities of Monitoring, Reporting and Verification. The Climate Change Division will be Jamaica’s representative in the International Consultative and Analysis, (ICA) process. The establishment of a domestic MRV system is in its embryonic stage with focus on exploring how this can be best achieved within the Climate Change Division.
Institutional Arrangements for the GHG Inventory System
Institutional arrangements in Jamaica for the GHG emissions inventory is currently undergoing substantial review. The sections below outline the arrangements used for the emissions inventory presented in this report. However, the UNDP project, “Third National Communication and Biennial Update report to the United Nations Framework Convention on Climate Change”, that supported the compilation of this GHG emissions inventory and this report includes a task to:
Review the current institutional arrangements in Jamaica
Compile and present information on best practice National Systems (for GHG emissions inventories), of which institutional arrangements is a component.
Make recommendations for the implementation of a National System in Jamaica that delivers the best possible.
Most of these activities will be completed before the project’s end date in 2017 and the start of the preparation of the next Biennial Update report in 2018. As a result, it is hoped that significant improvements can be made to the institutional arrangements however this will depend on the securing of financial support to assist the Government of Jamaica efforts.
Emissions Inventory Management
The management of the activities relating to the compilation and reporting of the national GHG emissions inventory is the responsibility of the Climate Change Division. The parent Ministry is able to provide management and co-ordination activities for: data gathering, emissions inventory compilation, QA/QC activities, emissions inventory reporting, file management and archiving. However, undertaking the majority of these activities requires financial support that is to be identified by the national Government.
Programme
Caribbean: Mainstreaming Adaptation to Climate Change
World Bank 5,000,000 4,300,000
Community-based Adaptation (CBA) Programme UNDP 4,525,140 4,525,140
Stabilizing GH Emissions from Road Transportation Through Doubling of Global Vehicle Fuel economy: Regional Implementation of the Global Fuel Economy Initiative (GFEI)
UNEP 1,713,637 13,460,582
34
Consequently, the Ministry is currently focused on undertaking activities associated with the management of specific international projects but would prefer the setting up for on-going annual cycle of activities.
National Experts
National experts were identified for each of the emissions inventory sectors, and were contracted by the Ministry. These national experts either led or contributed to the data collection and emissions inventory estimates and reporting for their respective sectors. All of these national experts were contracted from commercial consultancies, with the exception of the Agriculture expert, who was seconded from the Agriculture Ministry.
The technical work of the national experts was supported by and co-ordinated by an international emissions inventory expert, who had the overall responsibility of delivering the emissions inventory and the management of emissions inventory quality. There is currently no provision for on-going/continuous input from sector experts once the current contract is finished – although this is being reviewed/considered by the government.
Data Providers
There are effective mechanisms in place for Government departments and Ministries to request information that is required as input into the GHG emissions inventory. However, data supply agreements have not yet been established, and consequently the emissions inventory team are required to work with the data that is voluntarily provided by data providers (both within and outside government). Significant improvements could be made to the current data provision arrangements, not just to ensure the continuity of data provision, but also to drive up the quality of the data and ensure that it is provided in formats that can be readily incorporated into the emissions inventory. Of particular note are the energy balance tables (which required significant processing before the data could be used in the emissions inventory), and data from the agriculture sector (where data capture across the time series was far from ideal). However some processes are well established, for example there are procedures within Government for ensuring that confidential data is clearly identified and handled appropriately i.e. the data is provided with information on limiting the circulation, and details on what it can/can’t be used for, within the emissions inventory team.
The current inventory data provision arrangements are being reviewed, and recommendations will shortly be made available to develop the existing data flows into the emissions inventory system.
QA/QC and Continuous Improvements
At present, the lead inventory compiler (an international expert) is responsible for overseeing all QA/QC activities. This has been undertaken to UNFCCC best practice standards as data and resources have allowed. In particular all of the methodological choice and data handling has been reviewed in detail, and outputs have been compared against previous inventories and/or emission estimates from other countries. In addition, the national sector experts are increasingly being involved in QA/QC within their own sectors, and representatives from the Ministry are also providing thorough review and assessment

Biennial Update Report of Jamaica
of the outputs from the emissions inventory projects. All of these QA/QC responsibilities were clearly agreed at the outset of the project.
The current emissions inventory project has already identified a range of improvements relating to both the emissions inventory data and also the institutional arrangements. These will be taken into account as the Government continue to develop Jamaica’s national system as finding sources allow.
Institutional Arrangement for Mitigation Actions (including NAMAs)
The Climate Change Division has the responsibilities for coordinating the development and implementation of mitigation actions through the Senior Director for Mitigation. The establishment of a domestic MRV system is being explored and will be enhanced with the establishment of a database management system for the collection and archiving GHG inventory activity data in the Division. Jamaica’s first Nationally Appropriate Mitigation Action, (NAMA) template was developed by the Ministry with responsibility for energy, in collaboration with the Organización Latino Americana de Energía (OLADE), and the Climate Change Division. The NAMA developed through this collaboration focused on a scale-up of renewable electricity deployment. Currently, the Climate Change Division is working with Ministry of Science, Energy and Technology, (MSET) and OLADE to build the MRV framework for the NAMA, with the main focus on institutional capacity building. Other NAMAs are to be developed including through the USAID supported project, Climate Economic Analysis for Development, Investment and Resilience, (CEADIR). Climate resilient sector plans will be formulated for the energy, transportation, waste and finance sectors. CEADIR will output a proposed NAMA based on identified prioritized actions for each of the sectors.
Institutional Arrangement for Clean Development Mechanism
The Climate Change Division has the responsibilities for the promotion and implementation of mitigation actions including activities under the Clean Development Mechanism. Jamaica has established a National Designated Authority since 2004 and has a registered CDM project activity. The Climate Change Division works in close collaboration with the Ministry with responsibility for Energy and has developed a Carbon Trading Policy.
Support Required
The Climate Change Division requires support (additional staff and resources) to make it capable of executing its responsibilities for Mitigation actions such as NAMAs and participation in the CDM or any new market that are established under the UNFCCC.
This would ensure include institutional structures related to the GHG inventory, MRV of mitigation actions and MRV of support and links to national budget processes to enable operation on a continuous basis.
Support Received
The Climate Change Division has the responsibilities for the MRV of support received however the process for continuous operation is not yet in place and will require further support for its implementation.

36
Institutional Arrangements for BUR and NC
The institutional arrangements for the preparation on Jamaica’s Third National Communication and Biennial Update Report is seen in the organizational chart above. The Climate Change Division reports to the parent Ministry with responsibility for the Environment and is responsible for the preparation of national climate change reports.
The Project Management Unit is established in the Climate Change Division by the Ministry of Economic Growth and Job Creation, the ministry for the Environment.
The Project Board consists of representative from the Meteorological Service, the Planning Institute of Jamaica, The Emergency and Risk Management Division of the Ministry of Economic Growth and Job Creation. Chaired by the Climate Change Division that also provides secretarial support it also includes the UNDP. Incorporating the function of a “Project Steering Committee” it makes all final management decisions and ensure the coordination of the activities the Project Management Unit.
MINISTRY OF ECONOMIC GROWTH & JOB CREATION
MITGATION ASSESSEMENTS SASSESSMENTS
PROJECT MANAGEMENT UNIT
NATIONAL CIRCUMSTANCES
GHG INVENTORY
CROSS-CUTTING ISSUES
V&A ASSESSMENTS
CLIMATE CHANGE DIVISION
Third National Communication Biennial Update Report
CROSS-CUTTING ISSUES
MITIGATION ACTIONS
GHG INVENTORY
PROJECT BOARD
MRV

Biennial Update Report of Jamaica
30. GHG Emissions Inventory
The emission estimates presented here have been generated as part of the UNDP project “Third National Communication (TNC) and Biennial Update Report (BUR) to the United Nations Framework Convention on Climate Change (UNFCCC)” IC/2015/1. International guidelines (2006 IPCC Guidelines for National Greenhouse Gas Inventories, henceforth termed the 2006 IPCC Guidelines) were then used to provide the approaches and methodologies required to estimate emissions of GHGs from all relevant source sectors.
Emission estimates were made for: CO2, CH4, N2O and HFC’s. There were no quantifiable emission sources of PFC’s, SF6 or NF3 identified in Jamaica. The full scope of the emissions inventory is covered in detail in the following Sections. Emissions of indirect GHGs (CO, NOx, NMVOC, and SO2) were also included in the inventory. Results are presented in Appendix 1.The spreadsheets used to make the emissions estimates presented in this report are an integral part of the emissions inventory. If more detail is required than is presented here, then information can readily be obtained from these compilation spreadsheets, which have been designed to be transparent.
31. Summary Table Emissions Estimates for 2012
The table below presents emissions of direct and indirect GHGs for the most recent year of the emissions inventory, 2012. Similar tables of emissions for earlier years (2006 – 2011 inclusive) are presented in Appendix 2. Different aspects of the emissions inventory are considered in sections 3.2 to 3.5. The results from the emissions inventory are considered in Sections 3.6 to 3.11, where the emission trends for each GHG are presented and considered. Please note that 0.00 indicates values that are less than three decimal places.

38
Table 0.1 Summary Table of Emissions – 2012
Inventory Year: 2012
Greenhouse gas source and sink categoriesCO2 Emissions
(Gg)
CO2 Removals
(Gg)
CH4
(Gg)
N2O
(Gg)
CO
Gg
NOx
(Gg)
NMVOCs
(Gg)
SOx
(Gg)
HFC - 23 HFC - 134 Other CF4 C2F6 Other
Total National Emissions and Remov als 5761.13 40.58 21.27 82.45 43.98 29.65 16.00 0 52.39 39.43 0 0 0
1 - Energy 6909.33 1.41 0.24 69.06 33.58 9.88 15.99
1A - Fuel Combustion Ac tiv it ies 6909.05 1.41 0.24 69.06 33.58 9.88 15.99
1A1 - Energy Industries 2824.93 0.11 0.02 0.54 4.51 0.07 13.11
1A2 - Manufacturing Industries and Construction (ISIC) 1990.01 0.20 0.04 10.84 13.36 2.05 2.63
1A3 - Transport 1743.19 0.49 0.17 44.75 14.48 6.43 0.13
1A4 - Other Sectors 350.92 0.61 0.01 12.93 1.23 1.33 0.11
1A5 - Other NO NO NO NO NO NO NO
1B - Fugit iv e Emissions from Fuels 0.28 0.00 0.00 0.00 0.00 0.00 0.00
1B1 - Solid Fuels NO NO NO NO NO NO NO
1B2 - Oil and Natural Gas 0.28 0.00 0.00 0.00 0.00 0.00 0.00
2 - Industrial Processes 436.56 0.00 0.00 0.00 0.00 3.08 0.00 0 52.39 39.43 0 0 0
2A - Mineral Products 434.76 NA NA NA NA NA NA
2B - Chemical Industry NO NO NO NO NO NO NO
2C - Metal Production NO NO NO NO NO NO NO NO NO NO NO NO NO
2D - Other Production 1.80 NO NO NO NO NO NO
2E - Production of Halocarbons and Sulphur Hexafluoride NA NA NA NA NO NO NO NO NO NO
2F - Consumption of Halocarbons and Sulphur Hexafluoride NA NA NA NA NO 52.39 39.43 NO NO NO
2G - Other (please specify) NO NO NO NO NO 3.08 NO
3 - Solvent and Other Produc t Use 0.00 0.00 0.00 0.00 0.00 14.01 0.00
4 - Agriculture 12.87 20.88 8.07 10.09 1.67 0.00
4A - Enteric Fermentation 8.23 NA NA NA NA
4B - Manure Management 4.39 6.83 NA IE 1.61 NA
4C - Rice Cultivation 0.01 NA NA NA NA
4D - Agricultural Soils 6.68 NA 9.87 0.07 NA
4E - Prescribed Burning of Savannas NO NO NO NO NO NO
4F - Field Burning of Agricultural Residues 0.24 0.01 8.07 0.22 NE NE
4G - Other (please specify) 2.50 NO 7.36 NO NO NO NO
5 - Land-Use Change & Forestry -1625.88 0.00 0.00 0.00 0.00 0.00
5A - Changes in Forest and Other Woody Biomass Stocks -1777 NA NA NA NA
5B - Forest and Grassland Conversion 83 NA NA NA NA
5E - Other (please specify) 68 NA NA NA NA
6 - W aste 38.62 26.30 0.15 5.33 0.31 1.01 0.01
6A - Solid Waste Disposal on Land 22.05 0.00 0.00 0.87 0.00
6B - Wastewater Handling 3.63 0.13 0.00 0.00 0.00 0.00
6C - Waste Incineration 5 0.00 0.00 0.00 0.00 0.02 0.00
6D - Other (open bruning and biological treatment) 33 0.62 0.01 5.33 0.30 0.12 0.01
7 - Other (please spec ify) 0.00 0.00 0.00 0.00 0.00 0.00 0.00 NO NO NO NO NO NO
NO NO NO NO NO NO
Memo Items
International Bunkers 1365.79 0.06 0.04 1.97 19.12 0.63 4.23
1A3a1 - International Aviation 739.34 0.01 0.02 0.49 3.29 0.08 0.23
1A3d1 - International Marine (Bunkers) 626.45 0.06 0.02 1.48 15.83 0.54 4.00
CO2 emissions from biomass 586.92
HFCs (Gg CO2 EQ) PFCs (Gg CO2 EQ)

Biennial Update Report of Jamaica
32. Sector and Pollutant Coverage
The emissions inventory has been compiled to give as complete a dataset as possible with the available inputs. The following table provides a summary of the pollutant emission estimates from each source sector. Table 0.2 List of categories and emissions estimated
CRF code Sector CO2 CH4 N2O HFC CO NOx NMVOC SO2
1 Energy
1A1a Public electricity and heat production
1A1b Petroleum refining
1A2b Mining/Bauxite
1A2e Sugar and other food/drink manufacture
1A2f Cement
1A2gvii Industry, Mobile machinery
1A2gviii Industry Other, Stationary
1A3aii(i) Domestic aviation LTO (civil)
1A3b Road Transport
1A3bi Cars
1A3bii LDVs
1A3biii HGVs
1A3biv Motorcycles
1A3d Domestic shipping/National Navigation
1A4ai Commercial/institutional: Stationary
1A4aii Commercial/institutional: Mobile
1A4bi Residential: Stationary
1A4cii Agriculture/Forestry/Fishing: Mobile
1B2aiv Refinery flaring
2 IPPU
2A1 Cement
2A2 Lime
2F HFC consumption
2G Non-Energy Products
2G Food & Drink
3 Solvent Use
3 Domestic Solvent Use
3 Coating Applications
3 Dry Cleaning
4 Agriculture
4A Breeding Swine - Enteric
4A Dairy Cattle – Enteric
4A Goats – Enteric
4A Horses – Enteric
4A Market Swine – Enteric
4A Mules/Asses – Enteric
4A Other Cattle – Enteric
4A Sheep - Enteric
4B Livestock Manure management
4B Breeding Swine
4B Dairy Cattle
4B Goats
4B Horses
4B Market Swine
4B Mules/Asses
4B Other Cattle
4B Poultry- Chickens (Broilers)
4B Poultry- Chickens (Layers)
4B Poultry- Ducks & Geese
4B Poultry- Turkeys

40
CRF code Sector CO2 CH4 N2O HFC CO NOx NMVOC SO2
4B Rabbit
4B Sheep
4C Rice
4D Crop residues
4D Cultivated Soils
4D Drained/managed organic soils
4D Grazing animals
4D Lime Application
4D NO from managed soils
4D Organic N fertilizer
4D Synthetic N fertilizer
4D Urea Fertiliser Application
4F Field Burning
4G Manure - Atm. Deposition
4G Manure - Leaching/runoff
4G Soils- Atm. Deposition
4G Soils- Leaching/runoff
5 LULUCF
5A Forest Land Remaining Forest Land
5B Land Converted to Forest Land
5B Land Converted to Grassland
5E Land converted to Cropland
5E Land converted to Settlement
5E Other land Remaining other land
5E Land converted to Other Land
6 Waste
6A Solid waste disposal on land
6B Domestic wastewater handling
6B Industrial wastewater handling
6C Waste incineration
6D Biological treatment of waste
6D Open burning of waste (backyards)
6D Open burning of waste (landfills)
33. Temporal Coverage
The emissions inventory data presented are for the years 2006-2012. However, data was also collected for the earlier years of 2000-2005 as far as resources allowed and emission estimates were calculated. This was done in an attempt to generate a longer time series to better illustrate emission trends. However, the data that was obtained for these earlier years were not of a good level of completeness, and this therefore significantly restricts the uses of the data in these earlier years. So throughout this report, the years 2006-2012 are presented. The limited data from years before 2006 also meant that it was not possible to undertake a detailed comparison with the GHG emissions inventory for Jamaica reported in the Second National Communication (2NC) covering the years 2000 – 2005 (Final Report Jamaica’s Greenhouse Gas Emissions Inventory 2000 to 2005, Davis et al 2008). Comparing the different versions of the inventory provides a valuable quality check, highlighting and significant revisions to the emission estimates that arise either from improved input data or the use of more detailed emission estimation methodologies.
34. Methodology, Parameters and Emission Factors
Attempts were made to source country specific emission factors (EFs) and parameters at the most detailed level available. However, it became evident that little country specific data exist. As a

Biennial Update Report of Jamaica
result, the EFs and other key parameters required for estimating emissions were taken from the 2006 IPCC Guidelines for the vast majority of individual source emission estimates. Country specific data were available regarding the properties of some fossil fuels. In addition, whilst country specific calculations were required for processing some of the input data before it was used in emission estimation calculations, no country specific approaches or methodologies had been developed for estimating emissions. As a result, methodologies for estimating emissions were all taken from the 2006 IPCC Guidelines, Volumes 2-5, and the 2006 GPG-LULUCF.
Guidance specifically relating to the compilation of emissions inventories in BURs has been made available from the UNFCCC (UNFCCC BUR Guidelines, 2011). This indicates that methodologies from the 1996 IPCC Guidelines “should” be used. However, the guidance does recognise that there may be national circumstances which influence this decision. For the emissions inventory presented in this report, methodologies have all been taken from the 2006 IPCC Guidelines and the IPCC Good Practice Guidance for LULUCF (2003). This decision was made after careful consideration of the existing plans in Jamaica:
It was recognised that significant resources have been made available for the compilation of the 2006-2012 inventory presented here. It may not be possible to attract similar levels of funding in the future. It is therefore it is sensible to deliver an emissions inventory which is “future-proofed” as far as practicable.
Jamaica wishes to implement a programme of continuous improvement for the emissions inventory, and this proposes that the most up to date available guidance is used to support inventory compilation.
The BUR guidance (UNFCCC BUR Guidance, 2011) indicates that the global warming potential (GWP) of GHGs “should” be taken from the IPCC Second Assessment Report (IPCC, 1995), rather than the updated GWPs published in the Fourth UNFCCC Assessment Report (IPCC, 2007). This guidance was followed, on the basis that it allows consistency with a large number of other emission inventories, and in particular those reported by other non-Annex 1 parties to the UNFCCC. It was also noted that updating the GWPs is a relatively simple change to make in future years, when it becomes appropriate to do so.
35. Activity Data
Collection of high quality data is a critical success factor in completing a high quality GHG emissions inventory. The process of collecting data can be a very challenging exercise in developing countries, and countries which are not particularly data rich. It can also be challenging to assess the quality of the collected data. A substantial amount of effort was invested in sourcing activity data. Details are include in each of the sector specific chapters that follow. The availability of high quality activity data (in particular good levels of transparency, completeness, consistency and accuracy) was very variable across the source sectors. For example:
National energy balance tables were available from 2006 onwards, and as is typical, the data is considered to be generally high in completeness and accuracy.
Data on crop production were available in detail for 2000 to 2013, providing a high quality input dataset. Livestock numbers were also available for this time period, but data had to be sourced from different institutes for different parts of the time series. As a result, it is thought that some internal inconsistencies have been introduced into the time-series data.
There was very limited information on the use of HFCs in refrigeration and air conditioning. HFC import data were made available, but it was challenging to estimate the total amounts of HFC in products in Jamaica, and hence emissions to air. This is not unusual, as in general, specific surveys and bespoke datasets are needed as input into HFC emission calculations.

42
CO2 emissions and uptake from land use change and forestry were estimated to a high level of completeness. However, a number of key assumptions and extrapolation is used to generate input data for the entire time series. This is expected to have a significant impact on the quality of the input data.
These and other examples are presented in this report in the more the detail sector-specific chapters that follow. Improving the availability of high quality activity data features very strongly in the emissions inventory improvement activities listed in each of the sector chapters. There are also improvements that can be made to the national system that will help support the provision of high quality activity data. Review of, and recommendations for improvement to, the national system will be included in a separate report under this project (Third National Communication (TNC) and Biennial Update Report (BUR) to the United Nations Framework Convention on Climate Change (UNFCCC)” IC/2015/1).
36. The National System
The Jamaican emissions inventory is not currently routinely compiled, but is updated when international resources allow the task to be undertaken. Therefore, whilst there is an extensive amount of expertise in-country, there is no national system per se – management of the emissions inventory compilation is undertaken on a project by project basis. This can result in some drawbacks. For example, the compilation spreadsheets used in the 2000-2005 emissions inventory (Davis et al, 2008) could not be located for the project compiling the 2006-2012 emissions inventory. This means that it has not been possible to ensure continued transparency of the 2000-2005 version of the emission inventory, and considerably more resource were required to generate the 2006-2012 emissions inventory than if these original source files had been available. The project that has delivered the 2006-2012 emissions inventory has also ensured full transparency in delivering the compilation spreadsheets so that they are readily available for future use. A report is also being prepared that considers the most appropriate steps to take to allow the creation of a national system, to support on-going work to update and improve the most recent emissions inventory. The emissions inventory presented in this report has been compiled with rigorous QA/QC processes that comply with (and exceed) emissions inventory best practice as presented in the 2006 IPCC Guidance. It has been recommended that these are maintained and continued for the next version of the emissions inventory. Efforts have been made to ensure that as much of the QA/QC work undertaken is transparent, so that they can be easily reproduced in the next version of the emissions inventory,
37. Emissions of Direct GHGs
The following table presents a summary of emissions of GHGs, expressed as CO2 equivalents. Emissions of CO2 dominate the total, and arise almost exclusively from fuel combustion activities. Emissions of N2O make a substantial contribution to the emission total, and are almost exclusively from agricultural activities. CH4 makes a small contribution to the total emission, emissions arising from agricultural activities and landfill sites. HFC makes a very small contribution to the total, being emitted from refrigeration and air conditioning equipment in use, during refill and when scrapped. Land Use, Land Use Change and Forestry (LULUCF) is a net sink. The LULUCF total is a combination of several components, some of which are very large sources and sinks – particularly in the forestry sector. However, the net total from LULUCF is a sink that does not make a particularly large contribution to the total GHG emission.

Biennial Update Report of Jamaica
Table 0.3 Emissions of Greenhouse Gases (Gg CO2EQ)
2006 2007 2008 2009 2010 2011 2012
CO2 21,819 19,187 20,727 15,304 14,113 15,264 14,296
CH4 818 835 841 857 847 831 852
N2O 3,870 4,985 6,874 6,662 6,643 4,426 6,594
HFC 87 92 95 95 93 92 89
LULUCF -1,685 -1,638 -1,631 -1,622 -1,618 -1,616 -1,626
Total excluding LULUCF 26,595 25,100 28,537 22,919 21,696 20,614 21,831
Total including LULUCF 24,910 23,462 26,906 21,298 20,078 18,998 20,205
The trend of the total emission is downwards and is dominated by reductions in CO2 emissions with time (see figure below). Emissions N2O vary across the time series - this is a result of significant year to year variations in livestock numbers, with numbers being noticeably lower in 2006 and 2011. Emission trends are considered in more detail, on a pollutant by pollutant basis, in the following sections, and show that the reduced fuel consumption in the mining/bauxite industrial sector is the dominant component in determining the changes in emissions of CO2 across the time series, which in turn dominates the changes across the time series of total GHG emissions.
Figure 0.1. Total GHG Emissions (Gg CO2 EQ)
38. Emissions of CO2
The following table summarises the emissions of CO2 across the 2006 – 2012 time series. These data are also presented in the figure below.
Table 0.4 Emissions of CO2 (Gg CO2)
2006 2007 2008 2009 2010 2011 2012
Public electricity and heat production
3,004 3,171 3,062 3,130 3,093 3,062 2,825

44
Mining/Bauxite 4,600 2,964 4,146 1,547 1,239 1,673 1,525
Other Industrial Combustion
361 457 573 393 264 434 465
Road Transport 2,062 1,993 1,889 1,979 1,886 1,876 1,726
Other Transport/Mobile
49 42 39 19 25 18 17
Commercial, Residential (including Ag/For)
539 703 361 319 321 332 351
Energy 10,614 9,330 10,070 7,387 6,828 7,394 6,909
Cement & Lime 542 478 535 482 414 433 435
Other (Flaring, Non-E Prod Agri, Waste)
49 49 53 49 43 43 43
Total Excluding LULUCF
21,819 19,187 20,727 15,304 14,113 15,264 14,296
Land-Use Change - Forest remaining Forest
-1,834 -1,786 -1,779 -1,770 -1,767 -1,766 -1,777
Land-Use Change - Other
148 148 147 148 149 150 151
LULUCF -1,685 -1,638 -1,631 -1,622 -1,618 -1,616 -1,626
Total including LULUCF
20,134 17,549 19,096 13,683 12,495 13,648 12,670
Emissions of CO2 are dominated by fossil fuel combustion sources, the largest components being electricity generation, industrial combustion (dominated by the mining/bauxite industry) and road transport. Almost all sources are relatively constant across the time series, showing only small decreases with time. However the exception to this is the mining/bauxite industry, which shows very large year-to-year variations, and this consequently dominates the trend with time. These large year-to-year variations in the mining/bauxite sector are considered to be a genuine representation of the changes in the quantities of fuel oil used for plant operations, and hence changes in the output levels from the industry. Changes across the time series are attributed to economic factors, and in particular the substantial decrease in emissions from 2008 to 2009 represents the impact of the global economic downturn on the industry. Similar trends with time are evident in the other industrial combustion emissions, although the absolute emissions are smaller. CO2 emissions from electricity generation have decreased by relatively small amounts since 2009. This is a direct representation of lower levels of fuel oil and diesel oil consumption (and is independent of changes in electricity generating efficiencies). Emissions from oil refining is also included within this sector. Emissions from road transport have decreased across the time series. This has been caused by a combination of several different factors. Gasoline consumption across the time series has reduced by 22%, although this is offset by an increase in the diesel consumption. Whilst diesel consumption accounts for considerably less than gasoline, it has increased across the time series by 19%. The emissions calculations are based on fuel consumption, and do not use vehicle kilometre data. The results therefore do not reflect improvements in the fuel economy (kilometres per litre of fuel used) of the road vehicle fleet which are likely to occur across the time series, merely changes in the amounts of fuel used. However improved fuel economy is likely to be one of

Biennial Update Report of Jamaica
the several factors that influences the fuel consumption across the time series, along with changes in fuel prices and levels of disposable income across the general population.
LULUCF makes a significant contribution to the total CO2 emissions. However there is very little year-to-year variability of the LULUCF emissions, meaning that this source has very little impact on the emissions trend. LULUCF emissions are high in uncertainty, in particular when compared with fuel combustion sources which are typically very well characterised. More details can be found in the uncertainty analysis presented in Section 3.19.
Figure 0.2. Emissions of CO2 (Gg CO2)
39. Emissions of CH4
The following table summarises the emissions of CH4 across the 2006 – 2012 time series. These data are also presented in the figure below.
Table 0.5CH4 emissions (Gg CO2EQ)
2006 2007 2008 2009 2010 2011 2012
Fuel Combustion 35 33 35 34 31 30 30
Enteric Fermentation
173 181 174 168 161 154 173
Manure Management
92 101 107 103 99 85 92
Agriculture - Other 5 6 5 5 5 5 5
Landfill 400 412 422 456 468 468 463
Waste - Other 113 102 97 92 83 89 89
TOTAL 818 835 841 857 847 831 852

46
The largest contributions to the total CH4 emission come from the agriculture sector (primarily enteric fermentation and manure management) and from landfills. Overall, the year-to-year variability of emissions is small- although emissions from landfill show a steady increase across the time series (16% increase from 2006 to 2012), and emissions from agriculture are more variable from year-to-year than other source sectors.
CH4 emissions from agricultural activities are dominated by enteric fermentation. The largest component of the CH4 emissions from enteric fermentation is non-dairy cattle, followed by dairy cattle. Enteric fermentation emissions per head of dairy cattle are larger than non-dairy, but the substantially greater number of non-dairy cattle means that emissions from non-dairy cattle are approximately four times the emissions from dairy cattle. Similarly, goats emit lower levels of CH4 per head compared to cattle. However the larger number of animals means that the total CH4 enteric emissions are approximately 50% higher than those from dairy cattle.
Emissions of CH4 from manure management are approximately half of the emissions from enteric fermentation. Pigs and poultry make the largest contributions to the total CH4 from manure management, collectively accounting for nearly three quarters of the total CH4 emissions from manure management in 2012. Emissions from landfill are the largest component of CH4 emissions, and result from the breakdown of organic waste under anaerobic conditions. CH4 emissions from waste that is landfilled in a specific year occur across a long time period. Consequently the emissions in any given year represents the sum of emission contributions from waste that has been landfilled across many years previously.
Emissions from other sources in the waste sector include industrial and domestic waste water treatment, and small emissions from anaerobic digestion and waste burning (open burning and waste incineration).
Figure 0.3. Emissions of CH4 (Gg CO2 EQ)

Biennial Update Report of Jamaica
40. Emissions of N2O
The following table summarises the emissions of N2O across the 2006 – 2012 time series. These data are also presented in the figure below.
Table 0.6. N2O emissions (Gg CO2EQ)
2006 2007 2008 2009 2010 2011 2012
Fuel Combustion 94 88 91 87 77 79 76
Manure Management 1,230 1,606 2,243 2,175 2,164 1,413 2,118
Agricultural Soils - Other 1,298 1,626 2,155 2,078 2,073 1,425 2,072
Agriculture - Indirect 1,202 1,620 2,338 2,277 2,285 1,464 2,284
Waste 46 46 47 46 45 45 45
Total 3,870 4,985 6,874 6,662 6,643 4,426 6,594
Emissions of N2O are dominated by the agriculture sector (accounting for 98% of total N2O emissions in 2012). Calculation of N2O emissions in the agriculture sector uses a nitrogen flow approach. This requires all input and output terms to be evaluated throughout the entire agriculture sector, and allows a more accurate evaluation of the different emission terms. More detail can be found in Section 5 of this report. N2O emissions from each of the three main agricultural sectors (manure management, agricultural soils and indirect emissions) are broadly similar in magnitude. Manure management includes emissions from animal housing and during handling/storage of the manure. Emissions from agricultural soils include several components:
Emissions from the application of synthetic fertilisers and manure (organic fertiliser) to crops;
Emissions from manure deposited to fields from grazing animals;
Emissions from the crop residues incorporated into the soil;
Emissions from drained or managed organic soils.
Indirect emissions also arise through a number of different routes or mechanisms:
A fraction of agricultural N emissions deposited back to land, and a fraction of the deposited N is re-emitted as N2O;
N2Ois emitted from N that leaches or runs-off from agricultural fields;
N2O is emitted from N that leaches or runs-off from manure during storage;
Some of the interactions between these different pathways are complex, which is why better levels of accuracy is generally attained by evaluating the flow of N through the entire agriculture sector.
N2O emissions do vary considerably across the time series. This is largely driven by the changes in livestock numbers, and hence the total amount of N being generated from livestock farming. This impacts not just on manure management emissions, but also emissions from soils because it determines the amount of manure available for use as organic fertiliser. The amounts of synthetic fertiliser used annually were also available, and also impact on the year-to-year emissions from soils. It was not possible to obtain any reliable information on changes to practices in either livestock of arable farming, and so this was assumed to be constant across the time series. As a result, the emission trend presented here does not incorporate any potential impact from changes to farming practices across the time series.

48
Figure 0.4Emissions of N2O (Gg CO2 EQ)
41. Emissions of HFC
The following table summarises the emissions of HFC across the 2006 – 2012 time series, broken out by HFC species. Emissions are estimated to arise solely from refrigeration and air conditioning. These data are also presented in the figure below.
Table 0.7. HFCs emissions (Gg CO2EQ)
2006 2007 2008 2009 2010 2011 2012
HFC-23 4.31 5.47 6.60 7.70 8.78 9.84 10.89
HFC-125 12.43 12.94 13.09 12.92 12.49 11.83 11.49
HFC-134a 44.32 49.14 52.22 53.82 54.15 53.42 52.39
HFC-143a 16.04 18.14 19.16 19.29 18.64 17.35 16.31
HFC-152a 0.00 0.00 0.00 0.00 0.00 0.00 0.00
HFC-227ea 1.69 1.43 1.22 1.03 0.88 0.75 0.64
HFC-236fa 0.28 0.24 0.20 0.17 0.15 0.13 0.11
Total 79.07 87.36 92.49 94.94 95.10 93.32 91.81
Emissions of HFC for refrigeration and air conditioning increase from 2006 – 2010, and then fall from 2010 to 2012. This is a reflection of the emission trend for HFC134a, which is the largest component of the total HFC emission. The emission trend is high in uncertainty, because import data has been interpolated for 2006 to 2012. But the trend does represent emissions that arise from the increasing importation of HFC up to 2005, and then a steady decline in the importation of HFC134a. HFCs are typically used in, and emitted from, a number of bespoke applications in addition to air conditioning and refrigeration equipment, as outlined below. However, it is known that many sources are either not occurring in Jamaica, or it is not possible to quantify the HFC emissions

Biennial Update Report of Jamaica
arising. For the reasons indicated below, the emissions inventory reports the emissions to arise solely from air conditioning and refrigeration (as presented above).
Air Conditioning and Refrigeration
All imports of HFC were assumed to be used for refrigeration and air conditioning. This assumption is supported by the detailed analysis of the import data (which in some cases indicates cylinders designed for use with road vehicle air conditioning units), and local expert judgement that indicated that several of the other common uses of HFCs did not occur in Jamaica (see below).
Refrigeration and air-conditioning systems can be broken down by type or use (UNEP-RTOC, 2003), as indicated below:
Domestic (i.e., household) refrigeration (typically < 375kW)
Commercial refrigeration including different types of equipment, from vending machines to centralised refrigeration systems in supermarkets (typically < 1000 kW)
Industrial processes including chillers, cold storage, and industrial heat pumps used in the food, petrochemical and other industries (typically > 1000 kW)
Transport refrigeration including equipment and systems used in refrigerated trucks and containers
Stationary air conditioning including air-to-air systems, heat pumps, and chillers for building and residential applications
Mobile air-conditioning systems used in vehicles.
There are different approaches that can be used for estimating emissions, the two most common approaches consider the stock of different types of equipment, and a simpler approach that assumes that imported HFC is used to replace leakage. The method used for estimating emissions from refrigeration and air conditioning is detailed in Section 3.15.3.
Foam Blowing
All imports of HFC were assumed to be used for refrigeration and air conditioning, and consequently HFC emissions from foam blowing are assumed to be “not occurring”. This is consistent with the approach used in the 2NC.
Fire Suppression Equipment
Some of the HFCs imported are species used in fire suppression equipment as well as refrigeration and air conditioning. However, it was not possible to identify whether the imported HFC was specifically for use in fire suppression applications, and the 2NC indicates that there was only one occasion when a HFC was imported for fire suppression in the 2000-2005 period. It was decided to assume that no HFC imports were for fire suppression equipment for 2006-2012, and this source is therefore considered as “not occurring” in the emissions inventory.
Aerosols, Metered Dose Inhalers and Solvents
No information was available to identify any import or use of HFCs for aerosols or metered dose inhalers. Consequently this source is considered as “not occurring” in the emissions inventory. The 2NC does identify some importation of HFC-245fa for use as a solvent (a surfactant in paint). However no HFC-245fa was included in the available import data for 2006-2012, and consequently emissions from this source are considered to be “not occurring”.

50
Precision Cleaning and Semi-conductor Manufacture
Local expert knowledge indicated that there are no known precision cleaning or semiconductor manufacture operations in Jamaica that would use HFCs. Consequently no imported HFCs were allocated to this application, and emissions from this source are considered to be “not occurring”.
Semiconductor Manufacture, Electrical Insulation, Training Shoes, One Component Foams
Local expert knowledge indicated that there are no known precision cleaning operations in Jamaica that would use HFCs. Consequently no imported HFCs were allocated to this application, and emissions from this source are considered to be “not occurring”.
Figure 0.5Emissions of HFC (Gg CO2 EQ)
42. Emissions of PFC, SF6 and NF3
Emissions of PFC, SF6 and NF3 arise from some bespoke applications and products. Each of the potential sources was reviewed, and whilst it was not possible to source data in many cases, local experts concluded that many of the sources do not occur in Jamaica.
Production of PFC, SF6 and NF3
There is no known production of PFC, SF6 or NF3in Jamaica, and so it has been assumed that emissions are “not occurring”.
Fire extinguishers (PFCs)
It was not possible to obtain information on the import of PFC, or whether PFC is used in any fire extinguisher systems installed in Jamaica. However, information from the 2NC indicates that no PFCs were used in fire extinguisher systems. Therefore this source is reported as “not occurring”.
Semiconductor manufacture and Electronics (PFC, SF6, NF3)
Local experts indicated that there is no manufacture of semi-conductors in Jamaica, and therefore this source is assumed to be “not occurring”.

Biennial Update Report of Jamaica
Electrical equipment (SF6)
SF6 is used in high voltage electrical switchgear, and in-use leakage can arise as well as during disposal. It was not possible to obtain any data on this source, however it is likely that SF6 is present in some high voltage electrical switchgear in Jamaica. Therefore this source is currently included in the inventory as “not estimated”. This will need to be addressed in the future, and is captured as an action in the improvement programme.
Training shoes (SF6, PFC) Some training shoes include SF6 or PFC in the cushioning. Whilst the practice stopped several years ago, it is still possible that emissions arise from shoes purchased when SF6 and PFC were being used. There is no manufacture of training shoes in Jamaica, so the emissions from the manufacturing component is assumed to be “not occurring”. Emissions during use are typically assumed to be negligible (UK National Inventory Report on GHG Emissions, 2015), and therefore are also assumed to be “not occurring”. However, emissions would arise after end-of-life i.e. once the shoes have been landfilled. It has not been possible to obtain any data on this source, and it is therefore included in the inventory as “not estimated”. This expected to be a small source, but review of data availability has been included in the improvement programme.
Scientific tracer gas (SF6)
SF6 is used as a scientific tracer gas, for example to investigate atmospheric mixing and dispersion. There is no know use of SF6 for this application in Jamaica, and local expert opinion was that this source is “not occurring”.
43. Energy Sector
Methodological Overview
Various methods can be used to estimate emissions or removal from most sources and sink categories when conducting GHG Inventory. The methodologies applied in undertaking the GHG Inventory for Jamaica was guided by the 2006 IPCC Guidance (Volume 2 Energy), within the framework presented by emissions inventory good practice given in 2006 IPCC Guidance (Volume 1 General Guidance). The method to be applied will depend on the desired degree of estimation detail. It also depends on the availability of human and financial resources, as well as the time available to complete the inventory. The simplest or lowest ranking method is referred to as Tier 1.The more elaborate methods are Tier 2 and Tier 3, where country specific information, point source emissions data and potentially detailed modelling are used in the emission calculations. The country specific information that was obtained for use in the inventory for the energy sector was limited. Most of the fuel properties were default values taken from the 2006 IPCC Guidance, and whilst this may be regionally specific, the emission methodologies should be considered as Tier 1 methods.
Activity Data
In the energy sector, data is supplied from both the public and private sectors, the former including a number of Ministries, departments and agencies (MDAs). The Ministry of Science, Technology and Energy (MSTEM) has a mandate to provide energy statistics and information on various aspects of the energy sector, and is therefore one of the most important data providers for the emissions inventory. It is the main repository for energy related data: petroleum, electricity and bio-energy types. Some of the other Ministries which supply information include the Ministry

52
of Transport and Works (MTW), Ministry of Agriculture and Fisheries (MOAF), Ministry of Land, Water, Environment and Climate Change (MWLECC) and the Ministry of Industry, Investment and Commerce (MIIC). There are also some other agencies that played a critical role in the data supply process. These include the Petroleum Cooperation of Jamaica (PCJ), Petrojam Limited (Refinery), Planning Institute of Jamaica (PIOJ), National Environmental Planning Agency (NEPA), Office of Utilities Regulation (OUR), Statistical Institute of Jamaica (STATIN), among others. Some of the private sector entities included the Jamaica Chamber of Commerce (JCC), Private Sector Organization of Jamaica (PSOJ), Jamaica Exporters Association (JEA), Jamaica Public Service Company Limited (JPS), among others. Where these entities were not willing to share information, formal requests were issued by the Climate Change Division of the MWLECC. Some of these entities also prepare annual reports which can provide the data being sought.
National Energy Balance Tables
In order to estimate GHG emissions from the energy sector, it is essential to have high quality fuel consumption data. National Energy Balances for Jamaica for 2006 to 2012 were made available by the MSTEM (MSTEM, 2015). The data from the national energy balance tables were studied in detail. Some errors were established in the way the fuel types were allocated to different source sectors. Corrections were therefore made before use in emissions inventory. A summary of the data is provided in the following table. Table 0.8 Fuel Consumed by Inventory Sector (TJ, except Barrels of oil for Refinery Flaring). Sector Fuel 2006 2007 2008 2009 2010 2011 2012
Public electricity and heat production Fuel oil 27,919 29,696 28,377 29,075 29,075 28,389 25,604
Public electricity and heat production Diesel oil 9,836 10,109 9,984 10,174 9,686 9,887 9,450
Petroleum refining Fuel oil 1,470 1,592 1,619 1,615 1,612 1,698 1,847
Petroleum refining Diesel oil 4 4 4 4 4 4 0
Mining/Bauxite Fuel Oil 59,430 38,296 53,566 19,987 16,008 21,613 19,699
Sugar Fuel oil 151 159 115 81 52 29 29
Sugar Bagasse 3,613 3,547 3,535 6,297 2,509 3,475 3,421
Cement Fuel oil 93 119 156 75 29 29 150
Cement Coal 1,108 1,510 1,193 1,282 787 1,990 1,831
Industry Other, Stationary LPG 86 81 82 88 70 82 76
Industry Other, Stationary Fuel oil 1,178 1,205 1,084 669 317 577 259
Industry, Mobile machinery Gasoline 396 434 378 367 333 253 292
Industry, Mobile machinery Diesel Oil 1,474 2,140 4,306 2,325 1,725 2,251 3,054
Domestic aviation LTO (civil) Avgas 27 23 17 14 13 1 12
Domestic aviation LTO (civil) Turbo 52 44 33 28 26 0 23
Road Transport Gasoline 23,126 20,590 21,338 20,822 19,476 19,103 18,416
Road Transport Diesel Oil 6,194 7,639 5,535 7,228 7,240 7,447 6,074
Railways Diesel oil 0 0 0 0 0 0 0
Railways Diesel oil 0 0 0 0 0 0 0
Domestic shipping/National Navigation Diesel Oil 324 168 178 42 124 108 69
Domestic shipping/National Navigation Fuel Oil 246 317 290 171 163 123 120
Commercial/institutional: Mobile Gasoline 0 292 149 0 0 0 0
Commercial/institutional: Mobile Diesel oil 187 1,433 281 218 195 212 201
Commercial/institutional: Stationary Fuel Oil 531 0 0 0 92 0 0
Commercial/institutional: Stationary LPG 1,573 1,393 1,523 1,546 1,593 1,664 1,746
Commercial/institutional: Stationary Kerosene 1,051 1,493 0 47 29 29 117
Commercial/institutional: Stationary Charcoal 794 794 1,165 1,165 1,165 817 817
Residential: Stationary Kerosene 1,393 1,979 99 53 35 35 128
Residential: Stationary LPG 2,099 2,351 2,027 1,804 1,880 1,962 2,056
Residential: Stationary Wood 1,335 1,333 1,369 1,369 1,369 1,369 1,369
Agriculture/Forestry/Fishing: Mobile Gasoline 407 369 413 395 361 395 384
Agriculture/Forestry/Fishing: Mobile Diesel oil 658 884 947 769 689 746 700
Refinery flaring Flared gases and
vapours 3,351 2,882 1,021 4,864 3,083 670 777

Biennial Update Report of Jamaica
These fuel use data by emissions inventory source represent the activity data for the emission calculations in the Energy sector. Whilst some assumptions were required regarding the allocation of fuel from the energy balance tables to specific emission inventory sources (e.g. between stationary and mobile combustion sources), the data itself is considered to be of good quality in terms of accuracy, completeness and consistency. Whilst the data in the energy balance tables is presented as national level data, the tables are not entirely compiled using a top-down approach. For example, it is known that the data in the energy balance tables for e.g. electricity generating stations and other large industrial sources are compiled from point source data. Properties of Fuels The national energy balance tables present data in terms of thousand barrels of oil equivalent (K BOE). The IPCC Guidance expresses emissions factors in energy terms, but uses TJoules (on a net energy basis). Therefore to convert from K BOE to TJoules, it is not only necessary to perform a K BOE to TJoules conversion, but to also take into account the ratio of Net calorific value (CV) to Gross CV on a fuel by fuel basis. The net and gross CVs that were used in the conversion for each fuel are included in the table below. The CVs for fuel oil and gas oil are country specific. For all other fuels, the literature was searched to find CVs considered to be most appropriate for the fuel used in Jamaica.
Table 0.9 Fuel Properties – Calorific Values.
Fuel Net CVs (GJ/tonn
e)
Reference Gross CVs (GJ/tonne)
Reference
Fuel oil 40.5 Country specific CV 42.9 Country specific CV
Diesel oil 42.6 Country specific CV 45.4 Country specific CV
Gasoline 44.3 IPPC, 2006, Chapter 1, Table 1.2
47.3 Engineering Toolbox 2
Kerosene 44.1 IPPC, 2006, Chapter 1, Table 1.2
46.2 Engineering Toolbox 2
Coal 26.7 IPPC, 2006, Chapter 1, Table 1.2
33.0 Engineering Toolbox 2
Charcoal 29.5 IPPC, 2006, Chapter 1, Table 1.2
29.6 Engineering Toolbox 2
Wood 15.6 IPPC, 2006, Chapter 1, Table 1.2
15.9 Engineering Toolbox 2
LPG 47.3 IPPC, 2006, Chapter 1, Table 1.2
49.4 UK Digest of Energy Statistics 3
Bagasse 7.6 FAO 1 7.7 Assumed to be the same NCV/GCV ratio as that for wood
1 http://www.fao.org/docrep/003/s8850e/s8850e03.htm) 2 http://www.engineeringtoolbox.com/fuels-higher-calorific-values-d_169.html 3 https://www.gov.uk/government/uploads/system/.../dukesa_1-a_3.xls
The value of these CVs directly influences the resulting fuel in TJoules. Consequently selection is particularly important in giving accurate fuel consumption data for use in emission calculations. Whilst there is little variation in the literature for CVs of most fuel types, there are some which can

54
vary by several percent, and subtleties associated with the details and definitions of some fuels. Whilst care has been taken in selecting appropriate CVs from the available literature, there is scope for improving this step of the emission calculations. Drawing more extensively on local expertise and knowledge would better support decisions, and also may be able to improve the extent to which country specific values are used. 44. Sectoral and Reference Approaches
The 2006 IPCC Guidelines (Volume 2, Energy) provides detail on how the comparison of the reference and sectoral approaches can be used as a verification exercise, explaining that any significant differences in emissions calculated by the two different approaches requires explanation. In Jamaica, it was not possible to collate complete information on fuel consumption at the individual sectoral level using bottom-up approaches. As a result, the national energy balance tables provided the single source of fuel consumption data for use in the emissions inventory. It is known that the national energy balance tables are compiled using a combination of a “top-down” approach with national level fuel data being allocated to different source sectors, and a “bottom-up” approach where fuel from specific sources are summed to give sectoral fuel consumption estimates. This ensures that there is consistency between assumed fuel consumption and import/export data, but also draws on the source specific detailed information where available. So, whilst there are not two independent sources of information on fuel consumption that can be checked against each other, the national energy balance tables can be regarded as a good quality dataset. In line with good practice, a reference approach calculation of emission was undertaken for verification purposes (as outlined in the 2006 IPCC Guidelines). The reference approach is based on data for fuel production, import, export and stock change. The following steps were therefore required:
The fuel data in the national energy balance tables was converted from thousand barrels
of oil equivalent to Tera Joules (using the same net and gross calorific value conversions as
the inventory).
These energy data were then combined with carbon contents for each fuel (expressed as
kg of carbon/Tera Joule, and consistent with the calculations in the emissions inventory
undertaken at the sector level).
The resulting carbon was then converted into an emission of CO2.
The table below provides the time series for these two approaches, and a time series of the difference that can be seen between them.
Table 0.10. Emission Sources in the Energy Sector by CRF (Mg CO2)
2006 2007 2008 2009 2010 2011 2012
Reference Approach
Mg CO2
10,614,323 9,330,185 10,069,586 7,386,723 6,827,920 7,393,837 6,909,053
Sectoral Approach
Mg CO2
10,614,323 9,330,185 10,069,586 7,386,723 6,827,920 7,393,837 6,909,053
Difference % 0% 0% 0% 0% 0% 0% 0%

Biennial Update Report of Jamaica
The fuel data used in the top-down approach is also used to calculate Jamaica’s sectoral inventory, and therefore there should be no difference between the sectoral and reference approaches. This is the case as shown in the table above. Efforts were made to collect data on a sector by sector basis, and whilst information was made available to support emission estimate calculations, the national energy balance tables were used for all fuel consumption data in the emissions inventory. In future it is hoped that two independent datasets will be available to allow a more informative sectoral vs reference approach to be undertaken. 45. Calculation Methodologies
Efforts were made to obtain detailed data at the sectoral level, with the aim of using a Tier Two approach as far as possible. Data needs were broken out into various components (as outlined in the reporting format). These are as follows;
1.A.1 Energy Industries
1.A.2 Manufacturing Industries and Construction
1.A.3 Transport
1.A.4 Commercial, Institutional, Residential and Agriculture/Forestry/Fishing
1.A.5 Other(not specified elsewhere)
Memo Items
1.B Fugitive Sources
1A1 Energy Industries This sector includes public electricity and heat production, petroleum refining and manufacture of solid fuels. 1A1a Public Electricity For public electricity, data was requested on fuel consumption by type and location of power plant. The main supplier (JPS) and independent power producers were included. Corresponding fuel consumption data are shown in Table 3.9. No plant specific emissions or emission factors (EFs) were available. So emissions were calculated by combining the fuel consumption data with default EFs from the 2006 IPCC Guidance. Emissions from manufacturing industries that generate their own electricity (known as “autogeneration”) are reported under 1A2 Manufacturing Industries and Construction, in accordance with the 2006 IPCC Guidance. 1A1b Petroleum Refining Annual own use fuel consumption for petroleum refining, by fuel, is not included in the national energy balance tables, so the data were requested from Petrojam’s refinery at Hunt’s Bay. The data provided (Petrojam, 2015a) had limited breakdown by fuel type, and was only available for 2011-2012, so assumptions and extrapolation was required to obtain a complete dataset. The fuel consumption data for this source sector are shown in Table 3.9. Own use fuel consumption in the refinery was combined with default EFs from the 2006 IPCC Guidance to obtain emission estimates. 1A1c Manufacture of Solid Fuel The production of charcoal is a sensitive ecological issue in Jamaica. Local experts indicated that manufacture is typically undertaken at a small scale, rather than a large commercial operation. Some further work is required to be able to estimate the emissions from the charcoal

56
manufacture, and allocate it to the most appropriate source sector within the inventory, ensuring that there is no double-counting with e.g. land use change. Emissions from the use of charcoal are included in the inventory under 1A4a Commercial/Institutional (see below). 1A2 Manufacturing Industries and Construction This sector includes emissions from manufacturing industries, and in Jamaica this includes activities in the Bauxite/Aluminium sector, sugar manufacture, cement manufacture and other non-specific industrial activities. Emissions are included here for both autogeneration and fuel use directly relating to the manufacturing process. Emissions are included from both stationary sources and mobile machinery used in the corresponding industrial sector. 1A2b Bauxite/Aluminium Aluminium manufacture is an important industrial sector in Jamaica, and is present due to the natural deposits of bauxite (aluminium containing ore). Aluminium manufacture is very energy intensive, and therefore this makes a significant contribution to the total GHG emissions in Jamaica. There are a number of different sources associated with aluminium manufacture:
Emissions from bauxite mining activities (both stationary and mobile machinery),
Emissions from the fuel combustion in the aluminium manufacture
Emissions from fuel used for electricity generation specifically for aluminium manufacture
Emissions from mobile machinery used in aluminium manufacture.
Data were gathered from the following bauxite/aluminium companies regarding fuel consumption (including fuel consumption for electricity generation from specific plant): Jamalco, Alpart, Windalco and Norando. These data were incorporated into the energy balance tables. However, these data do not resolve the fuel oil used in stationary combustion sources for mining activities and activities associated with processing the ore to make aluminium. As a result, all emissions associated with stationary combustion are included within this aluminium manufacturing emissions category. Emissions associated with both autogeneration and manufacture should be reported within manufacturing. So including all of the fuel, and hence emissions, within this source category does not create an issue regarding allocation to the correct source category. It has been assumed that all of the gasoline and diesel oil consumed in the mining/bauxite sector relate to mobile machinery. Associated emissions have been grouped with other industrial mobile machinery and allocated to 1A2gvii Other Industrial Mobile Machinery (see sub-section below). The fuel consumption data for this source sector are shown in Tables 3.9. Emission estimates were calculated by combining the fuel oil used in the bauxite/aluminium sector with default EFs from the 2006 IPCC Guidance. 1A2e Sugar Manufacture Sugar manufacture from sugar cane remains an important industry in Jamaica. Some of the sugar factories use little or no petroleum products, using it only during plant start-up. However there are also sugar factories that rely solely on petroleum use for the operation of the factory.

Biennial Update Report of Jamaica
Bagasse (a biomass fuel made from the sugar cane as a by-product) is used extensively as a fuel in the sugar manufacturing plant. However, as a renewable fuel, no emissions of CO2 are reported from the burning of bagasse as a fuel (although other pollutants are included in the emissions inventory). Fuel consumption data were incorporated into the energy balance tables, and included diesel and bagasse used by Monymusk, and bagasse used by Long Pond. The fuel consumption data for this source sector are shown in Table 3.9. Emission estimates were calculated by combining the fuel consumption data with default EFs from the 2006 IPCC Guidance. There are no EFs in the guidance specifically for bagasse, so EFs for “other primary solid biomass” were used. 1A2f Cement Manufacture The cement manufacture is a very energy intensive process. The Caribbean Cement Company in Jamaica uses coal and fuel oil fuel for both the manufacture of cement and autogeneration (as well as purchasing electricity from JPS, the public supplier). The fuel consumption data for this source sector are shown in Table 3.9. Emission estimates were calculated by combining the fuel consumption data with default EFs from the IPCC 2006 Guidance. For the purpose of emissions calculations, it was assumed that “coal” was equivalent to anthracite. 1A2gviii Other Industry – Stationary Sources The national energy balance tables do not categorise all of the fuel being used in the industrial sector, and a significant amount is assumed to “other industry”. It was assumed that, of this fuel, LPG and fuel oil are used in stationary combustion. The fuel consumption data for this source sector are shown in Table 3.9. Emission estimates were calculated by combining the fuel consumption data with default EFs from the 2006 IPCC Guidance. For the purpose of emissions calculations. 1A2gvii Other Industry – Mobile Sources The national energy balance tables do not categorise all of the fuel being used in the industrial sector, and a significant amount is assumed to “other industry”. It was assumed that, of this fuel, all gasoline and diesel oil are used in mobile combustion. The fuel consumption data for this source sector are shown in Table 3.9. Emission estimates were calculated by combining the fuel consumption data with default EFs from the 2006 IPCC Guidance. 1A3 Transport This source sector includes all modes of transport (but not non-road mobile machinery, which is included in the inventory under 1A5b Other Mobile). Sources included here are:
Civil Aviation (Domestic)
Road Transportation
Railways
Domestic Navigation (Shipping)
Other Transport
These are all outlined in more detail in the following sections.

58
1A3a Domestic Civil Aviation Emissions from domestic activities are included in this source sector. Emissions from international aviation activities are estimated, but are not included in the emissions inventory totals (they are reported as a memo item – see Section 3.8). The emissions from aviation are determined as two components - landing & take-off (LTO) and cruise. Fuel used for aviation was available for the whole time series, but this was only resolved into domestic and international for 2011-2012. Avgas and aviation turbo fuel were used. Estimates of fuel use for years prior to 2011 were generated by scaling the fuel use in 2012 according to the trend in aircraft movement data, which was available in detail for the entire time series (sourced from MWLECC). Table 0.11. Domestic Commercial Aircraft Movements (LTOs)
2006 2007 2008 2009 2010 2011 2012
Domestic Commercial Aircraft Movements
LTOs 17,474 14,841 10,976 9,331 8,577 7,436 7,770
The full time series of calculated fuel consumption data for this source sector are shown in Table 3.9. Given that domestic flights in Jamaica are all of short distances, it was assumed that planes do not reach cruising altitude, and start their approach part of the landing phase after completing climb out from the take-off phase. As a result, cruise emissions are assumed to be zero. Hence emission estimates for LTO were calculated by combining the total fuel consumption of both Avgas and aviation turbo fuel data with default EFs from the 2006 IPCC Guidance (Volume 1, Chapter 3, tables 3.6.4 and 3.6.5 giving the emissions per unit of fuel consumed). This approach was used because no information could be sourced on the aircraft movement data split by different classes of aircraft. The assumption that cruise emissions are zero was tested. It was assumed that, as a small jet plane, a Saab2000 might be representative of the aircraft fleet. The fuel consumption per LTO for a Saab2000 (taken from the 2013 EMEP/EEA Guidebook Chapter 1A3a and accompanying spreadsheet annex) was combined with the number of domestic LTOs. This allowed an estimate to be made of the fuel required for all of the domestic flights in the movement data. The value of the fuel estimated was similar to, but slightly larger than, the actual fuel consumption reported in 2012. So in conclusion, it appears reasonable to make the assumption that, for domestic aviation, there are no emissions in the cruise phase, and all fuel and emissions can be assigned to the LTO phase. 1A3b Road Transportation Estimating emissions of CO2 from road transport is relatively straightforward, in that it can be assumed that the carbon in the fuel is released as CO2. However, to accurately determine emissions of other pollutants, an extensive amount of information is required on the road vehicle fleet: the number of different vehicle types, vehicle ages, engine technologies etc. It was possible to obtain some information on the vehicle fleet to allow more than a simple methodology to be used, but there are still several important improvements that could be made to the calculation. The fuel consumption data of gasoline and diesel oil for this source sector are shown in Table 3.9, and are plotted in the figure below. It is surprising to note that consumption of gasoline has been declining with time. The consumption of diesel oil shows little trend with time - although the year to year fluctuations are large relative to the total, making it difficult to identify any time trend.

Biennial Update Report of Jamaica
Figure 0.6 Fuel Consumption in the Road Transport Sector (TJoules)
Emission estimates for CO2, CH4 and N2O from gasoline and diesel oil consumption were calculated separately by combining the fuel data with default EFs from the 2006 IPCC Guidance.
Table 0.12. GHG Emissions from Road Transport (Mg)
Pollutant
Fuel Units
2006 2007 2008 2009 2010 2011 2012
CO2 Gasoline
Mg 1,602,606
1,426,859
1,478,718
1,442,981
1,349,667
1,323,857
1,276,208
CO2 Diesel Mg 459,003 566,043 410,121 535,624 536,475 551,791 450,112
CH4 Gasoline
Mg 578 515 533 521 487 478 460
CH4 Diesel Mg 24 30 22 28 28 29 24
N2O Gasoline
Mg 185 165 171 167 156 153 147
N2O Diesel Mg 24 30 22 28 28 29 24
For estimating emissions of indirect pollutants a more sophisticated approach is required, because emissions are very dependent on vehicle type, age, engine technologies etc. This is detailed in Appendix 2. 1A3c Railways A rail passenger service is no longer operated in Jamaica, the railway being used for freight - primarily activities associated with the bauxite/aluminium sector. Fuel consumption for railway activities was sought, but it was not possible to obtain information on fuel consumption specifically for rail activities. However, the fuel used is included in the national energy balance tables, and more specifically will be included in 1A2gvii Other Industry, Mobile (see section 3.13.6).

60
The inclusion of railway activities in Other Industry will not impact on the emission estimates of CO2. However, EFs for indirect GHGs do vary according to machinery type, and hence improvements in accuracy as well as transparency would be achieved if the fuel used in the rail sector could be specifically identified. This should be included in the emissions inventory improvement programme. 1A3d Domestic Navigation (Shipping) Emissions from domestic shipping activities, excluding fishing, are included in this source sector. Emissions from fuel sold for international shipping are estimated, but are not included in the emissions inventory totals (they are reported as a memo item – see Section 3.14.1). Fuel used specifically for domestic shipping (fuel oil and diesel oil) was made available from MWLECC (MWLECC, 2015) for 2011 ad 2012. Estimates of fuel use for domestic shipping for years prior to 2011 were generated by scaling the fuel use in 2011 according to the trend in the total fuel use for shipping, which was available for the entire time series from the national energy balance tables. The full time series of calculated fuel consumption data for this source sector are shown in Tables 3.9. Emission estimates were calculated by combining the total fuel consumption of diesel oil and fuel oil with default EFs from the 2006 IPCC Guidance (EFs for gas oil and residual fuel oil were used). EFs for the indirect GHGs were sourced from the 2013 EMEP/EEA Guidebook. This approach was used because no information was available on the use of fuel by different types of vessel. Emissions from fishing boats should be reported in 1A4ciii Fishing. But it was not possible to resolve the fuel used in shipping to allow this. So emissions from fishing boats is included in this sector. 1A3e Other Transport This source category is included for other vehicle types which are not included in the four categories explained above. There are likely to be some which are present in Jamaica, for example aircraft support vehicle, however none have been specifically identified as itemised. It is likely that the fuel used by these vehicles is assigned to the road transport sector (see sub-section above), or industrial mobile machinery (see Section 3.13.6). 1A4 Commercial and Institutional Combustion, Residential Combustion, Combustion in Agriculture/Forestry/Fishing This section addresses fuel use that can be readily divided into three categories:
Commercial and institutional buildings: These may be equipped with their own generators,
and/or use fuel for fuel for heating and cooking. The use of mobile machinery in the
commercial/institutional sector is also included.
Residential buildings and houses: In Jamaica the majority of fuel consumption in
stationary sources in the residential sector is for cooking, although some is also used for
other purposes such as heating and in small generators. Some mobile sources are also
expected.
Agriculture/Forestry/Fishing: Limited stationary combustion activities, with emissions
primarily arising from mobile machinery.

Biennial Update Report of Jamaica
1A4a Commercial and Institutional Combustion The national energy balance tables identify the fuel that is used in “Services”, which can be equated to the Commercial and Institutional sector. The following fuels are used: fuel oil, kerosene, LPG, charcoal, gasoline and diesel oil. These fuels are assumed to be used in stationary combustion, with the exception of gasoline and diesel oil, which are assumed to be used entirely in mobile machinery. The fuel consumption data for this source sector are shown in Table 3.9. Emission estimates were calculated by combining the fuel consumption data with default EFs for mobile machinery from the 2006 IPCC Guidance for gasoline and diesel oil, and default EFs for stationary combustion sources for other fuel types. Charcoal is a “renewable” fuel, and therefore CO2 emissions are not included in the emissions inventory (but are reported as a memo item), although emissions of other pollutants are included. EFs for the indirect GHGs are taken from the 2013 EMEP/EEA Guidebook (Chapter 1A4, Commercial/Institutional, tables 3.8-3.10). 1A4b Residential Combustion The national energy balance tables identify the fuel that is used in “Household”, which can be equated to the Residential sector. The following fuels are used: kerosene, LPG and wood. These fuels are assumed to be used in stationary combustion. The fuel consumption data for this source sector are shown in Table 3.9. Emission estimates were calculated by combining the fuel consumption data with default EFs from the IPCC 2006 Guidance for stationary combustion sources. Wood is a “renewable” fuel, and therefore CO2 emissions are not included in the emissions inventory (but is reported as a memo item), although emissions of other pollutants are included. EFs for the indirect GHGs are taken from the 2013 EMEP/EEA Guidebook (Chapter 1A4, Residential, tables 3.4-3.6). The national energy balance tables indicate that the use of gasoline and diesel oil in the Household sector is zero (with the exception of small levels of consumption in 2007 alone). So no fuel has been allocated to mobile machinery in the residential sector, and hence emissions are zero. It is assumed that this is because fuel used for mobile machinery in the residential sector is allocated elsewhere in the energy balance tables. Emissions are therefore likely to be included in 1A2gvii Other Industry – Mobile Machinery. 1A4c Combustion in Agriculture, Forestry and Fishing The national energy balance tables identify the fuel that is used in “Agriculture”, is considered to also include the use of machinery in forestry. The following fuels are used: gasoline and diesel oil. These fuels are assumed to be used in mobile machinery only. The fuel consumption data for this source sector are shown in Table 3.9. Emission estimates were calculated by combining the fuel consumption data with default EFs from the IPCC 2006 Guidance for mobile machinery in the Agriculture/Forestry sectors (Table 3.2.1 and 3.2.2). EFs for the indirect GHGs are taken from the 2013 EMEP/EEA Guidebook (Chapter 1A4, Agriculture/Forestry/Fishing, table 3.1). Fuel used in fishing boats, and hence resulting emission, is not specifically resolved from the fuel used in all types of shipping. So emissions from fishing boats are included with emissions from all ships and boats in 1A3d Domestic Navigations (see Section 3.13.7). There is no information on fuel used for stationary combustion sources in the fishing sector, and this is likely to be included in 1A2gviii Other Industrial stationary combustion.

62
1B Fugitive Emissions from Oil and Natural Gas Fugitive emissions occur as leaks or other unintended or irregular emission. Emissions from venting and flaring in the oil and gas sector are considered to be a fugitive emission because emissions arise from the burning of fuel, but this does not, and is not intended to, generate heat or electricity. Information on the amount of flaring from the refinery was provided by Petrojam (Petrol Jam, 2015b pers comm). The data were provided in terms of barrels of oil equivalent of “gases and vapours”. The typical composition of gases and vapours flared was therefore requested, and this was also provided. The majority of the mass of released gases and vapours was determined to be hydrogen. The composition information allowed the hydrocarbon content to be determined, and it was established that the majority of the hydrocarbon content was either methane or short-chain hydrocarbons. The “fuel” data for this source sector are shown in Table 3.9. Emission estimates were calculated by combining the mass of hydrocarbons released with an EF that was an average of CH4 and LPG – this being considered to be a good representation of the hydrocarbon mix of the release. The CH4 and LPG EFs were sourced from the 2006 IPCC Guidance. The CO2 emissions that result from this source are very small compared to the vast majority of emissions from fuel combustion sources. 46. Sectoral Emission Estimates
The following tables summarise the emissions from the Energy sector by source and by fuel for each pollutant.

Biennial Update Report of Jamaica
Table 0.13 CO2emissions (Mg CO2) Sector Fuel 2006 2007 2008 2009 2010 2011 2012
Public electricity and heat production Fuel oil 421.58 448.40 428.50 439.03 439.03 428.67 386.61
Public electricity and heat production Diesel oil 159.34 163.76 161.74 164.81 156.91 160.16 153.10
Petroleum refining Fuel oil 0.01 0.01 0.01 0.01 0.01 0.01 0.01
Petroleum refining Diesel oil 0.00 0.00 0.00 0.00 0.00 0.00 0.00
Mining/Bauxite Fuel Oil 3,922.40 2,527.56 3,535.33 1,319.14 1,056.53 1,426.46 1,300.11
Sugar Fuel oil 9.97 10.50 7.61 5.33 3.43 1.90 1.90
Sugar Bagasse 2,059.67 2,022.04 2,015.20 3,589.03 1,430.14 1,980.98 1,950.19
Cement Fuel oil 6.13 7.88 10.28 4.95 1.90 1.90 9.90
Cement Coal 1,031.81 1,406.01 1,110.62 1,193.57 732.73 1,852.56 1,705.09
Industry Other, Stationary LPG 2.48 2.34 2.38 2.55 2.04 2.38 2.21
Industry Other, Stationary Fuel oil 77.76 79.54 71.55 44.15 20.93 38.06 17.13
Industry, Mobile machinery Gasoline 6,885.17 7,552.77 6,576.29 6,377.01 5,799.09 4,402.13 5,081.68
Industry, Mobile machinery
Diesel Oil 371.39 539.15 1,084.66 585.71 434.59 566.91 769.38
Domestic aviation LTO (civil) Turbo 1,420.87 1,206.77 892.50 758.74 697.43 0.00 631.81
Domestic aviation LTO (civil) Avgas 719.38 610.99 451.87 384.15 353.11 38.14 319.88
Domestic aviation, cruise Turbo 0.00 0.00 0.00 0.00 0.00 0.00 0.00
Domestic aviation, cruise Avgas 0.00 0.00 0.00 0.00 0.00 0.00 0.00
Road Transport Gasoline 42,341.2
1 37,697.9
4 39,068.0
5 38,123.8
7 35,658.5
1 34,961.4
8 33,685.8
1
Road Transport Diesel
Oil 1,173.48 1,044.79 1,082.76 1,056.60 988.27 965.19 906.38
Railways Diesel oil 7,177.80 6,390.66 6,622.93 6,462.87 6,044.93 6,031.84 5,995.13
Domestic shipping/National Navigation
Diesel Oil 60.32 53.71 55.66 54.31 50.80 50.02 49.43
Domestic shipping/National Navigation Fuel Oil 1,840.88 1,639.01 1,698.58 1,657.52 1,550.34 1,520.49 1,464.49
Commercial/ institutional: Mobile Gasoline 2,095.18 1,865.42 1,933.21 1,886.49 1,764.50 1,730.53 1,666.79
Commercial/ institutional: Mobile Diesel oil 0.00 0.00 0.00 0.00 0.00 0.00 0.00
Commercial/ institutional: Stationary Fuel Oil 9,632.30
12,429.14
11,366.09 6,681.57 6,365.40 4,826.47 4,680.86
Commercial/ institutional: Stationary LPG
12,363.10 6,434.29 6,811.83 1,594.83 4,748.46 4,144.76 2,648.92
Commercial/ institutional: Stationary
Kerosene 0.00 17.50 8.94 0.00 0.00 0.00 0.00
Commercial/ institutional: Stationary Charcoal 11.20 85.98 16.88 13.09 11.71 12.75 12.06
Residential: Stationary Kerosen
e 31.83 0.00 0.00 0.00 5.54 0.00 0.00
Residential: Stationary LPG 45.61 40.40 44.17 44.85 46.21 48.24 50.62
Residential: Stationary Wood 63.03 89.56 0.00 2.80 1.75 1.75 7.01
Agriculture/Forestry/ Fishing: Mobile Gasoline 452.50 452.50 663.80 663.80 663.80 465.70 465.70
Agriculture/Forestry/ Fishing: Mobile Diesel oil 79.39 112.78 5.66 3.00 2.00 2.00 7.32

64
Refinery flaring
Flared gases and
vapours 54.59 61.12 52.70 46.91 48.89 51.02 53.46
Table 0.14 CH4 emissions (Mg CH4)
Sector Fuel 2006 2007 2008 2009 2010 2011 2012 Public electricity and heat production Fuel oil 83.76 89.09 85.13 87.23 87.23 85.17 76.81
Public electricity and heat production Diesel oil 29.51 30.33 29.95 30.52 29.06 29.66 28.35
Petroleum refining Fuel oil 4.41 4.78 4.86 4.85 4.84 5.09 5.54
Petroleum refining Diesel oil 0.01 0.01 0.01 0.01 0.01 0.01 0.00
Mining/Bauxite Fuel Oil 178.29 114.89 160.70 59.96 48.02 64.84 59.10
Sugar Fuel oil 0.45 0.48 0.35 0.24 0.16 0.09 0.09
Sugar Bagasse 108.40 106.42 106.06 188.90 75.27 104.26 102.64
Cement Fuel oil 0.28 0.36 0.47 0.22 0.09 0.09 0.45
Cement Coal 11.08 15.10 11.93 12.82 7.87 19.90 18.31
Industry Other, Stationary LPG 0.09 0.08 0.08 0.09 0.07 0.08 0.08
Industry Other, Stationary Fuel oil 3.53 3.62 3.25 2.01 0.95 1.73 0.78
Industry, Mobile machinery Gasoline 9.90 10.86 9.45 9.17 8.34 6.33 7.31
Industry, Mobile machinery Diesel Oil 5.75 8.35 16.79 9.07 6.73 8.78 11.91
Domestic aviation LTO (civil) Turbo 0.03 0.02 0.02 0.01 0.01 0.00 0.01
Domestic aviation LTO (civil) Avgas 0.01 0.01 0.01 0.01 0.01 0.00 0.01
Domestic aviation, cruise Turbo 0.00 0.00 0.00 0.00 0.00 0.00 0.00
Domestic aviation, cruise Avgas 0.00 0.00 0.00 0.00 0.00 0.00 0.00
Road Transport Gasoline 578.14 514.74 533.45 520.56 486.89 477.58 460.39
Road Transport Diesel Oil 24.16 29.79 21.59 28.19 28.24 29.04 23.69
Railways Diesel oil 0.00 0.00 0.00 0.00 0.00 0.00 0.00
Domestic shipping/National Navigation Diesel Oil 2.26 1.18 1.25 0.29 0.87 0.76 0.49
Domestic shipping/National Navigation Fuel Oil 1.72 2.22 2.03 1.19 1.14 0.86 0.84
Commercial/institutional: Mobile Gasoline 0.00 2.92 1.49 0.00 0.00 0.00 0.00
Commercial/institutional: Mobile Diesel oil 1.87 14.33 2.81 2.18 1.95 2.12 2.01
Commercial/institutional: Stationary Fuel Oil 5.31 0.00 0.00 0.00 0.92 0.00 0.00
Commercial/institutional: Stationary LPG 7.86 6.96 7.62 7.73 7.97 8.32 8.73
Commercial/institutional: Stationary Kerosene 10.51 14.93 0.00 0.47 0.29 0.29 1.17
Commercial/institutional: Stationary Charcoal 158.77 158.77 232.91 232.91 232.91 163.40 163.40
Residential: Stationary Kerosene 13.93 19.79 0.99 0.53 0.35 0.35 1.28
Residential: Stationary LPG 10.50 11.75 10.13 9.02 9.40 9.81 10.28
Residential: Stationary Wood 400.48 399.78 410.57 410.57 410.57 410.57 410.57
Agriculture/Forestry/Fishing: Mobile Gasoline 4.07 3.69 4.13 3.95 3.61 3.95 3.84
Agriculture/Forestry/Fishing: Mobile Diesel oil 6.58 8.84 9.47 7.69 6.89 7.46 7.00
Refinery flaring Flared gases and vapours 0.10 0.09 0.03 0.14 0.09 0.02 0.02

Biennial Update Report of Jamaica
Table 0.15 N2O emissions (Mg N2O)
Sector Fuel 2006 2007 2008 2009 2010 2011 2012 Public electricity and heat production Fuel oil 16.75 17.82 17.03 17.45 17.45 17.03 15.36
Public electricity and heat production Diesel oil 5.90 6.07 5.99 6.10 5.81 5.93 5.67
Petroleum refining Fuel oil 0.88 0.96 0.97 0.97 0.97 1.02 1.11
Petroleum refining Diesel oil 0.00 0.00 0.00 0.00 0.00 0.00 0.00
Mining/Bauxite Fuel Oil 35.66 22.98 32.14 11.99 9.60 12.97 11.82
Sugar Fuel oil 0.09 0.10 0.07 0.05 0.03 0.02 0.02
Sugar Bagasse 14.45 14.19 14.14 25.19 10.04 13.90 13.69
Cement Fuel oil 0.06 0.07 0.09 0.04 0.02 0.02 0.09
Cement Coal 1.66 2.27 1.79 1.92 1.18 2.98 2.75
Industry Other, Stationary LPG 0.01 0.01 0.01 0.01 0.01 0.01 0.01
Industry Other, Stationary Fuel oil 0.71 0.72 0.65 0.40 0.19 0.35 0.16
Industry, Mobile machinery Gasoline 3.17 3.47 3.03 2.93 2.67 2.03 2.34
Industry, Mobile machinery Diesel Oil 5.75 8.35 16.79 9.07 6.73 8.78 11.91
Domestic aviation LTO (civil) Turbo 0.10 0.09 0.07 0.06 0.05 0.00 0.05
Domestic aviation LTO (civil) Avgas 0.05 0.05 0.03 0.03 0.03 0.00 0.02
Domestic aviation, cruise Turbo 0.00 0.00 0.00 0.00 0.00 0.00 0.00
Domestic aviation, cruise Avgas 0.00 0.00 0.00 0.00 0.00 0.00 0.00
Road Transport Gasoline 185.01 164.72 170.70 166.58 155.81 152.83 147.33
Road Transport Diesel Oil 24.16 29.79 21.59 28.19 28.24 29.04 23.69
Railways Diesel oil 0.00 0.00 0.00 0.00 0.00 0.00 0.00
Domestic shipping/National Navigation Diesel Oil 0.65 0.34 0.36 0.08 0.25 0.22 0.14
Domestic shipping/National Navigation Fuel Oil 0.49 0.63 0.58 0.34 0.33 0.25 0.24
Commercial/institutional: Mobile Gasoline 0.00 0.17 0.09 0.00 0.00 0.00 0.00
Commercial/institutional: Mobile Diesel oil 0.11 0.86 0.17 0.13 0.12 0.13 0.12
Commercial/institutional: Stationary Fuel Oil 0.32 0.00 0.00 0.00 0.06 0.00 0.00
Commercial/institutional: Stationary LPG 0.16 0.14 0.15 0.15 0.16 0.17 0.17
Commercial/institutional: Stationary Kerosene 0.63 0.90 0.00 0.03 0.02 0.02 0.07
Commercial/institutional: Stationary Charcoal 0.79 0.79 1.16 1.16 1.16 0.82 0.82
Residential: Stationary Kerosene 0.84 1.19 0.06 0.03 0.02 0.02 0.08
Residential: Stationary LPG 0.21 0.24 0.20 0.18 0.19 0.20 0.21
Residential: Stationary Wood 5.34 5.33 5.47 5.47 5.47 5.47 5.47
Agriculture/Forestry/Fishing: Mobile Gasoline 0.24 0.22 0.25 0.24 0.22 0.24 0.23
Agriculture/Forestry/Fishing: Mobile Diesel oil 0.39 0.53 0.57 0.46 0.41 0.45 0.42
Refinery flaring Flared gases and vapours 0.00 0.00 0.00 0.00 0.00 0.00 0.00
47. Memo Items
International Aviation Emissions from international aviation are not included within the national emissions inventory total, but have been estimated, and are reported as a “memo item”. The emissions from international aviation are determined as two components - landing & take-off (LTO) and cruise. Only aviation turbo fuel is used in this source sector. The approached used to estimate the emissions from these two components was to estimate fuel used in LTO from aircraft

66
movements, and subtract this from the total to give the amount of fuel remaining for use in the cruise mode. This approach was used because no information could be sourced on the aircraft movement data split by different classes of aircraft. Aircraft movement data were available through MWLECC for the complete time series 2006 – 2012 (MWLECC, 2015). The international component was determined by summing all of the components other than “Domestic Commercial” i.e. “International Scheduled Commercial”, “International Non-Scheduled Commercial” and “Private” aircraft movements. Military flights were not included in the emissions inventory. The international aircraft movement data were combined with information from the 2013 EMEP/EEA Guidebook, which indicates typical fuel consumption per LTO cycle for the types of aircraft used in international flights. This allows an estimate of the fuel consumption for LTO to be estimated from the aircraft movement data. Table 0.16. International Aircraft Movements (LTOs) and Derived Fuel Use
2006 2007 2008 2009 2010 2011 2012
International Aircraft Movements
LTOs 56,472 56,586 57,201 50,997 54,155 53,728 54,669
Aviation turbo fuel consumed (LTO)
Tjoules 4,027 4,035 4,079 3,637 3,862 3,831 3,898
The fuel use data was combined with default EFs from the IPCC 2006 Guidance to give emissions estimates for the GHGs. A similar approach was used for estimating indirect GHG emissions, using EFs from the 2013 EMEP/EEA Guidebook (Aviation Chapter, Tables 3-3). The fuel used for LTO was then subtracted from the total fuel consumption to give the amount of fuel remaining, for assigning to the cruise phase. EFs were similarly sourced from the IPCC 2006 Guidance for GHGs and from the 2013 EMEP/EEA Guidebook (Aviation Chapter, Tables 3-3) for indirect GHGs to allow the calculation of emissions during the cruise phase. It is recognised that this methodology uses a relatively simple approach. So a sanity check was performed on the results, comparing the fuel use and emissions during LTO with those during cruise. Fuel use, and CO2 emissions, during the cruise phase were approximately 160% those of the fuel consumption and CO2 emissions during LTO. Evidently this represents a generalisation, but indicates that the proportion of fuel used during LTO in comparison to that during cruise is within reasonable bounds.
Table 0.17. International Aircraft Emissions (Mg)
Pollutant Units 2006 2007 2008 2009 2010 2011 2012
LTO Emissions
CO2 Mg 287,931 288,512 291,648 260,016 276,117 273,940 278,738
CH4 Mg 2 2 2 2 2 2 2
N2O Mg 8 8 8 7 8 8 8
Cruise Emissions
CO2 Mg 481,094 482,065 487,305 434,452 461,355 457,718 460,598
CH4 Mg 3 3 3 3 3 3 3
N2O Mg 13 13 14 12 13 13 13

Biennial Update Report of Jamaica
LTO Emissions
NOx Mg 1,468 1,471 1,487 1,326 1,408 1,397 1,421
NMVOC Mg 11 11 11 10 11 11 11
CO Mg 344 345 349 311 330 328 333
SO2 Mg 90 91 92 82 87 86 87
Cruise Emissions
NOx Mg 1,953 1,957 1,978 1,764 1,873 1,858 1,870
NMVOC Mg 76 76 77 69 73 73 73
CO Mg 168 168 170 152 161 160 161
SO2 Mg 153 153 155 138 146 145 146
International Shipping Emissions from international shipping are not included in the emissions inventory totals, but have been estimated and are reported as a memo item. Fuel used specifically for international shipping (fuel oil and diesel oil) was made available from MWLECC for 2011 ad 2012 (MWLECC, 2015). Estimates of fuel use for years prior to 2011 were generated by scaling the fuel use in 2011 according to the trend in the total fuel use for shipping, which was available for the entire time series from the national energy balance tables. Emission estimates were calculated by combining the total fuel consumption of diesel oil and fuel oil with default EFs from the 2006 IPCC Guidance (EFs for gas oil and residual fuel oil were used). EFs for the indirect GHGs were sourced from the 2013 EMEP/EEA Emissions Inventory Guidebook. This approach was used because no information was available on the use of fuel by different types of vessel. Table 0.18. International Aircraft Emissions (Mg)
Pollutant Units 2006 2007 2008 2009 2010 2011 2012
CO2 Mg 1,515,810 1,812,704 1,671,628 946,410 950,218 728,680 626,453
CH4 Mg 138 164 152 86 86 66 57
N2O Mg 39 47 43 24 25 19 16
NOx Mg 38,293 45,847 42,273 23,948 24,024 18,420 15,832
NMVOC Mg 1,311 1,565 1,443 816 821 630 542
CO Mg 3,578 4,281 3,947 2,235 2,244 1,720 1,479
SO2 Mg 9,670 11,569 10,668 6,041 6,064 4,650 3,997
48. Sectoral Uncertainties
The 2006 IPCC Guidelines (Volume 1) provide guidance on identifying uncertainties for source categories. These guidelines were observed in the process of undertaking an uncertainty assessment. CO2 emissions from fuel combustion are typically much better characterised than other sources. This is because the amount of fuel used is generally known with a high degree of accuracy, and the EF (the carbon content of the fuel) is also known and does not typically vary much from international default values. In Jamaica, the national energy balance tables provide comprehensive data on the fuel use. Whilst it has not been possible to obtain quantified information on the uncertainties of these data,
68
expert opinion has provided a good insight into the variability of the uncertainties. Some data is compiled on a plant by plant basis, and is considered to be particularly reliable. This is generally the case for the stationary sources which are consuming the largest quantities of fuel. Consequently the amounts of fuel can be generally considered to be relatively accurate. However, for some source-fuel combinations, a number of assumptions have had to be made which increases the levels of uncertainty. For example, it has been assumed that fuel used in stationary and mobile sources within sectors can easily be determined by allocating all of the gasoline and diesel oil to the mobile sources. This illustrates the extent to which uncertainties can arise in the allocation of the fuel in the energy balance tables to the emissions inventory sources. There are different levels of uncertainty across the fuels as well as across the different sources sectors. For example, in the residential sector, wood consumption is considerably more uncertain than LPG use. This is because the amounts of LPG can be estimated from import data and sales data. For wood use, estimates are typically based on surveys that collect estimates of annual consumption, and this is much higher in uncertainty than information from sales or exports. Carbon EFs for fuel combustion are typically very low in uncertainty. This is because the carbon content of fuel is generally well characterised, and e.g. liquid fuels made in a country do not generally vary from international default values by more than a few percent. Therefore even when country specific information is not available, the use of international default values from the 2006 IPCC Guidance is considered to be give suitable representative values. The carbon content of solid fuels is more variable, and it can be sourced from different providers. EFs for CH4 and N2O from fuel combustion are high in uncertainty. This is because the emissions are dependent on the conditions and efficiency of the combustion. However, emissions of CH4 and N2O from fuel combustion are small, so this relatively high EF uncertainty does not have a large impact on the uncertainty of the emission totals. Detailed results of the uncertainty assessment carried out on the whole emissions inventory are presented in Section 3.19. 49. Quality Assurance and Quality Control
There are a number of sector specific QA/QC procedures that have been undertaken as part of the emissions inventory compilation:
Reference vs Sectoral approaches: The emissions estimates from both the sectoral and
reference approaches have been compiled and compared. The two approaches draw on
the same fuel consumption data (because it has not been possible to obtain fuel
consumption data that is independent of the national energy balance tables).
Demonstrating that the emissions give the same results therefore acts as a useful QC
check.
Handling activity data: At all stages of the compilation, a programme of QC checks have
been included that are specific to the way the activity data are handled in the emissions
inventory.
Assumptions: It has been necessary to use assumptions in estimating emissions from a
number of different sources. In all cases, the opinion of local experts has been sought to
the extent possible.

Biennial Update Report of Jamaica
50. Recommendations for Improvement
The vast majority of the methodologies used in this sector are Tier 1 methodologies. Best practise dictates that Tier 2 or better methodologies are used for key categories – many of which are included in the energy sector. There is therefore a need to improve the input data in general to allow Tier 2 methodologies to be used, and more specifically improvements to EFs and activity data. In estimating emissions from all sources, default emission factors have been used from international guidance material. There is a clear need for the use of more country specific data, particularly on the information relating to the properties of fuels, which directly determines the CO2 emission estimates. This would allow Tier 2 methodologies to be used. The activity data has almost all been drawn from the national energy balance tables. The data is considered to be accurate, but there are a number of examples where more detail is required to allow Tier 2 methodologies to be used. In addition, a better understanding of how the data is compiled to form the national energy balance tables is needed. This would then support activities to compile two independent datasets using the reference and sectoral approaches (top-down and bottom-up respectively). Examples of sector specific improvements include the following:
1A1a Electricity Generation – a better understanding of the information used in the
national energy balance tables is needed. It may be that emissions from individual point
sources is available for use, which would help with transparency, and could demonstrate
the use of a Tier 2 and 3 approach.
1A1b Refinery – provision of data covering the full time series, with detailed fuel specific
data, would be an improvement.
1A2 Manufacturing Industries – More detail is needed on the fuel used in the
bauxite/aluminium sector to resolve mining activities.
1A2-4 Mobile Machinery – It has been assumed that all gasoline and diesel oil use in the
industry, commercial and residential sectors is for mobile machinery. More detailed
information is needed to confirm this assumption and allow emissions to be better
allocated to respective source sectors.
1A3a Civil Aviation – The availability of fuel used in domestic aviation for the complete
time series would allow improvements. The assumption that the cruise phase is zero for
domestic flights requires more rigorous investigation.
1A3b Road Transport – Whilst the fuel consumption data is considered to be accurate,
much more information is needed on the vehicle fleet to allow emissions to be calculated
with improved certainty and at a more detailed level.
1A3c Railways – Obtaining information on the fuel use in the rail sector would allow
emissions to be better disaggregated and reported in the correct source category.
1A3d Domestic Navigation – Data was not available for the entire time series, and it was
not possible to resolve the fuel used for fishing from the domestic shipping total. Sourcing
more complete and detailed data would allow improved accuracy and improved reporting
of emission estimates to the relevant source sectors.

70
51. Industrial Processes and Product Use
Methodological Overview
Efforts were made to obtain detailed data at the sectoral level, with the aim of using a Tier 2 methodologies from the 2006 IPCC Guidance as far as possible. However it provide challenging to obtain relatively simple data for use in Tier 1 methodologies, and other than activity data, virtually no country specific information was available to support the calculation of emission estimates. The consequence is that most of the emission sources in the IPPU sector are based on 2006 IPCC Guidance Tier 1, although some use Tier 2 methodologies. The main focus of effort was on trying to maximise the completeness of the inventory, and to obtain data on all sources known to exist, or thought to potentially exist in Jamaica. Focus on improving the accuracy of emissions (e.g. by obtaining more detailed input data) will need to be addressed as part of future improvements. However, it is recognised that whilst there are a number of areas where improved input data could provide better quality emission estimates, it is possible that improvements in other source sectors will be prioritised over those in the IPPU sector. This is because the emissions from the IPPU sector make a relatively small contribution to the total GHG emission.
52. Calculation Methodologies
2A Mineral Industry Cement and lime are produced in Jamaica by the calcination of limestone. Cement is used in the construction industry. Lime is used mostly in the processing of bauxite into alumina, in the sugar industry, and can also be applied to agricultural soils for pH control.
There has been a steady decline in bauxite/alumina production in Jamaica from 2008 onwards, and hence the demand for lime in Jamaica. Plant have closed due to the global economic decline and the resulting reduction in the world demand for aluminium. In addition, the high cost of production in Jamaica due to high energy costs has had an impact on the competitiveness of the sector.
2A1 Cement Production The Caribbean Cement Company Limited, located in Rockford, Kingston, is the only manufacturer of “Portland” cement in Jamaica, and produces cement from high quality limestone and uses local shale and gypsum. All of the materials used in the manufacturing process are obtained locally, i.e. there are no imports of raw materials. Annual clinker production data (as well as imports) were provided by the Caribbean Cement Company. There were no imports of clinker over the time period under consideration.
Activity data were collected directly from the plant and compared with data from national statistics. A complete set of data from 2000-2014 were collected. Activity data were compared to data available from ESSC reports 2000-2013 as well as from the company website in form of the company’s annual reports. No major challenge was encountered with the data gathering and calculation of estimates from the cement sub-sector. The method used is classed as a Tier 2 method, as the GHG emission estimates are made by using the national clinker production as the activity data. These production data are considered accurate and reliable, being taken directly from weight measurements at the production plant. A default

Biennial Update Report of Jamaica
correction factor for Cement Kiln Dust (CKD) was used, taken from equation 2.4 in the 2006 IPCC Guidance (IPPU sector - chapter –mineral industry), to give emission estimates of CO2.
2A2 Lime Production The production of lime by the calcination (heating) of limestone produces CO2. Most lime kilns are located at bauxite/alumina plants where usage of lime was greatest, and provided straightforward access. The local sugar factories are also heavy users of lime. However, since 2008 there has been major closure of the bauxite/alumina plants due decline in world demand as well as the high cost of energy in Jamaica. As a result, most of the lime kilns have closed. The sugar industry in Jamaica has also been in general decline. CEMEX Jamaica Limited was established in 1998 and is the only local production company supplying remaining two alumina plants and seven sugar factories with quicklime. Lime kilns that were located at alumina plants have closed down operations and are buying lime directly from the CEMEX plant, which has a capacity of 120,000 tonnes/year. Activity data were collected from national statistics (STATIN, 2015a) as well as the Minerals Yearbook 2000-2011. A complete set of data from 2000-2008 were collected. However the data from 2008-2012 was estimated from (extrapolation) from the previous year’s data set. Activity data from CEMEX that was requested was not provided. Clinker and lime production data are given in the table below. Table 0.19 Production of Clinker and Lime (tonnes)
Year Clinker Production Lime Production
2006 604,174 303,795
2007 519,598 276,800
2008 578,067 312,669
2009 742,208 128,384
2010 629,444 115,141
2011 628,287 141,845
2012 652,579 127,226
Emissions from lime production were calculated using a Tier 2 methodology from the 2006 IPCC Guidance (Volume 3), and using a default value for the Lime Kiln Dust correction factor. The calculated emissions of CO2 from cement and lime production are presented in the table below. Table 0.20 Emissions of CO2 from Cement and Lime Production (Mg CO2)
Year Clinker Production Lime Production Total
2006 314,170 227,846 542,017
2007 270,191 207,600 477,791
2008 300,595 234,502 535,097
2009 385,948 96,288 482,236
2010 327,311 86,356 413,666
2011 326,709 106,384 433,093
2012 339,341 95,420 434,761

72
2D Non-energy Products from Fuels and Solvent Use 2D1 Lubricant Use Lubricants and grease are mostly used in industrial and transportation applications. The emissions that arise from the unintentional oxidation of lubricants and grease are not included in 1A Energy, because the lubricants and grease are not considered to be a fuel. So emissions are included in the IPPU Sector. The CO2 emissions were estimated using the Tier 1 methodology from the 2006 IPCC Guidance. More detailed data on the amounts of each type of lubricant and the associated ODUs (Oxidised during Use) would be required for Tier 2 methodology to be used. The default carbon content and ODU factor were used for both lubricants and grease (0.2 carbon content and 0.05 ODU). It was necessary to convert the quantities of lubricants and grease from energy to mass terms. A net calorific value of 40.4 GJ/tonne was used. This is considered to be a reasonable estimate for lubricants, and whilst it may not be particularly representative of grease, lubricants are by far the largest component. Activity data for the production of a lubricants/grease total were available from Petrojam for 2011 and 2012 (Petrojam, 2015). Consumption for earlier years of the time series were estimated by using simple extrapolation. It was necessary to use default data to divide the total consumption into the two separate components. A 90-10% the split for oil-grease was assumed (see 2006 IPCC Guidance, Volume 3, Chapter 5, and Table 5-2). The consumption of lubricants and grease is presented in the table below. Table 0.21 Consumption of Lubricants and Grease (Mg of product)
Year Lubricating Oil Grease
2006 597.47 16.60
2007 597.47 16.60
2008 597.47 16.60
2009 597.47 16.60
2010 597.47 16.60
2011 927.44 25.76
2012 554.79 15.41
The disposal route for waste lubricants/grease that is not oxidised during use is not known with certainty. So no CO2 emissions have been calculated, or included in the emissions inventory, from the un-oxidised waste lubricant/grease. 2D3 Asphalt Production and Use Asphalt is used widely in road paving and roofing operations, and NMVOC emissions arise. Activity data of the amount of asphalt produced were obtained from Petroleum Corporation of Jamaica (Petrojam, 2015a). For the purposes of the calculation of the estimates asphalt was assume to have the properties similar to Fuel Oil with a conversion factor of 40 GJ/tonne. An EF of 16g NMVOC/Mg (2013 EMEP/EEA Emissions Inventory Guidebook, 2D3b Table 3-1) was used to calculate the NMVOC estimates.

Biennial Update Report of Jamaica
The table below presents the asphalt production, and the resulting NMVOC emission estimates. Table 0.22 Asphalt production (Mg)
Year Asphalt Production (Mg) NMVOC Emission (Mg)
2006 18,178.02 0.29
2007 18,178.02 0.29
2008 18,178.02 0.29
2009 18,178.02 0.29
2010 18,178.02 0.29
2011 19,331.43 0.31
2012 19,419.24 0.31
2F Consumption of Halocarbons and SF6 HFCs, PFCs, SF6 and NF3 are used in a range of applications, as summarised in sections 2.5.4 – 2.5.5. However, after careful consideration by local experts, the only source that could be identified and estimated were the emissions of HFCs from refrigeration and air conditioning. 2F1 Refrigeration and Air Conditioning HFCs are used in refrigeration and air conditioning, and emissions arise at a number of different stages:
Manufacture: The handling of HFCs, and charging of units, during manufacture leads to
emissions.
Use: Leakage of HFC during the use of units occurs throughout the lifetime of the
equipment.
Refill: Following HFC leakage from the equipment during use, some units (particularly air
conditioning in road vehicles) are refilled. Emissions arise from this process, and the size is
highly dependent on the infrastructure in place to ensure that only trained personnel
undertake this, and under conditions to minimise emissions to air.
Disposal: Emissions arise from equipment during disposal. The size of the emission is very
much dependent on whether recovery programmes are in place. Jamaica does have a
system in place for the recovery of HFCs from equipment being scrapped, but expert view
was that the system was not rigorously applied to all equipment being removed from
operation.
Information was sought on the number of different types of refrigeration units and air conditioning units in an attempt to estimate the amount of HFC that was held in equipment. But it was not possible to compile information that was considered to be accurate of complete enough. Consequently it was necessary to use a different approach. HFC import data were obtained from STATIN by individual HFC species for 2012 and 2013. The manufacture of HFCs in Jamaica is known to be zero, and hence the import provides the main input term (along with HFC in imported equipment). The import data were available for 2012 and 2013 only, and assumptions were made to interpolate between these data, and information on the GHG emissions inventory compiled for the Second National Communication, covering 2000-2005 (Davis et al, 2008).

74
The imported data were used with the Tier 1 f-gas emissions calculation tool provided by the UNFCCC. This uses the import data to build up a total “bank” or pool of HFC in equipment. The bank can be calculated on a yearly incremental basis by accounting for HFC added in the form of imports or new equipment, and removals in the form of HFCs recovered from scrapped equipment and emissions to air. An IPCC default EF of 15% is used to determine the emissions from installed equipment. HFC emission estimates are given in the following table. Table 0.23 HFC Emissions (tonnes of CO2 EQ)
HFC-32 HFC-125 HFC-134a HFC-143a HFC-152a HFC-227ea HFC-236fa TOTAL
2006 4.31 12.43 44.32 16.04 0.00 1.69 0.28 79.07
2007 5.47 12.94 49.14 18.14 0.00 1.43 0.24 87.36
2008 6.60 13.09 52.22 19.16 0.00 1.22 0.20 92.49
2009 7.70 12.92 53.82 19.29 0.00 1.03 0.17 94.94
2010 8.78 12.49 54.15 18.64 0.00 0.88 0.15 95.10
2011 9.84 11.83 53.42 17.35 0.00 0.75 0.13 93.32
2012 10.89 11.49 52.39 16.31 0.00 0.64 0.11 91.81
Other Possible Sources of F-Gases There are a number of other possible sources of F-gases. Each source is considered here, with an explanation of why they have not been included in the emissions inventory, and qualitative comments on the levels of certainty associated with the associated assumptions.
2F2 Foams: F-gases are used in some foam blowing. No specific activities were identified
where f-gases were being used, and whilst it is possible that some of the imported HFC
was for use in foam blowing, it is considered unlikely.
2F3 Fire protection: F-gases are used in some fire suppression equipment, and import of F-
gases for this purpose was noted in the second national communication (for 2000-2005). It
has been assumed that all of the HFC import was for use in air conditioning and
refrigeration, but it is possible that small amounts were for use in fire suppression.
2F4 Aerosols and Metered Dose Inhalers: Most aerosols use hydrocarbon propellants, and
HFCs are used only in a few applications such as air dusters and pipe freezing products, so
it is reasonable to assume that the usage in Jamaica is negligible. Metered dose inhalers
(MDIs) are used to deliver certain pharmaceutical products as an aerosol. MDIs originally
used CFC propellants but, as with industrial aerosols, concern over ozone destruction led
to attempts to replace CFCs with HFCs. It has not been possible to quantify the extent of
the use of these products in Jamaica.
2F5 Solvents: F-gases can be used for precision cleaning, but this is typically in the
electronics industry and is not relevant for Jamaica.
2G1 Electrical equipment: SF6 is used as an insulator in high voltage electrical switch gear.
JPS were approached about the use and potential leakage of SF6 from the electricity
infrastructure, but were not able to provide any information. It is considered likely that SF6
is in use in Jamaica in electrical switchgear, and that the inability to make an emission
estimate from this source constitutes an omission. So this source is reported as “NE” – not
estimated.
Biennial Update Report of Jamaica
2G2 Bespoke Military and Scientific Applications: These are not considered to be relevant
for Jamaica.
2G3 N2O from product uses: N2O is used as an anaesthetic in some medical and dental
practices. It was not possible to obtain any information on the use of N2O, and hence no
emissions have been estimated. This is typically a small source, but efforts should be made
to include it as the emissions inventory is improved.
Sectoral Uncertainties
The 2006 IPCC Guidance (Volume 1) provide guidance on identifying uncertainties for source categories. These guidelines were observed in the process of undertaking an uncertainty assessment. However, it was challenging to obtain any quantitative data in the uncertainties associated with input data for estimating emissions from sources within the IPPU sector. Activity data for industrial processes (e.g. clinker production, lime production, food and drink manufacture) were generally considered to be of good quality. However it was not possible to obtain any plant specific emissions, and hence calculation methodologies relied on using default EFs from the 2006 IPCC Guidance. Whilst these EFs are considered to be generally representative, it does result in larger uncertainties. Emissions of F-gases are known to be particularly uncertain, when compared to emissions of most other sources. In addition, it was not possible to use a calculation methodology that considered the numbers and types of fridges and air conditioning units in use. The limited input data meant that the methodology used only import data, which results in emission estimates with relatively high uncertainties. As no quantified data on the uncertainties associated with activity data were available, it was necessary to use expert judgement. Uncertainties associated with EFs were taken from the 2006 IPCC Guidance. A detailed uncertainty analysis was undertaken across all sources of the emissions inventory, and results are presented in Section 3.19.
Quality Assurance and Quality Control
There are a number of sector specific QA/QC procedures that have been undertaken as part of the emissions inventory compilation:
In some cases it was possible to compare national production statistics with
internationally published literature. Data provided at the national level was considered to
be more reliable, but a degree of validation.
Handling activity data: At all stages of the compilation, a programme of QC checks have
been included that are specific to the way the activity data are handled in the emissions
inventory.
Assumptions: It has been necessary to use assumptions in estimating emissions from a
number of different sources. In all cases, the opinion of local experts has been sought to
the extent possible.

76
Recommendations for Improvement
Emissions from the IPPU sector make a small contribution to the total GHG emission, although emissions from cement and lime manufacture are identified as key categories (see Section 8), as is the total HFC emission from refrigeration and air conditioning. Whilst there are areas where methodologies could be significantly improved, it is likely that prioritisation of the available resources will direct improvement resources to other sectors of the inventory. However, it is possible to make a number of observations about improvements that could be made to the emission estimates for the IPPU sector:
Emissions from cement and lime manufacture are estimated using a Tier 2 methodology. It
would be possible to improve this by using individual plant specific data – but this is
considered to be of low priority.
Emissions of HFC from refrigeration and air conditioning uses a very simple methodology
due to the lack of input data and characterisation of the sector, and improvements to the
methodology used for estimating this source should be considered a priority. A more
sophisticated approach could be used for estimating the emissions of F-gases from this
sector by compiling information on the number of units of different types that are in
operation. Obtaining more complete import data would also bring improvements to the
accuracy of the current methodology. Furthermore, it is known that there are activities in
Jamaica to recover f-gases from scrapped equipment. The impact of this on reducing
emissions could be taken into account if or when a more sophisticated methodology is
used for estimating emissions.
Emissions from food and drink could be improved. However the emissions are only an
important contributor to the NMVOC emissions total, and as an indirect GHG, this is
generally given a lower priority.
53. Waste
Solid Waste Disposal
Methodology A Tier 2 methodology was used to calculate the CH4 emissions from solid waste disposal sites in Jamaica. The default values were taken from the “Parameters” spreadsheet provided in the IPCC Spreadsheet for Estimating Methane Emissions from Solid Waste Disposal Sites (IPCC Waste Model) and country specific activity data on current and historical solid waste disposal were utilised in the other tables. Activity Data Population Data Population data was obtained from STATIN website. Exact values were provided for the years 2006 to 2012. Waste Generation Rate Jamaica's per capita generation rate for Municipal Solid Waste (MSW) for the each year within the period 2006-2012 was estimated 1kg/capita/day. This is based on information provided by the National Solid Waste Management Authority (NSWMA). Percentage of MSW to Solid Waste Disposal Sites (SWDS) The fraction of municipal solid waste disposed to SWDS was estimated to be 75% according to the

Biennial Update Report of Jamaica
NSWMA. This percentage was used for all the years. Quantity of Waste The NSWMA has demarcated Jamaica into four regions known as wastesheds: The Riverton, Retirement, West Kirkvine (Southern) and North-eastern wastesheds. Data on the quantity of waste disposed of at the four wastesheds were provided by the NSWMA. The quantity of waste disposed at all the SWDS was available for all the years except 2006 and 2012 for Riverton (the quantity of waste for 2006 was interpolated using the amount reported in 2005, collected from the previous inventory, and that of 2007. In addition, an average of 2011 and 2013 data was used for the year 2012 for the Riverton disposal site. The Church Corner waste disposal site situated in St. Thomas had its waste recorded in Riverton’s data and as such it was assumed that 5% of Riverton’s waste represents Church Corner. This assumption was made based on the ratio of the quantity of waste disposed at Riverton to that disposed at Church Corner; obtained from data in the 2000-2005 inventory. The percentage of waste going to each SWDS was then calculated for 2006-2012. The average percentages were then calculated to be 58%, 23%, 8% and 11% for Riverton, Retirement, North-eastern and West Kirkvine respectively. Composition of MSW Disposed to SWDS The 2010 State of the Environment Report (SOE) and the NSWMA provided data on the composition of waste going to SWDS based on waste characterization studies that were done at the four wastesheds. The waste streams for plastics, metal/tin, glass, e-waste, hazardous waste and other were combined into the fraction “plastics and other inert materials.” The cardboard waste stream was combined into the “paper” waste composition category. Riverton Disposal Site The composition of solid waste disposed to the Riverton disposal site for 2006 was provided in the 2010 SOE report while the NSWMA only provided Riverton’s waste composition for 2013. As a result, for the period 2007-2012 the data was interpolated. Retirement, West Kirkvine (Southern) and North-Eastern Wastesheds The composition of the waste at each of these sites was provided by the NSWMA for the year 2009. No composition data was available for the rest of the years. As such, the composition data for 2006-2008 and 2010-2012 was assumed the same as that of 2009 for each of these wastesheds. The weighted average composition data was then calculated using the average percentage of waste going to each site and their composition data. Methane Correction Factor (MCF) The NSWMA provided descriptions of the solid waste disposal sites that are currently in operation. This allowed for the categorization of the waste management sites into managed, unmanaged deep, unmanaged shallow, managed semi-aerobic and uncategorized. The percentage of waste going to each category was calculated for 2006-2012 using the data provided by the NSWMA. The MCF default values for each category were used from Table 3.1 of the 2006 IPCC Guidelines for National Gas Inventories: Chapter 3, Volume 5. This, along with the percentage of waste going to each waste site allowed for the calculation of the weighted average MCF for MSW.

78
Industrial Waste Disposal Sites No data on the quantity of industrial waste disposed to the four municipal SWDS was provided by the NSWMA. In order to determine the emissions from the most established industrial waste landfills, data was collected from the Jamaica Bauxite Institute (JBI). There are five bauxite /alumina plants in Jamaica: Noranda (bauxite mining only), Jamalco, Windalco Kirkvine, Windalco Ewarton and Alpart. The JBI provided data on the quantity of waste disposed to the industrial waste disposal sites used by the bauxite alumina plants for Windalco Kirkvine, Windalco Ewarton and Alpart. The data reflects that Windalco Kirkvine Works has not been in operation since 2009 and the operations at Alpart were significantly scaled back due to its closure, except for maintenance works since 2009. Table 0.24. Bauxite Industry Waste (Tonnes)
Site Type of Waste
2006 2007 2008 2009 2010 2011 2012
Alpart Alpart Dump 63,294 70,138 82,646 18,587.3 7,664.5 5,374.85 1,059.94
Windalco Kirkvine works
Industrial Alkaline Waste
50,638 52,383 54,110 0 0 0 0
Windalco Ewarton Works
Industrial Alkaline Waste
49,845 33,932 43,945 50,109 39,566 51,117 27,679
The industrial waste deposited to landfills comprises of boiler scales, filter press cloth and other waste material from the bauxite alumina plants. It was assumed that 50% of the waste will degrade under anaerobic conditions resulting in methane emissions. Whilst this is relatively high in uncertainty, it represents the best expert judgement available at the time. It was also assumed that 100% industrial waste goes to the disposal sites. Other industrial waste generated by bauxite alumina plants which are landfilled are red mud tailings and calcium oxalate. These were not included in the inventory as they do not comprise a biodegradable form of waste which releases greenhouse gases; in fact they function as carbon sinks, and are considered in Section 7.2.5 below. Emission Factors Default values were used from the “Parameters” spreadsheet provided in the IPCC FOD Model Spreadsheet under the category “waste by composition” for Degradable Organic Carbon (DOC), Fraction of Degradable Organic Carbon (DOCf) and Fraction of CH4 in generated landfill gas (F). Category Emissions CH4 emissions from domestic and industrial solid waste disposal facilities were estimated as shown in the table below for the years 2006-2012. Table 0.25. CH4 emissions from Municipal and Industrial SWDS (Gg CH4)
Year CH4 (Gg)
2006 19.04
2007 19.64
2008 20.11
2009 21.71
2010 22.30
2011 22.29

Biennial Update Report of Jamaica
2012 22.05
The results show that the emissions slightly increased from 2006 to 2010 but started to decrease thereafter reflecting the effects of the shutdown of the bauxite plants in 2009.
Red Mud as a Carbon Sink
Red mud, the industrial waste resulting from the extraction of alumina from the Bayer process is mineral waste containing iron in the form of hematite (Fe2O3), left-over aluminium oxide (Al2O3), silica (SiO2), some titanium dioxide (TiO2), and other residual minerals. The red mud will absorb atmospheric CO2 to produce HCO3
- in an alkaline environment and HCO3-
will continue to produce CO32- ions under alkaline conditions. Eventually, products like Na2CO3,
CaCO3 will be produced and so the red mud disposal sites are considered to be carbon sinks. Oxalate is also considered as a reliable sink for atmospheric CO2 through calcium carbonate biomineralization in ferralitic tropical soils. There is no IPCC guidance or methodology on estimating the CO2 uptake from red muds, but it was possible to make a quantifiable approximation using first principles and material from the literature. Bonenfant et al (2008) concluded that red mud adsorbs CO2 from the air at a rate of 41.5 g CO2/kg of red mud. This suggest that the CO2 uptake in Jamaica is the order of approximately 20 Gg CO2 in 2012. This equates to approximately 0.1% of the total GHG emissions. The estimate is high in uncertainty, and considering the very small contribution to the CO2 emissions inventory overall, it was decided not to include this sink in the emissions inventory at this time.
Biological Treatment of Solid Waste
Methodology Tier 1 methodology was used to determine the CH4 emissions from anaerobic digestion in biogas facilities. This means that a default emission factor (on a dry weight basis) was used from the 2006 IPCC Guidelines for National GHG Inventories: Volume 5 together with national data on the amount of CH4 generated from biodigesters. Activity Data Data for the methane gas flow rate (m3/day) was provided by the Scientific Research Council (SRC) for the years 2000 to 2005 and recorded in the report “Estimated Greenhouse Gas Emissions from Waste Facilities” dated January 2008. Using the density of methane (0.717 kg/m3) the methane generation rate was found (g/yr) then used to calculate the methane emissions for 2000-2005. For 2006-2012, data on the gas flow rate of biodigesters was unavailable. Therefore, the methane emissions for 2006-2012 were extrapolated using the data from the previous inventory. Default Value Information from the Scientific Research Council indicated that about 75 % of methane generated from all biologically treated solid waste was used and the remainder was burnt off/flared. However, Chapter 4, Section 4.1 of the 2006 IPCC Guidelines for National GHG Inventories: Volume 5 suggests that unintentional leakages during process disturbances and other unexpected events during anaerobic digestion of organic waste should be accounted for by reducing the quantity of CH4 generated by the biodigesters by between 0 and 10 percent. It was therefore assumed in this case that the leakages would be minimal and a value of 5 percent was used.

80
Emission Factors The emission factor (g CH4/kg waste treated) for anaerobic digestion at biogas facilities on a dry weight basis used for the calculation of the methane emissions was taken from Table 4.1 in the 2006 IPCC Guidelines for National GHG Inventories: Volume 5. In addition, Table 4.1 indicates that the EF for N2O from anaerobic digestion should be assumed to be negligible. Category Emissions The estimated CH4 and N2O emissions from biodigesters for the years 2006-2012 are negligible as shown in the following table. Table 0.26. Estimated Methane and Nitrous Oxide Emissions from Biodigesters (Gg)
Year CH4 (Gg) N2O (Gg)1
2006 3.62E-05 NE
2007 3.85E-05 NE
2008 4.09E-05 NE
2009 4.32E-05 NE
2010 4.55E-05 NE
2011 4.79E-05 NE
2012 5.02E-05 NE 1NE: emissions of N2O are considered to be negligible, so no estimate is presented.
Waste Incineration – Medical and Industrial Waste
Methodology Tier 1 methodology was used to estimate CH4 and N2O emissions as well as indirect greenhouse gas emissions (NOx, SO2, CO and NMVOC). Data on the quantity of waste incinerated were estimated in the case of medical waste and were based on data provided by some industries with incinerators for the period under review. Activity Data Quantity of Medical Waste Incinerated There is very little documentation on the quantity of waste that is generated and incinerated by both public and private healthcare facilities. To determine the quantity of waste incinerated, data on the medical waste generation rate (kg/bed/day) and the number of beds in the hospitals categorized by region were collected. Hospitals are categorized into four regions as follows: Table 0.27 Regional Categorisation of Hospitals
Region Hospitals
North East Regional Hospitals
St. Ann’s Bay, Annotto Bay, Port Antonio, Port Maria
South East Regional Hospitals
Spanish Town, Linstead, Princess Margaret, Bellevue, Bustamante Children, Hope Institute, Mona Rehabilitation, National Chest, Victoria Jubilee
Western Regional Hospitals Cornwall Regional, Savanna la Mar, Falmouth, Noel Holmes
Southern Regional Hospitals Mandeville, Black River, Lionel Town, May Pen, Percy Junior
The University Hospital of the West Indies (UHWI) was not included in any of the abovementioned categories and is located in the South East region of Jamaica.

Biennial Update Report of Jamaica
An estimation of the quantity of waste incinerated was determined by combining a number of partial datasets on bed numbers, occupancy rates and waste generation per bed. Information was also gathered on the use of an autoclave to sterilize the medical waste of all the hospitals in the South East region. Details can be found in the GHG Emissions Inventory Report (Dore et al, 2015). Quantity of Industrial Waste Incinerated A list of permitted incinerators operating within the period 2006-2012 was provided by NEPA along with the average annual quantity of waste incinerated. This average value was used for all years in the time series, as no year specific data were available. Emission Factors The default values for the emission factors for CH4 and N2O were used:
60 kg CH4/Gg waste for from Table 5.2 in the 2006 IPCC Guidelines for National Greenhouse Gas Inventories: Volume 5 [batch type –stoker]
100 kg N2O/Gg waste from Section 5.4.1.3 in the 2006 IPCC Guidelines for National Greenhouse Gas Inventories: Volume 5
To calculate the CO2 emissions, default values were obtained from Table 5.2, 2006 IPCC Guidelines for National Greenhouse Gas Inventories: Volume 5 for the relevant waste streams as follows: Table 0.28. Default Emission Values for CO2 EFs for Incineration
Default Values Medical waste (fraction) Industrial waste (fraction)
Dry matter content Not applicable Not applicable
Fraction of carbon in dry matter 0.60 0.50
Fraction of fossil carbon in Total carbon 0.40 0.90
Oxidation factor 1 1
Conversion of C to CO2 emitted 44/12 44/12
To estimate the indirect greenhouse gas emissions, the default values in the table below were taken from 2013 EMEP/EEA Guidebook, Chapter 5C1biii, and Table 3.1: Table 0.29. Emission factors for Indirect Greenhouse Gases. Waste incineration
NOx EF (kg/Mg) SO2 EF (kg/Mg) NMVOC EF (kg/Mg) CO EF (kg/Mg)
2.3 0.54 0.7 0.19
Category Emissions The estimated CH4, N2O and fossil CO2 emissions from incinerators for the years 2006 to 2012 are shown in the table below. A decrease in the emissions is observed which reflects the reduced used of incinerators due to the implementation and use of the autoclave technology. The CH4 and N2O emissions are negligible. Table 0.30. Total emissions from Incineration of Medical and Industrial Waste (Gg)
Year CH4 N2O Fossil CO2 NOx SO2 NMVOC CO
2006 0.0002 0.0004 5.5276 0.0058 0.0010 0.0197 0.0005
2007 0.0002 0.0004 5.2975 0.0052 0.0008 0.0196 0.0004
2008 0.0002 0.0004 5.3369 0.0053 0.0008 0.0196 0.0004
2009 0.0002 0.0004 5.3585 0.0053 0.0009 0.0196 0.0004
2010 0.0002 0.0004 5.3682 0.0054 0.0009 0.0196 0.0004
2011 0.0002 0.0004 5.3223 0.0052 0.0008 0.0196 0.0004
2012 0.0002 0.0004 5.1851 0.0049 0.0007 0.0195 0.0004

82
Open Burning of Waste
Methodology Tier 2 methodology was used to estimate the CH4 and N2O emissions from open burning of waste at landfills and in the backyard. Country specific data on the quantity of open burned municipal solid waste was used together with default EFs from the 2006 IPCC Guidelines for National GHG Emissions Inventories: Volume 5. Tier 2a methodology was used to estimate the CO2 emissions from open burning of waste. Country specific data on the quantity of open burned municipal solid waste and the composition by waste stream were used together with default EFs from the 2006 IPCC Guidelines for National Greenhouse Gas Emissions Inventories: Volume 5. Activity Data Population Data Population data (P) for the years 2006 to 2012 were obtained from STATIN website. Per Capita Waste Generation Per capita waste generation (MSWp) for Jamaica is 1 kg/per person per day. Fraction of Population Burning Waste, Pfrac The fraction of the population that reportedly burned their waste in the backyard in 2006 and 2010 were 38% and 32% respectively. In the absence of year specific data, the percentage obtained for 2006 was applied to 2007- 2009 while 32% was used for 2010-2012. The fraction of municipal solid waste disposed to SWDS is reportedly 75% as discussed in section 7.2.2 above. It was therefore assumed that 50% of the amount disposed to the SWDS is burnt as not all of the waste is burnt when there are fires at landfills. Fraction of Waste Burnt Relative to the Amount Treated, Bfrac The 2006 IPCC Guidelines for National Greenhouse Gas Emissions Inventories, Section 5.3.2 suggests that if all waste is burned without leaving a residue, the fraction of waste burned relative to the amount of waste treated (Bfrac) waste should be 1. For landfill fires, the fraction burned was estimated to be 0.6 as only this fraction of the waste is burnt with 40% of waste being residue. Backyard burning was estimated to be 0.9 as nearly all the waste is burned with a small amount of ash residue. Number of Fires It assumed that burning took place twice per week in backyards. In 2008, there were two fires at the Riverton disposal site while there were reportedly one fire occurring in each of the other years in the inventory period. Each fire lasted for 14 days. Emission Factors A methane emission factor of 6500g/t MSW wet weight (or 6500 kg/Gg) as suggested in Section 5.4.2 of the 2006 IPCC Guidelines for National Greenhouse Gas Inventories: Volume 5 was used. A N2O emission factor of 150 g/t of MSW (or 150 kg/Gg) as indicated in Section 5.4.3, Table 5.6 was used to estimate the N2O emissions. The EFs used for the indirect emissions obtained from 2013 EMEP/EEA Guidebook, Chapter 5C2, Table 3.1 are as follows:
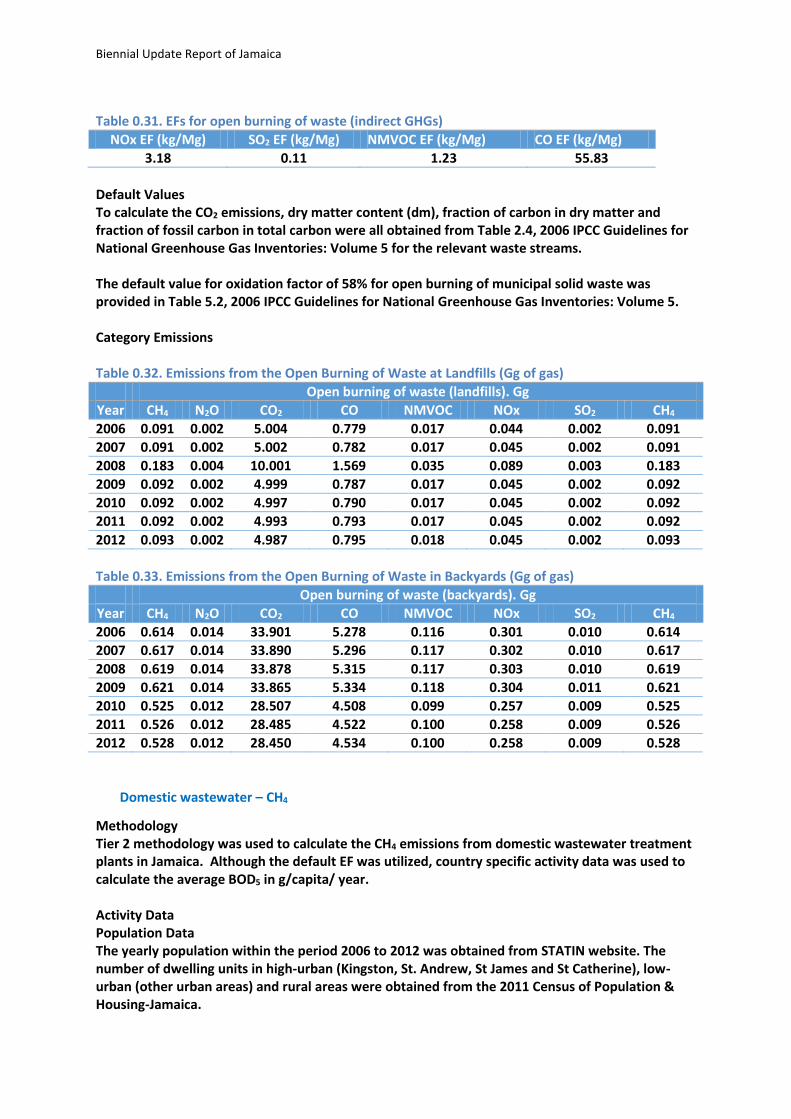
Biennial Update Report of Jamaica
Table 0.31. EFs for open burning of waste (indirect GHGs)
NOx EF (kg/Mg) SO2 EF (kg/Mg) NMVOC EF (kg/Mg) CO EF (kg/Mg)
3.18 0.11 1.23 55.83
Default Values To calculate the CO2 emissions, dry matter content (dm), fraction of carbon in dry matter and fraction of fossil carbon in total carbon were all obtained from Table 2.4, 2006 IPCC Guidelines for National Greenhouse Gas Inventories: Volume 5 for the relevant waste streams. The default value for oxidation factor of 58% for open burning of municipal solid waste was provided in Table 5.2, 2006 IPCC Guidelines for National Greenhouse Gas Inventories: Volume 5. Category Emissions Table 0.32. Emissions from the Open Burning of Waste at Landfills (Gg of gas)
Open burning of waste (landfills). Gg
Year CH4 N2O CO2 CO NMVOC NOx SO2 CH4
2006 0.091 0.002 5.004 0.779 0.017 0.044 0.002 0.091
2007 0.091 0.002 5.002 0.782 0.017 0.045 0.002 0.091
2008 0.183 0.004 10.001 1.569 0.035 0.089 0.003 0.183
2009 0.092 0.002 4.999 0.787 0.017 0.045 0.002 0.092
2010 0.092 0.002 4.997 0.790 0.017 0.045 0.002 0.092
2011 0.092 0.002 4.993 0.793 0.017 0.045 0.002 0.092
2012 0.093 0.002 4.987 0.795 0.018 0.045 0.002 0.093
Table 0.33. Emissions from the Open Burning of Waste in Backyards (Gg of gas)
Open burning of waste (backyards). Gg
Year CH4 N2O CO2 CO NMVOC NOx SO2 CH4
2006 0.614 0.014 33.901 5.278 0.116 0.301 0.010 0.614
2007 0.617 0.014 33.890 5.296 0.117 0.302 0.010 0.617
2008 0.619 0.014 33.878 5.315 0.117 0.303 0.010 0.619
2009 0.621 0.014 33.865 5.334 0.118 0.304 0.011 0.621
2010 0.525 0.012 28.507 4.508 0.099 0.257 0.009 0.525
2011 0.526 0.012 28.485 4.522 0.100 0.258 0.009 0.526
2012 0.528 0.012 28.450 4.534 0.100 0.258 0.009 0.528
Domestic wastewater – CH4
Methodology Tier 2 methodology was used to calculate the CH4 emissions from domestic wastewater treatment plants in Jamaica. Although the default EF was utilized, country specific activity data was used to calculate the average BOD5 in g/capita/ year. Activity Data Population Data The yearly population within the period 2006 to 2012 was obtained from STATIN website. The number of dwelling units in high-urban (Kingston, St. Andrew, St James and St Catherine), low-urban (other urban areas) and rural areas were obtained from the 2011 Census of Population & Housing-Jamaica.

84
The population in 2011 was divided by the total dwellings to determine the average number of persons per dwelling (3.17persons/dwelling). This enabled the population in each income group to be calculated as follows:
Total dwellings (i) average persons per dwelling = population (i)
The population fractions that were calculated were used to determine the population of the high urban, low urban and rural areas for the other years (2006-2010 and 2012). Table 0.34. Population Data for 2011
Year Total dwellings Population Population fraction
Total dwellings
high urban (KMA) 341,560 1,081,947 0.400 341,560
low urban 118,959 376,822 0.139 118,959
rural 393,149 1,245,364 0.461 393,149
Total 853,668 2,704,133 1.000 853,668
BOD5 Generation Rate The Biochemical Oxygen Demand (BOD) loading rate (g/yr) and the average population (capita) served by the wastewater treatment plants were used to determine the BOD generation rate (g/capita/day). Loading Rate To calculate the loading rate (g/yr), the capacities (L/yr) of the treatment plants and the BOD (mg/L) were collected from the National Water Commission (NWC) and the National Environment and Planning Agency (NEPA). The BOD for seventy six (76) sewage treatment plants was provided by NWC. However the capacities of only 66% of the plants were available. The BOD for 189 sewage treatment plants were provided by NEPA, six of which were NWC plants, the other 183 were private sewage treatment plants. Data provided on the six NWC plants were cross checked with that provided by NWC and used to fill gaps of the missing data. NEPA only provided the capacities of 64% of the plants. Average Population Served by each Plant The average population served by 56 of the sewage treatment plants was found from research together with the data provided by NWC. NEPA did not provide any data on population served by each plant therefore the BOD generation rate of the 183 private sewage treatment plants could not be calculated. In summary, the BOD generation rates of only 50 sewage treatment plants were calculated due to the fact that data on plant capacities and the average population served by each plant were unavailable. The rates that were less than 0.1 g/capita/day and greater than 90 g/capita/day were not used in the calculation of methane emissions level are they are deemed outliers. Degree of Utilization The sewage treatment facilities for Jamaica are predominantly aerobic systems. The data on the performance of the systems (degree of utilization (Tij) in high-urban, low-urban and rural areas) for 2006, 2007, 2009 and 2010 were obtained from the Planning Institute of Jamaica (PIOJ) and

Biennial Update Report of Jamaica
STATIN (Jamaica Survey of Living Conditions 2006, 2007, 2009 & 2010, Table F3, F3, F3 and F7 respectively). To find the degree of utilization in 2008, an average of the values for 2007 and 2009 was used since no data was available. For 2011 and 2012, the degree of utilization obtained for 2010 was used. Emission Factors Table 6.3 in the 2006 IPCC Guidelines for National Greenhouse Gas Inventories Volume 5 provides values for the default Methane Correction Factor (MCF). The wastewater treatment plants in Jamaica fall into two main categories for which default MCF values were provided:
for untreated systems with high organic loadings or
for treated, not well managed systems.
Therefore, an average default MCF value of 0.2 was estimated. The default value of 0.6 kg CH4/kg BOD was used for the maximum CH4 producing capacity (B0), from Table 6.2, 2006 IPCC Guidelines for National GHG Emissions Inventories, Volume 5. The EF for domestic wastewater was calculated to be 0.12 kg CH4/kg BOD (MCF x default value B0) for the years 2006 to 2012. There were no values for sludge production, so the EF for domestic sludge is zero for all the years.
Sludge Removal and Methane Recovery Neither NEPA nor NWC was able to provide any data on sludge removal and the amount of CH4 recovered. For the purpose of this exercise these parameters were assumed to be zero. Category Emissions The estimated CH4 emissions for domestic wastewater are presented in the table below. Table 0.35. CH4 emissions from Domestic Wastewater Treatment Facilities (Gg)
Year CH4 (Gg)
2006 1.88
2007 2.43
2008 2.05
2009 1.80
2010 1.62
2011 1.60
2012 1.52
Industrial Wastewater
Methodology The Tier 2 methodology was used to calculate the CH4 emissions from industrial wastewater treatment plants in Jamaica. Default wastewater generation and the corresponding Chemical Oxygen Demand (COD) values were used for most of the primary industries generating wastewater in Jamaica. Country specific data on total industrial product was used. In addition, country specific data on COD for the sugar industry and the wastewater generation rate for the alcohol industry were used.

86
Activity Data The activity data for this source category is the amount of organically degradable material in the wastewater (TOW). This parameter is a function of industrial output (product) P (tonnes/yr), wastewater generation W (m3/tonne of product) and degradable organics concentration in the wastewater COD (kg COD/m3). The table below shows the activity data collected and used for the calculation of emissions from primary industries in Jamaica.

Biennial Update Report of Jamaica
Table 0.36. Annual Production, Wastewater Generation and COD values for Primary Industries in Jamaica
2006 IPCC Guideline Default values & Country Specific
Values
Total Industrial Product (P) [t/yr]
Industry Type Wastewater Generation W [m3/ton]
COD Generated
[kg/m3]
2006 2007 2008 2009 2010 2011 2012
Alcohol Refining
22.5 11 23,218 21,737 23,266 22,020 19,050 20,019 23,500
Beer & Malt 6.3 2.9 86,955 68,117 85,985 69,204 65,516 58,343 50,226
Coffee & Cocoa
9 12,985 15,885 9,441 12,919 9,666 8,299 7,244
Dairy Products 7 2.7 4,877 5,704 4,525 3,868 4,386 3,864 3,648
Fish Processing
13 2.5 21,087 17,438 15,355 18,346 16,498 15,358 11,138
Meat & Poultry
13 4.1 118,113 120,695 122,556 119,770 114,822 115,596 118,583
Sugar Refining 2.87 146,882 164,387 140,872 125,818 121,806 139,594 131,589
Vegetables, Fruits & Juices
20 5 467,802 197,951 196,095 229,073 212,796 273,388 280,615
Petroleum Refineries
0.6 1 1,033,055 1,089,163 1,135,801 1,047,265 1,104,994 1,160,199 1,132,389
Detergent 2.5 0.85 1,609 2,194 2,457 1,568 392 367 387
Vegetable Oil 3.1 0.85 21,122 21,306 20,642 18,617 21,712 21,266 21,102
Total 1,937,705 1,724,577 1,756,995 1,668,468 1,691,638 1,816,293 1,780,421
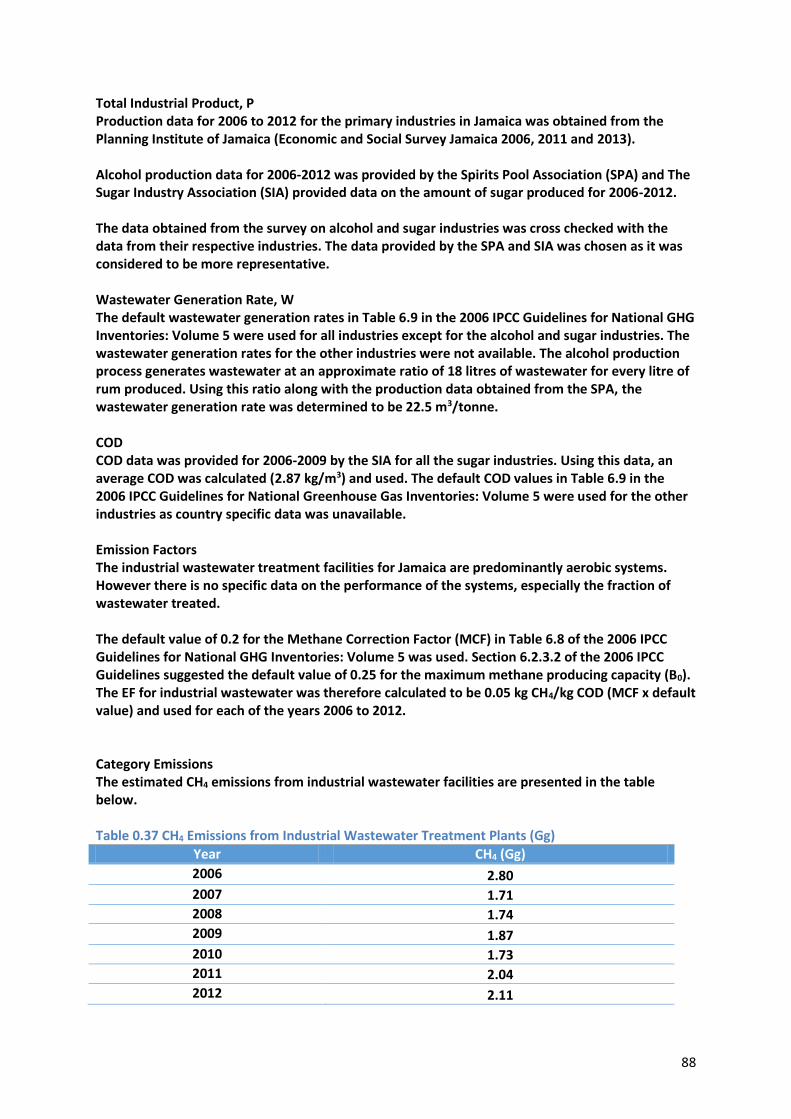
88
Total Industrial Product, P Production data for 2006 to 2012 for the primary industries in Jamaica was obtained from the Planning Institute of Jamaica (Economic and Social Survey Jamaica 2006, 2011 and 2013). Alcohol production data for 2006-2012 was provided by the Spirits Pool Association (SPA) and The Sugar Industry Association (SIA) provided data on the amount of sugar produced for 2006-2012. The data obtained from the survey on alcohol and sugar industries was cross checked with the data from their respective industries. The data provided by the SPA and SIA was chosen as it was considered to be more representative. Wastewater Generation Rate, W The default wastewater generation rates in Table 6.9 in the 2006 IPCC Guidelines for National GHG Inventories: Volume 5 were used for all industries except for the alcohol and sugar industries. The wastewater generation rates for the other industries were not available. The alcohol production process generates wastewater at an approximate ratio of 18 litres of wastewater for every litre of rum produced. Using this ratio along with the production data obtained from the SPA, the wastewater generation rate was determined to be 22.5 m3/tonne. COD COD data was provided for 2006-2009 by the SIA for all the sugar industries. Using this data, an average COD was calculated (2.87 kg/m3) and used. The default COD values in Table 6.9 in the 2006 IPCC Guidelines for National Greenhouse Gas Inventories: Volume 5 were used for the other industries as country specific data was unavailable. Emission Factors The industrial wastewater treatment facilities for Jamaica are predominantly aerobic systems. However there is no specific data on the performance of the systems, especially the fraction of wastewater treated. The default value of 0.2 for the Methane Correction Factor (MCF) in Table 6.8 of the 2006 IPCC Guidelines for National GHG Inventories: Volume 5 was used. Section 6.2.3.2 of the 2006 IPCC Guidelines suggested the default value of 0.25 for the maximum methane producing capacity (B0). The EF for industrial wastewater was therefore calculated to be 0.05 kg CH4/kg COD (MCF x default value) and used for each of the years 2006 to 2012. Category Emissions The estimated CH4 emissions from industrial wastewater facilities are presented in the table below. Table 0.37 CH4 Emissions from Industrial Wastewater Treatment Plants (Gg)
Year CH4 (Gg)
2006 2.80
2007 1.71
2008 1.74
2009 1.87
2010 1.73
2011 2.04
2012 2.11

Biennial Update Report of Jamaica
Domestic Wastewater - N2O
Methodology The methodology used for this section is provided by Chapter 6 of the 2006 IPCC Guidelines for National Gas Inventories: Volume 5. It addresses indirect N2O emissions from wastewater treatment effluent that is discharged into aquatic environments. Activity Data The activity data that is needed for estimating N2O emissions are nitrogen content in the wastewater effluent, country population and average annual per capita protein generation (kg/person/yr). Population Data Population data for the years 2006 to 2012 was obtained from STATIN (website). Per Capita Protein Consumption Data on per capita protein available for consumption in 2006 to 2012 was obtained from the Food and Agriculture Organisation (FAOSTAT) website (http://faostat3.fao.org/download/D/FS/E ). It was assumed that all protein available for consumption was actually consumed. Nitrogen Content in the Wastewater The following default values were used:
fraction of Nitrogen in protein (FNPR) - 0.16 kg N/kg protein
the non-consumed protein (FNON-CON) added to wastewater - 1.1
for industrial and commercial co-discharged protein (FIND-COM) - 1.25 The default values were obtained from Chapter 6, Table 6.11, in the 2006 IPCC Guidelines for National GHG Inventories: Volume 5. Emission Factors The default EF of the wastewater effluent (EFEFFLUENT) was obtained from Chapter 6, Table 6.11, in the 2006 IPCC Guidelines for National GHG Inventories: Volume 5; EFEFFLUENT= 0.005 kg N2O-N/kg sewage-N produced. Category Emissions The estimated N2O emissions from wastewater for the years 2006 to 2012 are presented in the table below: Table 0.38. N2O Emissions from Wastewater treatment (Gg)
Year N2O (Gg)
2006 0.131
2007 0.131
2008 0.132
2009 0.130
2010 0.131
2011 0.131
2012 0.132

90
Sectoral Uncertainties
Solid Waste Disposal Data for the quantity of waste disposed to different sites was complete for all the years for all disposal sites except Riverton. Data was missing for 2006 which was then interpolated between the data for 2005 and 2007. Therefore, calculations on the percentages of waste going to the disposal site and the Methane Correction Factors (MCF) may have been overestimated or underestimated. Data for the composition of domestic waste was available for only 2006 for Retirement, North-eastern and West Kirkvine wastesheds. The data for the rest of the years was assumed the same which may result in inaccuracy of the results. Industrial waste going to landfills was only obtained for the bauxite industry therefore the emissions calculated in this regard do not include other industries that also dispose of their waste in landfills. Additionally, some industrial waste is disposed of at the municipal disposal sites but the quantity is unknown. Estimates of uncertainties were calculated as shown in the Table below based on information provided in Chapter 3, Table 3.5 of the 2006 IPCC Guidelines for National Gas Inventories: Volume 5. Biological Treatment of Solid Waste Uncertainties for activity data related to biologically treated waste were calculated using information from Table 3.5 the 2006 IPCC Guidelines for National GHG Inventories: Volume 5. Uncertainties related to the EFs were calculated using the ranges provided in Table 4.1 of the 2006 IPCC Guidelines for National Gas Inventories: Volume 5. The data from the Scientific Research Council on the CH4 gas flow rate is expected to be reliable and a +10% error was assumed. The CH4 recovery (R) uncertainty was obtained from Chapter 3, Table 3.5 of the 2006 IPCC Guidelines for National Gas Inventories: Volume 5 which suggested an uncertainty for metered CH4 recovery or flaring systems of +10%. The uncertainty for the CH4 EF (a value of 2 within a range of 0 to 20) was -100% to +900%. This information was obtained from Chapter 4, Table 4.1 of the 2006 IPCC Guidelines for National Gas Inventories: Volume 5 and is presented in table 7.16 below. Incineration of Waste Data on the quantity of medical waste incinerated was found by using the waste generation rate calculated for the St Ann’s Bay hospital as this was the only hospital for which data was available. It is expected that the waste generation rates of hospitals located in different regions will vary and so the assumption that the generation rate is the same could lead to misrepresentations in the emissions calculations. In addition, interpolation/extrapolation was used to estimate the data for the years for which no data was available on the number of beds and occupancy rates. Site-specific EFs were not available and default values obtained from the 2006 IPCC Guidelines for National GHG Inventories: Volume 5 and the 2013 EMEP/EEA Guidebook had to be used. Data obtained from NEPA on the quantity of industrial waste incinerated was an average annual estimate as yearly values were not available. Some CH4 emissions are unaccounted for as it was difficult to obtain information from some facilities which NEPA granted permits to operate incinerators.

Biennial Update Report of Jamaica
There was insufficient information in the 2006 IPCC Guidelines for National Greenhouse Gas Inventories: Volume 5 to calculate the percentage uncertainty for CO2 emissions. Open Burning of Waste The default value for the fraction of waste burned relative to the amount of waste treated (Bfrac) waste was used in the absence of country specific data. Data on the number of fires in the backyard was assumed and was not based on any studies carried out by the NSWMA. There was insufficient information in the 2006 IPCC Guidelines for National Greenhouse Gas Inventories: Volume 5 to calculate the percentage uncertainty for CO2 emissions. Domestic Wastewater – CH4 To determine the BOD generation rate (g/capita/day), the average population served by each plant and the capacities of the plants were needed. However, the NWC and NEPA provided limited data and as such, BOD data for 26 of NWC plants as well as 183 private sewage plants were not included in the calculations. The design capacities of the treatment plant had to be used rather than the actual annual average flow rate. This may result in inaccurate representation of the BOD generated from the plants. The population fractions calculated for 2011 were used as the population fractions for the other years due to the absence of year specific data on the population of each income group. The change in population however is expected to be minimal. Data for the degree of utilization of type of treatment system (sewered, not sewered, pit latrines) were obtained for some of the years except 2008, 2011 and 2012 from the Jamaica Survey of Living Conditions. 2010 data was used for the years 2011-2012, even though there was a small increase in the use of sewered water closets and a corresponding decline in the use of pit latrines observed in the high urban time series.
Since no country-specific data was available for the emission factors for domestic wastewater, estimates were based on default EF values provided by Tables 6.2 and 6.3 of the 2006 IPCC Guidelines for National Greenhouse Gas Inventories: Volume 5. Using the default values provided by Table 6.7 of the 2006 IPCC Guidelines for National GHG Inventories: Volume 5, together with expert judgment, the percentage uncertainty in the CH4 emission estimations was calculated. Industrial Wastewater – CH4 Since data for wastewater generated (W) and the chemical oxygen demand (COD) were not available for most industries example values from Table 6.9 in the 2006 IPCC Guidelines for National GHG Inventories were used. For the coffee and cocoa industry, no IPCC example values or range on the rate of generation of wastewater for this critical sector was available which is known to produce significant quantities of wastewater. Country specific data on wastewater generation and COD was only available for the alcohol and sugar industry respectively. Country specific information for the maximum CH4 producing capacity (B0) and CH4 correction factor was not available and default values obtained from the 2006 IPCC Guidelines for National Greenhouse Gas Inventories had to be used. Using the default values provided by Table 6.10 of the 2006 IPCC Guidelines for National

92
Table 0.39 Uncertainties in Emissions Estimates in Waste Sector
Activity data, Parameter or Emission factor % Uncertainty
Remarks
Solid waste disposal
Total municipal solid waste (MSWT) 30 Waste generation data collected on a
regular basis
Fraction of MSWT sent to SWDS (MSWF) 50 Periodic studies conducted to
determine % of solid waste sent to municipal disposal sites
Total uncertainty of waste composition 50 Periodic studies conducted including
sampling
Degradable Organic Carbon (DOC) 20 IPCC default values used
Fraction of Degradable Organic Carbon (DOCf)
20 IPCC default values used
Methane Correction Factor (MCF) 20 IPCC default values used
Biological treatment - CH4
Emission factor -100 to
+900
Methane recovery (R) 10
Methane gas flow rate 10
Incineration and open burning- CO2
Amount of solid waste incinerated 70 Some waste incineration data
available
Amount of solid waste burnt 20 Some waste burning data available
Fraction of carbon in dry matter ? IPCC default values used
Fraction of Fossil Carbon on Total Carbon ? IPCC default values used
Oxidation factor ? IPCC default values used
Conversion factor ? IPCC default values used
Nitrous oxide emission factor 100 IPCC default values used
Methane Emission factor 100 IPCC default values used
Domestic and Industrial wastewater treatment - CH4
Maximum CH4 producing capacity (Bo) 30
Fraction treated anaerobically (MCF) 40 Mixture of untreated systems and
latrines and lagoons, poorly managed treatment plants
Human Population (P) 5
BOD per person 30
Fraction of population income group (U) 15
Degree of utilisation of treatment/discharge pathway or system for each income group (Tij)
30
Correction factor for additional industrial BOD discharged into sewers
20
Industrial production (P) 10
Wastewater/unit production (W) 35
COD/unit wastewater
Wastewater -N2O
EFEFFLUENT (kgN2O-N/kg-N) 30
EFPLANTS (gN2O/person/year) 40
Human Population (P) 5
Protein 10
Fraction of nitrogen in protein (FNPR) (kgN/kg protein)
6
Degree of utilisation of large WWT plants 20

Biennial Update Report of Jamaica
(Tplant)
Factor to adjust for non-consumed protein (FNON-CON)
30
These data have been used in determining the uncertainties from the individual sources in the waste sector. Results of the uncertainty analysis conducted across the whole emissions inventory are presented in Section 9.
Quality Assurance and Quality Control
There are a number of sector specific QA/QC procedures that have been undertaken as part of the emissions inventory compilation:
Handling activity data: At all stages of the compilation, a programme of QC checks have
been included that are specific to the way the activity data are handled in the emissions
inventory. The activity data that was obtained for use in the emissions calculations is
generally high in detail level, although not always high in completeness.
It was possible to compare the activity data with that from other countries by using simple
metrics, such as waste generated per capita. This provided an important and useful quality
check on the data.
Interpolation/extrapolation: There are some occasions where it was necessary to extend
available data to the whole time series by using interpolation or extrapolation. Gap filling
in this way is typically straightforward, but there are occasions where there are options for
the approach used to extrapolate data. Where there was the potential for choice to have a
significant impact on the resulting emissions, the available approaches were discussed
between experts to agree the most appropriate method. This also helped to ensure a
consistent approach with other sectors of the emissions inventory.
Assumptions: It has been necessary to use assumptions in estimating emissions from a
number of different sources. The inventory compilers were able to bring excellent in-
depth local knowledge and expertise in making assumptions, as well as consulting with an
internationally experienced inventory compiler before finalising on assumptions.
The IPCC model was used for estimating CH4 emissions from landfilled domestic and
industrial waste landfills. A number of QC routines were added to the model to ensure
that data handling errors were eliminated.
The emissions estimates as originally compiled were independently reviewed. This identified a number of calculation errors, and assumptions that required correction. These were addressed before data were finalised and included in this report.
Recommendations for Improvement
Solid Waste Disposal Improvements to data quality and availability would be achieved if industries operating industrial disposal sites established reliable systems to estimate/measure the quantity and types of industrial wastes being disposed at dump sites. A requirement to submit this information annually to the NSWMA would help with accessibility. The NSWMA could then maintain a database with this information to enable easy data retrieval. Similarly, if the NSWMA, the current operator of the municipal disposal sites, logged information on the source, quantities and types of industrial and municipal solid waste being delivered to its

94
sites and maintained this information in a database, it would help with the availability of high quality datasets. Biological Treatment of Solid Waste Improvements to data quality and availability would be achieved if the SRC maintained a database of the quantity of waste that is treated by biodigesters and made this information readily available. Incineration of Waste Improvements to data quality and availability would be achieved if the MOH maintained records of the quantity of medical waste generated from health care facilities and made this data readily accessible. To improve data quality and availability, a number of changes are proposed. It is expected that the NEPA could take the role of maintaining an up-to-date database of all existing incinerators. All major and significant facilities must be licenced under the Air Quality Regulations to discharge emissions. Through this regime, data could be provided by the facilities on their annual emissions. NEPA would need to ensure an effective system for monitoring facilities. While challenging, NEPA would also need to ensure that small facilities which do not fall within the licencing system still use the best available technology and /or best practices to operate their facilities. Open Burning of Waste It is suggested that the NSWMA carry out studies to determine country specific data for the fraction of waste burned relative to the amount of waste treated (Bfrac). Regular analysis of the waste stream composition could be conducted by the NSWMA at each of the disposal sites so that the differences across the country can be assessed. Domestic Wastewater – CH4 It is necessary that flow meters are installed at the sewage treatment facilities to get actual flow rates of the wastewater instead of estimating the BOD loading rates using the capacity of the plants. In addition, increasing the frequency of sampling would give better data for each plant on the BOD values throughout the year. The NEPA has the legal mandate to request information on domestic sewage flows and effluent quality from the operators of sewage treatment plants and it would improve data availability if this information was regularly submitted. It would bring significant efficiencies if STATIN and PIOJ collected and presented data in the same formats annually. Information required includes:
Population according to income groups (KMA, Other towns and Rural Areas)
Degree of utilisation of type of treatment system (sewered, not sewered, pit latrines) split
between KMA, Other towns and Rural Areas.
Industrial wastewater – CH4 Data on annual wastewater flows, COD and annual production were difficult to obtain for major industries in Jamaica. Improved input data could be made available if industries conducted more frequent BOD and COD analysis on wastewater. The NEPA has the legal mandate to request information on wastewater flows, production and effluent quality from industries that are generators of large volumes of wastewater. 54. Uncertainty Analysis
Introduction
The IPCC Guidance provides information on the quantification of uncertainties associated with emission estimates, and uncertainty ranges are given for the EFs in the guidance. Methodologies

Biennial Update Report of Jamaica
are also presented that allow the combination of uncertainties to give an overall uncertainty value that can be applied to a pollutant total and also to a trend in the time series.
Methodology
The data available on uncertainties associated with the input data was very variable. Consideration has been given to uncertainties in each of the individual sector chapters of this report, and this provides an overview of the inputs used – both EFs and activity data. In the vast majority of cases, EF uncertainties have been chosen after close consultation with the information provided in the IPCC 2006 guidance. Most of the approaches used in the inventory are Tier 1 methodologies, and hence uncertainties are generally larger than those for higher Tier methodologies. Estimating uncertainties associated with activity data is often more challenging. Little quantified information was provided with input data, and hence it has been necessary to draw on expert opinion. Whilst expert opinions can be difficult to justify or explain, they typically provide a very good representation of the data, because the expert possesses a detailed understanding of the data. Once an uncertainty value has been assigned to the activity data and EF (or in some cases parameters that are used in calculating the activity data or EF), then a “propagation of errors” methodology was used to estimate the emissions for each individual source, and ultimately the pollutant total. This follows best practise in the IPCC 2006 Guidance. The overall uncertainties are summarised in the table below: Table 0.40 GHG Emission Uncertainties (Absolute and Trend)
Year Uncertainty in the emission total
Uncertainty in the trend 2006-2012
CO2 (including LULUCF) 2.8% 0.9%
CO2 (including LULUCF) 10% 3.5%
CH4 55% 62%
N2O 111% 34%
HFC 317% 112%
These results reflect the fact that CO2 emissions from fuel combustion are typically well characterised, as the amount of fuel is measured with higher accuracy than most other activity data in the inventory, and the carbon content of the fuels are also well known. Emissions from LULUCF are very high in uncertainty, reflecting the challenges associated with accurately quantifying/representing changes to natural ecosystems. As a result, there is a significant increase in the CO2 emissions uncertainty when LULUCF is included. The largest CH4 source is the emission from landfill, and this is one of the more uncertain sources, representing the challenges associated with accurately quantifying the generation of CH4 from the breakdown of waste, which is dependent on many different factors. Emissions from agriculture also make a large contribution to the emissions total. These are also sources which are affected by a number of different parameters in complex relationships. Emissions of N2O are very much dominated by the agriculture sector. Emissions from manure management are relatively high, reflecting the complexity of the emissions mechanism. The

96
generation and release of N2O into the air is affected by weather and meteorological conditions, the details of the manure management system, as well the properties of the manure itself – all of which are challenging to determine or take into account in any detail. Emissions from soils are even higher in uncertainty than those of manure management. This is because, in addition to the uncertainties associated with the detail of the manure or other sources of N applied to the soils, the release mechanism of N2O from the soil is particularly dependent on factors such as the weather, soil moisture content, pH of the soil etc. The uncertainty analysis for HFCs is relatively simple, and results in high uncertainties. This is primarily because there is little information on the emissions of HFC. Hence a relatively simple methodology has been used for estimating the emissions, and associated uncertainties are high. In addition to this, the nature of the emissions are challenging to quantify anyway (resulting from leakage and other unintentional sources). So even when detailed input data are available, it can still be challenging to estimate HFC emissions with any accuracy. The uncertainty assessment that has been undertaken provides information to help direct improvement activities in the national emissions inventory improvements programme. However there are improvements that can be made to the uncertainty assessment itself. It has been necessary to rely on expert opinion for many of the inputs. Whilst this is relatively common, there is scope to obtain better information, and potentially quantified information, on the uncertainties associated with the emissions inventory input data. The detailed results of the uncertainty analysis (on a source specific basis) are shown in the next section in a table format.

Biennial Update Report of Jamaica
55. CO2 Uncertainty Analysis
Table 0.41 Uncertainties CO2 Emissions Estimates Fuel Emissions
2006
Emissions
2012
Activity
Data (AD)
Uncertain
ty
Emission
Factor
(EF)
Uncertain
ty
Combined
Uncertain
ty
Combined
Uncertain
ty as % of
Emissions
in 2012
Combined
Emissions
Uncertain
ty
Squared
Type A
Sensitivit
y
Type B
Sensitivit
y
Uncertain
ty in
Trend in
Total
Emissions
due to AD
Uncertain
ty in
Trend in
Total
Emissions
due to EF
Combined
Uncertain
ty in
Trend in
Total
Emissions
Combined
Trend
Uncertainty
Squared
CO2 Gg CO2eq Gg CO2eq % % % % % % % % %
1A1a Public electricity and heat production Fuel oil 2161 1982 1 7 7.07 2.43 5.92 0.07 0.21 0.29 0.49 0.58 0.33
1A1a Public electricity and heat production Diesel oil 729 700 1 7 7.07 0.86 0.74 0.03 0.07 0.10 0.19 0.22 0.05
1A1b Petroleum refining Fuel oil 114 143 1 2 2.24 0.06 0.00 0.01 0.02 0.02 0.02 0.03 0.00
1A1b Petroleum refining Diesel oil 0 0 1 2 2.24 0.00 0.00 0.00 0.00 0.00 0.00 0.00 0.00
1A2b Mining/Bauxite Fuel Oil 4600 1525 2 2 2.83 0.75 0.56 -0.13 0.16 0.45 -0.26 0.52 0.27
1A2e Sugar Fuel oil 12 2 2 2 2.83 0.00 0.00 0.00 0.00 0.00 0.00 0.00 0.00
1A2e Sugar Bagasse 0 0 5 5 7.07 0.00 0.00 0.00 0.00 0.00 0.00 0.00 0.00
1A2f Cement Fuel oil 7 12 2 2 2.83 0.01 0.00 0.00 0.00 0.00 0.00 0.00 0.00
1A2f Cement Coal 109 180 2 2 2.83 0.09 0.01 0.01 0.02 0.05 0.02 0.06 0.00
1A2gviii Industry Other, Stationary LPG 5 5 5 2 5.39 0.00 0.00 0.00 0.00 0.00 0.00 0.00 0.00
1A2gviii Industry Other, Stationary Fuel oil 91 20 5 2 5.39 0.02 0.00 0.00 0.00 0.01 -0.01 0.02 0.00
1A2gvii Industry, Mobile machinery Gasoline 27 20 5 2 5.39 0.02 0.00 0.00 0.00 0.02 0.00 0.02 0.00
1A2gvii Industry, Mobile machinery Diesel Oil 109 226 5 2 5.39 0.21 0.04 0.02 0.02 0.17 0.03 0.17 0.03
1A3aii(i) Domestic aviation LTO (civil) Turbo 4 2 5 1 5.10 0.00 0.00 0.00 0.00 0.00 0.00 0.00 0.00
1A3aii(i) Domestic aviation LTO (civil) Avgas 2 1 5 1 5.10 0.00 0.00 0.00 0.00 0.00 0.00 0.00 0.00
1A3aii(ii) Domestic aviation, cruise Turbo 0 0 5 1 5.10 0.00 0.00 0.00 0.00 0.00 0.00 0.00 0.00
1A3aii(ii) Domestic aviation, cruise Avgas 0 0 5 1 5.10 0.00 0.00 0.00 0.00 0.00 0.00 0.00 0.00
1A3b Road Transport Gasoline 1603 1276 1 2 2.24 0.50 0.25 0.03 0.13 0.19 0.06 0.20 0.04
1A3b Road Transport Diesel Oil 459 450 1 2 2.24 0.17 0.03 0.02 0.05 0.07 0.04 0.08 0.01
1A3c Railways Diesel oil 0 0 2 2 2.83 0.00 0.00 0.00 0.00 0.00 0.00 0.00 0.00
1A3d Domestic shipping/National Navigation Diesel Oil 24 5 1 1 1.41 0.00 0.00 0.00 0.00 0.00 0.00 0.00 0.00
1A3d Domestic shipping/National Navigation Fuel Oil 19 9 1 1 1.41 0.00 0.00 0.00 0.00 0.00 0.00 0.00 0.00
1A4aii Commercial/institutional: Mobile Gasoline 0 0 10 2 10.20 0.00 0.00 0.00 0.00 0.00 0.00 0.00 0.00
1A4aii Commercial/institutional: Mobile Diesel oil 14 15 10 2 10.20 0.03 0.00 0.00 0.00 0.02 0.00 0.02 0.00
1A4ai Commercial/institutional: Stationary Fuel Oil 41 0 5 2 5.39 0.00 0.00 0.00 0.00 0.00 -0.01 0.01 0.00
1A4ai Commercial/institutional: Stationary LPG 99 110 5 2 5.39 0.10 0.01 0.01 0.01 0.08 0.01 0.08 0.01
1A4ai Commercial/institutional: Stationary Kerosene 76 8 5 2 5.39 0.01 0.00 0.00 0.00 0.01 -0.01 0.01 0.00
1A4ai Commercial/institutional: Stationary Charcoal 0 0 20 5 20.62 0.00 0.00 0.00 0.00 0.00 0.00 0.00 0.00
1A4bi Residential: Stationary Kerosene 100 9 10 2 10.20 0.02 0.00 -0.01 0.00 0.01 -0.01 0.02 0.00
1A4bi Residential: Stationary LPG 132 130 10 2 10.20 0.23 0.05 0.01 0.01 0.19 0.01 0.19 0.04
1A4bi Residential: Stationary Wood 0 0 20 5 20.62 0.00 0.00 0.00 0.00 0.00 0.00 0.00 0.00
1A4cii Agriculture/Forestry/Fishing: Mobile Gasoline 28 27 10 2 10.20 0.05 0.00 0.00 0.00 0.04 0.00 0.04 0.00
1A4cii Agriculture/Forestry/Fishing: Mobile Diesel oil 49 52 10 2 10.20 0.09 0.01 0.00 0.01 0.08 0.00 0.08 0.01
1B2aiv Refinery flaring Flared gases and vapours 1 0 5 10 11.18 0.00 0.00 0.00 0.00 0.00 0.00 0.00 0.00
IPCC Source Category

98
2A1 Cement Clinker Production 314 339 2 5 5.39 0.32 0.10 0.02 0.04 0.10 0.08 0.13 0.02
2A2 Lime Lime Production 228 95 2 1 2.24 0.04 0.00 0.00 0.01 0.03 0.00 0.03 0.00
2D1 Non-Energy Products Lubricating Oil 2 2 500 1 500.00 0.15 0.02 0.00 0.00 0.13 0.00 0.13 0.02
2D1 Non-Energy Products Grease 0 0 500 1 500.00 0.00 0.00 0.00 0.00 0.00 0.00 0.00 0.00
3D Urea Fertiliser Application Urea Fertiliser Application 1 2 5 50 50.25 0.02 0.00 0.00 0.00 0.00 0.01 0.01 0.00
3D Lime Application Lime Application 0 0 10 50 50.99 0.00 0.00 0.00 0.00 0.00 0.00 0.00 0.00
4B1a Forest Land Remaining Forest Land LUCF -1834 -1777 10 30 31.62 -9.75 95.14 -0.07 -0.19 -2.64 -2.11 3.38 11.41
4B1b Land Converted to Forest Land LUCF -30 -33 20 30 36.06 -0.21 0.04 0.00 0.00 -0.10 -0.05 0.11 0.01
4B2a Cropland Remaining Cropland LUCF 0 0 10 30 31.62 0.00 0.00 0.00 0.00 0.00 0.00 0.00 0.00
4B2b Land Converted to Cropland LUCF 0 0 20 30 36.06 0.00 0.00 0.00 0.00 0.00 0.00 0.00 0.00
4B3a Grassland Remaining Grassland LUCF 0 0 10 30 31.62 0.00 0.00 0.00 0.00 0.00 0.00 0.00 0.00
4B3b Land converted to Grassland LUCF 116 116 20 30 36.06 0.72 0.52 0.00 0.01 0.34 0.14 0.37 0.14
4B4ai Wetlands Remaining Wetlands LUCF 0 0 10 30 31.62 0.00 0.00 0.00 0.00 0.00 0.00 0.00 0.00
4B4bi,ii Land converted to Wetlands LUCF 0 0 20 30 36.06 0.00 0.00 0.00 0.00 0.00 0.00 0.00 0.00
4B5a Settlement Remaining settlement LUCF 0 0 10 30 31.62 0.00 0.00 0.00 0.00 0.00 0.00 0.00 0.00
4B5b Land converted to Settlement LUCF 6 6 20 30 36.06 0.04 0.00 0.00 0.00 0.02 0.01 0.02 0.00
4B6a Other land Remaining other land LUCF 0 6 10 30 31.62 0.03 0.00 0.00 0.00 0.01 0.02 0.02 0.00
4B6b Land converted to Other Land LUCF 56 56 20 30 36.06 0.35 0.12 0.00 0.01 0.17 0.07 0.18 0.03
5A Solid waste disposal on land Waste 0 0 77 65 100.62 0.00 0.00 0.00 0.00 0.00 0.00 0.00 0.00
5B Biological treatment of waste (composting and AD)Waste 0 0 0 0 0.00 0.00 0.00 0.00 0.00 0.00 0.00 0.00 0.00
5C1 Waste incineration Waste 6 5 70 40 80.62 0.07 0.01 0.00 0.00 0.05 0.01 0.05 0.00
5C2 Open burning of waste (backyards) Waste 34 28 20 40 44.72 0.22 0.05 0.00 0.00 0.08 0.03 0.09 0.01
5C2 Open burning of waste (landfills) Waste 5 5 20 40 44.72 0.04 0.00 0.00 0.00 0.01 0.01 0.02 0.00
5D1 Domestic wastewater handling Waste 0 0 0 0 0.00 0.00 0.00 0.00 0.00 0.00 0.00 0.00 0.00
5D2 Industrial wastewater handling Waste 0 0 0 0 0.00 0.00 0.00 0.00 0.00 0.00 0.00 0.00 0.00
103.63 12.42
TOTAL CO2 emissions (incl LULUCF) 9520 5761 % Uncertainty (abs) 10.18 % Trend Uncertainty 3.52
TOTAL CO2 emissions (excl LULUCF) 11205 7387 % Uncertainty (abs) 2.79 % Trend Uncertainty 0.91

Biennial Update Report of Jamaica
56. CH4 Uncertainty Analysis
Table 0.42 Uncertainties in CH4 Emissions Estimates GWP 21
Fuel Emissions
2006
Emissions
2012
Activity
Data (AD)
Uncertain
ty
Emission
Factor
(EF)
Uncertain
ty
Combined
Uncertain
ty
Combined
Uncertain
ty as % of
Emissions
in 2012
Combined
Emissions
Uncertain
ty
Squared
Type A
Sensitivit
y
Type B
Sensitivit
y
Uncertain
ty in
Trend in
Total
Emissions
Uncertain
ty in
Trend in
Total
Emissions
Combined
Uncertain
ty in
Trend in
Total
Combined
Trend
Uncertainty
Squared
CH4 Gg CO2eq Gg CO2eq % % % % % % % % %
1A1a Public electricity and heat production Fuel oil 2 2 1 100 100.00 0.19 0.04 0.00 0.00 0.00 -0.03 0.03 0.00
1A1a Public electricity and heat production Diesel oil 1 1 1 100 100.00 0.07 0.00 0.00 0.00 0.00 -0.01 0.01 0.00
1A1b Petroleum refining Fuel oil 0 0 1 100 100.00 0.01 0.00 0.00 0.00 0.00 0.00 0.00 0.00
1A1b Petroleum refining Diesel oil 0 0 1 100 100.00 0.00 0.00 0.00 0.00 0.00 0.00 0.00 0.00
1A2b Mining/Bauxite Fuel Oil 4 1 2 100 100.02 0.15 0.02 0.00 0.00 0.00 -0.32 0.32 0.11
1A2e Sugar Fuel oil 0 0 2 100 100.02 0.00 0.00 0.00 0.00 0.00 0.00 0.00 0.00
1A2e Sugar Bagasse 2 2 5 100 100.12 0.25 0.06 0.00 0.00 0.02 -0.03 0.03 0.00
1A2f Cement Fuel oil 0 0 2 100 100.02 0.00 0.00 0.00 0.00 0.00 0.00 0.00 0.00
1A2f Cement Coal 0 0 2 100 100.02 0.05 0.00 0.00 0.00 0.00 0.02 0.02 0.00
1A2gviii Industry Other, Stationary LPG 0 0 5 100 100.12 0.00 0.00 0.00 0.00 0.00 0.00 0.00 0.00
1A2gviii Industry Other, Stationary Fuel oil 0 0 5 100 100.12 0.00 0.00 0.00 0.00 0.00 -0.01 0.01 0.00
1A2gvii Industry, Mobile machinery Gasoline 0 0 5 100 100.12 0.02 0.00 0.00 0.00 0.00 -0.01 0.01 0.00
1A2gvii Industry, Mobile machinery Diesel Oil 0 0 5 100 100.12 0.03 0.00 0.00 0.00 0.00 0.02 0.02 0.00
1A3aii(i) Domestic aviation LTO (civil) Turbo 0 0 5 100 100.12 0.00 0.00 0.00 0.00 0.00 0.00 0.00 0.00
1A3aii(i) Domestic aviation LTO (civil) Avgas 0 0 5 100 100.12 0.00 0.00 0.00 0.00 0.00 0.00 0.00 0.00
1A3aii(ii) Domestic aviation, cruise Turbo 0 0 5 100 100.12 0.00 0.00 0.00 0.00 0.00 0.00 0.00 0.00
1A3aii(ii) Domestic aviation, cruise Avgas 0 0 5 100 100.12 0.00 0.00 0.00 0.00 0.00 0.00 0.00 0.00
1A3b Road Transport Gasoline 12 10 1 49 49.01 0.56 0.31 0.00 0.01 0.02 -0.18 0.18 0.03
1A3b Road Transport Diesel Oil 1 0 1 49 49.01 0.03 0.00 0.00 0.00 0.00 0.00 0.00 0.00
1A3c Railways Diesel oil 0 0 2 100 100.02 0.00 0.00 0.00 0.00 0.00 0.00 0.00 0.00
1A3d Domestic shipping/National Navigation Diesel Oil 0 0 1 100 100.00 0.00 0.00 0.00 0.00 0.00 0.00 0.00 0.00
1A3d Domestic shipping/National Navigation Fuel Oil 0 0 1 100 100.00 0.00 0.00 0.00 0.00 0.00 0.00 0.00 0.00
1A4aii Commercial/institutional: Mobile Gasoline 0 0 10 100 100.50 0.00 0.00 0.00 0.00 0.00 0.00 0.00 0.00
1A4aii Commercial/institutional: Mobile Diesel oil 0 0 10 100 100.50 0.00 0.00 0.00 0.00 0.00 0.00 0.00 0.00
1A4ai Commercial/institutional: Stationary Fuel Oil 0 0 5 100 100.12 0.00 0.00 0.00 0.00 0.00 -0.01 0.01 0.00
1A4ai Commercial/institutional: Stationary LPG 0 0 5 100 100.12 0.02 0.00 0.00 0.00 0.00 0.00 0.00 0.00
1A4ai Commercial/institutional: Stationary Kerosene 0 0 5 100 100.12 0.00 0.00 0.00 0.00 0.00 -0.03 0.03 0.00
1A4ai Commercial/institutional: Stationary Charcoal 3 3 20 100 101.98 0.41 0.17 0.00 0.00 0.12 0.00 0.12 0.01
1A4bi Residential: Stationary Kerosene 0 0 10 100 100.50 0.00 0.00 0.00 0.00 0.00 -0.03 0.03 0.00
1A4bi Residential: Stationary LPG 0 0 10 100 100.50 0.03 0.00 0.00 0.00 0.00 0.00 0.00 0.00
1A4bi Residential: Stationary Wood 8 9 20 100 101.98 1.03 1.06 0.00 0.01 0.30 -0.02 0.30 0.09
1A4cii Agriculture/Forestry/Fishing: Mobile Gasoline 0 0 10 39 40.26 0.00 0.00 0.00 0.00 0.00 0.00 0.00 0.00
1A4cii Agriculture/Forestry/Fishing: Mobile Diesel oil 0 0 10 39 40.26 0.01 0.00 0.00 0.00 0.00 0.00 0.00 0.00
1B2aiv Refinery flaring Flared gases and vapours 0 0 5 100 100.12 0.00 0.00 0.00 0.00 0.00 0.00 0.00 0.00
CRF

100
3A Dairy Cattle Dairy Cattle 22 24 10 40 41.23 1.18 1.40 0.00 0.03 0.42 0.08 0.43 0.18
3A Other Cattle Other Cattle 88 98 10 40 41.23 4.75 22.53 0.01 0.12 1.70 0.31 1.72 2.97
3A Buffalo Buffalo 0 0 10 40 41.23 0.00 0.00 0.00 0.00 0.00 0.00 0.00 0.00
3A Sheep Sheep 1 2 10 40 41.23 0.09 0.01 0.00 0.00 0.03 0.05 0.06 0.00
3A Goats Goats 49 35 10 40 41.23 1.72 2.94 -0.02 0.04 0.61 -0.76 0.97 0.95
3A Horses Horses 7 8 10 40 41.23 0.39 0.15 0.00 0.01 0.14 0.01 0.14 0.02
3A Mules/Asses Mules/Asses 2 2 10 40 41.23 0.09 0.01 0.00 0.00 0.03 0.00 0.03 0.00
3A Market Swine Market Swine 4 3 10 40 41.23 0.13 0.02 0.00 0.00 0.05 -0.06 0.08 0.01
3A Breeding Swine Breeding Swine 0 0 10 40 41.23 0.01 0.00 0.00 0.00 0.01 -0.01 0.01 0.00
3B Dairy Cattle Dairy Cattle 16 18 10 30 31.62 0.67 0.45 0.00 0.02 0.31 0.04 0.32 0.10
3B Other Cattle Other Cattle 2 3 10 30 31.62 0.10 0.01 0.00 0.00 0.05 0.01 0.05 0.00
3B Buffalo Buffalo 0 0 10 30 31.62 0.00 0.00 0.00 0.00 0.00 0.00 0.00 0.00
3B Sheep Sheep 0 0 10 30 31.62 0.00 0.00 0.00 0.00 0.00 0.00 0.00 0.00
3B Goats Goats 2 2 10 30 31.62 0.06 0.00 0.00 0.00 0.03 -0.03 0.04 0.00
3B Horses Horses 1 1 10 30 31.62 0.04 0.00 0.00 0.00 0.02 0.00 0.02 0.00
3B Mules/Asses Mules/Asses 0 0 10 30 31.62 0.01 0.00 0.00 0.00 0.00 0.00 0.00 0.00
3B Market Swine Market Swine 46 32 10 30 31.62 1.20 1.44 -0.02 0.04 0.56 -0.56 0.79 0.62
3B Breeding Swine Breeding Swine 9 6 10 30 31.62 0.24 0.06 0.00 0.01 0.11 -0.11 0.16 0.02
3B Poultry- Chickens (Layers) Poultry- Chickens (Layers) 2 3 10 30 31.62 0.10 0.01 0.00 0.00 0.05 0.01 0.05 0.00
3B Poultry- Chickens (Broilers) Poultry- Chickens (Broilers) 12 27 10 30 31.62 1.00 0.99 0.02 0.03 0.46 0.51 0.69 0.48
3B Poultry- Turkeys Poultry- Turkeys 0 0 10 30 31.62 0.00 0.00 0.00 0.00 0.00 0.00 0.00 0.00
3B Poultry- Ducks&Geese Poultry- Ducks&Geese 0 0 10 30 31.62 0.01 0.00 0.00 0.00 0.00 0.00 0.01 0.00
3B Rabbit Rabbit 0 0 10 30 31.62 0.00 0.00 0.00 0.00 0.00 0.00 0.00 0.00
3C Rice TOTAL 0 0 5 76 76.50 0.03 0.00 0.00 0.00 0.00 0.03 0.03 0.00
3F Field Burning TOTAL 5 5 5 112 112.36 0.66 0.43 0.00 0.01 0.04 -0.08 0.09 0.01
5A Solid waste disposal on land Waste 400 463 77 65 100.62 54.69 2990.60 0.06 0.57 61.47 3.68 61.58 3792.58
5B Biological treatment of waste (composting and AD)Waste 0.00 0.00 14 900 900.11 0.00 0.00 0.00 0.00 0.00 0.00 0.00 0.00
5C1 Waste incineration Waste 0 0 70 100 122.07 0.00 0.00 0.00 0.00 0.00 0.00 0.00 0.00
5C2 Open burning of waste (backyards) Waste 13 11 20 100 101.98 1.33 1.76 0.00 0.01 0.38 -0.29 0.48 0.23
5C2 Open burning of waste (landfills) Waste 2 2 20 100 101.98 0.23 0.05 0.00 0.00 0.07 0.00 0.07 0.00
5D1 Domestic wastewater handling Waste 40 32 49 50 70.36 2.63 6.90 -0.01 0.04 2.72 -0.57 2.78 7.73
5D2 Industrial wastewater handling Waste 59 44 36 50 61.85 3.22 10.38 -0.02 0.05 2.79 -1.03 2.98 8.86
3041.84 3815.03Total CH4 emissions 818 852 % Uncertainty (abs) 55.15 % Trend Uncertainty 61.77

Biennial Update Report of Jamaica
57. N2O Uncertainty Analysis
Table 0.43 Uncertainties in N2O Emissions Estimates GWP 310
Fuel Emissions
2006
Emissions
2012
Activity
Data (AD)
Uncertain
ty
Emission
Factor
(EF)
Uncertain
ty
Combined
Uncertain
ty
Combined
Uncertain
ty as % of
Emissions
in 2012
Combined
Emissions
Uncertain
ty
Squared
Type A
Sensitivit
y
Type B
Sensitivit
y
Uncertain
ty in
Trend in
Total
Emissions
due to AD
Uncertain
ty in
Trend in
Total
Emissions
due to EF
Combined
Uncertain
ty in
Trend in
Total
Emissions
Combined
Trend
Uncertainty
Squared
Gg CO2eq Gg CO2eq % % % % % % % % %
1A1a Public electricity and heat production Fuel oil 5 5 1 150 150.00 0.11 0.01 0.00 0.00 0.00 -0.16 0.16 0.03
1A1a Public electricity and heat production Diesel oil 2 2 1 150 150.00 0.04 0.00 0.00 0.00 0.00 -0.05 0.05 0.00
1A1b Petroleum refining Fuel oil 0 0 1 150 150.00 0.01 0.00 0.00 0.00 0.00 0.00 0.00 0.00
1A1b Petroleum refining Diesel oil 0 0 1 150 150.00 0.00 0.00 0.00 0.00 0.00 0.00 0.00 0.00
1A2b Mining/Bauxite Fuel Oil 11 4 2 150 150.01 0.08 0.01 0.00 0.00 0.00 -0.59 0.59 0.35
1A2e Sugar Fuel oil 0 0 2 150 150.01 0.00 0.00 0.00 0.00 0.00 0.00 0.00 0.00
1A2e Sugar Bagasse 4 4 5 150 150.08 0.10 0.01 0.00 0.00 0.01 -0.13 0.13 0.02
1A2f Cement Fuel oil 0 0 2 150 150.01 0.00 0.00 0.00 0.00 0.00 0.00 0.00 0.00
1A2f Cement Coal 1 1 2 150 150.01 0.02 0.00 0.00 0.00 0.00 0.00 0.00 0.00
1A2gviii Industry Other, Stationary LPG 0 0 5 150 150.08 0.00 0.00 0.00 0.00 0.00 0.00 0.00 0.00
1A2gviii Industry Other, Stationary Fuel oil 0 0 5 150 150.08 0.00 0.00 0.00 0.00 0.00 -0.01 0.01 0.00
1A2gvii Industry, Mobile machinery Gasoline 1 1 5 150 150.08 0.02 0.00 0.00 0.00 0.00 -0.04 0.04 0.00
1A2gvii Industry, Mobile machinery Diesel Oil 2 4 5 150 150.08 0.08 0.01 0.00 0.00 0.01 0.03 0.03 0.00
1A3aii(i) Domestic aviation LTO (civil) Turbo 0 0 5 150 150.08 0.00 0.00 0.00 0.00 0.00 0.00 0.00 0.00
1A3aii(i) Domestic aviation LTO (civil) Avgas 0 0 5 150 150.08 0.00 0.00 0.00 0.00 0.00 0.00 0.00 0.00
1A3aii(ii) Domestic aviation, cruise Turbo 0 0 5 150 150.08 0.00 0.00 0.00 0.00 0.00 0.00 0.00 0.00
1A3aii(ii) Domestic aviation, cruise Avgas 0 0 5 150 150.08 0.00 0.00 0.00 0.00 0.00 0.00 0.00 0.00
1A3b Road Transport Gasoline 57 46 1 39 39.01 0.27 0.07 -0.01 0.01 0.02 -0.52 0.52 0.28
1A3b Road Transport Diesel Oil 7 7 1 39 39.01 0.04 0.00 0.00 0.00 0.00 -0.05 0.05 0.00
1A3c Railways Diesel oil 0 0 2 150 150.01 0.00 0.00 0.00 0.00 0.00 0.00 0.00 0.00
1A3d Domestic shipping/National Navigation Diesel Oil 0 0 1 150 150.00 0.00 0.00 0.00 0.00 0.00 -0.01 0.01 0.00
1A3d Domestic shipping/National Navigation Fuel Oil 0 0 1 150 150.00 0.00 0.00 0.00 0.00 0.00 -0.01 0.01 0.00
1A4aii Commercial/institutional: Mobile Gasoline 0 0 10 150 150.33 0.00 0.00 0.00 0.00 0.00 0.00 0.00 0.00
1A4aii Commercial/institutional: Mobile Diesel oil 0 0 10 150 150.33 0.00 0.00 0.00 0.00 0.00 0.00 0.00 0.00
1A4ai Commercial/institutional: Stationary Fuel Oil 0 0 5 150 150.08 0.00 0.00 0.00 0.00 0.00 -0.01 0.01 0.00
1A4ai Commercial/institutional: Stationary LPG 0 0 5 150 150.08 0.00 0.00 0.00 0.00 0.00 0.00 0.00 0.00
1A4ai Commercial/institutional: Stationary Kerosene 0 0 5 150 150.08 0.00 0.00 0.00 0.00 0.00 -0.01 0.01 0.00
1A4ai Commercial/institutional: Stationary Charcoal 0 0 20 150 151.33 0.01 0.00 0.00 0.00 0.00 -0.01 0.01 0.00
1A4bi Residential: Stationary Kerosene 0 0 10 150 150.33 0.00 0.00 0.00 0.00 0.00 -0.02 0.02 0.00
1A4bi Residential: Stationary LPG 0 0 10 150 150.33 0.00 0.00 0.00 0.00 0.00 0.00 0.00 0.00
1A4bi Residential: Stationary Wood 2 2 20 150 151.33 0.04 0.00 0.00 0.00 0.01 -0.04 0.05 0.00
1A4cii Agriculture/Forestry/Fishing: Mobile Gasoline 0 0 10 49 50.01 0.00 0.00 0.00 0.00 0.00 0.00 0.00 0.00
1A4cii Agriculture/Forestry/Fishing: Mobile Diesel oil 0 0 10 49 50.01 0.00 0.00 0.00 0.00 0.00 0.00 0.00 0.00
1B2aiv Refinery flaring Flared gases and vapours 0 0 5 150 150.08 0.00 0.00 0.00 0.00 0.00 0.00 0.00 0.00
CRF

102
3B Dairy Cattle Dairy Cattle 4 5 10 100 100.50 0.07 0.01 0.00 0.00 0.02 -0.07 0.07 0.00
3B Other Cattle Other Cattle 18 20 10 100 100.50 0.31 0.10 0.00 0.01 0.07 -0.28 0.29 0.08
3B Buffalo Buffalo 0 0 10 100 100.50 0.00 0.00 0.00 0.00 0.00 0.00 0.00 0.00
3B Market Swine Market Swine 127 90 10 100 100.50 1.37 1.89 -0.03 0.02 0.33 -3.27 3.28 10.78
3B Breeding Swine Breeding Swine 7 5 10 100 100.50 0.08 0.01 0.00 0.00 0.02 -0.19 0.19 0.04
3B Poultry- Chickens (Layers) Poultry- Chickens (Layers) 35 39 10 100 100.50 0.60 0.36 -0.01 0.01 0.14 -0.54 0.56 0.31
3B Poultry- Chickens (Broilers) Poultry- Chickens (Broilers)820 1794 10 100 100.50 27.34 747.67 0.10 0.46 6.56 10.22 12.14 147.39
3B Poultry- Turkeys Poultry- Turkeys 0 1 10 100 100.50 0.02 0.00 0.00 0.00 0.00 0.01 0.01 0.00
3B Poultry- Ducks&Geese Poultry- Ducks&Geese 2 3 10 100 100.50 0.05 0.00 0.00 0.00 0.01 0.02 0.02 0.00
3B Sheep Sheep 2 4 10 100 100.50 0.06 0.00 0.00 0.00 0.02 0.04 0.04 0.00
3B Goats Goats 114 82 10 100 100.50 1.26 1.58 -0.03 0.02 0.30 -2.88 2.90 8.39
3B Horses Horses 5 5 10 100 100.50 0.08 0.01 0.00 0.00 0.02 -0.08 0.08 0.01
3B Mules/Asses Mules/Asses 2 2 10 100 100.50 0.03 0.00 0.00 0.00 0.01 -0.04 0.04 0.00
3B Rabbit Rabbit 92 65 10 100 100.50 1.00 0.99 -0.02 0.02 0.24 -2.37 2.38 5.66
3D Synthetic N fertilizer Synthetic N fertilizer 28 56 5 300 300.04 2.55 6.48 0.00 0.01 0.10 0.67 0.67 0.45
3D Organic N fertilizer Organic N fertilizer 855 1646 5 300 300.04 74.91 5611.33 0.05 0.43 3.01 14.67 14.97 224.22
3D Grazing animals Grazing animals 342 295 5 300 300.04 13.41 179.88 -0.07 0.08 0.54 -22.32 22.33 498.47
3D Crop residues Crop residues 6 8 5 300 300.04 0.35 0.12 0.00 0.00 0.01 -0.26 0.26 0.07
3D N mineralised from mineral soils as a result of loss of soil carbonN mineralised from mineral soils as a result of loss of soil carbon0 0 5 300 300.04 0.00 0.00 0.00 0.00 0.00 0.00 0.00 0.00
3D Drained/managed organic soils Drained/managed organic soils67 67 5 300 300.04 3.05 9.30 -0.01 0.02 0.12 -3.66 3.66 13.38
3E Soils- Atm. Deposition Soils- Atm. Deposition 3 6 5 330 330.04 0.31 0.10 0.00 0.00 0.01 0.08 0.08 0.01
3E Soils- Leaching/runoff Soils- Leaching/runoff 319 569 5 330 330.04 28.47 810.29 0.01 0.15 1.04 2.10 2.34 5.48
3E Manure - Atm. Deposition Manure - Atm. Deposition 696 1353 5 330 330.04 67.73 4587.11 0.04 0.35 2.47 14.22 14.44 208.44
3E Manure - Leaching/runoff Manure - Leaching/runoff 182 354 5 330 330.04 17.70 313.26 0.01 0.09 0.65 3.77 3.82 14.63
3F Field burning Field burning 2 2 5 65 65.19 0.02 0.00 0.00 0.00 0.00 -0.03 0.03 0.00
5A Solid waste disposal on land Waste 0 0 0 0 0.00 0.00 0.00 0.00 0.00 0.00 0.00 0.00 0.00
5B Biological treatment of waste (composting and AD)Waste 0 0 0 0 0.00 0.00 0.00 0.00 0.00 0.00 0.00 0.00 0.00
5C1 Waste incineration Waste 0 0 70 100 122.07 0.00 0.00 0.00 0.00 0.00 0.00 0.00 0.00
5C2 Open burning of waste (backyards) Waste 4 4 20 100 101.98 0.06 0.00 0.00 0.00 0.03 -0.10 0.10 0.01
5C2 Open burning of waste (landfills) Waste 1 1 20 100 101.98 0.01 0.00 0.00 0.00 0.00 -0.01 0.01 0.00
5D1 Domestic wastewater handling Waste 41 41 43.14 50 66.04 0.41 0.17 -0.01 0.01 0.64 -0.36 0.74 0.55
5D2 Industrial wastewater handling Waste 0 0 36.40 50 61.85 0.00 0.00 0.00 0.00 0.00 0.00 0.00 0.00
12270.77 1139.04TOTAL N2O emissions 3870 6594 % Uncertainty (abs) 110.77 % Trend Uncertainty 33.75

Biennial Update Report of Jamaica
58. HFC Uncertainty Analysis
Table 0.44 Uncertainties in HFC Emissions Estimates Gas Emissions
2006
Emissions
2012
Activity
Data (AD)
Uncertain
ty
Emission
Factor
(EF)
Uncertain
ty
Combined
Uncertain
ty
Combined
Uncertain
ty as % of
Emissions
in 2012
Combined
Emissions
Uncertain
ty
Squared
Type A
Sensitivit
y
Type B
Sensitivit
y
Uncertain
ty in
Trend in
Total
Emissions
due to AD
Uncertain
ty in
Trend in
Total
Emissions
due to EF
Combined
Uncertain
ty in
Trend in
Total
Emissions
Combined
Trend
Uncertainty
Squared
HFCs Gg CO2eq Gg CO2eq % % % % % % % % %
2F HFC_consumption HFC-32 4 11 100 500 509.90 60.47 3656.04 0.07 0.14 19.47 37.20 41.99 1763.27
2F HFC_consumption HFC-125 12 11 100 500 509.90 63.82 4072.61 -0.04 0.15 20.55 -18.55 27.68 766.42
2F HFC_consumption HFC-134a 44 52 100 500 509.90 290.94 84646.27 0.01 0.66 93.70 5.79 93.88 8813.30
2F HFC_consumption HFC-143a 16 16 100 500 509.90 90.55 8199.87 -0.03 0.21 29.16 -14.68 32.65 1065.89
2F HFC_consumption HFC-152a 0 0 100 500 509.90 0.00 0.00 0.00 0.00 0.00 0.00 0.00 0.00
2F HFC_consumption HFC-227ea 2 1 100 500 509.90 3.53 12.46 -0.02 0.01 1.14 -8.35 8.43 71.08
2F HFC_consumption HFC-236fa 0 0 100 500 509.90 0.59 0.35 0.00 0.00 0.19 -1.41 1.42 2.01
100587.61 12481.972F HFC_consumption HFC 79 92 % Uncertainty (abs) 317.16 % Trend Uncertainty 111.72
CODE
The results of the uncertainty analysis can be used to prioritise improvements that will have the greatest impact. This is considered in the section below which presents a Key Category Analysis on the inventory.
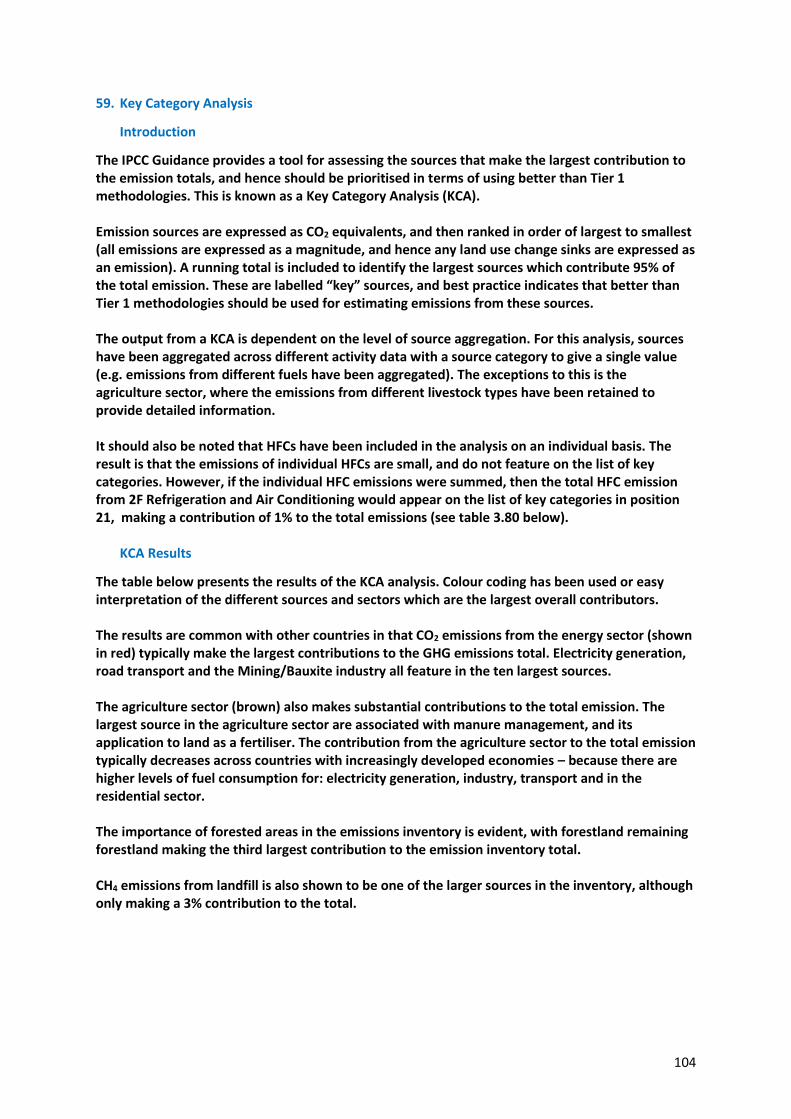
104
59. Key Category Analysis
Introduction
The IPCC Guidance provides a tool for assessing the sources that make the largest contribution to the emission totals, and hence should be prioritised in terms of using better than Tier 1 methodologies. This is known as a Key Category Analysis (KCA). Emission sources are expressed as CO2 equivalents, and then ranked in order of largest to smallest (all emissions are expressed as a magnitude, and hence any land use change sinks are expressed as an emission). A running total is included to identify the largest sources which contribute 95% of the total emission. These are labelled “key” sources, and best practice indicates that better than Tier 1 methodologies should be used for estimating emissions from these sources. The output from a KCA is dependent on the level of source aggregation. For this analysis, sources have been aggregated across different activity data with a source category to give a single value (e.g. emissions from different fuels have been aggregated). The exceptions to this is the agriculture sector, where the emissions from different livestock types have been retained to provide detailed information. It should also be noted that HFCs have been included in the analysis on an individual basis. The result is that the emissions of individual HFCs are small, and do not feature on the list of key categories. However, if the individual HFC emissions were summed, then the total HFC emission from 2F Refrigeration and Air Conditioning would appear on the list of key categories in position 21, making a contribution of 1% to the total emissions (see table 3.80 below).
KCA Results
The table below presents the results of the KCA analysis. Colour coding has been used or easy interpretation of the different sources and sectors which are the largest overall contributors. The results are common with other countries in that CO2 emissions from the energy sector (shown in red) typically make the largest contributions to the GHG emissions total. Electricity generation, road transport and the Mining/Bauxite industry all feature in the ten largest sources. The agriculture sector (brown) also makes substantial contributions to the total emission. The largest source in the agriculture sector are associated with manure management, and its application to land as a fertiliser. The contribution from the agriculture sector to the total emission typically decreases across countries with increasingly developed economies – because there are higher levels of fuel consumption for: electricity generation, industry, transport and in the residential sector. The importance of forested areas in the emissions inventory is evident, with forestland remaining forestland making the third largest contribution to the emission inventory total. CH4 emissions from landfill is also shown to be one of the larger sources in the inventory, although only making a 3% contribution to the total.

Biennial Update Report of Jamaica
Table 0.45 Key Category Analysis Rank CRF Source Pollutant Emission
(Gg CO2 EQ)
Emission (%)
Running Total%
1 1A1a Public electricity & heat prodn
CO2 2,682 16% 15.9%
2 4B Manure Mgt - Chickens (Broilers)
N2O 1,794 11% 26.5%
3 5A Forest Land Remaining FL CO2 1,777 11% 37.0%
4 1A3b Road Transport CO2 1,726 10% 47.2%
5 4D Organic N fertilizer N2O 1,646 10% 56.9%
6 1A2b Mining/Bauxite CO2 1,525 9% 65.9%
7 4G Manure - Atm. Deposition N2O 1,353 8% 73.9%
8 4G Soils- Leaching/runoff N2O 569 3% 77.3%
9 6A Solid waste disposal on land
CH4 463 3% 80.0%
10 4G Manure - Leaching/runoff N2O 354 2% 82.1%
11 2A1 Cement CO2 339 2% 84.1%
12 4D Grazing animals N2O 295 2% 85.8%
13 1A2gvii Industry, Mobile machinery CO2 247 1% 87.3%
14 1A2f Cement CO2 192 1% 88.4%
15 1A1b Petroleum refining CO2 143 1% 89.3%
16 1A4bi Residential: Stationary CO2 139 1% 90.1%
17 1A4ai Commercial/Institnl: Stationary
CO2 119 1% 90.8%
18 5B Land converted to Grassland
CO2 116 1% 91.5%
19 4A Enteric - Other Cattle CH4 98 1% 92.1%
20 2A2 Lime CO2 95 1% 92.6%
21 4B Manure Mgt - Market Swine
N2O 90 1% 93.2%
22 4B Manure Mgt - Goats N2O 82 0.5% 93.6%
23 1A4cii Agricul/Forest/Fishing: Mobile
CO2 79 0.5% 94.1%
24 4D Drained/managed organic soils
N2O 67 0.4% 94.5%
25 4B Manure Mgt - Rabbit N2O 65 0.4% 94.9%
26 5E Land converted to Other Land
CO2 56 0.3% 95.2%
Legend 1 Energy 2 IPPU 3 Agricul. 4 LULUCF 5 Waste
60. Prioritisation of Improvement Activities
Potential improvements to the emissions inventory have been identified and included in this report on a sector by sector basis. The results from the key category analysis above can be used to help with the prioritisation of improvement activities. The IPCC Good Practice Guidance (2006) indicates that it is best practice for all key sources to use methodologies that are higher than Tier 1. There are some improvements that could be made to the methodologies used for emissions from both the agriculture and energy sectors which would help to elevate the methodologies to Tier 2 or better. In general, the focus of this improvement would require the collation and use of country specific data more completely throughout the emission calculations.

106
This would be a particularly effective and efficient approach for improving the quality (and in particular the accuracy) of the emissions inventory. The results from the uncertainty analysis also help to steer the prioritisation of inventory improvements. The ten largest sources (which account for more than 80% of the emissions) are considered below (detailed observations regarding improvements are also included in this report on a sector by sector basis in Sections 3.13 to 3.17). 1A1a Public Electricity & Heat Production (CO2), 1A2b Mining/Bauxite (CO2) The current methodology uses activity data from the national energy balance tables and default EFs from the 2006 IPCC Guidance. This is generally an accurate way of determining emissions of CO2, but the use of country specific data at the individual plant level would allow both the activity data and EFs to be characterised in more detail. Furthermore, it is highly likely that these data exist, making this improvement an issue of data collection rather than data availability. It would also help with the transparency of the emissions calculations for large point sources if improvements were made to the transparency of the activity data used. 4B Manure Management from Broiler Chickens (N2O), and 4D Organic N Fertiliser (N2O) Uncertainties in EFs for the agriculture sector are typically higher than combustion sources, and for these sources result in an overall uncertainty of more than 100% and 300% for Broiler Chickens (N2O) and Organic N Fertiliser (N2O) respectively. The methodology used for estimating emissions from the agriculture sector (both manure management and from soils) is very detailed, and is based on a full assessment of the N flows through the whole sector. It is thought that the activity data represents the best quality that is currently available. So whilst improvements could be made to some of the assumptions that underpin these emission estimates, it is likely that this would require new data collection, making any significant improvements challenging. Nevertheless, there are key datasets which should be prioritised in terms of improving the quality. In particular a high quality dataset of livestock numbers across the time series was not readily available. These data were assembled from several different sources, and required extensive interpolation/extrapolation to obtain a reliable time series. Given the importance of these data, it is recommended that improvements are made to the quality and availability of livestock numbers data. 5A Forest Land Remaining Forest Land (CO2) Uncertainties in emissions from land use and land use change are typically higher than other categories, because the input data is challenging to obtain at high quality levels, and the current uncertainty of 32% may represent an underestimate of the uncertainty. Significant improvements could be made to the emission estimates in the Jamaican inventory by investing resources in improved data collection, and in particular more frequent assessment of land cover types and changes. This is likely to be resource intensive, but would be valuable in also helping to support the general management of forested areas, and not just for use in the emissions inventory.

Biennial Update Report of Jamaica
1A3b Road Transport (CO2) The activity data for road transport is taken from the energy balance tables. Local experts consider this to be of a good level of accuracy, and the overall uncertainty in CO2 emissions is estimated to be approximately2%. However, it has not been possible to obtain bottom-up sales data. This means that a single dataset is used in both the reference approach and the sectoral approach. The use of two independent datasets for the reference and sectoral approaches allows an important quality check on the activity data, and sourcing data that allows this check should be a high priority. 4G Indirect Emissions (N2O) Atmospheric deposition (and re-emission) and leaching/runoff from soils and manure management are all indirect emissions of N2O. Indirect emissions of N2O from the agriculture sector are particularly challenging to estimate with any accuracy, and this is reflected in the uncertainty assessment which calculates the uncertainties associated with the emissions from indirect sources as 330%. The methodologies currently used in the inventory are detailed, using a full assessment of the N flows in the agriculture sector. It is therefore unlikely that improvements could be easily made to the underlying methodology. The high uncertainty is driven by uncertainties in the EFs, and obtaining country specific data would involve a detailed study of e.g. agricultural soils, runoff potential, fertiliser application rates to fields, topography etc. This would be a large undertaking and is expected to be beyond current resources. 6A Solid Waste Disposal on Land (CH4) The uncertainty assessment in the waste sector has been undertaken in detail, considering the uncertainty associated with each of the underlying parameters. The uncertainty analysis indicates that the uncertainty in the emission is over 100%, and that this is significantly influenced by the uncertainty in both activity data and the EF. The relatively high EFs for CH4 from landfills reflects the uncertainties in characterising an emission source that is influenced by many different variables. It is therefore challenging to make significant improvements to the EF uncertainty by sourcing additional data, although this could be done by using more detailed country specific data in the modelling of CH4 generation and emissions from Jamaican landfills. It is more straightforward to target improvement efforts at obtaining better quality activity data i.e. the amount and composition of waste going to landfill. Whilst it is thought that the data used in the emissions inventory is the best quality that is currently available, it may be that improvements are made in the coming years as part of a general improvement in solid waste management in Jamaica.

108
61. Mitigation Actions
62. Overview
Locally implemented Mitigation Projects
Project Description Implementation Agency Launch date
Status Funding Organization
Project Budget US$
Net Billing Allow JPS customers who own renewable energy generators to generate electricity for personal use and also permits them to sell excess energy to JPS at wholesale or “avoided cost” prices set by the OUR
Office of Utilities Regulation 2012 On-going N/A N/A
Wind Power for Domestic/Community Feasibility Study and Regulatory Review
Encourages private individuals and CBOs to invest in wind turbines by showing the economic benefits to be obtained
Ministry with responsibility for Energy
2013 Completed UNDP NA
Biomass resource assessment Quantify current local usage of fuel wood and charcoal and assess future market use of these renewable energy sources
Centre of Excellence in Sustainable Energy Developments (CESED) a division of Petroleum Corporation of Jamaica(PCJ)
2012 Completed PCJ 60000

Biennial Update Report of Jamaica
Locally implemented Mitigation Projects (continued)
Project Description Implementation Agency Launch date
Status Funding Organization
Project Budget US$
Situational Analysis of Jamaica’s Energy Status and Alternative Energy Systems and Opportunities
Highlight local opportunities for Community Based Organizations (CBOs) to participate in alternative energy projects.
Association of Development Agencies
Completed EFJ NA
Small Scale Biodiesel Pilot Project
Determine the agricultural and process parameters for the production of oil crops (castor and jatropha) and their conversion into biodiesel.
Ministry of Agriculture and Fisheries (MOAF), PCJ, CESED
2010 Completed PCJ 73000
Research Partnership Agreement between CARDI and PCJ
Determine the agricultural parameters for the growth of biomass and oil seeds on marginal land/mined out bauxite land
Caribbean Agricultural Research and Development Institute (CARDI) and PCJ
2010 Ongoing PCJ 54000
Solar market survey Quantify the total installed capacity of solar energy (thermal and photovoltaic) and assess the market (supply and demand) to estimate the total potential for solar deployment in Jamaica
CESED 2013 Not yet launched
PCJ In negotiation
Train-the-Trainer seminars in Jamaica for the Caribbean region
Certify participants in the skills necessary to coordinate and carry out training of renewable energy professionals in the region
RENAC, Wigton Windfarm
2016 Ongoing RENAC, Wigton Windfarm
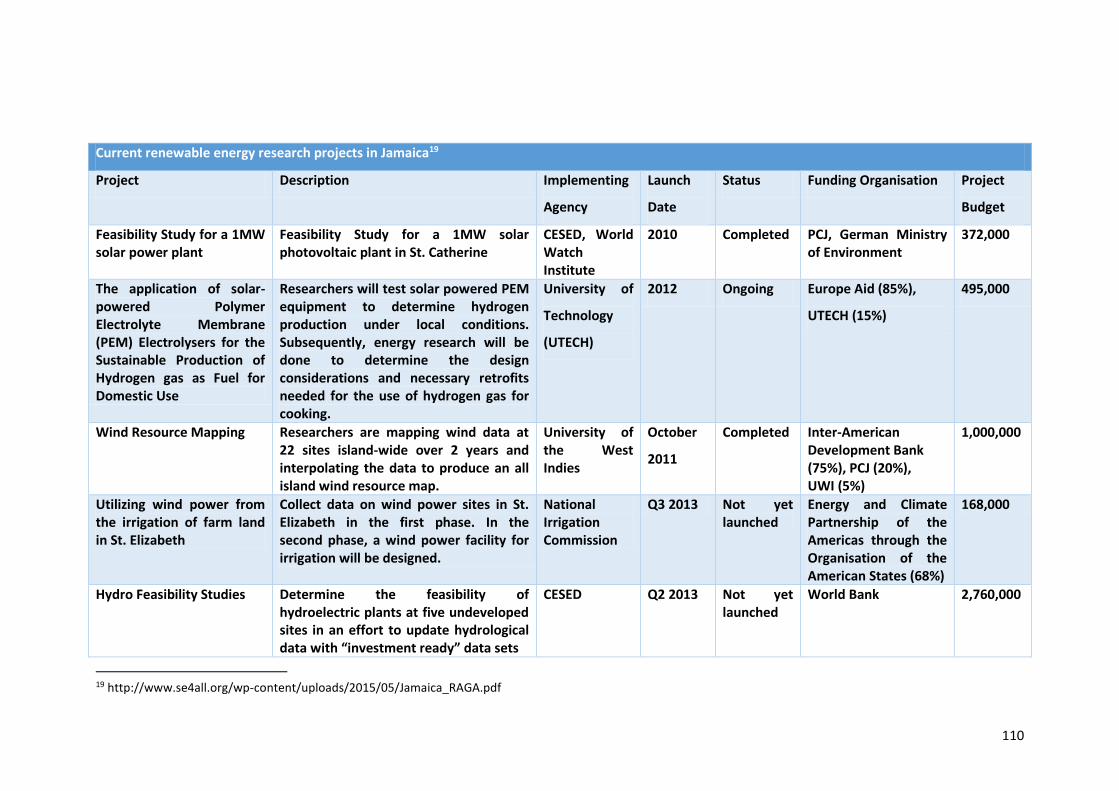
110
Current renewable energy research projects in Jamaica19
Project Description Implementing
Agency
Launch
Date
Status Funding Organisation Project
Budget
Feasibility Study for a 1MW solar power plant
Feasibility Study for a 1MW solar photovoltaic plant in St. Catherine
CESED, World Watch Institute
2010 Completed PCJ, German Ministry of Environment
372,000
The application of solar-powered Polymer Electrolyte Membrane (PEM) Electrolysers for the Sustainable Production of Hydrogen gas as Fuel for Domestic Use
Researchers will test solar powered PEM equipment to determine hydrogen production under local conditions. Subsequently, energy research will be done to determine the design considerations and necessary retrofits needed for the use of hydrogen gas for cooking.
University of
Technology
(UTECH)
2012 Ongoing Europe Aid (85%),
UTECH (15%)
495,000
Wind Resource Mapping Researchers are mapping wind data at 22 sites island-wide over 2 years and interpolating the data to produce an all island wind resource map.
University of the West Indies
October
2011
Completed Inter-American Development Bank (75%), PCJ (20%), UWI (5%)
1,000,000
Utilizing wind power from the irrigation of farm land in St. Elizabeth
Collect data on wind power sites in St. Elizabeth in the first phase. In the second phase, a wind power facility for irrigation will be designed.
National Irrigation Commission
Q3 2013 Not yet launched
Energy and Climate Partnership of the Americas through the Organisation of the American States (68%)
168,000
Hydro Feasibility Studies Determine the feasibility of hydroelectric plants at five undeveloped sites in an effort to update hydrological data with “investment ready” data sets
CESED Q2 2013 Not yet launched
World Bank 2,760,000
19 http://www.se4all.org/wp-content/uploads/2015/05/Jamaica_RAGA.pdf
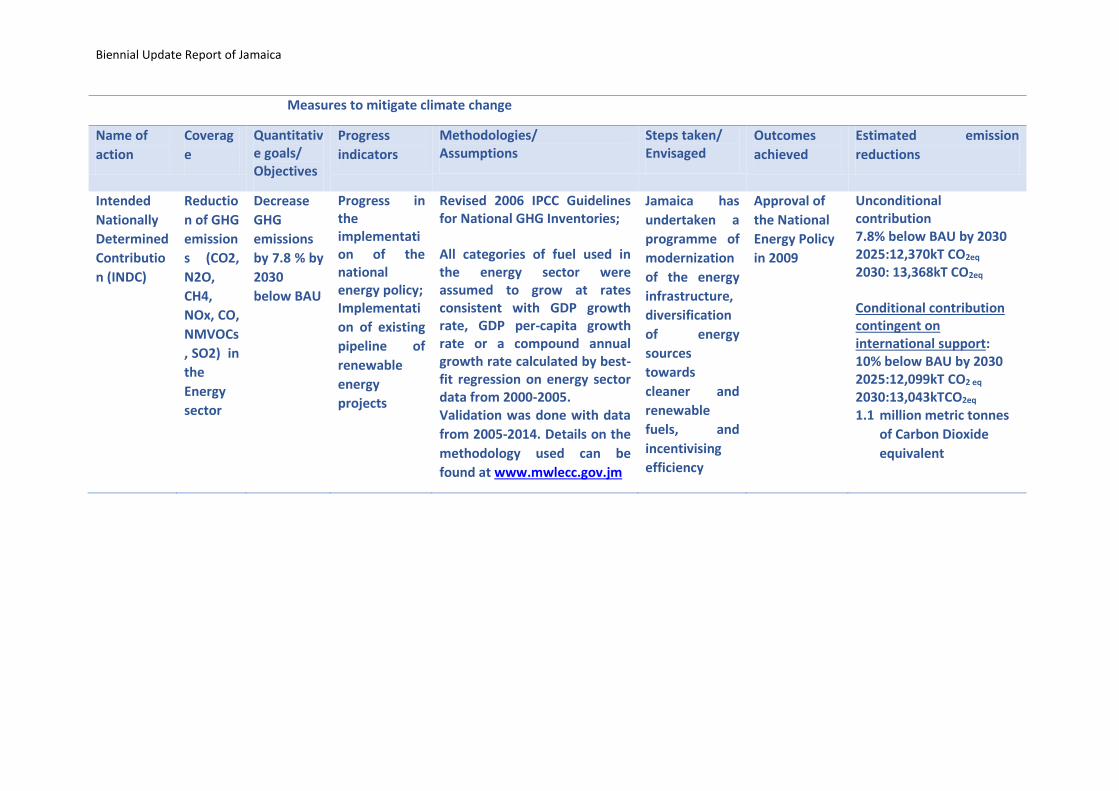
Biennial Update Report of Jamaica
Measures to mitigate climate change
Name of
action
Coverag
e
Quantitative goals/ Objectives
Progress
indicators
Methodologies/ Assumptions
Steps taken/ Envisaged
Outcomes
achieved
Estimated emission
reductions
Intended
Nationally
Determined
Contributio
n (INDC)
Reductio
n of GHG
emission
s (CO2,
N2O,
CH4,
NOx, CO,
NMVOCs
, SO2) in
the
Energy
sector
Decrease
GHG
emissions
by 7.8 % by
2030
below BAU
Progress in the implementation of the national energy policy; Implementati
on of existing
pipeline of
renewable
energy
projects
Revised 2006 IPCC Guidelines for National GHG Inventories;
All categories of fuel used in the energy sector were assumed to grow at rates consistent with GDP growth rate, GDP per-capita growth rate or a compound annual growth rate calculated by best-fit regression on energy sector data from 2000-2005. Validation was done with data
from 2005-2014. Details on the
methodology used can be
found at www.mwlecc.gov.jm
Jamaica has
undertaken a
programme of
modernization
of the energy
infrastructure,
diversification
of energy
sources
towards
cleaner and
renewable
fuels, and
incentivising
efficiency
Approval of
the National
Energy Policy
in 2009
Unconditional contribution 7.8% below BAU by 2030 2025:12,370kT CO2eq 2030: 13,368kT CO2eq
Conditional contribution contingent on international support: 10% below BAU by 2030 2025:12,099kT CO2 eq 2030:13,043kTCO2eq 1.1 million metric tonnes
of Carbon Dioxide
equivalent

112
63. Constraints and Gaps, and Related Financial and Capacity Needs
Jamaica is a Small Island Developing States and is one of the countries that is most vulnerable countries to the effects of climate change. The country has suffered significantly from several weather related events over the past two decades including droughts, floods, tropical storms and hurricanes that have severely impacted its economic growth. The country requires support to meet its needs with regards to capacity building, technology transfer and finance.
64. Financial Support Received
Jamaica received funding from the Global Environmental Facility to support enabling activities for the preparation of the TNC and BUR. Funding is been sought from the Green Climate Fund to implement the readiness phase for participation in the GCF. The Adaptation Fund have provided grant funds to implement several activities in three parishes. Bilateral partners have provided support for Jamaica’s efforts to respond to climate change including the European Union, United States Agency for International Development, Japan International Cooperation Agency, United Kingdom and several others including developing countries such as China and Kuwait. Jamaica is one of the participants in the Japan-Caribbean Climate Change Partnership that was launched early this year (2016).
65. Technology and Capacity Building Support Received
Jamaica has not yet received support specifically for Technology and Capacity-Building except when such activities are included as part of other projects. This is an area of concern and must be addressed in the coming months.
66. Support Required
The Climate Change Division will require a full complement of staff of about seven persons if it is to successfully undertake its full responsibilities of coordinating and facilitating Jamaica’s climate Change response. This will require additional staff with the requisite skills and capabilities. A possible merger with the Meteorological Service could be a practical solution if some of the requisite skills are added that are specific to addressing climate change issues.
67. Support Received for the Preparation of BURs
A sum of US$352,000 was provided through the Global Environment Facility’s Expedited Funding Facility for the preparation of the BUR. This was combined with funds of US$500,000 for the preparation of the TNC. UNDP has provided US$90,000 and in-kind contribution from the Government of Jamaica is some USD110,000. Technical support was provided by the UNDP/UNEP Global Support Programme and the Consultative Group of Expert.

Biennial Update Report of Jamaica
68. Appendix 1: Emission Estimate Table (CRF Format)
The following tables present emissions of direct and indirect GHGs for each year of the time series (with the exception of 2012, which is presented in the main body of the report, in Section 2). Please note that 0.00 indicates values of less than three decimal places

114
Inventory Year: 2006
Greenhouse gas source and sink categoriesCO2 Emissions
(Gg)
CO2 Removals
(Gg)
CH4
(Gg)
N2O
(Gg)
CO
Gg
NOx
(Gg)
NMVOCs
(Gg)
SOx
(Gg)
HFC - 23 HFC - 134 Other CF4 C2F6 Other
Total National Emissions and Remov als 9519.77 38.97 12.48 99.88 64.77 32.01 18.71 0 44.32 34.75 0 0 0
1 - Energy 10615.51 1.66 0.30 85.21 58.56 12.42 18.69
1A - Fuel Combustion Ac tiv it ies 10614.32 1.66 0.30 85.21 58.56 12.42 18.69
1A1 - Energy Industries 3003.85 0.12 0.02 0.58 4.81 0.07 14.28
1A2 - Manufacturing Industries and Construction (ISIC) 4961.00 0.32 0.06 14.37 32.94 2.98 3.90
1A3 - Transport 2110.20 0.61 0.21 56.93 18.82 8.03 0.32
1A4 - Other Sectors 539.27 0.62 0.01 13.33 1.99 1.34 0.20
1A5 - Other NO NO NO NO NO NO NO
1B - Fugit ive Emissions from Fuels 1.19 0.00 0.00 0.00 0.00 0.00 0.00
1B1 - Solid Fuels NO NO NO NO NO NO NO
1B2 - Oil and Natural Gas 1.19 0.00 0.00 0.00 0.00 0.00 0.00
2 - Industrial Processes 543.95 0.00 0.00 0.00 0.00 3.13 0.00 0 44.32 34.75 0 0 0
2A - Mineral Products 542.02 NA NA NA NA NA NA
2B - Chemical Industry NO NO NO NO NO NO NO
2C - Metal Production NO NO NO NO NO NO NO NO NO NO NO NO NO
2D - Other Production 1.94 NO NO NO NO NO NO
2E - Production of Halocarbons and Sulphur Hexafluoride NA NA NA NA NO NO NO NO NO NO
2F - Consumption of Halocarbons and Sulphur Hexafluoride NA NA NA NA NO 44.32 34.75 NO NO NO
2G - Other (please specify) NO NO NO NO NO 3.13 NO
3 - Solvent and Other Produc t Use 0.00 0.00 0.00 0.00 0.00 14.25 0.00
4 - Agriculture 12.87 12.03 8.61 5.86 1.07 0.00
4A - Enteric Fermentation 8.26 NA NA NA NA
4B - Manure Management 4.36 3.97 NA IE 1.01 NA
4C - Rice Cultivation 0.00 NA NA NA NA
4D - Agricultural Soils 4.19 NA 5.62 0.06 NA
4E - Prescribed Burning of Savannas NO NO NO NO NO NO
4F - Field Burning of Agricultural Residues 0.25 0.01 8.61 0.23 NE NE
4G - Other (please specify) 1.07 NO 3.87 NO NO NO NO
5 - Land-Use Change & Forestry -1685.19 0.00 0.00 0.00 0.00 0.00
5A - Changes in Forest and Other Woody Biomass Stocks -1834 NA NA NA NA
5B - Forest and Grassland Conversion 86 NA NA NA NA
5E - Other (please specify) 62 NA NA NA NA
6 - W aste 44.43 24.44 0.15 6.06 0.35 1.13 0.01
6A - Solid Waste Disposal on Land 19.05 0.00 0.00 0.98 0.00
6B - Wastewater Handling 4.68 0.13 0.00 0.00 0.00 0.00
6C - Waste Incineration 6 0.00 0.00 0.00 0.01 0.02 0.00
6D - Other (open bruning and biological treatment) 39 0.71 0.02 6.06 0.34 0.13 0.01
7 - Other (please spec ify) 0.00 0.00 0.00 0.00 0.00 0.00 0.00 NO NO NO NO NO NO
NO NO NO NO NO NO
Memo Items
International Bunkers 2284.83 0.14 0.06 4.09 41.71 1.40 9.91
1A3a1 - International Aviation 769.02 0.01 0.02 0.51 3.42 0.09 0.24
1A3d1 - International Marine (Bunkers) 1515.81 0.14 0.04 3.58 38.29 1.31 9.67
CO2 emissions from biomass 586.92
HFCs (Gg CO2 EQ) PFCs (Gg CO2 EQ)
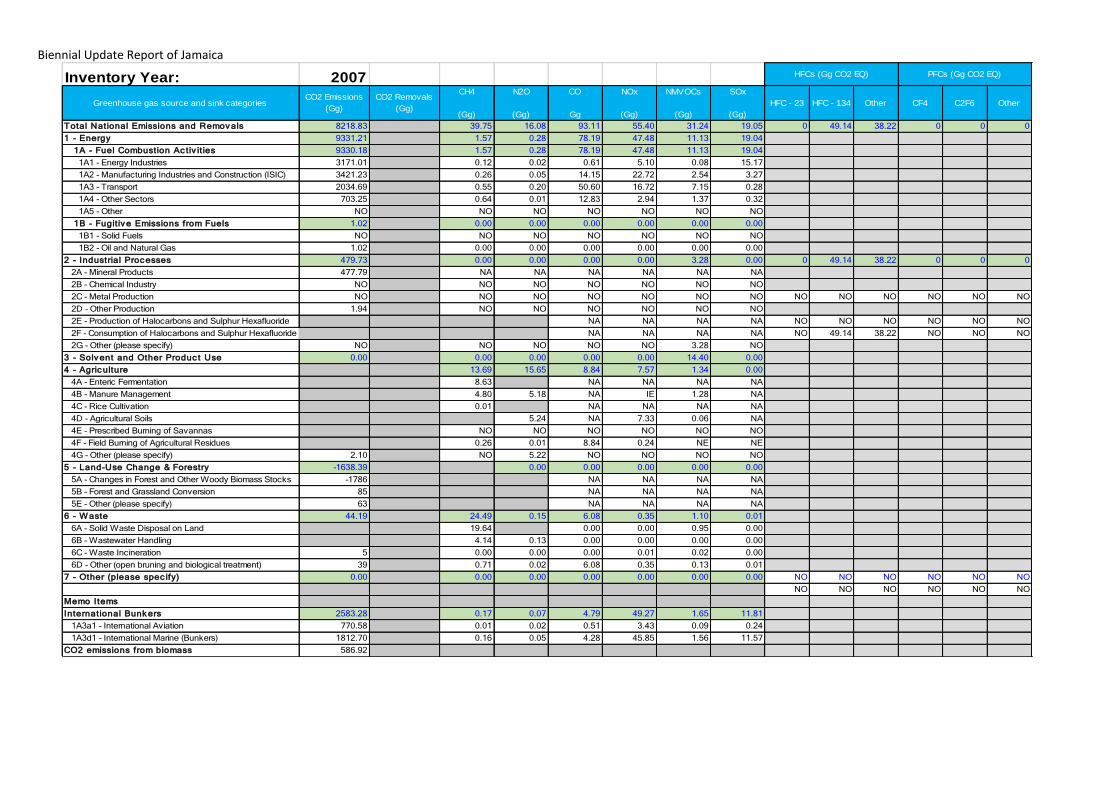
Biennial Update Report of Jamaica
Inventory Year: 2007
Greenhouse gas source and sink categoriesCO2 Emissions
(Gg)
CO2 Removals
(Gg)
CH4
(Gg)
N2O
(Gg)
CO
Gg
NOx
(Gg)
NMVOCs
(Gg)
SOx
(Gg)
HFC - 23 HFC - 134 Other CF4 C2F6 Other
Total National Emissions and Remov als 8218.83 39.75 16.08 93.11 55.40 31.24 19.05 0 49.14 38.22 0 0 0
1 - Energy 9331.21 1.57 0.28 78.19 47.48 11.13 19.04
1A - Fuel Combustion Ac tiv it ies 9330.18 1.57 0.28 78.19 47.48 11.13 19.04
1A1 - Energy Industries 3171.01 0.12 0.02 0.61 5.10 0.08 15.17
1A2 - Manufacturing Industries and Construction (ISIC) 3421.23 0.26 0.05 14.15 22.72 2.54 3.27
1A3 - Transport 2034.69 0.55 0.20 50.60 16.72 7.15 0.28
1A4 - Other Sectors 703.25 0.64 0.01 12.83 2.94 1.37 0.32
1A5 - Other NO NO NO NO NO NO NO
1B - Fugit ive Emissions from Fuels 1.02 0.00 0.00 0.00 0.00 0.00 0.00
1B1 - Solid Fuels NO NO NO NO NO NO NO
1B2 - Oil and Natural Gas 1.02 0.00 0.00 0.00 0.00 0.00 0.00
2 - Industrial Processes 479.73 0.00 0.00 0.00 0.00 3.28 0.00 0 49.14 38.22 0 0 0
2A - Mineral Products 477.79 NA NA NA NA NA NA
2B - Chemical Industry NO NO NO NO NO NO NO
2C - Metal Production NO NO NO NO NO NO NO NO NO NO NO NO NO
2D - Other Production 1.94 NO NO NO NO NO NO
2E - Production of Halocarbons and Sulphur Hexafluoride NA NA NA NA NO NO NO NO NO NO
2F - Consumption of Halocarbons and Sulphur Hexafluoride NA NA NA NA NO 49.14 38.22 NO NO NO
2G - Other (please specify) NO NO NO NO NO 3.28 NO
3 - Solvent and Other Produc t Use 0.00 0.00 0.00 0.00 0.00 14.40 0.00
4 - Agriculture 13.69 15.65 8.84 7.57 1.34 0.00
4A - Enteric Fermentation 8.63 NA NA NA NA
4B - Manure Management 4.80 5.18 NA IE 1.28 NA
4C - Rice Cultivation 0.01 NA NA NA NA
4D - Agricultural Soils 5.24 NA 7.33 0.06 NA
4E - Prescribed Burning of Savannas NO NO NO NO NO NO
4F - Field Burning of Agricultural Residues 0.26 0.01 8.84 0.24 NE NE
4G - Other (please specify) 2.10 NO 5.22 NO NO NO NO
5 - Land-Use Change & Forestry -1638.39 0.00 0.00 0.00 0.00 0.00
5A - Changes in Forest and Other Woody Biomass Stocks -1786 NA NA NA NA
5B - Forest and Grassland Conversion 85 NA NA NA NA
5E - Other (please specify) 63 NA NA NA NA
6 - W aste 44.19 24.49 0.15 6.08 0.35 1.10 0.01
6A - Solid Waste Disposal on Land 19.64 0.00 0.00 0.95 0.00
6B - Wastewater Handling 4.14 0.13 0.00 0.00 0.00 0.00
6C - Waste Incineration 5 0.00 0.00 0.00 0.01 0.02 0.00
6D - Other (open bruning and biological treatment) 39 0.71 0.02 6.08 0.35 0.13 0.01
7 - Other (please spec ify) 0.00 0.00 0.00 0.00 0.00 0.00 0.00 NO NO NO NO NO NO
NO NO NO NO NO NO
Memo Items
International Bunkers 2583.28 0.17 0.07 4.79 49.27 1.65 11.81
1A3a1 - International Aviation 770.58 0.01 0.02 0.51 3.43 0.09 0.24
1A3d1 - International Marine (Bunkers) 1812.70 0.16 0.05 4.28 45.85 1.56 11.57
CO2 emissions from biomass 586.92
HFCs (Gg CO2 EQ) PFCs (Gg CO2 EQ)

116
Inventory Year: 2008
Greenhouse gas source and sink categoriesCO2 Emissions
(Gg)
CO2 Removals
(Gg)
CH4
(Gg)
N2O
(Gg)
CO
Gg
NOx
(Gg)
NMVOCs
(Gg)
SOx
(Gg)
HFC - 23 HFC - 134 Other CF4 C2F6 Other
Total National Emissions and Remov als 9026.33 40.03 22.17 96.05 66.57 32.38 18.63 0 52.22 40.27 0 0 0
1 - Energy 10069.95 1.67 0.29 80.58 55.76 11.96 18.62
1A - Fuel Combustion Ac tiv it ies 10069.59 1.67 0.29 80.58 55.76 11.96 18.62
1A1 - Energy Industries 3061.88 0.12 0.02 0.59 4.91 0.07 14.51
1A2 - Manufacturing Industries and Construction (ISIC) 4718.59 0.31 0.07 14.41 32.09 3.03 3.69
1A3 - Transport 1928.02 0.56 0.19 51.89 17.26 7.40 0.27
1A4 - Other Sectors 361.09 0.68 0.01 13.68 1.50 1.46 0.14
1A5 - Other NO NO NO NO NO NO NO
1B - Fugit iv e Emissions from Fuels 0.36 0.00 0.00 0.00 0.00 0.00 0.00
1B1 - Solid Fuels NO NO NO NO NO NO NO
1B2 - Oil and Natural Gas 0.36 0.00 0.00 0.00 0.00 0.00 0.00
2 - Industrial Proc esses 537.03 0.00 0.00 0.00 0.00 3.11 0.00 0 52.22 40.27 0 0 0
2A - Mineral Products 535.10 NA NA NA NA NA NA
2B - Chemical Industry NO NO NO NO NO NO NO
2C - Metal Production NO NO NO NO NO NO NO NO NO NO NO NO NO
2D - Other Production 1.94 NO NO NO NO NO NO
2E - Production of Halocarbons and Sulphur Hexafluoride NA NA NA NA NO NO NO NO NO NO
2F - Consumption of Halocarbons and Sulphur Hexafluoride NA NA NA NA NO 52.22 40.27 NO NO NO
2G - Other (please specify) NO NO NO NO NO 3.11 NO
3 - Solv ent and Other Produc t Use 0.00 0.00 0.00 0.00 0.00 14.28 0.00
4 - Agric ulture 13.66 21.73 8.58 10.42 1.73 0.00
4A - Enteric Fermentation 8.31 NA NA NA NA
4B - Manure Management 5.10 7.24 NA IE 1.68 NA
4C - Rice Cultivation 0.01 NA NA NA NA
4D - Agricultural Soils 6.95 NA 10.18 0.06 NA
4E - Prescribed Burning of Savannas NO NO NO NO NO NO
4F - Field Burning of Agricultural Residues 0.25 0.01 8.58 0.23 NE NE
4G - Other (please specify) 1.60 NO 7.54 NO NO NO NO
5 - Land-Use Change & Forestry -1631.47 0.00 0.00 0.00 0.00 0.00
5A - Changes in Forest and Other Woody Biomass Stocks -1779 NA NA NA NA
5B - Forest and Grassland Conversion 83 NA NA NA NA
5E - Other (please specify) 64 NA NA NA NA
6 - W aste 49.22 24.70 0.15 6.88 0.40 1.30 0.01
6A - Solid Waste Disposal on Land 20.11 0.00 0.00 1.13 0.00
6B - Wastewater Handling 3.79 0.13 0.00 0.00 0.00 0.00
6C - Waste Incineration 5 0.00 0.00 0.00 0.01 0.02 0.00
6D - Other (open bruning and biological treatment) 44 0.80 0.02 6.88 0.39 0.15 0.01
7 - Other (please spec ify) 0.00 0.00 0.00 0.00 0.00 0.00 0.00 NO NO NO NO NO NO
NO NO NO NO NO NO
Memo Items
International Bunk ers 2450.58 0.16 0.07 4.47 45.74 1.53 10.91
1A3a1 - International Aviation 778.95 0.01 0.02 0.52 3.47 0.09 0.25
1A3d1 - International Marine (Bunkers) 1671.63 0.15 0.04 3.95 42.27 1.44 10.67
CO2 emissions from biomass 586.92
HFCs (Gg CO2 EQ) PFCs (Gg CO2 EQ)

Biennial Update Report of Jamaica
Inventory Year: 2009
Greenhouse gas source and sink categoriesCO2 Emissions
(Gg)
CO2 Removals
(Gg)
CH4
(Gg)
N2O
(Gg)
CO
Gg
NOx
(Gg)
NMVOCs
(Gg)
SOx
(Gg)
HFC - 23 HFC - 134 Other CF4 C2F6 Other
Total National Emissions and Removals 6296.01 40.82 21.49 91.11 46.36 31.57 17.34 0 53.82 41.12 0 0 0
1 - Energy 7388.45 1.63 0.28 77.47 35.99 11.56 17.33
1A - Fuel Combustion Ac tiv it ies 7386.72 1.63 0.28 77.47 35.98 11.56 17.33
1A1 - Energy Industries 3129.61 0.12 0.02 0.60 5.02 0.08 14.87
1A2 - Manufacturing Industries and Construction (ISIC) 1940.10 0.28 0.05 13.12 13.33 2.86 2.20
1A3 - Transport 1997.88 0.55 0.20 50.42 16.38 7.20 0.15
1A4 - Other Sectors 319.14 0.68 0.01 13.32 1.26 1.43 0.12
1A5 - Other NO NO NO NO NO NO NO
1B - Fugit ive Emissions from Fuels 1.72 0.00 0.00 0.00 0.00 0.00 0.00
1B1 - Solid Fuels NO NO NO NO NO NO NO
1B2 - Oil and Natural Gas 1.72 0.00 0.00 0.00 0.00 0.00 0.00
2 - Industrial Processes 484.17 0.00 0.00 0.00 0.00 2.96 0.00 0 53.82 41.12 0 0 0
2A - Mineral Products 482.24 NA NA NA NA NA NA
2B - Chemical Industry NO NO NO NO NO NO NO
2C - Metal Production NO NO NO NO NO NO NO NO NO NO NO NO NO
2D - Other Production 1.94 NO NO NO NO NO NO
2E - Production of Halocarbons and Sulphur Hexafluoride NA NA NA NA NO NO NO NO NO NO
2F - Consumption of Halocarbons and Sulphur Hexafluoride NA NA NA NA NO 53.82 41.12 NO NO NO
2G - Other (please specify) NO NO NO NO NO 2.96 NO
3 - Solvent and Other Produc t Use 0.00 0.00 0.00 0.00 0.00 14.19 0.00
4 - Agriculture 13.10 21.07 7.52 10.02 1.69 0.00
4A - Enteric Fermentation 7.98 NA NA NA NA
4B - Manure Management 4.89 7.02 NA IE 1.63 NA
4C - Rice Cultivation 0.01 NA NA NA NA
4D - Agricultural Soils 6.70 NA 9.82 0.06 NA
4E - Prescribed Burning of Savannas NO NO NO NO NO NO
4F - Field Burning of Agricultural Residues 0.22 0.01 7.52 0.20 NE NE
4G - Other (please specify) 0.74 NO 7.34 NO NO NO NO
5 - Land-Use Change & Forestry -1621.56 0.00 0.00 0.00 0.00 0.00
5A - Changes in Forest and Other Woody Biomass Stocks -1770 NA NA NA NA
5B - Forest and Grassland Conversion 83 NA NA NA NA
5E - Other (please specify) 65 NA NA NA NA
6 - W aste 44.22 26.09 0.15 6.12 0.35 1.17 0.01
6A - Solid Waste Disposal on Land 21.71 0.00 0.00 1.01 0.00
6B - Wastewater Handling 3.67 0.13 0.00 0.00 0.00 0.00
6C - Waste Incineration 5 0.00 0.00 0.00 0.01 0.02 0.00
6D - Other (open bruning and biological treatment) 39 0.71 0.02 6.12 0.35 0.13 0.01
7 - Other (please spec ify) 0.00 0.00 0.00 0.00 0.00 0.00 0.00 NO NO NO NO NO NO
NO NO NO NO NO NO
Memo Items
International Bunkers 1640.88 0.09 0.04 2.70 27.04 0.90 6.26
1A3a1 - International Aviation 694.47 0.00 0.02 0.46 3.09 0.08 0.22
1A3d1 - International Marine (Bunkers) 946.41 0.09 0.02 2.24 23.95 0.82 6.04
CO2 emissions from biomass 586.92
HFCs (Gg CO2 EQ) PFCs (Gg CO2 EQ)

118
Inventory Year: 2010
Greenhouse gas source and sink categoriesCO2 Emissions
(Gg)
CO2 Removals
(Gg)
CH4
(Gg)
N2O
(Gg)
CO
Gg
NOx
(Gg)
NMVOCs
(Gg)
SOx
(Gg)
HFC - 23 HFC - 134 Other CF4 C2F6 Other
Total National Emissions and Removals 5666.64 40.36 21.43 83.17 42.23 29.26 16.65 0 54.15 40.94 0 0 0
1 - Energy 6829.01 1.46 0.25 69.95 31.86 9.73 16.63
1A - Fuel Combustion Ac tiv it ies 6827.92 1.46 0.25 69.95 31.86 9.73 16.63
1A1 - Energy Industries 3093.20 0.12 0.02 0.60 4.99 0.08 14.84
1A2 - Manufacturing Industries and Construction (ISIC) 1502.57 0.15 0.03 9.48 10.17 1.50 1.51
1A3 - Transport 1910.67 0.52 0.18 47.16 15.48 6.74 0.18
1A4 - Other Sectors 321.48 0.67 0.01 12.71 1.22 1.42 0.11
1A5 - Other NO NO NO NO NO NO NO
1B - Fugit ive Emissions from Fuels 1.09 0.00 0.00 0.00 0.00 0.00 0.00
1B1 - Solid Fuels NO NO NO NO NO NO NO
1B2 - Oil and Natural Gas 1.09 0.00 0.00 0.00 0.00 0.00 0.00
2 - Industrial Processes 415.60 0.00 0.00 0.00 0.00 2.90 0.00 0 54.15 40.94 0 0 0
2A - Mineral Products 413.67 NA NA NA NA NA NA
2B - Chemical Industry NO NO NO NO NO NO NO
2C - Metal Production NO NO NO NO NO NO NO NO NO NO NO NO NO
2D - Other Production 1.94 NO NO NO NO NO NO
2E - Production of Halocarbons and Sulphur Hexafluoride NA NA NA NA NO NO NO NO NO NO
2F - Consumption of Halocarbons and Sulphur Hexafluoride NA NA NA NA NO 54.15 40.94 NO NO NO
2G - Other (please specify) NO NO NO NO NO 2.90 NO
3 - Solvent and Other Produc t Use 0.00 0.00 0.00 0.00 0.00 13.89 0.00
4 - Agriculture 12.63 21.04 7.92 10.06 1.67 0.00
4A - Enteric Fermentation 7.66 NA NA NA NA
4B - Manure Management 4.72 6.98 NA IE 1.61 NA
4C - Rice Cultivation 0.01 NA NA NA NA
4D - Agricultural Soils 6.69 NA 9.85 0.06 NA
4E - Prescribed Burning of Savannas NO NO NO NO NO NO
4F - Field Burning of Agricultural Residues 0.23 0.01 7.92 0.22 NE NE
4G - Other (please specify) 1.10 NO 7.36 NO NO NO NO
5 - Land-Use Change & Forestry -1617.95 0.00 0.00 0.00 0.00 0.00
5A - Changes in Forest and Other Woody Biomass Stocks -1767 NA NA NA NA
5B - Forest and Grassland Conversion 83 NA NA NA NA
5E - Other (please specify) 66 NA NA NA NA
6 - W aste 38.87 26.27 0.15 5.30 0.31 1.07 0.01
6A - Solid Waste Disposal on Land 22.30 0.00 0.00 0.93 0.00
6B - Wastewater Handling 3.35 0.13 0.00 0.00 0.00 0.00
6C - Waste Incineration 5 0.00 0.00 0.00 0.01 0.02 0.00
6D - Other (open bruning and biological treatment) 34 0.62 0.01 5.30 0.30 0.12 0.01
7 - Other (please spec ify) 0.00 0.00 0.00 0.00 0.00 0.00 0.00 NO NO NO NO NO NO
NO NO NO NO NO NO
Memo Items
International Bunkers 1687.69 0.09 0.05 2.73 27.30 0.90 6.30
1A3a1 - International Aviation 737.47 0.01 0.02 0.49 3.28 0.08 0.23
1A3d1 - International Marine (Bunkers) 950.22 0.09 0.02 2.24 24.02 0.82 6.06
CO2 emissions from biomass 586.92
HFCs (Gg CO2 EQ) PFCs (Gg CO2 EQ)

Biennial Update Report of Jamaica
Inventory Year: 2011
Greenhouse gas source and sink categoriesCO2 Emissions
(Gg)
CO2 Removals
(Gg)
CH4
(Gg)
N2O
(Gg)
CO
Gg
NOx
(Gg)
NMVOCs
(Gg)
SOx
(Gg)
HFC - 23 HFC - 134 Other CF4 C2F6 Other
Total National Emissions and Removals 6254.04 39.59 14.28 82.65 42.06 29.41 17.66 0 53.42 39.90 0 0 0
1 - Energy 7394.07 1.44 0.25 69.32 35.07 10.08 17.65
1A - Fuel Combustion Ac tiv it ies 7393.84 1.44 0.25 69.32 35.07 10.08 17.65
1A1 - Energy Industries 3061.61 0.12 0.02 0.59 4.92 0.07 14.51
1A2 - Manufacturing Industries and Construction (ISIC) 2107.04 0.21 0.04 10.27 13.85 2.06 2.87
1A3 - Transport 1893.33 0.51 0.18 45.34 15.09 6.61 0.15
1A4 - Other Sectors 331.86 0.61 0.01 13.12 1.21 1.33 0.11
1A5 - Other NO NO NO NO NO NO NO
1B - Fugit ive Emissions from Fuels 0.24 0.00 0.00 0.00 0.00 0.00 0.00
1B1 - Solid Fuels NO NO NO NO NO NO NO
1B2 - Oil and Natural Gas 0.24 0.00 0.00 0.00 0.00 0.00 0.00
2 - Industrial Processes 436.10 0.00 0.00 0.00 0.00 3.09 0.00 0 53.42 39.90 0 0 0
2A - Mineral Products 433.09 NA NA NA NA NA NA
2B - Chemical Industry NO NO NO NO NO NO NO
2C - Metal Production NO NO NO NO NO NO NO NO NO NO NO NO NO
2D - Other Production 3.01 NO NO NO NO NO NO
2E - Production of Halocarbons and Sulphur Hexafluoride NA NA NA NA NO NO NO NO NO NO
2F - Consumption of Halocarbons and Sulphur Hexafluoride NA NA NA NA NO 53.42 39.90 NO NO NO
2G - Other (please specify) NO NO NO NO NO 3.09 NO
3 - Solvent and Other Produc t Use 0.00 0.00 0.00 0.00 0.00 14.04 0.00
4 - Agriculture 11.61 13.88 8.01 6.68 1.19 0.00
4A - Enteric Fermentation 7.33 NA NA NA NA
4B - Manure Management 4.03 4.56 NA IE 1.13 NA
4C - Rice Cultivation 0.01 NA NA NA NA
4D - Agricultural Soils 4.60 NA 6.47 0.06 NA
4E - Prescribed Burning of Savannas NO NO NO NO NO NO
4F - Field Burning of Agricultural Residues 0.24 0.01 8.01 0.22 NE NE
4G - Other (please specify) 1.30 NO 4.72 NO NO NO NO
5 - Land-Use Change & Forestry -1616.24 0.00 0.00 0.00 0.00 0.00
5A - Changes in Forest and Other Woody Biomass Stocks -1766 NA NA NA NA
5B - Forest and Grassland Conversion 83 NA NA NA NA
5E - Other (please specify) 67 NA NA NA NA
6 - W aste 38.80 26.55 0.15 5.31 0.31 1.01 0.01
6A - Solid Waste Disposal on Land 22.29 0.00 0.00 0.88 0.00
6B - Wastewater Handling 3.64 0.13 0.00 0.00 0.00 0.00
6C - Waste Incineration 5 0.00 0.00 0.00 0.01 0.02 0.00
6D - Other (open bruning and biological treatment) 33 0.62 0.01 5.31 0.30 0.12 0.01
7 - Other (please spec ify) 0.00 0.00 0.00 0.00 0.00 0.00 0.00 NO NO NO NO NO NO
NO NO NO NO NO NO
Memo Items
International Bunkers 1460.34 0.07 0.04 2.21 21.67 0.71 4.88
1A3a1 - International Aviation 731.66 0.01 0.02 0.49 3.26 0.08 0.23
1A3d1 - International Marine (Bunkers) 728.68 0.07 0.02 1.72 18.42 0.63 4.65
CO2 emissions from biomass 586.92
HFCs (Gg CO2 EQ) PFCs (Gg CO2 EQ)

120
69. Appendix 2: Emissions of Indirect GHGs
Emissions of NOx
The following table summarises the emissions of NOx across the 2006 – 2012 time series. These data are also presented in the figure below.
Table 69.46. NOx emissions (Gg NO2)
2006 2007 2008 2009 2010 2011 2012
Electricity Generation 4.81 5.10 4.91 5.02 4.99 4.92 4.51
Mining/Bauxite 30.49 19.65 27.48 10.25 8.21 11.09 10.11
Other Industrial Combustion 2.46 3.07 4.61 3.07 1.96 2.77 3.26
Transport 18.82 16.72 17.26 16.38 15.48 15.09 14.48
Commercial, Residential (including Agriculture/Forestry/Fishing) 1.99 2.94 1.50 1.26 1.22 1.21 1.23
Agriculture (& Waste) 6.21 7.92 10.81 10.38 10.37 6.99 10.40
Total 64.77 55.40 66.57 46.36 42.23 42.06 43.98
Emissions of NOx arise almost exclusively from combustion sources, the main exception being the agriculture sector. As a result, the use of fuels in different sectors has a large influence on the relative contributions to the total emission from the different source sectors.
Whilst the energy balance tables do provide information on the use of fuels in different sectors, there are some limits to the detail that is available, and in particular whether the fuel is used in stationary sources or mobile machinery. This is particularly relevant for liquid fuels, which are used in both stationary sources and mobile machinery across many sectors. NOx EFs are different for stationary and mobile sources, so the fuel allocation to stationary/mobile sources does impact on the total emission estimate. However, it is possible to make assumptions regarding the allocation of fuel to stationary and mobile sources - gasoline and diesel oil are assigned to mobile machinery, and other fuels are assigned to stationary sources.
Mining/Bauxite Whilst the 2012 emissions from the mining/bauxite sector are not the largest in absolute terms, as with other pollutants, the trend in emissions is one of the most important in determining the trend of total NOx emissions. The large variations in NOx emissions across the time series is a reflection of the large variations in fuel consumption in the mining/bauxite sector. The substantial decrease in levels of production between 2008 and 2009 is reflected in the total NOx emissions. Transport This sector includes emissions from road transport, aviation and domestic shipping (emissions from railways are included elsewhere as explained in section 3.6.3). Emissions from all sources have been in steady decline across the time series. Road transport is the largest component of the transport sector, and NOx emissions have declined by 20% from 2006 to 2012. Although smaller in absolute terms, larger percentage reductions are observed in the aviation and shipping sectors (55% and 66% reductions respectively). These reductions are driven by decreasing fuel consumption across the time series.

Biennial Update Report of Jamaica
Emissions of NMVOC
The following table summarises the emissions of NMVOC across the 2006 – 2012 time series. These data are also presented in the figure below. Table 69.47. NMVOC emissions (Gg NMVOC)
2006 2007 2008 2009 2010 2011 2012
Stationary Combustion 3.05 2.61 3.11 2.93 1.58 2.13 2.12
Transport 8.03 7.15 7.40 7.20 6.74 6.61 6.43
Commercial, Residential 1.34 1.37 1.46 1.43 1.42 1.33 1.33
Food & Drink 3.13 3.28 3.11 2.96 2.90 3.09 3.08
Solvent Use 14.25 14.40 14.28 14.19 13.89 14.04 14.01
Other 2.21 2.44 3.04 2.86 2.74 2.20 2.68
Total 32.01 31.24 32.38 31.57 29.26 29.41 29.65
Emissions of NMVOC arise from a wide variety of different sources e.g. fuel combustion, and evaporative sources from the use of solvents, from food and drink manufacture and from the use of products. Transport Most of the NMVOC sources are relatively constant across the time series, the main exception being road transport. As a result, the trends in NMVOC emissions from road transport primarily determine the trend in the total NMVOC emissions across the time series - even though, in absolute terms, it is a smaller source than solvent use. Emissions from petrol cars are the largest component of the transport emissions, accounting for nearly two thirds of the emissions from transport (domestic aviation, road vehicles and domestic shipping combined). Emissions have been decreasing with time, and this is a reflection of the lower levels of fuel consumption, rather than improvements in emissions abatement. This is because the method for estimating emissions has not been able to take into account the changes in technology of the vehicle fleet across the time series. This is an important improvement for the future, but relies on being able to obtain more detailed information on the road vehicle fleet.
Food and Drink NMVOC emissions arise from the manufacture of a range of products in the food and drink sector. The largest NMVOC emissions come from the manufacture of flour, sugar and animal feed. The manufacture of alcoholic beverages, and particularly spirits, features strongly in the food and drink sector in Jamaica. However emissions from these sources are a relatively small component of the food and drink sector overall. This is because of the loss of product through evaporation is undesirable, and hence there are controls put in place to minimise the emissions to air.
Solvent Use Solvent use is the single largest source sector or NMVOC. Emissions are relatively constant across the time series, reflecting the fact that many of the sources within this sector only vary significantly with population. There are many individual sources within this source sector, but these are readily summarised by allocating them into one of three main sub-categories:
The use of products in the domestic sector e.g. cosmetics, cleaning products, and pharmaceuticals.
The use of paints, varnishes, other coatings and adhesives, and solvent use for e.g. degreasing and cleaning.
Dry cleaning.

122
It was not possible to obtained detailed information on whether there have been material changes in the characteristics of these sources across the time series (e.g. how the solvent content of paint may have decreased). So changes in emissions are primarily driven by changes in population.
Figure 69.7 Emissions of NMVOC (Gg NMVOC)
Emissions of CO
The following table summarises the emissions of CO across the 2006 – 2012 time series. These data are also presented in the figure below.
Table 69.48. CO emissions (Gg CO)
2006 2007 2008 2009 2010 2011 2012
Public electricity and heat production 0.58 0.61 0.59 0.60 0.60 0.59 0.54
Mining/Bauxite 3.92 2.53 3.54 1.32 1.06 1.43 1.30
Other Industrial Combustion 10.44 11.62 10.88 11.80 8.42 8.85 9.54
Transport 56.93 50.60 51.89 50.42 47.16 45.34 44.75
Commercial, Residential (including Agriculture/Forestry/Fishing) 13.33 12.83 13.68 13.32 12.71 13.12 12.93
Other (Flaring, Non-E Prod Agriculture, Waste) 14.67 14.92 15.47 13.64 13.22 13.32 13.40
Total 99.88 93.11 96.05 91.11 83.17 82.65 82.45
Emissions of CO arise completely from combustion sources, and in particular the incomplete combustion of fuel to CO rather than CO2. The CO emissions total is dominated by the transport

Biennial Update Report of Jamaica
component, although combustion in other sectors also sum to make a significant contribution to the total emission. Transport The CO emission from the transport sector is both the largest source sector in absolute terms, and the largest contributor to the overall trend with time. Emissions from petrol cars account for three quarters of the total sector emissions, and the variation with time is very much dominated by the amount of fuel consumption. Emission controls for CO have been introduced into road vehicle fleets in the form of different generations of the three-way catalyst and improved engine management systems. However it has not been possible to obtain the required detailed information to account for the penetration of these different technological advancements into the road vehicle fleet. Hence the emission trends are primarily driven by the trends in fuel consumption.
Figure 69.8 Emissions of CO (Gg CO)
Emissions of SO2
The following table summarises the emissions of SO2 across the 2006 – 2012 time series. These data are also presented in the figure below. Table 69.49. SO2 emissions (Gg SO2)
2006 2007 2008 2009 2010 2011 2012
Public electricity and heat production 14.28 15.17 14.51 14.87 14.84 14.51 13.11
Mining/Bauxite 2.79 1.80 2.52 0.94 0.75 1.02 0.93
Other Industrial Combustion 1.10 1.47 1.18 1.26 0.75 1.86 1.71
Transport 0.32 0.28 0.27 0.15 0.18 0.15 0.13
Commercial, Residential, Mobile 0.20 0.32 0.14 0.12 0.11 0.11 0.11
Other (Flaring, Non-E Prod Agricul, Waste) 0.01 0.01 0.01 0.01 0.01 0.01 0.01
Total 18.71 19.05 18.63 17.34 16.65 17.66 16.00

124
Emissions of SO2 are typically dominated by combustion sources, the sulphur in the fuel being converted into SO2 and emitted to air during fuel combustion. There are some non-combustion sources of SO2, but these do not occur in Jamaica, and hence all of the SO2 emissions in the inventory are from fuel combustion (sources included in “Other” in the table above are flaring and the burning of waste). Emissions of SO2 are expected to be less uncertain than the emission of other indirect GHGs. This is because the SO2 emission is readily determined from the sulphur content of the fuel and the amount of fuel used – both terms that are generally well characterised. Emissions of other indirect GHGs are affected by the combustion conditions, and are therefore considerably more variable from source to source, and hence less well characterised. Uncertainties associated with emissions of each pollutant have been calculated, and are presented in Section 9.
Public Electricity and Heat Production Emissions of SO2 are dominated by the emissions from electricity generation, both in terms of the absolute emissions and the contribution to the trend with time. Fuel oil and diesel oil are both used for electricity generation, the former being the larger component. The sulphur content of fuel oil is approximately an order of magnitude higher than that of diesel oil, and as a result, SO2 emissions from fuel oil are considerably larger than those from diesel oil, accounting for 97% of the total emissions from public electricity and heat production.
Transport Transport only accounts for less than 1% of the emission total in 2012. Whilst road transport is the largest consumer of fuel in the transport sector, there are stringent controls on the sulphur content that is allowed in gasoline and diesel used for road vehicles. The permitted levels of sulphur in fuels used for shipping are higher by several orders of magnitude, and as a result, it is domestic shipping which is the largest emitter in the transport sector. However, controls on the sulphur content of fuel used in shipping will come into effect from 2015 in the US and Canada. It is therefore expected that the fuel available for use in the Caribbean will also be lower in sulphur content, substantially reducing SO2 emission from domestic shipping.
Figure 69.9 Emissions of SO2 (Gg SO2)

Biennial Update Report of Jamaica
Methodology - Indirect GHG Emissions from Road Transport
The number of registered road vehicles was available for 2010 to 2012 as presented below. Simple extrapolation was used to extend these data to the complete 2006-2012 time series. The trends in the data for 2010 to 2012 were noted to be minimal, and hence the vehicle numbers were kept constant across earlier years of the time series. Local expert judgement was used to consider how the fleet numbers should be adjusted to account for the fact that vehicles are in use but not officially registered, and that some registered vehicles are off the road. It was considered that increasing the official data by 12% would account for unregistered vehicles in use (estimated to be 15%), and “several” percent of the registered vehicles not in use. This expert opinion was based on national studies that have been undertaken, but it was not possible to cite specific references. Assumptions were then made regarding the percentage of each vehicle type that uses gasoline or diesel oil. It was assumed that 1% of cars uses diesel, and that of the goods vehicles, 50% are diesel heavy goods vehicles, 45% are diesel light duty vehicles, and the remaining 5% are gasoline light duty vehicles. This provided “on the road” vehicle numbers, by class, and by fuel type, presented in the table below. Whilst these adjustments to the official fleet data drew on local expertise, it is recognised that there are steps which are highly uncertain without any supporting information that can be clearly referenced. Hence these steps in the methodology are in need of improvement. Table 69.50. “On the Road” Vehicle Numbers
Vehicle Type Fuel 2006 2007 2008 2009 2010 2011 2012
Cars Gasoline 280,409 280,409 280,409 280,409 280,409 280,483 288,026
LDVs Gasoline 4,322 4,322 4,322 4,322 4,322 4,306 4,310
Motorcycles Gasoline 8,090 8,090 8,090 8,090 8,090 8,235 8,724
Cars Diesel 2,832 2,832 2,832 2,832 2,832 2,833 2,909
LDVs Diesel 38,898 38,898 38,898 38,898 38,898 38,758 38,790
HGVs Diesel 43,220 43,220 43,220 43,220 43,220 43,064 43,100
It was then necessary to distribute the total gasoline and diesel oil to the different vehicle types. No information was available on the relative annual mileage or typical annual fuel consumption across the different vehicle types. So it was assumed that each vehicle in the fleet consumes the same amount of fuel. This is a significant simplification, and is in need of improvement, but allows the generation of fuel consumption for each vehicle type. These fuel consumption data are then combined with EFs taken from the 2013 EMEP/EEA Guidebook to give emission estimates for NOx, NMVOC, CO and SO2 for each vehicle and fuel type. Emission estimates are presented below. It was not possible to estimate NMVOC evaporative emissions with the limited information available. Table 69.51. Indirect GHG Emissions from Road Transport (Mg) Pollutant Vehicle
Type
Fuel Unit 2006 2007 2008 2009 2010 2011 2012
NOx Cars Gasoline Mg 4,364 3,886 4,027 3,929 3,675 3,603 3,472
NOx LDVs
Gasoline Mg 102 91 94 92 86 84 79
NOx Motorcycles Gasoline Mg 96 85 88 86 81 80 80
NOx Cars Diesel Mg 235 209 217 211 198 195 192

126
NOx LDVs
Diesel Mg 3,709 3,302 3,422 3,340 3,124 3,064 2,951
NOx HGVs Diesel Mg 9,224 8,212 8,511 8,305 7,768 7,618 7,338
NMVOC Cars
Gasoline Mg 5,024 4,473 4,636 4,524 4,231 4,148 3,997
NMVOC LDVs
Gasoline Mg 112 100 104 101 95 92 87
NMVOC Motorcycles Gasoline Mg 1,895 1,687 1,749 1,706 1,596 1,592 1,583
NMVOC Cars
Diesel Mg 13 11 12 11 11 11 10
NMVOC LDVs Diesel Mg 383 341 353 345 323 316 305
NMVOC HGVs Diesel Mg 531 473 490 478 447 438 422
CO Cars Gasoline Mg 42,341 37,698 39,068 38,124 35,659 34,961 33,686
CO LDVs Gasoline Mg 1,173 1,045 1,083 1,057 988 965 906
CO Motorcycles
Gasoline Mg 7,178 6,391 6,623 6,463 6,045 6,032 5,995
CO Cars Diesel Mg 60 54 56 54 51 50 49
CO LDVs Diesel Mg 1,841 1,639 1,699 1,658 1,550 1,520 1,464
CO HGVs
Diesel Mg 2,095 1,865 1,933 1,886 1,764 1,731 1,667
SO2 Cars
Gasoline Mg 30 27 28 27 25 25 24
SO2 LDVs Gasoline Mg 0 0 0 0 0 0 0
SO2 Motorcycles Gasoline Mg 1 1 1 1 1 1 1
SO2 Cars Diesel Mg 1 0 1 0 0 0 0
Methodology - NMVOC Emissions from 2G Food and Beverage Manufacture
NMVOC emissions arise from this sector, and a description is included in Appendix 3. Emissions of NMVOC arise from the manufacture of specific food and beverages. The Tier 1 methodology for estimating the emissions of NMVOC uses a straightforward combination of production data of specific food/beverage types with default emission factors from the 2013 EMEP/EEA Guidebook. Production data were obtained from Economic and Social Survey of Jamaica reports for 2000-2013 (Planning Institute of Jamaica, 2015), and are presented in the table below. Table 69.52 Food and Beverage Production Data (tonnes)
Year
Margarine Animal feeds
Milk products Flour Sugar Rum Beer
Non-alcoholic carbonated bev.
2006 7,581 378,165 5,021 129,322 146,882 22,940 86,955 8,500
2007 7,676 377,029 5,704 124,928 164,387 21,850 86,946 9,159
2008 7,967 390,929 4,525 132,397 140,872 22,620 85,985 9,243
2009 6,417 390,221 3,868 136,782 125,818 22,636 69,204 8,716
2010 6,517 381,432 4,386 136,798 121,806 18,494 65,516 9,337
2011 7,047 402,201 3,864 134,510 139,594 19,367 58,343 11,101
2012 6,903 408,139 3,648 136,132 136,645 22,747 50,226 11,461

Biennial Update Report of Jamaica
Table 69.53 NMVOC Emissions from Food and Beverage Production Data (tonnes)
Year
Margarine Animal feeds
Milk products Flour Sugar Rum Beer
Non-alcoholic carbonated bev.
2006 75.81 378.17 50.21 1,034.58 1,468.82 91.76 30.43 2.98
2007 76.76 377.03 57.04 999.42 1,643.87 87.40 30.43 3.21
2008 79.67 390.93 45.25 1,059.18 1,408.72 90.48 30.09 3.24
2009 64.17 390.22 38.68 1,094.26 1,258.18 90.54 24.22 3.05
2010 65.17 381.43 43.86 1,094.38 1,218.06 73.98 22.93 3.27
2011 70.47 402.20 38.64 1,076.08 1,395.94 77.47 20.42 3.89
2012 69.03 408.14 36.48 1,089.06 1,366.45 90.99 17.58 4.01
Methodology - NMVOC Emissions from 3 Solvent Use
Solvent use is a source sector in its own right, rather than a sub-sector of IPPU. However it is included here for convenience because methodologies similar to those for IPPU are used for estimating emissions. In addition, the only emissions estimated are those for NMVOC, rather than direct GHGs. The use of some solvents and certain consumer products can represent significant sources of emissions of NMVOCs. The table below provides a summary of source descriptions and the methodologies used for estimating the emissions of NMVOC. Table 69.54 Sources Involving Solvent Use
Sub-category Description of Solvent Comments
Domestic solvent use including fungicides
Solvents are used in a variety of applications in the manufacturing of chemicals and chemical products including fungicides and personal care products
Estimates were based on population data from 2000-2013 Emission Factor of 2700g/person was used based on the 2013 EMEP/EEA Guidebook 2013, 2D3a Domestic Solvent Use including pesticides, Table 3-1
Coating Applications -Paints
Coating operations, mixing, and use of thinning solvents
Estimates for emissions from paints were based on the local production of decorative paints, production are given in 000’litres however figures were converted to Kg using density of 0.5 g/m3
Degreasing applications
Surface cleaning/degreasing operations Not included in the inventory, as no solvent use data were readily available
Dry Cleaning operations
Use of specific chemical in fabric cleaning Local expert estimate 3.5 kg of clothes dry cleaned per month. This was scaled to an annual figure for Jamaica and combined an EF from the 2013 EMEP/EEA Guidebook.
Chemical Products
Solvents are used in a variety of applications in the manufacturing of chemicals and chemical products. Textile fabric printing, polyester resin plastic
Not included in the inventory, as no solvent use data were readily available

128
products manufacture, tank and drum cleaning and degreasing
Printing Press operations, lithography, and use of thinning solvents
Not included in the inventory, as no solvent use data were readily available
The tables below summarise the estimates of solvent use for domestic activities, and the resulting NMVOC emissions. Table 69.55 Consumption of Solvents for Domestic Activities
Domestic Solvent Use
Coating Applications – Decorative coating application Dry Cleaning
Population Paint applied Textile treated
1000 hab tonnes tonnes
2006 2,658 17,397 111,628
2007 2,667 18,092 112,022
2008 2,677 17,034 112,421
2009 2,686 16,151 112,816
2010 2,696 13,874 113,211
2011 2,704 14,648 113,572
2012 2,712 14,219 113,883
Table 69.56 Emissions of NMVOC from Solvent Use (Mg NMVOC)
Domestic Solvent Use Coating Applications – Decorative coating application Dry Cleaning
2006 7,176.06 2,609.55 4,465.10
2007 7,201.44 2,713.80 4,480.90
2008 7,227.09 2,555.10 4,496.86
2009 7,252.47 2,422.65 4,512.65
2010 7,277.85 2,081.10 4,528.44
2011 7,301.07 2,197.20 4,542.89
2012 7,321.05 2,132.85 4,555.32
NMVOC that is released into the air will eventually breakdown into CO2, and as such the NMVOC emissions contribute to the total CO2 emissions. However, no information was readily available on the carbon content of the solvents, and therefore a CO2 emission estimate was not included in the emissions inventory. This source was not given a high priority because the CO2 emission is very small when compared to numerous other sources of CO2, but would be a simple addition to future versions of the inventory.

Biennial Update Report of Jamaica
70. References
National Circumstances
Bailey, W., Chen, A.A., and Taylor, M.A. ,2009, Review of Health Effects of Climate Variability and Climate Change in the Caribbean, Climate Studies Group ,Mona, University of the West Indies, Mona in association with the Caribbean Environment and Health Institute for the Mainstreaming Adaptation to Climate Change Project of the Caribbean Community Climate Change Centre (CCCCC), 2nd Floor Lawrence Nicholas Building Bliss Parade, P.O. Box 536, Belmopan City, Belize, 85 p. CARIBSAVE, 2009, CARIBSAVE Final Report: Negril-Jamaica (Report can be downloaded from the website, www.caribsave.org; go to Projects and scroll down to DIFD Seed Funding Stage: Full Destination Profile for Negril, Jamaica – Download) (April 24, 2012) Caribbean Regional Fund for Wastewater Management (CREW).Revised January 2015. Baseline Assessment Study on Wastewater Management. Retrieved from www.gefcrew.org Dunn, L (2015, January) Lecture. Gender Vulnerabilities and gender mainstreaming at the Institute of Gender and Development Studies, University of the West Indies, Mona, Jamaica Dunn, L. & Mondesire, A. (Eds.),2009,CARICOM Secretariat Regional Special Topic Monograph on Gender & Development Issues Based on Analysis of the 2000 Round Census Data of Eighteen Caribbean countries. Caribbean Community (CARICOM) Secretariat, Turkeyen, Greater Georgetown, Guyana, 203p. Economic and Social Survey Jamaica, 2006, Published by the Statistical Institute of Jamaica, 16 Oxford Road, Kingston 5, Jamaica, West Indies Economic and Social Survey Jamaica, 2012, Published by the Statistical Institute of Jamaica, 16 Oxford Road, Kingston 5, Jamaica, West Indies Gammon, K. 2014, October 8. The Jamaica Observer: “The Cost of Chikungunya to Jamaica”, Retrieved from http://www.jamaicaobserver.com/columns/The-cost-of-chikungunya-to-Jamaica_17772229 Government of Jamaica, 2011, GOJ The Second National Communication of Jamaica to the United Nations Framework Convention Climate Change , National Meteorological Service Jamaica 65 ¾ Half Way Tree Road, Kingston 10, Jamaica, 409 page. Hill, K. (2011, April 7), The Gleaner “Educate Them To Stay”. Retrieved on October 8, 2015 from http://jamaica-gleaner.com/gleaner/20110417/lead/lead4.html Jamaica Survey of Living Conditions, 2006, A Joint Publication of the Planning Institute of Jamaica and the Statistical Institute of Jamaica, 16 Oxford Road, Kingston 5, , and 7 Cecelio Avenue, Kingston 10 , Jamaica, West Indies Jamaica Survey of Living Conditions, 2012, A Joint Publication of the Planning Institute of Jamaica and the Statistical Institute of Jamaica, 16 Oxford Road, Kingston 5, , and 7 Cecelio Avenue, Kingston 10 , Jamaica, West Indies Statistical Institute of Jamaica, 2011, Jamaica’s 2011 Census of Population and Housing Jamaica. Published by the Statistical Institute of Jamaica, 7 Cecelio Avenue, Kingston 10, Jamaica, West Indies UNECLAC, 2011, UNECLAC Summary Report: The Economics of Climate Change in the Caribbean, (Any queries about the report should be addressed to ECLAC Sub-regional Headquarters for the Caribbean, or to ECLAC Public Information and Web Services Section, E-mail: registryeclacpos.org ; Tel: (868) 224-8000; Fax: (868) 623-8485; Website: www.eclacpos.org, Vassell, L., 2009, UNDP Case Study on the Impact of Climate Change on Water and Sanitation in Jamaica, retrieved from http://www.undp.org.cu/crmi/docs/crmi-gttfcstjamaica-bp-2009-en.pdf (April 24, 2012)

130
Introduction and Summary of Emissions Inventory
Davis et al 2008: Final Report Jamaica’s Greenhouse Gas Emissions Inventory 2000 to 2005, prepared for Meteorological Services. Claude Davis & Associates, Owen Evelyn, Leslie A. Simpson, Ianthe T. Smith, February 2008. Dore et al, 2016: National GHG Emissions Inventory Report of Jamaica, 2006-2012. Ministry of Water, Land, Environment & Climate Change and UNDP, 2016. IPCC Guidelines, 1996 Revised: IPCC Guidelines for National GHG Inventories http://www.ipcc-nggip.iges.or.jp/public/gl/invs1.html IPCC Guidelines, 2006: IPCC Guidelines for National GHG Inventories:
Volume1 General Guidance
Volume 2 Energy
Volume 3 Industrial Processes and Product Use
Volume 4 Agriculture, Forestry and Other Land Use
Volume 5 Waste http://www.ipcc-nggip.iges.or.jp/public/2006gl/ IPCC GPG-LULUCF, 2006: IPCC Good Practice Guidance for Land Use, Land-Use Change and Forestry IPCC Second Assessment Report on Climate Change, 1995: A report of the Intergovernmental Panel on Climate Change. https://www.ipcc.ch/pdf/climate-changes-1995/ipcc-2nd-assessment/2nd-assessment-en.pdf IPCC Fourth Assessment Report on Climate Change, 2007: A report of the Intergovernmental Panel on Climate Change. https://www.ipcc.ch/publications_and_data/publications_ipcc_fourth_assessment_report_synthesis report.htm UK National Inventory Report on GHG Emissions 1990-2013, 2015: http://unfccc.int/national_reports/annex_i_ghg_inventories/national_inventories_submissions/items/8812.php UNFCCC BUR Guidelines, 2011: UNFCCC Biennial Update Reporting Guidelines for Parties not included in Annex I to the Convention, FCCC/CP/2011/9/Add.1 http://unfccc.int/national_reports/nonannex_i_natcom/guidelines_and_user_manual/items/2607.php
Energy Sector Caribbean Cement Company, 2015 pers comm: Annual coal and fuel oil consumption. EMEP/EEA Guidebook, 2013: EMEP/EEA Air Pollutant Emission Inventory Guidebook - 2013 http://www.eea.europa.eu//publications/emep-eea-guidebook-2013 IPCC Guidelines, 2006: IPCC Guidelines for National GHG Inventories:
Volume1 General Guidance,
Volume 2 Energy MSTEM, 2015: National Energy Balance Tables for Jamaica (2006-2012). MWLECC, 2015: Aircraft movement data, domestic shipping fuel consumption (supplied by Ministry for Transport). Petrojam, 2015a pers comm: Jamaican Refinery own fuel use, 2011-2012 and Asphalt Production. Petrojam, 2015b pers comm: Telroy Morgan, amount and composition of gases and vapours flared.

Biennial Update Report of Jamaica
Industrial Processes and Product Use Caribbean Cement Company Limited, 2015: Annual Clinker Production. Davis et al 2008: Final Report Jamaica’s Greenhouse Gas Emissions Inventory 2000 to 2005, prepared for Meteorological Services. Claude Davis & Associates, Owen Evelyn, Leslie A. Simpson, Ianthe T. Smith, February 2008. Planning Institute of Jamaica, 2015: Economic and Social Survey of Jamaica (ESSJ) reports 2000-2013 IPCC Guidelines, 2006: IPCC Guidelines for National GHG Inventories:
Volume1 General Guidance,
Volume 3 Industrial Processes and Product Use Minerals Yearbook 2000-2011: U.S Geological Survey, Islands of the Caribbean. Petrojam, 2015: Production of lubricants/grease for 2011-2012. STATIN, 2015a: National Cement and Lime Production 2000 – 2008 http://statinja.gov.jm/productionstats.aspx STATIN, 2015b: Annual importation of F-gases 2012-2013
Agriculture FAOSTAT: http://faostat3.fao.org/download/Q/*/E Date accessed, April 12 Ministry of Agriculture (MOA): http://www.moa.gov.jm/AboutUs/Operational%20plan%202013-2014/2013-2014%20Ministry%20Operational%20Plan.pdf Date accessed, March 21 EMEP/EEA Guidebook (2013): http://www.eea.europa.eu/publications/emep-eea-guidebook-2013 Date accessed, April 16 IPCC Guidelines, 2006: IPCC Guidelines for National GHG Inventories:
Volume1 General Guidance,
Volume 4 Agriculture, Forestry and Other Land Use Jamaica Macro Socio-Economic and Environmental Assessment of the Damage and Loss Caused By Hurricane Sandy. Prepared by the Planning Institute of Jamaica. January 2013 Jamaica Racing Commission Statistical Department Jamaica’s Second National Communication Jackie Millington - Lydford mining company Lance Whyte and Edmond Lewis - Sugar Industry Research Institute. Ministry of Agriculture and Fisheries (MOAF): Agriculture Marketing and Information Division (AMID) Ministry of Agriculture and Fisheries (MOAF): Agriculture Land Management Division Ministry of Agriculture and Fisheries (MOAF) 2012: Pig Farmer Survey Rural Agricultural Development Authority (RADA): Cattle livestock data, 2011-2012. pers comm Maxine Brown. Statistical Institute of Jamaica –Library STATIN, 2007: Agricultural Census Preliminary Report Sugar Industry Research Institute, www.jlaltd.com/about.committees.poultry.html
Land Use, Land Use Change and Forestry
Brown, S. (1997). Estimating biomass and biomass change of tropical forests: A primer. FAO Forestry Paper no. 134, Rome. 55 p.

132
Camirand, R. and Evelyn, O.B. (2003). Ecological land classification for forest management and conservation in Jamaica. Jamaica-Canada Trees for Tomorrow Project Phase II, Forestry Department and Tecsult International, Kingston, Jamaica. 40 p. Camirand, R., Evelyn, O. (2004). National Forest Inventory Report 2003 - Volume 1 of 2 - Main Report & Appendices I to VIb, Available online at www.forestry.gov.jm Davis, C. et al. (2008). Jamaica's Greenhouse Gas Emissions, 2000 – 2005. Final Report. Available online at http://www.metservice.gov.jm/Climate%20Change/GHGSNCFinal%5B1%5D.pdf Evelyn, O., Camirand, R. (2003). Forest cover and deforestation in Jamaica: an analysis of forest cover estimates over time, International Forestry Review, 5(4), 2003, pp. 354-363. Available online at: www.forestry.gov.jm FAO/Forestry Department (2005). Global Forest Resources Assessment 2005, Jamaica, Country Report - Final Draft, Available online at: www.forestry.gov.jm FAO (2010). FAO Resource Assessment, 2010 - Jamaica Country Report. Available online at: www.forestry.gov.jm/PDF_files/Docs/Jamaica_FRA2010_Country_Report.pdf Forestry Department (2001). National forest management and conservation plan. Ministry of Agriculture, Kingston, Jamaica. 100 p. and appendices. Forestry Department (2002). Photo Interpretation Manual. Prepared by the Trees for Tomorrow Project – Phase II, Jamaica. June 2002. Forestry Department (2013). Jamaica’s Land Use Cover Assessment – A comparative assessment of Forest Change Between 1998 & 2013 (unpublished report at the Forestry Department). FRA (2005). Global Forest Resources Assessment 2005, Progress towards sustainable forest management, FAO Forestry Paper 147, Food and `Agriculture Organization of the United Nations, Rome, 2005 FRA (2015).Global Forest Resources Assessment 2015 IPCC Guidelines, 2006: IPCC Guidelines for National GHG Inventories:
Volume1 General Guidance,
Volume 4 Agriculture, Forestry and Other Land Use Thompson, D.A., Wright, D.L. and Evelyn, O. (1986). Forest resources in Jamaica. In Thompson, D.A., Bretting, P.K. and Humphreys, M. (eds.). Forests of Jamaica. The Jamaican Society of Scientists and Technologists, Kingston, Jamaica. pp. 81-90. WRC (2007). Draft Forest Management Plan Cockpit Country / Martha Brae Watershed Jamaica, Prepared by Windsor Research Centre, September 2007.
Waste Bonenfant D, Kharoune L, Sauvé S, Hausler R, Niquette P, Mimeault M and Kharoune M (2008): CO2 Sequestration by Aqueous Red Mud Carbonation at Ambient Pressure and Temperature. Ind. Eng. Chem. Res., 2008, 47 (20), pp 7617–7622 Food and Agriculture Organisation (FAOSTAT), 2015: Per capita protein available for consumption in 2006 to 2012. http://faostat3.fao.org/download/D/FS/E IPCC Guidelines, 2006: IPCC Guidelines for National GHG Inventories:
Volume1 General Guidance,
Volume 5 Waste IPCC Waste Model: IPCC Spreadsheet for Estimating Methane Emissions from Solid Waste Disposal Sites, available from: www.ipcc-nggip.iges.or.jp/public/2006gl/pdf/5Waste/IPCC_Waste_Model.xls Jamaica Bauxite Institute (JBI), 2015: Quantity of waste disposed to industrial waste disposal sites. Jamaica Information Service, 2015: Incineration of medical waste (http://jis.gov.jm/ministry-of-health-to-introduce-new-medical-waste-disposal-system/).

Biennial Update Report of Jamaica
Management of Ship-Generated, Medical and Hazardous Wastes Report 7: Maritime Authority of Jamaica, National Solid Waste Management Authority, National Environmental Planning Agency. National Solid Waste Management Authority (NSWMA), 2015: MSW generation and disposal by wasteshed (and hence fraction of MSW disposed to SWDS). National Environment and Planning Agency, 2015: BOD for sewage treatment plants. National Water Commission, 2015: BOD for sewage treatment plants. North East Regional Health Authority (NERHA), 2015: Bed occupancy rates and number of beds, Health Care Delivery Reports 2007 and 2008. http://www.nerha.gov.jm/ Planning Institute of Jamaica, Economic and Social Survey Jamaica 2006, 2011 and 2013: Industrial Production 2006 to 2012. Planning Institute of Jamaica (PIOJ) and STATIN, 2006-2010: Performance of sewage systems in Jamaica Survey of Living Conditions 2006, 2007, 2009 & 2010, Table F3, F3, F3 and F7 respectively. Saint Ann’s Bay Hospital, 2015: Quantities of waste incinerated 2006-2012, pers comm, Operations Manager, 2015. Scientific Research Council, 2008: Estimated Greenhouse Gas Emissions from Waste Facilities, January 2008. Spirits Pool Association (SPA), 2015: Alcohol production data for 2006-2012. State of the Environment Report (SOE), 2010: National Environment and Planning Agency (NEPA) http://www.nepa.gov.jm/publications/SOE/2010/state-of-The-environment-report-2010-Jamaica.pdf STATIN website. Population data for 2006 to 2012: http://statinja.gov.jm/Demo_SocialStats/population.aspx STATIN, 2015: The number of beds in all hospitals, categorized by region for 2006-2008. Sugar Industry Association (SIA), 2015: Sugar production for 2006-2012. Western Regional Health Authority (WRHA), 2015: For the Cornwall Regional hospital, the number of beds in 2009: http://www.wrha.gov.jm/