government of india ministry of jal shakti,
TRANSCRIPT

1 | P a g e
August, 2020
Central Water Commission
Water Quality Monitoring of Canals
Government of India Ministry of Jal Shakti,
Department of Water Resources, River Development and Ganga Rejuvenation

Cover & Back page:
Indira Gandhi Main & Lift Canals
Photograph courtesy by Sh. Nitish Kumar Singh, SRA

Executive Summary
A meeting was held under the Chairmanship of Shri Gajendra Singh Shekhawat,
Hon’ble Minister of Jal Shakti, Government of India through video-conferencing on 10th
April, 2020 to review “Water Quality Activities of Central Water Commission”. During
the meeting, it was desired by the Hon’ble Minister that water quality of Sirhind
Feeder Canal, Rajasthan Feeder Canal and Indira Gandhi Canal should be assessed by
CWC at vulnerable places and at locations from which domestic water supply is being
made to important cities of Rajasthan. In this regard, 25 probable locations on these
Canals were identified.
The investigated water quality analysis results of these canals from 25 selected
locations are compared with the BIS 10500:2012 standards and CPCB standards for
Designated Best Use. Surface Water samples collected from all the Canals were found
within acceptable limit with respect to most of the physical and chemical parameters
(e.g. pH, EC, TDS, DO, Mg+2, Ca+2, Cl-, F-, NO3-, SO4
-2). Water samples from these Canals
were also found within acceptable limit with respect to all the heavy metals e.g. arsenic,
chromium, cadmium, copper, iron, nickel, lead and zinc indicating the absence of
industrial pollution in these canals. Also, the results of Pesticide analysis of the canal
water samples were found to be Below Detection Limit.
However, Canal water samples were found beyond acceptable limit as per CPCB
standards for Designated Best Use with respect to Total Coliform and Fecal Coliform
which is an indication of presence of animal or human waste. Also, at 12 locations, BOD
concentration was found to be beyond the acceptable limit as per CPCB standards for
Class A, B & C.


CONTENTS
S.NO. DESCRIPTION PAGE NO.
1 INTRODUCTION 1
2 WATER QUALITY MONITORING OF INDIRA GANDHI
CANAL, RAJASTHAN FEEDER AND SIRHIND FEEDER
4
3 WATER QUALITY STANDARDS 10
4 WATER QUALITY MONITORING 13
- SAMPLING LOCATIONS 13
- FIELD SURVEY 15
- ANALYSIS AND OBSERVATIONS 19
5 CONCLUSIONS 30
6 ANNEXURE I 31
7 ANNEXURE II 32
8 ANNEXURE III 33
LIST OF TABLES
Table 1 Basin-wise water-quality stations monitored by CWC 2
Table 2 Designated Best Uses of Water by CPCB 11
Table 3 Drinking Water Quality Standards, BIS: 10500, 2012 12
Table 4 Locations identified for collecting samples from Canal system 14
Table 5 Heavy Metals concentration in Canal water samples 27
Table 6 Suitability of Canal Water as per CPCB standards for Designated Best Use
and BIS: 10500: 2012.
29
LIST OF FIGURES
Figure 1 Water quality laboratories of CWC 3
Figure 2 Map showing Indira Gandhi Canal, Sirhind feeder and Rajasthan Feeder 5
Figure 3 Main Branches of Indira Gandhi Canal 6
Figure 4 Rajasthan and Sirhind Feeder run parallel with common bank 8
Figure 5 Sampling Locations (1-25) identified on the Indira Gandhi Canal, Rajasthan
feeder and Sirhind Feeder
13
Figure 6 Laboratory analysis of samples received from Canals. 19
Figure 7 pH variation in Canal Water 20


Figure 8 Electrical Conductivity variation in Canal Water 21
Figure 9 Total Dissolved Solids (TDS) variation in Canal Water 21
Figure 10 Dissolved Oxygen (DO) variation in Canal Water 22
Figure 11 Bio-Chemical Oxygen Demand variation in Canal Water 23
Figure 12 Total Coliform variation in Canal Water 25
Figure 13 Fecal Coliform variation in Canal Water 25

1
Introduction
Water quality monitoring is one of the most important components in
environmental management of aquatic ecosystems. Monitoring of water quality provides
water managers with the necessary information for sustainable water resources
management and provides insight into complex dynamic environmental processes as
reliable, consistent, and appropriate information is necessary to understand the water
resources. Due to the direct or indirect activities from natural and anthropogenic sources,
water quality on earth’s surface such as of lakes, rivers, canals and groundwater etc. are
getting deteriorated day by day. In comparison to groundwater, the surface water gets
polluted more easily as it is open to atmosphere and for which its quality monitoring is also
a major concern.
Presently, Central Water Commission (CWC) is monitoring river water quality at its
634 key hydrological observation stations covering all the important river basins of India.
Also, water quality samples are being collected from 33 water quality sampling stations.
Further, CWC is planning to increase the water quality network on Indian rivers by
considering future objectives and necessities, to cover each and every river in the country.
The basin wise split of 667 WQ monitoring stations of CWC as on June 2020 are depicted in
Table 1.
At present, CWC is maintaining a three tier laboratory system for analysis of the
physio-chemical parameters of the water. The Level-I laboratories are located at 295 field
water quality monitoring stations on major rivers of India where physical parameters such
as temperature, colour, odour, specific conductivity, total dissolved solids, pH and
dissolved oxygen of river water are observed. There are 18 Level–II laboratories located at
selected division offices throughout India to analyses 25 no. of physio-chemical and
bacteriological parameters of water. 5 Level-III laboratories are functioning at Varanasi,
Delhi, Hyderabad, Coimbatore and Guwahati where 41 parameters including heavy metals /
toxic parameters and pesticides are analysed. The list of 23 Level-II and Level-III laboratories

2
and parameters analysed in the laboratories given in Annexure-I and Annexure-II
respectively.
Table 1: Basin-wise water-quality stations monitored by CWC
S.No. Basin GDQ GDSQ GQ WQSS Total
1 Brahmani-Baitarni Basin
11 1 14 26
2 Cauvery Basin 17 24
41
3 East Flowing rivers between Mahanadi
and Pennar 5
5
4 East Flowing rivers between Pennar
and Kanyakumari 10 8
18
5 Ganga/Brahmaputra/Meghna/Barak 76 162 96 5 339
6 Godavari Basin 13 32 4 49
7 Indus Basin 3 8
11
8 Krishna Basin 12 29 3 44
9 Mahanadi Basin 1 22
8 31
10 Mahi Basin 2 3
5
11 Minor Rivers Draining into Myanmar
and Bangladesh 6
6
12 Narmada Basin 5 10 1 16
13 Pennar Basin 4 4
8
14 Sabarmati Basin 1 1
1 3
15 Subarnarekha Basin 1 6
5 12
16 Tapi Basin 1 3
4
17 West Flowing rivers from Tadri to
Kanyakumari 9 26
35
18 West flowing rivers from Tapi to Tadri 4 5
9
19 West flowing rivers of Kutchh and
Saurashtra including Luni 2 3
5
Total 161 368 105 33 667

3
Out of 23, 12 laboratories of CWC have got accreditation by National Accreditation
Board for Testing and Calibration Laboratories (NABL) and 11 laboratories are under process
of accreditation, details of which are given in figure 1.
Figure 1: Water quality laboratories of CWC

4
Water Quality Monitoring of Indira Gandhi canal, Rajasthan Feeder and Sirhind Feeder
Canals are also an important part of Earth’s water cycle. Canal provides a home,
drinking water and a hunting ground for many organisms. Canal provides irrigation water,
transportation, hydro-electrical power drainage, food and recreation opportunities. As
water quality perturbations related to escalating human population growth and industry
pressures continue to increase, effective water quality monitoring of canals has become
critical for water resource management programs. Three important canals have been
selected for water quality monitoring in Punjab and Rajasthan.
During the meeting held under the Chairmanship of Sh. Gajendra Singh Shekhawat,
Hon’ble Minister of Jal Shakti, Government of India through video-conferencing on 10th April
2020 to review “Water Quality Activities of Central Water Commission”, it was desired that
Water Quality of Sirhind feeder, Rajasthan Feeder Canal and Indira Gandhi Canal Project
should be assessed by CWC at vulnerable locations and at locations from which domestic
water supply is being made to important cities of Rajasthan and the same should be taken
up within a month of lifting of present lock-down.
In this regard, a desktop study was conducted and 25 probable sampling locations i.e
5 on the Sirhind Feeder & Rajastha feeder Canal and 20 on Indira Gandhi Canal Project were
identified. 5 teams from CWC had taken 25 water samples from these canals during the 1st
week of June 2020.
The collected canal water samples were analysed in the Water Quality Laboratories
of CWC. Physio-Chemical and Biological WQ parameters analysis has been done at Chenab
Division WQ Lab, IBO, Jammu and National River WQ Lab (NRWQL), YBO, New Delhi.
Further, Trace & Toxic Metal analysis has been done at NRWQL, YBO, New Delhi and
Pesticides analysis has been done at Lower Cauvery Water Quality Laboratory (LCWQL),
CSRO, Coimbatore. The analysis of physio-chemical parameters and Trace & Toxic Metal
were completed in the last week of June 2020. And, the analysis of Pesticides for canal
water samples was completed in the first week of August, 2020.

5
Indira Gandhi Canal
It is the largest irrigation project of the world to provide irrigation to semi-arid and
arid areas of Rajasthan and it has given a face lift to its economy and economic
development. It is also known by the names 'Lifeline of Rajasthan' and 'Maruganga'. Its
present name is Indira Gandhi Canal. The Indira Gandhi Canal is the longest canal of India.
Kanwar Sen, the then irrigation engineer of Bikaner, had planned for this canal in 1948. Its
construction started in the same year. The origin of this canal is from Harike barrage, a few
kilometers below the confluence of the Sutlej and Beas rivers in Ferozepur district in Punjab
and terminates in irrigation facilities in the Thar Desert in the north west of Rajasthan state
(Figure 2). The Indira Gandhi Canal provides irrigation facilities over an area of 6,770 km2
(1,670,000 acres) in Jaisalmer district and 37 km2 (9,100 acres) in Barmer district. The canal
has transformed the barren deserts of this district into fertile and good fields.
Besides providing water for agriculture, the canal supply drinking water to hundreds
of people in far-flung areas.
Figure 2: Map showing Indira Gandhi Canal, Sirhind feeder and Rajasthan Feeder.
6
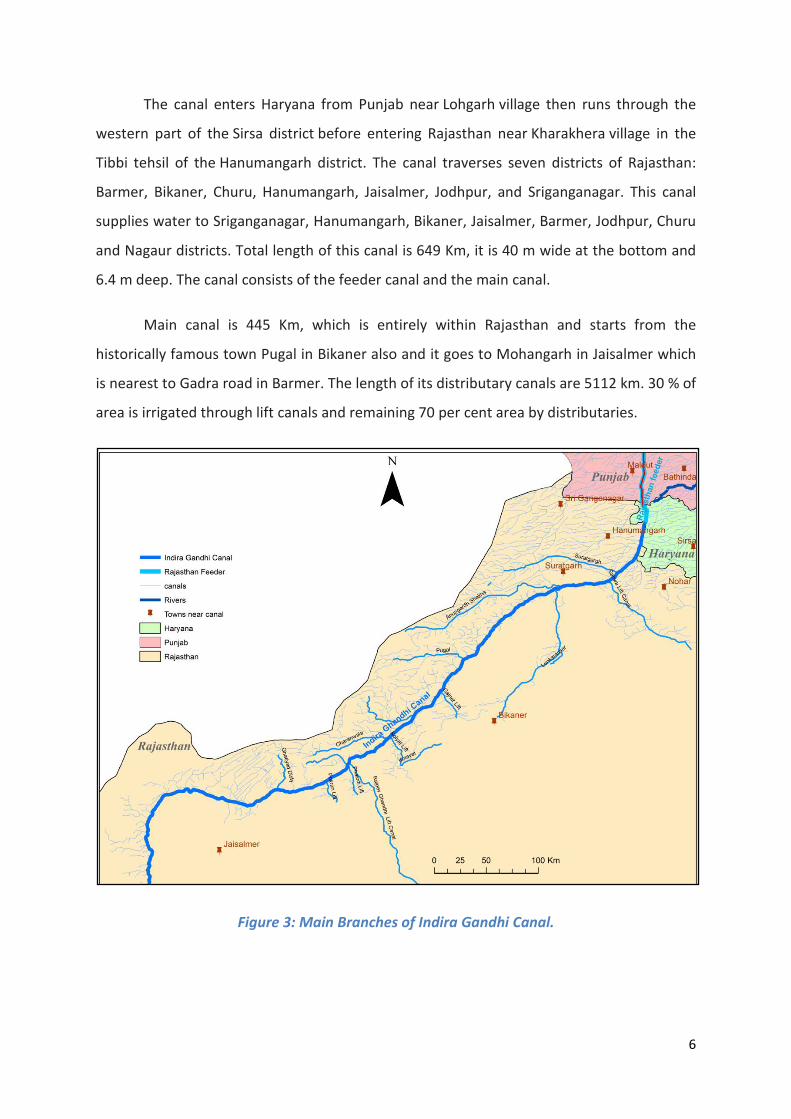
The canal enters Haryana from Punjab near Lohgarh village then runs through the
western part of the Sirsa district before entering Rajasthan near Kharakhera village in the
Tibbi tehsil of the Hanumangarh district. The canal traverses seven districts of Rajasthan:
Barmer, Bikaner, Churu, Hanumangarh, Jaisalmer, Jodhpur, and Sriganganagar. This canal
supplies water to Sriganganagar, Hanumangarh, Bikaner, Jaisalmer, Barmer, Jodhpur, Churu
and Nagaur districts. Total length of this canal is 649 Km, it is 40 m wide at the bottom and
6.4 m deep. The canal consists of the feeder canal and the main canal.
Main canal is 445 Km, which is entirely within Rajasthan and starts from the
historically famous town Pugal in Bikaner also and it goes to Mohangarh in Jaisalmer which
is nearest to Gadra road in Barmer. The length of its distributary canals are 5112 km. 30 % of
area is irrigated through lift canals and remaining 70 per cent area by distributaries.
Figure 3: Main Branches of Indira Gandhi Canal.

7
Main branch canals
1. Rawatsar branch (Hanumangarh)
2. Suratgarh branch (Sriganganagar)
3. Anupgarh branch (Sriganganagar)
4. Pugal branch (Bikaner)
5. Charanwala branch (Bikaner)
6. Dantor branch (Bikaner)
7. Birsalpur branch (Bikaner)
8. Shahid Birbal branch (Jaisalmer)
9. Sagarmal Gopa branch (Jaisalmer)
Since the extension of the Thar Desert is towards the west, therefore, lift canals are
also built to supply its water to the east of Rajasthan. Besides chief branch canals, lift canals
are also made, which are:
Lift canal
1. Gandheli (Nohar) Sahwa lift canal (Hanumangarh)
2. Lunkaransar lift canal(Bikaner)
3. Gajner lift canal (Bikaner)
4. Bangrasar lift canal (Bikaner)
5. Kolayat lift canal (Bikaner)
6. Phalodi lift canal (Jodhpur)
7. Pokaran lift canal (Jaisalmer)
8
Rajasthan Feeder and Sirhind Feeder
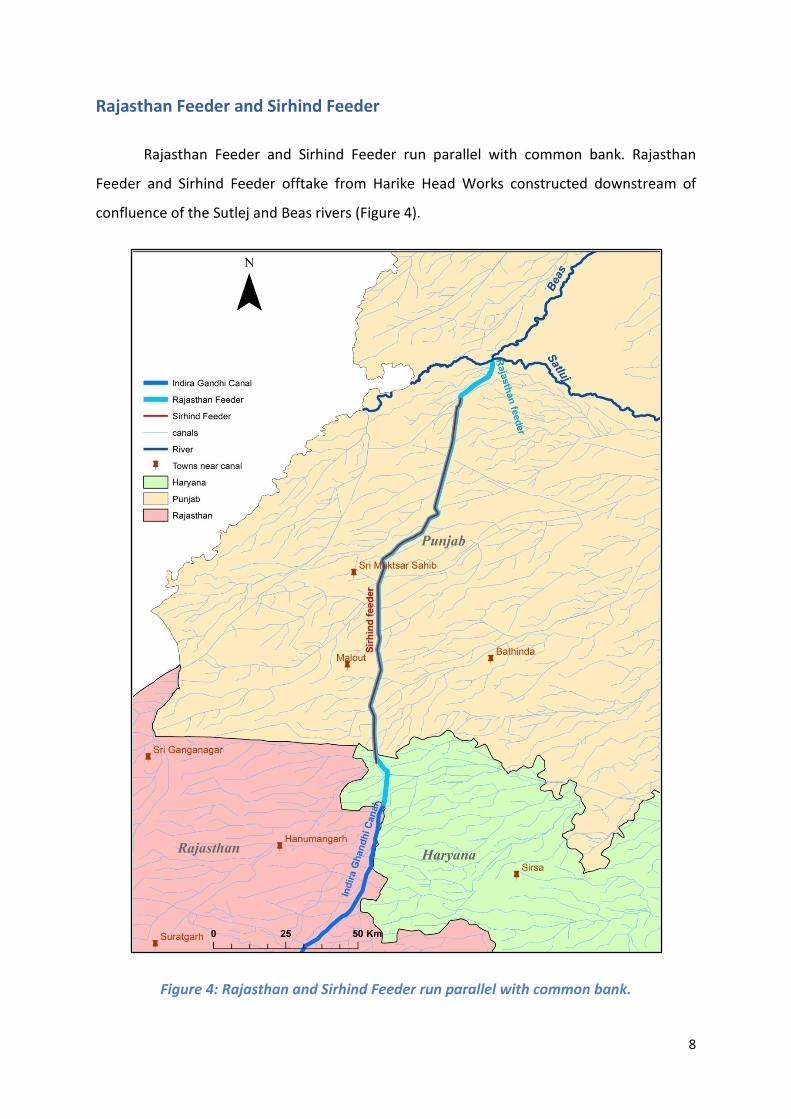
Rajasthan Feeder and Sirhind Feeder run parallel with common bank. Rajasthan
Feeder and Sirhind Feeder offtake from Harike Head Works constructed downstream of
confluence of the Sutlej and Beas rivers (Figure 4).
Figure 4: Rajasthan and Sirhind Feeder run parallel with common bank.

9
The Bhakra Dam on Satluj and Pong Dam on Beas are situated upstream of Harike
Head works. Sirhind feeder is an important feeder canal off taking from Harike Headworks
with 5264 cusecs capacity and having command area in Punjab. The Rajasthan Feeder which
carries Ravi-Beas waters exclusively for Rajasthan off- takes from Harike Headworks. It has a
capacity of 18500 cusecs. However, the head regulator of the canal has a capacity of 15000
cusecs which is sufficient for supplying allocated quantum of Ravi Beas waters to Rajasthan.
Rajasthan Feeder is exclusively meant for providing water to Indira Gandhi Nahar
Project serving the command lying in the territory of Rajasthan State and is lifeline of
Western Rajasthan. The feeder canal starts from Harike barrage to the head of Masitawali
which is 204 km; first 167 Km lies in Punjab and Haryana state and a further 37 Km in
Rajasthan. The canal which was constructed in the year 1958-1961, runs in a length of
149.53 Km in Ferozepur, Muktsar and Faridkot districts of Punjab. The canal enters Haryana
from Punjab near Loh garh village then runs through the western part of the Sirsa district
before entering Rajasthan. Seven districts of Western Rajasthan are totally dependent on it
for drinking water. Major cities like Jodhpur, Bikaner, Jaisalmer, several towns & cities along
with major army cantonments situated along the canal are dependent on it for drinking
water. Besides it also supplies water to Power Plants at Surat garh, Ram garh etc.

10
Water Quality Standards
The physico - chemical parameters like pH, electrical conductance, Chloride,
Fluoride, Nitrate, Sulphate, Boron, Total hardness, Dissolved Oxygen and Bio-chemical
Oxygen demand are main constituents defining the quality of river water in surface water.
Presence of these parameters in river water beyond the permissible limit is considered as
polluted river water quality. CPCB has identified water quality requirements in terms of a
few chemical characteristics, known as primary water quality criteria (Table 2).
Further, Bureau of Indian Standards (BIS) known as Indian Standard Institute (ISI)
vide its document BIS 10500:2012 has recommended water quality standards for drinking
water (Table 3).

11
Table 2: Designated Best Uses of Water by CPCB
Designated Best Use
Class
Criteria
Drinking Water Source without
conventional treatment but after
disinfection
A
1.Total Coliforms Organism MPN/100 mL shall
be 50 or less
2. pH between 6.5 and 8.5
3. Dissolved Oxygen 6 mg/L or more
4. Biochemical Oxygen Demand 5 days 20 °C, 2
mg/L or less
Outdoor bathing (Organised) B
1.Total Coliforms Organism MPN/100 mL shall
be 500 or less
2. pH between 6.5 and 8.5
3. Dissolved Oxygen 5 mg/L or more
4. Biochemical Oxygen Demand 5 days 20 °C, 3
mg/L or less
Drinking water source after
conventional treatment and
disinfection
C
1. Total Coliforms Organism MPN/100 mL shall
be 5000 or less
2. pH between 6 and 9
3. Dissolved Oxygen 4 mg/L or more
4. Biochemical Oxygen Demand 5 days 20 °C, 3
mg/L or less
Propagation of Wild life and
Fisheries D
1. pH between 6.5 and 8.5
2. Dissolved Oxygen 4 mg/L or more
3. Free Ammonia (as N) 1.2 mg/L or less
Irrigation, Industrial Cooling,
Controlled Waste disposal E
1. pH between 6.0 and 8.5
2. Electrical Conductivity at 25 °C micro
mhos/cm, maximum 2250
3. Sodium absorption Ratio Max. 26
4. Boron Max. 2 mg/L
Below-E Not meeting any of the A, B, C, D & E criteria

12
Table 3: Drinking Water Quality Standards, BIS: 10500, 2012*
S. No. Characteristic Requirement
(Acceptable Limit )
Permissible limit in the absence of Alternate
source Essential Characteristics
1 Colour, Hazen units, Max 5 15 2 Odour Agreeable Agreeable 3 Taste Agreeable Agreeable 4 Turbidity NTU, Max 1 5 5 pH Value 6.5 -8.5 No relaxation 6 Total Hardness (as CaCO3) mg/L, Max. 200 600 7 Iron (as Fe), mg/L, Max 0.3 No relaxation 8 Chlorides (as Cl), mg/L, Max 250 1000
9 Residual free chlorine, mg/L, Minimum 0.2 1.0
Desirable Characteristics 10 Total Dissolved solids, mg/L, Max 500 2000 11 Calcium (as Ca) mg/L, Max. 75 200 12 Magnesium (as Mg) mg/L, Max 30 100 13 Copper (as Cu), mg/L, Max 0.05 1.5 14 Manganese (as Mn) mg/L, Max 0.1 0.3 15 Sulphates (as SO4), mg/L, Max 200 400 16 Nitrate (as NO3) mg/L, Max. 45 No relaxation 17 Fluorides (as F), mg/L, Max 1 1.5 18 Ammonia (as total ammonia-N) mg/L 0.5 No relaxation 19 Mercury (as Hg), mg/L, Max 0.001 No relaxation 20 Cadmium (as Cd), mg/L, Max 0.003 No relaxation 21 Selenium (as Se), mg/L, Max 0.01 No relaxation 22 Total Arsenic (as As), mg/L, Max 0.01 No relaxation 23 Cyanides (as CN), mg/L, Max 0.05 No relaxation 24 Lead (as Pb), mg/L, Max 0.01 No relaxation 25 Zinc (as Zn), mg/L, Max 5 15 26 Total Chromium (as Cr), mg/L, Max 0.05 No relaxation 27 Total Alkalinity mg/L, Max 200 600 28 Aluminum (as Al) mg/L, Max 0.03 0.2 29 Boron mg/L, Max 0.5 1.0 30 Mineral oil, mg/L, Max 0.5
31
Poly Nuclear Aromatic Hydrocarbons, PAH’s, mg/L, Max
0.0001 No relaxation
32 Anionic detergents (as MBAS), mg/L, Max 0.2 1
33 Total Coliform Shall not be detected in any 100 of sample
36 Phenolic Compounds, mg/L, Max 0.001 0.002
* Limits have been given for specific parameters only as per Drinking Water Quality Standards, BIS: 10500, 2012.
13
Water Quality Monitoring
Sampling Locations
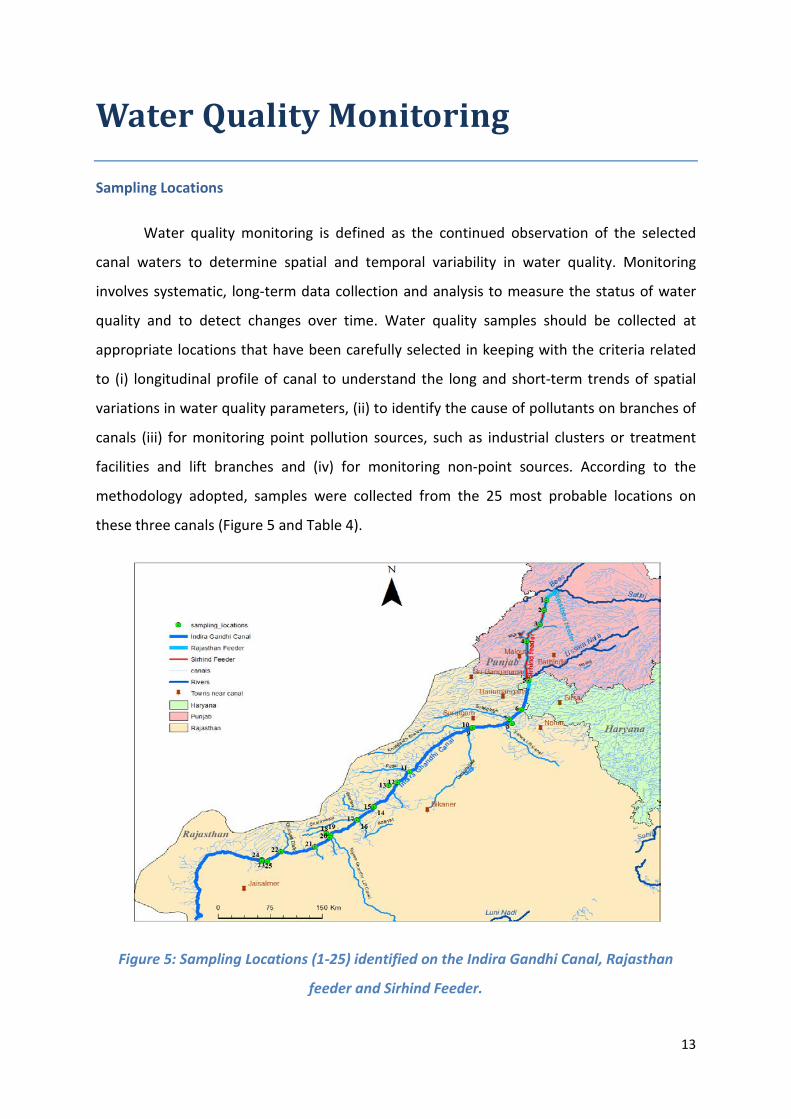
Water quality monitoring is defined as the continued observation of the selected
canal waters to determine spatial and temporal variability in water quality. Monitoring
involves systematic, long-term data collection and analysis to measure the status of water
quality and to detect changes over time. Water quality samples should be collected at
appropriate locations that have been carefully selected in keeping with the criteria related
to (i) longitudinal profile of canal to understand the long and short-term trends of spatial
variations in water quality parameters, (ii) to identify the cause of pollutants on branches of
canals (iii) for monitoring point pollution sources, such as industrial clusters or treatment
facilities and lift branches and (iv) for monitoring non-point sources. According to the
methodology adopted, samples were collected from the 25 most probable locations on
these three canals (Figure 5 and Table 4).
Figure 5: Sampling Locations (1-25) identified on the Indira Gandhi Canal, Rajasthan
feeder and Sirhind Feeder.
14
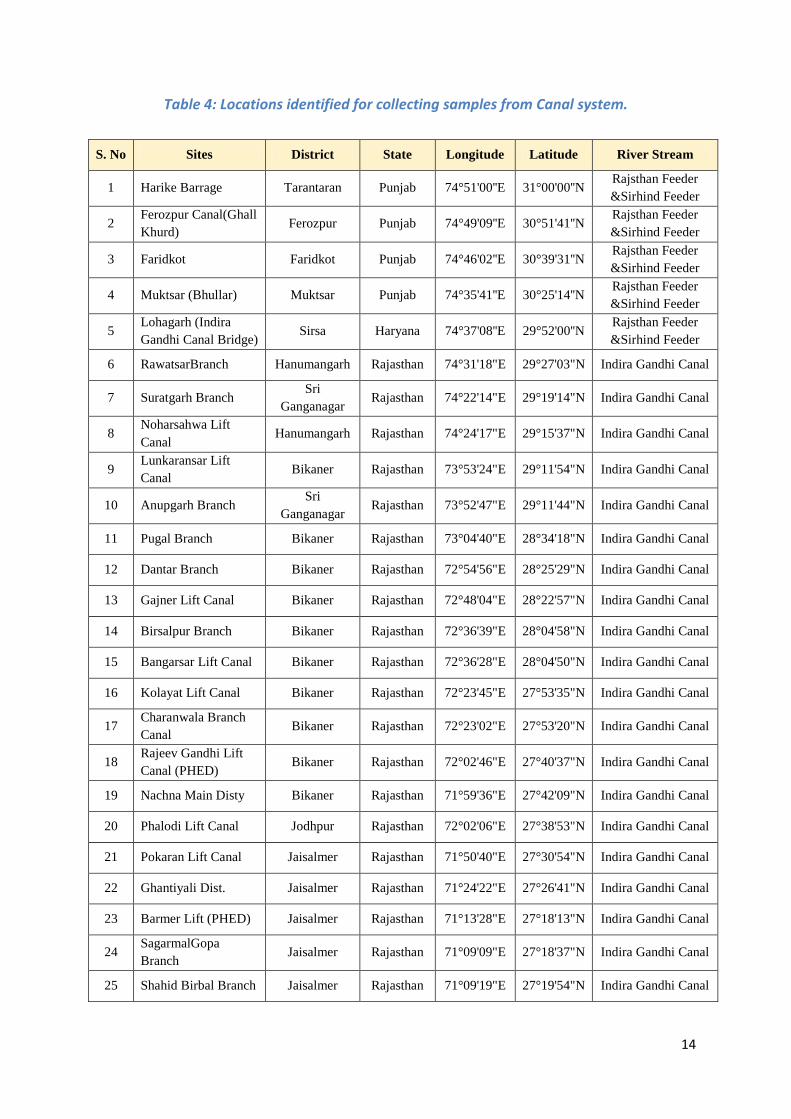
Table 4: Locations identified for collecting samples from Canal system.
S. No Sites District State Longitude Latitude River Stream
1 Harike Barrage Tarantaran Punjab 74°51'00''E 31°00'00''N Rajsthan Feeder &Sirhind Feeder
2 Ferozpur Canal(Ghall Khurd)
Ferozpur Punjab 74°49'09''E 30°51'41''N Rajsthan Feeder &Sirhind Feeder
3 Faridkot Faridkot Punjab 74°46'02''E 30°39'31''N Rajsthan Feeder &Sirhind Feeder
4 Muktsar (Bhullar) Muktsar Punjab 74°35'41''E 30°25'14''N Rajsthan Feeder &Sirhind Feeder
5 Lohagarh (Indira Gandhi Canal Bridge)
Sirsa Haryana 74°37'08''E 29°52'00''N Rajsthan Feeder &Sirhind Feeder
6 RawatsarBranch Hanumangarh Rajasthan 74°31'18"E 29°27'03"N Indira Gandhi Canal
7 Suratgarh Branch Sri
Ganganagar Rajasthan 74°22'14"E 29°19'14"N Indira Gandhi Canal
8 Noharsahwa Lift Canal
Hanumangarh Rajasthan 74°24'17"E 29°15'37"N Indira Gandhi Canal
9 Lunkaransar Lift Canal
Bikaner Rajasthan 73°53'24"E 29°11'54"N Indira Gandhi Canal
10 Anupgarh Branch Sri
Ganganagar Rajasthan 73°52'47"E 29°11'44"N Indira Gandhi Canal
11 Pugal Branch Bikaner Rajasthan 73°04'40"E 28°34'18"N Indira Gandhi Canal
12 Dantar Branch Bikaner Rajasthan 72°54'56"E 28°25'29"N Indira Gandhi Canal
13 Gajner Lift Canal Bikaner Rajasthan 72°48'04"E 28°22'57"N Indira Gandhi Canal
14 Birsalpur Branch Bikaner Rajasthan 72°36'39"E 28°04'58"N Indira Gandhi Canal
15 Bangarsar Lift Canal Bikaner Rajasthan 72°36'28"E 28°04'50"N Indira Gandhi Canal
16 Kolayat Lift Canal Bikaner Rajasthan 72°23'45"E 27°53'35"N Indira Gandhi Canal
17 Charanwala Branch Canal
Bikaner Rajasthan 72°23'02"E 27°53'20"N Indira Gandhi Canal
18 Rajeev Gandhi Lift Canal (PHED)
Bikaner Rajasthan 72°02'46"E 27°40'37"N Indira Gandhi Canal
19 Nachna Main Disty Bikaner Rajasthan 71°59'36"E 27°42'09"N Indira Gandhi Canal
20 Phalodi Lift Canal Jodhpur Rajasthan 72°02'06"E 27°38'53"N Indira Gandhi Canal
21 Pokaran Lift Canal Jaisalmer Rajasthan 71°50'40"E 27°30'54"N Indira Gandhi Canal
22 Ghantiyali Dist. Jaisalmer Rajasthan 71°24'22"E 27°26'41"N Indira Gandhi Canal
23 Barmer Lift (PHED) Jaisalmer Rajasthan 71°13'28"E 27°18'13"N Indira Gandhi Canal
24 SagarmalGopa Branch
Jaisalmer Rajasthan 71°09'09"E 27°18'37"N Indira Gandhi Canal
25 Shahid Birbal Branch Jaisalmer Rajasthan 71°09'19"E 27°19'54"N Indira Gandhi Canal

15
Field Survey
1. Sample Collection and analysis at Harike Barrage, Tarantaran by IBO Team
2. Sample Collection at Indira Gandhi Canal Bridge, Abubshahar by IBO Team

16
3. Sample Collection and analysis at Rawatsar branch, Hanumangarh by YBO Team
4. Sample Collection and analysis at Charan wala Branch Canal, Bikaner by YBO Team

17
5. Sample Collection and analysis at Pugal and Dantor Branch, Bikaner by YBO Team

18
6. Sample Collection and analysis at Sahid Birbal Branch and Sagarmal Gopa Branch Canal,
Jaisalmer by YBO Team

19
Analysis and Observations
Samples from Punjab were sent to Chenab Divisional Water Quality Laboratory, IBO,
CWC, Jammu and from Rajasthan to National River Water Quality Laboratory, YBO, CWC,
New Delhi as per standard guidelines given at http://cwc.gov.in/sites/default/files/water-
quality-activities-cwc.pdf.
Figure 6: Laboratory analysis of samples received from Canals.
Detailed discussions on various parameters of water are given as under:

20
1. pH
pH measurement is the determination of the activity of hydrogen ions in aqueous
solution. pH value in Canal varied between 7.43 and 8.29 during the study period. The
average value of pH is 7.97. All values are found within the prescribed limit (6.5-8.5) given
by CPCB standards for Designated Best Use (Figure 7).
Figure 7: pH variation in Canal Water
2. ELECTRICAL CONDUCTIVITY (EC)
Electrical conductivity is the measure of the ability of a solution to conduct an electric
current and is sometimes referred as “specific conductance”. This EC is due to the cations
and anions in the solution. EC depends on the ionic strength of the water. As per CPCB
standards for Designated Best Use, prescribed limit of conductivity is 2250 μS/cm for Class E
- Irrigation/Agriculture purpose.
The Conductance varied from maximum 300.8 μS/cm at sampling station Barmer lift
canal to minimum 217 μS/cm at sampling station Harike Barrage (Figure 8).

21
Figure 8: Electrical Conductivity variation in Canal Water
3. TOTAL DISSOLVED SOLIDS (TDS)
Sudden increase in the content of TDS can often indicate pollution by an extraneous
source. Harmful hazardous and lethal heavy metals are also found in the form of dissolved
solids. The Indian Standard standards i.e BIS 10500:2012 has recommended the TDS value
for Drinking water as upto 500 mg/L.
During the period of the study, the average values of TDS observed within the
permissible limits which are depicted in figure 9.
Figure 9: Total Dissolved Solids variation in Canal Water

22
4. DISSOLVED OXYGEN (DO)
The dissolved oxygen (DO) content plays an important role in supporting aquatic life
in running water and is susceptible to environmental changes. The presence of DO is
essential to maintain the higher forms of biological life and to keep proper balance of
various populations thus making the water bodies healthy. As per the CPCB standards for
Designated Best Use, the limit of DO for Class B – outdoor bathing is 5 mg/L. During the
study period, the average value of DO was observed 6.54 mg/L and all the water samples of
canal water are within the permissible limit (Figure 10).
Figure 10: Dissolved Oxygen variation in Canal Water
5. BIO-CHEMICAL OXYGEN DEMAND (BOD)
BOD is an environmentally significant parameter. The measurement of BOD is done
to assess pollution loads in aquatic environments. It indicates the strength of domestic and
industrial contamination in an aquatic environment. As per CPCB standards for Designated
Best Use, the limit of BOD for Class B– out door bathing is 3 mg/L. During the period of the
study, the average value of BOD observed was 2.83 mg/L in the Canal Water. BOD has
highest value of 3.82 mg/L at Pugal Branch of Indira Gandhi Canal and the lowest value at
Indira Gandhi Canal Bridge (1.50 mg/L) (Figure 11).

23
Figure 11: Bio-Chemical Oxygen Demand variation in Canal Water
6. MAJOR CATIONS & ANIONS
The most abundant cations present in water are calcium (Ca+2), magnesium (Mg+2),
sodium (Na+), and potassium (K+); the most abundant anions are bicarbonate (HCO3-),
chloride (Cl-), and sulfate (SO4-2). All the major cations and anions are within the permissible
limit in Canal Water.
Major Cations:
• Sodium concentration in Canal Water varies from 2.90 mg/L to 11.10 mg/L, with an
average value of 5.71 mg/L.
• Potassium concentration in Canal Water varies from 0.8 mg/L to 3.25 mg/L, with an
average value of 1.88 mg/L.
• Calcium concentration in Canal Water varies from 15.05 mg/L to 32.85 mg/L, with an
average value of 22.62 mg/L.
• Magnesium concentration in Canal Water varies from 3.06 mg/L to 24.05 mg/L, with
an average value of 12.72 mg/L.

24
Major Anions:
• Chloride concentration in Canal Water varies from 3.58 mg/L to 18.05 mg/L, with an
average value of 8.12 mg/L.
• The primary source of carbonate and bicarbonate ions water is the dissolved carbon
dioxide in rainwater. Bicarbonate concentration in Canal Water varies from 63.00
mg/L to 145.27 mg/L, with an average value of 99.16 mg/L.
• Sulphate concentration in Canal Water varies from 23.63 mg/L to 50.94 mg/L, with an
average value of 30.69 mg/L.
• Fluoride concentration in Canal Water varies from 0.09 mg/L to 0.29 mg/L, with an
average value of 0.16 mg/L
• Nitrate concentration in Canal Water varies from 1.22 mg/L to 2.95 mg/L, with an
average value of 1.9 mg/L
• The observed results of the nitrite, phosphate and Silicate at all sampling stations
were well within the limit prescribed by BIS 10500:2012 for drinking water.
7. TOTAL COLIFORM AND FECAL COLIFORM
Microorganisms are a valuable parameter of water quality in relation to drinking
water quality. Since most of the common disease, such as typhoid, cholera, dysentery,
infectious hepatitis, etc., affect the gastrointestinal tract, faeces of the affected persons
contain large number of the causative agents of the diseases. According to the CPCB
standards for Designated Best Use, the limit of Total Coliform organisms for Class B – out
door bathing is 500 MPN/100 mL. Total Coliform has highest value of 35000 MPN/100 mL at
Birsalpur Branch of Indira Gandhi Canal and the lowest value at Nachna Main Disty (4600
MPN/100 mL). Average value of Total Coliform in canal waters is 13476 MPN/100 mL (Figure
12). Fecal Coliform has highest value of 4000 MPN/100 mL at Charanwala Branch and the
lowest value of 450 MPN/100 mL at Sagarmal Gopal Branch of Indira Gandhi Canal (Figure
13). However, from bacteriological point of view as per BIS 10500:2012 for drinking water,
coliform count should not be present in 100 mL and more importantly the absence of fecal
coliform should be there.

25
Figure 12: Total Coliform variation in Canal Water
Figure 13: Fecal Coliform variation in Canal Water

26
8. HEAVY METALS
Aquatic ecosystem is the ultimate recipient of almost everything including heavy
metals. Pollution of heavy metals in aquatic environment is a growing problem worldwide
and currently it has reached an alarming rate. They are present at much lower
concentrations in waters compared to major ions. Some heavy metals, such as Cu and Zn
are necessary in trace amounts for the functioning of biological systems. Contamination of
heavy metals in the environment is of high concern because of their toxicity and threat to
human life and environment. All the metals (arsenic, chromium, cadmium, copper, iron,
nickel, lead and zinc) concentrations were found within the permissible limit of BIS 10500:
2012 for the Canal water samples (Table 5).

27
Table 5: Heavy Metals concentration in Canal water samples
Arsenic Cadmium Chromium Copper Iron Lead Nickel Zinc
10 3 50 50 300 10 20 5000
1 Harike Barrage BDL 0.038 5.89 3.98 16.57 2.49 7.11 6.254
2 Ferozpur Canal 0.08 0.024 3.87 6.14 23.64 1.35 4.69 3.654
3 Faridkot 0.21 0.024 2.68 0.88 36.49 0.89 3.54 12.598
4 Muktsar (Bhullar) 0.11 0.019 4.67 2.58 25.48 1.68 2.58 2.654
5 Indira Gandhi Canal Bridge BDL 0.014 1.69 6.48 20.18 0.65 6.58 8.984
6 Rawatsar Branch BDL 0.054 4.67 1.69 33.08 0.32 1.28 2.658
7 Suratgarh Branch 0.05 BDL 4.98 2.64 42.02 2.48 8.97 6.2987
8 Nohar sahwa Lift Canal BDL 0.017 6.54 2.58 29.07 1.65 4.98 4.985
9 Lunkaransar Lift Canal 0.09 0.024 5.43 1.65 16.25 0.68 0.68 13.658
10 Anupgarh Branch 0.18 BDL 7.84 3.47 53.04 1.69 0.59 1.658
11 Pugal Branch 0.04 0.017 0.88 5.97 13.58 0.24 0.34 14.689
12 Dantar Branch 0.72 0.024 0.96 6.54 14.67 0.39 1.26 8.647
13 Gajner Lift Canal BDL 0.036 2.79 2.89 19.54 0.27 5.24 2.689
14 Birsalpur Branch BDL 0.018 1.68 6.78 16.58 0.66 3.24 3.698
15 Bangarsar Lift Canal 0.54 0.024 0.87 8.47 17.52 1.23 6.28 1.258
16 Kolayat Lift Canal 0.19 0.029 1.35 7.48 36.14 1.65 6.28 2.654
17 Charanwala Branch Canal 0.54 0.028 9.14 2.69 20.45 2.48 3.57 7.894
18 Rajeev Gandhi Lift Canal 0.68 0.058 3.64 2.54 39.87 0.57 0.68 6.148
19 Nachna Main Disty 0.24 0.021 2.87 4.65 8.04 0.98 1.29 7.148
20 Phalodi Lift Canal 0.37 0.064 9.47 1.64 14.25 0.64 6.54 12.579
21 Pokaran Lift Canal 0.27 0.027 2.64 7.98 10.32 2.65 5.39 8.145
22 Ghantiyali Dist. BDL 0.057 1.58 0.52 8.67 1.25 3.25 3.258
23 Barmer Lift BDL BDL 1.69 4.98 16.54 0.65 1.65 12.569
24 Sagarmal Gopa Branch BDL 0.082 0.98 5.87 9.68 5.64 1.36 3.654
25 Shahid Birbal Branch 0.12 BDL 0.58 3.98 10.54 3.84 0.64 7.984
0.72 0.08 9.47 8.47 53.04 5.64 8.97 14.69
0.04 0.01 0.58 0.52 8.04 0.24 0.34 1.26
0.28 0.03 3.58 4.20 22.09 1.48 3.52 6.66
Min
Avg
S.No. Name of Siteµg/l
Water Quality Standards (BIS : 10500; 2012 )
Max

28
9. PESTICIDES
25 nos. of collected water samples from canals were extracted into 10 mL size at National
River Water Quality Laboratory (NRWQL), New Delhi and sent to Lower Cauvery Water Quality
Laboratory (LCWQL), Southern Rivers Division, Coimbatore and get analyzed through Gas
Chromatography technique.
From the Analysis results obtained for Samples of S. No. 1 to 12 as given in table 4, it was
found that there are no considerable peaks for constituents of pesticides. Further, from the Analysis
results obtained for Samples of S. No. 13 to 25, it was found that there are no prominent peaks
detected for pesticides except for Endosulfan (Beta) which suggests that trace quantities of
Endosulphan (Beta) may be present.
It is worth to note that, to confirm the results, sensitivity and correctness of the instrument
on which the analysis is carried out, the analysis has been done also from the South India Textile
Research Association (SITRA) chemical laboratory, Coimbatore, for the samples from S. No. 1 to 10.
The results from SITRA Chemical Laboratory also confirmed that there was no presence of
detectable pesticides.
From the analysis results of Pesticides for canal water samples, it has been observed that
pesticide concentrations were found to be Below Detection Limit (BDL).

29
Table 6: Suitability of Canal Water as per CPCB standards for Designated Best Use and BIS:
10500: 2012.
* Majorly, the unsuitability of canal water samples as per CPCB standards for Designated
Best use is due to the presence of Total Coliform & BOD.
** The Canal Water Samples were analysed for physical and chemical parameters like pH,
TDS, Major Cations, Major Anions etc. and bacteriological parameters like Coliform (Total
Coliform ad Fecal Coliform). Majorly, the unsuitability of canal water samples as per Drinking
Water Standards BIS: 10500:2012 is due to presence of Coliform.
Class-A Class-B Class-C Class-D Class-E1 Harike Barrage 2 Ferozpur Canal 3 Faridkot 4 Muktsar (Bhullar) 5 Indira Gandhi Canal Bridge 6 Rawatsar Branch 7 Suratgarh Branch 8 Nohar sahwa Lift Canal 9 Lunkaransar Lift Canal
10 Anupgarh Branch 11 Pugal Branch 12 Dantar Branch 13 Gajner Lift Canal 14 Birsalpur Branch 15 Bangarsar Lift Canal 16 Kolayat Lift Canal 17 Charanwala Branch Canal 18 Rajeev Gandhi Lift Canal 19 Nachna Main Disty 20 Phalodi Lift Canal 21 Pokaran Lift Canal 22 Ghantiyali Dist. 23 Barmer Lift 24 Sagarmal Gopal Branch 25 Shahid Birbal Branch
Suitability as per CPCB Standards for Designated Best Use Suitability as per BIS: 10500 : 2012**S.No. Name of Site

30
Conclusions
Total 25 water samples were collected and analysed from various sampling locations
covering the entire Indira Gandhi, Rajasthan feeder and Sirhind feeder canals. Analysis
results of these samples show that -
• Water samples from Canals were found within the acceptable limit with respect to
almost all the water quality parameters e.g. pH, Electrical Conductivity (EC), Total
Dissolved Solids (TDS), Dissolved Oxygen (DO), Major Cations (Na+, K+, Mg+2, Ca+2)
and Major Anions (Cl-, F-, NO3-, SO4
-2)
• Out of 25, for 12 samples, BOD was found to be beyond the limits for Class A, B & C.
Out of remaining 13 samples, 5 samples were within limits for Class A also. CPCB
limit for Designated Best Use with respect to BOD for Class A is 2 mg/L and for Class
B & Class C is 3 mg/L. Maximum BOD observed was 3.82 mg/L and Minimum
observed was 1.50 mg/L. The details thereof given at Annexure-III.
• CPCB limit for Designated Best Use with respect to Total Coliform for Class C is 5000
MPN/100 mL. Only 4 samples were found meeting this criterion. Presence of Total
Coliform and Fecal Coliform in Canal water indicate the contamination from human
& animal wastes from leaching animal manure, improperly treated septic and
sewage discharge.
• Water samples from Canals were found within the acceptable limit with respect to
all the heavy metals e.g. arsenic, chromium, cadmium, copper, iron, nickel, lead and
zinc indicating the absence of industrial pollution in the canal system.
• The results of Pesticide analysis of the canal water samples were found to be Below
Detection Limit.

31
Annexure-I
List of Water Quality Laboratories in CWC
S. No. Location of laboratory Level of Laboratory Organization
1 National River Water Quality Laboratory, New Delhi III YBO, New Delhi
2 Lower Cauvery Water Quality Laboratory, Coimbatore III CSRO, Coimbatore
3 Upper and Middle Ganga Water Quality Laboratory, Varanasi III LGBO, Patna
4 Krishna and Godavari River Water Quality, Hyderabad III KGBO, Hyderabad
5 Upper Cauvery Water Quality Laboratory, Bangalore II MSO, Bangalore
6 South Western Flowing Rivers Water Quality Laboratory, Kochi II CSRO, Coimbatore
7 Upper Krishna Division Water Quality Laboratory, Pune II KGBO, Hyderabad
8 Mahi Division Water Quality Laboratory, Gandhinagar II MTBO, Gandhinagar
9 Lower Yamuna Water Quality Laboratory, Agra II YBO, New Delhi
10 Eastern Rivers Water Quality Laboratory, Bhubaneswar II MERO, Bhubaneswar
11 Hydrology Division, Chennai II CSRO, Coimbatore
12 Wainganga Division, Nagpur II MCO, Nagpur
13 Middle Brahmaputra Division, Guwahati III BBBO, Shillong
14 Lower Brahmaputra Division, Jalpaiguri II T&BDBO, Kolkata
15 Upper Brahmaputra Division, Dibrugarh II BBBO, Shillong
16 Chenab Division, Jammu II IBO, Chandigarh
17 Lower Ganga Division, Berhampore II T&BDBO, Kolkata
18 Middle Ganga Division -V, Patna II LGBO, Patna
19 Mahanadi Division, Raipur II MERO, Bhubaneswar
20 Narmada Division, Bhopal II NBO, Bhopal
21 Tapi Division, Surat II NTBO, Gangdinagar
22 Himalayan Ganga Division, Dehradun II UGBO, Lucknow
23 Middle Ganga Division -I, Lucknow II UGBO, Lucknow


32
Annexure-II
List of Water Quality parameters analysed by CWC in Level-I, II and III laboratories
S. No Level-1 Level-II Level-III
1 Temperature Temperature Temperature 2 Color Color Color 3 Odour Odour Odour 4 pH pH pH
5 Electrical Conductivity Electrical Conductivity Electrical Conductivity
6 Dissolved Oxygen Dissolved Oxygen (DO) Dissolved Oxygen (DO) 7 Turbidity Turbidity 8 Biochemical Oxygen Demand (BOD) Biochemical Oxygen Demand (BOD) 9
Chemical Oxygen Demand (COD) Chemical Oxygen Demand (COD)
10
Total Dissolved Solids (TDS) Total Dissolved Solids (TDS) 11 Sodium Sodium 12 Calcium Calcium 13 Magnesium Magnesium 14 Potassium Potassium 15 Carbonate Carbonate 16 Bicarbonate Bicarbonate 17 Chloride Chloride 18 Sulphate Sulphate 19 Fluoride Fluoride 20 Boron Boron 21 Ammonia (Nitrogen) Ammonia (Nitrogen) 22 Nitrate + Nitrite Nitrate + Nitrite 23 Phosphate Phosphate 24 Total Coliform Total Coliform 25 F. Coliform F. Coliform 26 Arsenic 27 Cadmium 28 Chromium 29 Copper 30 Iron 31 Lead 32 Nickel 33 Mercury 34 Zinc
35 AlphaBenzenehexachloride(BHC), Beta BHC, Gama BHC (Lindane)
36
OP-Dichlorodiphenyltrichloroethane(OP DDT), PP-DDT
37 Alpha Endosulphan, Beta Endosulphan,
38 Aldrin, Dieldrin, 39 Carbaryl (Carbamate), 40 Malathian, Methyl Parathian, 41 Anilophos, Chloropyriphos


33
Annexure-III
BOD Analysis Results of Canal Water sampling locations as per CPCB standards for
Designated Best Use S.
No Sites District State River_Stream BOD Within
limits as per CPCB *
1 Harike Barrage Tarantaran Punjab Rajsthan Feeder & Sirhind Feeder 2.50 Class B & C
2 Ferozpur Canal Ferozpur Punjab Rajsthan Feeder & Sirhind Feeder 2.50 Class B & C
3 Faridkot Faridkot Punjab Rajsthan Feeder & Sirhind Feeder 1.90 Class A, B & C
4 Muktsar (Bhullar) Muktsar Punjab Rajsthan Feeder & Sirhind Feeder 3.80 **
5 Indira Gandhi Canal Bridge Sirsa Haryana Rajsthan Feeder &
Sirhind Feeder 1.50 Class A, B & C
6 Rawatsar Branch Hanumangarh Rajasthan Indira Gandhi Canal 3.58 ** 7 Suratgarh Branch Sri Ganganagar Rajasthan Indira Gandhi Canal 3.54 **
8 Nohar sahwa Lift Canal Hanumangarh Rajasthan Indira Gandhi Canal 2.87 Class B & C
9 Lunkaransar Lift Canal Bikaner Rajasthan Indira Gandhi Canal 3.50 **
10 Anupgarh Branch Sri Ganganagar Rajasthan Indira Gandhi Canal 2.91 Class B & C 11 Pugal Branch Bikaner Rajasthan Indira Gandhi Canal 3.82 ** 12 Dantar Branch Bikaner Rajasthan Indira Gandhi Canal 1.99 Class A, B & C 13 Gajner Lift Canal Bikaner Rajasthan Indira Gandhi Canal 1.91 Class A, B & C 14 Birsalpur Branch Bikaner Rajasthan Indira Gandhi Canal 3.10 ** 15 Bangarsar Lift Canal Bikaner Rajasthan Indira Gandhi Canal 3.26 ** 16 Kolayat Lift Canall Bikaner Rajasthan Indira Gandhi Canal 3.42 **
17 Charanwala Branch Canal Bikaner Rajasthan Indira Gandhi Canal 3.38 **
18 Rajeev Gandhi Lift Canal Bikaner Rajasthan Indira Gandhi Canal 3.54 **
19 Nachna Main Disty Bikaner Rajasthan Indira Gandhi Canal 2.35 Class B & C 20 Phalodi Lift Canal Jodhpur Rajasthan Indira Gandhi Canal 3.26 ** 21 Pokaran Lift Canal Jaisalmer Rajasthan Indira Gandhi Canal 1.87 Class A, B & C 22 Ghantiyali Dist. Jaisalmer Rajasthan Indira Gandhi Canal 3.66 ** 23 Barmer Lift Jaisalmer Rajasthan Indira Gandhi Canal 2.15 Class B & C
24 Sagarmal Gopal Branch Jaisalmer Rajasthan Indira Gandhi Canal 2.43 Class B & C
25 Shahid Birbal Branch Jaisalmer Rajasthan Indira Gandhi Canal 2.11 Class B & C
* BOD Limits for Class A, B & C only specified in CPCB standards for Designated Best Use.
** For D and E class, there is no limit specified for BOD.


a
CONTRIBUTION
Sampling and Field Survey
Sh Aditya Sarin, Assistant Research Officer, NRWQL, UYD, CWC, New Delhi
Sh Rajesh Kumar, Assistant Research Officer, NRWQL, UYD, CWC, New Delhi
Dr. Nirmal Kumar Bhuyan, Assistant Research Officer, IBRWQL, Chenab Division, CWC, Jammu
Sh Ashutosh Tripathi, Senior Research Assistant, NRWQL, UYD, CWC, New Delhi
Sh Nitish Kumar Singh, Senior Research Assistant, NRWQL, UYD, CWC, New Delhi
Sh Angad Kumar, Senior Research Assistant, IBRWQL, Chenab Division, CWC, Jammu
Sh Vivekanand Parasar, JE, CD, Jaipur
Sh Mahendra Meena, JE, CD, Jaipur
Sh Kuldeep Singh, JE, UYD New Delhi
Sh Sunil Negi, JE, UYD New Delhi
Sh Sajjan Singh, SWA, Chambal Division, Jaipur
Sh Munesh Meena, SWA, Chambal Division, Jaipur
Sh Shivcharan Meena, SWA, Chambal Division, Jaipur
Sh Chanda Ram, SWA, Chambal Division, Jaipur
Sh Kishori Lal, H’Dman, M&A Dte, CWC, Chandigarh
Sh Maghar Lal, WS-II, Chenab Division, CWC, Jammu
Analysis
Sh Aditya Sarin, Assistant Research Officer, NRWQL, UYD, CWC, New Delhi
Sh Rajesh Kumar, Assistant Research Officer, NRWQL, UYD, CWC, New Delhi
Dr. Nirmal Kumar Bhuyan, Assistant Research Officer, IBRWQL, Chenab Division, CWC, Jammu
Smt. L. Priyadharsini, Assistant Research Officer, LCWQL, SRD, CWC, Coimbatore
Sh Ashutosh Tripathi, Senior Research Assistant, NRWQL, UYD, CWC, New Delhi
Sh Nitish Kumar Singh, Senior Research Assistant, NRWQL, UYD, CWC, New Delhi
Sh Maneesh TP, Senior Research Assistant, LCWQL, SRD, CWC, Coimbatore


b
Sh Angad Kumar, Senior Research Assistant, IBRWQL, Chenab Division, CWC, Jammu
Sh Burri Jagadeesh Yadav, Senior Research Assistant, LCWQL, SRD, CWC, Coimbatore
Sh Srikanth Reddy Alla, Senior Research Assistant, LCWQL, SRD, CWC, Coimbatore
Smt Srujana Radha, Senior Research Assistant, LCWQL, SRD, CWC, Coimbatore
PREPARED BY
Dr. Sakshi Sharma, Senior Research Assistant, RDC-2 Directorate, CWC, New Delhi
GUIDANCE
Sh R.K. Jain, Chairman, CWC, New Delhi
Sh R.K. Sinha, Member (River Management), CWC, New Delhi
Sh Reading Shimray, Chief Engineer, Planning & Development, CWC, New Delhi
Sh Shivanandan Kumar, Chief Engineer, IBO, CWC, Chandigarh
Sh G. K. Aggarwal, Chief Engineer, YBO, CWC, New Delhi
Sh. N. M. Krishnaunni, Chief Engineer, CSRO, CWC, Coimbatore
Sh Vineet Gupta, Superintending Engineer (C), IBO, CWC, Chandigarh
Sh H. S. Senger, Superintending Engineer, HOC, Vaishali, YBO, CWC, New Delhi
Sh Amit Ranjan, Superintending Engineer (C), CSRO, Coimbatore
Sh Mohan Murali V, Superintending Engineer, CSRC, Bangaluru
Sh S. K. Sharma, Director M&A, CWC, Chandigarh
Sh S. D. Sharma, Director M&A, CWC, Jaipur
Sh Pankaj Kumar Sharma, Director RDC-2 Directorate, CWC, New Delhi
Sh Rakesh Kumar Gupta, Dy. Director, RDC-2 Directorate, CWC, New Delhi
Sh Satish Jain, Executive Engineer, Chenab Division, Jammu
Sh Shobhit Mishra, Executive Engineer, UYD, CWC, Delhi
Sh Ramdas Meena, Executive Engineer, Chabal division, CWC, Jaipur
Sh S. Rajendran, Executive Engineer, Southern Rivers Division, CWC, Coimbatore
Sh Vivek Kumar Singh, Dy. Director, M&A, CWC, Jaipur


c