government incentives and comparative advantage of the...
TRANSCRIPT
Pertanika J. Soc. Sci. & Hum. 3(2): 173-179 (1995) ISSN: 0128-7702© Universiti Pertanian Malaysia Press
Government Incentives and Comparative Advantage ofthe Sheep Industry in Malaysia
ZAINALABIDIN MOHAMED, EDDIE CHIEW FOOK CHONGand MAD NASIR SHAMSUDIN
Faculty of Economics and ManagementUniversiti Pertanian Malaysia
43400 UPM Serdang, Selangor Darul Ehsan, Malaysia
Keywords: sheep, comparative advantage, domestic resource cost, nominal protection rates,effective protection rates
ABSTRAK
Kajian ini mengira kadar perlindungan dan faedah bandingan pengeluaran bebiri dari sudut persepektifpenggantian import. Pada keseluruhannya, penemuan kajian ini mendapati pengeluaran bebiri di Malaysiamendapat perlindungan sebagaimana yang ditunjukkan oleh nilai NPR. Harga tempatan adalah 32% lebihtinggi daripada harga dunia. Nilai EPR pula menunjukkan bahawa pengeluaran beberi mempunyai galakan.Dari segi faedah bandingan, didapati hanya ladang yang bersaiz > 75 bilangan ternakan mempunyai faedahbandingan yang tipis. Ini menunjukkan bahawa pengeluaran beberi secara kecilan tidak viable dari segiekomomi dan sosial.
ABSTRACT
This slUdy computes the protection rates and comparative advantage of sheep production from an importsubstitution perspective. The results show that, in general, sheep production in Malaysia is moderatelyprotected as shown by the tpR. Domestic price is about 32% above the world price. The value of ETr, onthe other hand, indicates that there is an overall net incentive in sheep production. In terms of comparativeadvantage, this implies that with a small herd size, sheep production is not viable economically and socially.
INTRODUCTION
The agricultural sector continues to playa majorrole in the Malaysian economy through itscontribution to GDP, foreign exchange earningsand employment. In 1988, its contribution wasabout 21.1 % to GDP, 22.1 % in total exports and31.3% in employment. The livestock industrycontributed about 3.5% to overall GDP in 1988and its contribution to the agricultural sectorincreased from 16.27% in 1988 to 19.47% in1991. The main components of the livestockindustry were pigmeat, poultry and eggs, whichcomprised about 90% of total livestockproduction. The others were beef, mutton, milk,hide and offal. The small ruminant (sheep andgoat) subsector plays a minor role in the livestockindustry. For the last three decades, theconsumption of mutton has shown an increasingtrend, while local production has shown adownward trend. The self-sufficiency level also
shows a downward trend. It was at 38% in 1960and declined to 25% in 1970. In 1993 the selfsufficiency level was approximately 10% with90% of the mutton being imported in order tomeet the demand. In 1993 the value of importswas approximately RM30 million. Althoughmutton is less popular than beef and poultrymeats, it is acceptable to all races in Malaysiaand about 72% of the population in PeninsularMalaysia consume mutton (HOA 1992).Production remains essentially a subsistenceactivity with herd sizes ranging from 2 to 20.There are few large sheep/goat production units.The future of the sheep industry appears brightwith the current interest shown by the plantationsector. In recent years, research and fieldexperience have shown that sheep rearing underimmature oil palm and rubber is technicallyfeasible (Wan Mohamed et at. 1988; Mohamadet at. 1990). The plantation sector, with its large
Zainalabidin Mohamed, Ed<;lie Chiew Fook Chong and Mad Nasir Shamsudin
financial resources, is more likely to makeheadway in commercial mutton production.The development of the sheep industry in thiscountry will not only significantly increasemutton production but will also provide analternative income-generating activity forsmallholders, thus furthering the diversificationof agriculture production. The integration ofsheep with plantation crops will reduce the useof weedicides. Research and field trials haveshown that the cost of weeding can be reducedby 15-25% (Zakaria 1990). Thus theparticipation of private componies, such asGuthrie, Sime Darby, and Golden Hope willspeed up mutton production in Malaysia.
Tke Livestock Industry
The objectives of the Malaysian livestock policyare: (i) to encourage local production of meatto reduce dependence on imports, (ii) to saveand foreign exchange, (iii) to provideemployment, (iv) to ensure consumers a stablemeat supply at affordable prices, and (v) enhancethe nutritional adequacy of diets in the ruralareas. With the introduction of the NewEconomic Policy (NEP) in 1970, livestockprogrammes in the ruminant subsector becamea means to increase farm income and thus reducethe incidence of poverty. With' the aboveobjectives, the livestock policy was started as animport substitution strategy. Governmentintervention has contributed significantly to the
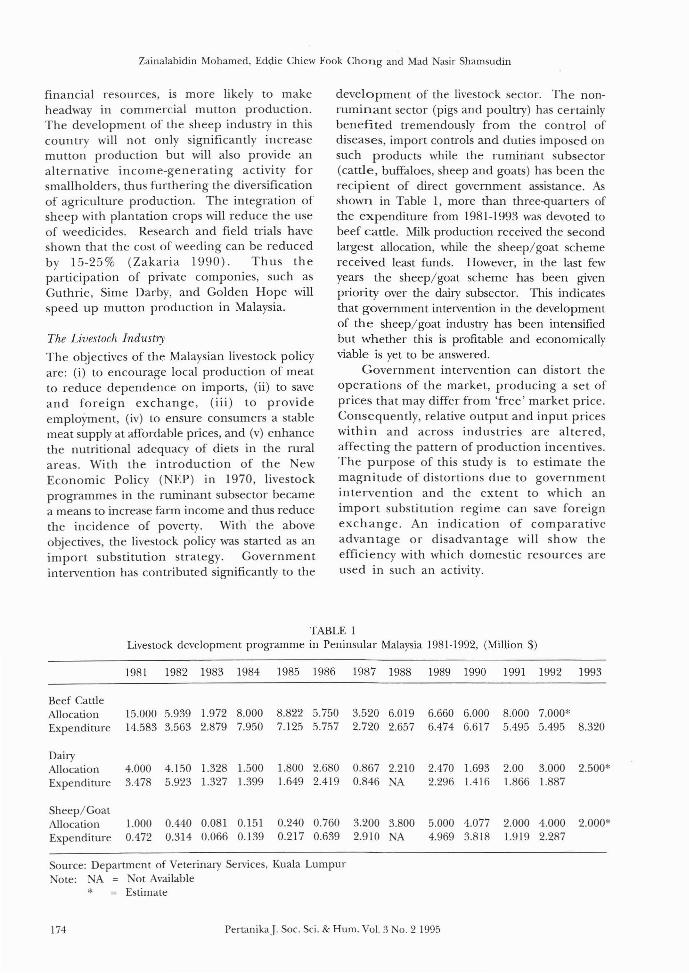
development of the livestock sector. The nonruminant sector (pigs and poultry) has certainlybenefited tremendously from the control ofdiseases, import controls and duties imposed onsuch products while the ruminant subsector(cattle, buffaloes, sheep and goats) has been therecipient of direct government assistance. Asshown in Table 1, more than three-quarters ofthe expenditure from 1981-1993 was devoted to
beef cattle. Milk production received the secondlargest allocation, while the sheep/goat schemereceived least funds. However, in the last fewyears the sheep/goat scheme has been givenpriority over the dairy subsector. This indicatesthat government intervention in the developmentof the sheep/goat industry has been intensifiedbut whether this is profitable and economicallyviable is yet to be answered.
Government intervention can distort theoperations of the market, producing a set ofprices that may differ from 'free' market price.Consequently, relative output and input priceswithin and across industries are altered,affecting the pattern of production incentives.The purpose of this study is to estimate themagnitude of distortions due to governmentintervention and the extent to which animport substitution regime can save foreignexchange. An indication of comparativeadvantage or disadvantage will show theefficiency with which domestic resources areused in such an activity.
TABLE 1Livestock development programme in Peninsular Malaysia 1981-1992, (Million $)
1981 1982 1983 1984 1985 1986 1987 1988 1989 1990 1991 1992 1993
Beef CattleAllocation 15.000 5.939 1.972 8.000 8.822 5.750 3.520 6.019 6.660 6.000 8.000 7.000*Expenditure 14.583 3.563 2.879 7.950 7.125 5.757 2.720 2.657 6.474 6.617 5.495 5.495 8.320
DairyAllocation 4.000 4.150 1.328 1.500 1.800 2.680 0.867 2.210 2.470 1.693 2.00 3.000 2.500*Expenditure 3.478 5.923 1.327 1.399 1.649 2.419 0.846 NA 2.296 1.416 1.866 1.887
Sheep/GoatAllocation 1.000 0.440 0.081 0.151 0.240 0.760 3.200 3.800 5.000 4.077 2.000 4.000 2.000*Expenditure 0.472 0.314 0.066 0.139 0.217 0.639 2.910 NA 4.969 3.818 1.919 2.287
Source: Department of Veterinary Services, Kuala LumpurNote: NA Not Available
* = Estimate
174 PertanikaJ. Soc. Sci. & Hum. Vol. 3 No.2 1995
Goverment Incentives and Comparative Advantage of the Sheep Industry in Malaysia
METHODOLOGY
Nominal and Effective Protection Rates
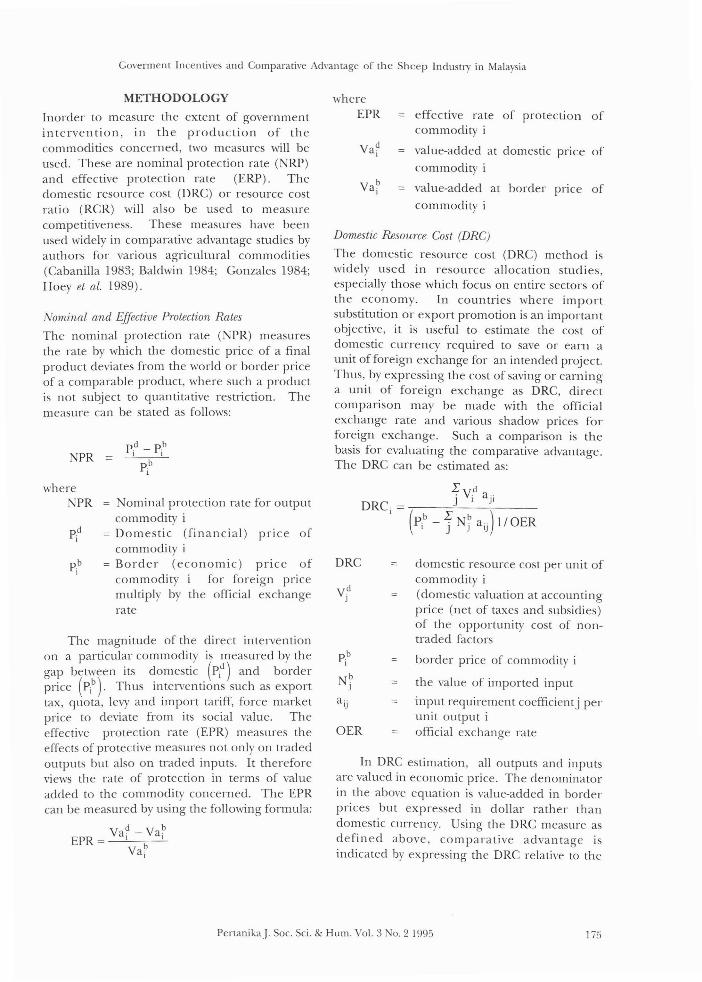
The nominal protection rate (NPR) measuresthe rate by which the domestic price of a finalproduct deviates from the world or border priceof a comparable product, where such a productis not subject to quantitative restriction. Themeasure can be stated as follows:
Inorder to measure the exten t of governmentintervention, in the production of thecommodities concerned, two measures will beused. These are nominal protection rate (NRP)and effective protection rate (ERP). Thedomestic resource cost (DRC) or resource costratio (RCR) will also be used to measurecompetitiveness. These measures have beenused widely in comparative advantage studies byauthors for various agricultural commodities(Cabanilla 1983; Baldwin 1984; Gonzales 1984;Hoey et al. 1989).
domestic resource cost per unit ofcommodity i(domestic valuation at accountingprice (net of taxes and subsidies)of the opportunity cost of nontraded factors
border price of commodity i
the value of imported input
input requirement coefficientj perunit output iofficial exchange rateOER
DRC
commodity i
.r d
J' Vi a ji
DRC = ~--=,,---.,..--
J (pb _I; N b a) I/OER1 J J IJ
In DRC estimation, all outputs and inputsare valued in economic price. The denominatorin the above equation is value-added in borderprices but expressed in dollar rather thandomestic currency. Using the DRC measure asdefined above, comparative advantage isindicated by expressing the DRC relative to the
Domestic ResouTCe Cost (DRC)
The domestic resource cost (DRC) method iswidely used in resource allocation studies,especially those which focus on entire sectors ofthe economy. In countries where importsubstitution or export promotion is an importantobjective, it is useful to estimate the cost ofdomestic currency required to save or earn aunit of foreign exchange for an intended project.Thus, by expressing the cost of saving or earninga unit of foreign exchange as DRC, directcomparison may be made with the officialexchange rate and various shadow prices forforeign exchange. Such a comparison is thebasis for evaluating the comparative advantage.The DRC can be estimated as:
whereEPR effective rate of protection of
commodity i
Va? value-added at domestic price ofcommodity i
Va b value-added at border price of1
pd _ ph1 J
phJ
Nominal protection rate for outputcommodity iDomestic (financial) price ofcommodity iBorder (economic) price ofcommodity for foreign pricemultiply by the official exchangerate
NPR
phJ
pd1
whereNPR
The magnitude of the direct interventionon a particular commodity is measured by thegap between its domestic (pn and borderprice (pn. Thus interventions such as exporttax, quota, levy and import tariff, force marketprice to deviate from its social value. Theeffective protection rate (EPR) measures theeffects of protective measures not only on tradedoutputs but also on traded inputs. It thereforeviews the rate of protection in terms of valueadded to the commodity concerned. The EPRcan be measured by using the following formula:
Va d- Va b
EPR = 1 J
Va?
Penanikaj. Soc. Sci. & Hum. Vol. 3 No.2 1995 175
Zainalabidin Mohamed, Eddie Chiew Fook Chong and Mad Nasir Shamsudin
shadow exchange rate (SER). This must be orsame bageks foot not be.! This ratio is alsoknown as the resource cost ratio (RCR). Hence,the economic activity can be determined whetherit has comparative advantage for the country,depending on the ratio of DRC/SER. Thus if:
DRC(i) < 1 denotes comparative
SER advantage
DRC
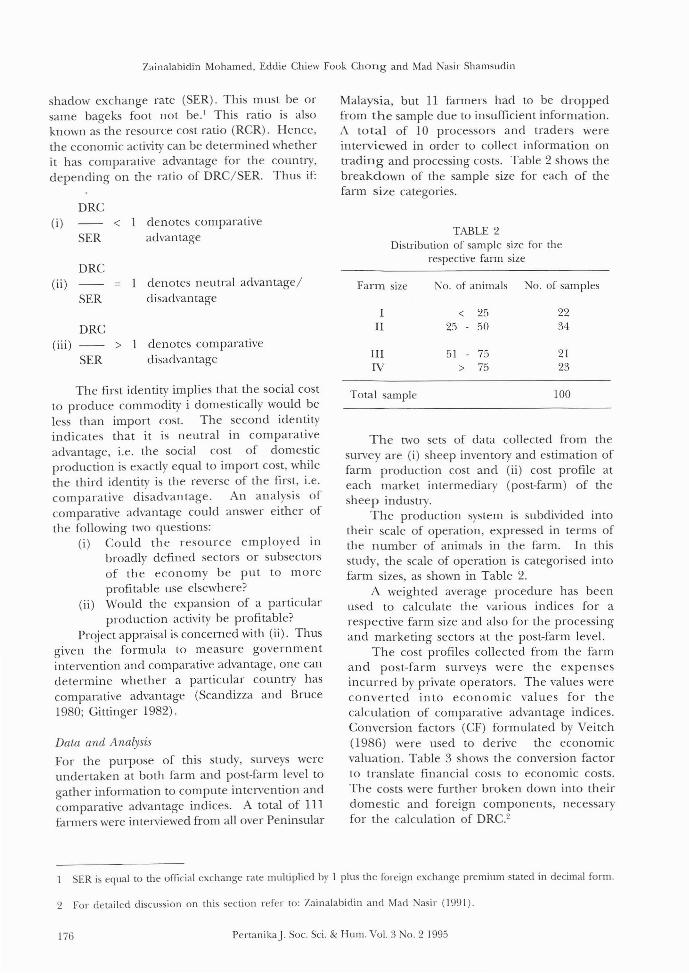
Malaysia, but 11 farmers had to be droppedfrom the sample due to insufficient information.A total of 10 processors and traders wereinterviewed in order to collect information ontrading and processing costs. Table 2 shows thebreakdown of the sample size for each of thefarm size categories.
TABLE 2Distribution of sample size for the
respective farm size
DRC(iii) > 1 denotes comparative
SER disadvantage
Data and Analysis
For the purpose of this study, surveys wereundertaken at both farm and post-farm level togather information to compute intervention andcomparative advantage indices. A total of IIIfarmers were interviewed from all over Peninsular
The first identity implies that the social costto produce commodity i domestically would beless than import cost. The second identityindicates that it is neutral in comparativeadvantage, i.e. the social cost of domesticproduction is exactly equal to import cost, whilethe third identity is the reverse of the first, i.e.comparative disadvantage. An analysis ofcomparative advantage could answer either ofthe following two questions:
(i) Could the resource em ployed 111
broadly defined sectors or subsectorsof the economy be put to moreprofitable use elsewhere?
(ii) Would the expansion of a particularproduction activity be profitable?
Project appraisal is concerned with (ii). Thusgiven the formula to measure governmentintervention and comparative advantage, one candeterm ine whether a particular country hascomparative advantage (Scandizza and Bruce1980; Gittinger 1982).
(i i)SER
1 denotes neutral advantage/disadvantage
Farm size No. of animals No. of samples
I < 25 22II 25 50 34
III 51 75 21IV > 75 23
Total sample 100
The two sets of data collected from thesurvey are (i) sheep inventory and estimation offarm production cost and (ii) cost profile ateach market intermediary (post-farm) of thesheep industry.
The production system is subdivided intotheir scale of operation, expressed in terms ofthe number of animals in the farm. In thisstudy, the scale of operation is categorised intofarm sizes, as shown in Table 2.
A weighted average procedure has beenused to calculate the various indices for arespective farm size and also for the processingand marketing sectors at the post-farm level.
The cost profiles collected from the farmand post-farm surveys were the expensesincurred by private operators. The values wereconverted into economic values for thecalculation of comparative advantage indices.Conversion factors (CF) formulated by Veitch(1986) were used to derive the economicvaluation. Table 3 shows the conversion factorto translate financial costs to economic costs.The costs were further broken down into theirdomestic and foreign components, necessaryfor the calculation of DRC.2
SER is equal to the official exchange rate multiplied by 1 plus the foreign exchange premium stated in decimal form.
2 For derailed discussion on this section refer to: Zainalabidin and Mad Nasir (1991).
176 PertanikaJ. Soc. Sci. & Hum. Vol. 3 No.2 1995

Goverment Incentives and Comparative Advantage of the Sheep Industry in Malaysia
TABLE 3Conversion factor' from financial to
economic values
RESULTS AND DISCUSSION
Protection Rates
The impact of market inteJ\lention policies onproduction is captured by the two measures,NRP and EPR. A comparison of the obseJ\leddomestic price with the border related pricereveals the impact of the policy which causes adivergence between the two prices. A positiveNPR implies that protection is given to domesticproducers, while a negative value indicates apenalty or tax is imposed on producers.
The values of NPR and EPR are shown in
Table 4. The NPR, which measures the differencebetween the domestic and border related pricesexpressed as a percentage of the related price,shows that the domestic price was about 32%above the world price. Although there is nodirect inteJ\lention by the government on the
rate of duty for both import and export of sheepand its by-products there is, however, an implicitquota that has been set by government as animport permit is required. This permit specifiesthe amount of meat that can be imported. Thussheep production in Malaysia is moderately
protected.A limitation of NPR is that it measures only
the effects of inteJ\lention on the price of thelivestock products. It does not measure theeffects of inteJ\lention on the tradable inputsthat go into sheep production. The EPR makes
up for the deficiency in the NPR by capturingthe extent to which policies in the productmarket cause value-added4 to differ from what itwould be in the absence of such policies. The
Item
Intermediate InputFeedMVSO.88Repair & MaintenanceWaterElectricityFuel & OilLivestock PurchaseOffice SuppliesTaxLicence
Primary InputLabourDepreciation:
BuildingEquipmentTransportation
Interest:BuildingEquipmentLivestockTransportationWorking CapitalLand Rent
Losses
Source: Veitch 1986.
Conversion Factor
0.95
0.780.750.840.880.950.90
0.82
0.860.900.70
1.301.301.301.301.301.001.00
3 The method of project appraisal involves the movement from a private or financial appraisal to an economic orsocial appraisal. In financial appraisal, costs and benefits are identified and valued solely from the point of viewof their impact solely on the project's private profitability. But the impact of the project may be much wider thanthis, and may have repercussions on the economy in various ways. The incorporation of these wider effects involvean economic or social appraisal. The parameters required for an economic appraisal comprise a set of shadowor accounting prices (AP), which replace conventional market prices (MP) in the appraisal. Thus, a comparisonof cost structure at MP with that at AP provides what is called the CONVERSION FACTOR (CF), which may beapplied to convert market values to accounting values. The system of appraisal used by Veitch for Malaysia isbased on Little-Mirrlees methodology with world prices as the numeraire, hence, CF by definition can beexpressed as follows (Veitch 1986):
CF = AP/MP
4 Value added is measured by the difference between the value of the output of the particular firm and the value ofall inputs purchased from outside the firm. Thus, the value of output minus the value of externally purchased inputis equal to value added (Gittinger 1982). Since the value added is a residual concept, clearly what is purchased,and hence the value added of any commodity, will vary according to the time period being considered and the levelof analysis (ScandizZQ and Bruce (1980)).
PenanikaJ. Soc. Sci. & Hum. Vol. 3 No.2 1995 177

Zainalabidin Mohamed, Eddie Chiew Fook Chong and Mad Nasir Shamsudin
TABLE 4Nominal and effective protection rates
Border Value of Value ofFarm Domestic Related Tradable Input Value-added NPR EPR
Price Price Financial Economic Financial Economic
I 12.36 9.35 2.67 2.58 9.69 6.77 32.19 43.13II 12.36 9.35 2.68 2.47 9.68 6.88 32.19 40.70III 12.36 9.35 2.79 2.58 9.57 6.77 32.19 41.36IV 12.36 9.35 2.50 2.32 9.86 7.03 32.19 40.26
Note: NPR ~
EPR ~
Nominal Protection RatesEffective Protection Rates
EPR is thus an indicator of the net incentive ordisincentive effects of all commodity policiesaffecting production costs. The values of EPRindicate that there is an overall net incentive insheep production where the values show thatvalue-added is at least 40% more than what itwould have been in the absence of protection.
The comparative advantage of sheepproduction in terms of import substitutionstrategy is measured by the resource cost ratio(RCR) and domestic resource cost (DRC). Thecomputation of RCR and DRC detailed in Table5. The values of RCR and DRC indicate thatonly Farm IV has marginal comparative advantagein sheep production. The results illustrate thatas the farm size becomes larger, it tends to havecomparative advantage. The values of DRC inFarms I, II and III indicate that the social cost ofproducing 1 kg of mutton domestically is morethan the import cost. Thus, DRC computed atRM6.94, RM3.08 and RM2.94 for farms I, II and11I respectively exceeded the official exchangerate of RM2.70. For Farm IV, the domesticresource cost is about equal to import cost.
Since the RCR values (i.e. DRC/OER)indicate that Farms I, II and III have nocomparative advantage, sensitivity analysis isapplied to determine the parity price for theRCR to be equal to 1. The sensitivity analysis,shown in Table 5, indicates that the cif pricehas to be increased to around RMll.70 inFarm 1, RMI0.20 in Farm II and RM 9.84 inFarm III for sheep production to havecomparative advantage. This represents anincrease of around 7.0 - 28.0% above prevailing
output prices.
Table 5Comparative advantage indicators
Farm Size II III IV
Rb 9.63 8.06 7.59 7.13Rf 0.13 0.13 0.13 0.13
Cif 9.20 9.20 9.20 9.20a 2.47 2.47 2.58 2.32e 0.20 0.20 0.20 0.20
RCR 2.57 I.l4 1.09 0.99DRC 6.94 3.08 2.94 2.67
Cif when RCR ~ 1 11.77 10.20 9.84 9.12
Note: Exchange rate RM2.70 ~ US$LOO
DRC RCR x OERRb domestic resource input to production and
marketingRf domestic components of transport costs
from port to wholesaleCif import pricea tradables costs component of production
and marketinge traded components of transport from port
to wholesale
CONCLUSION AND POLICY
IMPLICATIONS
This study attempted to measure the protectionrates and comparative advantage of sheepproduction because of the interest shown bypolicy-makers in the prospects of integratingsheep rearing with plantation crops to maximiseincome from agriculture. The analysis indicatesthat sheep production is moderately protectedand does not have comparative advantage exceptin farms with more than 75 animals. Thisimplies that, at the current level of production,
178 PertanikaJ. Soc. Sci. & Hum. Vol. 3 No.2 1995

Goverment Incentives and Comparative Advantage of the Sheep Indusny in Malaysia
i.e. small herd size, sheep production is not
economically or socially viable. Thus, ifeconomic efficiency is the main objective, sheep
production should not be continued except ona large scale as the social cost of a unit of local
mutton from small farms costs more than
imported mutton.Further research and development should
be continued, especially in large-scale breeding;
adapting the animals to local conditions; and
sheep rearing in the plantation sector. Malaysia
produces agro-industrial by-products and wastesin abundance which can be used for sheep
feed. Research and development should alsobe continued to overcome the current technical
constraints. At present only large-scale sheepproduction should be encouraged.
REFERENCES
BALDWIN, P. 1984. Domestic resource cost of riceproduction in West Malaysia. UnpublishedMaster's thesis, University of ew England.
G>\BANILLA, L.S. 1983. Economic analysis incentivesand comparative advantage in livestockindustry. Unpublished Ph.D. thesis UPLB.
GITIINGER, PJ. 1982. Economic Analysis ofAgriculturalProjects. Baltimore: John Hopkins Press.
GONZALES, L.A. 1984. Philippine agriculturaldiversification: a regional economiccomparative advan tage analysis. AsianDevelopment Bank Report.
HOEY, T.S., ZAINALABIDIN MOHA~1ED, MAD NASIRSHAMSUDIN and T.A. CHIEW 1989. Governmentincentives and comparative advantage inlivestock and feedstuffs sectors in Malaysia.Asian Development Bank Report.
MINISTRY OF AGRICULTURE. 1992. Livestock statistics.
MOHAMAD, N., W.E. WAN MOI-l'\lVIED and G.K. MQl-fDAZAM KHAN. 1990. Commercial sheepproduction under, rubber and oil palm crops:Development of Guthrie breed. In Workshop onIntegrated Tree O'opping and Small RuminantProduction System, Sept. 1990, Medan, Indonesia;p. 300-304.
SCAJ"\'DIZZO, P.L. and G BRUCE. 1980. Methodologiesfor measuring agricultural price interventionEffect. World Bank Staff Working Paper No. 3-4.
VEITCH, M.D. 1986. National parameters for projectappraisal in Malaysia. Regional EconomicsSection, Economic Planning Unit, PrimeMinister's Department.
WAN MOHAMED W.E., N. MOI-l-\MAD and A. ABDULRAH1vl-\N. 1988. Perspective and progress ofsheep industry at Kumpulan Guthrie. InProceedings of Symposium on Sheep Production inMalaysia. Nov. 1988, Kuala Lumpur 98-108.
ZAINALABlDIN MOHAMED and MAD NASIR SHAMSUDIN.1991. Economic assessment of sheep industryin Malaysia. PKDI Occasional paper no 14.
ZAKARJA KAMARUDIN 1990. Investment opportunitiesand incentives in livestock production. InConference on Malaysia Livestock IndustlY in the1990s organised by FLFAM and MMOA Coop.
(Received 4 FebnWl)' 1994)
PertanikaJ. Soc. Sci. & Hum. Vol. 3 No.2 1995 179