gordon geotechniques gordon geotechniques … a.pdf · gordon geotechniques pty ltd acn 127 420 839...
TRANSCRIPT

GORDON GEOTECHNIQUES PTY LTD ACN 127 420 839
262 Sunrise Drive, OCEAN VIEW, QLD 4521
Mobile: 0428 186 255 Ph/Fax: 07 3425 3720
Email: [email protected]
GORDON GEOTECHNIQUES
SUBSIDENCE PREDICTION REPORT FOR THE HAIL CREEK TRANSITION
PROJECT
Prepared for Rio Tinto Coal Australia Pty Ltd
MAY 2015

SUBSIDENCE PREDICTION REPORT FOR THE HAIL CREEK TRANSITION PROJECT
i
GORDON GEOTECHNIQUES
TABLE OF CONTENTS 1 INTRODUCTION ................................................................................................. 1
1.1 Background .................................................................................................. 1 1.2 Project Description ....................................................................................... 1 1.3 Longwall Mining Method and Layout ............................................................ 1 1.4 Topography and Drainage ............................................................................ 5 1.5 Scope of Work .............................................................................................. 7 1.6 Report Structure ........................................................................................... 7
2 ENGINEERING GEOLOGY ................................................................................ 8 2.1 Geological Data ............................................................................................ 8 2.2 Stratigraphy .................................................................................................. 9 2.3 Depth of Cover ............................................................................................. 9 2.4 Seam Thickness ......................................................................................... 11 2.5 Elphinstone to Hynds Seam Interburden Thickness ................................... 13 2.6 Seam Floor Levels ..................................................................................... 14 2.7 Weathering Thickness ................................................................................ 15 2.8 Geological Faults and Dykes ...................................................................... 17 2.9 Hydrogeology ............................................................................................. 18
3 SUBSIDENCE PREDICTION METHODOLOGY ............................................... 19 3.1 Introduction to Surface Deformation Prediction System (SDPS) ................ 19 3.2 Subsidence Behaviour ............................................................................... 20 3.3 Determination of the Influence Angle ......................................................... 22 3.4 Determination of the Panel Adjustment Factor ........................................... 22 3.5 Determination of Subsidence Factors ........................................................ 23
3.5.1 Single Seam ........................................................................................ 23 3.5.2 Dual Seam .......................................................................................... 24
3.6 Determination of the Strain Coefficient ....................................................... 26 3.7 Depth of Cover Adjustment ........................................................................ 26 3.8 Strata Compression .................................................................................... 30 3.9 Analysis of Massive Spanning Units ........................................................... 33
4 SUBSIDENCE PREDICTIONS .......................................................................... 34 4.1 Elphinstone Seam ...................................................................................... 34
4.1.1 Subsidence ......................................................................................... 34 4.1.2 Surface Strain ..................................................................................... 35 4.1.3 Tilts ..................................................................................................... 36 4.1.4 Cross Sections .................................................................................... 37
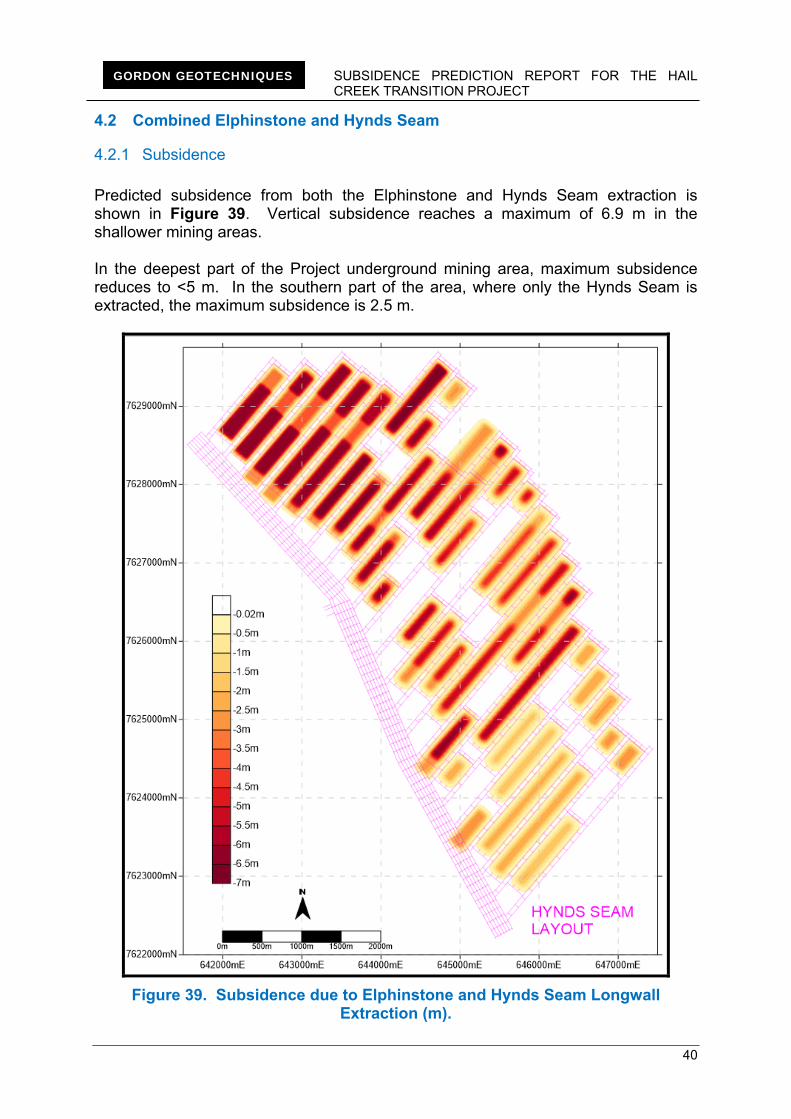
4.2 Combined Elphinstone and Hynds Seam ................................................... 40 4.2.1 Subsidence ......................................................................................... 40 4.2.2 Surface Strain ..................................................................................... 41 4.2.3 Tilts ..................................................................................................... 42 4.2.4 Cross Sections .................................................................................... 43
4.3 Limitations of the Subsidence Predictions .................................................. 44 5 SUBSIDENCE IMPACTS .................................................................................. 45
5.1 Surface Deformations ................................................................................. 45 5.2 Subsurface Subsidence Cracking .............................................................. 46
5.2.1 Background to Subsurface Subsidence Cracking ............................... 46 5.2.2 Prediction of Subsurface Subsidence Cracking Effects due to Single Seam Extraction ................................................................................................ 47

SUBSIDENCE PREDICTION REPORT FOR THE HAIL CREEK TRANSITION PROJECT
ii
GORDON GEOTECHNIQUES
5.2.3 Prediction of Subsurface Subsidence Cracking Effects due to Dual Seam Extraction ................................................................................................ 51 5.2.4 Comparative Assessment of Subsurface Subsidence Cracking Predictions for Single Seam Extraction ............................................................. 55 5.2.5 Conclusions ......................................................................................... 57
5.3 Surface Cracking ........................................................................................ 63 5.3.1 Tension Cracks ................................................................................... 63 5.3.2 Buckling and Heaving ......................................................................... 64 5.3.3 Remediation Measures for Surface Tension Cracks and Buckling ...... 65
5.4 Surface Drainage Effects ........................................................................... 66 5.5 Subsidence Monitoring Program ................................................................ 67
6 CONCLUSIONS ................................................................................................ 68 7 BIBLIOGRAPHY ................................................................................................ 70 8 GLOSSARY ....................................................................................................... 72 List of Figures Figure 1. Location Plan (RTCA, 2015). ...................................................................... 2 Figure 2. Open Cut and Underground Mining Areas (RTCA, 2015). ......................... 3 Figure 3. Underground Mine Plan. ............................................................................. 4 Figure 4. Proposed Mining Schedule. ........................................................................ 5 Figure 5. Topography and Drainage (RTCA, 2015). .................................................. 6 Figure 6. Location of Exploration Boreholes. ............................................................. 8 Figure 7. Stratigraphic Sequence (RTCA, 2015). ...................................................... 9 Figure 8. Elphinstone Seam Depth of Cover (m). .................................................... 10 Figure 9. Hynds Seam Depth of Cover (m). ............................................................. 11 Figure 10. Elphinstone Seam Thickness (m). .......................................................... 12 Figure 11. Hynds Seam Thickness (m). .................................................................. 13 Figure 12. Elphinstone to Hynds Seam Interburden Thickness (m). ........................ 14 Figure 13. 3D Surface of the Hynds Seam Structure Floor Levels (m ASL). ........... 15 Figure 14. Weathering Thickness (m). ..................................................................... 16 Figure 15. Surficial Deposits in the Existing Open Cut (October 2014). .................. 16 Figure 16. Location of Geological Faults and Hynds Seam Longwall Panels. ......... 17 Figure 17. Examples of Faults and Dykes Exposed in the Hail Creek Open Cut
(SCT, 2014b). .................................................................................................... 18 Figure 18. Effect of Panel Width (AusIMM, 2009). ................................................... 21 Figure 19. General Characterisation of a Subsidence Cross Line. .......................... 22 Figure 20. Elphinstone Seam Longwall Layout – Original Longwall Panels (red) and
Compensated Panels (blue). ............................................................................. 23 Figure 21. Empirical Curves for Sag Subsidence over Single Panels with Single
Seam Bowen Basin Data and Multi Seam Data. ............................................... 24 Figure 22. Interburden Thickness for Multi Seam Data Set. .................................... 26 Figure 23. Waste Rock Emplacement Landforms by Year 10. ................................ 27 Figure 24. Waste Rock Emplacement Landforms by Year 15. ................................ 27 Figure 25. Normalised Emplacement Height for a Waste Rock Density of 2 t/m3 and
an Overburden Density of 2.5 t/m3. ................................................................... 28 Figure 26. Adjusted Elphinstone Seam Depth of Cover (m). ................................... 29 Figure 27. Adjusted Hynds Seam Depth of Cover (m). ............................................ 30 Figure 28. Decrease in Chain Pillar Stability with Increasing Depth. ....................... 31 Figure 29. Predicted Extent of Yielding on the Hynds Seam Chain Pillars. ............. 32

SUBSIDENCE PREDICTION REPORT FOR THE HAIL CREEK TRANSITION PROJECT
iii
GORDON GEOTECHNIQUES
Figure 30. Compression of the Pillar, Roof and Floor. ............................................. 32 Figure 31. Gamma Response of the Elphinstone and Hynds Seam Overburden. ... 33 Figure 32. Subsidence due to Elphinstone Seam Longwall Extraction (m). ............ 34 Figure 33. Surface above the Project Underground Mining Area (Looking East from
the Existing Open Cut). ..................................................................................... 35 Figure 34. Strain due to Elphinstone Seam Longwall Extraction (m). ...................... 36 Figure 35. Tilt due to Elphinstone Seam Longwall Extraction (%). .......................... 37 Figure 36. Location of Cross Line 1 and Hail Creek. ............................................... 38 Figure 37. Subsidence, Strain and Tilt along Cross Line 1 after Elphinstone Seam
Extraction. ......................................................................................................... 39 Figure 38. Predicted Subsidence Depth and Channel Elevation for Hail Creek after
Extraction of the Elphinstone Seam. ................................................................. 39 Figure 39. Subsidence due to Elphinstone and Hynds Seam Longwall Extraction
(m). .................................................................................................................... 40 Figure 40. Strain due to Elphinstone and Hynds Seam Longwall Extraction (mm/m).
.......................................................................................................................... 41 Figure 41. Tilt due to Elphinstone and Hynds Seam Longwall Extraction (%). ........ 42 Figure 42. Subsidence, Strain and Tilt along Cross Line 1 after Extraction of both the
Elphinstone and Hynds Seams. ........................................................................ 43 Figure 43. Predicted Subsidence Depth and Channel Elevation for Hail Creek after
Extraction of both the Elphinstone and Hynds Seams. ...................................... 43 Figure 44. Cumulative Frequency Curves after Extraction of the Elphinstone Seam.
.......................................................................................................................... 45 Figure 45. Cumulative Frequency Curves after Extraction of both the Elphinstone
and Hynds Seams. ............................................................................................ 46 Figure 46. Hydrogeological Model for Cracking above Longwalls (Bai & Kendorski,
1995). ................................................................................................................ 48 Figure 47. Cumulative Vertical Conductivity – Single Seam Extraction at 200 m and
300 m Depth of Cover (SCT, 2014c). ................................................................ 49 Figure 48. Location of Microseismic Events above LW3 at the North Goonyella Mine
(Kelly and Gale, 1999). ...................................................................................... 50 Figure 49. Location of Microseismic Events around LW101 at Kestrel Mine (Kelly
and Gale, 1999). ................................................................................................ 51 Figure 50. Results of Physical Modelling of Dual Seam Subsidence (Ghabraie and
Ren, 2014). ........................................................................................................ 52 Figure 51. Displacement Profiles of Upper and Lower Seam Extraction (Ghabraie
and Ren, 2014). ................................................................................................. 53 Figure 52. Hydraulic Conductivity at 220 m Depth for Extraction of Both Seams
(SCT, 2014c). .................................................................................................... 54 Figure 53. Hydraulic Conductivity at 300 m Depth for Extraction of Both Seams
(SCT, 2014c). .................................................................................................... 55 Figure 54. Summary of Water Inflow Events. .......................................................... 56 Figure 55. Vertical Conductivity through a Numerical Model in the Oaky Creek
Mining Area (Gale, 2008). ................................................................................. 57 Figure 56. Potential Areas of Connective Cracking to the Surface – Single Seam
Extraction. ......................................................................................................... 61 Figure 57. Potential Areas of Connective Cracking to the Surface – Dual Seam
Extraction. ......................................................................................................... 62 Figure 58. Crack Width vs. Depth of Cover (reproduced from MSEC, 2007). ......... 63

SUBSIDENCE PREDICTION REPORT FOR THE HAIL CREEK TRANSITION PROJECT
iv
GORDON GEOTECHNIQUES
Figure 59. Examples of Subsidence Cracks. ........................................................... 64 Figure 60. Heaving and Buckling. ............................................................................ 65 Figure 61. Water Ponding over a Longwall Panel – Bowen Basin Longwall Mine. .. 66 List of Tables
Table 1. Selection of SDPS Parameters (IMC, 2011 and South Galilee EIS, 2012). 20 Table 2. Subsidence Parameters from Case Studies on Longwall Mining under
Existing Longwall Goaf (Li et al, 2010). ............................................................. 25 Table 3. Field Observations and Guidelines for the Height of Cracking. ................. 58 Table 4. Conceptual Model of the Subsurface Effects for Single Seam Extraction. . 59 Table 5. Conceptual Model of the Subsurface Effects for Dual Seam Extraction. ... 60

SUBSIDENCE PREDICTION REPORT FOR THE HAIL CREEK TRANSITION PROJECT
1
GORDON GEOTECHNIQUES
1 INTRODUCTION 1.1 Background
The Hail Creek Mine is an existing open cut mining operation located approximately 120 kilometres (km) southwest of Mackay and 35 km northwest of Nebo, within the Bowen Basin Coalfield in Central Queensland (Figure 1). Rio Tinto Coal Australia Pty Ltd (RTCA) proposes to extend open cut mining activities and develop an underground mining operation within Mining Lease (ML) 4738, herein referred to as the Hail Creek Transition Project (the Project). Gordon Geotechniques Pty Ltd (GGPL) was commissioned by RTCA to complete a subsidence assessment for the Project underground mining operation. This subsidence assessment forms part of an Environmental Amendment (EA) application to address information requests from the Department of Environment and Heritage Protection (DEHP). 1.2 Project Description The Project would involve the transition to open cut operation extensions and an underground mining operation. The Project underground mining operation would include longwall mining of both the Elphinstone and Hynds Seams to the east of the existing Hail Creek Mine open cut (Figure 2). 1.3 Longwall Mining Method and Layout The Project underground mine plan involves conventional single pass longwall extraction, with an extraction height up to 4.5 metres (m) in both the Elphinstone and Hynds Seams, with stacked longwall panels. The Elphinstone Seam is proposed to be accessed directly from the western open cut highwall and mined before the Hynds Seam (Figure 3). The Hynds Seam workings are proposed to be developed from access drifts driven from the Ramp 5 highwall. The layout of the Elphinstone and Hynds Seam longwall panels is constrained by both the western and proposed eastern open cut mining areas (Figure 2 and Figure 3). The longwall panels in both seams are designed at 250 m wide (rib to rib dimension) with two heading gateroads (Figure 3). The chain pillars between longwall panels in both seams are 50 m (solid dimension) wide, irrespective of the depth of cover. Development roadways are nominally 5.4 m wide and longwall panel lengths vary from 320 m up to 2650 m.

SUBSIDENCE PREDICTION REPORT FOR THE HAIL CREEK TRANSITION PROJECT
2
GORDON GEOTECHNIQUES
Figure 1. Location Plan (RTCA, 2015).

SUBSIDENCE PREDICTION REPORT FOR THE HAIL CREEK TRANSITION PROJECT
3
GORDON GEOTECHNIQUES
Figure 2. Open Cut and Underground Mining Areas (RTCA, 2015).

SUBSIDENCE PREDICTION REPORT FOR THE HAIL CREEK TRANSITION PROJECT
4
GORDON GEOTECHNIQUES
Figure 3. Underground Mine Plan.
The Elphinstone Seam longwalls will be mined sequentially from North to South, prior to mining of the underlying Hynds Seam (Figure 4). The constraints of the layout require that the longwalls in the Hynds Seam will initially be extracted to the north of the drifts and then continue southwards. Both seams are characterised by geological faulting, which requires a number of panel relocations. Thirty four Elphinstone Seam longwalls are scheduled to be mined between 2026 and 2034. Hynds Seam longwall extraction is planned to start in 2034 and be completed in 2048 (Figure 4). Once extraction of the Elphinstone Seam is completed, water accumulation in the goaf will be managed to prevent inrush to workings in the underlying Hynds Seam. Prior to longwall mining in the Elphinstone Seam, a waste rock emplacement is proposed to be constructed above part of the underground workings (Figure 2). This emplacement is up to 140 m high. A smaller emplacement is planned in the northern part of the Project area. The impact of the increased overburden load on the underground workings due to these emplacements has been considered in the subsidence predictions. The potential subsidence impacts on these emplacements have also been addressed, as if they are existing surface features at the time of longwall mining. The geotechnical stability of the emplacements is outside the scope of this assessment. For the purposes of referencing throughout this report, the panels of the Elphinstone Seam have been labelled LWE1 to LWE18 from north to south (Figure 3). Similarly, the Hynds Seam panels are labelled LWH1 to LWH22B (Figure 3).

SUBSIDENCE PREDICTION REPORT FOR THE HAIL CREEK TRANSITION PROJECT
5
GORDON GEOTECHNIQUES
Figure 4. Proposed Mining Schedule.
1.4 Topography and Drainage The Project area is located in the north of the Bowen Basin and on the northern slopes of the Isaac-Connors River catchment in Central Queensland. The topography immediately surrounding the project is typically flat to gently undulating terrain controlled by the underlying geology that comprises sedimentary coal measures, overlain by alluvial sediments in areas immediately adjacent to drainage features such as Hail Creek (Douglas Partners, 2015). The topography in the Project area is a reflection of the south-southeast plunging geological syncline, such that higher elevations occur along the eastern and western syncline limbs (Figure 5). This promotes drainage of tributaries towards Hail Creek, which is located above the Project underground mining area (Figure 5).

SUBSIDENCE PREDICTION REPORT FOR THE HAIL CREEK TRANSITION PROJECT
6
GORDON GEOTECHNIQUES
Figure 5. Topography and Drainage (RTCA, 2015).

SUBSIDENCE PREDICTION REPORT FOR THE HAIL CREEK TRANSITION PROJECT
7
GORDON GEOTECHNIQUES
1.5 Scope of Work This subsidence assessment includes the development of subsidence predictions and an evaluation of subsidence impacts for the proposed longwall mining operations in the Elphinstone and Hynds Seams in the Project area (Figure 3). The specific scope of work included:
A site visit in October 2014 to inspect the surface area above the underground panels to be subsided and identify any surface features potentially sensitive to subsidence impacts. The site visit also included an inspection of the open cut exposures to identify variability in the overburden strata and types of geological features encountered in the Project area.
Description of the site geology and mine plan as they relate to the subsidence predictions.
Detailed description and justification of the subsidence prediction methodology and any associated limitations.
Subsidence modelling using the influence functions methods as implemented in the Surface Deformation Prediction System (SDPS) subsidence program (Carlson Web Site) to visualize the resulting subsidence bowl of the longwall extraction and produce surface subsidence contours.
Description of the predicted subsidence impacts including:
o The magnitude and nature of the vertical subsidence, strains and tilts.
o The nature and extent of predicted surface and subsurface cracking above the mine workings.
o Potential for hydraulic connectivity to the surface due to subsurface cracking.
1.6 Report Structure Section 1 of this report introduces the Project, including the proposed longwall mining layout and topography of the Project underground mining area. Section 2 details the geology, stratigraphy, coal seam thickness, depth of cover and interburden thickness between the seams. Sections 3, 4 and 5 describe the subsidence methodology, the predictions and the potential subsidence impacts due to longwall mining, respectively.

SUBSIDENCE PREDICTION REPORT FOR THE HAIL CREEK TRANSITION PROJECT
8
GORDON GEOTECHNIQUES
2 ENGINEERING GEOLOGY 2.1 Geological Data The Project underground mining area is covered by closely spaced exploration drilling, with an average borehole spacing of approximately 600 m, as shown in Figure 6. These surface drill holes record the geological sequence of the overburden and coal seams. In the majority of drill holes, geophysical logs are also available and provide additional data on the rock and coal seam properties. This density of data provides a high level of confidence in the geological variables used as input into the subsidence models in the Project underground mining area.
Figure 6. Location of Exploration Boreholes.

SUBSIDENCE PREDICTION REPORT FOR THE HAIL CREEK TRANSITION PROJECT
9
GORDON GEOTECHNIQUES
2.2 Stratigraphy In the Project underground mining area, the target coal seams are part of the Permian Rangal Coal Measures (Figure 7). These are the Elphinstone and Hynds Seams. The sediments between the target coal seams typically consist of interbedded sandstones, siltstones and mudstones and minor coal seams. The Yarrabee Tuff within the Hynds Seam is taken as the boundary between the Rangal Coal Measures and the Fort Cooper Coal Measures. The Permian Coal Measures are overlain by coarse grained, greenish lithic sandstone and siltstone units of the Triassic Rewan Formation. The surficial sediments consist of Quaternary alluvial sands, gravels and clays (Figure 7).
Figure 7. Stratigraphic Sequence (RTCA, 2015).
2.3 Depth of Cover The depth of cover above the proposed Elphinstone longwall panels, based on the natural topographic surface prior to waste rock emplacement, ranges from 80 m in the take off area of LWE1, to a maximum of 340 m above the start of LWE14B (Figure 8). The Hynds Seam longwall panels are located at depths below the natural topographic surface ranging from 120 m above LWH1 in the northern part of the area, to more than 400 m in the central part of the area at the base of the syncline (Figure 9).

SUBSIDENCE PREDICTION REPORT FOR THE HAIL CREEK TRANSITION PROJECT
10
GORDON GEOTECHNIQUES
As discussed in Section 3 of this report, the construction of the waste rock emplacement above the Project underground mining area, prior to the commencement of longwall mining, modifies the overburden loading above the longwall panels. This additional loading has been incorporated into the subsidence prediction methodology in this section of the report.
Figure 8. Elphinstone Seam Depth of Cover (m).

SUBSIDENCE PREDICTION REPORT FOR THE HAIL CREEK TRANSITION PROJECT
11
GORDON GEOTECHNIQUES
Figure 9. Hynds Seam Depth of Cover (m).
2.4 Seam Thickness Both the Elphinstone and Hynds Seams are proposed to be extracted using conventional single pass longwall mining equipment to a maximum height of 4.5 m. A minimum of 0.5 m of coal is planned to be left in the floor of both seams to improve the mining conditions.

SUBSIDENCE PREDICTION REPORT FOR THE HAIL CREEK TRANSITION PROJECT
12
GORDON GEOTECHNIQUES
The total seam thicknesses (including the proposed 0.5 m of floor coal) are shown in Figure 10 and Figure 11. The Elphinstone Seam thickness ranges from 4.5 m in the northern part of the area, to 6 m in the western and southern part of the area (Figure 10). The thickness of the Hynds Seam is typically 8 to 8.5 m in the northern part of the area. In the southern part of the area, the seam thins to 6.5 to 8 m (Figure 11).
Figure 10. Elphinstone Seam Thickness (m).

SUBSIDENCE PREDICTION REPORT FOR THE HAIL CREEK TRANSITION PROJECT
13
GORDON GEOTECHNIQUES
Figure 11. Hynds Seam Thickness (m).
2.5 Elphinstone to Hynds Seam Interburden Thickness The interburden between the Elphinstone and Hynds Seams is generally 50-70 m thick in the Project area (Figure 12).

SUBSIDENCE PREDICTION REPORT FOR THE HAIL CREEK TRANSITION PROJECT
14
GORDON GEOTECHNIQUES
Figure 12. Elphinstone to Hynds Seam Interburden Thickness (m).
2.6 Seam Floor Levels The influence of the regional Nebo Syncline through the middle of the longwall layout is clearly shown in Figure 13. This syncline strikes north-northwest and plunges to the south-southeast.

SUBSIDENCE PREDICTION REPORT FOR THE HAIL CREEK TRANSITION PROJECT
15
GORDON GEOTECHNIQUES
Figure 13. 3D Surface of the Hynds Seam Structure Floor Levels (m ASL).
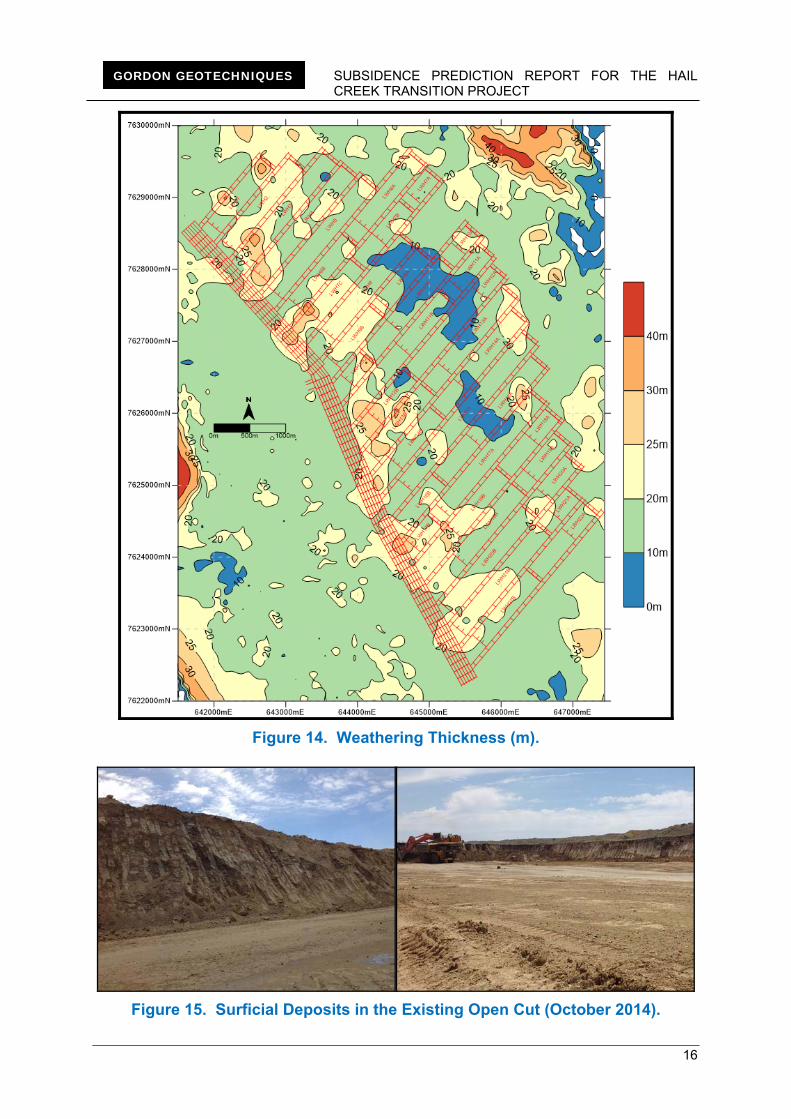
2.7 Weathering Thickness The weathering thickness above the Project underground mining area is typically <20 m (Figure 14). These deposits consist of sands and gravels and their aquifer potential is considered negligible (Douglas Partners, 2015). Exposures of the weathered surficial deposits, in the existing open cut inspected during the October 2014 site visit, are shown in Figure 15.
SUBSIDENCE PREDICTION REPORT FOR THE HAIL CREEK TRANSITION PROJECT
16
GORDON GEOTECHNIQUES
Figure 14. Weathering Thickness (m).
Figure 15. Surficial Deposits in the Existing Open Cut (October 2014).
SUBSIDENCE PREDICTION REPORT FOR THE HAIL CREEK TRANSITION PROJECT
17
GORDON GEOTECHNIQUES
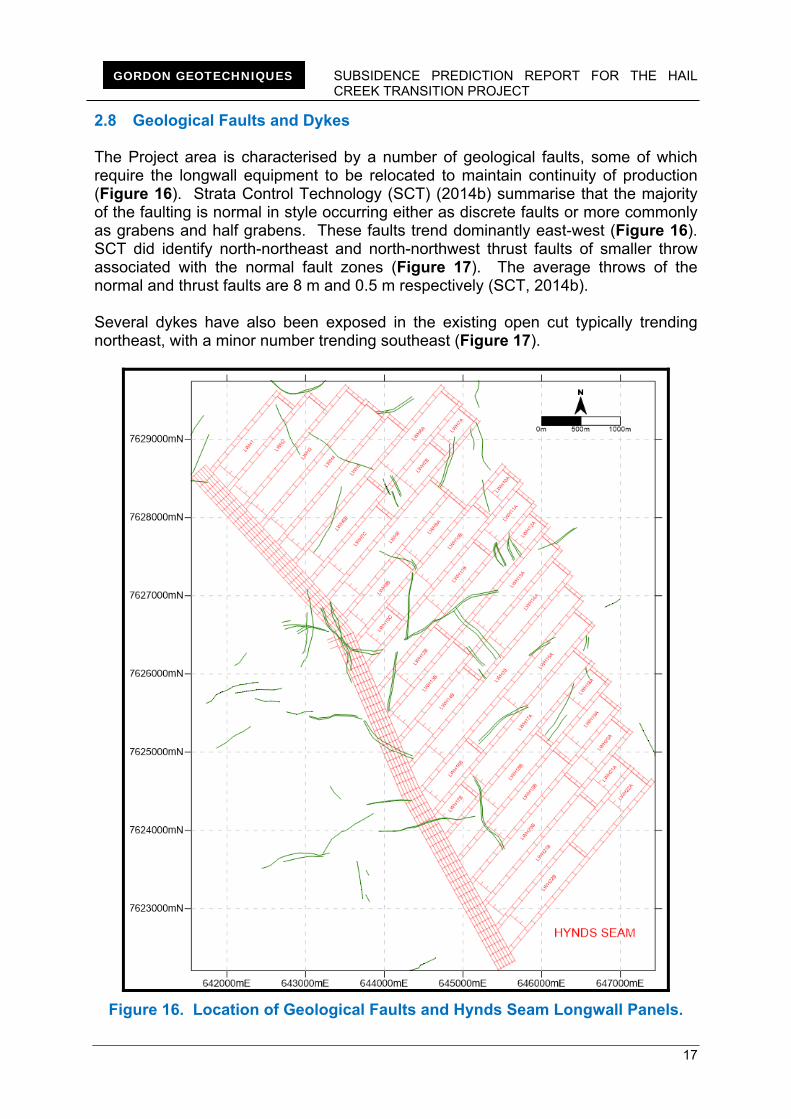
2.8 Geological Faults and Dykes The Project area is characterised by a number of geological faults, some of which require the longwall equipment to be relocated to maintain continuity of production (Figure 16). Strata Control Technology (SCT) (2014b) summarise that the majority of the faulting is normal in style occurring either as discrete faults or more commonly as grabens and half grabens. These faults trend dominantly east-west (Figure 16). SCT did identify north-northeast and north-northwest thrust faults of smaller throw associated with the normal fault zones (Figure 17). The average throws of the normal and thrust faults are 8 m and 0.5 m respectively (SCT, 2014b). Several dykes have also been exposed in the existing open cut typically trending northeast, with a minor number trending southeast (Figure 17).
Figure 16. Location of Geological Faults and Hynds Seam Longwall Panels.

SUBSIDENCE PREDICTION REPORT FOR THE HAIL CREEK TRANSITION PROJECT
18
GORDON GEOTECHNIQUES
Figure 17. Examples of Faults and Dykes Exposed in the Hail Creek Open Cut (SCT, 2014b).
2.9 Hydrogeology Douglas Partners (2015) concluded that the hydrogeology of the Project area is relatively simple, such that geological units can in general be regarded as individual hydrogeological units. The main aquifers above the Project underground mining area are the:
1. Quaternary alluvium;
2. Transition zone of the Triassic Rewan Formation, and Permian Rangal and Fort Cooper Coal Measures; and
3. Permian coal seams. The Quaternary alluvium along Hail Creek and the weathering transition zones of the Triassic and Permian do not represent significant aquifers (Douglas Partners, 2015). The Elphinstone and Hynds Seams are the main groundwater aquifers in the Rangal Coal Measures. Groundwater storage and flow is predominantly associated with the interconnecting natural coal seam cleat and joint patterns. Groundwater head contours confirm that flow within the coal seams is towards the southwest, where the current open cut mining is actively depressurising the coal seams. The extent of drawdown behind the current highwall appears to propagate eastward by about 1 km to 1.5 km (Douglas Partners, 2015).

SUBSIDENCE PREDICTION REPORT FOR THE HAIL CREEK TRANSITION PROJECT
19
GORDON GEOTECHNIQUES
3 SUBSIDENCE PREDICTION METHODOLOGY 3.1 Introduction to Surface Deformation Prediction System (SDPS) GGPL has used the SDPS software to visualise the subsidence deformations in the Project underground mining area. The SDPS program uses an influence function method that assumes the shape of a subsided surface can be modelled with a Gaussian (bell shaped) curve. This technique is a proven and reliable prediction methodology widely used throughout QLD and NSW, for Environmental Impact Statement (EIS) assessments and predictions of subsidence impacts due to longwall mining beneath structures such as dams, highways and transmission towers. The method requires calibration to existing survey data and mine geometry. The following inputs are required:
Panel Layouts (corrected by the adjustment factor).
Seam Thickness.
Depth of Cover.
Influence Angle.
Subsidence Factor (maximum subsidence (Smax)/extracted thickness ratio).
Strain Coefficient. It should be noted that the SDPS methodology can only predict overall or systematic deformations. All subsidence surveys reveal small scale variations from the smooth profile predicted by this method. These deformations can be related to localised movements of blocky rock that is a feature of all coal mine overburdens. Published dual seam longwall monitoring data has also been referenced from elsewhere in the Australian and overseas mining industry. Consistent with the subsidence data from neighbouring Bowen Basin operations presented in Table 1, the following parameters were used for modelling the Project underground operation:
Panel Adjustment Factor of 0.2.
Influence Angle of 77o.
Strain Coefficient of 0.2.
Maximum Subsidence Factor of 60% for extraction in virgin ground and 95% for Hynds Seam extraction below Elphinstone Seam goaf areas.
These parameters are consistent with those used by GGPL at Bowen Basin mines for non-published subsidence studies. It should be emphasised that similar maximum strain values can be obtained for a combination of lower influence angle and higher strain coefficient values, as used for the Surface Subsidence Prediction for the Red Hill Mine assessment (IMC, 2011), compared to the higher influence angle and lower strain coefficient values used for the Project area.

SUBSIDENCE PREDICTION REPORT FOR THE HAIL CREEK TRANSITION PROJECT
20
GORDON GEOTECHNIQUES
Discussion of how these parameters were developed is included in the following sections. It should be highlighted that chain pillar deformations have not been analysed, resulting in a more conservative approach whereby the resulting strains and tilts are higher. This is due to the calculation of the subsidence above the chain pillars as simply the arithmetic sum of the subsidence developed above adjacent “isolated” panels.
Smax/T Offset Tan β =
K3 Strain
Coefficient
USA 0.19-0.76 0.20 (conservative)0.25 (average)
2.31 0.35
NSW (Southern Coalfield)
0.5-0.64 0.20 3.0 NA
NSW (Western Coalfield)
0.65 0.35 3.4 NA
NSW (Newcastle Coalfield)
0.56 0.40 1.8 NA
Bowen Basin 0.60 0.20 4.4 0.20
Red Hill 0.64 not quoted 1.48 0.35
Project Area at Hail Creek
0.60 0.20 4.4 0.20
Table 1. Selection of SDPS Parameters (IMC, 2011 and South Galilee EIS, 2012).
3.2 Subsidence Behaviour The subsidence above longwall panels is comprised of two main components namely sag subsidence and strata compression. Depending on the depth of cover and width of extraction, these components combine in various proportions (Figure 18). In the shallower part of the Project underground mining area, the sag subsidence is expected to be a large component of the total subsidence (Figure 18). This is termed supercritical subsidence. In these areas, the maximum vertical subsidence does not increase as the panel width increases. In the deeper longwall mining areas, where the width/depth ratio is <1.2, strata compression may contribute a higher component of the total subsidence (Figure 18). Due to the extraction of the Hynds Seam longwall panels below the Elphinstone Seam longwall panels in a stacked layout, the ridges above the chain pillars may be more pronounced.

SUBSIDENCE PREDICTION REPORT FOR THE HAIL CREEK TRANSITION PROJECT
21
GORDON GEOTECHNIQUES
Figure 18. Effect of Panel Width (AusIMM, 2009).
The general shape of a cross section through a subsidence bowl (Figure 19) reveals a number of key parameters that can be used as a frame of reference:
The areal extent of subsidence is defined by the angle of draw. Conventionally the angle of draw is measured from the point of 20 millimetres (mm) of vertical subsidence (not zero), which equates to the limit of measurable subsidence (LOMS). Subsidence less than 20 mm will have a negligible effect, as it cannot be differentiated from natural ground surface variations due to soil moisture changes.
Maximum tilt should correspond with zero strain (Figure 19).
The subsidence at the point of maximum tilt and zero strain should be half the maximum vertical movement (Figure 19).
The maximum tilts or strains do not necessarily correspond with the edge of the extraction.
These parameters characterise the surface deformations above the extracted longwall panels and provide context to the resulting impacts in the Project area.

SUBSIDENCE PREDICTION REPORT FOR THE HAIL CREEK TRANSITION PROJECT
22
GORDON GEOTECHNIQUES
C of PanelLMax. tilt
Max. concavecurvature
Max. convexcurvature
Angle of draw
Seam Goaf Area
Dep
th o
f co
v er
H
Ground Level
Max
.su
bsi
denc
e
Sm
ax
Max. horizontal movement
Max. tensile strain
Point ofinflection
Max. compressivestrain
Panel width Wpa
Smax2
Subsid
profile
ence
Extracted seamthickness
T
Figure 19. General Characterisation of a Subsidence Cross Line.
3.3 Determination of the Influence Angle Using subsidence data from the Bowen Basin (Table 1), a high influence angle of 77o was used in the modelling for both the Elphinstone and Hynds Seams. For the Hynds Seam it is likely that the overlying rock mass will be broken due to extraction of the overlying Elphinstone Seam and not able to span, resulting in high influence angle values. Whilst the influence angle for the Elphinstone Seam and Hynds Seam extraction in virgin ground may be less than the 77o assumption, this value is considered conservative for the purpose of the subsidence assessment. In the absence of dual seam subsidence data, the 77o is considered appropriate to apply to extraction in both the Elphinstone and Hynds Seams.
3.4 Determination of the Panel Adjustment Factor SDPS considers each extraction panel not by the mining edge but by the projection of the points of inflexion. The compensation width is the distance from the rib edge to the inflexion point or point of half the maximum subsidence. For wide extraction panels, the position of the inflexion points is a linear proportion of the depth of cover. The panel adjustment factor is the compensation width divided by the depth of cover, where the compensation width is the distance measured from the rib edge to the inflection point or point of half the maximum subsidence (Figure 19). An average value of 0.2 was determined for the panel adjustment factor from the available published Bowen Basin data (Table 1). For the SDPS analysis of the Elphinstone Seam layout, the original and compensated longwall panel boundaries

SUBSIDENCE PREDICTION REPORT FOR THE HAIL CREEK TRANSITION PROJECT
23
GORDON GEOTECHNIQUES
are shown in Figure 20. Compensated boundaries were also determined for the Hynds Seam layout using the same panel adjustment factor.
Figure 20. Elphinstone Seam Longwall Layout – Original Longwall Panels (red) and Compensated Panels (blue).
3.5 Determination of Subsidence Factors
3.5.1 Single Seam
A subsidence factor ratio of maximum subsidence (Smax) to extracted thickness (T) in virgin ground has been estimated from Bowen Basin data and empirical data from

SUBSIDENCE PREDICTION REPORT FOR THE HAIL CREEK TRANSITION PROJECT
24
GORDON GEOTECHNIQUES
NSW (Figure 21). This ratio is the percentage of the extracted thickness underground, measured as subsidence on the surface.
0
0.1
0.2
0.3
0.4
0.5
0.6
0.7
0.8
0.9
1
1.1
1.2
0 0.2 0.4 0.6 0.8 1 1.2 1.4 1.6 1.8 2 2.2 2.4 2.6 2.8 3
MAXIM
UM SUBSIDEN
CE/EXTR
ACTED THICKNESS
WIDTH OF PANEL/DEPTH OF COVER
Western Coalfield ‐ NSW
Southern Coalfield ‐ NSW
Newcastle Coalfield ‐ NSW
Bowen Basin Data
Multi Seam Data for Second Seam (Li et al, 2010)
Multi Seam Data for Second Seam (MSEC, 2012)
Average Smax/T ratio for the Bowen Basin = 0.60
Average Smax/T ratio for the Multi Seam Data = 0.95
Figure 21. Empirical Curves for Sag Subsidence over Single Panels with Single Seam Bowen Basin Data and Multi Seam Data.
It should be highlighted that an empirical curve has not been developed for the Bowen Basin due to the fact that the majority of the extraction has been carried out at panel width:depth of cover ratios >0.8 (Figure 21). Available Bowen Basin data validates the application of a 60% subsidence factor to the Project underground mining area for extraction in virgin ground (Figure 21). In parts of the Project mining area, the ratio of the panel width:depth ratio is less than 1.2. In these areas, the subsidence factor has been correspondingly reduced in SDPS, based on the Southern Coalfield empirical subsidence curve presented in Figure 21. Unpublished subsidence data from the Laleham pillar extraction mine near Blackwater indicates that the Southern Coalfield curve is the most similar to Bowen Basin conditions for low width of panel:depth of cover ratios.
3.5.2 Dual Seam
Li et al (2010) have recently reported experience in dual seam longwall mining environments. In their case study, subsidence data for extraction of the upper seam followed by the lower seam at Newstan, Liddell and North Wambo mines was presented. In addition, data from Sigma Colliery in South Africa and the UK National

SUBSIDENCE PREDICTION REPORT FOR THE HAIL CREEK TRANSITION PROJECT
25
GORDON GEOTECHNIQUES
Coal Board were also discussed. This subsidence data is summarised in Table 2 below.
Mine Seam Seam
Thickness (m)
Panel Width
(m)
Depth(m)
W/H IB
(m) Smax
(m)
Subsidence Factor (Upper Seam)
Subsidence Factor (Lower Seam)
Subsidence Factor (Both
Seams)
Sigma Colliery, SA
Upper 2.75 211 133 1.59 13
1.10 40%
Lower 3.04 187 148 1.26 2.92 96%
69%
Newstan Colliery,
NSW
Upper 3.40 155 60 2.58 15
20.3 60%
Lower 3.20 210 75 2.80 3.03 95%
77%
Liddell Colliery,
NSW
Upper 2.40 180 160 1.13 40
1.55 65%
Lower 2.00 180 200 0.90 2.10 105%
83%
North Wambo
Mine, NSW
Upper 3.30 210 260 0.81 85
-
Lower 2.80 260 345 0.75 2.75 98%
North Wambo
Mine, NSW
Upper 3.30 210 95 2.21 65
-
Lower 2.60 260 160 1.63 2.54 98%
National Coal Board,
UK
Upper - - - -
- 80%
Lower - - - - 90%
85%
Table 2. Subsidence Parameters from Case Studies on Longwall Mining under Existing Longwall Goaf (Li et al, 2010).
Based on the subsidence data presented in Table 2 and Figure 21, a conservative maximum 95% subsidence factor has been applied to the Hynds Seam extraction. Additional undermining subsidence data documented by MSEC (2012) is also appended to Figure 21 and reinforces the application of the 95% subsidence factor value. As detailed above, in areas of lower panel width to depth of cover ratios, the subsidence factor was correspondingly reduced in line with empirical data. MSEC (2007) also proposed that the additional ground movement in a dual seam mining environment is dependent upon the thickness of the interburden between the seams, as well as the thickness of the seams to be extracted. The Hynds Seam in the project site is typically 50-70 m below the Elphinstone Seam and hence is located within the range detailed in the data sets in Table 2 and Figure 21 (Figure 22). The depth of cover range of the subsidence data sets referred to is 75-345 m, which is also similar to the Project underground mining area. In the case of the combined Hynds and Elphinstone Seam extraction, the total subsidence at any point is a simple addition of individual values for each seam. The same is not true of the strain and tilts. SDPS has the facility to allow models to be run with both seam layouts simultaneously, to provide outputs of these parameters. This methodology has been utilised in areas where both the Elphinstone and Hynds Seams are extracted.

SUBSIDENCE PREDICTION REPORT FOR THE HAIL CREEK TRANSITION PROJECT
26
GORDON GEOTECHNIQUES
0.50
0.60
0.70
0.80
0.90
1.00
1.10
1.20
0 10 20 30 40 50 60 70 80 90
MAXIM
UM SUBSIDEN
CE/EXTR
ACTED THICKNESS
INTERBURDEN THICKNESS (m)
ELPHINSTONE TO HYNDS INTERBURDEN THICKNESS RANGE (50‐70m)
Figure 22. Interburden Thickness for Multi Seam Data Set.
3.6 Determination of the Strain Coefficient Strain data is particularly affected by blocky rock movements and often show a large degree of disordered movement. A strain coefficient of 0.2 has been used for the subsidence modelling work in the Project underground mining area, based on the Bowen Basin data presented in Table 1. 3.7 Depth of Cover Adjustment As detailed earlier, the open cut operations at Hail Creek intend to emplace waste rock over the Project underground area up to Year 10 of the Project, prior to the commencement of underground mining. Completion of the contouring of these emplacements is planned by Year 15. As shown in Figure 23 and Figure 24, the dozer contouring between Years 10 and 15 does not affect the shape of the emplacements above the Project underground area, rather is concentrated mainly in the eastern and western open cut pits.

SUBSIDENCE PREDICTION REPORT FOR THE HAIL CREEK TRANSITION PROJECT
27
GORDON GEOTECHNIQUES
Figure 23. Waste Rock Emplacement Landforms by Year 10.
Figure 24. Waste Rock Emplacement Landforms by Year 15.

SUBSIDENCE PREDICTION REPORT FOR THE HAIL CREEK TRANSITION PROJECT
28
GORDON GEOTECHNIQUES
To account for the increased thickness of overburden above the extracted longwall panels resulting from the waste rock emplacements, the depth of cover above the extracted seams has been adjusted (Figure 25). A density of 2 tonnes per cubic metre (t/m3) has been assumed for the waste rock and the thickness has been normalised to an overburden density of 2.5 t/m3, to allow the adjusted depth of cover contours to be generated (Figure 26 and Figure 27).
Figure 25. Normalised Emplacement Height for a Waste Rock Density of 2 t/m3 and an Overburden Density of 2.5 t/m3.

SUBSIDENCE PREDICTION REPORT FOR THE HAIL CREEK TRANSITION PROJECT
29
GORDON GEOTECHNIQUES
These adjusted depth of cover contours for both the Elphinstone and Hynds Seams, resulting from the waste rock emplacements, are shown in Figure 26 and Figure 27. Due to the emplacement in the north eastern part of the Project area, the maximum depth of cover increases to 400 m and 460 m above the Elphinstone and Hynds Seam workings, respectively (Figure 26 and Figure 27). This compares to the maximum depths below the natural topography, prior to emplacement, of 340 m and 400 m respectively.
Figure 26. Adjusted Elphinstone Seam Depth of Cover (m).

SUBSIDENCE PREDICTION REPORT FOR THE HAIL CREEK TRANSITION PROJECT
30
GORDON GEOTECHNIQUES
Figure 27. Adjusted Hynds Seam Depth of Cover (m).
3.8 Strata Compression The subsidence prediction has also considered the effect of yielding of the chain pillars and compression of the roof and floor strata. For the 50 m (solid) chain pillars proposed for the underground operation in the Project area, a pillar stability analysis using the ALPS methodology has been carried out to assess the possibility of major

SUBSIDENCE PREDICTION REPORT FOR THE HAIL CREEK TRANSITION PROJECT
31
GORDON GEOTECHNIQUES
changes in the magnitude of pillar deformations. Only at depths greater than 420 m, does this pillar size yield in an adjacent goaf loading situation and contribute additional levels of subsidence (Figure 28).
0
1
2
3
4
5
6
7
8
9
10
100 120 140 160 180 200 220 240 260 280 300 320 340 360 380 400 420 440
FACTO
R OF SA
FETY
DEPTH OF COVER (m)
PILLAR WIDTH = 50 mDENSITY = 2.5 t/m3
PANEL WIDTH = 250 m (rib to rib)ROADWAY HEIGHT = 2.9 mABUTMENT ANGLE = 21o
ABUTMENT FACTOR = 2 for an adjacent goaf
Figure 28. Decrease in Chain Pillar Stability with Increasing Depth.
Based on Figure 28, no pillar yielding is expected in the Elphinstone Seam workings where the depths, including the waste rock emplacements, are <420 m. Yielding of the Hynds Seam pillars is predicted in a very small proportion of the area, where the depth of cover is >420 m and adjacent goaf conditions are present (Figure 29). It should be noted that the mining conditions at the face, and in particular at the tailgate end of the longwall face, can still be readily managed even if this yield is occurring in the goaf. Using representative roof and floor moduli values (SCT, 2014a) and a 4.5 m extraction thickness the combined pillar, roof and floor compression component is <300 mm for the majority of the Project underground area (Figure 30). As detailed previously this assessment has therefore conservatively not considered the contribution of strata compression for the purposes of the EA amendment application. Greater levels of strata compression may occur particularly at greater depths in areas of pillar yield, which may contribute higher levels of pillar deformation.

SUBSIDENCE PREDICTION REPORT FOR THE HAIL CREEK TRANSITION PROJECT
32
GORDON GEOTECHNIQUES
Figure 29. Predicted Extent of Yielding on the Hynds Seam Chain Pillars.
0
100
200
300
400
500
600
700
800
900
1000
80 100 120 140 160 180 200 220 240 260 280 300 320 340 360 380 400 420 440 460
PILLA
R/ROOF/FLOOR COMPRESSION (mm)
DEPTH OF COVER (m)
PILLAR WIDTH = 50 mDENSITY = 2.5 t/m3
PANEL WIDTH = 250 m (rib to rib)EXTRACTED THICKNESS = 4.5 mABUTMENT ANGLE = 21o
ABUTMENT FACTOR = 2 for an adjacent goafRoof Modulus = 14.5 GPaFloor Modulus = 6.6 GPaCoal Modulus = 2 GPa
Figure 30. Compression of the Pillar, Roof and Floor.

SUBSIDENCE PREDICTION REPORT FOR THE HAIL CREEK TRANSITION PROJECT
33
GORDON GEOTECHNIQUES
3.9 Analysis of Massive Spanning Units The potential for spanning massive units in overburdens of the Elphinstone and Hynds Seams that may modify the subsidence behaviour has also been assessed. SCT (2014a) identified a thickly bedded sandstone unit, with occasional minor siltstone bands, in the roof of the Elphinstone Seam through the central part of the Project underground mining area. SCT inferred that the bedding within this unit would assist caving. Conservatively assuming a 20o caving angle, a rock strength of 60 MPa and a modulus of 12 GPa, a voussoir beam analysis indicates that a 49 m thick massive unit is required to span a 250 m wide longwall panel. The variability in the gamma response of the Elphinstone and Hynds Seam overburden in selected exploration drill holes across the Project underground mining area, indicates that any massive units are less than 30 m thick (Figure 31). The potential for spanning units in the overburden is therefore unlikely, consistent with studies by SCT and it is anticipated that caving behind the retreating longwalls will occur readily.
0
20
40
60
80
100
120
0 50 100 150 200
HEIGHT ABOVE HYNDS SEAM (m)
GAMMA (API)
10075Dabove LW H1
ELPHINSTONE SEAM
0
20
40
60
80
100
120
0 50 100 150 200
HEIGHT ABOVE HYNDS SEAM (m)
GAMMA (API)
10081D above LW H7C
ELPHINSTONE SEAM
0
20
40
60
80
100
120
0 50 100 150 200
HEIGHT ABOVE HYNDS SEAM (m)
GAMMA (API)
10059D above LW H17A
ELPHINSTONE SEAM
Figure 31. Gamma Response of the Elphinstone and Hynds Seam Overburden.

SUBSIDENCE PREDICTION REPORT FOR THE HAIL CREEK TRANSITION PROJECT
34
GORDON GEOTECHNIQUES
4 SUBSIDENCE PREDICTIONS
The results of running the SDPS models for the Elphinstone and Hynds Seam longwall panels are presented in the following sections. Subsidence modelling was carried out individually for extraction of the Elphinstone Seam alone and also for the combined Elphinstone and Hynds Seams extraction scenario. For the purposes of this assessment, the longwall take off position has been taken to be 15 m outbye of the chute roadways to allow for longwall bolt up.
4.1 Elphinstone Seam
4.1.1 Subsidence
Predicted total subsidence from longwall mining in the Elphinstone Seam is shown in Figure 32. Vertical subsidence reaches a maximum of 2.7 m in the shallower mining areas, reducing to <2 m in the deeper parts of the area.
Figure 32. Subsidence due to Elphinstone Seam Longwall Extraction (m).

SUBSIDENCE PREDICTION REPORT FOR THE HAIL CREEK TRANSITION PROJECT
35
GORDON GEOTECHNIQUES
As well as vertical movement, minor horizontal ground movements also occur at the surface due to underground mining. These movements are more relevant if key surface infrastructure is located above an underground mining area. Qualitatively in the Project area, the horizontal displacements are minor and not considered a significant additional effect. With the improvement in survey techniques over the years, far-field effects have been measured outside the conventional 26.5o angle of draw. If an elastic analysis of a rock mass is carried out, both vertical and horizontal movements of less than 20 mm are indicated outside the angle of draw consistent with the survey measurements. The horizontal movements are greater than the vertical but because of the very low magnitude of the movements, the strains are negligible. These minor horizontal movements are typically towards the extraction area (AusIMM, 2009). These far-field effects do not occur below the surface and only occur where there is a free face such as the steep sided valleys in the Southern Coalfield of NSW. In this coalfield, vertical cliff faces may be greater than 100 m high. This behaviour is confirmed by the strong influence on the magnitude and direction of horizontal movements of the surface topography detailed in the 2009 AusIMM subsidence paper. In the flat lying topography above the Project underground mining area, no significant far-field effects are expected (Figure 33).
Figure 33. Surface above the Project Underground Mining Area (Looking East from the Existing Open Cut).
4.1.2 Surface Strain
Bending and horizontal movements in the strata cause surface strain. Measured strain is determined from monitored survey data by calculating the horizontal change in length of a section of a subsidence profile and dividing this by the initial horizontal length of that section. The maximum predicted tensile strains after the extraction of the Elphinstone Seam range in magnitude up to 29 mm/m (Figure 34). In all cases, maximum tensile strains are expected to occur over the chain pillars. Maximum compressive strains range up to 31 mm/m.

SUBSIDENCE PREDICTION REPORT FOR THE HAIL CREEK TRANSITION PROJECT
36
GORDON GEOTECHNIQUES
Figure 34. Strain due to Elphinstone Seam Longwall Extraction (m).
4.1.3 Tilts
Tilt is the change in slope of subsided land over a given distance and is calculated by determining the change in subsidence between two points and dividing this by the distance between those points. The physical result of this is that the post mining surface slopes become steeper in localized areas along the edges of the subsidence troughs.
SUBSIDENCE PREDICTION REPORT FOR THE HAIL CREEK TRANSITION PROJECT
37
GORDON GEOTECHNIQUES
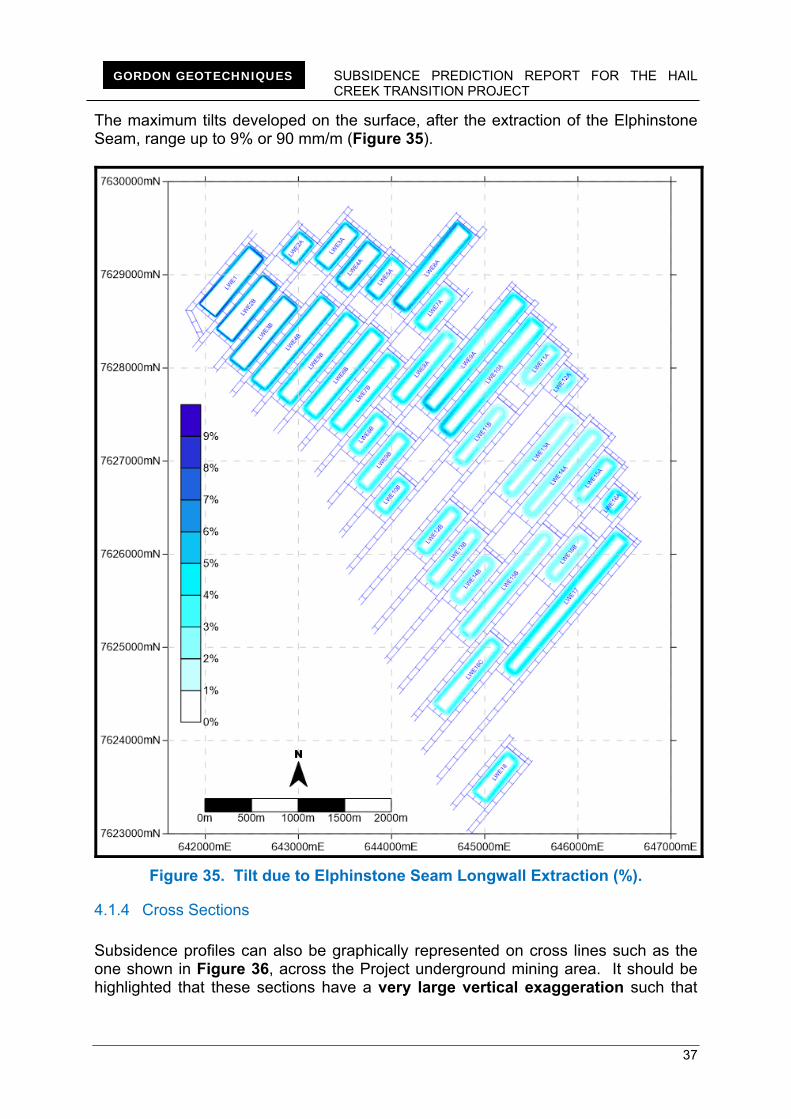
The maximum tilts developed on the surface, after the extraction of the Elphinstone Seam, range up to 9% or 90 mm/m (Figure 35).
Figure 35. Tilt due to Elphinstone Seam Longwall Extraction (%).
4.1.4 Cross Sections
Subsidence profiles can also be graphically represented on cross lines such as the one shown in Figure 36, across the Project underground mining area. It should be highlighted that these sections have a very large vertical exaggeration such that

SUBSIDENCE PREDICTION REPORT FOR THE HAIL CREEK TRANSITION PROJECT
38
GORDON GEOTECHNIQUES
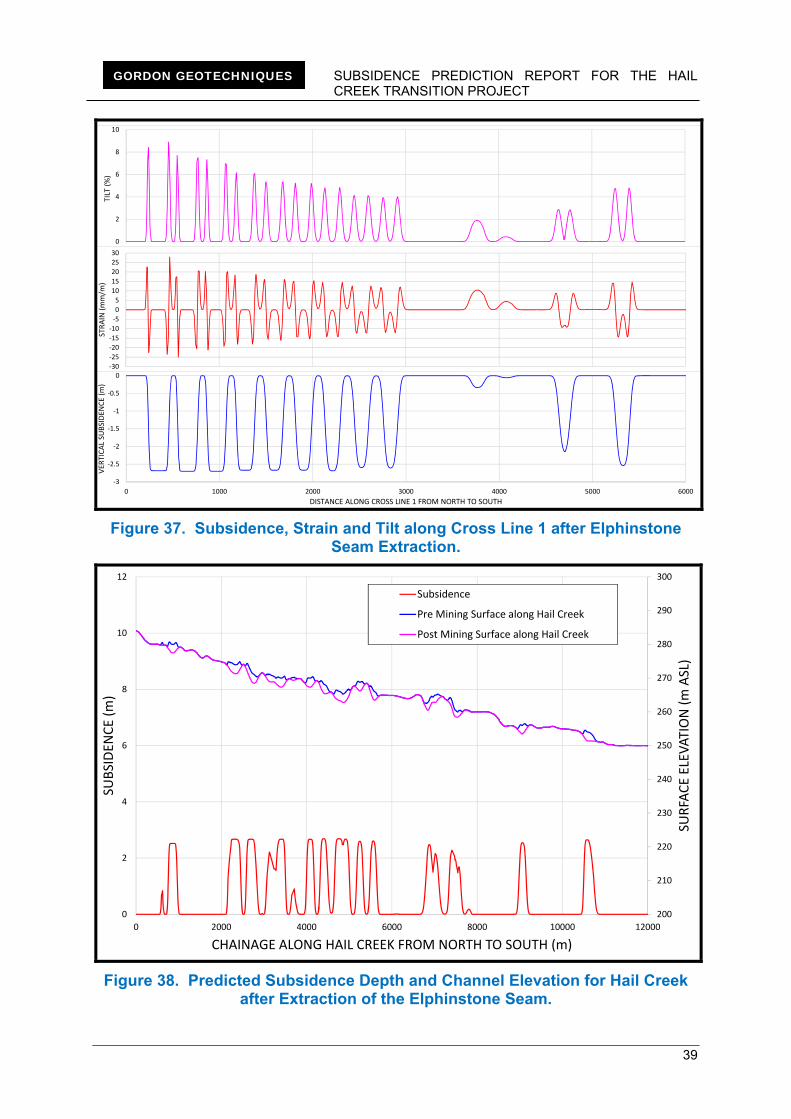
the tilts shown in the figures are much larger than will be induced by the subsidence. The subsidence, strain and tilt profiles along cross line 1 are shown on Figure 37. To provide an indication of the predicted profile along Hail Creek after extraction of the Elphinstone Seam both the pre-mining and post-mining surfaces are shown in Figure 38.
Figure 36. Location of Cross Line 1 and Hail Creek.
SUBSIDENCE PREDICTION REPORT FOR THE HAIL CREEK TRANSITION PROJECT
39
GORDON GEOTECHNIQUES
‐3
‐2.5
‐2
‐1.5
‐1
‐0.5
0
0 1000 2000 3000 4000 5000 6000
VER
TICAL SU
BSIDEN
CE (m
)
DISTANCE ALONG CROSS LINE 1 FROM NORTH TO SOUTH
‐30
‐25
‐20
‐15
‐10
‐5
0
5
10
15
20
25
30
STRAIN (mm/m
)
0
2
4
6
8
10
TILT (%)
Figure 37. Subsidence, Strain and Tilt along Cross Line 1 after Elphinstone Seam Extraction.
200
210
220
230
240
250
260
270
280
290
300
0
2
4
6
8
10
12
0 2000 4000 6000 8000 10000 12000
SURFACE ELEVATION (m ASL)
SUBSIDEN
CE (m
)
CHAINAGE ALONG HAIL CREEK FROM NORTH TO SOUTH (m)
Subsidence
Pre Mining Surface along Hail Creek
Post Mining Surface along Hail Creek
Figure 38. Predicted Subsidence Depth and Channel Elevation for Hail Creek after Extraction of the Elphinstone Seam.
SUBSIDENCE PREDICTION REPORT FOR THE HAIL CREEK TRANSITION PROJECT
40
GORDON GEOTECHNIQUES
4.2 Combined Elphinstone and Hynds Seam
4.2.1 Subsidence
Predicted subsidence from both the Elphinstone and Hynds Seam extraction is shown in Figure 39. Vertical subsidence reaches a maximum of 6.9 m in the shallower mining areas. In the deepest part of the Project underground mining area, maximum subsidence reduces to <5 m. In the southern part of the area, where only the Hynds Seam is extracted, the maximum subsidence is 2.5 m.
Figure 39. Subsidence due to Elphinstone and Hynds Seam Longwall Extraction (m).

SUBSIDENCE PREDICTION REPORT FOR THE HAIL CREEK TRANSITION PROJECT
41
GORDON GEOTECHNIQUES
4.2.2 Surface Strain
The maximum tensile strains caused by the Elphinstone and Hynds Seam longwall extraction are higher than the strains due to single seam extraction and range in magnitude up to 51 mm/m (Figure 40). Maximum compressive strains range up to 47 mm/m. Lower strains are predicted in the southern part of the Project underground mining area where extraction of only the Hynds Seam is proposed.
Figure 40. Strain due to Elphinstone and Hynds Seam Longwall Extraction (mm/m).

SUBSIDENCE PREDICTION REPORT FOR THE HAIL CREEK TRANSITION PROJECT
42
GORDON GEOTECHNIQUES
4.2.3 Tilts
The maximum tilts developed after extraction of both the Elphinstone and Hynds Seam longwall panels are higher than in the shallowest part of the area, where they range up to 14% or 140 mm/m (Figure 41).
Figure 41. Tilt due to Elphinstone and Hynds Seam Longwall Extraction (%).

SUBSIDENCE PREDICTION REPORT FOR THE HAIL CREEK TRANSITION PROJECT
43
GORDON GEOTECHNIQUES
4.2.4 Cross Sections
The subsidence, strain and tilt profiles along cross line 1 after the extraction of both the Elphinstone and Hynds Seams are shown on Figure 42. To provide an indication of the predicted profile along Hail Creek after the extraction of both seams, the pre-mining and post-mining surfaces are shown in Figure 43.
‐7
‐6
‐5
‐4
‐3
‐2
‐1
0
0 1000 2000 3000 4000 5000 6000
VER
TICAL SU
BSIDEN
CE (m
)
DISTANCE ALONG CROSS LINE 1 FROM NORTH TO SOUTH
‐50
‐40
‐30
‐20
‐10
0
10
20
30
40
50
60
STRAIN (mm/m
)
0
2
4
6
8
10
12
14
16
TILT (%)
Figure 42. Subsidence, Strain and Tilt along Cross Line 1 after Extraction of both the Elphinstone and Hynds Seams.
200
210
220
230
240
250
260
270
280
290
300
0
2
4
6
8
10
12
14
16
18
20
0 2000 4000 6000 8000 10000 12000
SURFACE ELEVATION (m ASL)
SUBSIDEN
CE (m
)
CHAINAGE ALONG HAIL CREEK FROM NORTH TO SOUTH (m)
Subsidence
Pre Mining Surface along Hail Creek
Post Mining Surface along Hail Creek
Figure 43. Predicted Subsidence Depth and Channel Elevation for Hail Creek after Extraction of both the Elphinstone and Hynds Seams.

SUBSIDENCE PREDICTION REPORT FOR THE HAIL CREEK TRANSITION PROJECT
44
GORDON GEOTECHNIQUES
4.3 Limitations of the Subsidence Predictions The subsidence predictions represent final subsidence values after longwall mining is completed. The nature of the longwall mining method means that subsidence does not increase further over time. Based on subsidence monitoring in the neighbouring Bowen Basin, greater than 97% of the maximum subsidence at a point on the surface typically occurs within 6 weeks after longwall mining has retreated past this point, assuming an industry average retreat rate of 100 m/week. Based on the available data for the Project underground mining area, there are no localised features or variations in the geology, geotechnical conditions or surface topography that are considered likely to result in any significant deviations from the subsidence predictions presented in this report. As is good engineering practice, a review of the predictions should be conducted as any new geological/geotechnical data and subsidence monitoring becomes available. This is particularly relevant to the extraction of the Hynds Seam due to the limited availability of empirical data for dual seam extraction. Overall, the subsidence predictions are based on well established methodologies that have been proven to provide reliable predictions at numerous similar mining operations. In any areas of uncertainty, conservative assumptions have been applied. The predictions are therefore considered suitable for assessing the potential impacts of subsidence on the environment in the Project area.

SUBSIDENCE PREDICTION REPORT FOR THE HAIL CREEK TRANSITION PROJECT
45
GORDON GEOTECHNIQUES
5 SUBSIDENCE IMPACTS The previous section has documented the predicted surface subsidence associated with the proposed longwall mining in the Project underground mining area. This section provides an assessment of the impacts that subsidence may have on both the overburden rock mass and the surface. 5.1 Surface Deformations An indication of the range of predicted subsidence deformations associated with the proposed longwall mining is shown in the cumulative frequency curves in Figure 44 and Figure 45. After extraction of the Elphinstone Seam, 80% of the strains will be less than 10 mm/m and 90% of the tilts will be less than 40 mm/m or 4% (Figure 44).
‐3.0
‐2.5
‐2.0
‐1.5
‐1.0
‐0.5
0.0‐40
‐30
‐20
‐10
0
10
20
30
40
50
60
70
80
90
0% 5% 10% 15% 20% 25% 30% 35% 40% 45% 50% 55% 60% 65% 70% 75% 80% 85% 90% 95% 100%
SUBSIDEN
CE (m
)
TILTS AND STR
AINS (m
m/m
)
Tilt
Strain
Vertical Subsidence
Figure 44. Cumulative Frequency Curves after Extraction of the Elphinstone Seam.
After the extraction of both the Elphinstone and Hynds Seams, 80% of the strains will be less than 20 mm/m. 85% of the tilts will be less than 6%, which is equivalent to a change in slope of 3.4° (Figure 45).

SUBSIDENCE PREDICTION REPORT FOR THE HAIL CREEK TRANSITION PROJECT
46
GORDON GEOTECHNIQUES
‐8.0
‐7.0
‐6.0
‐5.0
‐4.0
‐3.0
‐2.0
‐1.0
0.0‐60
‐40
‐20
0
20
40
60
80
100
120
140
160
0% 5% 10% 15% 20% 25% 30% 35% 40% 45% 50% 55% 60% 65% 70% 75% 80% 85% 90% 95% 100%
SUBSIDEN
CE (m
)
TILTS AND STR
AINS (m
m/m
)
Tilt
Strain
Vertical Subsidence
Figure 45. Cumulative Frequency Curves after Extraction of both the Elphinstone and Hynds Seams.
5.2 Subsurface Subsidence Cracking
5.2.1 Background to Subsurface Subsidence Cracking
Longwall mining methods can induce a range of subsurface subsidence impacts. In the context of changes to the hydrogeological regime, the key issue associated with longwall subsidence is the creation of subsurface subsidence cracks in the rock mass. These cracks may provide new flow paths for groundwater and alter the permeability of the strata overlying longwall mining areas. The potential changes in the hydrogeological characteristics of the rock mass are dependent upon a number of variables that may affect the behaviour of subsurface subsidence cracking, such as:
mine geometry;
extracted seam thickness;
thickness and geomechanical properties of the overburden;
presence of tuffaceous horizons that may restrict the vertical flow of groundwater; and
the bulking and compaction of the goaf material. For operating longwall mines, it is possible to measure key subsurface subsidence cracking characteristics including the height of cracking above the extracted coal

SUBSIDENCE PREDICTION REPORT FOR THE HAIL CREEK TRANSITION PROJECT
47
GORDON GEOTECHNIQUES
seam. This information can be correlated to measured changes in the water regime, such as decreases in groundwater levels in boreholes or inflows to underground mining areas. This provides accurate site-specific data on the known characteristics and impacts of subsurface subsidence cracking within the geological sequence. A range of different methodologies are used to determine the heights of subsurface subsidence cracking associated with existing mining operations, such as:
borehole extensometers;
piezometer records;
drilling records;
comparison of permeability testing; and
microseismic monitoring.
5.2.2 Prediction of Subsurface Subsidence Cracking Effects due to Single Seam Extraction
The prediction of subsurface subsidence cracking for single seam extraction has been extensively studied using both empirical and numerical modelling methods. Microseismic monitoring of the overburden has also been used to measure the actual height of subsurface cracking at a number of Bowen Basin mining operations.
5.2.2.1 Empirical Methods
Models based upon empirical evidence such as observation and measurement are commonly used to predict the effects of subsidence. Empirical hydrogeological models for subsided strata are typically based on the interpretation of water inflow events. The most commonly cited empirical model developed for predicting subsurface subsidence cracking effects on groundwater and surface water is the Bai and Kendorski (1995) model (Figure 46). The key principle of this model is that subsurface subsidence cracking can be characterised by the following zones:
Constrained zone – unaffected by subsurface subsidence cracking.
Dilated (or discontinuous cracking) zone – no changes in vertical permeability, possible changes in horizontal permeability and storativity.
Fractured (or continuous cracking) zone – changes in vertical and horizontal permeability are possible.
In this model, cracking within the dilated (or discontinuous cracking) zone is dominantly horizontal, with negligible vertical cracks. In this zone, there may be an increase in horizontal permeability but this is not likely to result in significant inflows to the underground mine workings. The fractured zone nomenclature is related to the zone of vertical hydraulic connectivity (or unrestricted inflow) and does not imply the limit of all cracking.

SUBSIDENCE PREDICTION REPORT FOR THE HAIL CREEK TRANSITION PROJECT
48
GORDON GEOTECHNIQUES
Figure 46. Hydrogeological Model for Cracking above Longwalls (Bai & Kendorski, 1995).
This model concludes that water will enter an underground mine or be lost from an aquifer or surface water body if:
the zone of continuous subsurface cracking intersects the water body; or
there is a connection between the continuous subsurface cracking zone and any surface subsidence cracking.
The heights of subsurface subsidence cracking in models such as that of Bai and Kendorski are related to extracted coal thickness. In Figure 46, the fractured zone is shown to range from 6 to 30 times the extracted seam thickness. Alternative models are available, which relate the height of continuous cracking to the mining induced tensile strains and depths of cover. However, the overall concept of dividing the rock mass into different cracking zones is common to all methods and is a well-established and valid approach to explain the measured differences in field observations arising from subsurface subsidence cracking.

SUBSIDENCE PREDICTION REPORT FOR THE HAIL CREEK TRANSITION PROJECT
49
GORDON GEOTECHNIQUES
Measured data taken from comparable mining operations in equivalent geology to the Project area can also be used to assist with the prediction of the likely extent of each subsurface cracking zone and, in particular, the boundary between discontinuous and continuous zones of subsurface subsidence cracking.
5.2.2.2 Numerical Methods
The behaviour of the subsided rock mass can also be assessed using numerical modelling methods. Commercially available modelling software includes the Fast Lagrangian Analysis of Continua (FLAC) model. SCT has also modelled the Elphinstone and Hynds Seam layout at a 4.5 m extraction height. The models were configured to obtain information on caving, face support behaviour, fracture distribution, pore pressure and hydraulic conductivity of the ground (SCT, 2014c). Two cases were modelled at 200 m and 300 m depth of cover, for single seam extraction. A distinct change in vertical hydraulic conductivity of the overburden was indicated at 75 m and 90 m above the extracted seam respectively (Figure 47).
Figure 47. Cumulative Vertical Conductivity – Single Seam Extraction at 200 m and 300 m Depth of Cover (SCT, 2014c).
It should be highlighted that numerical modelling of subsurface cracking requires robust calibration, verification and validation to minimise the potential for erroneous results and requires reference to measured data. For a greenfield project with no site specific monitoring data available, a numerical model would necessarily be calibrated against measured data from other similar mine sites. Consequently, numerical

SUBSIDENCE PREDICTION REPORT FOR THE HAIL CREEK TRANSITION PROJECT
50
GORDON GEOTECHNIQUES
modelling would not provide a higher level of accuracy than empirical methods in the prediction of subsurface cracking for a greenfield project, as the basis of the predictions would be essentially the same.
5.2.2.3 Microseismic Monitoring
Microseismic monitoring involves the use of geophones installed in boreholes to record the development of fractures by measuring microseismic events. Microseismic monitoring is one of the most reliable tools for determining the interface between continuous and discontinuous subsurface subsidence cracking. Published monitoring data is available from two Bowen Basin longwall mines. At North Goonyella Mine, microseismic monitoring of a 250 m wide longwall panel, at approximately 150 m depth of cover was carried out. The extraction height was up to 4 m high. As shown in Figure 48, the majority of microseismic events occur within 120 m of the extracted seam. These results indicate the monitored limit of continuous cracking is 120 m.
Figure 48. Location of Microseismic Events above LW3 at the North Goonyella Mine (Kelly and Gale, 1999).
Microseismic monitoring above the 200 m wide, Longwall 101 panel at Kestrel Mine indicates a marked reduction in events (i.e. cracking) at 90 m above the seam (Figure 49). This was taken to be the limit of monitored continuous cracking. No microseismic events were recorded higher than 115 m above the extracted seam

SUBSIDENCE PREDICTION REPORT FOR THE HAIL CREEK TRANSITION PROJECT
51
GORDON GEOTECHNIQUES
(Figure 49). The depth of cover and extraction height in this area of the mine were 220 m and 3 m respectively.
Figure 49. Location of Microseismic Events around LW101 at Kestrel Mine (Kelly and Gale, 1999).
5.2.3 Prediction of Subsurface Subsidence Cracking Effects due to Dual Seam Extraction
GGPL is not aware of empirical studies examining the height of subsurface cracking above dual seam longwalls; however, some recent physical modelling work by Ghabraie and Ren (2014) is detailed below to provide an understanding of the subsurface strata movement in a dual seam longwall mine.
5.2.3.1 Physical Modelling Methods
Ghabraie and Ren (2014) built a physical model to investigate the mechanism of surface and subsurface movements of the strata in a dual seam longwall environment (Figure 50). The upper seam, located 24 m above the lower seam, was

SUBSIDENCE PREDICTION REPORT FOR THE HAIL CREEK TRANSITION PROJECT
52
GORDON GEOTECHNIQUES
extracted first. The panel width in both seams was 120 m and the extraction height was 4.5 m. The depth of cover above the upper seam was 80 m, indicating supercritical subsidence behaviour (width to height ratio of 1.5). As shown in Figure 50, some reworking of the upper seam goaf occurs when the lower seam is extracted. The model indicates that the height of cracking above the upper seam is increased, once both seams are extracted. It is noted that additional cracking was not observed outside the previously caved zone. A conceptual model for this reworking of the upper seam goaf is shown in Figure 51.
Figure 50. Results of Physical Modelling of Dual Seam Subsidence (Ghabraie and Ren, 2014).

SUBSIDENCE PREDICTION REPORT FOR THE HAIL CREEK TRANSITION PROJECT
53
GORDON GEOTECHNIQUES
This sequence of extraction is the same as planned for the Project area and provides useful insight to the potential failure mechanisms for dual seam mining. Ghabraie and Ren (2014) found that the initial cracks formed by the extraction of the first seam could change the crack propagation above the second seam extracted. Subsidence from the extraction of the second seam opens up existing cracks and induces greater bedding separation. This is highlighted by the different displacement profiles for the two mining scenarios (Figure 51). The subsurface strata cracking profile after extraction of the first seam shows a balanced movement between horizontal and vertical components (Figure 51). In comparison, after the second seam is extracted the vertical movement is mainly restricted to a wedge shaped area, shown by dotted red line in Figure 51. Outside this wedge area, the horizontal displacement is the predominant displacement component.
Figure 51. Displacement Profiles of Upper and Lower Seam Extraction (Ghabraie and Ren, 2014).

SUBSIDENCE PREDICTION REPORT FOR THE HAIL CREEK TRANSITION PROJECT
54
GORDON GEOTECHNIQUES
5.2.3.2 Numerical Methods
As well as the single seam layout, SCT has also modelled the Elphinstone and Hynds multiseam layout for a 4.5 m extraction height, at both 220 m and 300 m depth of cover (SCT, 2014c). The modelling indicates an increase in the conductivity of the reworked Elphinstone Seam overburden compared to the single seam extraction case (Figure 47). These results are consistent with the findings of the physical modelling study documented above. This modelling work by SCT indicates a change in the hydraulic conductivity in the overburden at approximately 150 m and 170 m for the two cases at 220 m and 300 m depth of cover (Figure 52 and Figure 53).
Figure 52. Hydraulic Conductivity at 220 m Depth for Extraction of Both Seams (SCT, 2014c).

SUBSIDENCE PREDICTION REPORT FOR THE HAIL CREEK TRANSITION PROJECT
55
GORDON GEOTECHNIQUES
Figure 53. Hydraulic Conductivity at 300 m Depth for Extraction of Both Seams (SCT, 2014c).
5.2.4 Comparative Assessment of Subsurface Subsidence Cracking Predictions for Single Seam Extraction
5.2.4.1 Water Inflow Events in the Bowen Basin
Seedsman and Dawkins (2006) provide a comprehensive summary of subsurface subsidence cracking and water inflow events in the Bowen Basin. Seedsman and Dawkins report that:
no major surface water inflows to longwall mining areas have occurred in the Bowen Basin where the depth of cover has exceeded 120 m; and
no major groundwater inflows to longwall mining areas have occurred in the Bowen Basin where the distance from the seam to the aquifers is more than approximately 90 m.
Klenowski (2000) reports on the inflow of water at the Oaky Creek Mine and the German Creek mining complex in the central part of the Bowen Basin. These mines target the German Creek Coal Measures, which comprise a sequence of sandstones, siltstones, mudstones and coal seams similar to the Project underground area. Klenowski concluded that unrestricted inflow from the zone of continuous cracking generally occurs to a height of about 120 m above the longwall mining area. The inflow rates for different heights of cracking in the German Creek mining complex, as

SUBSIDENCE PREDICTION REPORT FOR THE HAIL CREEK TRANSITION PROJECT
56
GORDON GEOTECHNIQUES
well as other comparable mining operations, extracting single seam longwalls, throughout the Bowen Basin, Australia and overseas, are plotted in Figure 54.
0
25
50
75
100
125
150
175
200
0 25 50 75 100 125 150 175 200 225 250 275 300 325
WATER INFLOW (litres/second)
HEIGHT TO WATER BODY (m)
German Creek Area
NSW
Crinum
Overseas
120 m Interburden
Figure 54. Summary of Water Inflow Events.
These conclusions are consistent with the mining conditions at the Aquila mine at German Creek, where no significant cracking or slabbing of the strata was encountered in the roadways developed 110 m above the extracted goaf. Evidence from Crinum Mine and Kestrel Mine, suggests that the presence of Tertiary clay materials in the overburden within the cracking zone may have retarded water inflow rates to underground workings (Seedsman & Dawkins (2006), Gale (2008)). Similar Tertiary clays that could minimise inflows of water are not present in the Project area.
5.2.4.2 Numerical Modelling
Published numerical modelling studies by Gale (2008) in the Oaky Creek area showed a distinct decrease in the vertical conductivity to around 10-6 m/s, at beyond 90 to 100 m above the coal seam (Figure 55). This is also consistent with the field observations described above. The progressive reduction in vertical conductivity from 100 m/s close to the extracted seam, decreasing to 10-4 m/s at the top of continuous cracking zone is also clearly evident in Figure 55.

SUBSIDENCE PREDICTION REPORT FOR THE HAIL CREEK TRANSITION PROJECT
57
GORDON GEOTECHNIQUES
Figure 55. Vertical Conductivity through a Numerical Model in the Oaky Creek Mining Area (Gale, 2008).
5.2.4.3 Summary of Data
Field observations of heights of subsurface subsidence cracking from mines in QLD, NSW and overseas are summarised in Table 3. Gale (2008) also reports that 105 m of rock head is used as a standard buffer distance to minimise the risk of inflow events in the UK. This thickness is consistent with monitoring conducted in NSW mines, where the potential for surface water to flow into underground longwall workings is recognised if the longwall panel is less than 100 m to 150 m below the surface.
5.2.5 Conclusions
The estimation of the height and behaviour of subsurface subsidence cracking is a complex issue. Specifically relating to water impacts, there is no simple calculation to estimate the height of the continuous and discontinuous zones. The estimate is further complicated by the lack of monitoring data available for dual seam longwall extraction. Reference to measured data and site-specific experience is a means of addressing this issue for single seam extraction. For dual seam extraction, the physical model studies detailed earlier have been referred to for the Project underground mining area at Hail Creek.

SUBSIDENCE PREDICTION REPORT FOR THE HAIL CREEK TRANSITION PROJECT
58
GORDON GEOTECHNIQUES
This approach is considered to provide a suitable basis for the assessment of the likely behaviour of subsurface subsidence for the Project underground mining area. With the available data, conceptual models for the subsurface effects of both single seam and dual seam extraction, in the Project underground mining area, are discussed in the following sections.
Mining Area Height of Cracking
Discussion/Evidence
Crinum, QLD 90-100 m Height to overlying basalt/sand aquifers in the Tertiary (Seedsman and Dawkins, 2006).
NSW 100-150 m The potential for surface water to flow into underground longwall workings is recognised if the longwall panel is less than 100 m to 150 m below the surface (Seedsman and Dawkins, 2006).
Oaky Creek and German Creek, QLD
<160 m For ponded water at cover depths greater than 160 m, remedial works are generally not required and standard underground pumping systems are capable of handling minor increases in flow (Klenowski, 2000).
Unrestricted inflow generally occurs to a height of about 120 m above the active mine area, with inflow rates progressively reducing as the depth of cover increases above 120 m (Klenowski, 2000).
Kestrel, QLD <115 m Microseismic monitoring of Longwall 101. (Kelly and Gale, 1999).
North Goonyella <120 m Microseismic monitoring of Longwall 3. (Kelly and Gale, 1999).
Wyee, NSW 40-63 m Wide panels and strong, massive roof strata (Forster and Enever, 1992).
Cooranbong, NSW 58 m Wide panels and strong, massive roof strata (Forster and Enever, 1992).
Wistow Mine, UK 77 m Limestone aquifer (Whittaker and Reddish, 1989).
UK <105 m of rock head
Guideline to minimise the risk of inflow (Gale, 2008).
Northern Bowen Basin <170-250 m Longwalls (314 m wide and 4.5 m high) successfully extracted beneath the Isaac River.
Table 3. Field Observations and Guidelines for the Height of Cracking.
5.2.5.1 Prediction for Single Seam Extraction
Based on the site-specific data from the Bowen Basin, including microseismic monitoring and documented unrestricted inflow events, an upper bound height of continuous cracking for single seam extraction of either the Elphinstone or Hynds Seam is proposed at 120 m, as detailed in the conceptual model in Table 4. This is consistent with the available data from NSW and international longwall mining operations and hence provides a robust basis for the assessment of potential groundwater impacts associated with continuous cracking in single seam longwall mining areas.

SUBSIDENCE PREDICTION REPORT FOR THE HAIL CREEK TRANSITION PROJECT
59
GORDON GEOTECHNIQUES
Height above
Seam
Description Thickness
270
260
250
240
230
220
210
200
190
180
170
160
150
140
130
120
110
100
90
80
70
60
50
40
30
20
10Caved zone as evidenced by microseismic
data and empirical models.
0 Elphinstone or Hynds Seam
Single Seam
Constrained strata overlain by (elastic
and) surface tension cracking zone.NA
Zone of connective cracking.
Zone of discontinuous cracking resulting
predominantly in bed separations with
negligible vertical cracks.
60m
120m
Table 4. Conceptual Model of the Subsurface Effects for Single Seam Extraction.
5.2.5.2 Prediction for Dual Seam Extraction
The conceptual model proposed for dual seam extraction is shown in Table 5 below. This model has referenced the physical modelling studies of Ghabraie and Ren (2014) to provide a better understanding of the failure mechanisms in the overburden. Due to potential weakening of the overburden strata in the discontinuous cracking zone above the Elphinstone Seam, by the extraction of the Hynds Seam, the zone of continuous cracking is conservatively inferred to extend to 180 m above the Elphinstone Seam extraction (Table 5).

SUBSIDENCE PREDICTION REPORT FOR THE HAIL CREEK TRANSITION PROJECT
60
GORDON GEOTECHNIQUES
This 50% increase from the predicted continuous cracking height for single seam extraction should more than adequately account for the uncertainty associated with dual seam extraction and therefore provide a conservative basis for the purposes of assessing potential worst case groundwater impacts.
Height above
Elphinstone
Seam
Height above
Hynds Seam
Thickness Description
220 280
210 270
200 260
190 250
180 240
170 230
Zone of discontinuous cracking due to Elphnstone
Seam extraction resulting predominantly in bed
separations with negligible vertical cracks.
160 220
150 210
140 200
130 190
120 180
110 170
100 160
90 150
80 140
70 130
60 120
50 110
40 100
30 90
20 80
10 70
0 60 Elphinstone Seam
50
40
30
20
10Caved zone as evidenced by microseismic data and
empirical models.
0 Hynds Seam
Zone of connective cracking.
60m
Previously discontinuously cracked zone experiences
reworking of existing cracks and bedding. This
increases the void and eventually causes failures,
resulting in failure of the upper layers (ref Section 3,
Ghabraie and Ren, 2014).
Dual Seam
NAConstrained strata overlain by (elastic and) surface
tension cracking zone.
This subsidence regime mainly involves opening
existing cracks with minimal generation of new cracks.
This results in a similar crack propagation profile to
single seam extraction. Vertical displacement due to
second extraction mainly restricted to the previously
disturbed zone (ref Section 4, Ghabraie and Ren, 2014).
This zone may have been weakened by extraction of
the Hynds Seam and there is the possibility of some
connective cracking to account for uncertainties in the
failure mechanism due to dual seam extraction.
60m
Zone where existing cracks and bedding are reworked
(ref Section 3, Ghabraie and Ren, 2014). Vertical
displacement due to second extraction mainly
restricted to the previously disturbed zone (ref Section
4, Ghabraie and Ren, 2014). Subsidence regime mainly
opening existing cracks with minimal generation of
new cracks.
60m
60m
Table 5. Conceptual Model of the Subsurface Effects for Dual Seam Extraction.

SUBSIDENCE PREDICTION REPORT FOR THE HAIL CREEK TRANSITION PROJECT
61
GORDON GEOTECHNIQUES
5.2.5.3 Connective Cracking to the Surface
In any areas where the depth of cover to the extracted coal seams is less than the combined height of connective cracking and surface crack depth, connective cracking to the surface could potentially occur.
Where single seam extraction only is carried out, there is potential for connective cracking to occur within a very small area in the north western part of the area where the depth of cover to the Elphinstone Seam is less than 130 m (120 m for connective cracking and 10 m for surface cracks) (Figure 56). No connective cracking above areas where single seam extraction of the Hynds Seam is proposed is predicted (Figure 56).
Figure 56. Potential Areas of Connective Cracking to the Surface – Single Seam Extraction.

SUBSIDENCE PREDICTION REPORT FOR THE HAIL CREEK TRANSITION PROJECT
62
GORDON GEOTECHNIQUES
In the dual seam extraction areas, connective cracking may occur where the depth above the Elphinstone Seam is less than 190 m (Figure 57). Any surface cracks that develop in these areas would be sealed through crack remediation.
Figure 57. Potential Areas of Connective Cracking to the Surface – Dual Seam Extraction.

SUBSIDENCE PREDICTION REPORT FOR THE HAIL CREEK TRANSITION PROJECT
63
GORDON GEOTECHNIQUES
5.3 Surface Cracking
5.3.1 Tension Cracks
Subsidence related cracking of the surface will develop in the Project underground mining area. Whether it is discernible from the natural cracking that characterises some of the soils of the area will depend on the interaction between the cracks, the soil and water. The areas with the highest potential for cracking are those located at the panel edges where the maximum tensile strain occurs. It is noted that based on the principles of fracture mechanics, there is likely to be a direct relationship between crack width and crack depth i.e. narrow surface cracks will be shallower than wide cracks. Deeper and wider cracking could be associated with areas of high tensile strains. The widest of these cracks are predicted to extend to no more than 10 m below ground level based on the model of Bai and Kendorski and observations at other Bowen Basin mine sites (Figure 46).
5.3.1.1 Single Seam
MSEC (2007) also proposed a relationship between crack width and depth of cover with the severity and frequency of surface cracking reducing as the depth of cover increases (Figure 58).
0
20
40
60
80
100
120
140
160
180
200
0 50 100 150 200 250 300 350 400 450 500 550 600 650
CRACK W
IDTH
(mm)
DEPTH OF COVER (m)
Flat Terrain Data
Valley Data
Elphinstone Seam Depth Range ‐ Single Seam Extraction
Hynds Seam Depth Range ‐ Single Seam Extraction
Figure 58. Crack Width vs. Depth of Cover (reproduced from MSEC, 2007).

SUBSIDENCE PREDICTION REPORT FOR THE HAIL CREEK TRANSITION PROJECT
64
GORDON GEOTECHNIQUES
Based on Figure 58, and experience at a number of operating Bowen Basin longwall mines, the maximum crack widths predicted in single seam extraction areas are 200 mm in the shallow areas, decreasing to <50 mm in the deeper areas (Figure 58).
5.3.1.2 Dual Seam
As well as depth of cover, ground strain is also a factor contributing to surface cracking with the largest surface crack widths predicted to occur where the strains are the highest. With reference to the predicted strains for the single seam and dual seam extraction areas in Figure 34 and Figure 40 respectively, wider cracks are expected in the dual seam extraction areas due to higher strain predictions compared to the single seam areas, at the same depth of cover. Maximum crack widths in the deeper areas of the dual seam extraction are expected to be up to 100 mm, compared to 50 mm after single seam extraction, due to the increased strains. In the shallower parts of the dual seam area, crack widths may locally exceed 200 mm in width.
5.3.1.3 Type and Location of Cracks
Surface cracks are typically located in the tensile zone around the perimeter of longwall panels. Recent surveys of surface cracking at other Bowen Basin longwall mines, indicates that these predicted maximum subsidence crack dimensions are likely to be conservative. Some examples of subsidence cracks from Bowen Basin longwall mines are shown in Figure 59.
Figure 59. Examples of Subsidence Cracks.
5.3.2 Buckling and Heaving
When the near-surface strata break, the resulting blocks of rock interact and can produce localised movements. As well as surface cracking, other subsidence impacts include buckling and heaving as shown in Figure 60.
Crack width = 100 mm Crack width = 75 mm

SUBSIDENCE PREDICTION REPORT FOR THE HAIL CREEK TRANSITION PROJECT
65
GORDON GEOTECHNIQUES
Figure 60. Heaving and Buckling.
These types of effects tend to occur less frequently than tension cracks and occur more commonly within the centre of the longwall panel area, rather than around the perimeter.
5.3.3 Remediation Measures for Surface Tension Cracks and Buckling
As mining proceeds, subsided areas should be visually inspected on a regular basis for the formation of surface tension cracks and buckling, particularly around the perimeter of the active panel where the tensile strains are greatest (Figure 34 and Figure 40). At the completion of each longwall panel, crack locations should be inspected and assessed for the level of treatment required to rehabilitate each crack. In those areas where the tension cracks are narrow, typically <0.2 m, the following rehabilitation is recommended:
Ripping or ploughing of the cracks using a small dozer, grader or tractor.
Allow the area to regenerate naturally through inherent seed resources, vegetation propagation from rootstock and recruitment from adjoining undisturbed edges.
Where the cracks are wider (>0.2 m), more intensive rehabilitation earthworks are required including:
Stripping the topsoil from around the cracks, excavating and backfilling the cracks.
Respreading of topsoil over the area to allow natural regeneration from the seed bank in the topsoil and from the rootstock and recruitment from the adjacent vegetation.
Minimal clearing should be undertaken during the rehabilitation, with disturbance limited to a narrow strip (2-3 m) along the length of the crack. Erosion and sediment controls may also be required during the revegetation stage. This may include the installation of minor diversion drains, hay bales and/or silt fences.

SUBSIDENCE PREDICTION REPORT FOR THE HAIL CREEK TRANSITION PROJECT
66
GORDON GEOTECHNIQUES
Buckling and heaving should be rehabilitated as required, through regrading excess soil material. Regeneration of vegetation and monitoring will be as per the tension crack rehabilitation program described above. In areas of grazing, stock should be temporarily excluded from actively subsiding and rehabilitated areas with fencing to allow grass cover and seed store to recover and also prevent injury to animals. Monitoring of rehabilitated areas should be undertaken to ensure that the surface subsidence impacts have been successfully rehabilitated and disturbed vegetation is regenerating. Some maintenance work such as refilling of cracks and reseeding may be required. It should be highlighted that surface subsidence impacts and associated rehabilitation will occur progressively over approximately 23 years of mining in the Project area. During this time only relatively small areas at any one time will be effected by subsidence and require rehabilitation. 5.4 Surface Drainage Effects Subsidence can result in the formation of localised depressions in the surface topography that can cause surface water ponding (Figure 61). The post-subsidence surface topography has been used to assess the potential for ponding in the surface water assessment (Hatch, 2015).
Figure 61. Water Ponding over a Longwall Panel – Bowen Basin Longwall Mine.

SUBSIDENCE PREDICTION REPORT FOR THE HAIL CREEK TRANSITION PROJECT
67
GORDON GEOTECHNIQUES
5.5 Subsidence Monitoring Program The subsidence monitoring program for the Project area should include:
1. Subsidence surveys.
2. Inspection of the actively subsiding areas.
3. Targeted watercourse monitoring.
4. Monitoring of the overall condition of the watercourses in the area.
5. Groundwater monitoring. The subsidence surveys should include both centre line and cross line monitoring of each longwall panel. The actual subsidence profiles should be compared with the predicted profiles. During longwall mining, the surface above the panels should be regularly inspected to identify any potential effects of subsidence including tension cracks and ponding. Photo point monitoring before and after rehabilitation is recommended to allow a comparison of rehabilitated areas to the pre-mining conditions. The characteristics and location of all surface subsidence features should be recorded. Regular inspections along the watercourses to identify potential erosion and instability areas affected by subsidence are also recommended during longwall extraction. These inspections should also be carried out after flow events and will be the basis for determining if erosion control and stabilisation earthworks are required. As well as the active mining areas, the overall condition of the watercourses in the area should be compared against the baseline assessments at a nominated interval, typically every five years. Finally, a program of groundwater monitoring is recommended across the Project underground mining area.

SUBSIDENCE PREDICTION REPORT FOR THE HAIL CREEK TRANSITION PROJECT
68
GORDON GEOTECHNIQUES
6 CONCLUSIONS The key conclusions from this report include:
1. Vertical subsidence is predicted to reach a maximum of 6.9 m in the shallower dual seam mining areas. In the deepest part of the mining area, maximum subsidence is predicted to reduce to <5 m. In the southern part of the area where only the Hynds Seam would be extracted the maximum predicted subsidence is 2.5 m. Far field subsidence impacts are not considered significant on the surface due to the flat to gently undulating topography above the underground mining area.
2. The maximum tensile strains due to dual seam extraction are predicted to
range in magnitude up to 51 mm/m. Maximum compressive strains are predicted to range up to 47 mm/m. 80% of the strains due to dual seam extraction are predicted to be less than 20 mm/m.
3. The maximum tilts developed due to dual seam extraction in the shallower part
of the underground area are predicted to range up to 14% or 140 mm/m. 85% of the tilts across the area are predicted to be less than 60 mm/m, which is equivalent to a change in slope of 3.4°.
4. Based on subsidence monitoring at Bowen Basin longwall mines in similar
geology, greater than 97% of the maximum subsidence is predicted to typically occur within six weeks after longwall mining is completed, assuming an industry average retreat rate of 100 m/week.
5. There is confidence in the subsidence predictions due to the amount of
monitoring data available from more than 25 years of underground mining experience in the Bowen Basin mining area. This data has provided a sound basis to enable conservative prediction of potential environmental impacts due to subsidence impacts. It is considered unlikely that there would be any significant deviations from the current predictions due to topographic, geological or geotechnical variations.
6. Based on experience in Australia and overseas, continuous subsurface subsidence cracking and resultant unrestricted inflow generally occurs to a height of about 120 m above the active longwall in single seam extraction areas, with inflow rates progressively reducing above 120 m. As such, continuous cracking up to 120 m above the longwall panels extracted in virgin ground can be expected.
7. In the dual seam mining areas, a more conservative height of 180 m for
continuous cracking above the Elphinstone Seam should be assumed. This 50% increase from the continuous cracking height for single seam extraction should more than adequately account for the uncertainty associated with the continuous cracking height predictions in dual seam areas and therefore provide a conservative basis for the purposes of assessing potential worst case groundwater impacts.

SUBSIDENCE PREDICTION REPORT FOR THE HAIL CREEK TRANSITION PROJECT
69
GORDON GEOTECHNIQUES
8. Surface subsidence cracks will develop above the proposed underground mining areas. The areas with the highest potential for cracking are those located at the panel edges where the maximum tensile strain occurs. The widest of these cracks are predicted to extend to no more than 10 m below ground level. Maximum surface crack widths in excess of 200 mm could be expected above dual seam extraction areas in the shallower parts of the mining area. At greater depths in single seam extraction areas, maximum crack widths <50 mm could be expected. Cracks of this size can be readily remediated.

SUBSIDENCE PREDICTION REPORT FOR THE HAIL CREEK TRANSITION PROJECT
70
GORDON GEOTECHNIQUES
7 BIBLIOGRAPHY AusIMM (2009). Australasian Coal Mining Practice – Monograph Series 12. Pp1085. Bai, M, and Kendorski F.S. (1995). Chinese and North American high extraction underground coal mining strata behaviour and water protection experience and guidelines. 14th Conference on Ground Control in Mining. 209-217. Byrnes R. 2003. Case studies in the application of influence functions to visualising surface subsidence. COAL2003 - 4th Underground Coal Operators Conference. AusIMM Illawarra Branch. Carlson Web Site. www.carlsonsw.com. Douglas Partners (2015). Hail Creek Transition Project Groundwater Assessment. Forster, I., and Enever, J. (1992). Hydrogeological response of overburden strata to underground mining, Central Coast, NSW. Office of Energy Sydney. Gale, W. (2008). Aquifer inflow prediction above longwall panels. ACARP Project C13013. Ghabraie, B., and Ren, G. (2014). Investigating characteristics of strata movement due to multiple seam mining using a sand-plater physical model. Proceedings of the 9th Triennial Conference on Mine Subsidence. Hatch (2015). Hail Creek Transition Project Surface Water Assessment. International Mining Consultants (2011). Surface Subsidence Prediction Report for the Red Hill Mine (RHM). Report No. IMC01384. Kelly, M. and Gale, W. 1999. Ground behaviour about longwall faces and its effect on mining. ACARP Project C5017. Klenowski, G. (2000). The influence of cracking on longwall extraction. ACARP Project C5016. Li, G., Steuart, P., Paquet, R., and Ramage, R. (2010). A case study on mine subsidence due to multi-seam longwall extraction. 2nd Australasian Ground Control in Mining Conference. Pp. 191-200. MSEC (2007). General discussion on systematic and non-systematic mine subsidence ground movements. Revision A, August 2007. MSEC (2012). An Independent Review of Mine Subsidence Predictions and Impact Assessments of Upper Liddell Seam - Longwalls 1 to 8 for Ashton Coal Operations Limited. Report Number: MSEC541. Ashton Coal website.

SUBSIDENCE PREDICTION REPORT FOR THE HAIL CREEK TRANSITION PROJECT
71
GORDON GEOTECHNIQUES
MSEC (2012). Moranbah South Project – Subsidence Impact Assessment. Report No. MSEC558. Palgas Pty Ltd (2014). Hail Creek Gas Production Estimate. Report No. RIO1889. RTCA (2014). Hail Creek Transition Project - Section 226 Consideration Report (Prepared by Resource Strategies Pty Ltd). Project No. RIO-13-04. Document No. 00570149. Seedsman, R.W. and Dawkins, A. (2006). Techniques to predict and measure subsidence and its impacts on the ground water regime above shallow longwalls. ACARP Project C13009. South Galilee EIS (2012). Life of Mine Subsidence Deformations. Strata Control Technology (2014a). Hail Creek Underground Project – Geotechnical Characterisation for Pre-Feasibility Study. Report No. RTCA3854A. Strata Control Technology (2014b). Hail Creek Underground Project – Mineability for Pre-Feasibility Study. Report No. RTCA3854B. Strata Control Technology (2014c). Hail Creek Studies. PowerPoint Presentation. June 2014. Strata Control Technology (2014d). Hail Creek Connectivity Update FLAC Caving Models - Preliminary Results. PowerPoint Presentation. October 2014. Whittaker, B.N., and Reddish, D.J. (1989). Subsidence – Occurrence, Prediction and Control. Elsevier.

SUBSIDENCE PREDICTION REPORT FOR THE HAIL CREEK TRANSITION PROJECT
72
GORDON GEOTECHNIQUES
8 GLOSSARY Aquifer A saturated, permeable, geologic unit that can transmit
significant quantities of ground water under ordinary hydraulic gradients and is permeable enough to yield economic quantities of water to wells.
ASCII American Standard Code for Information Interchange.
ASL Above Sea Level.
Compensation Width Distance from the rib edge to the inflexion point or point of half the maximum subsidence.
Empirical Based or acting on observation and experiment, not on theory.
Floor Strata immediately below the extracted seam.
Goaf That part of a mine from which the coal has been partially or wholly removed.
Groundwater The supply of fresh water found beneath the ground surface, usually in aquifers, which supply wells and springs.
Hydrogeology The branch of geology dealing with the waters below the earth's surface and with the geological aspects of surface waters.
Influence Function A type of function used to solve inhomogeneous differential equations subject to specific initial conditions or boundary conditions.
LIDAR Light Detection and Ranging or Laser Imaging, Detection and Ranging.
LOMS Limit of Measurable Subsidence.
Longwall Mining A form of underground coal mining where a face of coal is mined in a single slice.
Modulus The ratio between applied stress and resultant strain.
Outbye The direction away from the coal face.
Overburden Sequence of strata above the extracted seam.
Pillar Coal that is not extracted within the underground workings.
Roof Strata immediately above the extracted seam.
SDPS Surface Deformation Prediction System.
Smax Maximum subsidence.
Stratigraphy A branch of geology that studies rock layers and layering. It is primarily used in the study of sedimentary and layered volcanic rocks.

SUBSIDENCE PREDICTION REPORT FOR THE HAIL CREEK TRANSITION PROJECT
73
GORDON GEOTECHNIQUES
Subsidence Sinking or settlement of the land surface, due to any of several processes. As commonly used, the term relates to the vertical downward movement of natural surfaces although small-scale horizontal components may be present. The term does not include landslides, which have large-scale horizontal displacements, or settlements of artificial fills.
Strain Relative change in the volume, area or length of a body as a result of stress. The change is expressed in terms of the amount of displacement measured in the body divided by its original volume, area, or length, and referred to as either a volume strain, areal strain, or one dimensional strain, respectively. The unit measure of strain is dimensionless, as its value represents the fractional change from the former size.
Tilt The rate of change in vertical subsidence between two points divided by the horizontal distance between those two points.
Voussoir Beam A single beam with vertical joints.