goodwood precinct public lighting … · roadway lighting on goodwood road is not covered by the...
TRANSCRIPT
Level 1/89 King William Street, Kent Town SA 5067 Phone: (08) 8364 6155 Fax: (08) 8364 6199 www.lucidconsulting.com.au
Civic Centre 181 Unley Rd, Unley, South Australia 5061 Telephone (08) 8372 5111, Facsimile (08) 8271 4886 www.unley.sa.gov.au
Prepared for City of Unley GOODWOOD PRECINCT PUBLIC LIGHTING STRATEGY REPORT Document No: 4397-003 Revision: REVISION 3 Date of Issue: May 2010

GOODWOOD PRECINCT LIGHTING STRATEGY REPORT
2
Contents 1 EXECUTIVE SUMMARY ........................................................................................................................ 4 2 INTRODUCTION ................................................................................................................................... 6
2.1 Background ...................................................................................................................................................... 6 2.2 Purpose of This Report ................................................................................................................................... 6 2.3 Information Sources ....................................................................................................................................... 6 2.4 Limitations ......................................................................................................................................................... 6 2.5 Australian Standard ........................................................................................................................................ 7
3 PUBLIC LIGHTING CONTROLS / CONNECTIONS ............................................................................... 8 3.1 Photo-electric (PE) Cell Control .................................................................................................................. 8 3.2 Time Clock Control ......................................................................................................................................... 8 3.3 ETSA Power Supply .......................................................................................................................................... 8 3.4 Connection to Private Building Supply ..................................................................................................... 8 3.5 Photo-voltaic (PV) or Solar Powered Installation ................................................................................... 8
4 PRESENT LIGHTING INSTALLATION ..................................................................................................... 9 4.1 Roadway Lighting ........................................................................................................................................... 9 4.2 Under Veranda Lighting ................................................................................................................................ 9 4.3 Building Feature Lighting ............................................................................................................................... 9 4.4 Footpath Lighting .......................................................................................................................................... 10 4.5 Tram Station Environs ................................................................................................................................... 10 4.6 Car Park Lighting ........................................................................................................................................... 10
5 PROPOSED LIGHTING STRATEGIES ................................................................................................... 11 5.1 General Strategy .......................................................................................................................................... 11
5.1.1 Option 1 – Fluorescent and Metal Halide Lighting ..................................................................... 12 5.1.2 Option 2 – LED Lighting ...................................................................................................................... 13 5.1.3 Energy Costs & Tariff Costs ................................................................................................................ 14
5.2 Roadway Lighting ......................................................................................................................................... 15 5.2.1 Option 1 ................................................................................................................................................. 15 5.2.2 Option 2 ................................................................................................................................................. 16 5.2.3 Environmental Impact ........................................................................................................................ 17 5.2.4 Energy Cost Analysis ........................................................................................................................... 18
5.3 Under Veranda Lighting .............................................................................................................................. 18 5.3.1 Option 1 ................................................................................................................................................. 18 5.3.2 Option 2 ................................................................................................................................................. 20 5.3.3 Environmental Impact ........................................................................................................................ 20 5.3.4 Energy Cost Analysis ........................................................................................................................... 21
5.4 Building/Precinct Feature Lighting ........................................................................................................... 21 5.4.1 Option 1 ................................................................................................................................................. 21 5.4.2 Option 2 ................................................................................................................................................. 22 5.4.3 Environmental Impact ........................................................................................................................ 22 5.4.4 Energy Cost Analysis ........................................................................................................................... 23
5.5 Footpath Lighting .......................................................................................................................................... 23 5.5.1 Option 1 ................................................................................................................................................. 23 5.5.2 Option 2 ................................................................................................................................................. 23 5.5.3 Environmental Impact ........................................................................................................................ 24 5.5.4 Energy Cost Analysis ........................................................................................................................... 24
5.6 Tram Station Environs ................................................................................................................................... 24 5.6.1 Option 1 ................................................................................................................................................. 24 5.6.2 Option 2 ................................................................................................................................................. 25 5.6.3 Environmental Impact ........................................................................................................................ 26 5.6.4 Energy Cost Analysis ........................................................................................................................... 26
5.7 Car Park Lighting ........................................................................................................................................... 26 5.7.1 Option 1 ................................................................................................................................................. 26 5.7.2 Option 2 ................................................................................................................................................. 27
GOODWOOD PRECINCT LIGHTING STRATEGY REPORT
3
5.7.3 Environmental Impact ........................................................................................................................ 27 5.7.4 Energy Cost Analysis ........................................................................................................................... 28
6 NEGOTIATIONS WITH ETSA UTILITIES / BUILDING OWNERS ............................................................. 29 6.1 Tariff Arrangements ...................................................................................................................................... 29
6.1.1 SLUoS Tariff ............................................................................................................................................. 29 6.1.2 CLER Tariff .............................................................................................................................................. 29 6.1.3 Energy Only Tariff ................................................................................................................................. 30 6.1.4 Metered Supply .................................................................................................................................... 30
6.2 Metering Arrangements .............................................................................................................................. 30 7 COST COMPARISON ......................................................................................................................... 31 8 SUMMARY AND RECOMMENDATIONS ............................................................................................ 32 9 APPENDIX A – PRECINCT AREA MAPS ............................................................................................. 33 10 APPENDIX B – REFERENCE LIST ......................................................................................................... 36 11 APPENDIX C – GLOSSARY ................................................................................................................ 37

GOODWOOD PRECINCT LIGHTING STRATEGY REPORT
4
1 EXECUTIVE SUMMARY
This report categorises all forms of public lighting in the Goodwood Precinct into the following categories:
Roadway Lighting
Feature Lighting
Under-veranda lighting
Footpath Lighting
Tram Environs Lighting
Car Park Lighting
The report discusses two options for the upgrade of all public external lighting for each of these categories within the precinct.
Option 1 involves a cost affective, energy efficient industry standard lighting solution for each type of lighting installation, which will aid in the enhancement of the character, heritage and culture of the precinct as well as generally improve visibility and perceived security.
Option 2 involves a lighting strategy that achieves the aesthetic requirements of Option 1 while also using industry best practice to provide maximum energy efficiency in the public lighting installation.
The estimated long term costs to upgrade lighting in the entire precinct for each option split into a suggested shared contribution between Council and building owners/tenants are as follows:
Option Lighting Type Roadway Lighting
Feature Lighting
Under-veranda Lighting
Footpath Lighting
Tram Environs Lighting
Car Park Lighting
1 Approximate Quantity
10 35 240 100 15 60
Approximate Cost Council
$10,000 $38,000 Nil $500,000 $25,000 $150,000
Approximate Cost Owners
Nil $22,000 $120,000 Nil $75,000 $150,000
2 Approximate Quantity
10 35 240 100 30 60
Approximate Cost Council
$20,000 $57,000 Nil $600,000 $50,000 $180,000
Approximate Cost Owners
Nil $33,000 $240,000 Nil $150,000 $180,000
Selected Option Total cost to Council Total cost to Owners
Option 1 $723,000 $367,000
Option 2 $907,000 $603,000
GOODWOOD PRECINCT LIGHTING STRATEGY REPORT
5
1- Option 1 is recommended to be offered as a minimum standard to be achieved for new developments and lighting upgrades in the precinct.
(Option 2 comes at a cost premium of approximately 30 – 40%. It is expected that this cost premium will become less significant in the future. Both options are compatible with one another so a mixture of each option is also feasible.)
2- An individual business case may need to be developed for individual lighting upgrade projects to further assess the exact cost premiums associated with Option 2 on a project-by-project basis.
The council may consider offering incentives to building owners / tenants that consider opting to implement an Option 2 lighting strategy for their building such as increased council capital contribution.
3- A project of this financial magnitude would require a long term strategic approach and Council would need to consider its role in funding infrastructure that is does not own.

GOODWOOD PRECINCT LIGHTING STRATEGY REPORT
6
2 INTRODUCTION
2.1 Background
The Goodwood precinct is generally defined as the street facing properties along the section of Goodwood Road in Goodwood spanning from Leader Street/Parsons Street to the north and Mitchell Street/Arundel Avenue to the south.
This report focuses mainly on the area from Tramway Park to Mitchell St.
This precinct contains a mixture of retail, office, some residential and mixed use buildings, public spaces, schools and churches, public library, cinema and community centre.
The City of Unley has developed a strategic action plan for the Goodwood Precinct as part of their Business and Economic Development Program. Specifically, the plan focuses on providing direction to revitalise the key public spaces to enhance the existing social, cultural and economic aspects of the precinct.
An Urban Design Framework report exists for the precinct. Finalised in August 2009, the report highlighted the need for a formalised Public Lighting Strategy.
2.2 Purpose of This Report
This report provides the formalised Public Lighting Strategy with the primary aims of enhancing the character, heritage and culture of the precinct, improve safety and perceived security, in turn promoting economic development and investment opportunities.
An equally important consideration of this report and the Public Lighting Strategy is the environmental impact of additional and ongoing public lighting enhancements, including energy consumption and light pollution.
The report serves as a set of guidelines for use by council for all public and private property developments when considering the type of external lighting to be installed as part of a general upgrade.
2.3 Information Sources
Site inspections were carried out during the day to determine the extent and arrangement of existing lighting systems in the precinct and to assess areas for potential lighting enhancements, including site visits to properties nominated for the detailed design component of this project. This was followed up by night time inspections to determine the effectiveness of the existing lighting and to carry out night trials of proposed lighting systems.
2.4 Limitations
The Public Lighting Strategy considers only functional and decorative lighting to external spaces, pathways and building features for the above described section of Goodwood Road. The strategy also extends to the lighting strategy for the interface of side roads abutting Goodwood Road.
Roadway lighting on Goodwood Road is not covered by the Strategy as the Council is presently investigating undergrounding of the overhead power lines on the road as part of a separate project.
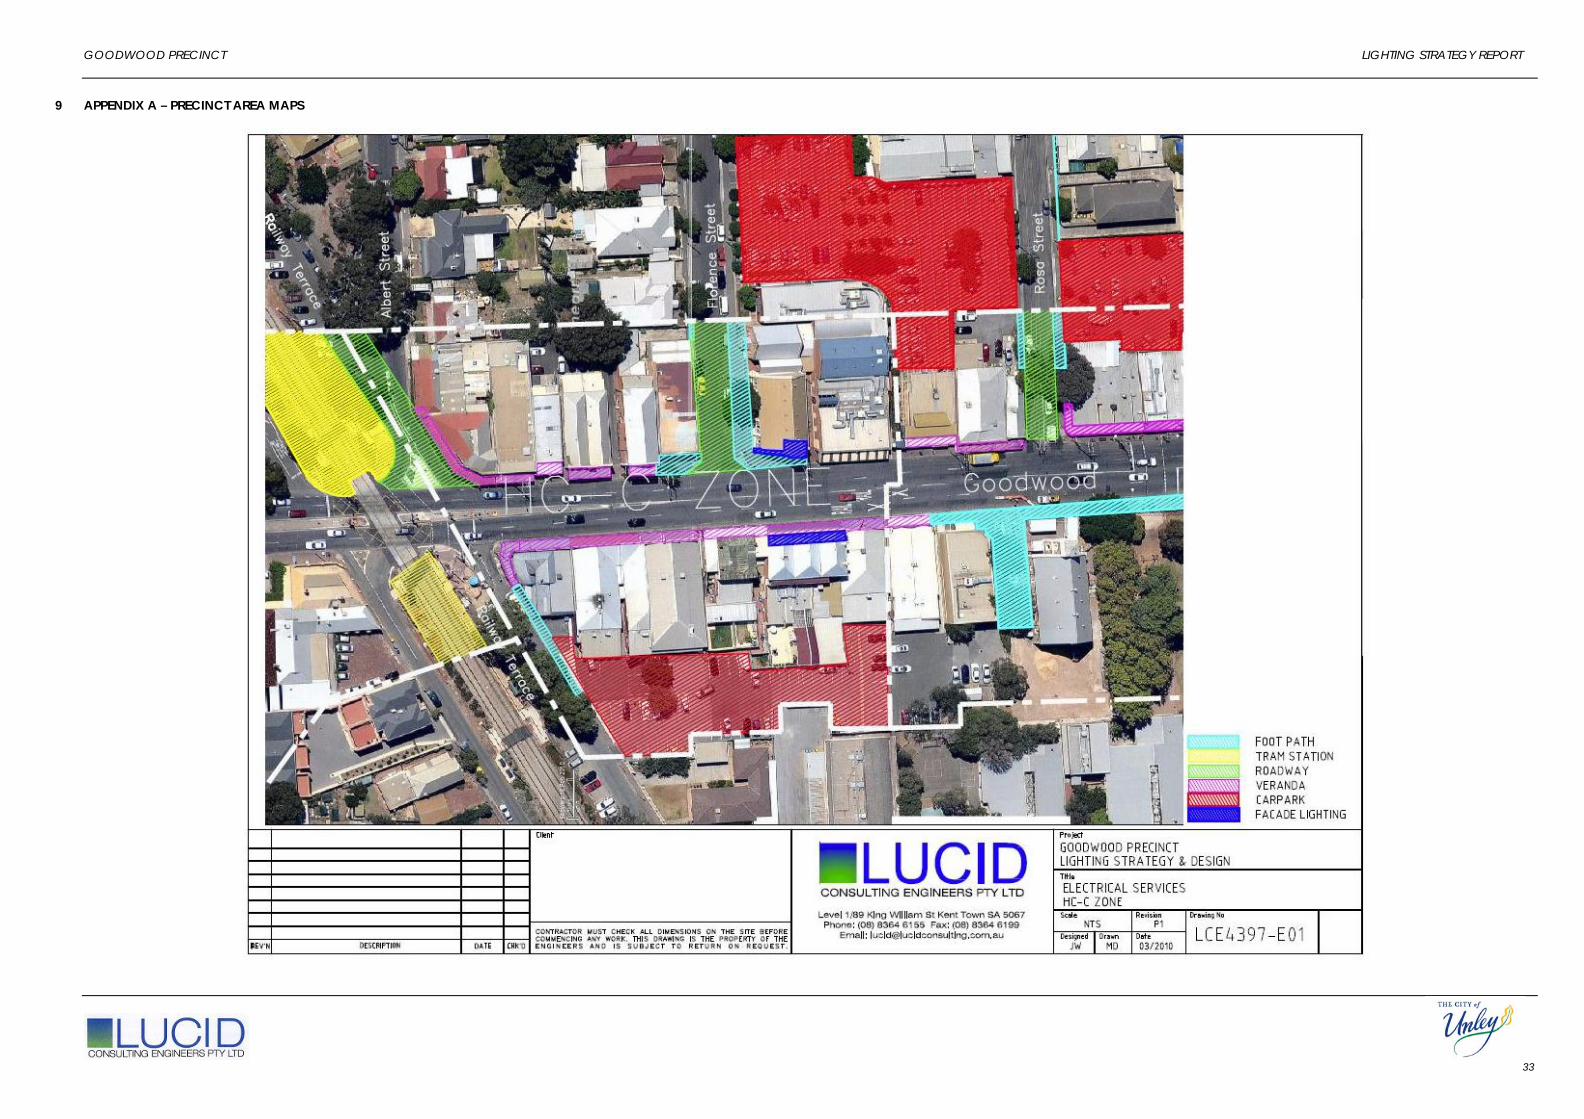
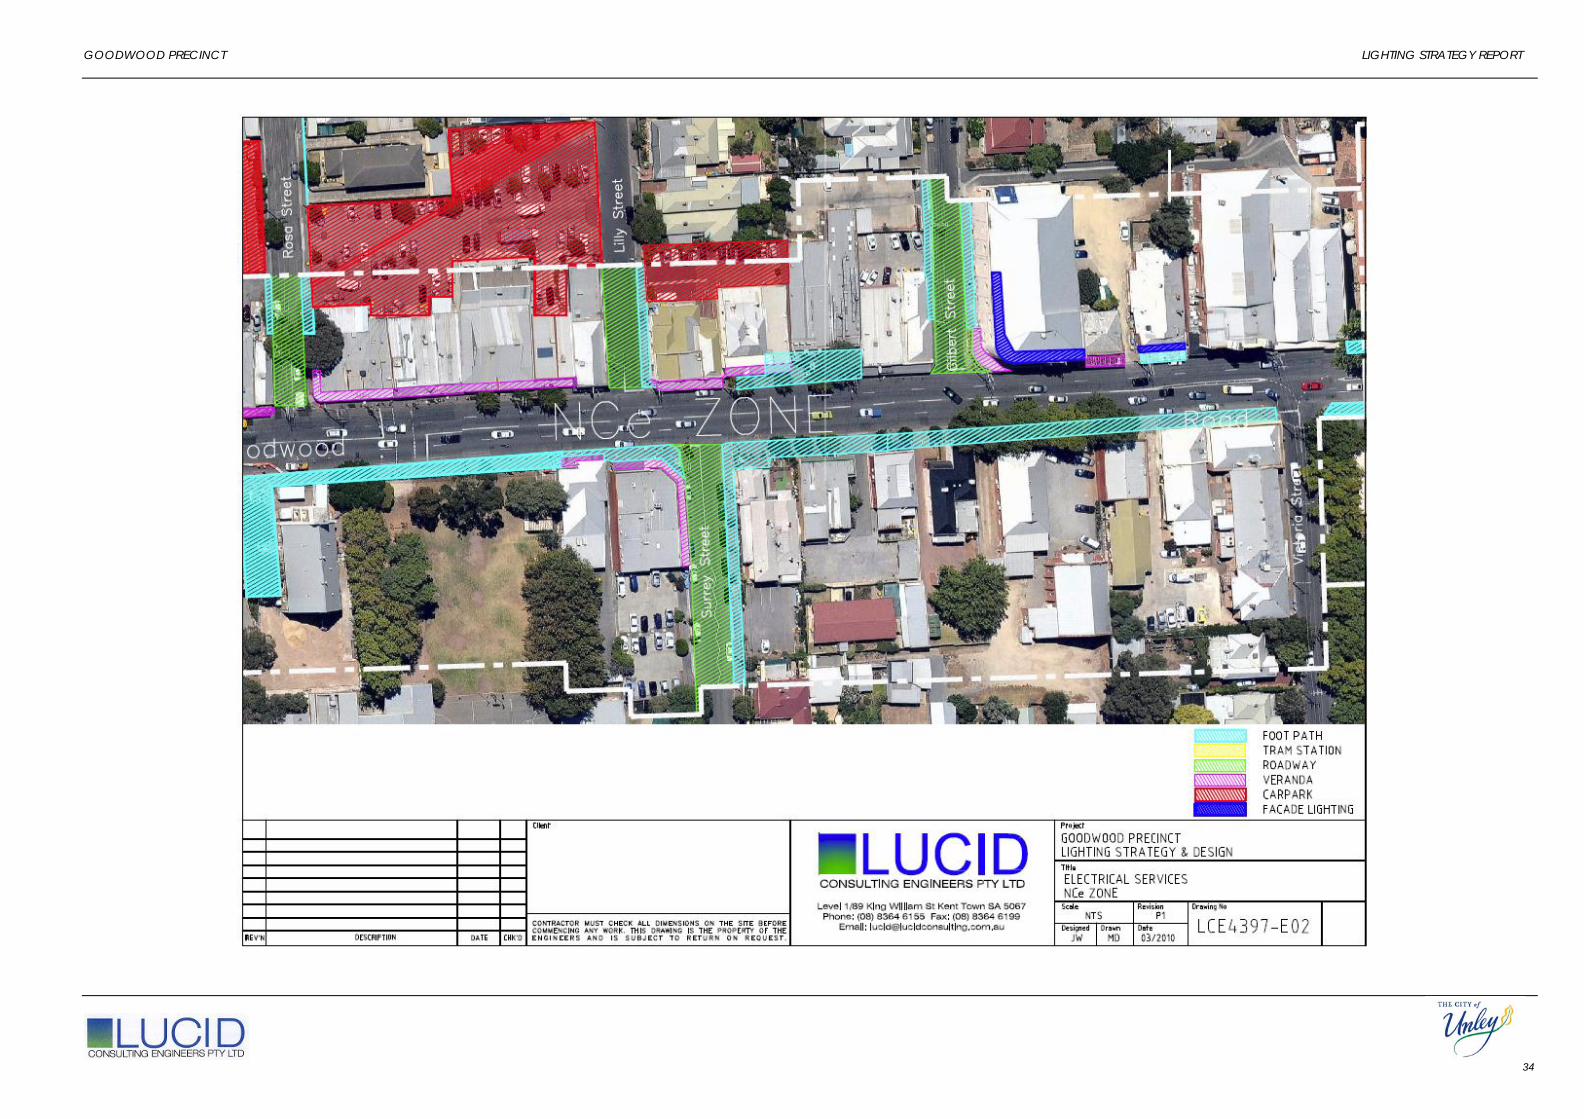
The areas covered by the scope of this report are illustrated by the maps of the precinct (Appendix A)

GOODWOOD PRECINCT LIGHTING STRATEGY REPORT
7
2.5 Australian Standard
Public lighting is generally designed around the Australian Standard series AS1158. This is a non-required standard that defines the appropriate lighting levels for different public spaces. There are different lighting categories based on whether the dominant visual requirements of a space are for pedestrians (P Categories) or vehicles (V Categories). These categories are further broken down into sub categories to distinguish between levels of traffic, need to enhance prestige or consideration of the risk of crime. South Australian Councils, DTEI and ETSA Utilities generally require new public lighting installations to be installed in accordance with the requirements of AS1158.
The requirements of the standard have an effect on the luminaire selected, the mounting height or the height of lighting columns, the light source (lamp) and the spacing and arrangement of luminaires.

GOODWOOD PRECINCT LIGHTING STRATEGY REPORT
8
3 PUBLIC LIGHTING CONTROLS / CONNECTIONS
As well as the type of light fitting and light source, the control of lighting should be considered with respect to the desired operation of lighting systems depending on their application.
3.1 Photo-electric (PE) Cell Control
Photo-electric cells sense the ambient light levels and allow the lighting to switch on when ambient light drops below a certain level, switching the lighting off when ambient light increases to a certain level. When used in isolation this causes the lighting to operate between the hours of dusk until dawn.
3.2 Time Clock Control
Some lighting installations may only be required for part of the night. In these instances, a time-clock can be used to switch lighting on and at prescribed times.
When used in conjunction with PE cell control, lighting can be made to switch on when ambient lighting drops to a certain level and then forced off at a prescribed time, when the lighting system is not required.
3.3 ETSA Power Supply
Generally, systems connected to the ETSA Utilities mains voltage network are controlled by PE cells mounted to each individual luminaire.
3.4 Connection to Private Building Supply
Where lighting is connected to a private electricity supply, the control of the lighting is more flexible and can be tailored to the specific application.
3.5 Photo-voltaic (PV) or Solar Powered Installation
In order to offset some of the energy used by public lighting, a photo-voltaic array can be installed on or near the lighting system.
Given the lighting system is required to operate during night hours, the generation of electricity cannot be used instantaneously by the lighting systems. This means storing the generated energy within battery arrays. Alternatively, the PV array could be grid connected, providing energy to the mains grid during the day to offset the energy used by the lighting system at night.
GOODWOOD PRECINCT LIGHTING STRATEGY REPORT
9
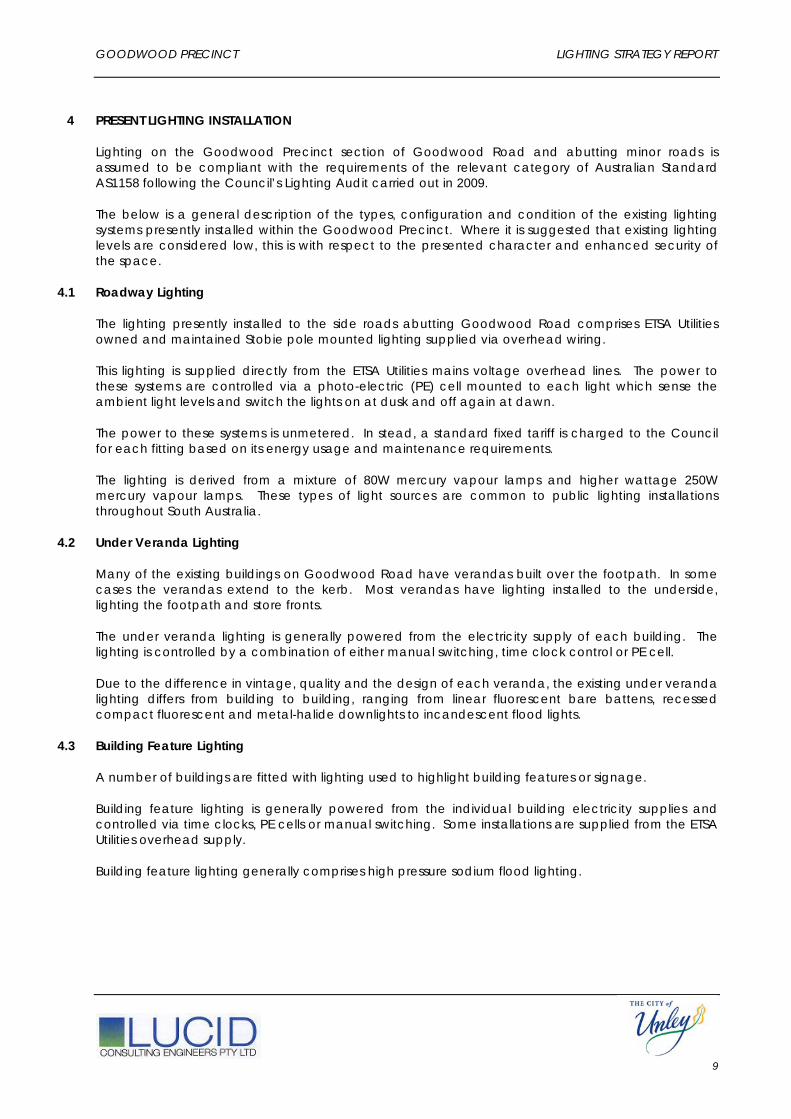
4 PRESENT LIGHTING INSTALLATION
Lighting on the Goodwood Precinct section of Goodwood Road and abutting minor roads is assumed to be compliant with the requirements of the relevant category of Australian Standard AS1158 following the Council’s Lighting Audit carried out in 2009.
The below is a general description of the types, configuration and condition of the existing lighting systems presently installed within the Goodwood Precinct. Where it is suggested that existing lighting levels are considered low, this is with respect to the presented character and enhanced security of the space.
4.1 Roadway Lighting
The lighting presently installed to the side roads abutting Goodwood Road comprises ETSA Utilities owned and maintained Stobie pole mounted lighting supplied via overhead wiring.
This lighting is supplied directly from the ETSA Utilities mains voltage overhead lines. The power to these systems are controlled via a photo-electric (PE) cell mounted to each light which sense the ambient light levels and switch the lights on at dusk and off again at dawn.
The power to these systems is unmetered. In stead, a standard fixed tariff is charged to the Council for each fitting based on its energy usage and maintenance requirements.
The lighting is derived from a mixture of 80W mercury vapour lamps and higher wattage 250W mercury vapour lamps. These types of light sources are common to public lighting installations throughout South Australia.
4.2 Under Veranda Lighting
Many of the existing buildings on Goodwood Road have verandas built over the footpath. In some cases the verandas extend to the kerb. Most verandas have lighting installed to the underside, lighting the footpath and store fronts.
The under veranda lighting is generally powered from the electricity supply of each building. The lighting is controlled by a combination of either manual switching, time clock control or PE cell.
Due to the difference in vintage, quality and the design of each veranda, the existing under veranda lighting differs from building to building, ranging from linear fluorescent bare battens, recessed compact fluorescent and metal-halide downlights to incandescent flood lights.
4.3 Building Feature Lighting
A number of buildings are fitted with lighting used to highlight building features or signage.
Building feature lighting is generally powered from the individual building electricity supplies and controlled via time clocks, PE cells or manual switching. Some installations are supplied from the ETSA Utilities overhead supply.
Building feature lighting generally comprises high pressure sodium flood lighting.
GOODWOOD PRECINCT LIGHTING STRATEGY REPORT
10
4.4 Footpath Lighting
Footpaths generally are not provided with a dedicated lighting system. Footpath lighting is covered via spill light from roadway lighting or Stobie pole mounted flood lighting. Some areas of footpath are lit by existing private post top lighting comprising incandescent or compact fluorescent lamps within domestic style external post top fittings. The ETSA Utilities Stobie mounted flood lighting, where fitted, comprises high-pressure sodium lighting
The existing post top systems are supplied from individual building electricity supplies. Conversely, the ETSA Utilities lighting is supplied from the ETSA mains voltage overhead power lines.
Controls for the post top lighting is via manual switching, time clock controls or PE cells, while the ETSA Utilities lighting utilises PE cell control exclusively.
4.5 Tram Station Environs
The tram station is presently lit using column mounted high pressure sodium lighting controlled by PE cells.
The tram station lighting is supplied by an unmetered ETSA Utilities supply.
4.6 Car Park Lighting
The main car parks within the Goodwood Precinct are located at the rear of the supermarket between Lily Street and Rosa Street and adjacent the Community Centre between Rosa Street and Florence Street.
The supermarket car park is lit by building and column mounted flood lights located throughout the car park. The lights use a mixture of high pressure sodium or mercury vapour lamps. This lighting is connected to the supermarket electricity supply.
The community centre car park is lit using decorative post top luminaires throughout the car park. These lights use metal-halide lamps and are connected and controlled from the Community centre.
Both systems are controlled via a combination of time clock and PE cells.

GOODWOOD PRECINCT LIGHTING STRATEGY REPORT
11
5 PROPOSED LIGHTING STRATEGIES
The following lighting strategies aim to address the shortcomings of the existing lighting systems in each of the above lighting applications.
Option 1 outlines lighting strategies that embody present best practice for public lighting using industry standard technologies. The suggested technologies are energy efficient, readily available, easily maintainable, cost effective and where proposed for connection to ETSA Utilities public lighting network, approved for use by ETSA Utilities.
Option 2 outlines lighting strategies that would introduce further energy efficiency by using new technologies. The additional energy efficiency generally comes at a cost premium, with maintainability and availability of spares also being affected.
5.1 General Strategy
The general characteristics of each source type play a part in the selection of an appropriate source for the intended use.
The characteristics of the major lamp types are summarised below. The characteristics are described in terms of lamp life and qualities of light, such as efficacy, colour temperature, colour rendition.
Efficacy refers to the quantity of luminous flux (light output) from the lamp per unit of input energy. Efficacy can be thought of as a measurement of energy efficiency, being measured in lumens-per-Watt. The following efficacy levels are typical for commercial light sources:
Low - 40 – 55 lm/W
Moderate - 55 – 70 lm/W
High - 70 – 100 lm/W
Very High - > 100 lm/W
Lamp depreciation is a measurement of the difference in light output at a given time as compared to the output when new. This lamp characteristic determines how much light will be available at the end of the lamp life, when the lamp is due for replacement. This characteristic is important when calculating the light levels in an installation, which must be calculated at end of lamp life. This characteristic ranges from 20% to 40%.
Colour temperature can be thought of as the degree of whiteness for a light source. Colour temperature refers to the equivalence in colour of a light source when compared with the light emitted from an ideal light source. As this measurement refers to the colour of a light source only, there is generally no direct relationship between the temperature of a light source and its colour temperature. For example, fluorescent lamps can have a high colour temperature while operating at a relatively low temperature.
Lower colour temperature equates to warmer/yellower light, higher values equate to cooler/whiter light. For example, candle flame has a colour temperature of approximately 1,850K, typical daylight having a colour temperature of 6,500K (3drender.com 2003).
Colour rendition or colour rendering index (CRI) is a measurement of how well the colour of objects illuminated by a lamp is faithfully reproduced as compared to that of an ideal or natural light source. The measurement is expressed as a value ranging from 0 to 100 (Standards Australia 2005). Ideal black body radiation has a colour rendering index of 100, with incandescent light being close to 100.

GOODWOOD PRECINCT LIGHTING STRATEGY REPORT
12
5.1.1 Option 1 – Fluorescent and Metal Halide Lighting
Generally low wattage applications which presently consist of numerous types of lamp and luminaire combinations can be replaced with a modern fluorescent equivalent.
Modern fluorescent sources offer a versatile, energy efficient solution with many styles of lamp to suit most applications.
Linear fluorescent and compact fluorescent lamps have a warm-to-cool white light output (2,700-4,000K) and a very high colour rendering index of around 80-89.
Efficacy of modern fluorescent lamps is high, at around 76 lumens/Watt, they perform approximately twice as well as equivalent output mercury vapour lamp and perform similarly to that of lower wattage high pressure sodium lamps (Osram 2005).
Although modern linear and compact fluorescent lamps contain mercury, the amount is greatly reduced over the equivalent 80W mercury vapour lamp (as low as 3mg compared to ~80mg), at approximately 4% (Australian Greenhouse Office 2005).
Lamp life for modern fluorescent lamps is good, with improved performance over mercury vapour lamps but at a slight disadvantage to high pressure sodium lamps. Lamp depreciation is also good at 10-20% at end of service (Osram 2006).
There have been some concerns with the cold temperature operation of compact fluorescent lamps, with a noticeable decrease in output of some lamps with reduced temperature. There are lamps available utilising ‘amalgam’ technology that are designed for use in cold conditions.
Linear Fluorescent lamps have very similar attributes to compact fluorescent lamps, although they are less compact, requiring a long and slim luminaire.
Where higher wattages are required to achieve sufficient light levels, fluorescent lamps are unfeasible. For similar energy efficiency and optical characteristics, the metal halide lamp could be considered.
Metal halide lamps are used where a white light is required for increased perception of security. Metal halide lamps enable improved night vision and better colour rendition making skin tones, clothing and vehicle colour more easily identifiable. Metal halide lamps are therefore found in car parks, prestigious roadways and public spaces (ICLEI 2008). Metal halide is also the preferred light source for use with CCTV surveillance.
Metal halide lamps are presently used in public lighting in South Australia, by such councils as Adelaide City Council and City of Port Adelaide Enfield (ICLEI 2008). Given their high efficacy and quality of light, they can be considered for wide-spread use, especially as an alternative to higher wattage mercury vapour applications.
The metal halide lamp gives a very high quality of light. Colour temperature is in the range of 2,900-4,000K and colour rendering index is 80 - 89 (Osram 2005). This is virtually equivalent to that of modern fluorescent lamps (Osram 2005).
Metal halide lamps have recently been approved for use within ETSA Utilities public lighting systems and an interim tariff is presently in place.
GOODWOOD PRECINCT LIGHTING STRATEGY REPORT
13
A new type of light source is now available called CosmoPolis or UrbanWhite. This is a new type of high-intensity discharge lamp which combines the technologies of both high pressure sodium and metal halide lamps. This gives a highly energy efficient lamp with excellent light output properties. These lamps are only presently available up to 140W. Though they have efficiency and light output quality advantages over conventional high-intensity discharge sources such as metal halide and high pressure sodium, they are not presently used in large volumes for public lighting and can be considered an interim technology until LED lighting begins to take over public lighting applications.
5.1.2 Option 2 – LED Lighting
LEDs have undergone significant development in the last few years toward increased power and light output. LED advancement has progressed to a level that allows LEDs to be assembled into arrays of multiple LEDs and fitted into luminaires, giving performance making them a genuine alternative to conventional light sources.
LEDs are available in ‘cool’ or ‘warm’ white colours. The ‘cool’ white LEDs have a colour temperature approaching 6500K being close to daylight colour. The ‘warm’ white colour (3500K) is presently generated by applying a filter directly to the lens of cool white LEDs, thus slightly reducing their output. LEDs have a high colour rendering index above 75 (Philips 2008).
Efficacy of LEDs is constantly improving. At the time of publication, LED technology has advanced to efficacy up to 95 lm/W (Lighting Council Australia 2009).
The continual increases in lighting performance are making LEDs increasingly competitive against conventional light sources, particularly in terms of energy efficiency.
One of the key differences between LED luminaires and conventional light sources is that the light source is integral to the luminaire. Therefore, a conventional comparison between the efficacy of LED luminaires and other light sources would need to incorporate the effect of the luminaire on output of a lighting system. Typically for a discharge lamp or fluorescent luminaire, the output of light from the luminaire is around 60 – 75% percent that of the lamp output.
Therefore for a high pressure sodium lamp installed within a typical roadway luminaire the overall efficacy is reduced from 70 – 120 lm/W to 53 – 90 lm/W. This is approximately equivalent to the output of modern LED luminaires. Therefore LEDs could be considered to have an equivalent output to a luminaire using a high pressure sodium lamp.
One of the biggest present advantages of LED roadway luminaires is lamp life. Manufacturers have claimed operational life lengths of 50,000 hours. One manufacturer has claimed 100,000 hour life which equates to 20 years of operation (Beta LED 2008; LED Roadway Lighting Ltd 2008).
Due to the construction of array type LED luminaires, the beam control available from LED luminaires is excellent. Each individual LED can be optically aimed to give the ideal optical characteristic required for different installation requirements.
The high colour rendition for LEDs gives them a clear advantage over high pressure sodium lamps and as technology improves, LEDs are projected to exceed the efficacy of metal halide lamps and high pressure sodium lamps.
LED light sources have increased in performance and become more affordable in recent years. Many local councils have conducted small scale trial installations with successful results.

GOODWOOD PRECINCT LIGHTING STRATEGY REPORT
14
It is widely believed that LEDs will become the dominant light source in public lighting in the future.
ETSA Utilities is presently developing an approved LED alternative to conventional lighting which will be approved for use on their public lighting network.
Should an LED option be considered for roadway lighting at present, this would require an alternative tariff arrangement to be agreed with ETSA Utilities, such as an energy only tariff as there is presently no agreed standard permanent or interim tariff arrangement with ETSA Utilities for either SLUOS or CLER tariff.
5.1.3 Energy Costs & Tariff Costs
The above recommended options will result are generally more energy efficient than the existing external lighting within the precinct. This may result in an overall energy saving for public lighting within the precinct. Though council pay for energy used in ETSA owned public lighting systems, there is also a cost for maintenance and re-lamping, etc carried out by ETSA Utilities. These two costs make up the overall lighting tariff.
Therefore, though the energy costs for new energy efficient lighting technologies will be reduced, the additional maintenance, re-lamping and replacement costs built into the tariff, may cause the overall tariff to be similar, or increase.
For example, although the electrical energy used by the proposed substitution of 80W mercury vapour lamps with a 42W compact fluorescent equivalent, due to an increase in the tariff component charged by ETSA Utilities, the overall annual running cost for the 42W CFL is slightly increased over that of an equivalent 80W MV luminaire as seen in the following table:
Lamp Type Annual ETSA SLUoS Tariff Charges
AGL Energy Delivery Charges
AGL Energy Use Charges
TOTAL ANNUAL RUNNING COST
80W MV $59.10 $16.48 $27.47 $103.05
42W CFL $103.50 $8.74 $14.97 $127.21
Difference 75% increase 47% decrease 46% decrease 23% increase (ETSA Utilities 2008)
This tariff is likely to be reduced as demand for the new technology increases.
GOODWOOD PRECINCT LIGHTING STRATEGY REPORT
15
5.2 Roadway Lighting
5.2.1 Option 1
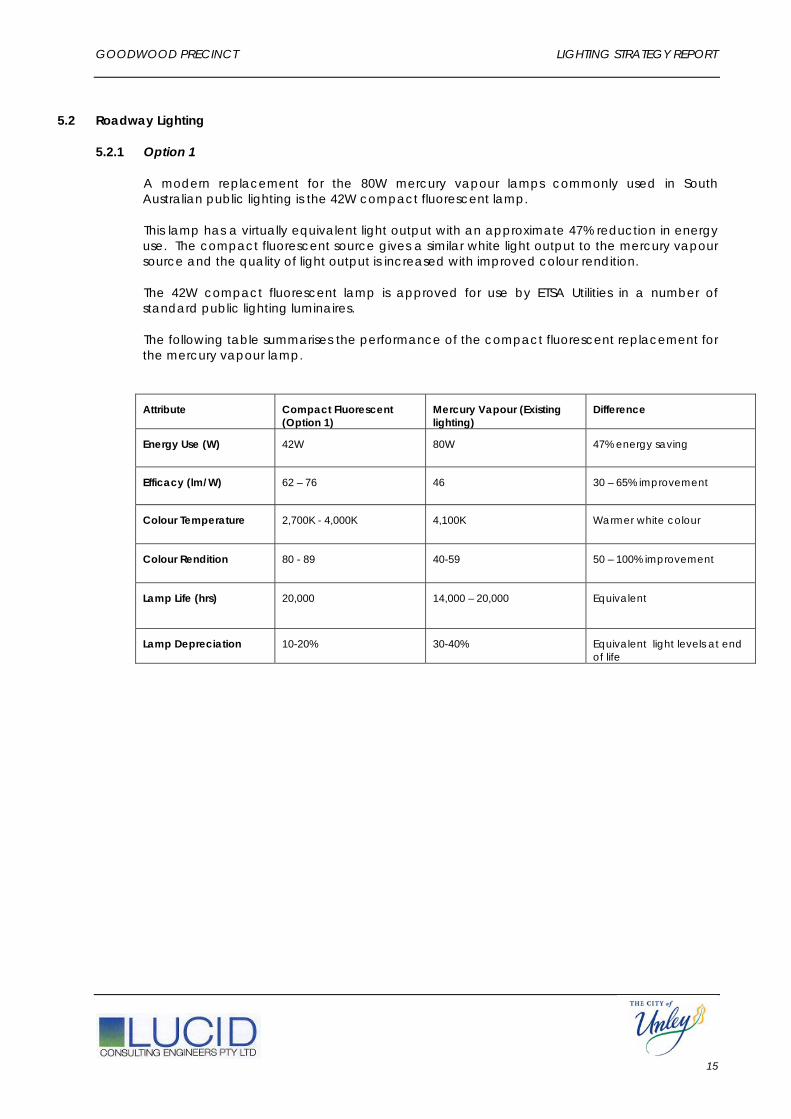
A modern replacement for the 80W mercury vapour lamps commonly used in South Australian public lighting is the 42W compact fluorescent lamp.
This lamp has a virtually equivalent light output with an approximate 47% reduction in energy use. The compact fluorescent source gives a similar white light output to the mercury vapour source and the quality of light output is increased with improved colour rendition.
The 42W compact fluorescent lamp is approved for use by ETSA Utilities in a number of standard public lighting luminaires.
The following table summarises the performance of the compact fluorescent replacement for the mercury vapour lamp.
Attribute Compact Fluorescent (Option 1)
Mercury Vapour (Existing lighting)
Difference
Energy Use (W) 42W 80W 47% energy saving
Efficacy (lm/W) 62 – 76 46 30 – 65% improvement
Colour Temperature 2,700K - 4,000K 4,100K Warmer white colour
Colour Rendition 80 - 89 40-59 50 – 100% improvement
Lamp Life (hrs) 20,000 14,000 – 20,000 Equivalent
Lamp Depreciation 10-20% 30-40% Equivalent light levels at end of life

GOODWOOD PRECINCT LIGHTING STRATEGY REPORT
16
To replace the existing higher wattage roadway luminaires, a 150W metal-halide lamp can replace the existing 250W mercury vapour lamps.
The following table summarises the benefits of replacing the mercury vapour lamp with an equivalent metal halide lamp.
Attribute Metal Halide (Option 1) Mercury Vapour (Existing lighting)
Difference
Energy Use (W) 150W 250W 40% energy saving
Efficacy (lm/W) 78 - 80 46 > 70% improvement
Colour Temperature 2,900K - 4,000K 4,100K Warmer white colour
Colour Rendition 80 - 89 40-59 50 – 100% improvement
Lamp Life (hrs) 9,000 - 16,000 14,000 – 20,000 Reduced from mercury vapour (65 – 80% life)
Lamp Depreciation 20-25% 30-40% 27% greater light output at end of life.
5.2.2 Option 2
LED luminaires are available to replace conventional roadway luminaires. The following tables summaries the benefits of replacing the low and high output mercury vapour lamps with LED equivalents.
Attribute LED (Option 2) Mercury Vapour (Existing lighting)
Difference
Energy Use (W) 34W 80W 57% energy saving
Efficacy (lm/W) 50 – 80 * ~35 * 43 – 130% improvement
Colour Temperature 3,500K - 6,500K 4,100K Cooler white colour
Colour Rendition >75 40-59 30% improvement
Lamp Life (hrs) 50,000 14,000 – 20,000 Greater than double life
Lamp Depreciation 30% 30-40% Slight improvement

GOODWOOD PRECINCT LIGHTING STRATEGY REPORT
17
Attribute LED (Option 2) Mercury Vapour (Existing lighting)
Difference
Energy Use (W) 110W 250W 57% energy saving
Efficacy (lm/W) 50 – 80 * ~35 * 43 – 130% improvement
Colour Temperature 3,500K - 6,500K 4,100K Cooler white colour
Colour Rendition >75 40-59 30% improvement
Lamp Life (hrs) 50,000 14,000 – 20,000 Greater than double life
Lamp Depreciation 30% 30-40% Slight improvement
* The efficacy stated for LED luminaires is for the performance of the fitting overall. Therefore to achieve an equivalent comparison with conventional light sources, a light output ratio of 0.75 has been applied for the existing lighting installation to account for light loss due to lamp being mounted within a conventional roadway fitting.
5.2.3 Environmental Impact
The following table summarises the environmental impact to energy use by replacing the existing roadway lighting with the proposed alternatives of Option 1 and Option 2.
Lighting Type Energy Use Per Year
Greenhouse gas emissions per 100 luminaires
Equivalent domestic houses per 100 luminaires
Percentage improvement
Existing type 80W mercury vapour
350kWh 29,000kg 5 -
Option 1 42W compact fluorescent
183kWh 15,000kg 3 48%
Option 2 34W LED 149kWh 12,500kg 2 57%
Existing type 250W mercury vapour
1,100kWh 92,000kg 18 -
Option 1 150W metal halide
660kWh 55,000kg 11 40%
Option 2 110W LED 480kWh 40,000kg 8 56%
GOODWOOD PRECINCT LIGHTING STRATEGY REPORT
18
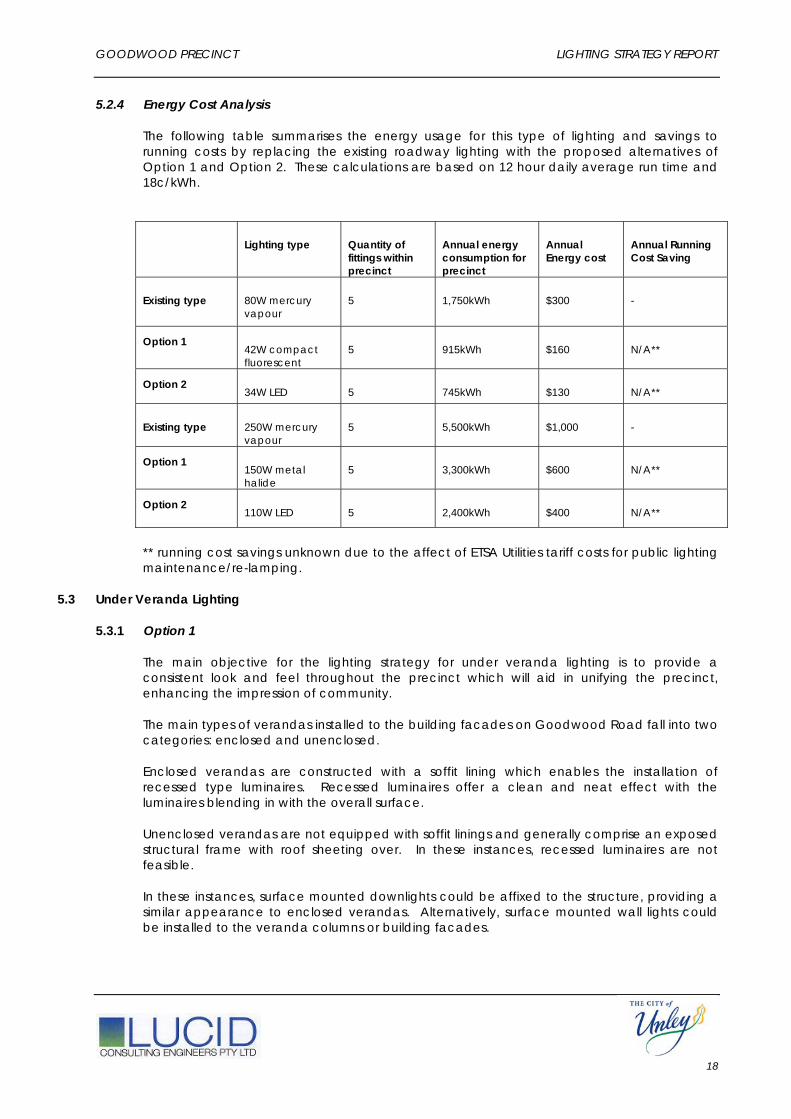
5.2.4 Energy Cost Analysis
The following table summarises the energy usage for this type of lighting and savings to running costs by replacing the existing roadway lighting with the proposed alternatives of Option 1 and Option 2. These calculations are based on 12 hour daily average run time and 18c/kWh.
Lighting type Quantity of fittings within precinct
Annual energy consumption for precinct
Annual Energy cost
Annual Running Cost Saving
Existing type 80W mercury vapour
5 1,750kWh $300 -
Option 1 42W compact fluorescent
5 915kWh $160 N/A**
Option 2 34W LED 5 745kWh $130 N/A**
Existing type 250W mercury vapour
5 5,500kWh $1,000 -
Option 1 150W metal halide
5 3,300kWh $600 N/A**
Option 2 110W LED 5 2,400kWh $400 N/A**
** running cost savings unknown due to the affect of ETSA Utilities tariff costs for public lighting maintenance/re-lamping.
5.3 Under Veranda Lighting
5.3.1 Option 1
The main objective for the lighting strategy for under veranda lighting is to provide a consistent look and feel throughout the precinct which will aid in unifying the precinct, enhancing the impression of community.
The main types of verandas installed to the building facades on Goodwood Road fall into two categories: enclosed and unenclosed.
Enclosed verandas are constructed with a soffit lining which enables the installation of recessed type luminaires. Recessed luminaires offer a clean and neat effect with the luminaires blending in with the overall surface.
Unenclosed verandas are not equipped with soffit linings and generally comprise an exposed structural frame with roof sheeting over. In these instances, recessed luminaires are not feasible.
In these instances, surface mounted downlights could be affixed to the structure, providing a similar appearance to enclosed verandas. Alternatively, surface mounted wall lights could be installed to the veranda columns or building facades.
GOODWOOD PRECINCT LIGHTING STRATEGY REPORT
19
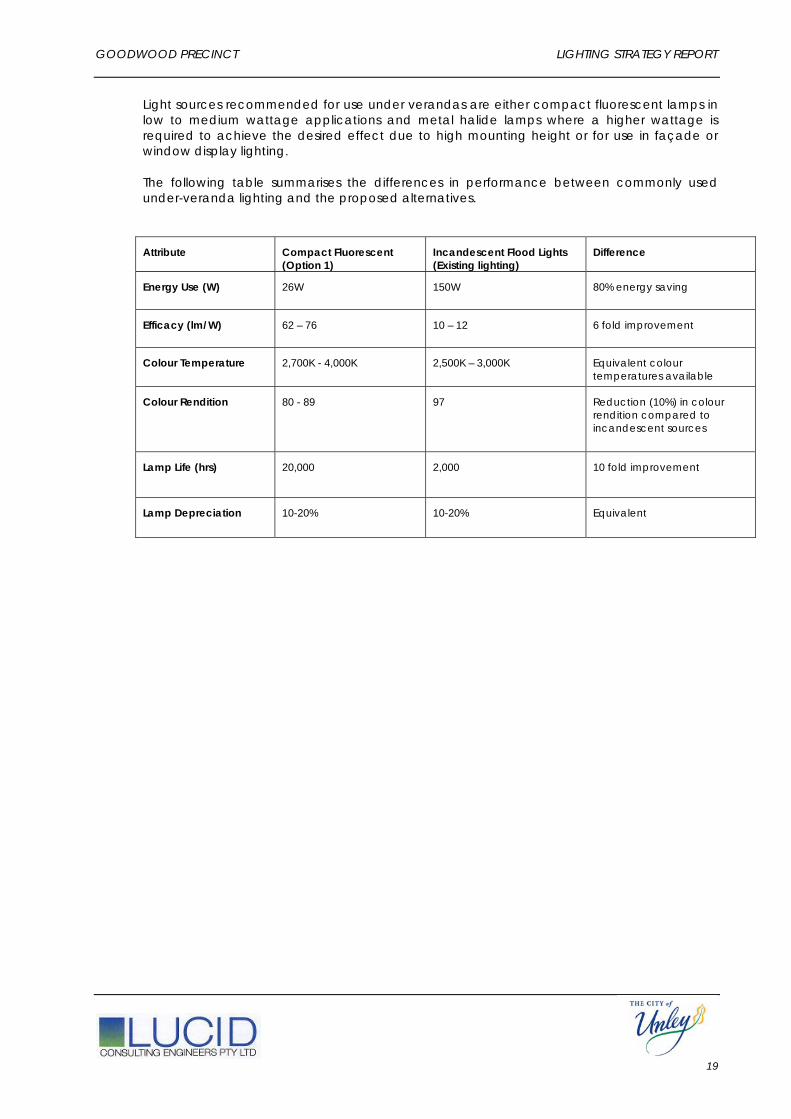
Light sources recommended for use under verandas are either compact fluorescent lamps in low to medium wattage applications and metal halide lamps where a higher wattage is required to achieve the desired effect due to high mounting height or for use in façade or window display lighting.
The following table summarises the differences in performance between commonly used under-veranda lighting and the proposed alternatives.
Attribute Compact Fluorescent (Option 1)
Incandescent Flood Lights (Existing lighting)
Difference
Energy Use (W) 26W 150W 80% energy saving
Efficacy (lm/W) 62 – 76 10 – 12 6 fold improvement
Colour Temperature 2,700K - 4,000K 2,500K – 3,000K Equivalent colour temperatures available
Colour Rendition 80 - 89 97 Reduction (10%) in colour rendition compared to incandescent sources
Lamp Life (hrs) 20,000 2,000 10 fold improvement
Lamp Depreciation 10-20% 10-20% Equivalent
GOODWOOD PRECINCT LIGHTING STRATEGY REPORT
20
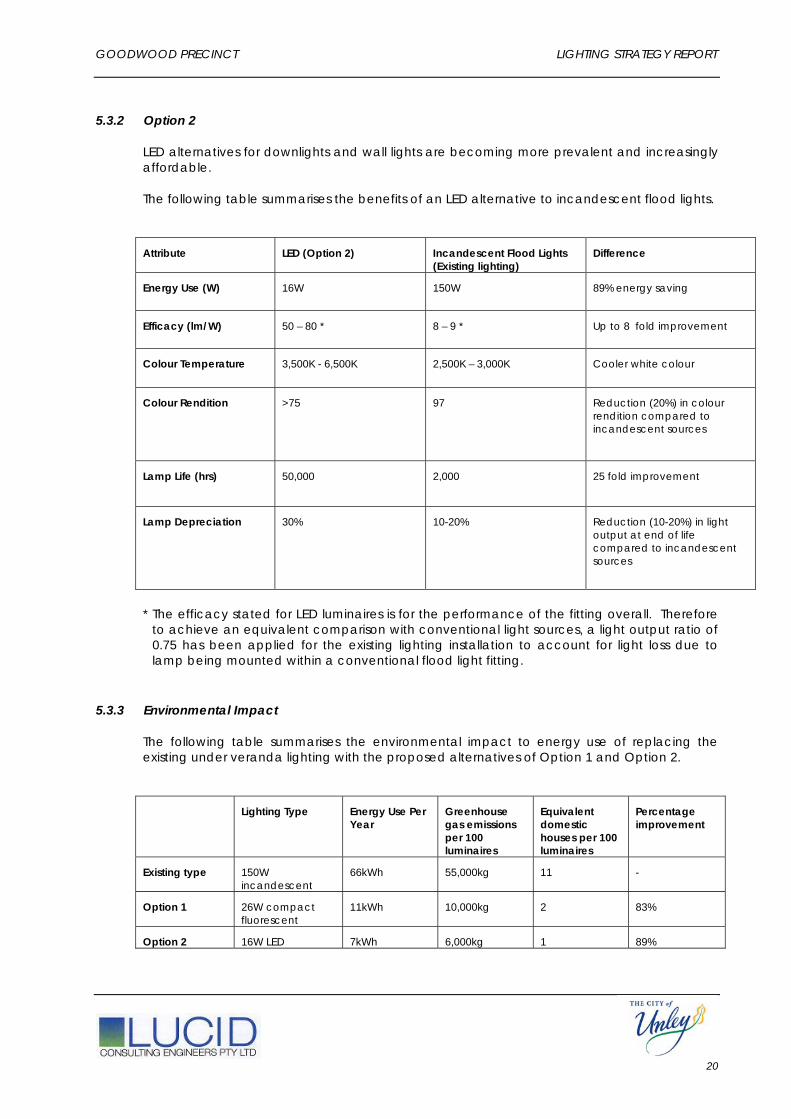
5.3.2 Option 2
LED alternatives for downlights and wall lights are becoming more prevalent and increasingly affordable.
The following table summarises the benefits of an LED alternative to incandescent flood lights.
Attribute LED (Option 2) Incandescent Flood Lights (Existing lighting)
Difference
Energy Use (W) 16W 150W 89% energy saving
Efficacy (lm/W) 50 – 80 * 8 – 9 * Up to 8 fold improvement
Colour Temperature 3,500K - 6,500K 2,500K – 3,000K Cooler white colour
Colour Rendition >75 97 Reduction (20%) in colour rendition compared to incandescent sources
Lamp Life (hrs) 50,000 2,000 25 fold improvement
Lamp Depreciation 30% 10-20% Reduction (10-20%) in light output at end of life compared to incandescent sources
* The efficacy stated for LED luminaires is for the performance of the fitting overall. Therefore to achieve an equivalent comparison with conventional light sources, a light output ratio of 0.75 has been applied for the existing lighting installation to account for light loss due to lamp being mounted within a conventional flood light fitting.
5.3.3 Environmental Impact
The following table summarises the environmental impact to energy use of replacing the existing under veranda lighting with the proposed alternatives of Option 1 and Option 2.
Lighting Type Energy Use Per Year
Greenhouse gas emissions per 100 luminaires
Equivalent domestic houses per 100 luminaires
Percentage improvement
Existing type 150W incandescent
66kWh 55,000kg 11 -
Option 1 26W compact fluorescent
11kWh 10,000kg 2 83%
Option 2 16W LED 7kWh 6,000kg 1 89%
GOODWOOD PRECINCT LIGHTING STRATEGY REPORT
21
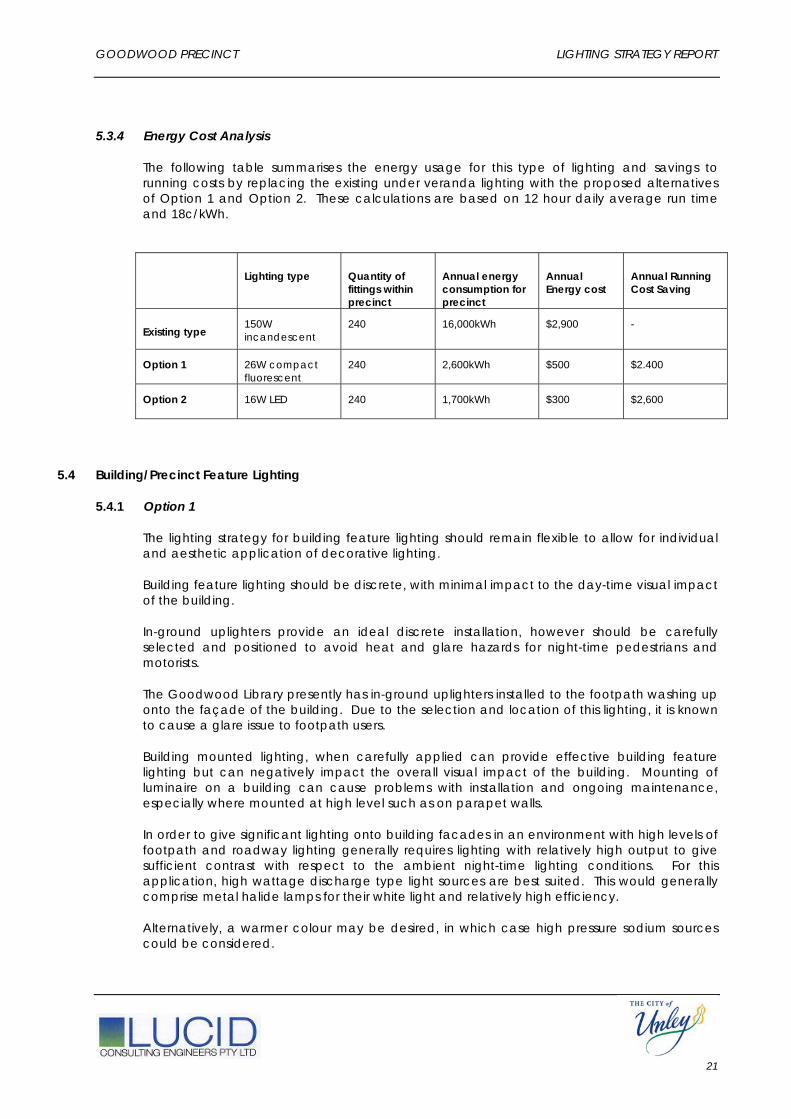
5.3.4 Energy Cost Analysis
The following table summarises the energy usage for this type of lighting and savings to running costs by replacing the existing under veranda lighting with the proposed alternatives of Option 1 and Option 2. These calculations are based on 12 hour daily average run time and 18c/kWh.
Lighting type Quantity of fittings within precinct
Annual energy consumption for precinct
Annual Energy cost
Annual Running Cost Saving
Existing type 150W incandescent
240 16,000kWh $2,900 -
Option 1 26W compact fluorescent
240 2,600kWh $500 $2.400
Option 2 16W LED 240 1,700kWh $300 $2,600
5.4 Building/Precinct Feature Lighting
5.4.1 Option 1
The lighting strategy for building feature lighting should remain flexible to allow for individual and aesthetic application of decorative lighting.
Building feature lighting should be discrete, with minimal impact to the day-time visual impact of the building.
In-ground uplighters provide an ideal discrete installation, however should be carefully selected and positioned to avoid heat and glare hazards for night-time pedestrians and motorists.
The Goodwood Library presently has in-ground uplighters installed to the footpath washing up onto the façade of the building. Due to the selection and location of this lighting, it is known to cause a glare issue to footpath users.
Building mounted lighting, when carefully applied can provide effective building feature lighting but can negatively impact the overall visual impact of the building. Mounting of luminaire on a building can cause problems with installation and ongoing maintenance, especially where mounted at high level such as on parapet walls.
In order to give significant lighting onto building facades in an environment with high levels of footpath and roadway lighting generally requires lighting with relatively high output to give sufficient contrast with respect to the ambient night-time lighting conditions. For this application, high wattage discharge type light sources are best suited. This would generally comprise metal halide lamps for their white light and relatively high efficiency.
Alternatively, a warmer colour may be desired, in which case high pressure sodium sources could be considered.
GOODWOOD PRECINCT LIGHTING STRATEGY REPORT
22
The Council is presently proposing to install signage to the entry and exit of the Goodwood Precinct. Depending on the final design of the signage, a similar strategy for in-ground up-lighting or sign mounted feature lighting could be applied for illumination of this signage.
Other than the library, the buildings within the precinct are generally not presently fitted with decorative façade lighting. Therefore the proposed lighting will add to the net energy used by public lighting in the precinct. However the performance of the proposed metal halide sources is similar to those outlined above under roadway lighting.
5.4.2 Option 2
As LEDs become more powerful, external feature lighting applications are becoming more common. As they are compact and able to be configured in many configurations, LEDs can provide solutions for feature lighting which have benefits such as linear strip LED fittings which can provide a more even distribution than conventional point sources.
LEDs are presently only available in lower wattage spot-light type fittings. In some feature lighting applications, higher wattage fittings will be required to achieve sufficient light levels, in these cases the only viable option presently is a discharge fitting such as metal halide or high pressure sodium sources.
As stated, the buildings within the precinct are generally not presently fitted with decorative façade lighting. The performance of the proposed LED sources is similar to those outlined above under roadway lighting.
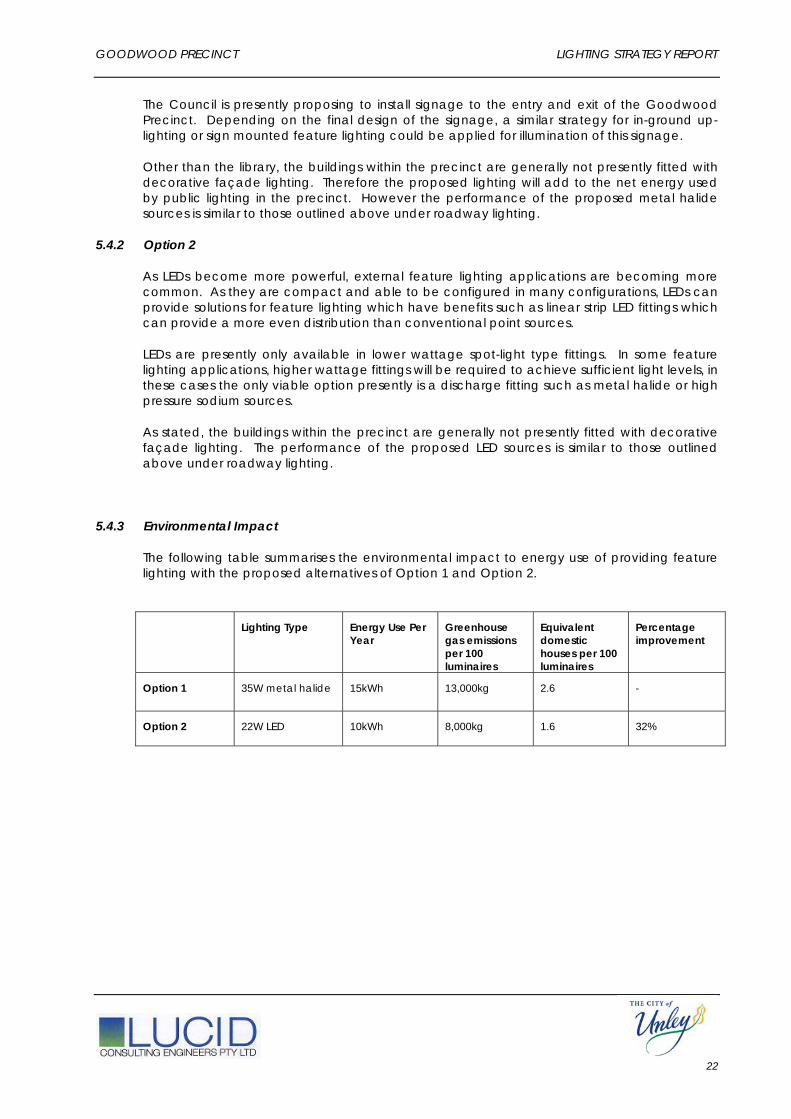
5.4.3 Environmental Impact
The following table summarises the environmental impact to energy use of providing feature lighting with the proposed alternatives of Option 1 and Option 2.
Lighting Type Energy Use Per Year
Greenhouse gas emissions per 100 luminaires
Equivalent domestic houses per 100 luminaires
Percentage improvement
Option 1 35W metal halide 15kWh 13,000kg 2.6 -
Option 2 22W LED 10kWh 8,000kg 1.6 32%
GOODWOOD PRECINCT LIGHTING STRATEGY REPORT
23
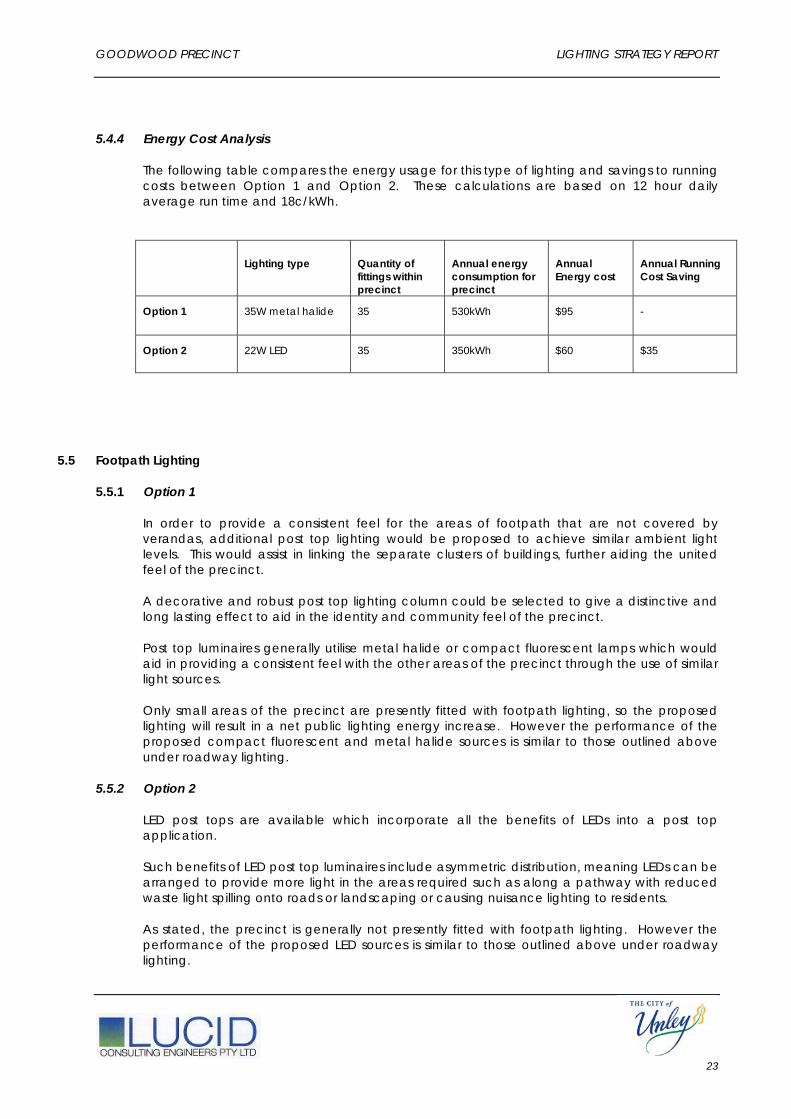
5.4.4 Energy Cost Analysis
The following table compares the energy usage for this type of lighting and savings to running costs between Option 1 and Option 2. These calculations are based on 12 hour daily average run time and 18c/kWh.
Lighting type Quantity of fittings within precinct
Annual energy consumption for precinct
Annual Energy cost
Annual Running Cost Saving
Option 1 35W metal halide 35 530kWh $95 -
Option 2 22W LED 35 350kWh $60 $35
5.5 Footpath Lighting
5.5.1 Option 1
In order to provide a consistent feel for the areas of footpath that are not covered by verandas, additional post top lighting would be proposed to achieve similar ambient light levels. This would assist in linking the separate clusters of buildings, further aiding the united feel of the precinct.
A decorative and robust post top lighting column could be selected to give a distinctive and long lasting effect to aid in the identity and community feel of the precinct.
Post top luminaires generally utilise metal halide or compact fluorescent lamps which would aid in providing a consistent feel with the other areas of the precinct through the use of similar light sources.
Only small areas of the precinct are presently fitted with footpath lighting, so the proposed lighting will result in a net public lighting energy increase. However the performance of the proposed compact fluorescent and metal halide sources is similar to those outlined above under roadway lighting.
5.5.2 Option 2
LED post tops are available which incorporate all the benefits of LEDs into a post top application.
Such benefits of LED post top luminaires include asymmetric distribution, meaning LEDs can be arranged to provide more light in the areas required such as along a pathway with reduced waste light spilling onto roads or landscaping or causing nuisance lighting to residents.
As stated, the precinct is generally not presently fitted with footpath lighting. However the performance of the proposed LED sources is similar to those outlined above under roadway lighting.
GOODWOOD PRECINCT LIGHTING STRATEGY REPORT
24
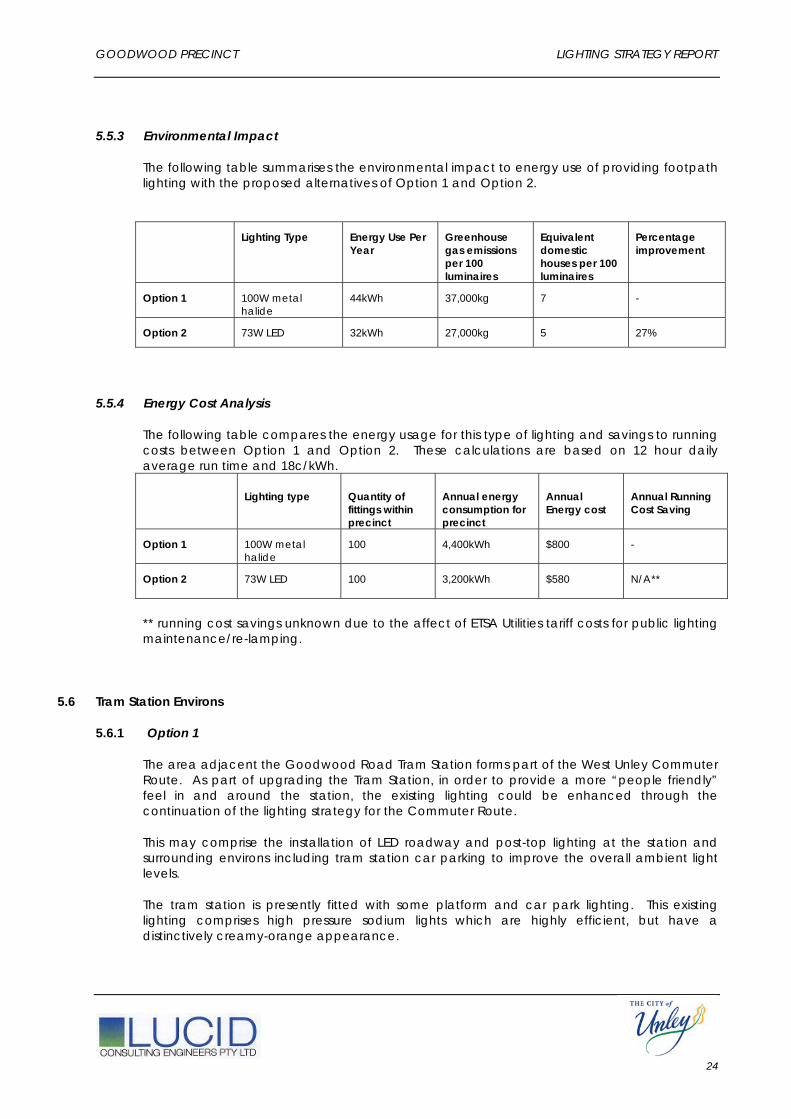
5.5.3 Environmental Impact
The following table summarises the environmental impact to energy use of providing footpath lighting with the proposed alternatives of Option 1 and Option 2.
Lighting Type Energy Use Per Year
Greenhouse gas emissions per 100 luminaires
Equivalent domestic houses per 100 luminaires
Percentage improvement
Option 1 100W metal halide
44kWh 37,000kg 7 -
Option 2 73W LED 32kWh 27,000kg 5 27%
5.5.4 Energy Cost Analysis
The following table compares the energy usage for this type of lighting and savings to running costs between Option 1 and Option 2. These calculations are based on 12 hour daily average run time and 18c/kWh.
Lighting type Quantity of fittings within precinct
Annual energy consumption for precinct
Annual Energy cost
Annual Running Cost Saving
Option 1 100W metal halide
100 4,400kWh $800 -
Option 2 73W LED 100 3,200kWh $580 N/A**
** running cost savings unknown due to the affect of ETSA Utilities tariff costs for public lighting maintenance/re-lamping.
5.6 Tram Station Environs
5.6.1 Option 1
The area adjacent the Goodwood Road Tram Station forms part of the West Unley Commuter Route. As part of upgrading the Tram Station, in order to provide a more “people friendly” feel in and around the station, the existing lighting could be enhanced through the continuation of the lighting strategy for the Commuter Route.
This may comprise the installation of LED roadway and post-top lighting at the station and surrounding environs including tram station car parking to improve the overall ambient light levels.
The tram station is presently fitted with some platform and car park lighting. This existing lighting comprises high pressure sodium lights which are highly efficient, but have a distinctively creamy-orange appearance.

GOODWOOD PRECINCT LIGHTING STRATEGY REPORT
25
The white light from LEDs would provide an increased perception of security and stature over that from the existing lighting while giving improved energy efficiency.
The following table summarises the differences in performance between the existing high pressure sodium tram station lighting and the proposed LED alternative.
Attribute LED (Option 1) High Pressure Sodium Lights (Existing lighting)
Difference
Energy Use (W) 140W 150W 7% energy saving
Efficacy (lm/W) 50 – 80 * ~75 * ~5% improved efficacy
Colour Temperature 3,500K - 6,500K 2,100K Cool white colour
Colour Rendition >75 20-40 Approximately 100% improvement
Lamp Life (hrs) 50,000 24,000 Approximately 100% improvement
Lamp Depreciation 30% 20-30% Equivalent
* The efficacy stated for LED luminaires is for the performance of the fitting overall. Therefore to achieve an equivalent comparison with conventional light sources, a light output ratio of 0.75 has been applied for the existing lighting installation to account for light loss due to lamp being mounted within a conventional flood light fitting.
5.6.2 Option 2
Option 2 could extend the lighting strategy from Option 1 above to include roadway lighting to the streets leading up to the tram station and the tram station car park using the same LED roadway lighting strategy.
Additionally, some decorative feature lighting could be considered to enhance the esteem of the platform and surrounding environs. This may take the form of in-ground LED or metal halide up-lighters to the landscaping or low level LED wall lights which could be provided in a contrasting colour.
The tram station is not presently fitted with any significant decorative lighting. Therefore any additional lighting will increase the net energy used to light the tram station environs. However the performance of the proposed LED and metal halide sources is similar to those outlined above under roadway lighting.

GOODWOOD PRECINCT LIGHTING STRATEGY REPORT
26
5.6.3 Environmental Impact
The following table summarises the environmental impact to energy use of replacing the existing tram station lighting with the proposed alternative of Option 1 (option 2 involves additional replacements of similar lighting types and additional decorative lighting).
Lighting Type Energy Use Per Year
Greenhouse gas emissions per 100 luminaires
Equivalent domestic houses per 100 luminaires
Percentage improvement
Existing type 150W high pressure sodium
66kWh 55,000kg 11 -
Option 1 140W LED 61kWh 52,000kg 10 7%
Option 2 140W LED 61kWh 52,000kg 10 7%
5.6.4 Energy Cost Analysis
The following table summarises the energy usage for this type of lighting and savings to running costs by replacing the existing under veranda lighting with the proposed alternatives of Option 1 and Option 2. These calculations are based on 12 hour daily average run time and 18c/kWh.
Lighting type Quantity of fittings within precinct
Annual energy consumption for precinct
Annual Energy cost
Annual Running Cost Saving
Existing type 150W high pressure sodium
15 1,000kWh $180 -
Option 1 140W LED 15 900kWh $160 $20
Option 2 140W LED 30 1,800kWh $320 -$140
5.7 Car Park Lighting
5.7.1 Option 1
The overall light level of the car parks in the precinct could be increased to provide a higher level of perceived security and general opinion of the precinct.
This would involve re-design of some of the car park lighting to ensure code compliance to meet current standard requirements in all areas.
Metal halide light sources should be considered to give high quality white light with reasonable energy efficiency.

GOODWOOD PRECINCT LIGHTING STRATEGY REPORT
27
Compliant lighting design would likely necessitate additional lighting columns and/or additional building mounted lighting. Care should be taken with the placement of new luminaires to avoid any nuisance light or glare issues, particularly for the neighbouring residential sites.
The local car park areas in the precinct are presently fitted with lighting. This lighting generally comprises a mixture of high pressure sodium and mercury vapour sources. However it is likely that the existing lighting does not comply with the present Australian Standard for external public lighting. The performance of the existing lighting and proposed metal halide sources is similar to those outlined above under roadway and tram station lighting.
5.7.2 Option 2
Similarly to roadway lighting and post top lighting, LED car park lighting is available with the associated benefits of energy, flexible optic properties and evenly distributed light.
The performance of the proposed LED sources is similar to that outlined above under roadway lighting.
5.7.3 Environmental Impact
The following table summarises the environmental impact to energy use by replacing the existing car park lighting with the proposed alternatives of Option 1 and Option 2.
Note that en energy saving is only available from the replacement of high pressure sodium lighting with LEDs as metal halide sources have a lower efficacy than high pressure sodium lamps. This alternative is proposed for Option 1 however, as metal halide lamps have higher colour temperature and colour rendition performance than high pressure sodium sources, a metal halide solution may still be a viable consideration.
Lighting Type Energy Use Per Year
Greenhouse gas emissions per 100 luminaires
Equivalent domestic houses per 100 luminaires
Percentage improvement
Existing type 250W mercury vapour
110kWh 92,000kg 18 -
Option 1 150W metal halide
66kWh 55,000kg 11 40%
Option 2 110W LED 48kWh 40,000kg 8 56%
Existing type 150W high pressure sodium
66kWh 55,000kg 11 -
Option 1 250W metal halide
110kWh 92,000kg 18 -66%
Option 2 140W LED 61kWh 52,000kg 10 7%

GOODWOOD PRECINCT LIGHTING STRATEGY REPORT
28
5.7.4 Energy Cost Analysis
The following table summarises the energy usage for this type of lighting and savings to running costs by replacing the existing car park lighting with the proposed alternatives of Option 1 and Option 2. These calculations are based on 12 hour daily average run time and 18c/kWh.
Lighting type Quantity of fittings within precinct
Annual energy consumption for precinct
Annual Energy cost
Annual Running Cost Saving
Existing type 250W mercury vapour
60 6,600kWh $1,200 -
Option 1 150W metal halide
60 4,000kWh $700 $500
Option 2 110W LED 60 2,800kWh $300 $900
Existing type 150W high pressure sodium
60 4,000kWh $700 -
Option 1 250W metal halide
60 6,600kWh $1,200 -$500
Option 2 140W LED 60 3,600kWh $600 $100

GOODWOOD PRECINCT LIGHTING STRATEGY REPORT
29
6 NEGOTIATIONS WITH ETSA UTILITIES / BUILDING OWNERS
Generally, any lighting which is installed to public spaces such as roadways and footpaths, is generally considered to be the responsibility of the Council. There are a number of options for Council lighting connections and metering arrangements.
Lighting located on private property or attached to building facades can be treated in a number of ways depending on the purpose of the lighting and what arrangement can be negotiated between the building owner, tenant and council.
For example, a lighting system installed to a building façade will benefit the building tenant through increased visibility of the site. This will have ongoing benefits to the building owner. This will also benefit the entire precinct through the enhanced visual profile of the precinct and the increased business brought to the precinct.
In this case, the responsibility for installation, running and maintenance costs for the lighting system may be a subject of deliberation.
6.1 Tariff Arrangements
Roadway lighting and footpath lighting which is installed to enhance the light levels in the area can be connected to the existing ETSA Utilities mains voltage network via overhead wiring or new underground electricity supplies to each location. An energy tariff can be agreed with ETSA Utilities for the connection and running costs of these systems. Additionally, ETSA Utilities may be able to maintain and re-lamp these systems, provided the lamp and/or luminaire is of an approved type. These arrangements are standardised within the ETSA Utilities Public Lighting system as follows.
6.1.1 SLUoS Tariff
SLUoS is an ETSA Utilities acronym for Street Lighting Use of System. The SLUoS tariff is charged to Councils and DTEI for the use of public lighting that is owned and maintained directly by ETSA Utilities. A separate tariff is calculated for each type of approved ETSA luminaire installation, based on the cost and frequency of lamp replacement, luminaire maintenance and cleaning (ETSA Utilities 2004).
Approximately 85% of all public lighting is covered under the SLUoS tariff.
As SLUoS assets are owned and maintained by ETSA, approval for new luminaires and lamp sources are required to be approved by ETSA before they can be used under the SLUoS tariff. ESTA have an internal process for assessing potential SLUoS luminaires to ensure their suitability for public lighting over a 20 year period (ETSA Utilities 2009).
The present approved SLUoS luminaire range is relatively limited. This can make the selection of a suitable luminaire for every application challenging.
6.1.2 CLER Tariff
CLER is an ETSA Utilities acronym for Customer Lantern Equipment Rate. The CLER tariff is charged to Councils and DTEI for the maintenance only of Council owned public lighting assets.
Approximately 13.5% of all public lighting is covered under the CLER tariff (ICLEI 2006).
As ETSA Utilities are required to carry out lamp changes for CLER luminaires, there are certain criteria that are required to be met to achieve approval for use under the CLER tariff including lamp access and labelling requirements. There is added flexibility in that the repair costs of the luminaires is not considered in the tariff arrangement and this remains the responsibility of the owner (Council or DTEI) (ETSA Utilities 2004).
GOODWOOD PRECINCT LIGHTING STRATEGY REPORT
30
6.1.3 Energy Only Tariff
The Energy Only tariff is charged to Councils and DTEI where the lighting system is owned and maintained by the user and only energy charged from ETSA based on the known consumption of the lamp (ETSA Utilities 2004).
As the responsibility for installation and ongoing maintenance of Energy Only installations is with the owners, the range of luminaires is limited only by the requirement for the lamp type to be approved by ETSA (ETSA Utilities 2004).
6.1.4 Metered Supply
A metered supply is like other conventional electricity supplies where the energy used by the system is metered and the electricity charged per the consumption read from the meter.
The installation of lighting systems on a metered supply is equivalent to a private lighting installation. As long as the installation complies with the requirements of AS3000 and the ETSA Rules of Service, the downstream load can supply any electrical installation (ETSA Utilities 2004).
6.2 Metering Arrangements
The connection of building mounted lighting which is used to enhance the visual impact of a building may need to be negotiated with the building owner and tenant. Circuits and controls would need to be mounted within the building electrical switchboard. The running costs would then be the responsibility of the building owner or tenant unless another arrangement is negotiated with Council. Alternatively, a separate meter may be able to be installed within the switchboard which could be the responsibility of Council.

GOODWOOD PRECINCT LIGHTING STRATEGY REPORT
31
7 COST COMPARISON
The below table summarises the approximate quantities of each type of public lighting within the Goodwood Precinct required to upgrade all lighting within the precinct, the approximate associated costs for each component and the likely split of the costs between council and private owners / tenants. This split would need to be negotiated between council and the building owners/tenants. The costs for feature lighting includes the four feature buildings proposed to be provided with feature lighting as part of the designs accompanying this report and additional feature lighting to other key buildings in the precinct.
Option Lighting Type Roadway Lighting
Feature Lighting
Under-veranda Lighting
Footpath Lighting
Tram Environs Lighting
Car Park Lighting
1 & 2 Suggested Cost Split
100% Council 50% Council
50% Owners
100% Owners
100% Council 75% Council
25% DTEI
50% Council
50% Owners
1 Approximate Quantity
10 35 240 100 15 60
Approximate Cost Council
$10,000 $38,000 Nil $500,000 $25,000 $150,000
Approximate Cost Owners
Nil $22,000 $120,000 Nil $75,000 $150,000
2 Approximate Quantity
10 35 240 100 30 60
Approximate Cost Council
$20,000 $57,000 Nil $600,000 $50,000 $180,000
Approximate Cost Owners
Nil $33,000 $240,000 Nil $150,000 $180,000
Selected Option Total cost to Council Total cost to Owners
Option 1 $723,000 $367,000
Option 2 $907,000 $603,000
BASIS OF ESTIMATES
The estimates are based on the following:
Rates for labour and equipment as of May 2010.
Excluding GST of 10%.
Excluding any associated building works.
Excluding after hours work penalty rates.
Excluding fees for professional services, such as structural engineering approvals for penetration works.
Excluding costs associated with upgrading electrical infrastructure and equipment.
Assuming roadway lighting can be installed using existing ETSA Stobie pole locations.

GOODWOOD PRECINCT LIGHTING STRATEGY REPORT
32
Assuming proposed luminaires will be acceptable in accordance with ETSA standards.
Cost split between council and building owners/tenants is an example of a possible arrangement which may be agreed between Council and building owners/tenants and would be subject to negotiations between all parties.
8 SUMMARY AND RECOMMENDATIONS
Two options have been presented to upgrade each type of public lighting in the Goodwood Precinct.
Option 1 involves a cost affective, energy efficient industry standard lighting solution for each type of lighting installation, which will aid in the enhancement of the character, heritage and culture of the precinct as well as generally improve visibility and perceived security.
Option 1 involves the replacement of the existing lighting in the precinct which generally comprises an ad-hock mixture of styles and lighting methods with a unified and consistent look which will consolidate the area aiding in the perception of ‘precinct’ for the space.
Option 2 involves a lighting strategy that achieves the aesthetic requirements for the precinct while also using industry best practice to provide maximum energy efficiency in the public lighting installation. This solution comes at a cost premium of approximately 30 – 40%. It is expected that this cost premium will become less significant in the future.
The options have been considered such that implementation of either option in any area will create an integrated look and feel even if adjacent areas have been upgraded using the alternative option with minimal aesthetic impact.
Based on the present cost premium, we would recommend that Option 1 be generally offered as a minimum standard to be achieved for new developments and lighting upgrades in the precinct.
An individual business case may need to be developed for individual lighting upgrade projects to further assess the exact cost premiums associated with Option 2 on a project-by-project basis.
The council may consider offering incentives to building owners / tenants that consider opting to implement an Option 2 lighting strategy for their building such as increased council capital contribution.
GOODWOOD PRECINCT LIGHTING STRATEGY REPORT
9 APPENDIX A – PRECINCT AREA MAPS
33
GOODWOOD PRECINCT LIGHTING STRATEGY REPORT
34

GOODWOOD PRECINCT LIGHTING STRATEGY REPORT
35
GOODWOOD PRECINCT LIGHTING STRATEGY REPORT
36
10 APPENDIX B – REFERENCE LIST Australian Greenhouse Office 2005, Public Lighting in Australia – Energy Efficiency Challenges and Opportunities, Australian Greenhouse Office in the Department for Environment and Heritage Beta LED 2008, The Edge LED Area Light – Type II Short, Beta LED ETSA Utilities 2004, TS-101 Public Lighting Standard for Overhead & Underground Networks, ETSA Utilities ETSA Utilities 2008, Information on comparative costs of street lighting, ETSA Utilities. ETSA Utilities 2009, NICC-403 Information on ETSA Utilities Public Lighting Arrangements, ETSA Utilities GreenPower 2008, Australia’s climate change challenge, GreenPower Accreditation Program, viewed 10 December 2008, http://www.greenpower.gov.au/australias-greenhouse-challenge.aspx ICLEI 2006, South Australian Strategic Action Planning Guide for Sustainable Public Lighting, ICLEI – Local Governments for Sustainability – Australia/New Zealand. ICLEI 2008, Technologies: Metal Halide, viewed 11 December 2008 http://www.iclei.org/index.php?id=6666 LED Roadway Lighting Ltd, Model A50 Roadway Luminaire – Preliminary Technical Specifications, LED Roadway Lighting Ltd Lighting Council Australia 2009, Presentation to Ai Group Environmental Solutions Forum, Lighting Council Australia Osram 2005, Indoor and Outdoor Lighting 2005/2006, Osram Osram 2006, Optic 2006 – Osram Australia: High Intensity Discharge Lamps, Osram Australia Philips 2008, Technical Datasheet DS56 – LUXEON Rebel, Philips Lumileds Lighting Company Standards Australia 2005, AS/NZS 1158 Series – Lighting for roads and public spaces, Standards Australia 3drender.com 2003, Glossary: Kelvin Colour Temperature, viewed 11 December 2008, http://www.3drender.com/glossary/colortemp.htm

GOODWOOD PRECINCT LIGHTING STRATEGY REPORT
37
11 APPENDIX C – GLOSSARY AS1158 - Australian Standard which prescribes the performance requirements the
design, manufacture and installation of lighting for roads and public spaces by pedestrians and vehicles.
CRI - Colour Rendering Index – a scale from 0-100 measuring the accuracy of colour reproduction of objects when illuminated from a light source.
Colour Temperature
- Colour temperature is a measurement the degree of whiteness for a light source.
CLER - Tariff arrangement for public lighting in South Australia. CLER is an ETSA Utilities acronym for Customer Lantern Equipment Rate. The CLER tariff is charged to Councils and DTEI for the maintenance only of Council owned public lighting assets.
DTEI - Department for Transport, Energy an Infrastructure, South Australian government department responsible for public lighting on major roadways.
ETSA Utilities - South Australian electricity authority.
Efficacy - Efficacy refers to the quantity of luminous flux (light output) from the lamp per unit of input energy. Efficacy can be thought of as a measurement of energy efficiency, being measured in lumens-per-Watt.
Lamp Depreciation
- A measurement of the difference in light output of a lamp at a given time as compared to the output when new.
Lumen (lm) - A measurement of luminous flux. This can be thought of as the perceived power of light by the human eye.
LED - Light emitting diode light source technology.
PV - Photovoltaics is the field of technology associated with converting sunlight into electricity through the use of solar cells.
PE Cell - Photoelectric cell acting as an electrical switch that is sensitive to light, changing state above and below a certain threshold of ambient light.
SLUoS - SLUoS is an ETSA Utilities acronym for Street Lighting Use of System. The SLUoS tariff is charged to Councils and DTEI for the use of public lighting that is owned and maintained directly by ETSA Utilities.
Watt (W) - Measurement of energy. Within the context of public lighting this is generally a measurement of electrical energy used by a lighting system.