goodrich 4e5b4576-44a6-4a6f-ac6f-ec154cb164a8_goodrich2002arfinal
DESCRIPTION
TRANSCRIPT

WHAT YOU SEE
GO
OD
RIC
H2
002 Annual R
eport
2002 Annual Report
What you see at Goodrich is a vast array of aerospace products
and services that keep the finest aircraft in the world operating
safely and predictably day after day. You can see our products
on every airplane Airbus makes. page 14. You can see them
across the spectrum of commercial and military aircraft built
by Boeing. page 8. You can see them at work on the Royal Air
Force’s Tornado. page 16. You can see our maintenance, repair
and overhaul services at work on the aircraft of ExpressJet, South
African Airways and Southwest Airlines. page 12.
BUSINESS DESCRIPTION Goodrich Corporation,
a Fortune 500 company, is a leading global supplier
of systems and services to the aerospace industry.
If there’s an aircraft in the sky – we’re on it. Goodrich
technology is involved in making aircraft fly…helping
them land…and keeping them safe. Serving a global
customer base with significant worldwide manufac-
turing and service facilities, Goodrich is one of the
largest “pure play” aerospace companies in the world.
For more information visit http://www.goodrich.com.
Four Coliseum Centre
2730 West Tyvola Road
Charlotte, NC 28217-4578
704/423-7000
www.goodrich.com

Company HeadquartersGoodrich CorporationFour Coliseum Centre2730 West Tyvola RoadCharlotte, North Carolina 28217-4578704/423-7000www.goodrich.com
Stock Exchange ListingGoodrich common stock and BFGoodrich Capital cumulative quar-terly income preferred securities (QUIPS) are listed on the New YorkStock Exchange. Symbols: GR and GRPRA, respectively. Options toacquire our common stock are traded on the Chicago BoardOptions Exchange.
The following table sets forth on a per share basis the high andlow sales prices for our common stock for the periods indicated asreported on the New York Stock Exchange composite transactionsreporting system, as well as the cash dividends declared on ourcommon stock for these periods.
2002 2001
Quarter High Low Dividend Quarter High Low Dividend
First 32.19 24.12 $.275 First 42.65 33.06 $.275
Second 34.42 26.17 .200 Second 44.50 36.01 .275
Third 27.49 18.31 .200 Third 38.80 15.91 .275
Fourth 20.38 14.17 .200 Fourth 26.89 18.65 .275
As of February 14, 2003, there were approximately 13,230 holders ofrecord of our common stock.
Annual MeetingOur annual meeting of shareholders will be held at the GoodrichCorporate Headquarters, Four Coliseum Centre, 2730 West TyvolaRoad, Charlotte, North Carolina on April 15, 2003 at 10:00 A.M.The meeting notice and proxy materials were mailed to shareholderswith this report.
Shareholder ServicesIf you have questions concerning your account as a shareholder,dividend payments, lost certificates and other related items, pleasecontact our transfer agent:
The Bank of New YorkShareholder Relations Dept. 11EP.O. Box 11258Church Street StationNew York, N.Y. 10286-12581-800-524-4458E-mail: [email protected]
The Bank of New York’s Shareholder Services website can be locatedat http://www.stockbny.com. Registered shareholders can accesstheir account online and review account holdings, transaction historyand check history. In addition, the site offers an extensive Q&A,instructions on the direct purchase, sale and transfer of plan sharesand information about dividend reinvestment plans. Shareholdersalso can download frequently used forms.
Designed and produced by see see eye/AtlantaCover photo on right supplied by Rolls-Royce plc
Stock Transfer and Address ChangesPlease send certificates for transfer and address changes to:
The Bank of New YorkReceive and Deliver Dept. 11WP.O. Box 11002Church Street StationNew York, N.Y. 10286-1002
Dividend ReinvestmentWe offer a Dividend Reinvestment Plan to holders of our commonstock. For enrollment information, please contact The Bank of NewYork, Investor Relations Department, at 1-800-524-4458.
Investor RelationsSecurities analysts and others seeking financial informationshould contact:
Paul S. GiffordVice President of Investor RelationsGoodrich CorporationFour Coliseum Centre2730 West Tyvola RoadCharlotte, North Carolina 28217-4578704/423-5517e-mail: [email protected]
To request an Annual Report, Proxy Statement, 10-K, 10-Q or quar-terly earnings release, visit our website at www.goodrich.com or call704/423-7103. All other press releases are available on our website.
Annual Report on Form 10-KOur 2002 Annual Report on Form 10-K, when filed with the SEC,will be available on our website at www.goodrich.com. We will alsoprovide a copy of our 2002 Annual Report on Form 10-K (withoutexhibits) at no charge upon written request addressed to our VicePresident of Investor Relations.
The Goodrich FoundationWe make charitable contributions to nonprofit arts and cultural,civic and community, educational, and health and human servicesorganizations through The Goodrich Foundation and our opera-tions, distributing $3 million in 2002. Foundation guidelines areavailable on our website, www.goodrich.com.
For more information contact:The Goodrich FoundationFour Coliseum Centre2730 West Tyvola RoadCharlotte, North Carolina 28217-4578
Affirmative ActionWe hire, train, promote, compensate and make all other employ-ment decisions without regard to race, sex, age, religion, nationalorigin, disability, veteran or disabled veteran status or otherprotected classifications. We have affirmative action programs inplace in accordance with Executive Order 11246 and other federallaws and regulations to ensure equal employment opportunity forour employees.
Forward-Looking StatementsThis annual report contains forward-looking statements that involverisks and uncertainties, and actual results could differ materiallyfrom those projected in the forward-looking statements. These risksand uncertainties are detailed in the section of the Management’sDiscussion and Analysis entitled “Forward-Looking Information isSubject to Risk and Uncertainty” and in our Annual Report on Form10-K and other filings with the SEC.
SHAREHOLDER Information
FIVE REASONS TO THINK ABOUT GOODRICH
For over 132 years, through economic ups and downs, Goodrich Corporation has stayedthe course, working to deliver long-term value to our shareholders and customers, and pro-viding a challenging and rewarding place to work for our employees. Our hallmarks include:
Strong financial performance. Our goal is superior returns through consistent, predictablerevenue and income growth.
Global leadership. More than 40 successful acquisitions over the past 16 years, coupled withinternal growth, have created an unparalleled portfolio of world-class aerospace systems.
Balanced business mix. We have purposefully diversified our product market and customermix to counterbalance industry cycles in aircraft production.
Value-creating processes. Strategic planning, value-based management, operational excel-lence, innovation and business platform “roadmaps” are among our purposeful processesthat deliver value.
Innovative solutions. Developing breakthrough innovations is part of our culture. We systemati-cally look for ways to leverage our technological strengths through aerospace – and beyond.

WHAT YOU DON’T SEE is the strength behind the products and services: the steady
determination and commitment of all of Goodrich’s people,
the deep ethical theme that runs through all the company’s
endeavors and the high-caliber staff that develops lasting
and meaningful relationships with our customers. What
you don’t see is the community involvement, the caring and
the commitment to those around us that makes Goodrich
a good investment, a good partner, a good citizen and
a good neighbor.

A high standard of ethics at Goodrich is an enduring tradition
that has remained at the heart of everything we do during a period
of great transformation. Although our business products, services
and locations have changed dramatically over our 132-year
history, our standards for honesty, integrity and fairness have
remained constant. Our commitment to fair, ethical and appro-
priate behavior is supported by comprehensive internal review
and reporting systems and dedication to open and unrestricted
communication. We will remain committed to these high stan-
dards on behalf of our fellow employees, our customers, our
communities and our shareholders.
A Focused Global Leader
Over the past two decades, Goodrich has purposefully evolved
from a commodity products business, with varied financial per-
formance, into a focused aerospace systems supplier. We have
achieved leadership positions across a broad variety of global
platforms with strong profit margins, stable financial perform-
ance and a clear vision of who we are and where we’re going.
The transformation culminated with the acquisition in 2002 of
the TRW Aeronautical Systems businesses, which expanded our
business base and global footprint to the point that no other
company in the aerospace industry has a broader array of lead-
ership positions than Goodrich. We intend to build upon this
base as the company continues to evolve.
Well-Positioned for the Future
The current business climate is challenging, and we are not
happy with our stock price performance. We are experiencing
a down cycle in the commercial aviation market exacerbated
by a weak economy and an uncertain global political situation.
The year 2002 was a time of great introspection for many
American corporations due to the reprehensible behavior
of a few. At Goodrich, we examined our ethical bearings
and found what we already knew: our historic emphasis
on a culture of personal responsibility and accountability
has produced a strong foundation of fair and ethical
behavior that extends from the corporate offices to the
manufacturing floor.
David L. Burner Chairman and Chief Executive Officer
LETTER to Shareholders
2 Goodrich Corporation 2002 Annual Report 3

But we believe that no other company in our industry is better
positioned to capitalize on the expected recovery of the market
and the economy. Some aspects of our strength may not be fully
apparent, and for that reason we are using this annual report to
point out “What You Don’t See.”
This new year will mark another important chapter in the
transformation of Goodrich as I move toward retirement and
Marshall Larsen succeeds me as chief executive officer. Marshall
has shouldered increased responsibilities within the company,
particularly with the rapid consolidation of the aerospace market-
place, our aggressive acquisition program and the subsequent
integration opportunities. He has demonstrated that he is the
right person to lead the company in the future and to face the
challenges of the global economy and geopolitical issues. Not
only do those of us at Goodrich feel confident in Marshall, but
the industry as a whole has demonstrated its trust in his leader-
ship abilities by naming him to a term last year as chairman of
the Aerospace Industries Association. He was at the helm of the
association during the period of crisis that followed September 11
and he handled his duties with distinction. Marshall is now in
a position to pilot the transformed company to the next level
of success.
As I turn over the leadership of Goodrich to Marshall,
I want to thank you, the shareholders, for giving me this oppor-
tunity to serve. I especially want to thank our thousands of loyal
and dedicated employees for their commitment and support;
they are our greatest asset and the foundation for success in
the years ahead.
I am extremely proud of the new Goodrich that we have
created. I look back on several critical junctures when we decided
to take dramatic and aggressive action to change the very nature
of the company. Beginning in the mid-1980s, we began to trans-
form the company by divesting the traditional BFGoodrich tire,
chemical and industrial rubber businesses, while investing in our
aerospace franchise. The Goodrich aerospace base was further
strengthened over time with numerous acquisitions and invest-
ments, including the important acquisitions of Simmonds
Precision in 1990, Cleveland Pneumatic and Rosemount
Aerospace in 1993, Rohr in 1997, Coltec in 1999 and TRW
Aeronautical Systems in 2002. These structural business
changes required significant changes in the organization and
infrastructure of the company. These aggressive actions required
courage on the part of the entire Goodrich organization, the
unswerving support of our Board of Directors and excellence in
execution. I never had a doubt that we would succeed.
I have enjoyed every moment at Goodrich. I am deeply
grateful to have been entrusted with the great honor of serving you,
and I wish Marshall Larsen and all of our employees every success
as they lead this great corporation to an even greater future.
David L. Burner
Chairman and Chief Executive Officer
February 21, 2003
Transformation Highlights:
1986 – Sale of tire division providescapital to begin transformation
1990 – Acquisition of SimmondsPrecision begins to build systemsplatform
1993 – Acquisition of ClevelandPneumatic and RosemountAerospace broadens platformpositions
1993 – Spin-off of PVC businesssharpens focus on aerospace
1997 – Acquisition of Rohr adds keypositions on major platforms
1999 – Acquisition of ColtecIndustries significantly broadensaerospace market presence
2001 – Sale of PerformanceMaterials completes exit fromchemical industry
2001 – New name and identityrolled out
2002 – Spin-off of EngineeredIndustrial Products acceleratestransformation into an aerospacebusiness
2002 – Acquisition of AeronauticalSystems enhances balance acrossthe aerospace systems portfolio
4 Goodrich Corporation 2002 Annual Report 5

A. We are living through a challenging period, but there is no doubt that air travel in general
and the aerospace industry in broader terms are going to recover. Air travel is an integral
and essential part of our lives – and a foundation of the global economy. As for Goodrich,
it has undergone a transformation led by Dave Burner as chairman and CEO. His intelli-
gence and vision have presented us with an unequalled portfolio of products and services.
We are now in a position to excel as the market picks up. My job in the near term is to
make sure our portfolio performs. We have the assets and the industry positioning, and
it’s my job to make sure that we execute on the fundamentals and that the business per-
forms to its full potential.
A. The businesses we acquired from TRW have significantly enhanced our portfolio of aero-
space products and services. They are a perfect strategic fit. Our focus for the next year is to
integrate those businesses and generate excellent performance across all our activities. We will
manage the new businesses, as we have successfully done with our previous acquisitions, to
realize the full potential of their strong market positions. We also intend to capitalize on the
technical capabilities they have and, most important, to operate them in the Goodrich culture,
which focuses on individual responsibility, accountability and performance.
A. The reorganization was driven by our desire to align more closely with our customers.
The breadth of our portfolio allows us to structure ourselves into three easy-to-understand
segments: Airframe Systems, Electronic Systems and Engine Systems. This alignment
enables us to focus better on our customers and to provide better leverage between
product lines in similar areas of the aerospace market. It will also facilitate the integration
of the Aeronautical Systems businesses and help achieve the accountability that is one
of the foundations of the Goodrich approach. One of the first things we have to do is to
successfully deploy this alignment across the customer base. We’ve always had good rela-
tionships with our customers, but we want them to see Goodrich as a complete suite of
capabilities rather than as individual parts.
Q. Your election as chairmanof the Aerospace Industries
Association couldn’t havecome at a more difficult time,
during the September 11, 2001,tragedies. What do you think
the future holds for theaerospace industry in general
and for Goodrich in particular,and what steps will you
take to prepare for it?
Q. How hard is it going to be to get a portfolio this broad to perform?
Goodrich is still digesting the $1.5 billion acquisition of
TRW Aeronautical Systems. How will you insure that theintegration of this and otheracquisitions goes smoothly?
A. We have many opportunities to be more productive in terms of how we connect all the
capabilities and synergies within the portfolio. Specifically, we are putting more energy into
delivering cost efficiency through supply chain integration and, of equal importance, pro-
ductivity gains through continuous process improvement (CPI). For instance, we’re going
to better leverage our economies of scale to achieve better prices across a broad range of
products and materials. CPI means looking at the way we manufacture things, the way we
process orders and the way we engineer new products and then making them more effec-
tive and more efficient. We’re already using ‘lean’ manufacturing techniques across our
business. In addition, we found great expertise in Six Sigma within the Aeronautical Systems
businesses and we are combining this with other tools to enhance our CPI approach.
A. Having transformed our business into a global leader in aerospace, we intend to focus
on operational excellence and to deliver enhanced value to our customers and shareholders.
We will build on our excellent cash flow performance in 2002, and strive to further
strengthen our balance sheet.
A. Under Dave Burner’s leadership we have created a focused aerospace systems company
with global leadership in distinctive systems platforms like landing gear, and wheels and
brakes. The acquisition of Aeronautical Systems added leadership positions in actuation
systems, cargo systems, engine control systems and power systems. We are now No. 1
or No. 2 on a global basis in many of the major system platforms that are required on
every single aircraft that flies. Nobody else has as many platforms. Goodrich can use this
positioning and expertise to assure an active role in any new aircraft program, worldwide.
A. We may be headquartered in North America, but we have operations worldwide and we
serve a global market. Nearly 40% of our sales and one-third of our employees are outside
the United States. We are balanced in our portfolio across Boeing and Airbus, across busi-
ness and regional aircraft, military and commercial, and space markets. So, yes, we think
our worldwide partnerships make us a serious global player in the industry and we intend
to be recognized as such.
Q. What’s behind your recentreorganization into three
business segments?
Q. How will you get more value out of your
broadened portfolio?
Q. What are your goals forenhancing shareholder value?
Q. What emphasis are you going to place on the
company’s various platforms?
Q&A with Marshall Larsen
Marshall Larsen will take the
helm as chief executive officer
effective on April 15, 2003.
In the following question and
answer session, he describes
his vision for Goodrich’s future.
6 Goodrich Corporation 2002 Annual Report 7
Q. Don’t you think Goodrich is still primarily thought of as a
North American company? Do you intend for the
company to be regarded as more of a global player?
Working smarter for BOEING:
Even after working on the Boeing C-17 for nearly two decades, Goodrich is
still finding ways to do things better.
Goodrich provides the massive landing gear that enables the 174-foot-long
C-17 to land on small, austere airfields around the world while carrying a pay-
load of 160,000 pounds. Boeing recently asked Goodrich to revamp the
installation of the landing gear by taking on additional assembly work earlier
in the manufacturing process at Long Beach, California.
“We saved time and money and it even resulted in more work for Goodrich,”
says Bill Stowers, Boeing’s vice president for Supplier Management and
Procurement, Integrated Defense Systems. He notes that Goodrich improved
a process that was originally begun 17 years ago with the inception of the
C-17 program.
“No matter how mature the program, if you put your heads together and
develop a strong working relationship, there are always additional opportunities,”
Stowers says.
Goodrich products are found on virtually every aircraft Boeing manufactures,
both military and commercial, and the relationship between the two companies
dates back 70 years, into the pioneer era of aerospace.
“Boeing and Goodrich work very closely together,” Stowers says. “We are
capitalizing on each other’s strengths. There is a strong sense of teamwork
in the working relationship between our companies.” And, he says, the com-
panies work together from bottom to top: “from manufacturing at the site
levels up to the enterprise level.”
Boeing has built its foundation on ethical standards and Stowers believes
Goodrich has the same high values: “Sharing values in terms of ethics, quality
and trust is extremely important as we align ourselves with our customers
and around common goals and objectives.”
8 Goodrich Corporation
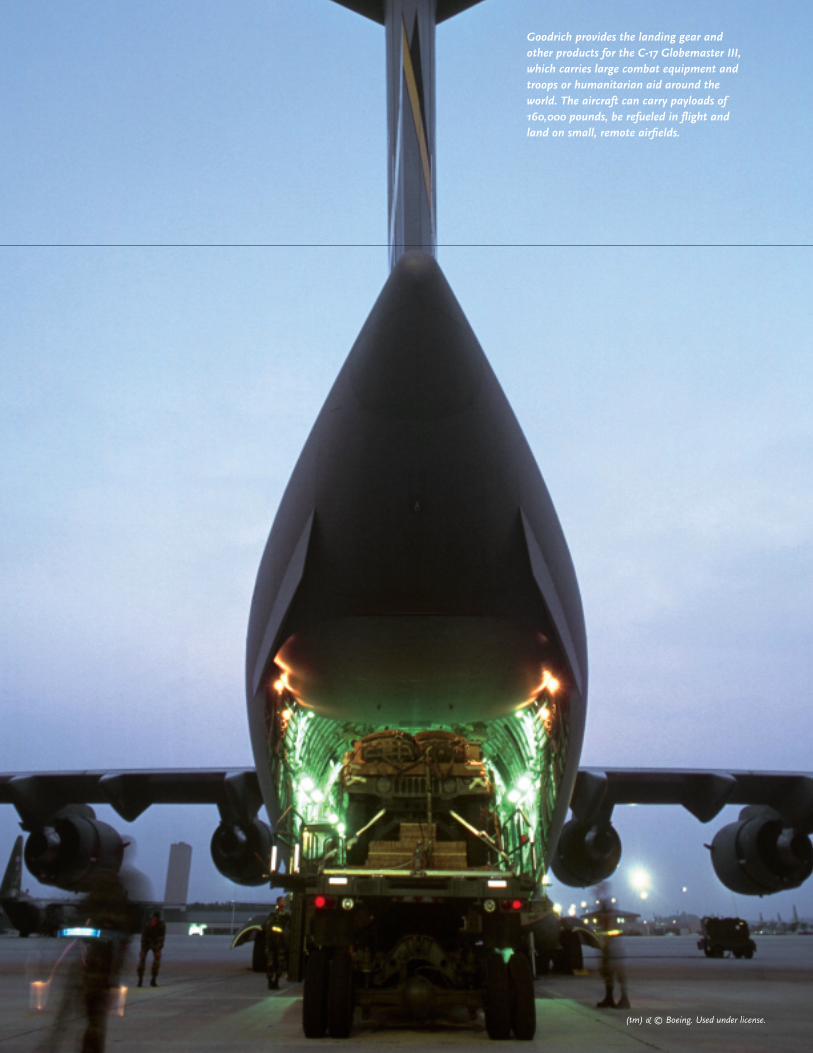
Goodrich provides the landing gear andother products for the C-17 Globemaster III,which carries large combat equipment andtroops or humanitarian aid around theworld. The aircraft can carry payloads of160,000 pounds, be refueled in flight andland on small, remote airfields.
(tm) & © Boeing. Used under license.
10 Goodrich Corporation
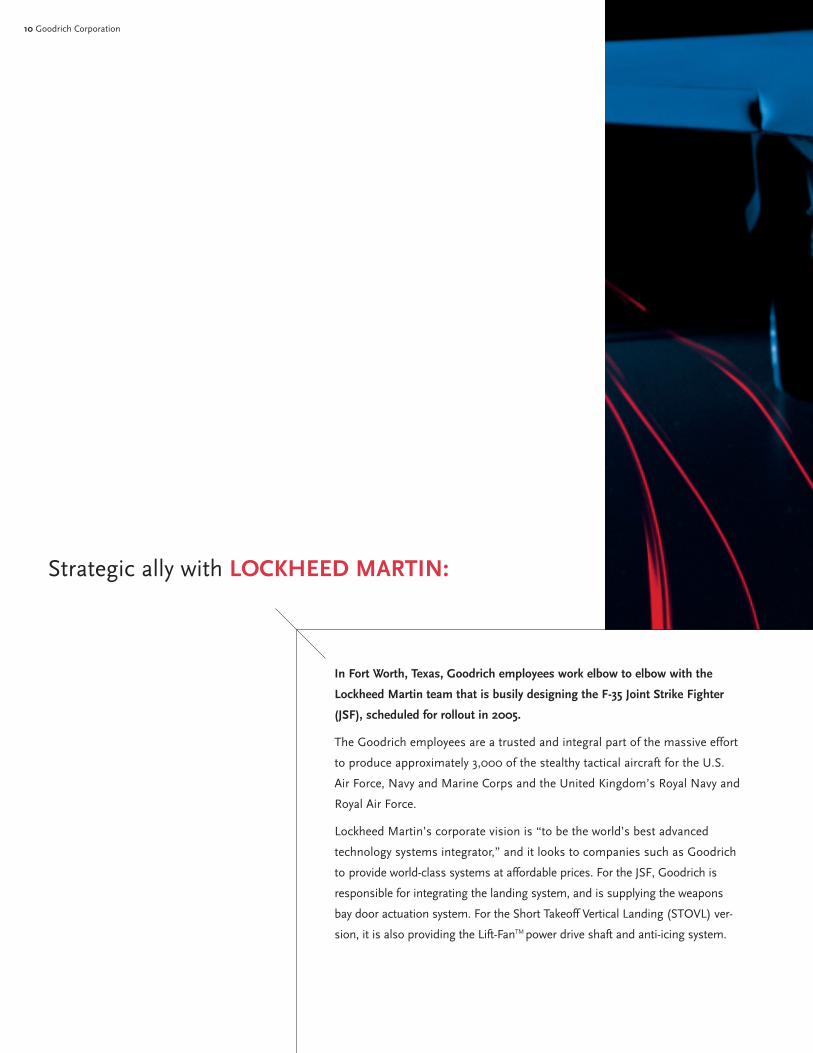
Strategic ally with LOCKHEED MARTIN:
In Fort Worth, Texas, Goodrich employees work elbow to elbow with the
Lockheed Martin team that is busily designing the F-35 Joint Strike Fighter
(JSF), scheduled for rollout in 2005.
The Goodrich employees are a trusted and integral part of the massive effort
to produce approximately 3,000 of the stealthy tactical aircraft for the U.S.
Air Force, Navy and Marine Corps and the United Kingdom’s Royal Navy and
Royal Air Force.
Lockheed Martin’s corporate vision is “to be the world’s best advanced
technology systems integrator,” and it looks to companies such as Goodrich
to provide world-class systems at affordable prices. For the JSF, Goodrich is
responsible for integrating the landing system, and is supplying the weapons
bay door actuation system. For the Short Takeoff Vertical Landing (STOVL) ver-
sion, it is also providing the Lift-FanTM power drive shaft and anti-icing system.
2002 Annual Report 11
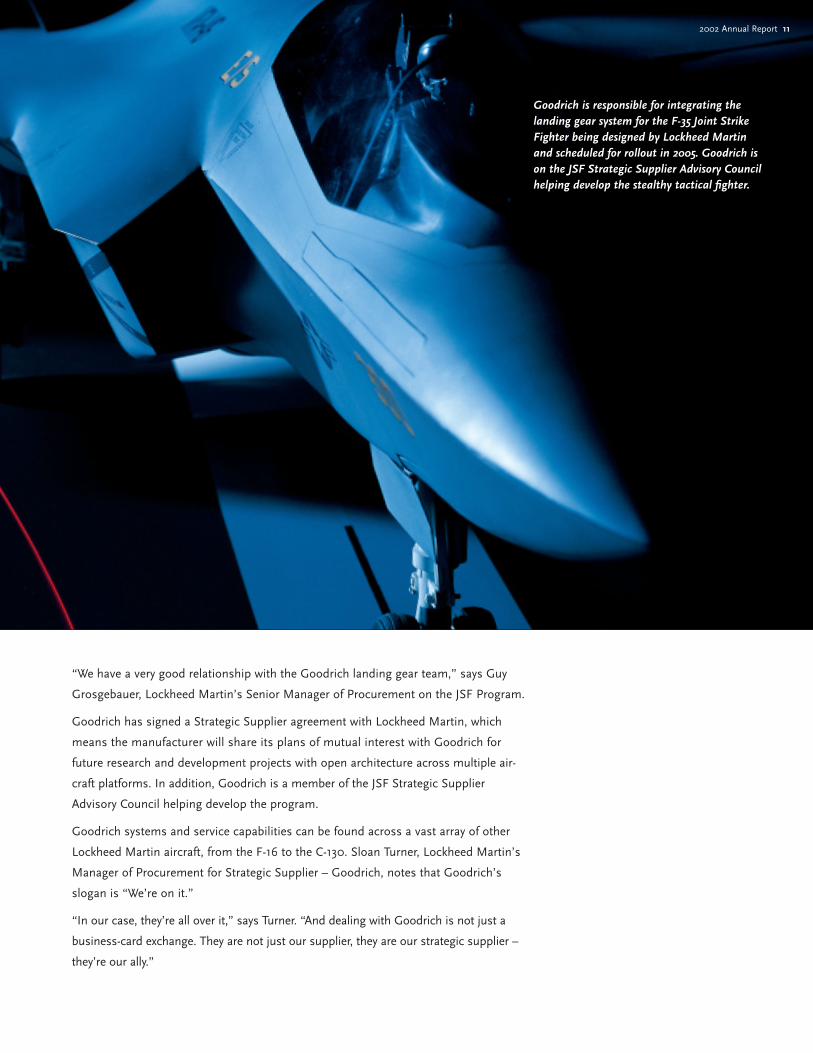
Goodrich is responsible for integrating thelanding gear system for the F-35 Joint StrikeFighter being designed by Lockheed Martinand scheduled for rollout in 2005. Goodrich ison the JSF Strategic Supplier Advisory Councilhelping develop the stealthy tactical fighter.
“We have a very good relationship with the Goodrich landing gear team,” says Guy
Grosgebauer, Lockheed Martin’s Senior Manager of Procurement on the JSF Program.
Goodrich has signed a Strategic Supplier agreement with Lockheed Martin, which
means the manufacturer will share its plans of mutual interest with Goodrich for
future research and development projects with open architecture across multiple air-
craft platforms. In addition, Goodrich is a member of the JSF Strategic Supplier
Advisory Council helping develop the program.
Goodrich systems and service capabilities can be found across a vast array of other
Lockheed Martin aircraft, from the F-16 to the C-130. Sloan Turner, Lockheed Martin’s
Manager of Procurement for Strategic Supplier – Goodrich, notes that Goodrich’s
slogan is “We’re on it.”
“In our case, they’re all over it,” says Turner. “And dealing with Goodrich is not just a
business-card exchange. They are not just our supplier, they are our strategic supplier –
they’re our ally.”

12 Goodrich Corporation
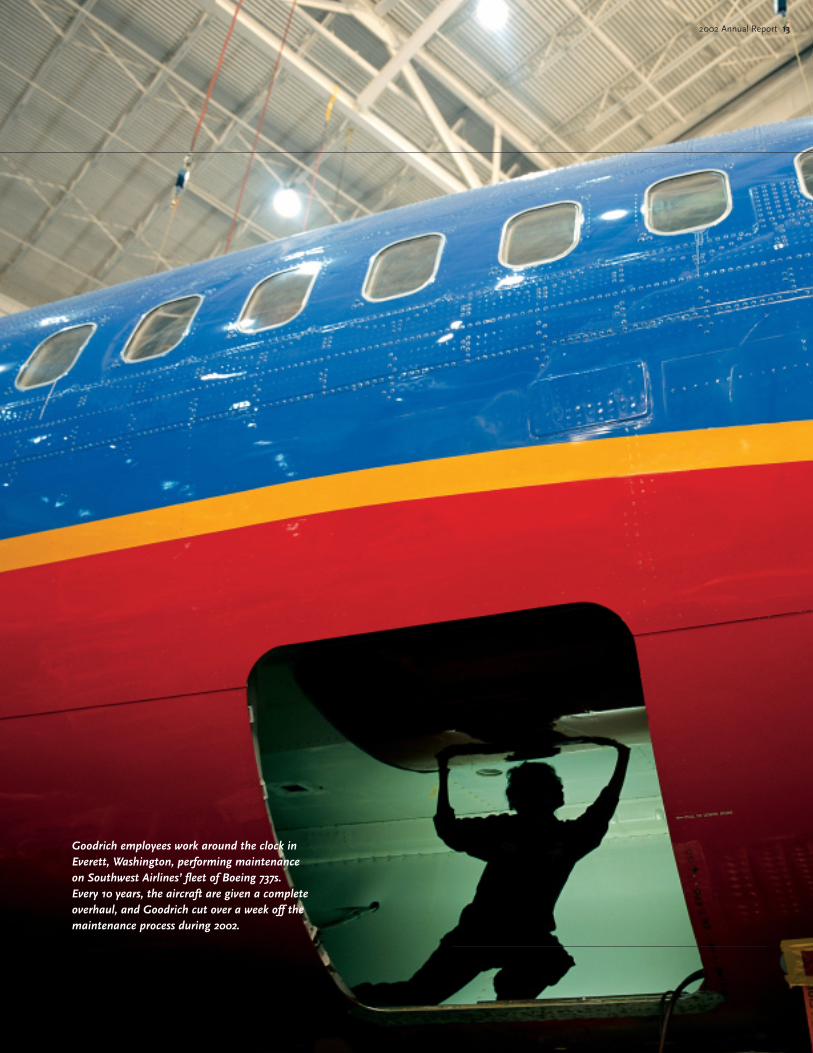
Scoring high for SOUTHWEST:
Southwest Airlines sends its fleet of Boeing 737s to Goodrich’s million-
square-foot facility in Everett, Washington, for regularly scheduled heavy
maintenance.
Over their 27-year relationship, Goodrich has maintained and delivered more
than 800 Southwest aircraft. Many of these aircraft have undergone a com-
plete overhaul (heavy check) that is required every 10 years.
Southwest felt the heavy maintenance process was taking too long – in some
cases as long as 42 days – and urged Goodrich to make a significant reduction
in the amount of time the overhauls took.
“The more aircraft that are in the air, the more money we’re making,” explains
Jim Sokol, Southwest’s vice president of maintenance and engineering.
Goodrich responded and by 2002 had cut over a week off the heavy mainte-
nance process. It now takes just 32 days into which the company packs
roughly 25,000 labor hours of work.
“Goodrich senses the urgency of our needs. They are inspired to do what is
best – and I mean that very passionately,” Sokol says.
About 300 Goodrich employees are assigned to work exclusively on
Southwest’s aircraft, and the team is on the job 24 hours a day, seven days
a week. Every three months, the two companies get together for a rigorous
performance review.
“We talk very candidly about ways to improve business aspects,” Sokol says.
In early 2003, Southwest awarded Goodrich the highest score Southwest has
ever given a major maintenance provider.
Says Sokol, “They understand our work program and our philosophies and
act as an extension of Southwest Airlines. They really do a fantastic job.”
Solving maintenance challenges
Goodrich has developed innovative ways to
deliver maintenance, repair and overhaul
(MRO) services to its customers.
ExpressJet wanted to manage repair services
efficiently as it increases the size of its fleet
of Embraer jets to a total of 274 aircraft. The
answer was Goodrich Customer Services’ asset
management solution that provides mainte-
nance, repair and support services for a fixed
hourly rate over a 10-year period.
South African Airways decided to outsource
the management of some of its repairs through
Goodrich Customer Services’ total global repair
maintenance solution. Using the online total
repair management system, SAA improved
turnaround times on repair parts by approxi-
mately 25 percent from point of pickup to
point of delivery.
2002 Annual Report 13
Goodrich employees work around the clock inEverett, Washington, performing maintenanceon Southwest Airlines’ fleet of Boeing 737s.Every 10 years, the aircraft are given a completeoverhaul, and Goodrich cut over a week off themaintenance process during 2002.

Developing new technology for AIRBUS:
Video breakthrough will protect pilots
In the aftermath of September 11, airlines wanted
additional ways to protect their pilots from attack.
Airbus decided to do more than simply meet U.S.
requirements for reinforced cockpit doors. It wanted
pilots to see who was on the other side of the
secure door.
Goodrich responded with a three-camera video
surveillance system, the first of its kind, which
securely monitors the cabin side of the cockpit
door as well as the galley. The new system is such
an obvious safety benefit that British Airways and
Virgin Atlantic want the cameras for their entire
fleet of aircraft.
The double-decker Airbus A380, the largest airliner ever to be built, will
enter commercial service in 2005 with several technological advances
from Goodrich.
One of the major challenges for Goodrich was to create an evacuation system
for an aircraft that stands 79 feet tall, stretches nearly the length of an
American football field and will carry 555 passengers.
“The evacuation slides are not only made of new high-tech materials, but
they also have a number of innovations around the inflation system and
even the adhesion of components,” says Ray Wilson, executive vice president
of procurement for Airbus. “The innovations have resulted in a much
lighter product.”
As one of Airbus’ top five equipment suppliers, Goodrich is also providing the
main landing gear for the A380, as well as innovative LED-based exterior
lighting, breakthrough variable frequency technology for the aircraft’s power
generation, actuation systems and other products.
14 Goodrich Corporation

2002 Annual Report 15
“We challenged Goodrich to get some significant weight out of the landing
gear,” Wilson says. “The loads and energy to be absorbed by the gear were
higher than our previous estimates when it came to final calculations, which
potentially added weight to the landing gear. Goodrich had no contractual
obligation to do so, but they put together a team and worked with our guys
and gave us quite remarkable results in a short period. It impressed our
organization enormously.”
Airbus and Goodrich share a common philosophy that technology is a means
to the end of improving cost-performance, he says.
Wilson has gotten to know executives across Goodrich and appreciates
their customer orientation, candor and ethical behavior. “Sometimes they’re
tough and aggressive,” he adds. “But that’s what I expect from good
business people.”
The Airbus A380, shown here as acomputer-generated image, will entercommercial service in 2005 featuringseveral Goodrich innovations, includingan advanced evacuation system andbreakthrough variable frequency powergeneration technology. The A380 willbe the largest airliner ever built.
Image provided by Airbus

From 24,000 feet in altitude and a distance of
58 miles, the image produced by the Raptor
airborne reconnaissance system is clear enough
to identify types of vehicles crossing a bridge.
16 Goodrich Corporation
World class reconnaissance for RAF RAPTOR:
For six years, Goodrich has worked with the United Kingdom’s Ministry of
Defence and the Royal Air Force to develop the Raptor program, the highest-
performance, lowest-risk airborne reconnaissance system in the world.
Today, Goodrich employees are on site with RAF personnel around the world
working as a team with Tornado GR4 aircraft equipped with 20-foot Raptor
Reconnaissance Airborne Pods. These teams will have eight pods to equip
its Tornado jets with by the end of the year. The pods contain the Goodrich
DB-110 camera system, a recorder, a mission control system and a data link
system. Raptor provides a digital, electro-optic and infrared system that cap-
tures images day or night and transmits the data to a ground station where
it is analyzed and forwarded to commanders within minutes. The images are
transmitted to the ground team via a radio frequency data link in near-real
time. When the curvature of the earth interferes with the signal, the image
can be recorded and transmitted when the aircraft is back in range.
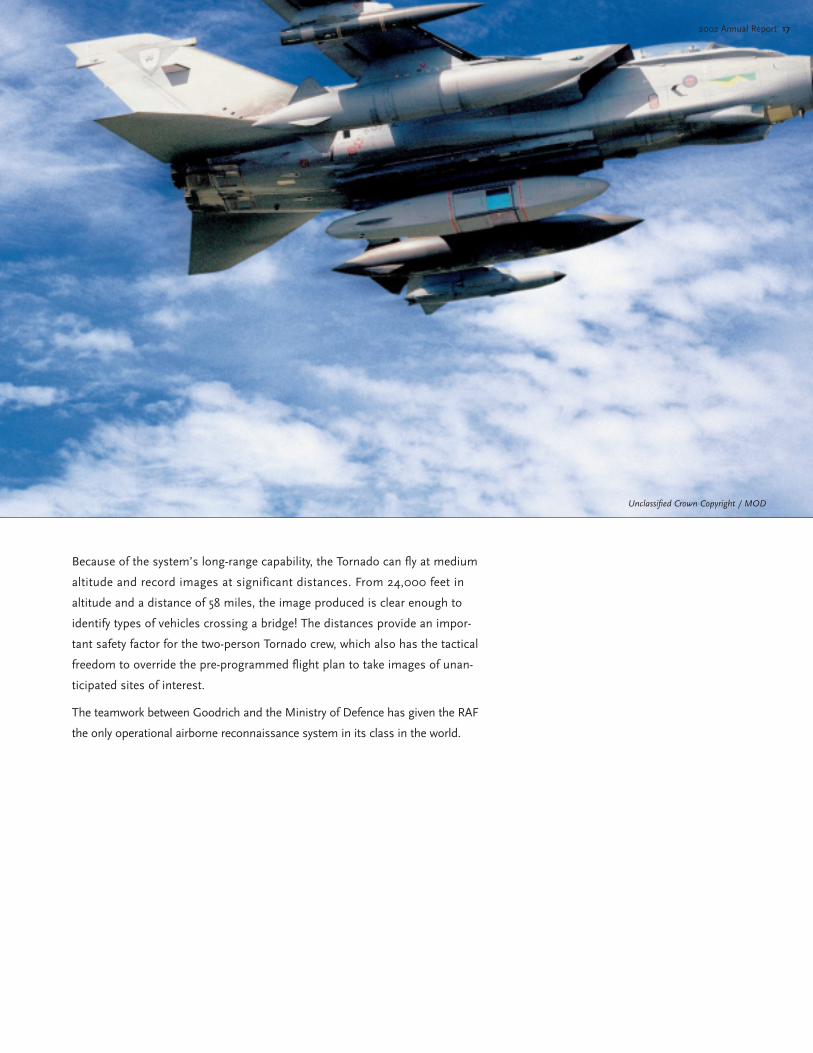
The United Kingdom’s Royal Air Forceflies Tornado GR4 aircraft equipped withRaptor Reconnaissance Airborne Podsdeveloped by Goodrich. The camera systemcaptures images and transmits the data toa ground station. Goodrich employeesserve on site with RAF personnel.
Unclassified Crown Copyright / MOD
2002 Annual Report 17
Because of the system’s long-range capability, the Tornado can fly at medium
altitude and record images at significant distances. From 24,000 feet in
altitude and a distance of 58 miles, the image produced is clear enough to
identify types of vehicles crossing a bridge! The distances provide an impor-
tant safety factor for the two-person Tornado crew, which also has the tactical
freedom to override the pre-programmed flight plan to take images of unan-
ticipated sites of interest.
The teamwork between Goodrich and the Ministry of Defence has given the RAF
the only operational airborne reconnaissance system in its class in the world.
Unclassified Crown Copyright / MOD
18 Goodrich Corporation
A partner with our world COMMUNITIES:
Goodrich has made its reputation by establishing long-term partnerships
that benefit its customers. The company takes the same approach with
worthy causes that help make the world a better place.
A prime example is the ORBIS program, which operates a DC-10 flying eye
hospital. The aircraft travels to developing countries where an international
medical team performs eye surgeries and shares its skills with eye care pro-
fessionals from the host nations.
Goodrich has donated services to the DC-10 since 1996. The Goodrich
Aircraft Interior Products (AIP) Service Center network has provided overhaul
service for the aircraft’s evacuation system as well as new seat assemblies
for the pilot/co-pilot and first officer seats. AIP also donated inspection
and overhaul services.
Goodrich Aviation Technical Services also began working with ORBIS in
2002 and donated 600 labor hours to install a global positioning system
on the airplane.

2002 Annual Report 19
Goodrich donates services to the DC-10
flying eye hospital operated by the ORBIS
program, whose doctors perform eye
surgeries in developing countries and share
their skills with local physicians. Goodrich
recently put a new global positioning system
on the aircraft.
Shown are:
MaryAnn Miller – Vice President of Human
Resources, Aircraft Interior Products
Christine Probett – President,
Aircraft Interior Products
Keith Norgren – Vice President of
Mature Products and Services, Aircraft
Interior Products
In the United Kingdom, Goodrich is an active partner in the Schools
Aerospace Challenge, which invites design entries from teenagers to com-
pete for a chance to attend a special summer session at Cranfield University
and win a prize of £5,000 (approximately US$8,000). This year’s contest
solicited ideas for future versions of the Joint Strike Fighter. Goodrich engi-
neers provide guidance to the students and have found that the program not
only builds goodwill but gives young people a fascinating introduction to the
aerospace industry.
“We’ve found that the ones who haven’t had a strong engineering background
have gone through this rewarding experience and gone away thinking, ‘Gosh,
that was really quite interesting, so rather than becoming a banker, I might
become an aircraft designer,’” says Graham Stark, a leader of the Challenge.
20 Goodrich Corporation
WHAT YOU SEE, WHAT YOU DON’T SEE: The Goodrich Platform.
Power Systems
Power Generation &Distribution Systems
Rescue Hoists
Cargo Winches
Aircraft Interior Products
Evacuation Slides
Life Rafts
Seating Systems
Propulsion Systems
Military Aircrew EscapeSystems
Propulsion Products
Space & MissileApplications
Fuel & Utility Systems
Fuel Management Systems
Fuel MeasurementSystems
Health & UsageManagement Systems
Fire Suppression Systems
Proximity Sensing Systems
Brake Control Systems
Optical & Space Systems
Optical Systems &Precision Components
Space-Based AstronomicalTelescopes
Launch Vehicle Avionics
Spacecraft Avionics,Sensors and Actuators
Laser Warning Systems
Sensor Systems
Primary & Standby AirData Systems
Ice Detection Sensors &Systems
Rate Gyros & InertialSensors
Video SurveillanceSystems
Engine Temperature &Pressure Sensors
De-Icing & SpecialtySystems
Ice Protection Systems
Potable Water Systems
Specialty Heating Systems
Avionics Systems
Collision Avoidance
Display Systems
Weather Avoidance
Standby Instruments
Navigation Systems
Lighting Systems
Interior Lighting Systems
Exterior Lighting Systems
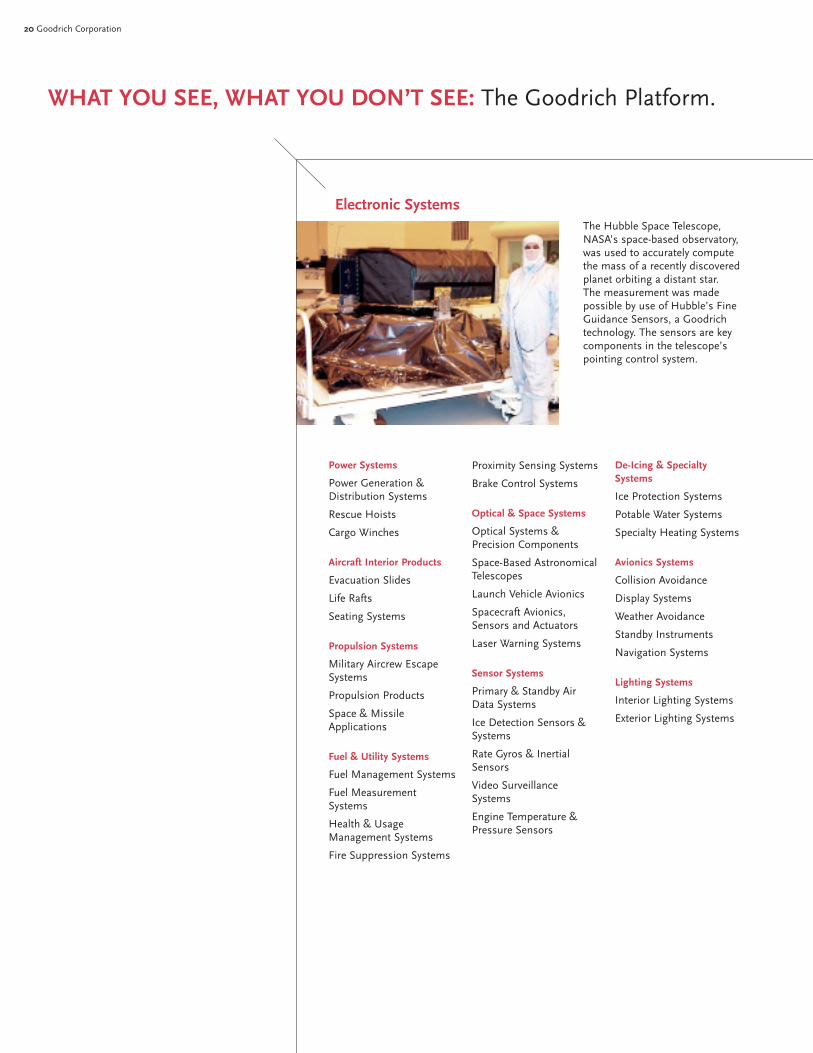
Electronic SystemsThe Hubble Space Telescope,NASA’s space-based observatory,was used to accurately computethe mass of a recently discoveredplanet orbiting a distant star.The measurement was madepossible by use of Hubble’s FineGuidance Sensors, a Goodrichtechnology. The sensors are keycomponents in the telescope’spointing control system.

2002 Annual Report 21
Goodrich producesa range of efficient, state-of-the-art landing systemsfor commercial jets,bombers, transports,general aviation aircraft,helicopters and fighters,including the LockheedMartin F-16.
Actuation Systems
Flight Control ActuationSystems
Engine and NacelleActuation
Helicopter Rotor Actuation
Utility Actuation
Missile Actuation
Landing Gear
Landing Gear Systems
Wheels & Brakes
Aircraft Wheels
Steel Braking Systems
Carbon Braking Systems
High TemperatureComposite Coatings
Aviation Technical Services
Airframe Maintenance
Aircraft Modifications
Component Repair & Overhaul
Customer Services
Maintenance Repair& Overhaul OrderTransactions
Spares Order Transactions
Field Service
AOG Support (for former Aeronautical Systems businesses)
Engineered PolymerProducts
Acoustic Windows& Sonar Domes
Engineered Composites
Goodrich’s Turbine FuelTechnologies businessspecializes in the design,development, and manu-facture of gas turbinefuel injection compo-nents and systems foraviation and industrialgas turbine engines.
Engine Control Systems
Electronic Engine Controls
Hydromechanical EngineControls
Fuel Pumping & MeteringSystems
Cargo Systems
MechanicalComponents/Systems
Electrical Control Systems
Power Drive Systems
Aerostructures
Nacelles & Pylon Systems
Other SpecializedAerostructures
Turbine Fuel Technologies
Gas Turbine Fuel InjectionComponents
Turbomachinery Products
Gas Turbine EngineComponents
Airframe Systems
Engine Systems
2002 Annual Report 23
Financial Highlights . . . . . . . . . . . . . . . . . . . . . . . . . . . . . .24
Management’s Discussion & Analysis . . . . . . . . . . . . . . . .25
Management’s Responsibility for Financial Statements . . .46
Report of Independent Auditors . . . . . . . . . . . . . . . . . . . . .47
Consolidated Statement of Income . . . . . . . . . . . . . . . . . . .48
Consolidated Balance Sheet . . . . . . . . . . . . . . . . . . . . . . . .49
Consolidated Statement of Cash Flows . . . . . . . . . . . . . . . .50
Consolidated Statement of Shareholder’s Equity . . . . . . . . .51
Notes to Consolidated Financial Statements . . . . . . . . . . .52
Quarterly Financial Data . . . . . . . . . . . . . . . . . . . . . . . . . . .78
Selected Financial Data . . . . . . . . . . . . . . . . . . . . . . . . . . . .80
Index to Financials
22 Goodrich Corporation
David L. BurnerChairman and Chief Executive Officer
Marshall O. LarsenPresident and Chief Operating Officer
Terrence G. LinnertExecutive Vice President, Human Resourcesand Administration, General Counsel
Ulrich (Rick) SchmidtExecutive Vice President and Chief Financial Officer
Stephen R. HugginsSenior Vice President, Strategic Resources and Information Technology
Jerry S. LeeSenior Vice President, Technologyand Innovation
John J. CarmolaSegment President, Engine Systems
Cynthia M. EgnotovichSegment President, Electronic Systems
John J. GrisikSegment President, Airframe Systems
Joseph F. AndolinoVice President, Business Development and Tax
Robert D. Koney, Jr.Vice President and Controller
Scott E. KuechleVice President and Treasurer
Alexander C. SchochVice President, Associate GeneralCounsel and Secretary
Senior MANAGEMENT
David L. BurnerChairman and Chief Executive OfficerGoodrich Corporation.Director since 1995. (1)
Diane C. CreelPresident and Chief Executive OfficerEarth Tech, an international consultingengineering company.Director since 1997. (2,5)
George A. Davidson, Jr.Retired ChairmanDominion Resources, Inc., a natural gasand electric power holding company.Director since 1991. (2,5)
Harris E. DeLoach, Jr.President and Chief Executive OfficerSonoco Products Company, a worldwide,vertically integrated packaging company.Director since 2001. (2,3)
James J. GlasserChairman EmeritusGATX Corporation, a transportation, storage,leasing and financial services company.Director since 1985. (1,2,4)
James W. GriffithPresident and Chief Executive OfficerThe Timken Company, an international man-ufacturer of highly engineered bearings, alloyand specialty steels and components.Director since 2002. (2,3)
William R. HollandRetired ChairmanUnited Dominion Industries, adiversified manufacturing company.Director since 1999. (4,5)
Marshall O. LarsenPresident and Chief Operating OfficerGoodrich CorporationDirector since 2002.
Douglas E. OlesenRetired President and Chief Executive OfficerBattelle Memorial Institute, a worldwidetechnology organization working forgovernment and industry.Director since 1996. (3,5)
Richard de J. OsborneChairman of the Board (retired)ASARCO Incorporated, a leading producerof nonferrous metals.Director since 1996. (3,4)
Alfred M. Rankin, Jr.Chairman, President and ChiefExecutive OfficerNACCO Industries, Inc., an operatingholding company with interests in the min-ing and marketing of lignite, themanufacturing and marketing of forklifttrucks and the manufacturing andmarketing of small household appliances.Director since 1988. (1,3,5)
James R. WilsonRetired Chairman, President andChief Executive OfficerCordant Technologies, a leading producerof solid-propellant rocket motors, high-performance fasteners used in commercialaircraft and industrial applications, andcomponents for aircraft and industrial gasturbine engines.Director since 1997. (2,4)
A. Thomas Young Retired Executive Vice PresidentLockheed Martin Corporation, an aerospaceand defense company.Director since 1995. (3,5)
Committees of the Board(1) Executive Committee(2) Compensation Committee(3) Audit Review Committee(4) Committee on Governance(5) Financial Policy Committee
BOARD of Directors

24 Goodrich Corporation
Goodrich’s ethical foundation is built on four principles: integrity,
mutual respect, responsibility and corporate citizenship.
• Integrity drives our commitment to customers, suppliers,
fellow employees and others with whom we interact.
We embrace truthfulness and trust. We say what we mean,
and we deliver what and when we promise.
• Mutual respect creates an environment based on teamwork
and trust. We value the differences and the similarities in our
customers, suppliers, fellow employees and communities.
• Responsibility makes us accountable for accepting the
consequences of our behavior. We strive for excellence in
everything we do. We are expected to adhere to the highest
legal and ethical standards.
• Corporate citizenship requires that we operate our businesses
in a manner that respects and complies with all applicable
laws and regulations. We respect the environment.
To help maintain commitment to these principles, Goodrich
has recently adopted its updated Business Code of Conduct.
The Code, which applies to our directors, officers, employees
and others acting on behalf of the company, identifies funda-
mental legal and ethical principles for conducting all aspects
of business. From product integrity on the factory floor to
corporate governance in the boardroom, all of us are expected
to adhere to these standards and to report any violations. An
extensive program of live and on-line training supports the
Code. The company employs a full-time Director of Ethics and
Business Conduct, and provides a Helpline to address prob-
lems and concerns about ethical or legal issues.
For more information on Goodrich’s ethics policy contact the
Ethics and Business Conduct Office at 704/423-7576, e-mail
[email protected] or write to:
Goodrich Corporation
Attention: Director, Ethics & Business Conduct
Four Coliseum Centre
2730 West Tyvola Road
Charlotte, NC 28217-4578
An Ethical TRADITION
For the year (dollars in millions, except per share amounts) 2002 2001 % Change
Sales $ 3,910 $ 4,185 (6.6%)
Segment operating income(1) $ 533 $ 644 (17.3%)
Segment operating margins(1) 13.6% 15.4%
Net Income(1) $ 244 $ 306 (20.3%)
Free cash flow(1) $ 487 $ 223 118.9%
Return on average shareholders’ equity(1) 21.3% 23.7%
Net Income per Share(1)
Basic $ 2.35 $ 2.97 (20.9%)
Diluted $ 2.31 $ 2.87 (19.5%)
Dividends per share $ 0.88 $ 1.10 (20.0%)
Shares outstanding 117.1 101.7
(1) Excludes special items. We believe excluding special items provides meaningful additional information on our operating results. Amounts adjusted to excludespecial items should not be construed as an alternative to amounts determined in accordance with GAAP. Because amounts adjusted to exclude specialitems are not calculated in the same manner by all companies, our presentation may not be comparable to other similarly titled amounts reported by othercompanies. For a reconciliation of non-GAAP financial measures to the most directly comparable GAAP measures, see Management’s Discussion andAnalysis starting on p25.
Financial HIGHLIGHTS

2002 Annual Report 25
You should read the following discussion in conjunction with the auditedconsolidated financial statements of Goodrich Corporation included elsewhere inthis document.
This management’s discussion and analysis of financial condition and resultsof operations contains forward-looking statements. See “Forward-LookingStatements” below and “Certain Business Risks” in Item 1 of our Annual Report onForm 10-k for a discussion of the uncertainties, risks and assumptions associatedwith these statements.
As discussed below, the Company’s engineered industrial product (EIP) and per-formance materials (PM) segments have been accounted for as discontinuedoperations. Unless otherwise noted herein, disclosures pertain only to the Company’scontinuing operations.
Special items, as used throughout “management’s discussion and analysis offinancial condition and results of operations” include restructuring and consolida-tion costs, certain gains or losses on the sale of businesses, results of discontinuedoperations, cumulative effect of a change in accounting, asset impairmentcharges and acquisition-related charges including the step-up of inventory and in-process research and development.
Overview
We are one of the largest worldwide suppliers of components, sys-tems and services serving the commercial, regional, business andgeneral aviation markets. We are also a leading supplier of aircraftand satellite systems products to the global military and space mar-kets. Our business is conducted on a global basis with manufactur-ing, service and sales undertaken in various locations throughoutthe world. Our products and services are principally sold to cus-tomers in North America and Europe.
Acquisition of Aeronautical SystemsOn October 1, 2002, we completed our acquisition of AeronauticalSystems from TRW Inc. for approximately $1.5 billion in cash. At thetime of acquisition, the acquired businesses employed approximately6,200 employees in 22 facilities in nine countries, including manufac-turing and service operations in the United Kingdom, France, Germany,Canada, the United States and several Asia/Pacific countries. Refer toNote B to the accompanying Consolidated Financial Statements.
We financed the acquisition through a $1.5 billion, 364-day creditfacility provided by some of our existing lenders. This facility expireson July 29, 2003. In the fourth quarter of 2002, we repaid $1.3 billionof the credit facility primarily through the use of cash flow fromasset monetizations, cash flow from operations, the successfulcompletion of a secondary offering of common stock for net pro-ceeds of $216.2 million and the issuance of $800 million of 5 and 10-year notes for net proceeds of $793.1 million. The proceeds from thepending sale of our Avionics business, which was announced inJanuary 2003 will be used to reduce the balance of the credit facility.
As a result of integration activities with respect to AeronauticalSystems, we expect to realize annual cost savings of approximately$30 million to $40 million, net of anticipated incremental costs, bythe beginning of 2005. These cost savings are expected to resultfrom consolidation of duplicate facilities, reduction of personnel,reduction of expenditures, expansion of procurement initiatives andthe use of best practices across the combined businesses.
Spin-off of Engineered Industrial Products On May 31, 2002, we completed the tax-free spin-off of ourEngineered Industrial Products (EIP) segment. The spin-off wasmade through a tax-free distribution to our shareholders of all of thecapital stock of EnPro Industries, Inc. (EnPro), a subsidiary that weformed in connection with the spin-off. In the spin-off, our shareholdersreceived one share of EnPro common stock for every five shares of ourcommon stock owned on May 28, 2002, the record date.
At the time of the spin-off, EnPro’s only material asset was all of thecapital stock and certain indebtedness of Coltec Industries Inc(Coltec). Coltec and its subsidiaries owned substantially all of theassets and liabilities of the EIP segment, including the associatedasbestos liabilities and related insurance.
Prior to the spin-off, Coltec also owned and operated an aerospacebusiness. Before completing the spin-off, Coltec’s aerospace busi-ness assumed all intercompany balances outstanding betweenColtec and us, and Coltec then transferred to us as a dividend all theassets, liabilities and operations of its aerospace business, includ-ing these assumed balances. Following this transfer and prior to thespin-off, all of the capital stock of Coltec was contributed to EnPro,with the result that at the time of the spin-off Coltec was a wholly-owned subsidiary of EnPro.
In connection with the spin-off, we and EnPro entered into a distri-bution agreement, a tax matters agreement, a transition servicesagreement, an employee matters agreement and an indemnificationagreement, which govern the relationship between us and EnProafter the spin-off and provide for the allocation of employee benefits,tax and other liabilities and obligations attributable to periods priorto the spin-off.
The spin-off was recorded as a dividend and resulted in a reductionof our shareholders’ equity of $409.1 million representing therecorded value of the net assets of the business distributed, includ-ing cash of $47.0 million. The distribution agreement provided forcertain post-distribution adjustments relating to the amount of cashto be included in the net assets distributed. At December 31, 2002,the final adjustment had been calculated and is subject to a disputeresolution process. We expect that the effect of the final resolutionof this process on our Consolidated Financial Statements will be immaterial.
The $150 million of outstanding Coltec Capital Trust 5 1/4 percentconvertible trust preferred securities (TIDES) that were reflected inliabilities of discontinued operations remained outstanding as partof the EnPro capital structure following the spin-off. The TIDES areconvertible into shares of both Goodrich and EnPro common stockuntil April 15, 2028. We have guaranteed amounts owed by ColtecCapital Trust with respect to the TIDES and have guaranteedColtec’s performance of its obligations with respect to the TIDESand the underlying Coltec convertible subordinated debentures.EnPro, Coltec and Coltec Capital Trust have agreed to indemnify usfrom any costs and liabilities arising under or related to the TIDESafter the spin-off.
Management’s Discussion & Analysis of Financial Condition and Results of Operations
26 Goodrich Corporation
Management’s Discussion & Analysis
Prior to the spin-off, Coltec acquired certain call options on ourcommon stock in order to partially hedge its exposure to fluctua-tions in the market price of our stock resulting from the TIDES.These call options remained an asset of Coltec following the spin-off.
Sale of Performance MaterialsOn February 28, 2001, we completed the sale of our PerformanceMaterials (PM) segment to an investor group led by AEA Investors,Inc. for approximately $1.4 billion. Total net proceeds, after antici-pated tax payments and transaction costs, included approximately$1 billion in cash and $172 million in payment-in-kind (PIK) debtsecurities issued by the buyer, which is now known as NoveonInternational Inc. (Noveon). The transaction resulted in an after-taxgain of $93.5 million. During the second quarter 2002, a disputeover the computation of a post-closing working capital adjustmentwas resolved. The resolution of this matter did not have an effect onthe previously reported gain.
In July 2002, we entered into an agreement with Noveon to amendcertain provisions of the PIK notes held by us to give Noveon theoption to prepay the securities at a discount greater than the originaldiscount if they prepaid on or before February 28, 2003. As a resultof prepayments made in June and October 2002, Noveon prepaid atotal of $62.5 million of the outstanding principal of the PIK notesfor $49.8 million in cash. Because these prepayments did notexceed the original discount recorded at the inception of the notes,no gain or loss was recognized.
Pursuant to the terms of the transaction, we have retained certainassets and liabilities, primarily pension, postretirement and envi-ronmental liabilities, of Performance Materials. We have also agreedto indemnify Noveon for liabilities arising from certain events asdefined in the agreement. Such indemnification is not expected tobe material to our financial condition, but could be material to ourresults of operations in a given period.
Other Acquisitions and DivestituresAcquisitionsThe following acquisitions were recorded using the purchasemethod of accounting. Their results of operations have been includedin our results since their respective dates of acquisition. Acquisitionsmade by businesses included within the Performance Materials andEngineered Industrial Products are not discussed below.
During 2001, we acquired a manufacturer of aerospace lighting sys-tems and related electronics, as well as the assets of a designer andmanufacturer of inertial sensors used for guidance and control ofunmanned vehicles and precision-guided systems. Total considera-tion aggregated $113.8 million, of which $102.6 million representedgoodwill and other intangible assets.
During 2000, we acquired a manufacturer of earth and sun sensorsfor attitude determination and control ejection seat technology; amanufacturer of fuel nozzles; a developer of avionics and displays; the assets of a developer of precision electro-optical instrumenta-tion serving the space and military markets; an equity interest in ajoint venture focused on developing and operating a comprehensiveopen electronic marketplace for aerospace aftermarket productsand services; a manufacturer of precision and large optical systems,laser encoding systems, and visual surveillance systems for day andnight use; and a supplier of pyrotechnic devices for space, missile,and aircraft systems. Total consideration aggregated $242.6 million, ofwhich $105.4 million represented goodwill and other intangible assets.
The impact of these acquisitions was not material in relation to ourresults of operations. Consequently, pro forma information is notpresented. See Note B to the accompanying Consolidated FinancialStatements.
DivestituresDuring 2002, we sold a business and a minority interest in a businessresulting in a pre-tax gain of $2.5 million. The gain has been reportedin other income (expense) – net.
During 2001, we sold a minority interest in a business, resulting ina pre-tax gain of $7.2 million. The gain has been reported in otherincome (expense) – net.
During 2000, we sold a product line of a business, resulting in apre-tax gain of $2.0 million. The gain has been reported in otherincome (expense) – net.
For dispositions accounted for as discontinued operations, refer toNote U to the accompanying Consolidated Financial Statements.
Business SegmentsAt December 31, 2002, we operated in five business segments:Aerostructures and Aviation Technical Services; Landing Systems;Engine and Safety Systems; Electronic Systems; and AeronauticalSystems. A summary of the products and services provided by ourbusiness segments is presented below.
Aerostructures and Aviation Technical ServicesThe core products of our Aerostructures division are nacelles,pylons, thrust reversers and related aircraft engine housing compo-nents. We are a leading worldwide supplier of nacelles, which are theaerodynamic structures that surround engines, and pylons, whichare the engine-to-wing structures that support engines and providethe critical connective conduit for fuel delivery and numerousengine-driven aircraft systems. In addition, we manufacture a rangeof specialized aerostructures, including lightweight, temperature-resistant auxiliary power unit tailcones for jetliners, corrosion-resist-ant structures for tactical military aircraft, and rigid cargo barriersfor freighter aircraft. We also manufacture a variety of galley, wing,nacelle, thrust reverser, flight control surface and assembly compo-nents for out-of-production aircraft.

2002 Annual Report 27
Through our Aviation Technical Services division, we service approx-imately 550 aircraft each year and are among the largest independentproviders of maintenance, repair, overhaul and modification servicesin the world. Services provided by our Aviation Technical Servicesdivision range from the repair of individual components and systemsto heavy maintenance and modifications of large commercial aircraftand business jet aircraft. We perform comprehensive total aircraftmaintenance, repair, overhaul and modification for many commercialairlines, independent operators, aircraft leasing companies and air-freight carriers.
Landing SystemsOur Landing Systems segment provides systems and componentsrelated to aircraft taxi, take-off, landing and stopping. Severaldivisions within this segment are linked by their ability to contributeto the integration, design, manufacture and service of entire aircraftundercarriage systems, including landing gear, wheels and brakes,and certain brake controls. We differentiate ourselves from componentsuppliers by providing integrated systems, delivered as completely pre-assembled units to airframe manufacturers. We also provide completerepair and overhaul services for landing gear, wheels and brakes. Inaddition, through our engineered polymer products division, wedesign and produce components made from proprietary, high-perform-ance composite material systems used in naval ships and submarinesto improve acoustic characteristics and reduce radar signature ofexposed superstructures.
Engine and Safety SystemsOur Engine and Safety Systems segment produces a variety of prod-ucts used in engine systems, including fuel delivery systems, electronicand mechanical controls, pumps, metering devices, manifolds androtating components such as disks, blisks, shafts and airfoils for bothaerospace and industrial gas turbine applications. The segment alsoprovides evacuation systems such as slides and floats and seats forpilots, observers and flight attendants. Our de-icing and specialtysystems division produces ice protection systems for general avia-tion, heating and related systems for large commercial transport air-craft, and potable water systems for regional and business aircraft.We also supply electrothermal ice protection systems for airframe,propeller and helicopter rotor applications and specialty heatingsystems, water heaters and other internal and external heatedcomponents for large commercial transport aircraft. Through ourpropulsion systems division, we provide research, design, develop-ment, qualifications and manufacture of advanced aircrew escapesystems. We also supply individual components such as rocket motorsand catapults, pyrotechnic gas generators, ejection seats, precisionelectro-explosive devices, propellants, linear actuators, and safety andarming devices.
Electronic SystemsOur Electronic Systems segment produces a wide array of productsthat provide flight performance measurements, flight management,and control and safety data. We supply a variety of high-performancesensor systems, such as stall warning systems and systems that
measure, manage and/or monitor aircraft fuel; oil debris; engine,transmission and structural health; and aircraft motion and control.We also supply a variety of avionics systems and other instruments,including warning and detection systems, ice detection systems,test equipment, aircraft lighting systems, landing gear cables andharnesses, satellite control, data management and payload systems,launch and missile telemetry systems, airborne reconnaissancesystems and laser warning systems. In addition, our optical andspace systems division designs and builds high-performance, cus-tom-engineered electronics, optics and electro-optical products fordefense, aerospace, scientific and commercial applications. We alsoproduce directional surveying equipment for use by companiesoperating in petroleum, mining and utility industries.
Aeronautical SystemsAeronautical Systems manufactures highly engineered systems andequipment in the following product groups:
• Engine Controls This product group consists of engine controlsystems and components for jet engines used on commercial andmilitary aircraft, including fuel metering controls, fuel pumpingsystems, electronic control software and hardware, variablegeometry actuation controls, afterburner fuel pump and meteringunit nozzles, and engine health monitoring systems.
• Flight Controls This product group includes actuators for primaryflight control systems that operate elevators, ailerons and rudders,as well as secondary flight controls systems such as flaps and slats.
• Power Systems This product group consists of systems thatproduce and control electrical power for commercial and militaryaircraft, including electric generators for both main and back-upelectrical power, electric starters, and electric starter generatingsystems, as well as power management and distribution systems.
• Cargo Systems This product group consists of fully-integratedmain deck and lower lobe cargo systems for wide body aircraft.
• Hoists and Winches This product group consists of airborne hoistsand winches used on both helicopters and fixed wing aircraft.
• Actuation Systems This product group consists of systems thatcontrol the movement of steering systems for missiles as well aselectro-mechanical systems that are characterized by high power,low weight, low maintenance, resistance to extreme temperaturesand vibrations, and high reliability.
Segment ReorganizationEffective January 1, 2003, we reorganized our organization into threebusiness segments: Airframe Systems, Engine Systems and ElectronicSystems. The reorganization was designed to enhance communica-tion and maximize synergies in a streamlined organization. Segmentfinancial results will be restated effective January 1, 2003 beginningwith the first quarter 2003.

28 Goodrich Corporation
Management’s Discussion & Analysis
2002 Results The following table summarizes our results of operations for 2002and 2001.
Year-Ended December 31,2002(1) 2001(2)
(in millions) 2002 Adjusted 2001 Adjusted
Sales $ 3,910.2 $ 3,910.2 $ 4,184.5 $ 4,184.5Segment Operating Income $ 420.6 $ 532.9 $ 444.8 $ 644.1
Income from Continuing Operations $ 165.9 $ 244.0 $ 176.9 $ 306.3
Income (loss) from Discontinued Operations (11.9) — 112.3 —
Cumulative Effect of an Accounting Change (36.1) — — —
Net Income $ 117.9 $ 244.0 $ 289.2 $ 306.3
Diluted EPS $ 1.14 $ 2.31 $ 2.76 $ 2.87
Net Cash Provided by Operating Activities $ 539.2 $ 382.6
Free Cash Flow(3) $ 487.1 $ 222.5
(1) Results exclude the effect of special items consisting of a $41.3 millioncharge ($27.7 million after-tax), or $0.26 per diluted share, for restructuringand consolidation costs and a $2.4 million gain ($1.6 million after-tax), or$0.02 per diluted share, from the sale of a business. Results also excludespecial items relating to the acquisition of Aeronautical Systems includingin-process research and development expense of $12.5 million ($12.5 mil-lion after-tax), or $0.12 per diluted share, and the step-up of inventoryto fair market value and subsequent sales of the inventory resulting inreduced profit margins of $58.8 million ($39.5 million after-tax), or $0.38per diluted share. Results also exclude the after-tax effect of a loss fromdiscontinued operations ($11.9 million, or $0.09 per diluted share) and acharge for the cumulative effect of a change in accounting for goodwill of$36.1 million after-tax, or $0.34 per diluted share.
(2) Results exclude the effect of special items consisting of a $107.3 millioncharge ($71.3 million after-tax), or $0.67 per diluted share, for restructuringand consolidation costs, a $94.5 million charge ($62.8 million after-tax),or $0.59 per diluted share, recorded in cost of sales for inventory adjust-ments and a $7.2 million gain ($4.7 million after-tax), or $0.04 per dilutedshare, from the sale of a portion of our interest in a business. Resultsalso exclude the after-tax effect of income from discontinued operations($112.3 million, or $1.11 per diluted share).
(3) Free cash flow is defined as operating cash flow adjusted for cash pay-ments related to special items of $55.2 million in 2002 and $30.3 millionin 2001 less capital expenditures of $107.3 million in 2002 and $190.5 mil-lion in 2001. We believe free cash flow provides meaningful additionalinformation on our operating results and on our ability to service ourlong-term debt and other fixed obligations and to fund our continuedgrowth. Free cash flow should not be construed as an alternative to oper-ating income (loss) as determined in accordance with generally acceptedaccounting principles in the United States (GAAP), as an alternative tocash flow from operating activities as determined in accordance withGAAP, or as a measure of liquidity. Because free cash flow is not calculat-ed in the same manner by all companies, our presentation may not becomparable to other similarly titled measures reported by other companies.
Special items include restructuring and consolidation costs, gainsor losses on the sale of businesses, results of discontinued opera-tions, asset impairment charges, other restructuring costs and thecumulative effect of an accounting change. Special items alsoinclude acquisition-related charges including the step-up of inven-tory and in-process research and development. We believe thatexcluding special items provides meaningful information of ouroperating results. Amounts adjusted to exclude special itemsshould not be construed as an alternative to amounts determined inaccordance with GAAP. Because amounts adjusted to excludespecial items are not calculated in the same manner by all companies,our presentation may not be comparable to other similarly titledamounts reported by other companies.
Sales Sales declined in 2002 by $274.3 million or 6.6 percent to$3,910.2 million from $4,184.5 million in 2001. Sales in 2002 include$264.4 million from the Aeronautical Systems businesses that wereacquired on October 1, 2002. Sales also include our aerospace lightingsystems business acquired in September 2001. Excluding sales of ourlighting systems business for both years and sales of theAeronautical Systems business in 2002, sales declined 13.6 percentfrom 2001. Substantially all of our businesses experienced salesdeclines except for our pump and engine control business which isincluded in the Engine and Safety Systems segment and the opticaland space systems business included in our Electronic Systems seg-ment. For further information regarding sales changes by businesssegment, refer to “Business Segment Performance” below.
Segment Operating Income Segment operating income was $420.6million for 2002 and $444.8 million for 2001. Segment operatingincome, excluding special items, declined $111.2 million, or 17.3 per-cent from $644.1 million in 2001 to $532.9 million in 2002. Adjustedfor special items as discussed above and for the impact of the oper-ating income related to the lighting systems business acquired inSeptember 2001 and the Aeronautical Systems business acquired inOctober 2002, segment operating income declined approximately18.6 percent. The segment operating income decline was consistentwith the sales declines in all of our businesses. In addition, as dis-cussed in “Business Segment Performance” below, contract lossprovisions of $26.8 million and $5.4 million of pre-certification costwrite-offs recorded by the Aerostructures business in the third andfourth quarters of 2002 added to the decline. Segment operatingincome improved in our pump and engine control and optical andspace systems businesses consistent with the sales improvementsin those businesses. For further information regarding operatingincome changes by business segment, refer to “Business SegmentPerformance” below.
Income from Continuing Operations Income from continuing opera-tions, as reported, was $165.9 million in 2002 and $176.9 million in2001. Income from continuing operations, excluding special items,declined $62.3 million, or 20.3 percent to $244.0 million in 2002compared to $306.3 million in 2001. The decline in sales discussedabove was a significant contributor to the income decline. Partially

2002 Annual Report 29
offsetting these declines was an increase in interest income in 2002compared with the prior year resulting, in part, from interest incomeon the F-14 aircraft program claim settlement in 2002.
The 2002 special items include the effect of $41.3 million of restruc-turing and consolidation costs and a $2.4 million gain from the saleof a business and items relating to the acquisition of AeronauticalSystems including in-process research and development expense of$12.5 million and the effect of the step-up of inventory to fair marketvalue which was sold amounting to $58.8 million.
The 2001 special items include the effect of a $107.3 million chargefor restructuring and consolidation costs, a $94.5 million chargerelated primarily to reducing our investment in the B717 programand in our Super 27 re-engining program, and a $7.2 million gainfrom the sale of a portion of our interest in a business.
Income (Loss) from Discontinued Operations Income from discontinuedoperations decreased $124.2 million from income during 2001 of$112.3 million to a loss of $11.9 million during 2002. Sales from dis-continued operations declined from $828.9 million during 2001 to$289.5 million in 2002. The 2001 sales included two months ofPerformance Material sales of $187.0 million, which did not recur in2002. In addition, 2002 sales include only five months of EIP salesdue to the EnPro spin-off, which occurred on May 31, 2002. Also, thedecrease results from lower earnings from operations of the EIPsegment, discontinued in 2001, compared to 2002 resulting, in part,from an $11.0 million pre-tax charge for a court ruling relating to anemployee benefit matter of a previously discontinued business. Feesand expenses related to the spin-off recorded during 2002 also con-tributed to the loss. Also, discontinued operations during 2001include the operations of the Performance Materials segment fortwo months and the gain on sale of that segment of $93.5 million.
Cumulative Effect of an Accounting Change During the second quarterof 2002, we performed the first of the required impairment tests ofgoodwill and indefinite lived intangible assets. Based on thoseresults, we determined that it was likely that goodwill relating to theAviation Technical Services “reporting unit” (ATS) had beenimpaired. ATS is included in the Aerostructures and AviationTechnical Services business segment. During the third quarter of2002, we completed our measurement of the goodwill impairmentcharge and recognized an impairment charge of $36.1 million(representing total goodwill of this reporting unit) which wasnondeductible for income tax purposes, and which was reportedas a cumulative effect of an accounting change retroactively toJanuary 1, 2002.
Net Cash Provided by Operating Activities Cash flow provided byoperating activities increased by $156.6 million to $539.2 million in2002 from $382.6 million in 2001. The increase in cash flow fromoperations resulted from improved management of AccountsReceivable and Inventory, and lower estimated tax payments in 2002.Also included in 2002 cash flow provided by operating activities wasapproximately $29.4 million resulting from the sale of an interest rateswap agreement associated with $200 million of our long-term debt
and $30.8 million of cash received from the sale of hedges acquiredin the acquisition of Aeronautical Systems. Offsetting the favorablecash flow was a decrease in Accounts Payable.
Free Cash Flow Free cash flow, defined as cash flow provided byoperating activities adjusted for cash payments of special items lesscash used for capital expenditures, increased $264.6 million to$487.1 million in 2002 from $222.5 million in 2001. The increase wasprincipally a result of the increase in cash flow provided by operations.Cash used to pay special items increased in 2002 by $24.9 million par-tially reducing the cash provided by operating activities. Improving freecash flow, however, was a reduction in the level of capital expendituresin 2002 by $83.2 million from the 2001 levels. Capital expenditures in2001 included a large expenditure to implement an enterpriseresource planning project in our Aerostructures business that wassubstantially complete by the end of 2001.
OutlookThe current world economic and political environment is uncertainand subject to rapid and radical change. As a result, forecasting withany degree of accuracy in this environment is difficult. We havebased our outlook for 2003 on various assumptions that maychange over the course of the year. The outlook described belowassumes that there is no significant adverse impact on us and onour customers from potential military conflicts or acts of terrorism.Additionally, it does not assume additional airline bankruptcy filings.
Regarding the market segments in which we operate, the outlookalso assumes that the demand for large commercial transport orig-inal equipment declines in line with manufacturers’ forecasts fordelivery, from 684 deliveries in 2002 to about 550 in 2003.Aftermarket sales are expected to be relatively flat, as the airlinescontinue a slow recovery from the events of September 11, 2001 andin view of the current economic conditions. Regional and businesssales should show a slight increase in 2003 as deliveries of newregional jets continue to be relatively strong, and military salesshould increase roughly in line with global military budgets.
Overall sales are expected to increase to between $4.4 billion to $4.5billion in 2003. These expectations include the full year contributionof Aeronautical System, and the loss of between $100 million to$200 million in sales associated with businesses such as Avionics,that are expected to be divested in 2003 and treated as discontinuedoperations.
Segment operating income, as reported, is expected to improve in2003 due to the successful implementation of our restructuring actions,the expected positive contribution from Aeronautical Systems andthe absence of 2002 acquisition-related charges, including the step-up of inventory and in-process research and development, andhigher restructuring costs in 2002 than expected in 2003. However,segment operating income, as reported, will be reduced by higherpension expense of $49 million in 2003. Overall margins onsegment operating income, as reported, are expected to increase in2003 for the same reasons as noted for segment operating income,as reported.
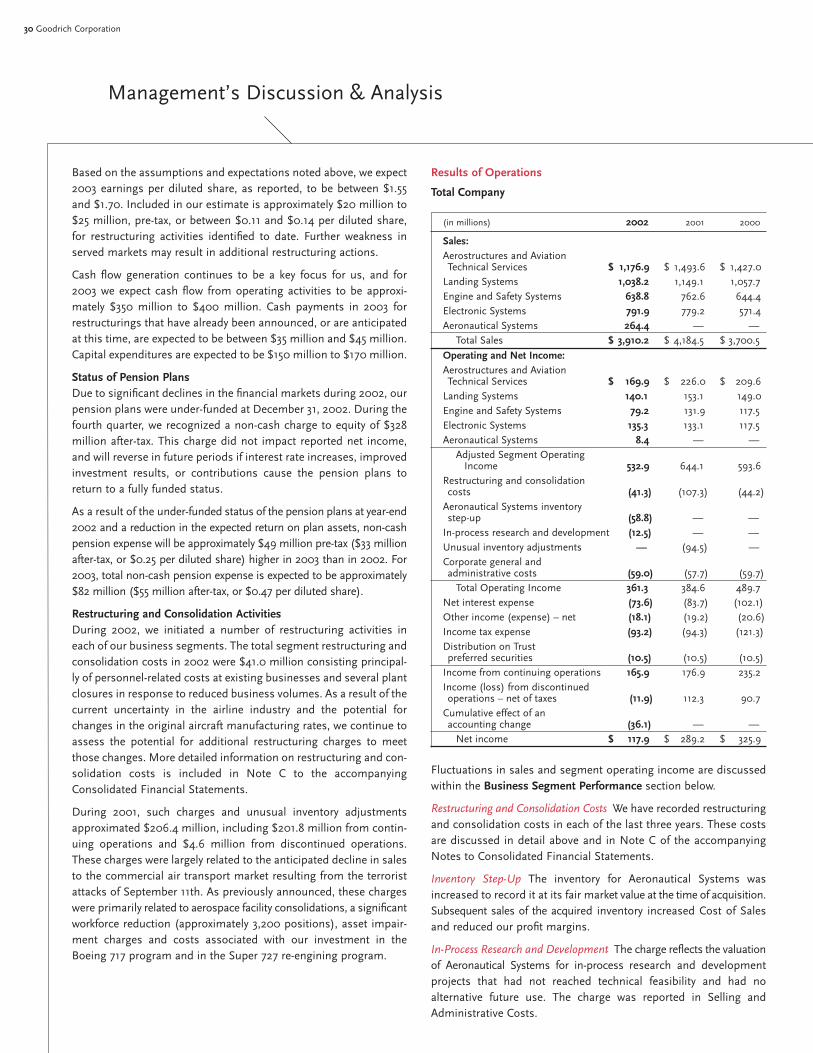
30 Goodrich Corporation
Management’s Discussion & Analysis
Based on the assumptions and expectations noted above, we expect2003 earnings per diluted share, as reported, to be between $1.55and $1.70. Included in our estimate is approximately $20 million to$25 million, pre-tax, or between $0.11 and $0.14 per diluted share,for restructuring activities identified to date. Further weakness inserved markets may result in additional restructuring actions.
Cash flow generation continues to be a key focus for us, and for2003 we expect cash flow from operating activities to be approxi-mately $350 million to $400 million. Cash payments in 2003 forrestructurings that have already been announced, or are anticipatedat this time, are expected to be between $35 million and $45 million.Capital expenditures are expected to be $150 million to $170 million.
Status of Pension PlansDue to significant declines in the financial markets during 2002, ourpension plans were under-funded at December 31, 2002. During thefourth quarter, we recognized a non-cash charge to equity of $328million after-tax. This charge did not impact reported net income,and will reverse in future periods if interest rate increases, improvedinvestment results, or contributions cause the pension plans toreturn to a fully funded status.
As a result of the under-funded status of the pension plans at year-end2002 and a reduction in the expected return on plan assets, non-cashpension expense will be approximately $49 million pre-tax ($33 millionafter-tax, or $0.25 per diluted share) higher in 2003 than in 2002. For2003, total non-cash pension expense is expected to be approximately$82 million ($55 million after-tax, or $0.47 per diluted share).
Restructuring and Consolidation ActivitiesDuring 2002, we initiated a number of restructuring activities ineach of our business segments. The total segment restructuring andconsolidation costs in 2002 were $41.0 million consisting principal-ly of personnel-related costs at existing businesses and several plantclosures in response to reduced business volumes. As a result of thecurrent uncertainty in the airline industry and the potential forchanges in the original aircraft manufacturing rates, we continue toassess the potential for additional restructuring charges to meetthose changes. More detailed information on restructuring and con-solidation costs is included in Note C to the accompanyingConsolidated Financial Statements.
During 2001, such charges and unusual inventory adjustmentsapproximated $206.4 million, including $201.8 million from contin-uing operations and $4.6 million from discontinued operations.These charges were largely related to the anticipated decline in salesto the commercial air transport market resulting from the terroristattacks of September 11th. As previously announced, these chargeswere primarily related to aerospace facility consolidations, a significantworkforce reduction (approximately 3,200 positions), asset impair-ment charges and costs associated with our investment in theBoeing 717 program and in the Super 727 re-engining program.
Results of Operations
Total Company
(in millions) 2002 2001 2000
Sales:Aerostructures and Aviation Technical Services $ 1,176.9 $ 1,493.6 $ 1,427.0
Landing Systems 1,038.2 1,149.1 1,057.7Engine and Safety Systems 638.8 762.6 644.4Electronic Systems 791.9 779.2 571.4Aeronautical Systems 264.4 — —
Total Sales $ 3,910.2 $ 4,184.5 $ 3,700.5
Operating and Net Income:Aerostructures and Aviation Technical Services $ 169.9 $ 226.0 $ 209.6
Landing Systems 140.1 153.1 149.0Engine and Safety Systems 79.2 131.9 117.5Electronic Systems 135.3 133.1 117.5Aeronautical Systems 8.4 — —
Adjusted Segment Operating Income 532.9 644.1 593.6
Restructuring and consolidation costs (41.3) (107.3) (44.2)
Aeronautical Systems inventory step-up (58.8) — —
In-process research and development (12.5) — —Unusual inventory adjustments — (94.5) —Corporate general and administrative costs (59.0) (57.7) (59.7)
Total Operating Income 361.3 384.6 489.7Net interest expense (73.6) (83.7) (102.1)Other income (expense) – net (18.1) (19.2) (20.6)Income tax expense (93.2) (94.3) (121.3)Distribution on Trust preferred securities (10.5) (10.5) (10.5)
Income from continuing operations 165.9 176.9 235.2Income (loss) from discontinued operations – net of taxes (11.9) 112.3 90.7
Cumulative effect of an accounting change (36.1) — —
Net income $ 117.9 $ 289.2 $ 325.9
Fluctuations in sales and segment operating income are discussedwithin the Business Segment Performance section below.
Restructuring and Consolidation Costs We have recorded restructuringand consolidation costs in each of the last three years. These costsare discussed in detail above and in Note C of the accompanyingNotes to Consolidated Financial Statements.
Inventory Step-Up The inventory for Aeronautical Systems wasincreased to record it at its fair market value at the time of acquisition.Subsequent sales of the acquired inventory increased Cost of Salesand reduced our profit margins.
In-Process Research and Development The charge reflects the valuationof Aeronautical Systems for in-process research and developmentprojects that had not reached technical feasibility and had noalternative future use. The charge was reported in Selling andAdministrative Costs.

2002 Annual Report 31
Unusual Inventory Adjustments These costs were classified withincost of sales and related primarily to inventory adjustments associ-ated with our investment in the Boeing 717 program and in ourSuper 27 re-engining program due to reduced expectations for theseprograms. The reduced expectations for the Boeing 717 programrelated directly to Boeing’s announced production schedule reduc-tions for this program during the fourth quarter of 2001, while theSuper 27 reduction in expectations was primarily due to deterioratingeconomic conditions and the September 11th terrorist attacks.
Corporate General and Administrative Costs Corporate general andadministrative costs, as a percent of sales, slightly increased in2002. Such costs, as a percent of sales, were 1.5 percent, 1.4 percentand 1.6 percent in 2002, 2001 and 2000, respectively. The reductionin costs in 2001 was primarily due to lower incentive compensationcosts due to the Company’s depressed stock price at the end of theyear, partially offset by rebranding costs incurred during 2001 asso-ciated with the Goodrich name change.
Net Interest Expense Net interest expense decreased $10.1 millionfrom $83.7 million in 2001 to $73.6 million in 2002. The decreasewas due to an increase in interest income from the PIK notes resultingfrom 12 months of interest income in 2002 compared to 10 monthsof interest income in 2001. In addition, interest income includes$5.4 million in 2002 relating to the settlement of a contract disputeon the F-14 claim. The impact of increased borrowings to finance theacquisition of Aeronautical Systems businesses in October 2002was offset by declines in the average interest rates on short-termfinancings. We also had higher short-term debt prior to thePerformance Materials sale during the first quarter of 2001 wheninterest rates were at significantly higher levels than later in 2001and 2002.
The significant decrease between 2001 and 2000 was due to the saleof Performance Materials during the first quarter of 2001. We wereable to reduce our short-term indebtedness with the proceeds fromthe sale and record interest income going forward on the PIK notesissued by the buyer. We recorded $23.3 million and $17.6 million ofPIK interest income during 2002 and 2001, respectively. See addi-tional discussion of the PIK notes in Note F to the accompanyingConsolidated Financial Statements.
Other Income (Expense) – Net The table below allows other income(expense) – net to be evaluated on a comparable basis.
(in millions) 2002 2001 2000
As reported $ (18.1) $ (19.2) $ (20.6)Gains/(losses) on sale of businesses 2.5 7.2 2.0
Adjusted Other income (expense) – net $ (20.6) $ (26.4) $ (22.6)
Included within other income (expense) – net are gains and lossesfrom the sale of businesses. Excluding these items, other income(expense) – net was expense of $20.6 million, $26.4 million and$22.6 million in 2002, 2001 and 2000, respectively.
The decrease in expenses in 2002 resulted from the sale of an intan-gible asset ($12.0 million) offset in part by settlement of litigationand legal fees ($3.5 million), increased minority interest expense($1.4 million) and lower income from a captive insurance company($1.4 million).
The increase in costs in 2001 was primarily due to increased retireehealthcare benefit costs associated with previously disposed of busi-nesses – mostly related to the Performance Materials dispositionduring the first quarter of 2001 (approximately $7 million), andincreased earnings attributable to minority interests (approximately$5 million), partially offset by higher income from subsidiariesaccounted for under the equity method (approximately $2 million)and lower costs associated with executive life insurance programs(approximately $3 million).
Income Tax Expense Our effective tax rate from continuing opera-tions was 34.6 percent, 33.5 percent and 33.1 percent in 2002, 2001and 2000, respectively. The increase in the effective tax rate from2001 to 2002 was due to a lower tax benefits from export saleswhich was due to the lower sales volume in 2002, higher incremen-tal U.S. tax on the deemed repatriation of foreign earnings and thewrite-off of in-process research and development with no tax benefit.The increase in the 2001 effective tax rate from 2000 was primarilyattributable to earnings of foreign operations that were subject totaxation at higher rates than U.S. earnings.
Income from Continuing Operations Income from continuing opera-tions included various charges or gains, referred to as special items,which affected reported earnings. Excluding the effects of specialitems, income from continuing operations in 2002 was $244.0million, or $2.31 per diluted share, compared with $306.3 million, or$2.87 per diluted share, in 2001 and $265.5 million, or $2.43 per dilutedshare, in 2000. The following table presents the impact of specialitems on earnings per diluted share. Additional information regardingrestructuring and consolidation costs can be found above and inNote C to the accompanying Consolidated Financial Statements.
(in millions)Earnings Per Diluted Share 2002 2001 2000
Income from continuing operations $ 1.57 $ 1.65 $ 2.16Restructuring and consolidation costs 0.26 0.67 0.26
Unusual inventory adjustments — 0.59 —Aeronautical Systems inventory step-up 0.38 — —
In-process research and development 0.12 — —
Net (gain) loss on divested businesses (0.02) (0.04) 0.01
Income from continuing operations,excluding special items $ 2.31 $ 2.87 $ 2.43
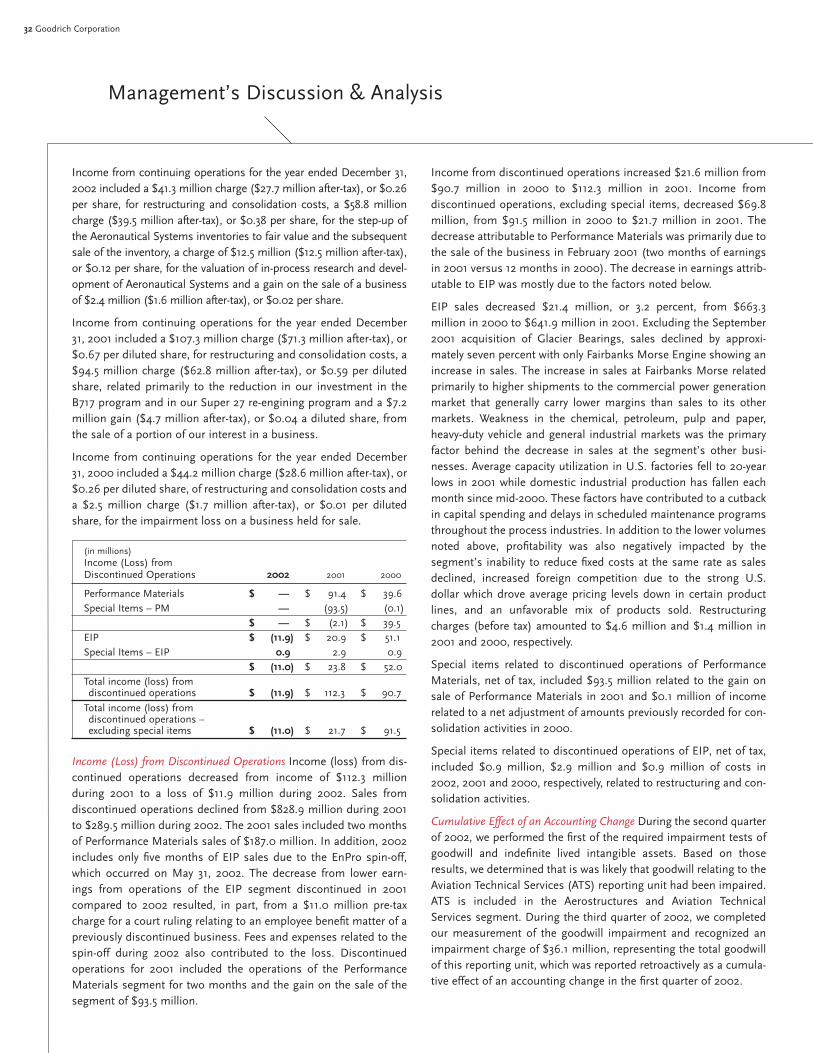
32 Goodrich Corporation
Management’s Discussion & Analysis
Income from continuing operations for the year ended December 31,2002 included a $41.3 million charge ($27.7 million after-tax), or $0.26per share, for restructuring and consolidation costs, a $58.8 millioncharge ($39.5 million after-tax), or $0.38 per share, for the step-up ofthe Aeronautical Systems inventories to fair value and the subsequentsale of the inventory, a charge of $12.5 million ($12.5 million after-tax),or $0.12 per share, for the valuation of in-process research and devel-opment of Aeronautical Systems and a gain on the sale of a businessof $2.4 million ($1.6 million after-tax), or $0.02 per share.
Income from continuing operations for the year ended December31, 2001 included a $107.3 million charge ($71.3 million after-tax), or$0.67 per diluted share, for restructuring and consolidation costs, a$94.5 million charge ($62.8 million after-tax), or $0.59 per dilutedshare, related primarily to the reduction in our investment in theB717 program and in our Super 27 re-engining program and a $7.2million gain ($4.7 million after-tax), or $0.04 a diluted share, fromthe sale of a portion of our interest in a business.
Income from continuing operations for the year ended December31, 2000 included a $44.2 million charge ($28.6 million after-tax), or$0.26 per diluted share, of restructuring and consolidation costs anda $2.5 million charge ($1.7 million after-tax), or $0.01 per dilutedshare, for the impairment loss on a business held for sale.
(in millions)Income (Loss) from Discontinued Operations 2002 2001 2000
Performance Materials $ — $ 91.4 $ 39.6Special Items – PM — (93.5) (0.1)
$ — $ (2.1) $ 39.5EIP $ (11.9) $ 20.9 $ 51.1Special Items – EIP 0.9 2.9 0.9
$ (11.0) $ 23.8 $ 52.0Total income (loss) from discontinued operations $ (11.9) $ 112.3 $ 90.7
Total income (loss) from discontinued operations – excluding special items $ (11.0) $ 21.7 $ 91.5
Income (Loss) from Discontinued Operations Income (loss) from dis-continued operations decreased from income of $112.3 millionduring 2001 to a loss of $11.9 million during 2002. Sales fromdiscontinued operations declined from $828.9 million during 2001to $289.5 million during 2002. The 2001 sales included two monthsof Performance Materials sales of $187.0 million. In addition, 2002includes only five months of EIP sales due to the EnPro spin-off,which occurred on May 31, 2002. The decrease from lower earn-ings from operations of the EIP segment discontinued in 2001compared to 2002 resulted, in part, from a $11.0 million pre-taxcharge for a court ruling relating to an employee benefit matter of apreviously discontinued business. Fees and expenses related to thespin-off during 2002 also contributed to the loss. Discontinuedoperations for 2001 included the operations of the PerformanceMaterials segment for two months and the gain on the sale of thesegment of $93.5 million.
Income from discontinued operations increased $21.6 million from$90.7 million in 2000 to $112.3 million in 2001. Income fromdiscontinued operations, excluding special items, decreased $69.8million, from $91.5 million in 2000 to $21.7 million in 2001. Thedecrease attributable to Performance Materials was primarily due tothe sale of the business in February 2001 (two months of earningsin 2001 versus 12 months in 2000). The decrease in earnings attrib-utable to EIP was mostly due to the factors noted below.
EIP sales decreased $21.4 million, or 3.2 percent, from $663.3million in 2000 to $641.9 million in 2001. Excluding the September2001 acquisition of Glacier Bearings, sales declined by approxi-mately seven percent with only Fairbanks Morse Engine showing anincrease in sales. The increase in sales at Fairbanks Morse relatedprimarily to higher shipments to the commercial power generationmarket that generally carry lower margins than sales to its othermarkets. Weakness in the chemical, petroleum, pulp and paper,heavy-duty vehicle and general industrial markets was the primaryfactor behind the decrease in sales at the segment’s other busi-nesses. Average capacity utilization in U.S. factories fell to 20-yearlows in 2001 while domestic industrial production has fallen eachmonth since mid-2000. These factors have contributed to a cutbackin capital spending and delays in scheduled maintenance programsthroughout the process industries. In addition to the lower volumesnoted above, profitability was also negatively impacted by thesegment’s inability to reduce fixed costs at the same rate as salesdeclined, increased foreign competition due to the strong U.S.dollar which drove average pricing levels down in certain productlines, and an unfavorable mix of products sold. Restructuringcharges (before tax) amounted to $4.6 million and $1.4 million in2001 and 2000, respectively.
Special items related to discontinued operations of PerformanceMaterials, net of tax, included $93.5 million related to the gain onsale of Performance Materials in 2001 and $0.1 million of incomerelated to a net adjustment of amounts previously recorded for con-solidation activities in 2000.
Special items related to discontinued operations of EIP, net of tax,included $0.9 million, $2.9 million and $0.9 million of costs in2002, 2001 and 2000, respectively, related to restructuring and con-solidation activities.
Cumulative Effect of an Accounting Change During the second quarterof 2002, we performed the first of the required impairment tests ofgoodwill and indefinite lived intangible assets. Based on thoseresults, we determined that is was likely that goodwill relating to theAviation Technical Services (ATS) reporting unit had been impaired.ATS is included in the Aerostructures and Aviation TechnicalServices segment. During the third quarter of 2002, we completedour measurement of the goodwill impairment and recognized animpairment charge of $36.1 million, representing the total goodwillof this reporting unit, which was reported retroactively as a cumula-tive effect of an accounting change in the first quarter of 2002.
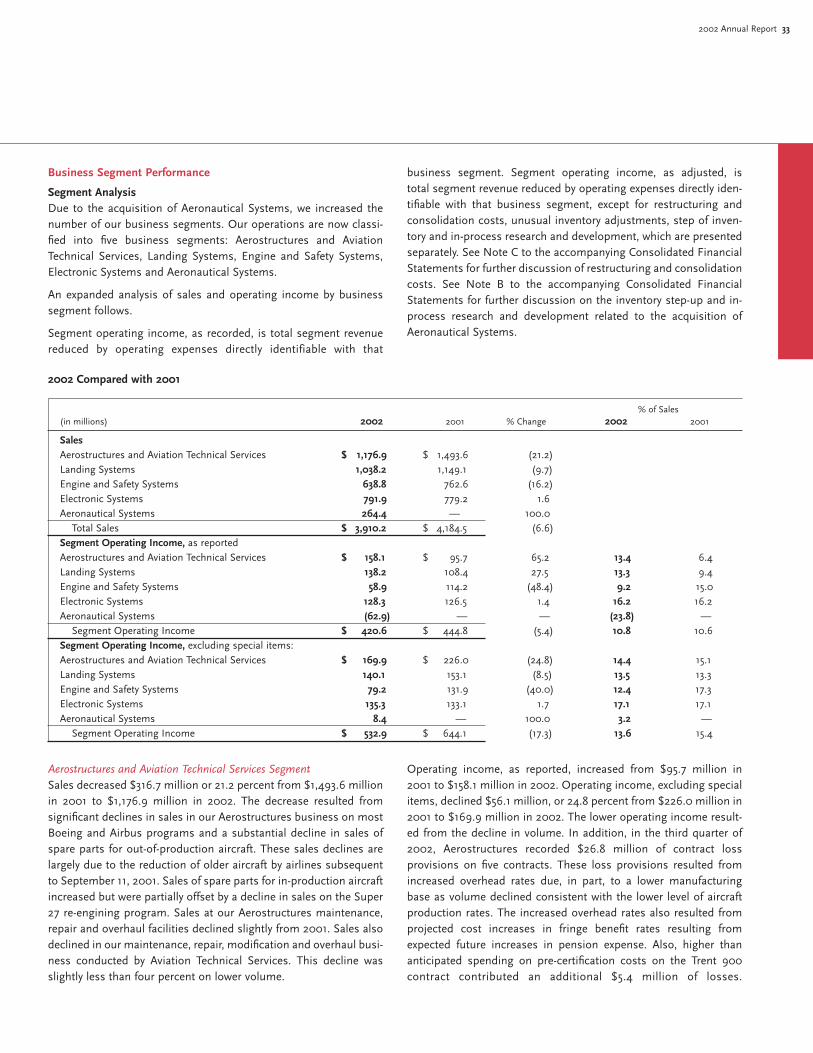
2002 Annual Report 33
Business Segment Performance
Segment AnalysisDue to the acquisition of Aeronautical Systems, we increased thenumber of our business segments. Our operations are now classi-fied into five business segments: Aerostructures and AviationTechnical Services, Landing Systems, Engine and Safety Systems,Electronic Systems and Aeronautical Systems.
An expanded analysis of sales and operating income by businesssegment follows.
Segment operating income, as recorded, is total segment revenuereduced by operating expenses directly identifiable with that
business segment. Segment operating income, as adjusted, istotal segment revenue reduced by operating expenses directly iden-tifiable with that business segment, except for restructuring andconsolidation costs, unusual inventory adjustments, step of inven-tory and in-process research and development, which are presentedseparately. See Note C to the accompanying Consolidated FinancialStatements for further discussion of restructuring and consolidationcosts. See Note B to the accompanying Consolidated FinancialStatements for further discussion on the inventory step-up and in-process research and development related to the acquisition ofAeronautical Systems.
2002 Compared with 2001
% of Sales(in millions) 2002 2001 % Change 2002 2001
SalesAerostructures and Aviation Technical Services $ 1,176.9 $ 1,493.6 (21.2)Landing Systems 1,038.2 1,149.1 (9.7)Engine and Safety Systems 638.8 762.6 (16.2)Electronic Systems 791.9 779.2 1.6Aeronautical Systems 264.4 — 100.0
Total Sales $ 3,910.2 $ 4,184.5 (6.6)Segment Operating Income, as reportedAerostructures and Aviation Technical Services $ 158.1 $ 95.7 65.2 13.4 6.4Landing Systems 138.2 108.4 27.5 13.3 9.4Engine and Safety Systems 58.9 114.2 (48.4) 9.2 15.0Electronic Systems 128.3 126.5 1.4 16.2 16.2Aeronautical Systems (62.9) — — (23.8) —
Segment Operating Income $ 420.6 $ 444.8 (5.4) 10.8 10.6Segment Operating Income, excluding special items:Aerostructures and Aviation Technical Services $ 169.9 $ 226.0 (24.8) 14.4 15.1Landing Systems 140.1 153.1 (8.5) 13.5 13.3Engine and Safety Systems 79.2 131.9 (40.0) 12.4 17.3Electronic Systems 135.3 133.1 1.7 17.1 17.1Aeronautical Systems 8.4 — 100.0 3.2 —
Segment Operating Income $ 532.9 $ 644.1 (17.3) 13.6 15.4
Aerostructures and Aviation Technical Services SegmentSales decreased $316.7 million or 21.2 percent from $1,493.6 millionin 2001 to $1,176.9 million in 2002. The decrease resulted fromsignificant declines in sales in our Aerostructures business on mostBoeing and Airbus programs and a substantial decline in sales ofspare parts for out-of-production aircraft. These sales declines arelargely due to the reduction of older aircraft by airlines subsequentto September 11, 2001. Sales of spare parts for in-production aircraftincreased but were partially offset by a decline in sales on the Super27 re-engining program. Sales at our Aerostructures maintenance,repair and overhaul facilities declined slightly from 2001. Sales alsodeclined in our maintenance, repair, modification and overhaul busi-ness conducted by Aviation Technical Services. This decline wasslightly less than four percent on lower volume.
Operating income, as reported, increased from $95.7 million in2001 to $158.1 million in 2002. Operating income, excluding specialitems, declined $56.1 million, or 24.8 percent from $226.0 million in2001 to $169.9 million in 2002. The lower operating income result-ed from the decline in volume. In addition, in the third quarter of2002, Aerostructures recorded $26.8 million of contract lossprovisions on five contracts. These loss provisions resulted fromincreased overhead rates due, in part, to a lower manufacturingbase as volume declined consistent with the lower level of aircraftproduction rates. The increased overhead rates also resulted fromprojected cost increases in fringe benefit rates resulting fromexpected future increases in pension expense. Also, higher thananticipated spending on pre-certification costs on the Trent 900contract contributed an additional $5.4 million of losses.
34 Goodrich Corporation
Management’s Discussion & Analysis
Aerostructures also recorded approximately $8 million of favorablereserve adjustments in 2002. Our Aviation Technical Services busi-ness improved slightly.
Special items included $11.8 million in restructuring and consolida-tion costs in 2002, consisting of $9.1 million in personnel-relatedcosts and $2.7 million in consolidation costs. These costs wereincurred as part of a program to restructure facilities and adjust per-sonnel levels in response to the decline in manufacturing volume.
In 2001, the segment reported as special items, an unusual inven-tory adjustment for $94.5 million for our investment in the Boeing717 program and our Super 27 re-engining program due to reducedexpectations for these programs. The reduced expectation for theBoeing 717 program relates to Boeing’s announced productionschedule reduction for this program during the fourth quarter of2001 while the Super 27 reduction in expectations was primarily dueto deteriorating economic conditions and the September 11thterrorist attacks. In addition, the segment recorded $35.8 million inrestructuring and consolidation costs, consisting of $17.3 million inpersonnel-related costs, $18.1 million in asset impairments and$0.4 million in facility consolidation and closure costs. These costswere incurred in response to the decline in volume, particularlyresulting from reduced original equipment build rate declines, andlower anticipated spare parts sales resulting from the general industryeconomic decline after September 11, 2001.
Landing Systems SegmentLanding Systems sales declined in 2002 by $110.9 million or 9.7 per-cent to $1,038.2 million from the 2001 sales level of $1,149.1 million.Volume declines were experienced across most original equipmentlanding gear and wheels and brakes platforms manufactured byBoeing and Airbus. Significant volume declines occurred on theBoeing 737 next generation aircraft, B777, B757 and B747 platformsfor the landing gear business and on the Boeing 727, B737 andAirbus A330 and A340 platforms in our commercial wheels andbrakes business. The reduced sales resulted from decreaseddemand for new aircraft original equipment and decreased airlineutilization, lowering demand for landing gear original equipmentand aftermarket wheel and brake replacements. These declines werepartially offset by increases in sales to military programs such as theC-17, F-14 and F-16 programs. Volume slowdowns also occurred inour landing gear services business resulting from lower customerdemand. Wheels and brakes service business showed a smallincrease in volume from 2001.
Operating income, as reported, increased to $138.2 million in 2002from $108.4 million in 2001. Operating income, excluding specialitems, declined in 2002 by $13.0 million or 8.5 percent to $140.1 mil-lion from the 2001 operating income level of $153.1 million. Volumedeclines in the landing gear and wheels and brakes original equip-ment businesses accounted for most of the decline. Operatingincome, excluding special items, in the landing gear services busi-ness improved significantly over 2001 as a result of actions taken in2001 to rationalize personnel and rotable gear levels. Operating
income, excluding special items, was further impacted by a write-offof inventory, capitalized sales incentives and supplier terminationcosts of $16.6 million in 2002, relating to the Fairchild Dornier728 and 928 programs. Improving operating income in 2002 wasa June settlement with an insurance company for prior claims of$8.9 million.
Special items included $1.9 million of restructuring and consolidationcosts in 2002. These costs consisted of $1.6 million in personnel-related costs and $0.3 million in consolidation costs. These costswere incurred to further reduce work force and rationalize facilitiesto meet the volume declines discussed above.
During 2001, the segment recorded $44.7 million of restructuringand consolidation costs, consisting of $4.0 million in personnel-related costs, $26.4 million in asset impairments and $14.3 millionin facility consolidation and closure costs. These costs wereincurred to close a landing gear services facility resulting fromreduced customer demand and to recognize the impairment in cer-tain landing gear services rotable assets resulting from significantlyreduced demand for those assets.
Engine and Safety Systems SegmentEngine and Safety systems sales for 2002 decreased $123.8 million,or 16.2 percent to $638.8 million, from $762.6 million in 2001. Saleswere significantly lower than in 2002 throughout the product linesin power generation as well as aerospace original equipment andaftermarket. Pump and engine controls, primarily supporting themilitary sector, showed stronger sales than in 2001. Sales declineswere primarily related to volume declines resulting from weaker cus-tomer demand in the engine structural and rotating components,aircraft evacuation products and aircraft ice detection systems.
Operating income, as reported, declined from $114.2 million in 2001to $58.9 million in 2002. Operating income, excluding special items,declined $52.7 million, or 40.0 percent in 2002 to $79.2 million,from $131.9 million in 2001. Operating income, excluding specialitems, declined due to lower volume, investments in new programawards and weaker product mix with lower aftermarket sales.Research and development spending for 2002 was also higher thanin 2001. Operating efficiencies as a result of cost reduction initia-tives associated with the restructuring programs partially improved2002 results. Further improvements are expected upon realizing fullyear benefits.
Special items in 2002 included $20.3 million in restructuring andconsolidation costs, consisting of $15.7 million in personnel-relatedcosts and $4.6 million in consolidation costs. These costs wereincurred to reduce personnel and close a facility in response to thedecline in manufacturing volume.
Special items in 2001 included $17.7 million in restructuring andconsolidation costs consisting of $6.8 million in personnel-relatedcosts, $7.7 million in asset impairments and $3.2 million in facilityconsolidation and closure costs.
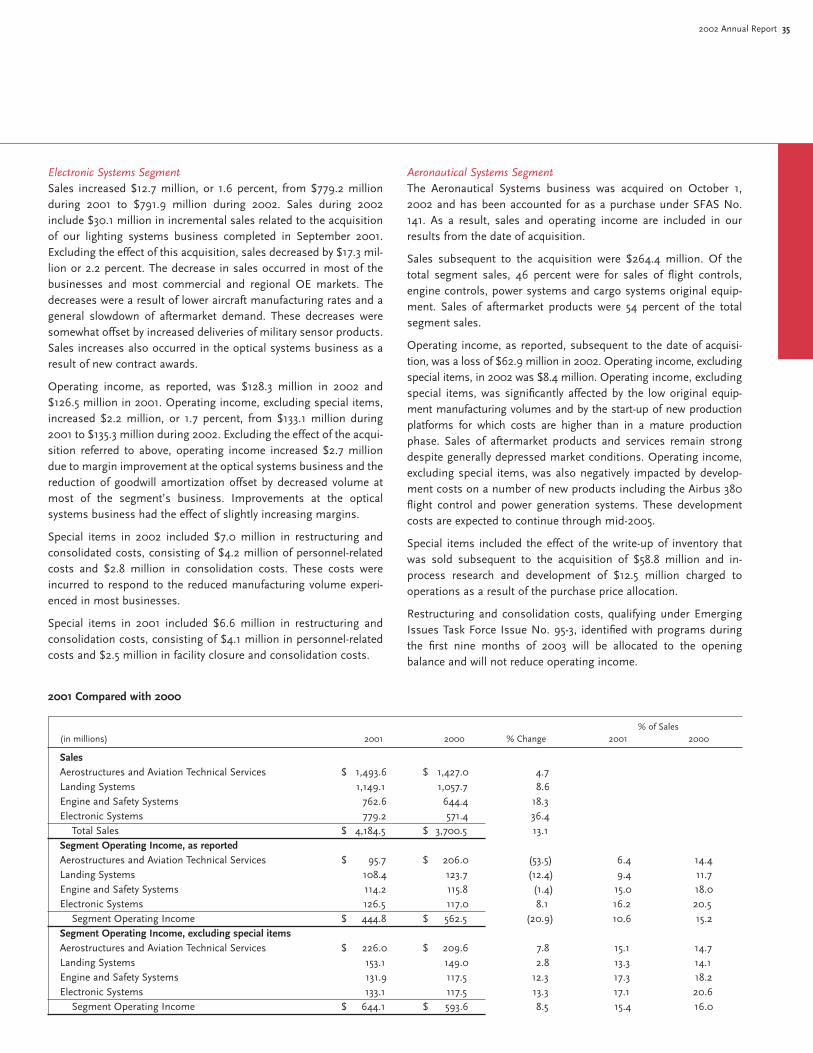
2002 Annual Report 35
Electronic Systems SegmentSales increased $12.7 million, or 1.6 percent, from $779.2 millionduring 2001 to $791.9 million during 2002. Sales during 2002include $30.1 million in incremental sales related to the acquisitionof our lighting systems business completed in September 2001.Excluding the effect of this acquisition, sales decreased by $17.3 mil-lion or 2.2 percent. The decrease in sales occurred in most of thebusinesses and most commercial and regional OE markets. Thedecreases were a result of lower aircraft manufacturing rates and ageneral slowdown of aftermarket demand. These decreases weresomewhat offset by increased deliveries of military sensor products.Sales increases also occurred in the optical systems business as aresult of new contract awards.
Operating income, as reported, was $128.3 million in 2002 and$126.5 million in 2001. Operating income, excluding special items,increased $2.2 million, or 1.7 percent, from $133.1 million during2001 to $135.3 million during 2002. Excluding the effect of the acqui-sition referred to above, operating income increased $2.7 milliondue to margin improvement at the optical systems business and thereduction of goodwill amortization offset by decreased volume atmost of the segment’s business. Improvements at the opticalsystems business had the effect of slightly increasing margins.
Special items in 2002 included $7.0 million in restructuring andconsolidated costs, consisting of $4.2 million of personnel-relatedcosts and $2.8 million in consolidation costs. These costs wereincurred to respond to the reduced manufacturing volume experi-enced in most businesses.
Special items in 2001 included $6.6 million in restructuring andconsolidation costs, consisting of $4.1 million in personnel-relatedcosts and $2.5 million in facility closure and consolidation costs.
Aeronautical Systems SegmentThe Aeronautical Systems business was acquired on October 1,2002 and has been accounted for as a purchase under SFAS No.141. As a result, sales and operating income are included in ourresults from the date of acquisition.
Sales subsequent to the acquisition were $264.4 million. Of thetotal segment sales, 46 percent were for sales of flight controls,engine controls, power systems and cargo systems original equip-ment. Sales of aftermarket products were 54 percent of the totalsegment sales.
Operating income, as reported, subsequent to the date of acquisi-tion, was a loss of $62.9 million in 2002. Operating income, excludingspecial items, in 2002 was $8.4 million. Operating income, excludingspecial items, was significantly affected by the low original equip-ment manufacturing volumes and by the start-up of new productionplatforms for which costs are higher than in a mature productionphase. Sales of aftermarket products and services remain strongdespite generally depressed market conditions. Operating income,excluding special items, was also negatively impacted by develop-ment costs on a number of new products including the Airbus 380flight control and power generation systems. These developmentcosts are expected to continue through mid-2005.
Special items included the effect of the write-up of inventory thatwas sold subsequent to the acquisition of $58.8 million and in-process research and development of $12.5 million charged tooperations as a result of the purchase price allocation.
Restructuring and consolidation costs, qualifying under EmergingIssues Task Force Issue No. 95-3, identified with programs duringthe first nine months of 2003 will be allocated to the openingbalance and will not reduce operating income.
2001 Compared with 2000
% of Sales(in millions) 2001 2000 % Change 2001 2000
SalesAerostructures and Aviation Technical Services $ 1,493.6 $ 1,427.0 4.7Landing Systems 1,149.1 1,057.7 8.6Engine and Safety Systems 762.6 644.4 18.3Electronic Systems 779.2 571.4 36.4
Total Sales $ 4,184.5 $ 3,700.5 13.1Segment Operating Income, as reportedAerostructures and Aviation Technical Services $ 95.7 $ 206.0 (53.5) 6.4 14.4Landing Systems 108.4 123.7 (12.4) 9.4 11.7Engine and Safety Systems 114.2 115.8 (1.4) 15.0 18.0Electronic Systems 126.5 117.0 8.1 16.2 20.5
Segment Operating Income $ 444.8 $ 562.5 (20.9) 10.6 15.2Segment Operating Income, excluding special itemsAerostructures and Aviation Technical Services $ 226.0 $ 209.6 7.8 15.1 14.7Landing Systems 153.1 149.0 2.8 13.3 14.1Engine and Safety Systems 131.9 117.5 12.3 17.3 18.2Electronic Systems 133.1 117.5 13.3 17.1 20.6
Segment Operating Income $ 644.1 $ 593.6 8.5 15.4 16.0

36 Goodrich Corporation
Management’s Discussion & Analysis
Aerostructures and Aviation Technical Services SegmentSales increased $66.6 million, or 4.7 percent, from $1,427.0 millionduring 2000 to $1,493.6 million in 2001. The increase was due to asignificant increase in Aerostructures related sales (approximately$92 million), offset by lower sales at the segment’s aviation techni-cal services businesses (approximately $41 million). The segment’saviation technical services business performs comprehensive totalaircraft maintenance, repair, modification and overhaul work. Mostof the decrease in sales in this business unit was attributable tolower aircraft maintenance work.
The increase in Aerostructures related sales (nacelles, pylons, thrustreversers and related engine housing components and services)was primarily due to rate increases on the CFM 56 (A319, A320 andA321 programs), PW4000, B717-200 and V2500 programs, higheraftermarket spares sales, increased aftermarket services and sparessales and several new programs (C-5 Pylon, F-15). Partially offsettingthese increases was a decrease in aftermarket sales on the Super 27program as well as rate decreases on the CFM56-5 (A340) andRR535-E4 programs.
Operating income, as reported, decreased to $95.7 million in 2001from $206.0 million in 2000. Operating income, excluding specialitems, increased $16.4 million, or 7.8 percent, from $209.6 million in2000 to $226.0 million in 2001. The increase was driven by theincrease in sales noted above, productivity improvements on severalAerostructures programs and reduced non-recurring engineeringcosts associated with the terminated X-33 program. Partially offsettingthese increases were additional costs associated with the implemen-tation of an enterprise resource planning system at the segment’sAerostructures businesses, increased losses of approximately $1million associated with the segment’s aviation technical services busi-ness and the closeout of the MD-11 and MD-90 contracts in 2000.
Landing Systems Segment
Sales increased $91.4 million, or 8.6 percent, from $1,057.7 millionduring 2000 to $1,149.1 million during 2001. The increase in saleswas primarily attributable to higher sales of landing gear and wheelsand brakes. Landing gear sales increased across all major marketsprimarily due to increased sales of original equipment to Boeing,Bombardier and the U.S. government, partially offset by reducedpricing on several Boeing programs as a result of contract extensions(through 2006) approved during mid-2001. Major programs con-tributing to the increased sales of landing gear included the B757,B777, C-17, F18 and RJ601 programs. The increased sales of wheelsand brakes related primarily to increased aftermarket sales in thecommercial, regional, business and military markets primarily on theA319/320, B747-400, B777, Embraer 145, DeHavilland Dash 8, F16and Cessna programs, partially offset by decreased sales on the B727out-of-production program. This increase in sales was partially offsetby a significant decrease in sales of landing gear overhaul services($20.5 million), primarily due to fewer customer removals as aresult of airlines deferring or reducing discretionary expenditures.
Operating income, as reported, decreased from $123.7 million in2000 to $108.4 million in 2001. Operating income, excluding specialitems, increased $4.1 million, or 2.8 percent, from $149.0 millionduring 2000 to $153.1 million during 2001. The increase was primarilydue to the increase in volume noted above as well as a favorable salesmix, partially offset by increased sales incentives, reduced pricing asnoted above, additional costs related to expedited shipments of certainlanding gear to Boeing and an increased loss associated with providinglanding gear overhaul services primarily due to the decrease in volumenoted above (this business recorded a slight loss in 2000).
Engine and Safety Systems SegmentSales increased $118.2 million, or 18.3 percent, from $644.4 mil-lion during 2000 to $762.6 million during 2001. While all of thesegment’s product lines experienced an increase in sales overthe prior year, the increase was primarily attributable to a significantincrease in aftermarket sales of evacuation products, particularly onthe B747 program, increased sales of ejection seats, increaseddemand for the segment’s gas turbine products that serve boththe aerospace and industrial engine markets and acquisitions(approximately $30 million).
Operating income, as reported, was $114.2 million in 2001 and$115.8 million in 2000. Operating income, excluding special items,increased $14.4 million, or 12.3 percent, from $117.5 million during2000 to $131.9 million during 2001. The increase was primarilyattributable to the increase in sales noted above, partially offset byincreased research and development expenses and inefficiencies atone of the segment’s location that produces gas turbine products.
Electronic Systems SegmentSales increased $207.8 million, or 36.4 percent, from $571.4 millionduring 2000 to $779.2 million during 2001. The increase was drivenprimarily by space-based acquisitions (approximately $160 million)and increased sales by the segment’s core businesses (approxi-mately $55 million). The increase in sales at the segment’s corebusinesses was primarily attributable to increased sales of sensors,fuel and utility systems as well as lightning detection and collisionavoidance units, partially offset by lower sales in the segment’s legacyspace-based businesses. The increase in sensor sales was driven byincreased regional and business OE demand, airline retrofits andthe resumption of thermocouple shipments to the USAF. The fueland utility sales increases were due mostly to aftermarket sales ofspares and retrofit products, particularly on the B747 and B737 pro-grams. The decrease in sales in the segment’s legacy space-basedbusinesses was due primarily to program delays and cancellations.
Operating income, as reported, increased to $126.5 million in 2001from $117.0 million in 2000. Operating income, excluding specialitems, increased $15.6 million, or 13.3 percent, from $117.5 millionduring 2000 to $133.1 million during 2001. The increase was prima-rily due to the factors noted above, partially offset by increasedinvestments in technologies and products, increased research anddevelopment expenses and higher costs related to the consolidationand integration of acquisitions.
2002 Annual Report 37
The significant reduction in operating margins of 20.6 percent in2000 to 17.1 percent in 2001 was primarily attributable to programdelays and cancellations impacting the segment’s space-based busi-nesses and lower margins on sales from acquired companies.
Liquidity and Capital Resources
We currently expect to fund expenditures for capital requirements aswell as liquidity needs from a combination of internally generatedfunds and financing arrangements. We believe that our internallygenerated liquidity, together with access to external capitalresources, will be sufficient to satisfy existing commitments andplans, and also to provide adequate financial flexibility.
Credit FacilitiesIn July 2002, we entered into a $1.5 billion committed syndicated364-day revolving credit agreement that expires in July 2003. Thiscredit facility was used to finance the acquisition of AeronauticalSystems from TRW Inc. The agreement was provided by a bankgroup that also participates in our global syndicated revolvers. AtDecember 31, 2002, this credit facility commitment had beenreduced to $200 million. This commitment reduction was primarilydue to the issuance of equity and long-term debt, cash from assetmonetizations and operating cash flow during the fourth quarter of2002. See Notes I and R of the accompanying Consolidated FinancialStatements. We intend to repay and terminate this agreement prior toits expiration date. The repayment is expected to be funded from theproceeds from asset monetizations and cash flow from operations.
In December 2001, we entered into $750 million in committed globalsyndicated revolving credit agreements. These credit agreementsreplaced the $600 million of committed domestic revolving creditagreements and the $80 million committed multi-currency revolvingcredit facility. The international bank group providing credit under thenew agreements is substantially the same group that providedcredit under the previous agreements. The syndicated credit facilitiesconsist of a $425 million three-year agreement expiring in December2004 and a $325 million 364-day agreement expiring in September2003. We intend to renew the $325 million credit facility at its annu-al renewal date. At December 31, 2002, $155 million was borrowedunder these committed revolving credit facilities.
We also maintain $100 million of uncommitted domestic moneymarket facilities and $6.8 million of uncommitted foreign workingcapital facilities with various banks to meet short-term borrowingrequirements. As of December 31, 2002, $23.5 million was borrowedunder these facilities. These uncommitted credit facilities are pro-vided by a small number of commercial banks that also provide uswith committed credit through the syndicated revolving credit facil-ities and with various cash management, trust and other services.As a result of these established relationships, we believe that ouruncommitted facilities are a highly reliable and cost-effective sourceof liquidity.
Continued borrowing under our credit facilities is conditioned uponcompliance with financial and other covenants set forth in the relatedagreements. We are currently in compliance with all such covenants.Our credit facilities do not contain any rating downgrade triggers thatwould accelerate the maturity of our indebtedness thereunder.However, a ratings downgrade would result in an increase in theinterest rate and fees payable under our syndicated revolving creditfacilities. Such a downgrade also could adversely affect our ability torenew existing, or obtain access to new, credit facilities in the futureand could increase the cost of such new facilities.
Long-Term FinancingAt December 31, 2002, we had long-term debt of $2,127.3 million,with maturities ranging from 2004 to 2046. See Note I of theaccompanying Financial Statements for further information on theborrowings. Current maturities of long-term debt at December 31,2002 were $2.1 million.
In December 2002, we issued $300.0 million of 6.45 percent seniornotes due in 2007 and $500.0 million of 7.625 percent senior notesdue in 2012. The net proceeds from the issuance of the senior noteswere used to repay a portion of the amounts outstanding under the$1.5 billion, 364-day credit facility.
In May 2002, we issued $296.9 million aggregate principal amountof 7.5 percent senior notes due in 2008 in exchange for a like prin-cipal amount of Coltec’s 7.5 percent senior notes due 2008. All ofthe $296.9 million of the Coltec senior notes acquired by us in theexchange offer were sold to Coltec and thereafter cancelled. Theremaining $3.1 million of outstanding Coltec senior notes remainoutstanding as the obligation of Coltec, which is now a whollyowned subsidiary of EnPro.
In November 2002, we completed an offering of 14,950,000 sharesof our common stock. The net proceeds from the offering of approx-imately $216.2 million were used to repay a portion of the amountsoutstanding under the $1.5 billion, 364-day credit facility.
At December 31, 2002, we had the authority to issue up to $1.4billion of debt securities, series preferred stock, common stock,stock purchase contracts and stock purchase units under our exist-ing shelf registration. The net proceeds from any securities issuedpursuant to the shelf registration statement would be used for gen-eral corporate purposes unless such proceeds are required to repayborrowings under the $1.5 billion, 364-day credit facility.
QUIPS At December 31, 2002 and 2001, $126.5 million was out-standing of 8.30% Cumulative Quarterly Income PreferredSecurities, Series A (QUIPS) issued by BFGoodrich Capital, a Delawarebusiness trust (Trust), all of the common equity of which is owned byus. The QUIPS are supported by 8.30% Junior SubordinatedDebentures, Series A, due 2025 (QUIPS Debentures) issued by us.We have unconditionally guaranteed all distributions required to bemade by the Trust, but only to the extent the Trust has funds legallyavailable for such distributions.
38 Goodrich Corporation
Management’s Discussion & Analysis
Off-Balance Sheet ArrangementsWe utilize several forms of off-balance sheet financing arrange-ments. At December 31, 2002, these arrangements included:
UndiscountedMinimum Receivables
(in millions) Payments Sold
Tax Advantaged Operating Leases $ 59Standard Operating Leases 166
$ 225
Short-Term Receivables $ 97
Lease Agreements We finance our use of certain equipment, includingcorporate aircraft, under committed lease arrangements provided byfinancial institutions. These arrangements allow us to claim adeduction for the tax depreciation on the assets, rather than the lessor,and allow us to lease up to a maximum of $95 million at December31, 2002. Since the terms of these arrangements meet the accountingdefinition of operating lease arrangements, the aggregate sum offuture minimum lease payments is not reflected on our consolidatedbalance sheet. At December 31, 2002, approximately $59 million offuture minimum lease payments were outstanding under thesearrangements. We also have various other operating lease agree-ments whose future minimum lease payments approximated $166million at December 31, 2002. The increase from $81 million atDecember 31, 2001 resulted from leases that we assumed in theacquisition of Aeronautical Systems. See Note J to the accompanyingConsolidated Financial Statements for additional disclosure.
Sale of Receivables At December 31, 2002 and 2001, we had in placea trade receivables securitization program pursuant to which wecould sell receivables up to a maximum of $140 million and $110million, respectively. Accounts receivable sold under this programwere $97.3 million at December 31, 2002 and 2001.
Continued availability of the securitization program is conditionedupon compliance with financial and other covenants set forth in therelated agreements. We are currently in compliance with all suchcovenants. The securitization agreement also includes a rating down-grade trigger pursuant to which the agreement may be terminatedupon a rating downgrade. If such an event were to occur, we expectthat we would have sufficient capital resources through our existingrevolving credit facilities to satisfy any termination requirements.
During 2000, we entered into an agreement to sell certain long-termreceivables to a financial institution. The agreement containedrecourse provisions under which we were required to repurchase thereceivables in certain events. In the fourth quarter 2001, we repur-chased approximately $20 million of these long-term receivables at therequest of the financial institution. In August 2002, we repurchased$20.3 million of receivables as a result of a payment default by theprimary obligor and terminated the agreement.
Share Repurchase ProgramOn September 17, 2001, we announced a program to repurchase upto $300 million of our common stock. We have repurchased 2.5 mil-lion shares through December 31, 2001. The total cost of theseshares was approximately $50 million with an average price of$20.29 per share.
No shares were repurchased under this program during 2002 andnone are expected to be repurchased in 2003.
Change in Dividend PolicyOn May 17, 2002, we announced that our Board of Directors approveda change in our dividend policy to achieve a net income payout ratiothat we believe is consistent with other leading aerospace companies.Our quarterly dividend on our common stock was reduced to $0.20per share from the previous level of $0.275 per share. The changewas effective with the regular quarterly dividend payable on July 1,2002 to the shareholders of record as of June 10, 2002.
Cash FlowThe following table summarizes our cash flow activity for 2002,2001 and 2000:
(in millions)Cash Flows Provided by (Used by): 2002 2001 2000
Operating activities $ 539.2 $ 382.6 $ 168.2Investing activities $(1,509.0) $ (288.8) $ (349.4)Financing activities $ 1,163.6 $ (936.3) $ 80.6Discontinued operations $ (132.6) $ 850.7 $ 114.6
Operating Cash FlowsCash flow provided by operating activities increased by $156.6million to $539.2 million in 2002 from $382.6 million in 2001. Theincrease in cash flow from operations resulted from improved manage-ment of Accounts Receivable and Inventory, and lower estimated taxpayments in 2002. Also included in 2002 cash flow provided byoperating activities was approximately $29.4 million resulting fromthe sale of an interest rate swap agreement associated with $200million of our long-term debt and $30.8 million of cash receivedfrom the sale of hedges acquired in the acquisition of AeronauticalSystems. Offsetting the favorable cash flow was a decrease inAccounts Payable.
Operating cash flow increased by $214.4 million, from $168.2 millionin 2000 to $382.6 million in 2001. The increase was primarily due to a$113.7 million payment to the Internal Revenue Service (IRS) in 2000,increased cash earnings from continuing operations, lower restruc-turing and consolidation cost payments and lower tax payments,partially offset by working capital requirements during 2001.
Investing Cash FlowsWe used $1,509.0 million of cash primarily for the acquisition ofAeronautical Systems for $1,472.2 million and capital expendituresof $107.3 million offset in part by a payment of $49.8 million of thePIK notes. Capital expenditures were lower than in 2001 due to the

2002 Annual Report 39
expansion of our carbon producing capabilities in 2001 and a largeenterprise resource planning project at our Aerostructures businessthat was substantially complete in 2001.
We used $288.8 million in investing activities in 2001 versus $349.4million in 2000. The decrease was due primarily to lower spending onacquisitions (approximately $128 million), partially offset by increasedspending on capital expenditures (approximately $57 million).
Financing Cash FlowsFinancing activities provided $1,163.6 million of cash in 2002, con-sumed $936.3 million of cash in 2001 and provided $80.6 million incash in 2000. The increase in long-term and short-term debt andcapital stock was to finance the acquisition of Aeronautical Systemsin 2002. The primary reason for the increased use of cash in 2001was the repayment of short-term indebtedness with the proceedsfrom the Performance Materials sale. See Discontinued OperationsCash Flow discussion below. We increased our borrowings in 2000to finance acquisitions as well as our share repurchase program.
Discontinued Operations Cash FlowCash requirements for discontinued operations of $132.6 millionduring 2002 includes $47.0 million of cash included in the netassets of the EIP business distributed to shareholders, $47.0 millionpaid, net of insurance receipts, for asbestos-related matters and$15.6 million relating to capital expenditures and debt repayments.Cash provided by discontinued operations during 2001 of $850.7million includes $960.0 million attributable to the sale of thePerformance Materials business in February 2001.
Cash flow from discontinued operations increased $736.1 million,from $114.6 million in 2000 to $850.7 million in 2001. PerformanceMaterials accounted for $960 million of this increase, partially offsetby a decrease of $224 million in cash flow attributable to the EIP seg-ment. The Performance Materials increase was primarily attributableto the sale of the business during the first quarter of 2001, while thedecrease in cash flow attributable to the EIP segment was primarilyattributable to the Glacier Bearings acquisition during 2001 (approx-imately $150 million) and increased payments related to the defenseand disposition of asbestos-related claims.
Net Debt-to-Capitalization RatioOur net debt-to-capitalization ratio (net of cash and cash equiva-lents) was 68.7 percent at December 31, 2002 as compared to 47.2percent at December 31, 2001. For purposes of this ratio, the trust pre-ferred securities are treated as capital. The ratio increased due to thedebt financing of approximately $1.3 billion relating to the acquisitionof Aeronautical Systems. The additional $200 million of purchaseprice of Aeronautical Systems was financed through the issuance of$216.2 million of common stock in the fourth quarter of 2002.
Commercial Airline CustomersThe downturn in the commercial air transport market, exacerbatedby the terrorist attacks on September 11, 2001, has adversely affectedthe financial condition of many of our commercial airline customers.Many of these customers have requested extended payment terms
for future shipments and/or reduced pricing. We review and evalu-ate these requests on a case-by-case basis. We perform ongoingcredit evaluations on the financial condition of all of our customersand maintain reserves for uncollectible accounts receivable basedupon expected collectibility. Although we believe our reserves areadequate, we are not able to predict the future financial stability ofthese customers. Any material change in the financial status of anyone or group of customers could have a material adverse effect onour financial condition, results of operations or cash flows. Theextent to which extended payment terms are granted to customersmay negatively affect future cash flow.
One of our customers, Fairchild Dornier, commenced insolvencyproceedings in Germany in 2002. As a result, we recorded a$1.0 million charge during the first quarter of 2002 related toaccounts receivable from Fairchild Dornier and recorded a$16.6 million charge during the second quarter of 2002 for capital-ized pre-production and inventory costs and supplier terminationcharges relating to the Fairchild Dornier 728 and 928 integratedlanding system program.
On August 11, 2002, US Airways announced that it had filed for pro-tection under Chapter 11 of the United States Bankruptcy Code. Asof December 31, 2002, we had accounts receivable for US Airways ofapproximately $2.6 million against which a valuation reserve of $1.9million was recorded. In addition, as of December 31, 2002, we hadapproximately $3.4 million of unamortized sales incentives recordedas other assets and a 50 percent-owned investee had unamortizedsales incentives recorded of approximately $1.6 million. We continueto provide US Airways with components under post-bankruptcy pro-tection and to assess the realization of the above pre-bankruptcyassets as information becomes available.
On December 9, 2002, the parent company of United Airlinesannounced that it and certain of its U.S. subsidiaries had filed forprotection under Chapter 11 of the U.S. Bankruptcy Code. As ofDecember 31, 2002, we had accounts receivable from UnitedAirlines of approximately $2.7 million against which a valuationreserve of $1.2 million was recorded. In addition, as of December 31,2002, we had unamortized sales incentives recorded as other assetsof approximately $4.5 million. We continue to provide UnitedAirlines with components under post-bankruptcy protection and toassess the realization of the pre-bankruptcy assets as informationbecomes available.
Insurance Costs and AvailabilityAs a result of the terrorist attacks on September 11, 2001 and gen-eral market conditions, our insurance costs have increased and certaintypes of coverage have been eliminated or made available to us withless favorable terms and conditions. We renewed our property andcasualty programs in 2002 at a higher cost, but with generally simi-lar deductibles, terms and conditions as the expiring policies, withthe exception that our property insurance program was renewedwithout coverage for terrorist acts, including associated businessinterruption. Our property and general liability programs were

40 Goodrich Corporation
Management’s Discussion & Analysis
renewed with reduced limits of liability reflecting the spin-off of ourindustrial products business, but in each case, limits were main-tained at levels consistent with our industry peers. Our propertyinsurance, general liability and aircraft products liability programsexpire in mid-2003 and our executive risk program expires in 2004.We expect to renew our policies when these policies expire in 2003.
Contingencies
GeneralThere are pending or threatened against us or our subsidiaries var-ious claims, lawsuits and administrative proceedings, all arisingfrom the ordinary course of business with respect to commercial,product liability, asbestos and environmental matters, which seekremedies or damages. We believe that any liability that may finally bedetermined with respect to commercial and non-asbestos productliability claims should not have a material effect on our consolidatedfinancial position or results of operations. From time to time, we arealso involved in legal proceedings as a plaintiff involving contract,patent protection, environmental and other matters. Gain contin-gencies, if any, are recognized when they are realized.
EnvironmentalWe are subject to various domestic and international environmentallaws and regulations which may require that we investigate andremediate the effects of the release or disposal of materials at sitesassociated with past and present operations, including sites atwhich we have been identified as a potentially responsible partyunder the federal Superfund laws and comparable state laws. We arecurrently involved in the investigation and remediation of a numberof sites under these laws.
The measurement of environmental liabilities by us is based oncurrently available facts, present laws and regulations and currenttechnology. Such estimates take into consideration our prior experi-ence in site investigation and remediation, the data concerningcleanup costs available from other companies and regulatoryauthorities and the professional judgment of our environmentalspecialists in consultation with outside environmental specialists,when necessary. Estimates of our liability are further subject touncertainties regarding the nature and extent of site contamination,the range of remediation alternatives available, evolving remedia-tion standards, imprecise engineering evaluations and estimates ofappropriate cleanup technology, methodology and cost, the extentof corrective actions that may be required and the number andfinancial condition of other potentially responsible parties, as well asthe extent of their responsibility for the remediation.
Accordingly, as investigation and remediation of these sites pro-ceed, it is likely that adjustments in our accruals will be necessary toreflect new information. The amounts of any such adjustmentscould have a material adverse effect on our results of operations ina given period, but the amounts, and the possible range of loss inexcess of the amounts accrued, are not reasonably estimable. Basedon currently available information, however, we do not believe thatfuture environmental costs in excess of those accrued with respect
to sites with which we have been identified as a potentially responsibleparty are likely to have a material adverse effect on our financial condi-tion. There can be no assurance, however, that additional futuredevelopments, administrative actions or liabilities relating to envi-ronmental matters will not have a material adverse effect on ourresults of operations or cash flows in a given period.
Environmental liabilities are recorded when our liability is probableand the costs are reasonably estimable, which generally is not laterthan at completion of a feasibility study or when we have recom-mended a remedy or have committed to an appropriate plan ofaction. The liabilities are reviewed periodically and, as investigationsand remediation proceed, adjustments are made as necessary.Liabilities for losses from environmental remediation obligations donot consider the effects of inflation, and anticipated expendituresare not discounted to their present value. The liabilities are notreduced by possible recoveries from insurance carriers or other thirdparties, but do reflect anticipated allocations among potentiallyresponsible parties at federal Superfund sites or similar state-man-aged sites and an assessment of the likelihood that such parties willfulfill their obligations at such sites.
At December 31, 2002, our liabilities for environmental remediationobligations totaled $92.7 million, of which $19.0 million was includedin current liabilities as Accrued Liabilities. Of the $92.7 million, $21.5million was associated with ongoing operations and $71.2 million wasassociated with businesses previously disposed of or discontinued.
The timing of expenditures depends on a number of factors thatvary by site, including the nature and extent of contamination, thenumber of potentially responsible parties, the timing of regulatoryapprovals, the complexity of the investigation and remediation, andthe standards for remediation. We expect that we will expend pres-ent accruals over many years, and will complete remediation of allsites with which we have been identified in up to 30 years. This periodincludes operation and monitoring costs that are generally incurredover 15 to 25 years.
Tolo Litigation In May 2000, we and our subsidiary Rohr, Inc. were served with acomplaint in a lawsuit filed in the Superior Court of Orange County,California, by former shareholders and certain former employees ofTolo, Inc. Tolo is a subsidiary of Rohr that was acquired in 1997 pur-suant to a stock purchase agreement. The former shareholdersalleged that we and Rohr breached the stock purchase agreement byfailing to pay $2.4 million under the terms of the agreement. InSeptember 2001, a jury found that we were liable to the shareholdersfor the $2.4 million retained by Rohr under the stock purchase agree-ment and were also assessed punitive damages of $48 million. Thecourt subsequently reduced the punitive damage award to $24 million.We and Rohr appealed the judgment.
In December 2002, the appellate court issued a ruling directing thetrial court to enter judgment in favor of us and Rohr on both thefraud claim and the breach of contract claim. The plaintiffs’ motion
2002 Annual Report 41
for rehearing of that ruling was subsequently denied. On February10, 2003, the plaintiffs filed a petition for review with the CaliforniaSupreme Court. We have until March 2, 2003 to respond to the petition.
AsbestosWe and certain of our subsidiaries have been named as defendantsin various actions by plaintiffs alleging injury or death as a result ofexposure to asbestos fibers in products, or which may have beenpresent in our facilities. A number of these cases involve Maritimeclaims, which have been and are expected to continue to be admin-istratively dismissed by the court. These actions primarily relate topreviously owned businesses. We believe that we have substantialinsurance coverage available to us related to any remaining claims.As a result, we believe that these pending and reasonably anticipatedfuture actions are not likely to have a material adverse effect on ourfinancial condition or results of operations.
Discontinued OperationsAt the time of the EIP spin-off, two subsidiaries of Coltec were defen-dants in a significant number of personal injury claims relating toalleged asbestos-containing products sold by those subsidiaries. Itis possible that asbestos-related claims might be asserted againstus on the theory that we have some responsibility for the asbestos-related liabilities of EnPro, Coltec or its subsidiaries, even thoughthe activities that led to those claims occurred prior to our owner-ship of any of those subsidiaries. Also, it is possible that a claimmight be asserted against us that Coltec’s dividend of its aerospacebusiness to us prior to the spin-off was made at a time when Coltecwas insolvent or caused Coltec to become insolvent. Such a claimcould seek recovery from us on behalf of Coltec of the fair marketvalue of the dividend.
No such claims have been asserted against us to date. We believethat we would have substantial legal defenses against any suchclaims. In addition, the agreement between EnPro and us that wasused to effectuate the spin-off provides us with an indemnificationfrom EnPro covering, among other things, these liabilities. Any suchasbestos-related claims would likely require, as a practical matter,that Coltec’s subsidiaries were unable to satisfy their asbestos-relatedliabilities and that Coltec was found to be responsible for theseliabilities and was unable to meet its financial obligations. We believe anysuch claims would be without merit and that Coltec was solvent bothbefore and after the dividend. If we are ultimately found to be responsiblefor the asbestos-related liabilities of Coltec’s subsidiaries, webelieve it would not have a material adverse effect on our financialcondition, but could have a material adverse effect on our results ofoperations and cash flows in a particular period. However, becauseof the uncertainty as to the number, timing and payments related tofuture asbestos-related claims, there can be no assurance that anysuch claims will not have a material adverse effect on our financialcondition, results of operations and cash flows. If a claim related tothe dividend of Coltec’s aerospace business were successful, itcould have a material adverse impact on our financial condition,results of operations and cash flows.
GuaranteesWe have guaranteed amounts owed by Coltec Capital Trust withrespect to the $150 million of outstanding 5 1/4 percent convertibletrust preferred securities (TIDES), and have guaranteed Coltec’sperformance of its obligations with respect to the TIDES and theunderlying Coltec convertible subordinated debentures. Followingthe spin-off of the EIP segment, the TIDES remained outstanding asan obligation of Coltec Capital Trust and our guarantee with respectto the TIDES remains an obligation of ours. EnPro, Coltec andColtec Capital Trust have agreed to indemnify us from any costs andliabilities arising under or related to the TIDES after the spin-off.
In addition to our guarantee of the TIDES, we have an outstandingcontingent liability for guaranteed debt and lease payments of $4.5million and for letters of credit and bank guarantees of $43.1 millionat December 31, 2002.
Certain Contracts and Investment
Our Aerostructures business re-engines 727 aircraft (the “Super 27program”). The re-engining enables these aircraft to meet soundattenuation requirements and improve their fuel efficiency. AtDecember 31, 2001, we had $44.7 million of inventory and $61.2 millionof long-term notes receivable with respect to the Super 27 program.At December 31, 2001, $20.3 million of these notes receivable hadbeen sold to a financial institution. The agreement relating to thesale contained recourse provisions. Due to a default by the primaryobligor, we repurchased the notes receivable in August 2002 and theagreement was terminated. We believe that the recorded value of thenotes receivable of $61.2 million is less than or equal to the fairvalue of the underlying collateral. Collection of these receivables, aswell as the recovery of some portion of our investment in existinginventory balances, may be negatively affected should the overalldeterioration in the commercial airline market continue or if themarket for re-engined Super 27 program aircraft deteriorates further.Because of these conditions, we will continue to assess the value ofthese assets and their ultimate recovery.
Our Aerostructures business has a contract with Boeing on theB717-200 program that is subject to certain risks and uncertainties.Recovery of pre-production inventory balances of $31.2 million as ofDecember 31, 2002 is subject to Boeing’s future production rate anddelivery schedule as well as our future cost structure and learningcurve assumptions.
During 2000, we invested as a minority shareholder in Cordiem LLC(Cordiem). Cordiem is an aerospace business venture betweensuppliers and airlines whose purpose is to utilize Internet-based solu-tions to lower costs of business transactions and inventory, to expandproduct awareness and availability to more customers and to improveinformation flow between participants. As of December 31, 2002, ourinvestment in Cordiem, including internal-use software, was $12.9million. As of December 31, 2002, all equity partners had signed up forservices for 2003. There is, however, concern about the ability of certainairlines to fulfill their pledges. We continue to monitor the recover-ability of our investment in Cordiem.
42 Goodrich Corporation
Management’s Discussion & Analysis
New Accounting Standards
In June 2001, the Financial Accounting Standards Board (FASB)issued Statement No. 143 “Accounting for Asset RetirementObligations” (SFAS 143). SFAS 143 addresses financial accountingand reporting for obligations associated with the retirement of tan-gible long-lived assets and the associated asset retirement costs. It applies to legal obligations associated with the retirement of long-lived assets that result from the acquisition, construction, developmentand/or the normal operation of a long-lived asset, except for certainobligations of lessees. SFAS 143 is effective for financial statementsissued for fiscal years beginning after June 15, 2002. We will adoptSFAS 143 on January 1, 2003. We do not expect that SFAS 143 willhave a material effect on our consolidated financial condition orresults of operations.
In October 2001, the FASB issued Statement No. 144 “Accounting forthe Impairment or Disposal of Long-Lived Assets” (SFAS 144). SFAS144 supersedes FASB Statement No. 121 “Accounting for theImpairment of Long-Lived Assets and for Long-Lived Assets to BeDisposed Of” (SFAS 121); however it retains the fundamental provi-sions of that statement related to the recognition and measurementof the impairment of long-lived assets to be “held and used.” In addi-tion, SFAS 144 provides more guidance on estimating cash flowswhen performing a recoverability test, requires that a long-lived asset(group) to be disposed of other than by sale (e.g. abandoned) beclassified as “held and used” until it is disposed of, and establishesmore restrictive criteria to classify an asset (group) as “held for sale.”SFAS 144 is effective for fiscal years beginning after December 15,2001. The adoption of SFAS 144 did not have a material impact onour consolidated financial condition or results of operations.
In April 2002, the FASB issued Statement No. 145 “Rescission ofFASB Statements No. 4, 44 and 62, amendment of FASB StatementNo. 13 and Technical Corrections” (SFAS 145). SFAS 145 will requiregains and losses on the extinguishments of debt to be classified asincome or loss from continuing operations rather than as extraordi-nary items as previously required under Statement of FinancialStandards No. 4. Extraordinary treatment will be required for certainextinguishments as provided in APB Opinion No. 30. SFAS 145 alsoamends Statement of Financial Accounting Standards No. 13 torequire certain modifications to capital leases to be treated as a sale-leaseback and modifies the accounting for sub-leases when theoriginal lessee remains a secondary obligor (or guarantor). SFAS 145is effective for financial statements issued after May 15, 2002,andwith respect to the impact of the reporting requirements of changesmade to SFAS 4 for fiscal years beginning after May 15, 2002. Theadoption of the applicable provisions of SFAS 145 did not have aneffect on our financial statements.
In June 2002, the FASB issued Statement No. 146, “Accounting forCosts Associated with Exit or Disposal Activities” (SFAS 146). SFAS146 nullifies Emerging Issues Task Force Issue No. 94-3 “LiabilityRecognition for Certain Employee Termination Benefits and OtherCosts to Exit an Activity (including Certain Costs Incurred in a
Restructuring).” SFAS 146 applies to costs associated with an exitactivity that does not involve an entity newly acquired in a businesscombination or with a disposal activity covered by SFAS 144. SFAS146 is effective for exit or disposal activities that are initiated afterDecember 31, 2002, with earlier application encouraged. We do notexpect that SFAS 146 will have a material effect on our consolidatedfinancial condition or results of operations but it will impact the timingof charges, which could impact comparability of results amongreporting periods.
During November 2002, the FASB issued Interpretation No. 45“Guarantor’s Accounting and Disclosure Requirements forGuarantees, Including Indirect Guarantees of Indebtedness ofOthers” (FIN 45). FIN 45 requires certain guarantees to be recordedat fair value. The initial recognition and measurement provisions ofFIN 45 are applicable, on a prospective basis, to guarantees issuedor modified after December 31, 2002. FIN 45 also requires a guarantorto make new disclosures regarding guarantees. The disclosurerequirements are effective for financial statements ending afterDecember 15, 2002.
In December 2002, the FASB issued Statement No. 148 “Accountingfor Stock-Based Compensation-Transition and Disclosures” (SFAS148) which amends FASB Statement No. 123 “Accounting for Stock-Based Compensation” (SFAS 123). SFAS 148 provides alternativemethods of transition for a voluntary change to the fair value basedmethod of accounting for stock-based employee compensation. Inaddition, SFAS 148 amends the disclosure requirements of SFAS 123to require more prominent and more frequent disclosures in finan-cial statements about the effects of stock-based compensation. Thetransition guidance and annual disclosure provisions of SFAS 148are effective for fiscal years ending after December 15, 2002. Theinterim disclosure provisions are effective for financial reports con-taining financial statements for interim periods beginning afterDecember 15, 2002.
Critical Accounting Policies
Our discussion and analysis of our financial condition and results ofoperations are based upon our consolidated financial statements,which have been prepared in accordance with accounting principlesgenerally accepted in the United States. The preparation of thesefinancial statements requires us to make estimates and judgmentsthat affect the reported amounts of assets, liabilities, revenues andexpenses, and related disclosure of contingent assets and liabilities.On an ongoing basis, we evaluate our estimates, including thoserelated to customer programs and incentives, product returns, baddebts, inventories, investments, intangible assets, income taxes,financing operations, warranty obligations, excess component ordercancellation costs, restructuring, long-term service contracts,pensions and other post-retirement benefits, and contingencies andlitigation. We base our estimates on historical experience and on var-ious other assumptions that are believed to be reasonable under thecircumstances, the results of which form the basis for making judg-ments about the carrying values of assets and liabilities that are not

2002 Annual Report 43
readily apparent from other sources. Actual results may differ fromthese estimates under different assumptions or conditions.
We believe the following critical accounting policies affect our moresignificant judgments and estimates used in the preparation of ourconsolidated financial statements.
Revenue RecognitionFor revenues not recognized under the contract method of accounting,we recognize revenues from the sale of products at the point of pas-sage of title, which is at the time of shipment. Revenues earned fromproviding maintenance service are recognized when the service iscomplete.
Contract Accounting – Percentage of CompletionRevenue RecognitionWe also have sales under long-term, fixed-priced contracts, many ofwhich contain escalation clauses, requiring delivery of products overseveral years and frequently providing the buyer with option pricing onfollow-on orders. Sales and profits on each contract are recognized inaccordance with the percentage-of-completion method of accounting,using the units-of-delivery method. We follow the guidelines ofStatement of Position 81-1 (SOP 81-1), “Accounting for Performanceof Construction-Type and Certain Production-Type Contracts” (thecontract method of accounting) except that our contract accountingpolicies differ from the recommendations of SOP 81-1 in that revi-sions of estimated profits on contracts are included in earningsunder the reallocation method rather than the cumulative catch-upmethod. Under the reallocation method, the impact of revisions inestimates related to units shipped to date is recognized ratably overthe remaining life of the contract while under the cumulative catch-up method such impact would be recognized immediately.
Profit is estimated based on the difference between total estimatedrevenue and total estimated cost of a contract, excluding that reportedin prior periods, and is recognized evenly in the current and future peri-ods as a uniform percentage of sales value on all remaining units to bedelivered. Current revenue does not anticipate higher or lower futureprices but includes units delivered at actual sales prices. Costincludes the estimated cost of the preproduction effort, primarilytooling and design, plus the estimated cost of manufacturing a spec-ified number of production units. The specified number of productionunits used to establish the profit margin is predicated upon contrac-tual terms adjusted for market forecasts and does not exceed thelesser of those quantities assumed in original contract pricing orthose quantities which we now expect to deliver in the time-frame/periods assumed in the original contract pricing. Our policiesonly allow the estimated number of production units to be deliveredto exceed the quantity assumed within the original contract pricingwhen we receive firm orders for additional units. The timeframe/peri-od assumed in the original contract pricing is generally equal to theperiod specified in the contract. If the contract is a “life of program”contract, then such period is equal to the time period used in theoriginal pricing model which generally equals the
time period required to recover our pre-production costs. Optionquantities are combined with prior orders when follow-on ordersare released.
The contract method of accounting involves the use of variousestimating techniques to project costs at completion and includesestimates of recoveries asserted against the customer for changes inspecifications. These estimates involve various assumptions andprojections relative to the outcome of future events, including thequantity and timing of product deliveries. Also included are assump-tions relative to future labor performance and rates, and projectionsrelative to material and overhead costs. These assumptions involvevarious levels of expected performance improvements. We reevaluateour contract estimates periodically and reflect changes in estimatesin the current and future periods under the reallocation method.
Included in sales are amounts arising from contract terms thatprovide for invoicing a portion of the contract price at a date afterdelivery. Also included are negotiated values for units delivered andanticipated price adjustments for contract changes, claims, escala-tion and estimated earnings in excess of billing provisions, resultingfrom the percentage-of-completion method of accounting. Certaincontract costs are estimated based on the learning curve conceptdiscussed below.
InventoryInventoried costs on long-term contracts include certain preproductioncosts, consisting primarily of tooling and design costs and productioncosts, including applicable overhead. The costs attributed to unitsdelivered under long-term commercial contracts are based on theestimated average cost of all units expected to be produced and aredetermined under the learning curve concept, which anticipates apredictable decrease in unit costs as tasks and production tech-niques become more efficient through repetition. This usuallyresults in an increase in inventory (referred to as “excess-overaverage”) during the early years of a contract.
If in-process inventory plus estimated costs to complete a specificcontract exceeds the anticipated remaining sales value of such con-tract, such excess is charged to current earnings, thus reducinginventory to estimated realizable value.
Identifiable Intangible AssetsIdentifiable intangible assets are recorded at cost, or when acquiredas part of a business combination, at estimated fair value. Theseassets include patents and other technology agreements, sourcingcontracts, trademarks, licenses, customer relationships and non-compete agreements. Intangible assets are generally amortizedusing the straight-line method over estimated useful lives of 5 to 25years for all acquisitions completed prior to June 30, 2001. Foracquisitions completed subsequent to June 30, 2001, identifiableintangible assets are amortized over their useful life using undis-counted cash flows, a method that reflects the pattern in which theeconomic benefits of the intangible assets are consumed.
44 Goodrich Corporation
Management’s Discussion & Analysis
Impairments of identifiable intangible assets are recognized whenevents or changes in circumstances indicate that the carryingamount of the asset, or related groups of assets, may not be recov-erable and our estimate of undiscovered cash flows over the assetsremaining useful life are less than the carrying value of the assets.The determination of undiscounted cash flow is based on the segments’plans. The revenue growth is based upon aircraft build projections fromaircraft manufacturers and widely available external publications. Theprofit margin assumption is based upon the current cost structureand anticipated cost reductions. Measurement of the amount ofimpairment may be based upon an appraisal, market values of sim-ilar assets or estimated discounted future cash flows resulting fromthe use and ultimate disposition of the asset.
Sales IncentivesWe offer sales incentives to certain commercial customers in con-nection with sales contracts. These incentives may consist of up-front cash payments, merchandise credits and/or free products. Thecost of these incentives is recognized in the period incurred unless itis specifically guaranteed of recovery within the contract by the cus-tomer. If the contract contains such a guarantee, then the cost of thesales incentive is capitalized and amortized over the contract period.
Entry Fees – Investment in Risk and Revenue Sharing ProgramsMajor aerospace customers negotiate an entry fee, representing anup-front cash investment in a new program. The payment effectivelydemonstrates our commitment to participate in new product pro-grams and is part of the exclusive supply agreement. In return, wereceive a percentage of the product sales in the supply periods afterflight certification. Entry fees differ from sales incentives as entryfees are an investment in a program which will generate a benefitfrom the total sales of the program, not just sales from our productswhile sales incentives are recovered during the contract period ofour products by a specific guarantee of recovery by the customer.The entry fees are recognized as Other Assets and amortized on astraight-line basis over the programs’ useful life following certification,which approximates 10 to 20 years. The value of the investments isevaluated for impairment based on the criteria in “IdentifiableIntangible Assets” above. The estimated lives are reviewed periodi-cally based upon the expected program lives as communicated bythe customer.
Employee BenefitsAssumptions used in determining the projected benefit obligationsand the fair value of plan assets for our pension and postretirementbenefits other than pensions plans are evaluated by us with consul-tation with an outside actuary. Changes in assumptions are basedupon our historical data, such as the rate of compensation increaseand the long-term rate of return on plan assets. Assumptions,including the discount rate, the long-term rate of return on planassets and the health care cost projections are evaluated and updat-ed annually.
Based upon our evaluation of the U.S. plans, we have changed theexpected long-term rate of return on plan assets from 9.25 percentfor 2002 to 9.00 percent for 2003. We have also changed the dis-count rate from 7.50 percent at December 31, 2001 to 6.875 percentat December 31, 2002. The rate of compensation decreased from4.0 percent in 2001 to 3.86 percent in 2002. For measurement atDecember 31, 2001, an 8.5 percent annual rate of increase in the percapita cost of covered healthcare benefits was assumed with the rateassumed to decrease gradually to 5.0 percent for 2006 and remainat that level, thereafter. For measurement at December 31, 2002, a10 percent annual rate of increase in the per capita cost of coveredhealthcare was assumed with a gradual decline to 5.0 percent for2007 remaining at that level, thereafter.
Pending Sale of the Avionics Business
On January 29, 2003, we had entered into a definitive agreement tosell our Avionics business to L-3 Communications Corporation (L-3)for $188 million. The transaction was approved by the boards ofdirectors of our company and L-3. Subject to customary regulatoryapprovals, the sale is expected to close late in the first quarter or earlyin the second quarter of 2003. After-tax proceeds are expected to beapproximately $134 million and are intended to be used to furtherreduce the borrowings under our $1.5 billion, 364-day credit agree-ment. The Avionics business will be reported as a discontinued oper-ation beginning with the first quarter 2003.
Forward-Looking Information Is Subject to Risk and Uncertainty
Certain statements made in this document are forward-lookingstatements within the meaning of the Private Securities LitigationReform Act of 1995 regarding our future plans, objectives andexpected performance. Specifically, statements that are not historicalfacts, including statements accompanied by words such as “believe,”“expect,” “anticipate,” intend,” “estimate,” or “plan,” are intendedto identify forward-looking statements and convey the uncertainty offuture events or outcomes. We caution readers that any suchforward-looking statements are based on assumptions that webelieve are reasonable, but are subject to a wide range of risks, andactual results may differ materially.
Important factors that could cause actual results to differ include,but are not limited to:
• the extent to which we are successful in integrating AeronauticalSystems and achieving expected operating synergies;
• the extent to which we are successful in completing the sale ofour Avionics business;
• global demand for aircraft spare parts and aftermarket services;
• the impact of the terrorist attacks on September 11, 2001 and theiraftermath;
• the timing related to restoring consumer confidence in air travel;
• the health of the commercial aerospace industry, including theimpact of bankruptcies in the airline industry;

2002 Annual Report 45
• the effect of current financial market conditions on pension planassets, including future plan asset valuations, and the effect ofthose valuations on shareholders’ equity and future pensionexpense and plan contributions;
• demand for and market acceptance of new and existing products,such as the Airbus A380 and the Joint Strike Fighter;
• potential cancellation of orders by customers;
• successful development of products and advanced technologies;
• competitive product and pricing pressures;
• the solvency of Coltec Industries Inc at the time of and subse-quent to the spin-off of EnPro Industries, Inc. and the ability ofColtec’s subsidiaries to satisfy their asbestos-related liabilities fol-lowing the spin-off;
• domestic and foreign government spending, budgetary and tradepolicies;
• economic and political changes in international markets wherewe compete, such as changes in currency exchange rates, infla-tion rates, recession and other external factors over which wehave no control; and
• the outcome of contingencies (including completion of acquisitions,divestitures, litigation and environmental remediation efforts).
We caution you not to place undue reliance on the forward-lookingstatements contained in this document, which speak only as of thedate on which these statements were made. We undertake no obli-gation to release publicly any revisions to these forward-lookingstatements to reflect events or circumstances after the date onwhich these statements were made or to reflect the occurrence ofunanticipated events.
Quantitative and Qualitative Disclosures about Market Risk
We are exposed to certain market risks as part of our ongoing busi-ness operations, including risks from changes in interest rates andforeign currency exchange rates that could impact our financial con-dition, results of operations and cash flows. We manage our exposureto these and other market risks through regular operating and financ-ing activities, and on a limited basis, through the use of derivativefinancial instruments. We intend to use such derivative financialinstruments as risk management tools and not for speculativeinvestment purposes.
Interest Rate Exposure We are exposed to interest rate risk as a resultof our outstanding debt obligations. The table below providesinformation about our financial instruments that are sensitive tochanges in interest rates. The table represents principal cash flowsand related weighted average interest rates by expected (contractual)maturity dates.
Expected Maturity Dates
Fair(dollars in millions) 2003 2004 2005 2006 2007 Thereafter Total Value
Debt
Fixed Rate $ 2.0 $ 1.3 $ 1.1 $ 1.1 $ 301.3 $ 1,800.5 $ 2,107.3 $ 2,202.4
Average Interest Rate 3.7% 2.5% 3.0% 2.8% 6.4% 7.2% 7.0%
Variable Rate $ 379.4 $ 1.2 $ 1.2 $ 2.1 $ 0.2 $ 17.2 $ 401.3 $ 401.3
Average Interest Rate 2.3% 3.4% 3.4% 4.6% 3.1% 2.0% 2.3%
Capital Lease Obligations $ 2.0 $ 1.5 $ 0.4 $ — $ — $ — $ 3.9 $ 3.5
Foreign Currency Exposure We are exposed to foreign currency risksthat arise from normal business operations. These risks includethe translation of monetary assets and liabilities denominated incurrencies other than the functional currency of the subsidiary andtranslation of income and expense and balance sheet amounts ofour foreign subsidiaries to the U.S. dollar. Our objective is to mini-mize our exposure to transaction and income risks through our nor-mal operating activities and, where appropriate, through foreigncurrency forward exchange contracts.
As currency exchange rates fluctuate, translation of the statementsof income of international businesses into U.S. dollars will affectcomparability of revenues and expenses between years.
Upon the acquisition of Aeronautical Systems, we entered into addi-tional foreign exchange forward contracts to sell U.S. dollars forGreat Britain Pounds and for Euros in addition to our existing Euro
contracts. These businesses have a substantial portion of thesecosts in Great Britain Pounds and Euros but have significant salescontracts that are denominated in U.S. dollars. These forward con-tracts are used to mitigate potential volatility to cash flows arisingfrom changes in currency exchange rates. As of December 31, 2002we had forward contracts with an aggregate notional amount of$656.0 million to buy Great Britain Pounds and contracts with anaggregate notional amount of $95.2 million to buy Euros. Theseforward contracts mature on a monthly basis with maturity datesthat range from January 2003 to April 2007.
At December 31, 2002, a hypothetical 10 percent unfavorable changein exchange rates would decrease the value of the forward contractsdescribed above by $88.0 million.

46 Goodrich Corporation
Management’s Responsibility for Financial Statements
The Consolidated Financial Statements and Notes to Consolidated Financial Statements of Goodrich Corporation and subsidiaries have beenprepared by management. These statements have been prepared in accordance with generally accepted accounting principles and, accordingly,include amounts based upon informed judgments and estimates. Management is responsible for the selection of appropriate accountingprinciples and the fairness and integrity of such statements.
The Company maintains a system of internal controls designed to provide reasonable assurance that accounting records are reliable for thepreparation of financial statements and for safeguarding assets. The Company’s system of internal controls includes: written policies, guidelinesand procedures; organizational structures, staffed through the careful selection of people that provide an appropriate division of responsibilityand accountability; and an internal audit program. Ernst & Young LLP, independent auditors, were engaged to audit and to render an opinion onthe Consolidated Financial Statements of Goodrich Corporation and subsidiaries. Their opinion is based on procedures believed by them tobe sufficient to provide reasonable assurance that the Consolidated Financial Statements are not materially misstated. The report of Ernst &Young LLP follows.
The Board of Directors pursues its oversight responsibility for the financial statements through its Audit Review Committee, composed ofDirectors who are not employees of the Company. The Audit Review Committee meets regularly to review with management and Ernst &Young LLP the Company’s accounting policies, internal and external audit plans and results of audits. To ensure complete independence,Ernst & Young LLP and the internal auditors have full access to the Audit Review Committee and meet with the Committee without the pres-ence of management.
D. L. Burner
Chairman and Chief Executive Officer
Ulrich Schmidt
Executive Vice President and Chief Financial Officer
R. D. Koney, Jr.
Vice President and Controller
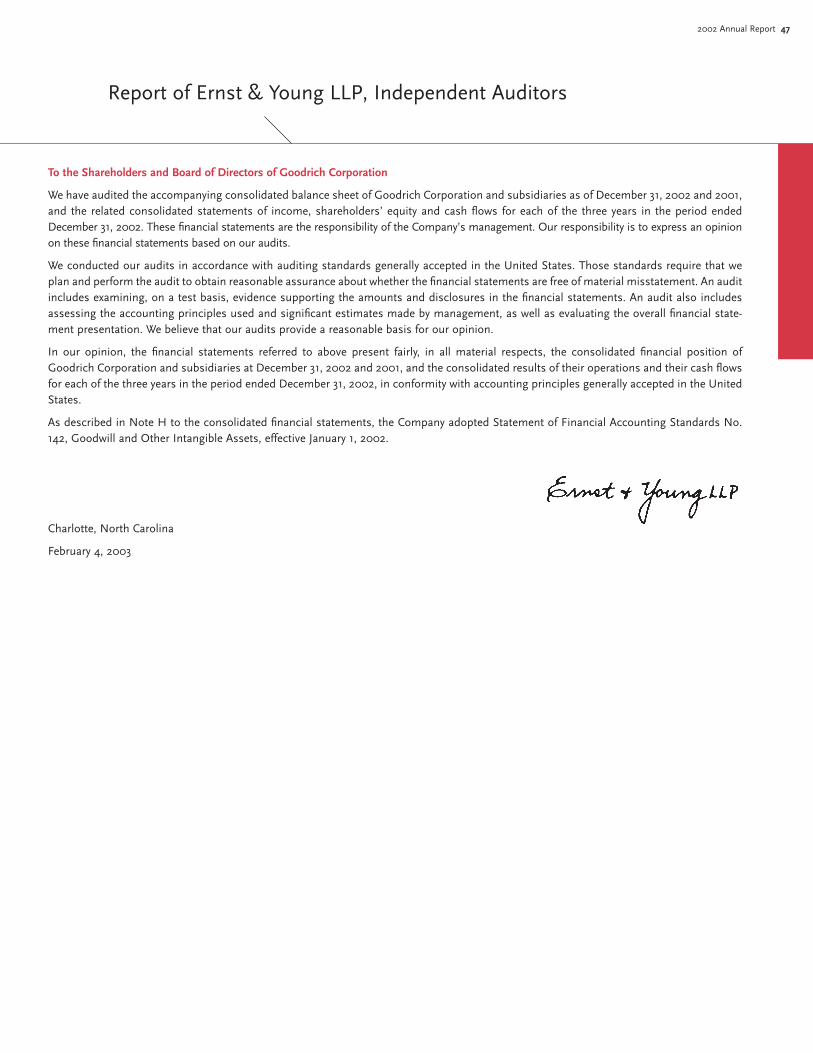
2002 Annual Report 47
To the Shareholders and Board of Directors of Goodrich Corporation
We have audited the accompanying consolidated balance sheet of Goodrich Corporation and subsidiaries as of December 31, 2002 and 2001,and the related consolidated statements of income, shareholders’ equity and cash flows for each of the three years in the period endedDecember 31, 2002. These financial statements are the responsibility of the Company’s management. Our responsibility is to express an opinionon these financial statements based on our audits.
We conducted our audits in accordance with auditing standards generally accepted in the United States. Those standards require that weplan and perform the audit to obtain reasonable assurance about whether the financial statements are free of material misstatement. An auditincludes examining, on a test basis, evidence supporting the amounts and disclosures in the financial statements. An audit also includesassessing the accounting principles used and significant estimates made by management, as well as evaluating the overall financial state-ment presentation. We believe that our audits provide a reasonable basis for our opinion.
In our opinion, the financial statements referred to above present fairly, in all material respects, the consolidated financial position ofGoodrich Corporation and subsidiaries at December 31, 2002 and 2001, and the consolidated results of their operations and their cash flowsfor each of the three years in the period ended December 31, 2002, in conformity with accounting principles generally accepted in the UnitedStates.
As described in Note H to the consolidated financial statements, the Company adopted Statement of Financial Accounting Standards No.142, Goodwill and Other Intangible Assets, effective January 1, 2002.
Charlotte, North Carolina
February 4, 2003
Report of Ernst & Young LLP, Independent Auditors
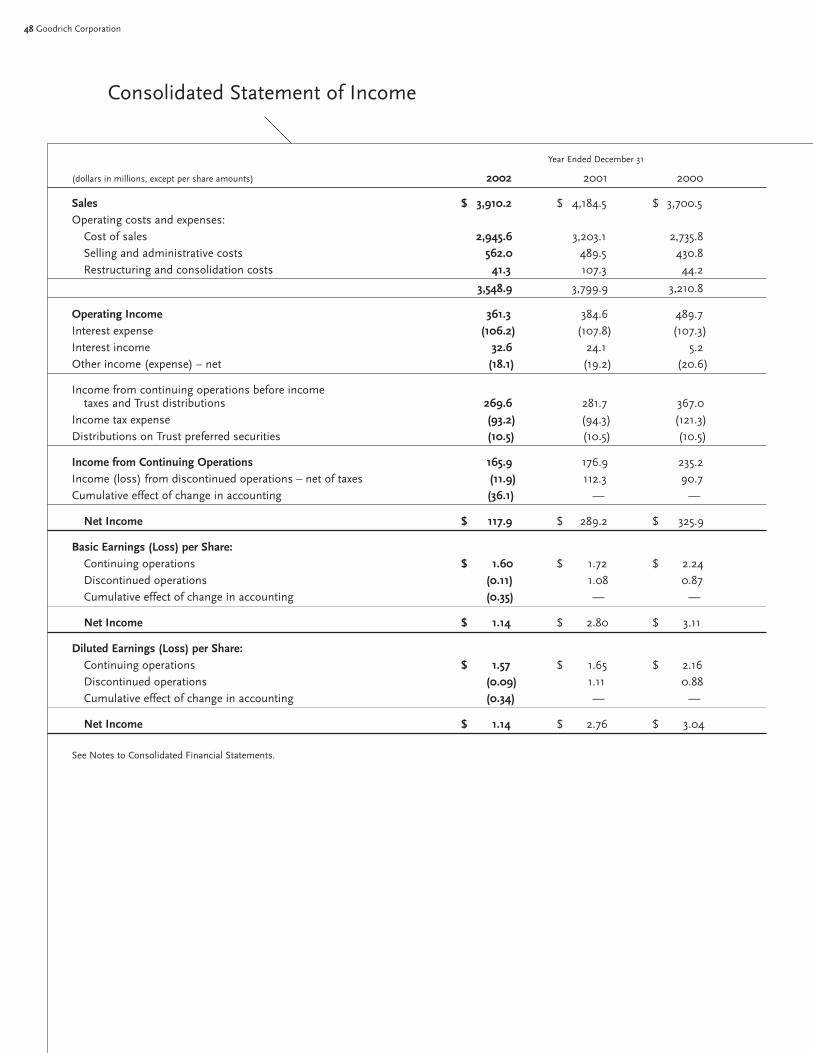
48 Goodrich Corporation
Consolidated Statement of Income
Year Ended December 31
(dollars in millions, except per share amounts) 2002 2001 2000
Sales $ 3,910.2 $ 4,184.5 $ 3,700.5Operating costs and expenses:
Cost of sales 2,945.6 3,203.1 2,735.8Selling and administrative costs 562.0 489.5 430.8Restructuring and consolidation costs 41.3 107.3 44.2
3,548.9 3,799.9 3,210.8
Operating Income 361.3 384.6 489.7Interest expense (106.2) (107.8) (107.3)Interest income 32.6 24.1 5.2Other income (expense) – net (18.1) (19.2) (20.6)
Income from continuing operations before income taxes and Trust distributions 269.6 281.7 367.0
Income tax expense (93.2) (94.3) (121.3)Distributions on Trust preferred securities (10.5) (10.5) (10.5)
Income from Continuing Operations 165.9 176.9 235.2Income (loss) from discontinued operations – net of taxes (11.9) 112.3 90.7Cumulative effect of change in accounting (36.1) — —
Net Income $ 117.9 $ 289.2 $ 325.9
Basic Earnings (Loss) per Share:Continuing operations $ 1.60 $ 1.72 $ 2.24Discontinued operations (0.11) 1.08 0.87Cumulative effect of change in accounting (0.35) — —
Net Income $ 1.14 $ 2.80 $ 3.11
Diluted Earnings (Loss) per Share:Continuing operations $ 1.57 $ 1.65 $ 2.16Discontinued operations (0.09) 1.11 0.88Cumulative effect of change in accounting (0.34) — —
Net Income $ 1.14 $ 2.76 $ 3.04
See Notes to Consolidated Financial Statements.
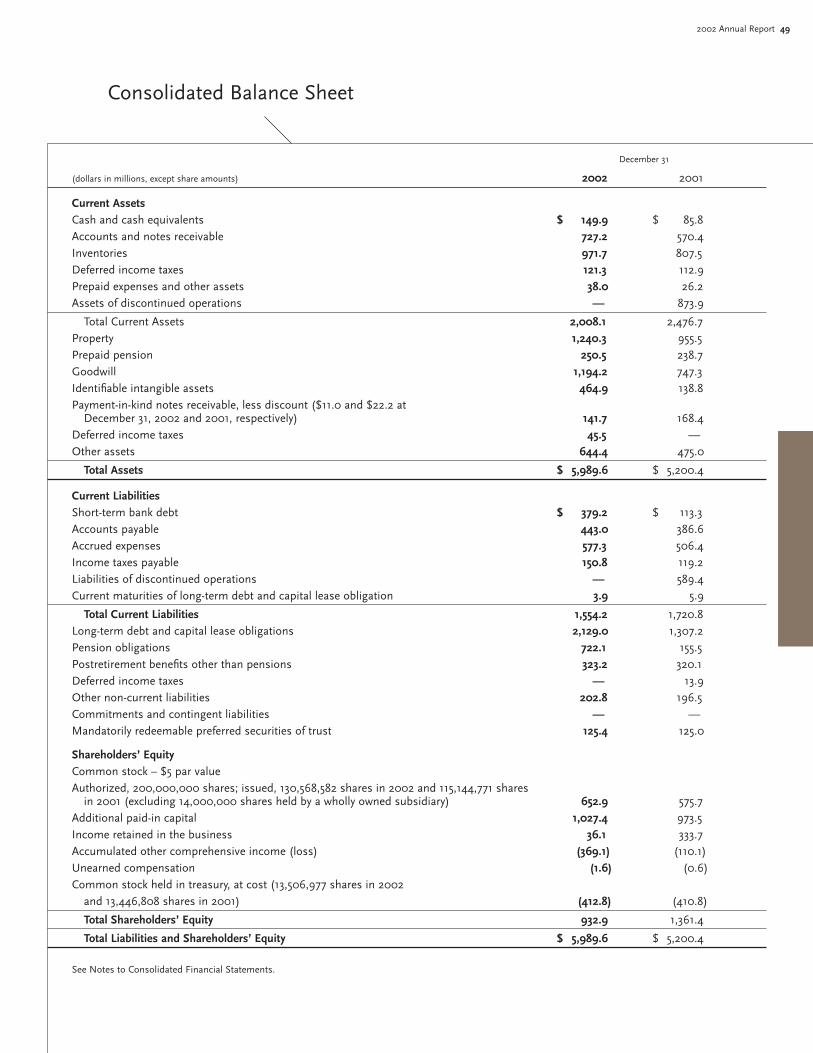
2002 Annual Report 49
Consolidated Balance Sheet
December 31
(dollars in millions, except share amounts) 2002 2001
Current AssetsCash and cash equivalents $ 149.9 $ 85.8Accounts and notes receivable 727.2 570.4Inventories 971.7 807.5Deferred income taxes 121.3 112.9Prepaid expenses and other assets 38.0 26.2Assets of discontinued operations — 873.9
Total Current Assets 2,008.1 2,476.7Property 1,240.3 955.5Prepaid pension 250.5 238.7Goodwill 1,194.2 747.3Identifiable intangible assets 464.9 138.8Payment-in-kind notes receivable, less discount ($11.0 and $22.2 at
December 31, 2002 and 2001, respectively) 141.7 168.4Deferred income taxes 45.5 —Other assets 644.4 475.0
Total Assets $ 5,989.6 $ 5,200.4
Current LiabilitiesShort-term bank debt $ 379.2 $ 113.3Accounts payable 443.0 386.6Accrued expenses 577.3 506.4Income taxes payable 150.8 119.2Liabilities of discontinued operations — 589.4Current maturities of long-term debt and capital lease obligation 3.9 5.9
Total Current Liabilities 1,554.2 1,720.8Long-term debt and capital lease obligations 2,129.0 1,307.2Pension obligations 722.1 155.5Postretirement benefits other than pensions 323.2 320.1Deferred income taxes — 13.9Other non-current liabilities 202.8 196.5Commitments and contingent liabilities — —Mandatorily redeemable preferred securities of trust 125.4 125.0
Shareholders’ EquityCommon stock – $5 par valueAuthorized, 200,000,000 shares; issued, 130,568,582 shares in 2002 and 115,144,771 shares
in 2001 (excluding 14,000,000 shares held by a wholly owned subsidiary) 652.9 575.7Additional paid-in capital 1,027.4 973.5Income retained in the business 36.1 333.7Accumulated other comprehensive income (loss) (369.1) (110.1)Unearned compensation (1.6) (0.6)Common stock held in treasury, at cost (13,506,977 shares in 2002
and 13,446,808 shares in 2001) (412.8) (410.8)
Total Shareholders’ Equity 932.9 1,361.4
Total Liabilities and Shareholders’ Equity $ 5,989.6 $ 5,200.4
See Notes to Consolidated Financial Statements.

50 Goodrich Corporation
Consolidated Statement of Cash Flows
Year Ended December 31
(dollars in millions) 2002 2001 2000
Operating ActivitiesIncome from continuing operations $ 165.9 $ 176.9 $ 235.2Adjustments to reconcile income from continuing operations
to net cash provided by operating activities:Restructuring and consolidation:
Expenses 41.3 107.3 44.2Payments (55.2) (30.3) (57.5)
In-process research and development 12.5 — —Aeronautical Systems inventory step-up 58.8 — —Unusual inventory adjustments. — 94.5 —Depreciation and amortization 183.5 173.8 165.4Deferred income taxes (2.2) 25.3 (33.2)Net gains on sale of businesses (2.5) (7.8) (2.0)Payment-in-kind interest income (23.3) (17.6) —Change in assets and liabilities, net of effects of
acquisitions and dispositions of businesses:Receivables 112.8 21.6 (72.7)Change in receivables sold, net — 46.3 39.2Inventories 57.5 (91.0) (38.7)Other current assets (16.2) (9.6) (31.2)Accounts payable (96.3) 3.1 81.6Accrued expenses (27.7) 24.7 5.1Income taxes payable 129.8 (60.0) 3.9Tax benefit on non-qualified options 0.5 7.7 8.3Other non-current assets and liabilities — (82.3) (179.4)
Net Cash Provided by Operating Activities 539.2 382.6 168.2
Investing ActivitiesPurchases of property (107.3) (190.5) (133.8)Proceeds from sale of property 15.1 2.0 26.4Proceeds from sale of businesses 6.0 18.9 4.8Proceeds from payment-in-kind note 49.8Payments made in connection with acquisitions, net of cash acquired (1,472.6) (119.2) (246.8)
Net Cash Used by Investing Activities (1,509.0) (288.8) (349.4)
Financing ActivitiesIncrease (decrease) in short-term debt, net 264.0 (626.4) 501.3Proceeds from issuance of long-term debt 793.1 4.9 5.0Repayment of long-term debt and capital lease obligations (1.4) (187.0) (14.7)Proceeds from issuance of common stock 220.2 51.4 25.4Purchases of treasury stock (4.9) (47.1) (300.4)Dividends (96.9) (113.7) (117.6)Distributions on Trust preferred securities (10.5) (18.4) (18.4)
Net Cash Provided (Used) by Financing Activities 1,163.6 (936.3) 80.6
Discontinued OperationsNet cash (used) provided by discontinued operations (132.6) 850.7 114.6
Effect of Exchange Rate Changes on Cash and Cash Equivalents 2.9 0.1 (2.9)
Net Increase in Cash and Cash Equivalents 64.1 8.3 11.1Cash and Cash Equivalents at Beginning of Year 85.8 77.5 66.4
Cash and Cash Equivalents at End of Year $ 149.9 $ 85.8 $ 77.5
See Notes to Consolidated Financial Statements.

2002 Annual Report 51
Consolidated Statement of Shareholders’ Equity
UnearnedIncome Accumulated Portion of
Additional Retained Other RestrictedCommon Stock Paid-In in the Comprehensive Stock Treasury
(in millions) Shares Amount Capital Business Income (Loss) Awards Stock Total
Balance December 31, 1999 112,065 $ 560.3 $ 895.8 $ (52.3) $ (41.8) $ (1.2) $ (65.2) $ 1,295.6Net income 325.9 325.9Other comprehensive income (loss):
Unrealized translation adjustments (16.4) (16.4)Minimum pension liability adjustment 0.5 0.5
Total comprehensive income 310.0Employee award programs 1,230 6.2 27.0 5.6 38.8Purchases of stock for treasury (300.4) (300.4)Dividends (per share – $1.10). (115.5) (115.5)
Balance December 31, 2000 113,295 566.5 922.8 158.1 (57.7) (1.2) (360.0) 1,228.5Net income 289.2 289.2Other comprehensive income (loss):
Unrealized translation adjustments net of reclassification adjustments for loss included in net income of $1.0 (3.5) (3.5)
Minimum pension liability adjustment (48.9) (48.9)
Total comprehensive income 236.8Employee award programs 1,850 9.2 50.7 0.6 (0.7) 59.8Purchases of stock for treasury (50.1) (50.1)Dividends (per share – $1.10) (113.6) (113.6)
Balance December 31, 2001 115,145 575.7 973.5 333.7 (110.1) (0.6) (410.8) 1,361.4Net income 117.9 117.9Other comprehensive income (loss):
Unrealized translation adjustments 37.4 37.4Minimum pension liability adjustment (327.8) (327.8)Unrealized gain on cash flow hedges 19.4 19.4
Total comprehensive income (loss) (153.1)Sale of common stock under public
offering, net of expenses 14,950 74.8 141.4 216.2Employee award programs 474 2.4 10.4 (1.0) (2.0) 9.8EnPro spin-off (97.9) (323.2) 12.0 (409.1)Dividends (per share – $0.875) (92.3) (92.3)
Balance December 31, 2002 130,569 $ 652.9 $1,027.4 $ 36.1 $ (369.1) $ (1.6) $ (412.8) $ 932.9
See Notes to Consolidated Financial Statements.

52 Goodrich Corporation
Notes to Consolidated Financial Statements
Note A. Significant Accounting Policies
Basis of Presentation The Consolidated Financial Statements reflectthe accounts of Goodrich Corporation and its majority-owned sub-sidiaries (“the Company” or “Goodrich”). Investments in 20 to 50percent-owned affiliates are accounted for using the equity method.Equity in earnings (losses) from these businesses is included inOther income (expense) – net. Intercompany accounts and transac-tions are eliminated.
As discussed in Note U, the Company’s Performance Materials andEngineered Industrial Products businesses have been accounted foras discontinued operations. Unless otherwise noted, disclosuresherein pertain to the Company’s continuing operations.
Cash Equivalents Cash equivalents consist of highly liquid investmentswith a maturity of three months or less at the time of purchase.
Allowance for Doubtful Accounts The Company evaluates the col-lectibility of trade receivables based on a combination of factors.The Company regularly analyzes significant customer accounts,and, when the Company becomes aware of a specific customer’sinability to meet its financial obligations to the Company, such as inthe case of bankruptcy filings or deterioration in the customer’soperating results or financial position, the Company records a spe-cific reserve for bad debt to reduce the related receivable to theamount the Company reasonably believes is collectible. TheCompany also records reserves for bad debt for all other customersbased on a variety of factors including the length of time the receiv-ables are past due, the financial health of the customer, macroeco-nomic considerations and historical experience. If circumstancesrelated to specific customers change, the Company’s estimates ofthe recoverability of receivables could be further adjusted.
Sale of Accounts Receivable The Company adopted the provisions ofStatement of Financial Accounting Standards No. 140 (SFAS 140),“Accounting for Transfers and Servicing of Financial Assets andExtinguishment of Liabilities” on April 1, 2001. Prior to that, theCompany accounted for the sale of receivables in accordance withSFAS No. 125, “Accounting for Transfers and Servicing of FinancialAssets and Extinguishments of Liabilities.” Trade accounts receiv-able sold are removed from the balance sheet at the time of sale.
Inventories Inventories, other than inventoried costs relating tolong-term contracts, are stated at the lower of cost or market.Certain domestic inventories are valued by the last-in, first-out(LIFO) cost method. Inventories not valued by the LIFO method arevalued principally by the average cost method.
Inventoried costs on long-term contracts include certain preproduc-tion costs, consisting primarily of tooling and design costs and pro-duction costs, including applicable overhead. The costs attributedto units delivered under long-term commercial contracts are basedon the estimated average cost of all units expected to be producedand are determined under the learning curve concept, which antici-
pates a predictable decrease in unit costs as tasks and productiontechniques become more efficient through repetition. This usuallyresults in an increase in inventory (referred to as “excess-over aver-age”) during the early years of a contract.
If in-process inventory plus estimated costs to complete a specificcontract exceeds the anticipated remaining sales value of such con-tract, such excess is charged to current earnings, thus reducinginventory to estimated realizable value.
In accordance with industry practice, costs in inventory includeamounts relating to contracts with long production cycles, some ofwhich are not expected to be realized within one year.
Long-Lived Assets Property, plant and equipment, including amountsrecorded under capital leases, are recorded at cost. Depreciationand amortization is computed principally using the straight-linemethod over the following estimated useful lives: buildings andimprovements, 15 to 40 years; machinery and equipment, 5 to 15years. In the case of capitalized lease assets, amortization is com-puted over the lease term if shorter. Repairs and maintenance costsare expensed as incurred.
Goodwill represents the excess of the purchase price over the fairvalue of the net assets of acquired businesses and was amortized bythe straight-line method, in most cases over 20 to 40 years for allacquisitions completed prior to June 30, 2001. Goodwill amortiza-tion is recorded in cost of sales. Effective July 1, 2001, the Companyadopted the provisions of Statement of Financial AccountingStandards No. 142 “Goodwill and Other Intangible Assets” (SFAS142) applicable to business combinations completed after June 30,2001. Effective January 1, 2002, additional provisions of SFAS 142,relating to business combinations completed prior to June 30, 2001became effective and were adopted. Under the provisions of SFAS142, intangible assets deemed to have indefinite lives and goodwillare not subject to amortization beginning January 1, 2002.
Identifiable intangible assets are recorded at cost, or when acquiredas a part of a business combination, at estimated fair value.These assets include patents and other technology agreements,trademarks, licenses, customer relationships and non-competeagreements. They are generally amortized using the straight-linemethod over estimated useful lives of 5 to 25 years for all acquisi-tions completed prior to June 30, 2001. For acquisitions completedsubsequent to June 30, 2001, identifiable intangible assets areamortized over their useful life using undiscounted cash flows, amethod that reflects the pattern in which the economic benefits ofthe intangible assets are consumed.
Impairments of long-lived assets are recognized when events orchanges in circumstances indicate that the carrying amount of theasset, or related groups of assets, may not be recoverable and theCompany’s estimate of undiscounted cash flows over the assetsremaining estimated useful life are less than the assets carrying

2002 Annual Report 53
value. Measurement of the amount of impairment may be based onan appraisal, market values of similar assets or estimated discount-ed future cash flows resulting from the use and ultimate dispositionof the asset.
Revenue and Income Recognition For revenues not recognized underthe contract method of accounting, the Company recognizes rev-enues from the sale of products at the point of passage of title,which is at the time of shipment. Revenues earned from providingmaintenance service are recognized when the service is complete.
A significant portion of the Company’s sales in the Aerostructuresand Aviation Technical Services Segment are under long-term,fixed-priced contracts, many of which contain escalation clauses,requiring delivery of products over several years and frequently pro-viding the buyer with option pricing on follow-on orders. Sales andprofits on each contract are recognized in accordance with the per-centage-of-completion method of accounting, using theunits-of-delivery method. The Company follows the guidelines ofStatement of Position 81-1 (SOP 81-1), “Accounting for Performanceof Construction-Type and Certain Production-Type Contracts” (thecontract method of accounting) except that the Company’s contractaccounting policies differ from the recommendations of SOP 81-1 inthat revisions of estimated profits on contracts are included in earn-ings under the reallocation method rather than the cumulativecatch-up method.
Profit is estimated based on the difference between total estimatedrevenue and total estimated cost of a contract, excluding that report-ed in prior periods, and is recognized evenly in the current andfuture periods as a uniform percentage of sales value on all remain-ing units to be delivered. Current revenue does not anticipate higheror lower future prices but includes units delivered at actual salesprices. Cost includes the estimated cost of the preproduction effort(primarily tooling and design), plus the estimated cost of manufac-turing a specified number of production units. The specified number of production units used to establish the profit margin ispredicated upon contractual terms adjusted for market forecastsand does not exceed the lesser of those quantities assumed in orig-inal contract pricing or those quantities which the Company nowexpects to deliver in the periods assumed in the original contractpricing. Option quantities are combined with prior orders whenfollow-on orders are released.
The contract method of accounting involves the use of various esti-mating techniques to project costs at completion and includes esti-mates of recoveries asserted against the customer for changes inspecifications. These estimates involve various assumptions andprojections relative to the outcome of future events, including thequantity and timing of product deliveries. Also included are assump-tions relative to future labor performance and rates, and projectionsrelative to material and overhead costs. These assumptions involve
various levels of expected performance improvements. TheCompany reevaluates its contract estimates periodically and reflectschanges in estimates in the current and future periods under thereallocation method.
Included in sales are amounts arising from contract terms that pro-vide for invoicing a portion of the contract price at a date after deliv-ery. Also included are negotiated values for units delivered andanticipated price adjustments for contract changes, claims, escala-tion and estimated earnings in excess of billing provisions, resultingfrom the percentage-of-completion method of accounting. Certaincontract costs are estimated based on the learning curve conceptdiscussed under Inventories above. Included in AccountsReceivables at December 31, 2002 and 2001, were receivableamounts under contracts in progress of $110.1 million and $107.2million, respectively, that represent amounts earned but not billable atthe respective Balance Sheet dates. These amounts become billableaccording to their contract terms, which usually consider the passageof time, achievement of milestones or completion of the project.
Shipping and Handling Shipping and handling costs are recorded incost of sales.
Financial Instruments The Company’s financial instruments includecash and cash equivalents, accounts and notes receivable, foreigncurrency forward contracts, accounts payable and debt. Because oftheir short maturity, the carrying amount of cash and cash equiva-lents, accounts and notes receivable, accounts payable andshort-term bank debt approximates fair value. Fair value oflong-term debt is based on quoted market prices or on rates avail-able to the Company for debt with similar terms and maturities.
The Company accounts for derivative financial instruments in accor-dance with Statement of Financial Accounting Standards No. 133,“Accounting for Derivative Instruments and Hedging Activities”(SFAS 133). Under SFAS 133, derivatives are carried on the BalanceSheet at fair value. The fair value of foreign currency forward con-tracts is based on quoted market prices.
Stock-Based Compensation The Company accounts for stock-basedemployee compensation in accordance with the provisions of APBOpinion No. 25, “Accounting for Stock Issued to Employees,” andrelated interpretations.
Earnings Per Share Earnings per share is computed in accordancewith SFAS No. 128, “Earnings per Share.”
Research and Development Expense The Company performs researchand development under Company-funded programs for commercialproducts, and under contracts with others. Research and develop-ment under contracts with others is performed on both military andcommercial products. Total research and development expendituresfrom continuing operations in 2002, 2001 and 2000 were $236.0

54 Goodrich Corporation
Notes to Consolidated Financial Statements
million, $198.2 million and $186.0 million, respectively. Of theseamounts, $49.0 million, $49.0 million and $50.6 million, respec-tively, were funded by customers. Research and developmentexpense in 2002 includes the $12.5 million of in-process researchand development expense written-off related to the AeronauticalSystems acquisition.
Reclassifications Certain amounts in prior year financial statementshave been reclassified to conform to the current year presentation.
Use of Estimates The preparation of financial statements in con-formity with generally accepted accounting principles requires man-agement to make estimates and assumptions that affect theamounts reported in the financial statements and accompanyingnotes. Actual results could differ from those estimates.
New Accounting StandardsIn June 2001, the FASB issued Statement No. 143 “Accounting forAsset Retirement Obligations” (SFAS 143). SFAS 143 addressesfinancial accounting and reporting for obligations associated withthe retirement of tangible long-lived assets and the associated assetretirement costs. It applies to legal obligations associated with theretirement of long-lived assets that result from the acquisition, con-struction, development and/or the normal operation of a long-livedasset, except for certain obligations of lessees. SFAS 143 is effectivefor financial statements issued for fiscal years beginning after June15, 2002. The Company will adopt SFAS 143 on January 1, 2003. TheCompany does not expect that SFAS 143 will have a material effecton its consolidated financial condition or results of operations.
In October 2001, the FASB issued Statement No. 144 “Accountingfor the Impairment or Disposal of Long-Lived Assets” (SFAS 144).SFAS 144 supersedes FASB Statement No. 121 “Accounting for theImpairment of Long-Lived Assets and for Long-Lived Assets to BeDisposed Of” (SFAS 121); however it retains the fundamental provi-sions of that statement related to the recognition and measurementof the impairment of long-lived assets to be “held and used.” Inaddition, SFAS 144 provides more guidance on estimating cashflows when performing a recoverability test, requires that a long-lived asset (group) to be disposed of other than by sale (e.g. aban-doned) be classified as “held and used” until it is disposed of, andestablishes more restrictive criteria to classify an asset (group) as“held for sale.” SFAS 144 is effective for fiscal years beginning afterDecember 15, 2001. The adoption of SFAS did not have a materialimpact on the Company’s consolidated financial condition or resultsof operations.
In April 2002, the FASB issued Statement No. 145 “Rescission ofFASB Statements No. 4, 44 and 62, amendment of FASB StatementNo. 13 and Technical Corrections” (SFAS 145). SFAS 145 will requiregains and losses on the extinguishments of debt to be classified asincome or loss from continuing operations rather than as extraordi-nary items as previously required under Statement of FinancialStandards No. 4. Extraordinary treatment will be required for certain
extinguishments as provided in APB Opinion No. 30. SFAS 145 alsoamends Statement of Financial Accounting Standards No. 13 torequire certain modifications to capital leases to be treated as a sale-leaseback and modifies the accounting for sub-leases when the orig-inal lessee remains a secondary obligor (or guarantor). SFAS 145 iseffective for financial statements issued after May 15, 2002, and withrespect to the impact of the reporting requirements of changesmade to SFAS 4 for fiscal years beginning after May 15, 2002. Theadoption of the applicable provisions of SFAS 145 did not have aneffect on the Company’s financial statements.
In June 2002, the FASB issued Statement No. 146, “Accounting forCosts Associated with Exit or Disposal Activities” (SFAS 146). SFAS146 nullifies Emerging Issues Task Force Issue No. 94-3 “LiabilityRecognition for Certain Employee Termination Benefits and OtherCosts to Exit an Activity (including Certain Costs Incurred in aRestructuring).” SFAS 146 applies to costs associated with an exitactivity that does not involve an entity newly acquired in a businesscombination or with a disposal activity covered by SFAS 144. SFAS146 is effective for exit or disposal activities that are initiated afterDecember 31, 2002, with earlier application encouraged. TheCompany does not expect that SFAS 146 will have a material effecton its consolidated financial condition or results of operations but itwill impact the timing of charges which could impact comparabilityof results among reporting periods.
During November 2002, the FASB issued Interpretation No. 45“Guarantor’s Accounting and Disclosure Requirements forGuarantees, Including Indirect Guarantees of Indebtedness ofOthers” (FIN 45). FIN 45 requires certain guarantees to be recordedat fair value. The initial recognition and measurement provisions ofFIN 45 are applicable, on a prospective basis, to guarantees issuedor modified after December 31, 2002. FIN 45 also requires a guaran-tor to make significant new disclosures. The disclosure requirementsare effective for financial statements ending after December 15, 2002.
In December 2002, the FASB issued Statement No. 148 “Accountingfor Stock-Based Compensation-Transition and Disclosures” (SFAS148) which amends FASB Statement No. 123 “Accounting for Stock-Based Compensation” (SFAS 123). SFAS 148 provides alternativemethods of transition for a voluntary change to the fair value basedmethod of accounting for stock-based employee compensation. Inaddition, SFAS 148 amends the disclosure requirements of SFAS 123to require more prominent and more frequent disclosures in finan-cial statements about the effects of stock-based compensation. Thetransition guidance and annual disclosure provisions of SFAS 148are effective for fiscal years ending after December 15, 2002. Theinterim disclosure provisions are effective for financial reports con-taining financial statements for interim periods beginning afterDecember 15, 2002.

2002 Annual Report 55
Note B. Acquisitions and Dispositions
AcquisitionsAeronautical SystemsOn October 1, 2002, the Company completed its acquisition of TRWInc.’s Aeronautical Systems businesses (Aeronautical Systems) forapproximately $1.5 billion in cash. The acquisition included the pur-chase of substantially all of the Aeronautical Systems businessesassets and the assumption of certain liabilities as defined in theMaster Agreement of Purchase and Sale. The acquisition has beenaccounted for using the purchase method in accordance withFinancial Accounting Standard No. 141 “Business Combinations.”The acquired businesses design and manufacture commercial andmilitary aerospace systems and equipment, including engine con-trols, flight controls, power systems, cargo systems, hoists andwinches and actuation systems. The businesses enhanced our glob-al operations with approximately 6,200 employees in 22 facilities innine countries, including manufacturing and service operations inthe United Kingdom, France, Germany, Canada, the United Statesand several Asia/Pacific countries. The acquired businesses expand-ed the number of products, systems and services that the Companydelivers to aircraft manufacturers and operators. Because the busi-nesses had previously been operated as one business segment, theCompany will continue to report the results of operations as a sep-arate business segment until the Company’s integration plan iscompleted in 2003. The results of operations of AeronauticalSystems have been included in the Company’s results for the fourthquarter of 2002.
The purchase price payable by the Company to TRW Inc. for theacquisition of the Aeronautical Systems businesses is subject topotential upward or downward adjustment based on the differencebetween the net assets of the businesses on October 1, 2002 andthe net assets of the businesses on May 31, 2002, both calculated inthe manner set forth in the Master Agreement of Purchase and Sale.The purchase price will also be adjusted based on the funding status of certain pension plans and other employee benefit arrange-ments. The above adjustments have not been finalized as ofDecember 31, 2002.
The allocation of the purchase price has been performed based on theassignment of fair values to assets acquired and liabilities assumed.Fair values are based, in part, on appraisals, performed by an inde-pendent appraisal firm, of certain fixed assets and intangible assets.The purchase price allocation has been based on preliminary estimatesand is subject to change. Items that may affect the ultimate purchaseprice allocation include revisions to intangible asset appraisals,finalization of restructuring plans that qualify for accrual in the openingbalance sheet and other information that provides a better estimate ofthe fair value of assets acquired and liabilities assumed.
The following table summarizes the estimated fair values of theassets acquired and liabilities assumed at the date of acquisition.
(in millions)At October 1, 2002
Current assets $ 544.3Property, plant and equipment 312.6In-process research and development 12.5Intangible assets subject to amortization
(17-year weighted-average useful life): Customer relationships
(17-year weighted-average useful life) 230.0Technology
(17-year weighted-average useful life) 81.2Favorable sourcing contracts
(3-year weighted-average useful life) 4.8316.0
Goodwill 500.6Other non-current assets 146.5
Total assets acquired 1,832.5Current liabilities 292.4Non-current liabilities 67.9
Total liabilities assumed 360.3Net assets acquired $ 1,472.2
The goodwill associated with the Aeronautical Systems acquisitionis expected to be fully deductible for tax purposes.
The fair value of in-process research and development (IPR&D) wasdetermined by an independent valuation using the discounted cashflow method, a variation of the income approach. The IPR&D tech-nologies included in the valuation were variable frequency andelectrohydrostatic actuation. The $12.5 million assigned to researchand development assets were written off at the date of acquisitionin accordance with FASB Interpretation No. 4, “Applicability of FASBStatement No. 2 to Business Combinations Accounted for by thePurchase Method.” Those write-offs are included in selling andadministrative expenses.
The following unaudited pro forma financial information presentsthe combined results of operations of Goodrich and AeronauticalSystems as if the acquisition had occurred at the beginning of theperiods presented. The unaudited pro forma financial information isnot intended to represent or be indicative of the consolidatedresults of operations or financial condition that would have beenreported had the acquisition been completed as of the dates pre-sented, and should not be taken as representative of the future con-solidated results of operations or financial condition.
UnauditedYear Ended December 31,
(in millions, except per share amounts) 2002 2001
Sales $ 4,665.7 $ 5,286.3Income from continuing operations $ 179.0 $ 205.3Net income $ 131.0 $ 317.6Diluted earnings per share:
Income from continuing operations $ 1.70 $ 1.92Net income $ 1.26 $ 3.02

56 Goodrich Corporation
Notes to Consolidated Financial Statements
Other AcquisitionsThe following acquisitions were recorded using the purchasemethod of accounting. Their results of operations have been includedin the Company’s results since their respective dates of acquisition.Acquisitions made by businesses included within the PerformanceMaterials and Engineered Industrial Products Segments are not dis-cussed below.
During 2001, the Company acquired a manufacturer of aerospacelighting systems and related electronics, and the assets of a design-er and manufacturer of inertial sensors used for guidance andcontrol of unmanned vehicles and precision-guided systems. Totalconsideration aggregated $113.8 million, of which $102.6 millionrepresented goodwill and other intangible assets.
During 2000, the Company acquired a manufacturer of earth andsun sensors for attitude determination and control ejection seattechnology; a manufacturer of fuel nozzles; a developer of avionicsand displays; the assets of a developer of precision electro-opticalinstrumentation serving the space and military markets; an equityinterest in a joint venture focused on developing and operating acomprehensive open electronic marketplace for aerospace after-market products and services; a manufacturer of precision and largeoptical systems, laser encoding systems, and visual surveillance sys-tems for day and night use and a supplier of pyrotechnic devices forspace, missile, and aircraft systems. Total consideration aggregated$242.6 million, of which $105.4 million represented goodwill andother intangible assets.
The impact of these acquisitions was not material in relation to theCompany’s results of operations. Consequently, pro forma informa-tion is not presented.
DispositionsDuring 2002, the Company sold a business and a minority interestin a business, resulting in a pre-tax gain of $2.5 million, which hasbeen reported in other income (expense) – net.
During 2001, the Company sold a minority interest in a business,resulting in a pre-tax gain of $7.2 million, which has been reportedin other income (expense) – net.
During 2000, the Company sold a product line of one of its busi-nesses, resulting in a pre-tax gain of $2.0 million, which has beenreported in other income (expense) – net.
For dispositions accounted for as discontinued operations refer toNote U to the Consolidated Financial Statements.
Note C. Restructuring and Consolidation Costs
The Company incurred $41.3 million ($27.7 million after-tax), $107.3million ($71.3 million after-tax) and $44.2 million ($28.6 millionafter-tax) of restructuring and consolidation costs in 2002, 2001 and2000, respectively. These charges related to the following segments:
(in millions) 2002 2001 2000
Aerostructures and Aviation Technical Services $ 11.8 $ 35.8 $ 3.6
Landing Systems 1.9 44.7 25.3Engine and Safety Systems 20.3 17.7 1.7Electronic Systems 7.0 6.6 0.5
Total Segment Charges 41.0 104.8 31.1Corporate 0.3 2.5 13.1
$ 41.3 $ 107.3 $ 44.2
Restructuring and consolidation reserves at December 31, 2002, aswell as activity during the year, consisted of:
Balance BalanceDecember 31, December 31,
(in millions) 2001 Provision Activity 2002
Personnel-related costs $ 26.6 $ 31.0 $ (39.9) $ 17.7
Consolidation 18.6 10.3 (23.2) 5.7$ 45.2 $ 41.3 $ (63.1) $ 23.4
ProvisionThe following is a description of key components of the $41.3 mil-lion provision for restructuring and consolidation costs in 2002:
Aerostructures and Aviation Technical Services The segment recorded$11.8 million in restructuring and consolidation costs, consisting of$9.1 million in personnel-related costs and $2.7 million in consoli-dation costs. Of the charge, $0.4 million represents non-cash assetimpairment charges.
The personnel-related charges were for employee severance and forvoluntary termination benefits. During the year, a total of 1,325employees were terminated. The consolidation costs related tomachinery and equipment relocation costs incurred in connectionwith a facility consolidation or closure, which were expensed asincurred, and asset impairment charges of $0.4 million.
Landing Systems The segment recorded $1.9 million in restructuringand consolidation costs, consisting of $1.6 million in personnel-related costs and $0.3 million in consolidation costs. Of the charge,$0.2 million represents non-cash items, including $0.8 million inasset impairments and a reserve reversal of $0.6 million related toa revision of estimated facility closure and consolidation costs.

2002 Annual Report 57
The personnel-related charges are for employee severance and ben-efits. During the year, a total of 263 employees were terminated.Consolidation costs include asset impairment charges of $0.8 mil-lion to write down assets held for sale or disposal based on theirestimated fair value and facility closure costs of $0.1 million forequipment relocation costs, which were expensed as incurred, offsetby the $0.6 million reserve reversal noted above.
Engine and Safety Systems The segment recorded $20.3 million inrestructuring and consolidation costs, consisting of $15.7 million inpersonnel-related costs and $4.6 million in consolidation costs. Ofthe charge, $2.0 million represents non-cash asset impairmentcharges. The personnel-related charges are for employee severanceand benefits. During the year, a total of 707 employees were termi-nated. Consolidation costs include $2.0 million in accelerateddepreciation and facility closure costs of $2.6 million for machineryand equipment relocation, which were expensed as incurred, andother facility closure costs.
Electronic Systems The segment recorded $7.0 million in restructur-ing and consolidation costs, consisting of $4.2 million in personnel-related costs and $2.8 million in consolidation costs. Of the charge,$0.2 million represents a non-cash asset impairment charge.
The personnel-related charges are for employee severance and ben-efits. During the year, a total of 339 employees were terminated.Consolidation costs included $0.2 million in accelerated depreciationand $2.2 million in equipment relocation costs, which were expensedas incurred, in connection with facility closure or consolidation.
Aeronautical Systems The segment established $6.7 million inrestructuring reserves in the opening balance sheet for employeeseverance in the fourth quarter of 2002. During the quarter, a totalof 149 employees were terminated.
Corporate Restructuring and consolidation costs of $0.3 million rep-resented employee outplacement services and relocation costs.
At December 31, 2002, approximately 650 employees remain to beterminated as a result of the restructuring actions described above.
ActivityOf the $63.1 million in activity, $55.2 million represented cash pay-ments. The remaining $7.9 million represented asset write-offs, thereversal of an acquisition-related reserve against goodwill andreclassifications of reserves to other non-current liabilities, offset byacquisition-related reserves that were established through the open-ing balance sheet.
Restructuring and consolidation reserves at December 31, 2001, aswell as activity during the year, consisted of:
PerformanceBalance Materials Balance
December 31, Restructuring December 31,(in millions) 2000 Provision Activity Reserve 2001
Personnel-related costs $ 12.9 $ 35.0 $ (17.6) $ (3.7) $ 26.6 Transaction costs 1.9 — (1.9) — — Consolidation costs 43.4 72.3 (59.4) (37.7) 18.6
$ 58.2 $ 107.3 $ (78.9) $ (41.4) $ 45.2
ProvisionThe following is a description of key components of the $107.3 mil-lion provision for restructuring and consolidation costs in 2001:
Aerostructures and Aviation Technical Services The segment recorded$35.8 million in restructuring and consolidation costs, consisting of$17.3 million in personnel-related costs, $18.1 million in assetimpairments and $0.4 million in facility consolidation and closurecosts. $20.7 million of the charge represents non-cash items,including $2.6 million of pension curtailment charges and $18.1 inasset impairments.
The personnel-related charges are for employee severance and ben-efits for 1,686 employees, 515 of which were terminated in 2001,leaving 1,171 employees to be terminated as of December 31, 2001.Asset impairment charges included $7.8 million to write down
assets held for sale or disposal based on their estimated fair valueand $10.3 million to write-off of long-term collateralized receivablesas a result of a deterioration in the value of the collateral. Facility clo-sure costs related to equipment relocation and a lease termination fee.
Landing Systems The segment recorded $44.7 million in restructur-ing and consolidation costs, consisting of $4.0 million in personnel-related costs (net of $0.3 million revision of prior estimate), $26.4million in asset impairments (net of $1.3 million revision of priorestimate) and $14.3 million in facility consolidation and closurecosts. $26.7 million of the charge represents non-cash items,including $0.6 million of pension curtailment charges and $27.7million in asset impairments, offset by a $1.6 million revision ofprior estimates.

58 Goodrich Corporation
Notes to Consolidated Financial Statements
The personnel-related charges were for employee severance andbenefits for 145 employees, 49 of which were terminated in 2001,leaving 96 employees to be terminated as of December 31, 2001.Asset impairment charges related to the write down of assets heldfor sale or disposal based on their estimated fair value, comprisedprimarily of $25 million, representing the difference between the car-rying value and fair value for rotable assets identified for sale. Facilityclosure costs related to lease termination costs ($2.1 million),equipment relocation ($6.3 million), environmental clean-up ($1.5million) and facility clean-up and preparation for sale ($4.4 million).
Engine and Safety Systems The segment recorded $17.7 million inrestructuring and consolidation costs, consisting of $6.8 million inpersonnel-related costs, $7.7 million in asset impairments and $3.2million in facility consolidation and closure costs. $8.6 million of thecharge represents non-cash items, including $0.9 million of pen-sion curtailment charges and $7.7 million in asset impairments.
The personnel-related charges were for employee severance andbenefits for 801 employees, 235 of which were terminated in 2001,leaving 566 employees to be terminated as of December 31, 2001.Asset impairment charges relate to the write down of assets held forsale or disposal based on their estimated fair value. Facility closurecosts related to lease and contract termination costs and facilityclean-up costs to prepare the facility for sale.
Electronic Systems The segment recorded $6.6 million in restructur-ing and consolidation costs, consisting of $4.1 million in personnel-
related costs and $2.5 million in facility closure and consolidationcosts. $0.3 million of the charge represents a non-cash pension cur-tailment charge.The personnel-related charges were for employee severance andbenefits for 155 employees, 24 of which were terminated in 2001,leaving 131 employees to be terminated as of December 31, 2001.Facility closure and consolidation costs related to lease terminationcosts and equipment relocation.
Corporate Restructuring and consolidation costs were $2.5 million,consisting of employee severance and benefits for 15 employees ter-minated during the period and employee relocation costs and change-in-control benefits associated with the Coltec merger. There were noemployees remaining to be terminated as of December 31, 2001.
ActivityOf the $78.9 million in activity, $30.3 million represented cash pay-ments and $56.8 million represented asset write-offs. Theseamounts were offset by a net increase to the reserve of $8.2 million,principally acquisition-related reserves that were establishedthrough the opening balance sheet.
Approximately $35 million of the $41.4 million of reserves recordedin 2000 for restructuring costs associated with the sale ofPerformance Materials ($35.6 million in asset impairment costs;$2.1 million in consolidation costs; and $3.7 million in severancecosts) were written-off in 2001. The remaining portion of the reserve(approximately $6 million) was assumed by the buyer and accord-ingly written-off against the gain on sale during 2001.
Restructuring and consolidation reserves at December 31, 2000, aswell as activity during the year, consisted of:
PerformanceBalance Materials Balance
December 31, Restructuring December 31,(in millions) 1999 Provision Activity Reserve 200o
Personnel-related costs $ 35.4 $ 16.7 $ (42.9) $ 3.7 $ 12.9Transaction costs 2.0 — (0.1) — 1.9Consolidation costs 6.5 27.5 (28.3) 37.7 43.4
$ 43.9 $ 44.2 $ (71.3) $ 41.4 $ 58.2
ProvisionDuring 2000, the Company recorded net restructuring and consoli-dation costs of $44.2 million consisting of:
• $18.8 million in personnel-related costs (offset by a credit of $2.1million representing a revision of prior estimates) consisting of:
– $9.5 million in settlement charges related to lump sum paymentsmade under a nonqualified pension plan that were triggered bythe Coltec merger.
– $3.3 million in employee relocation costs associated with theColtec merger.
– $6.0 million for work force reductions.
• $27.5 million in consolidation costs consisting of:
– $11.7 million of accelerated depreciation related to assets at theCompany’s Euless, Texas facility whose useful lives had beenreduced as a result of the decision to consolidate the facilitywith the Company’s other landing gear facilities.
– $2.5 million of asset impairment charges representing the excessof the assets’ carrying value over the fair value less costs to sell.
– $13.3 million for realignment activities, of which $6.5 millionrepresented equipment relocation costs and $3.8 million repre-sented facility closure costs associated with the consolidationof the Company’s landing gear businesses. The remaining $3million related to similar costs at various other facilities.

2002 Annual Report 59
ActivityThe $71.3 million in activity during the year included $57.5 millionrelated to cash payments and $13.8 million related to the write-off ofassets and accelerated depreciation.
During negotiations with the buyer of Performance Materials, thebuyer requested that the Company absorb the cost of closing and/orselling certain of the segment’s textile businesses as a condition ofthe sale (the “Textile Consolidation”). These actions included theclosure and/or sale of certain facilities, the sale of certain assets andthe consolidation of certain management functions. The estimatedcosts of these restructuring activities included $35.6 million forasset impairments, $2.1 million for consolidation costs and $3.7million for severance costs.
Since the decision to perform the actions contemplated by theTextile Consolidation was a direct result of the decision to disposeof the Performance Materials segment, the costs associated withthe Textile Consolidation were reflected as an obligation/reserve inthe consolidated Balance Sheet at December 31, 2000. The IncomeStatement effect was deferred and recognized as part of the gain onsale in February 2001.
Note D. Earnings Per Share
The computation of basic and diluted earnings per share for incomefrom continuing operations is as follows:
(In millions, except per share amounts) 2002 2001 2000
Numerator: Numerator for basic and diluted
earnings per share – income from continuing operations $ 165.9 $ 176.9 $ 235.2
Denominator: Denominator for basic
earnings per share – weighted-average share 103.7 103.1 104.8
Effect of dilutive securities: Stock options, employee
stock purchase plan and restricted stock 0.4 0.6 1.0
Performance share plans 0.2 0.3 0.4Convertible preferred securities 1.2 2.9 2.9
Dilutive potential common shares 1.8 3.8 4.3Denominator for diluted
earnings per share – adjusted weighted-average shares andassumed conversion 105.5 106.9 109.1
Per share income from continuing operations:
Basic $ 1.60 $ 1.72 $ 2.24
Diluted $ 1.57 $ 1.65 $ 2.16
At December 31, 2002, the Company had approximately 9.5 millionstock options outstanding (see Note T). Stock options are includedin the diluted earnings per share calculation using the treasury stockmethod, unless the effect of including the stock options would beanti-dilutive. During 2002, 2001 and 2000, there were anti-dilutiveoptions excluded from the diluted earnings per share calculation.
Note E. Sale of Receivables
The Company has an agreement to sell certain trade accountsreceivable, up to a maximum of $140.0 million and $110.0 million atDecember 31, 2002 and 2001, respectively. Receivables of $97.3 mil-lion were sold under this agreement and reflected as a reduction ofAccounts Receivable at December 31, 2002 and 2001. The receiv-ables were sold without recourse and at a discount, which is includedin interest expense.
Continued availability of the securitization is conditioned uponcompliance with covenants, related primarily to operation of thesecuritization, set forth in the related agreements. The Company isin compliance with all such covenants at December 31, 2002. Thesecuritization agreement includes a rating downgrade trigger pur-suant to which the agreement may be terminated upon a downgradeof our credit ratings below BB- by Standard & Poor’s or Ba3 byMoody’s Investor Services. If such an event were to occur, theCompany expects that it would have sufficient capital resourcesthrough existing revolving credit facilities to meet its needs.
During 2000, the Company entered into an agreement to sell certainlong-term receivables. This agreement contained recourse provisionsunder which the Company was required to repurchase receivables incertain events. In the fourth quarter 2001, the Company repur-chased approximately $20 million of these long-term receivables atthe request of the financial institution. In August 2002, theCompany repurchased $20.3 million of receivables as a result of apayment default by the primary obligor and terminated this agreement.
Note F. Payment-In-Kind Notes Receivable
The proceeds from the sale of the Company’s PerformanceMaterials segment included $172 million in debt securities issued bythe buyer in the form of unsecured notes with interest payable incash or payment-in-kind, at the option of the issuer. Payment-in-kindrefers to the issuer’s ability to issue additional debt securities withidentical terms and maturities as the original debt securities asopposed to making interest payments in cash. The notes have aterm of 10.5 years, and bear interest at a rate of 13 percent, whichincreases to 15 percent if cash interest payments do not commenceafter the fifth year.
The Company initially recorded a discount of $21.2 million based ona 14 percent discount rate. In July 2002, the Company entered intoan agreement with Noveon to amend certain provisions of the PIKnotes held by the Company to give Noveon the option to prepay the

60 Goodrich Corporation
Notes to Consolidated Financial Statements
securities at a discount greater than the original discount if they areprepaid on or before February 28, 2003. As a result of prepaymentsmade in June and October 2002, Noveon has prepaid a total of$62.5 million of the outstanding principal of the PIK notes for $49.8million in cash. Because the prepayments did not exceed the origi-nal discount recorded at the inception of the note, no gain or losswas recognized.
Interest income on the notes is recognized using the effective inter-est method and is recorded in Interest Income in the ConsolidatedStatement of Income. The notes are classified as held-to-maturity inaccordance with SFAS No. 115, “Accounting for Certain Investmentsin Debt and Equity Securities”.
The Company does not currently believe a valuation allowance isnecessary. The Company will record a valuation allowance if eventsor changes in circumstances indicate that the carrying amount ofthe notes may not be recoverable. The fair market value of the notesat December 31, 2002 is approximately $140 million.
Note G. Inventories
Inventories consist of the following:
(in millions) 2002 2001
FIFO or average cost (which approximates current costs):Finished products $ 246.2 $ 172.0In process 559.6 504.9Raw materials and supplies 259.0 217.1
1,064.8 894.0Reserve to reduce certain inventories
to LIFO basis (40.3) (42.2)Progress payments and advances (52.8) (44.3)
Total $ 971.7 $ 807.5
Approximately 13 and 15 percent of inventory was valued by the LIFOmethod in 2002 and 2001, respectively.
In-process inventories as of December 31, 2002, which include sig-nificant deferred costs for long-term contracts accounted for undercontract accounting, are summarized by contract as follows (in mil-lions, except quantities which are number of aircraft):
(1)Aircraft Order Status Company Order Status In-Process Inventory
Pre-Production
(3)Firm and Excess-Delivered Unfilled Unfilled (2) Contract Unfilled (4)Year Over-
to Airlines Orders Options Quantity Delivered Orders Complete Production Average Total
717-200 114 40 88 200 117 57 2007 $ 9.1 $ 31.2 $ 40.3Embraer Tailcone 6 112 202 600 13 — 2011 — 18.9 18.9CF34-10 — 30 72 750 — — 2020 — 25.0 25.0Trent 900 — 43 33 267 — — 2019 — 3.4 3.47Q7 — — — 18 — — 2006 — 21.3 21.3Others 120.2 4.2 124.4In-process inventory related
to long-term contracts $ 129.3 $ 104.0 233.3
In-process inventory notrelated to long-termcontracts 326.3Balance at
December 31, 2002 $ 559.6
(1) Represents the aircraft order status as reported by independent sources for the related aircraft and engine option.(2) Represents the number of aircraft used to obtain average unit cost.(3) Represents the number of aircraft for which the Company has firm unfilled orders.(4) The year presented represents the year in which the final production units included in the contract quantity are expected to be delivered. The contract may
continue in effect beyond this date.
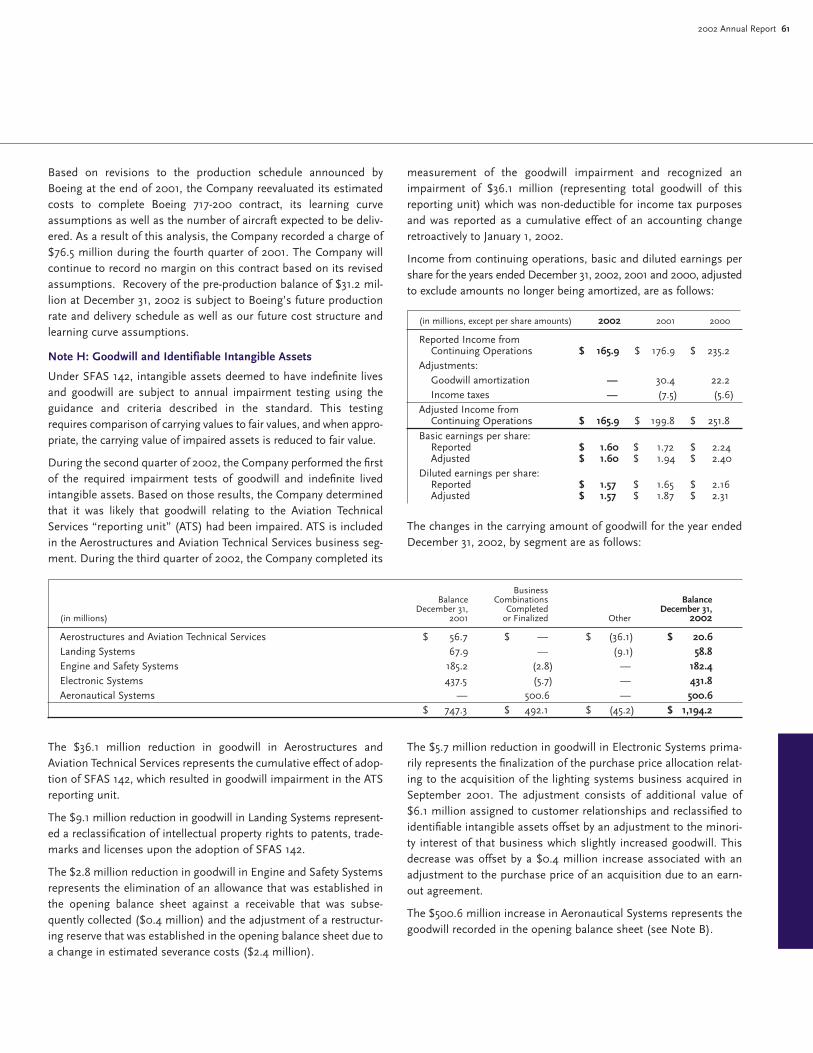
2002 Annual Report 61
Based on revisions to the production schedule announced byBoeing at the end of 2001, the Company reevaluated its estimatedcosts to complete Boeing 717-200 contract, its learning curveassumptions as well as the number of aircraft expected to be deliv-ered. As a result of this analysis, the Company recorded a charge of$76.5 million during the fourth quarter of 2001. The Company willcontinue to record no margin on this contract based on its revisedassumptions. Recovery of the pre-production balance of $31.2 mil-lion at December 31, 2002 is subject to Boeing’s future productionrate and delivery schedule as well as our future cost structure andlearning curve assumptions.
Note H: Goodwill and Identifiable Intangible Assets
Under SFAS 142, intangible assets deemed to have indefinite livesand goodwill are subject to annual impairment testing using theguidance and criteria described in the standard. This testingrequires comparison of carrying values to fair values, and when appro-priate, the carrying value of impaired assets is reduced to fair value.
During the second quarter of 2002, the Company performed the firstof the required impairment tests of goodwill and indefinite livedintangible assets. Based on those results, the Company determinedthat it was likely that goodwill relating to the Aviation TechnicalServices “reporting unit” (ATS) had been impaired. ATS is includedin the Aerostructures and Aviation Technical Services business seg-ment. During the third quarter of 2002, the Company completed its
measurement of the goodwill impairment and recognized animpairment of $36.1 million (representing total goodwill of thisreporting unit) which was non-deductible for income tax purposesand was reported as a cumulative effect of an accounting changeretroactively to January 1, 2002.
Income from continuing operations, basic and diluted earnings pershare for the years ended December 31, 2002, 2001 and 2000, adjustedto exclude amounts no longer being amortized, are as follows:
(in millions, except per share amounts) 2002 2001 2000
Reported Income from Continuing Operations $ 165.9 $ 176.9 $ 235.2
Adjustments: Goodwill amortization — 30.4 22.2Income taxes — (7.5) (5.6)
Adjusted Income from Continuing Operations $ 165.9 $ 199.8 $ 251.8
Basic earnings per share: Reported $ 1.60 $ 1.72 $ 2.24Adjusted $ 1.60 $ 1.94 $ 2.40
Diluted earnings per share: Reported $ 1.57 $ 1.65 $ 2.16Adjusted $ 1.57 $ 1.87 $ 2.31
The changes in the carrying amount of goodwill for the year endedDecember 31, 2002, by segment are as follows:
BusinessBalance Combinations Balance
December 31, Completed December 31,(in millions) 2001 or Finalized Other 2002
Aerostructures and Aviation Technical Services $ 56.7 $ — $ (36.1) $ 20.6Landing Systems 67.9 — (9.1) 58.8Engine and Safety Systems 185.2 (2.8) — 182.4Electronic Systems 437.5 (5.7) — 431.8Aeronautical Systems — 500.6 — 500.6
$ 747.3 $ 492.1 $ (45.2) $ 1,194.2
The $36.1 million reduction in goodwill in Aerostructures andAviation Technical Services represents the cumulative effect of adop-tion of SFAS 142, which resulted in goodwill impairment in the ATSreporting unit.
The $9.1 million reduction in goodwill in Landing Systems represent-ed a reclassification of intellectual property rights to patents, trade-marks and licenses upon the adoption of SFAS 142.
The $2.8 million reduction in goodwill in Engine and Safety Systemsrepresents the elimination of an allowance that was established inthe opening balance sheet against a receivable that was subse-quently collected ($0.4 million) and the adjustment of a restructur-ing reserve that was established in the opening balance sheet due toa change in estimated severance costs ($2.4 million).
The $5.7 million reduction in goodwill in Electronic Systems prima-rily represents the finalization of the purchase price allocation relat-ing to the acquisition of the lighting systems business acquired inSeptember 2001. The adjustment consists of additional value of$6.1 million assigned to customer relationships and reclassified toidentifiable intangible assets offset by an adjustment to the minori-ty interest of that business which slightly increased goodwill. Thisdecrease was offset by a $0.4 million increase associated with anadjustment to the purchase price of an acquisition due to an earn-out agreement.
The $500.6 million increase in Aeronautical Systems represents thegoodwill recorded in the opening balance sheet (see Note B).

62 Goodrich Corporation
Notes to Consolidated Financial Statements
Identifiable intangible assets as of December 31, 2002 are com-prised of:
Gross Accumulated(in millions) Amount Amortization Net
Amortizable intangible assets: Patents, trademarks and
licenses $ 155.3 $ 41.5 $ 113.8 Customer relationships 267.8 5.0 262.8Technology 82.2 0.5 81.7Non-compete agreements 7.8 5.6 2.2Sourcing contracts 4.8 0.4 4.4
$ 517.9 $ 53.0 $ 464.9
Amortization of these intangible assets for the year endedDecember 31, 2002 was $17.0 million. Amortization expense forthese intangible assets is estimated to be approximately $21 millionin 2003 and $22 million per year from 2004 to 2007. There were noindefinite lived identifiable intangible assets as of December 31, 2002.
Note I. Financing Arrangements
Short-Term Bank Debt At December 31, 2002 the Company had$750.0 million in committed global syndicated revolving creditagreements. These credit facilities consist of a $425.0 million three-year agreement expiring in December 2004 and a $325 million 364-day agreement expiring in September 2003. Borrowings under theseagreements bear interest, at the Company’s option, at rates tied tothe agent bank’s prime rate or for U.S. dollar or Great Britain Poundborrowings, the London interbank offered rate, and for Eurodollarborrowings, the EURIBO rate. Under the agreement expiring in2004, the Company is required to pay a facility fee of 17.5 basispoints per annum on the total $425 million committed line. Underthe 364-day agreement, the Company is required to pay a facility feeof 15 basis points per annum on the total $325 million committedline. On these two agreements, if the amount outstanding on theline of credit exceeds 33 percent of the total commitment, a usagefee of 12.5 basis points per annum on the loan outstanding ispayable by the Company. These fees and the interest rate margin onoutstanding revolver borrowings are subject to change as theCompany’s credit ratings change. At December 31, 2002, $155.0 mil-lion was outstanding pursuant to the three-year agreement. Therewere no borrowings under the 364-day agreement at year end.
In addition, the Company had a $200.0 million committed syndi-cated 364-day revolving credit agreement at December 31, 2002, allof which was outstanding as of that date. This credit facility is theremaining commitment and borrowing from the $1.5 billion creditfacility established in July 2002 for the Aeronautical Systems acqui-sition from TRW Inc.. Borrowings under this credit agreement bearinterest, at the Company’s option, at rates tied to the agent bank’sprime rate or the London interbank offered rate. Under the agree-ment, the Company is required to pay a facility fee of 15 basis pointsper annum on the amount of the commitment available at any time.
The Company also maintains $100.0 million of uncommitteddomestic money market facilities and $6.8 million of uncommittedforeign working capital facilities with various banks, of which $83.3million were unused and available at December 31, 2002.
Weighted-average interest rates on short-term borrowings were 2.8percent, 5.8 percent and 6.6 percent during 2002, 2001 and 2000,respectively.
Long-Term Debt At December 31, 2002 and 2001, long-term debt andcapital lease obligations consisted of:
(in millions) 2002 2001
MTN notes payable $ 699.0 $ 699.06.45% senior notes, maturing in 2007 300.0 —7.5% senior notes, maturing in 2008 296.9 300.06.6% senior notes, maturing in 2009 225.6 207.37.625% senior notes, maturing in 2012 500.0 —IDRBs, maturing in 2023, 6.0%. 60.0 60.0Other debt, maturing to 2020
(interest rates from 0.8% to 6.5%) 45.8 37.72,127.3 1,304.0
Capital lease obligation (Note I) 1.7 3.2Total $ 2,129.0 $ 1,307.2
Senior Notes In December 2002, the Company issued $300.0 millionof 6.45 percent senior notes due in 2007 and $500.0 million of 7.625percent senior notes due in 2012. The net proceeds from theissuance of the notes were used to repay a portion of the amountsoutstanding under the $1.5 billion, 364-day credit facility.
At December 31, 2001, the $300.0 million of 7.5 percent senior notesdue in 2008 were obligations of Coltec. In May 2002, the Companyissued $296.9 million aggregate principal amount of 7.5 percent sen-ior notes due in 2008 in exchange for a like principal amount ofColtec’s 7.5 percent senior notes due in 2008. All $296.9 million ofColtec senior notes acquired by the Company in the exchange offerwere sold to Coltec and thereafter cancelled. The remaining $3.1 mil-lion of outstanding Coltec senior notes remain outstanding as theobligation of Coltec, which is now a wholly owned subsidiary of EnPro.
In 1999, the Company issued $200.0 million of 6.6 percent seniornotes due in 2009. The Company entered into a fixed-to-floatinginterest rate swap to manage the interest rate exposure associatedwith these notes. In September 2002, the interest rate swap, whichwas accounted for as a fair value hedge, was terminated. At termi-nation, the Company received $29.4 million, comprised of a $2.6million receivable representing the amount owed on the interestrate swap from the previous settlement date and $26.8 million rep-resenting the fair value of the interest rate swap at the time of ter-mination. The carrying amount of the notes was increased by $26.8

2002 Annual Report 63
million representing the change in fair value of the debt due tochanges in interest rates for the period hedged. This amount will beamortized as a reduction to interest expense over the remainingterm of the debt.
MTN Notes Payable The Company has periodically issued long-termdebt securities in the public markets through a medium-term noteprogram (referred to as the MTN program), which commenced in1995. MTN notes outstanding at December 31, 2002, consistedentirely of fixed-rate non-callable debt securities. All MTN notes out-standing were issued between 1995 and 1998, with interest ratesranging from 6.5 percent to 8.7 percent and maturity dates rangingfrom 2008 to 2046.
IDRBs The industrial development revenue bonds maturing in 2023were issued to finance the construction of a hangar facility in 1993.Property acquired through the issuance of these bonds secures therepayment of the bonds.
Aggregate maturities of long-term debt, exclusive of capital leaseobligations, during the five years subsequent to December 31, 2002,are as follows (in millions): 2003 – $2.1; 2004 – $2.5; 2005 – $2.3;2006 – $3.3 and 2007 – $301.5.
The Company’s debt agreements contain various restrictivecovenants that, among other things, place limitations on the pay-ment of cash dividends and the repurchase of the Company’s capi-tal stock. Under the most restrictive of these agreements, $384.2million of income retained in the business and additional capitalwas free from such limitations at December 31, 2002.
Note J. Lease Commitments
The Company leases certain of its office and manufacturing facilitiesas well as machinery and equipment under various leasing arrange-ments. The future minimum lease payments from continuing oper-ations, by year and in the aggregate, under capital leases and undernoncancelable operating leases with initial or remaining noncance-lable lease terms in excess of one year, consisted of the following atDecember 31, 2002:
NoncancelableCapital Operating
(in millions) Leases Leases
2003 $ 2.0 $ 40.42004 1.5 33.52005 0.4 26.62006 — 19.62007 — 16.1Thereafter — 88.5Total minimum payments 3.9 $ 224.7
Amounts representing interest (0.4)Present value of net minimum lease payments 3.5Current portion of capital lease obligations (1.8)Total $ 1.7
Net rent expense from continuing operations consisted of thefollowing:
(in millions) 2002 2001 2000
Minimum rentals $ 42.1 $ 31.3 $ 28.5Contingent rentals 0.2 1.6 1.7Sublease rentals (0.2) (0.1) (0.1)Total $ 42.1 $ 32.8 $ 30.1
Note K. Pensions and Postretirement Benefits
The Company has several defined benefit pension plans coveringeligible employees. Plans covering salaried employees generally pro-vide benefit payments using a formula that is based on an employ-ee’s compensation and length of service. Plans covering hourlyemployees generally provide benefit payments of stated amounts foreach year of service. The Company also sponsors several unfundeddefined benefit postretirement plans that provide certain health-careand life insurance benefits to eligible employees. The health-careplans are contributory, with retiree contributions adjusted periodi-cally, and contain other cost-sharing features, such as deductibles andcoinsurance. The life insurance plans are generally noncontributory.
The Company’s general funding policy for qualified pension plans isto contribute amounts at least sufficient to satisfy regulatory fundingstandards. Assets for these plans consist principally of investmentsin U.S. and international equities, government and corporate bondsand real estate. At December 31, 2002, the pension plans held 2.0million shares of the Company’s common stock with a fair value of$36.8 million.
Amortization of unrecognized transition assets and liabilities, priorservice cost and gains and losses (if applicable) are recorded usingthe straight-line method over the average remaining service periodof active employees, or approximately 12 years.

64 Goodrich Corporation
Notes to Consolidated Financial Statements
PensionsThe following table sets forth the status of the Company’s definedbenefit pension plans as of December 31, 2002 and 2001, and theamounts recorded in the Consolidated Balance Sheet at these dates.The pension benefits related to discontinued operations retained bythe Company are included in the amounts below.
U.S. Plans Non-U.S. Plans(in millions) 2002 2001 2002 2001
Change in Projected Benefit ObligationsProjected benefit obligation at beginning of year $ 1,930.2 $ 1,962.9 $ 30.3 $ 24.6Service cost 30.9 27.1 6.1 1.4Interest cost 147.7 142.6 6.8 1.8Amendments 14.5 4.2 — —Actuarial (gains) losses 170.0 (34.9) (29.9) 1.8Participant contributions — — 2.0 0.8Acquisitions (divestitures)/other 71.8 0.4 332.3 1.9Curtailment/settlement — — (0.4) —Foreign currency translation — — 10.2 (1.1)Benefits paid (184.3) (172.1) (1.8) (0.9)Projected benefit obligation at end of year $ 2,180.8 $ 1,930.2 $ 355.6 $ 30.3Change in Plan AssetsFair value of plan assets at beginning of year $ 1,815.0 $ 2,083.2 $ 27.6 $ 27.7Actual return on plan assets (86.1) (104.7) 6.4 (0.7)Acquisitions (divestitures)/other 38.8 — 314.8 —Participant contributions — — 2.0 0.8Company contributions. 43.3 8.6 4.1 1.9Foreign currency translation — — 10.2 (1.2)Benefits paid (184.3) (172.1) (1.8) (0.9)Fair value of plan assets at end of year $ 1,626.7 $ 1,815.0 $ 363.3 $ 27.6Funded Status (Underfunded)Funded status $ (554.1) $ (115.2) $ 7.7 $ (2.7)Unrecognized net actuarial (gain) loss 660.2 250.7 (24.8) 4.4Unrecognized prior service cost 49.0 41.9 0.4 0.5Unrecognized net transition obligation — 1.5 (0.1) (0.1)Prepaid (accrued) benefit cost $ 155.1 $ 178.9 $ (16.8) $ 2.1Amounts Recognized in the Statement of Financial Position Consist Of:Prepaid benefit cost $ 249.4 $ 238.7 $ 2.7 $ 3.5Intangible asset 48.1 22.8 0.3 —Accumulated other comprehensive (income) loss 584.4 79.5 1.0 —Additional minimum liability (632.5) (102.3) (1.3) —Accrued benefit liability (94.3) (59.8) (19.5) (1.4)Net amount recognized $ 155.1 $ 178.9 $ (16.8) $ 2.1Weighted-Average Assumptions as of December 31 Discount rate 6.875% 7.50% 6.04% 6.73%Expected return on plan assets(1) 9.25% 9.25% 8.46% 7.79%Rate of compensation increase. 3.86% 4.06% 3.27% 3.69%(1) Effective January 1, 2003, the expected return on plan assets was changed to 9.0% for U.S. plans.
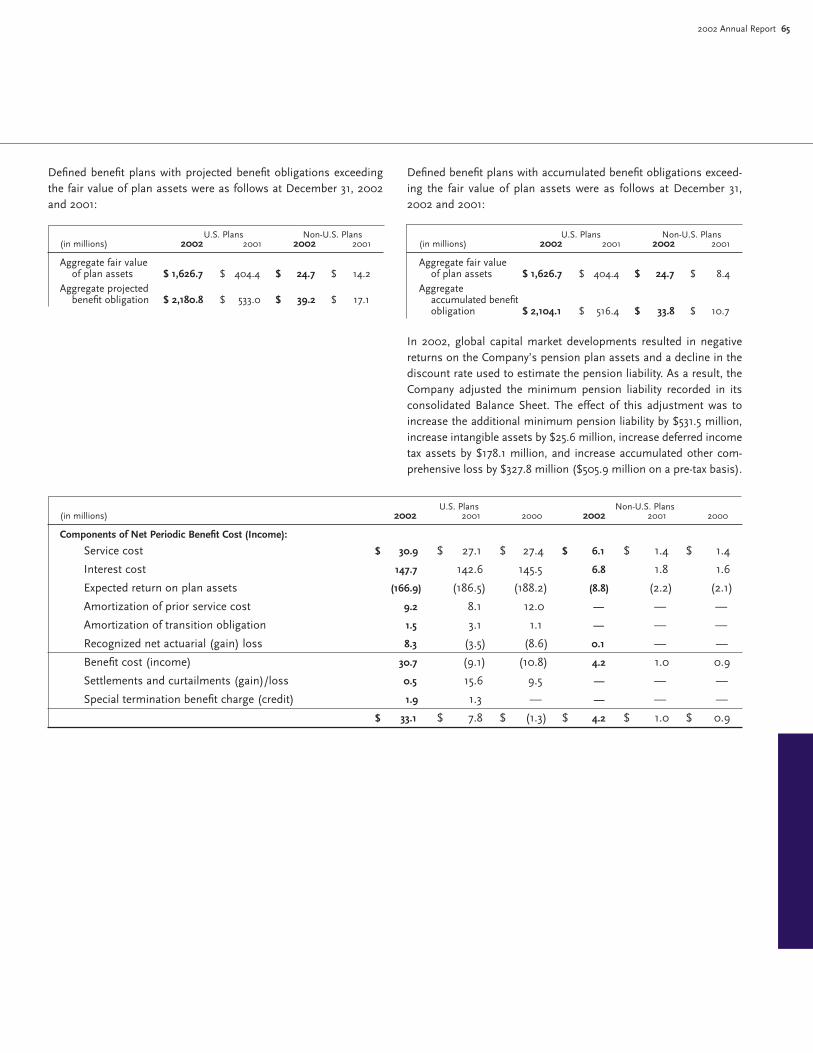
2002 Annual Report 65
Defined benefit plans with projected benefit obligations exceedingthe fair value of plan assets were as follows at December 31, 2002and 2001:
U.S. Plans Non-U.S. Plans(in millions) 2002 2001 2002 2001
Aggregate fair value of plan assets $ 1,626.7 $ 404.4 $ 24.7 $ 14.2
Aggregate projected benefit obligation $ 2,180.8 $ 533.0 $ 39.2 $ 17.1
Defined benefit plans with accumulated benefit obligations exceed-ing the fair value of plan assets were as follows at December 31,2002 and 2001:
U.S. Plans Non-U.S. Plans(in millions) 2002 2001 2002 2001
Aggregate fair value of plan assets $ 1,626.7 $ 404.4 $ 24.7 $ 8.4
Aggregate accumulated benefitobligation $ 2,104.1 $ 516.4 $ 33.8 $ 10.7
In 2002, global capital market developments resulted in negativereturns on the Company’s pension plan assets and a decline in thediscount rate used to estimate the pension liability. As a result, theCompany adjusted the minimum pension liability recorded in itsconsolidated Balance Sheet. The effect of this adjustment was toincrease the additional minimum pension liability by $531.5 million,increase intangible assets by $25.6 million, increase deferred incometax assets by $178.1 million, and increase accumulated other com-prehensive loss by $327.8 million ($505.9 million on a pre-tax basis).
U.S. Plans Non-U.S. Plans(in millions) 2002 2001 2000 2002 2001 2000
Components of Net Periodic Benefit Cost (Income):
Service cost $ 30.9 $ 27.1 $ 27.4 $ 6.1 $ 1.4 $ 1.4
Interest cost 147.7 142.6 145.5 6.8 1.8 1.6
Expected return on plan assets (166.9) (186.5) (188.2) (8.8) (2.2) (2.1)
Amortization of prior service cost 9.2 8.1 12.0 — — —
Amortization of transition obligation 1.5 3.1 1.1 — — —
Recognized net actuarial (gain) loss 8.3 (3.5) (8.6) 0.1 — —
Benefit cost (income) 30.7 (9.1) (10.8) 4.2 1.0 0.9
Settlements and curtailments (gain)/loss 0.5 15.6 9.5 — — —
Special termination benefit charge (credit) 1.9 1.3 — — — —
$ 33.1 $ 7.8 $ (1.3) $ 4.2 $ 1.0 $ 0.9
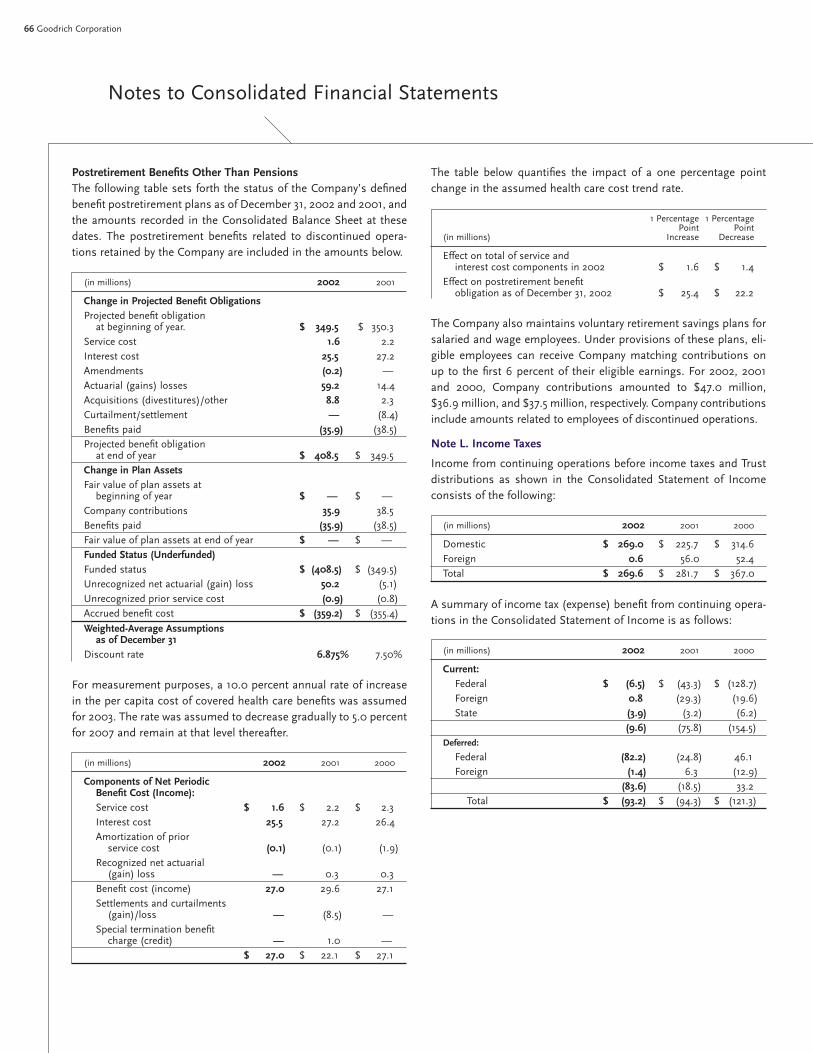
66 Goodrich Corporation
Notes to Consolidated Financial Statements
Postretirement Benefits Other Than PensionsThe following table sets forth the status of the Company’s definedbenefit postretirement plans as of December 31, 2002 and 2001, andthe amounts recorded in the Consolidated Balance Sheet at thesedates. The postretirement benefits related to discontinued opera-tions retained by the Company are included in the amounts below.
(in millions) 2002 2001
Change in Projected Benefit ObligationsProjected benefit obligation
at beginning of year. $ 349.5 $ 350.3Service cost 1.6 2.2Interest cost 25.5 27.2Amendments (0.2) —Actuarial (gains) losses 59.2 14.4Acquisitions (divestitures)/other 8.8 2.3Curtailment/settlement — (8.4)Benefits paid (35.9) (38.5)Projected benefit obligation
at end of year $ 408.5 $ 349.5Change in Plan Assets Fair value of plan assets at
beginning of year $ — $ —Company contributions 35.9 38.5Benefits paid (35.9) (38.5)Fair value of plan assets at end of year $ — $ —Funded Status (Underfunded)Funded status $ (408.5) $ (349.5)Unrecognized net actuarial (gain) loss 50.2 (5.1)Unrecognized prior service cost (0.9) (0.8)Accrued benefit cost $ (359.2) $ (355.4)
Weighted-Average Assumptions as of December 31
Discount rate 6.875% 7.50%
For measurement purposes, a 10.0 percent annual rate of increasein the per capita cost of covered health care benefits was assumedfor 2003. The rate was assumed to decrease gradually to 5.0 percentfor 2007 and remain at that level thereafter.
(in millions) 2002 2001 2000
Components of Net Periodic Benefit Cost (Income):Service cost $ 1.6 $ 2.2 $ 2.3Interest cost 25.5 27.2 26.4Amortization of prior
service cost (0.1) (0.1) (1.9)Recognized net actuarial
(gain) loss — 0.3 0.3Benefit cost (income) 27.0 29.6 27.1Settlements and curtailments
(gain)/loss — (8.5) —Special termination benefit
charge (credit) — 1.0 —$ 27.0 $ 22.1 $ 27.1
The table below quantifies the impact of a one percentage pointchange in the assumed health care cost trend rate.
1 Percentage 1 PercentagePoint Point
(in millions) Increase Decrease
Effect on total of service and interest cost components in 2002 $ 1.6 $ 1.4
Effect on postretirement benefit obligation as of December 31, 2002 $ 25.4 $ 22.2
The Company also maintains voluntary retirement savings plans forsalaried and wage employees. Under provisions of these plans, eli-gible employees can receive Company matching contributions onup to the first 6 percent of their eligible earnings. For 2002, 2001and 2000, Company contributions amounted to $47.0 million,$36.9 million, and $37.5 million, respectively. Company contributionsinclude amounts related to employees of discontinued operations.
Note L. Income Taxes
Income from continuing operations before income taxes and Trustdistributions as shown in the Consolidated Statement of Incomeconsists of the following:
(in millions) 2002 2001 2000
Domestic $ 269.0 $ 225.7 $ 314.6Foreign 0.6 56.0 52.4Total $ 269.6 $ 281.7 $ 367.0
A summary of income tax (expense) benefit from continuing opera-tions in the Consolidated Statement of Income is as follows:
(in millions) 2002 2001 2000
Current: Federal $ (6.5) $ (43.3) $ (128.7)Foreign 0.8 (29.3) (19.6)State (3.9) (3.2) (6.2)
(9.6) (75.8) (154.5)Deferred:
Federal (82.2) (24.8) 46.1Foreign (1.4) 6.3 (12.9)
(83.6) (18.5) 33.2Total $ (93.2) $ (94.3) $ (121.3)

2002 Annual Report 67
Significant components of deferred income tax assets and liabilitiesat December 31, 2002 and 2001, are as follows:
(in millions) 2002 2001
Deferred income tax assets:Accrual for postretirement benefits
other than pensions $ 159.2 $ 144.1Inventories 69.2 57.0Other nondeductible accruals 37.5 41.4Tax credit and net operating loss carryovers 37.1 37.1Employee benefits plans 11.6 4.6Pensions 170.7 1.8Other 62.1 92.0
Total deferred income tax assets. 547.4 378.0Deferred income tax liabilities:
Tax over book depreciation. (91.4) (73.5)Tax over book intangible amortization (75.7) (65.6)Tax over book interest expense (84.9) (82.2)Other (128.6) (57.7)
Total deferred income tax liabilities (380.6) (279.0)Net Deferred Income Tax Asset $ 166.8 $ 99.0
Management has determined, based on the Company’s history ofprior earnings and its expectations for the future, that taxableincome of the Company will more likely than not be sufficient torecognize fully these net deferred tax assets. In addition, manage-ment’s analysis indicates that the turnaround periods for certain ofthese assets are for long periods of time or are indefinite. In partic-ular, the turnaround of the largest deferred tax asset related to theaccrual for postretirement benefits other than pensions will occurover an extended period of time and, as a result, will be realized fortax purposes over those future periods. The tax credit and netoperating loss carryovers, principally relating to Rohr, are primarilycomprised of federal net operating loss carryovers of $62.8 million,which expire in the years 2005 through 2013, and investment taxcredit and other credits of $15.1 million, which expire in theyears 2003 through 2014. The remaining deferred tax assets andliabilities approximately match each other in terms of timing and amounts and should be realizable in the future, given theCompany’s operating history.
The effective income tax rate from continuing operations variedfrom the statutory federal income tax rate as follows:
Percent of IncomePretax
2002 2001 2000
Statutory federal income tax rate 35.0% 35.0% 35.0%Amortization of nondeductible
goodwill — 1.4 0.7Credits — (0.5) (0.4)State and local taxes 0.9 0.7 1.1Tax exempt income from
foreign sales corporation (5.7) (6.7) (3.8)Trust distributions (1.4) (1.3) (1.0)Repatriation of non-U.S. earnings 3.1 0.9 (0.4)In-process research and development 1.6 — —Other items 1.1 4.0 1.9Effective income tax rate 34.6% 33.5% 33.1%
The Company has not provided for U.S. federal and foreignwithholding taxes on $244.3 million of foreign subsidiaries’ undis-tributed earnings as of December 31, 2002, because such earningsare intended to be reinvested indefinitely. It is not practical to deter-mine the amount of income tax liability that would result had suchearnings actually been repatriated. On repatriation, certain foreigncountries impose withholding taxes. The amount of withholding taxthat would be payable on remittance of the entire amount of undis-tributed earnings would approximate $19.8 million.
Note M. Business Segment Information
Due to the acquisition of Aeronautical Systems from TRW in 2002,the spin-off of the Engineered Industrial Products segment in 2002,and the sale of the Performance Materials segment in 2001, theCompany redefined its segments. The Company’s operations arenow classified into five business segments: Aerostructures andAviation Technical Services, Landing Systems, Engine and SafetySystems, Electronic Systems and Aeronautical Systems.Accordingly, the Company has reclassified all periods based on itsrevised segment reporting.
Aerostructures and Aviation Technical ServicesThe core products of the Company’s Aerostructures division arenacelles, pylons, thrust reversers and related aircraft engine housingcomponents. The Company is a leading worldwide supplier ofnacelles, which are the aerodynamic structures that surroundengines, and pylons, which are the engine-to-wing structures thatsupport engines and provide the critical connective conduit for fueldelivery and numerous engine-driven aircraft systems. In addition,the Company manufactures a range of specialized aerostructures,including lightweight, temperature-resistant auxiliary power unittailcones for jetliners, corrosion-resistant structures for tactical mil-itary aircraft, and rigid cargo barriers for freighter aircraft. TheCompany also manufactures a variety of galley, wing, nacelle, thrustreverser, flight control surface and assembly components for out-of-production aircraft.
68 Goodrich Corporation
Notes to Consolidated Financial Statements
Through the Aviation Technical Services division, the Company serv-ices approximately 550 aircraft each year and is among the largestindependent providers of maintenance, repair, overhaul and modifi-cation services in the world. Services provided by the Company’sAviation Technical Services division range from the repair of indi-vidual components and systems to heavy maintenance and modifi-cations of large commercial aircraft and business jet aircraft. TheCompany performs comprehensive total aircraft maintenance,repair, overhaul and modification for many commercial airlines,independent operators, aircraft leasing companies and airfreightcarriers.
Landing SystemsThe Company’s Landing Systems segment provides systems andcomponents related to aircraft taxi, take-off, landing and stopping.Several divisions within this segment are linked by their ability tocontribute to the integration, design, manufacture and service ofentire aircraft undercarriage systems, including landing gear, wheelsand brakes, and certain brake controls. The Company differentiatesitself from component suppliers by providing integrated systems,delivered as completely pre-assembled units to airframe manufac-turers. The Company also provides complete repair and overhaulservices for landing gear, wheels and brakes. In addition, throughthe Company’s engineered polymer products division, the Companydesigns and produces components made from proprietary, high-performance composite material systems used in naval ships andsubmarines to improve acoustic characteristics and reduce radarsignature of exposed superstructures.
Engine and Safety SystemsThe Company’s Engine and Safety Systems segment produces avariety of products used in engine systems, including fuel deliverysystems, electronic and mechanical controls, pumps, meteringdevices, manifolds and rotating components such as disks, blisks,shafts and airfoils for both areospace and industrial gas turbineapplications. The segment also provides evacuation systems suchas slides and floats and seats for pilots, observers and flight atten-dants. The Company’s de-icing and specialty systems division produces ice protection systems for general aviation, heating andrelated systems for large commercial transport aircraft, and potablewater systems for regional and business aircraft. The Company alsosupplies electrothermal ice protection systems for airframe,propeller and helicopter rotor applications and specialty heatingsystems, water heaters and other internal and external heated com-ponents for large commercial transport aircraft. Through theCompany’s propulsion systems division, the Company providesresearch, design, development, qualifications and manufacture ofadvanced aircrew escape systems. The Company also suppliesindividual components such as rocket motors and catapults,pyrotechnic gas generators, ejection seats, precision electro-explosivedevices, propellants, linear actuators, and safety and arming devices.
Electronic SystemsThe Company’s Electronic Systems segment produces a wide arrayof products that provide flight performance measurements, flightmanagement, and control and safety data. The Company supplies avariety of high-performance sensor systems, such as stall warningsystems and systems that measure, manage and/or monitor aircraftfuel; oil debris; engine, transmission and structural health; and air-craft motion and control. The Company also supplies a variety ofavionics systems and other instruments, including warning anddetection systems, ice detection systems, test equipment, aircraftlighting systems, landing gear cables and harnesses, satellite con-trol, data management and payload systems, launch and missiletelemetry systems, airborne reconnaissance systems and laserwarning systems. In addition, the Company’s optical and space sys-tems division designs and builds high-performance, custom-engi-neered electronics, optics and electro-optical products for defense,aerospace, scientific and commercial applications. The Companyalso produces directional surveying equipment for use by compa-nies operating in petroleum, mining and utility industries.
Aeronautical SystemsAeronautical Systems manufactures highly engineered systems andequipment in the following product groups:
• Engine controls This product group consists of engine control sys-tems and components for jet engines used on commercial andmilitary aircraft, including fuel metering controls, fuel pumpingsystems, electronic control software and hardware, variablegeometry actuation controls, afterburner fuel pump and meteringunit nozzles, and engine health monitoring systems.
• Flight controls This product group includes actuators for primaryflight control systems that operate elevators, ailerons and rud-ders, as well as secondary flight controls systems such as flapsand slats.
• Power systems This product group consists of systems that pro-duce and control electrical power for commercial and military air-craft, including electric generators for both main and back-upelectrical power, electric starters, and electric starter generatingsystems, as well as power management and distribution systems.
• Cargo systems This product group consists of fully-integratedmain deck and lower lobe cargo systems for wide body aircraft.
• Hoists and winches This product group consists of airborne hoistsand winches used on both helicopters and fixed wing aircraft.
• Actuation systems This product group consists of systems thatcontrol the movement of steering systems for missiles as well aselectro-mechanical systems that are characterized by high power,low weight, low maintenance, resistance to extreme temperaturesand vibrations, and high reliability.

2002 Annual Report 69
Segment operating income is total segment revenue reduced byoperating expenses identifiable with that business segment, exceptthat in-process research and development, the AeronauticalSystems inventory step-up, restructuring and consolidation costs,and unusual inventory adjustments are presented separately.Unusual inventory adjustments are classified within cost of salesand relate primarily to inventory adjustments associated with reduc-ing the Company’s investment in the Boeing 717 program and in itsSuper 27 re-engining program due to reduced expectations for theseprograms. The reduced expectations for the Boeing 717 programrelate directly to Boeing’s announced production schedule reduc-tions for this program during the fourth quarter of 2001, while theSuper 27 reduction in expectations was primarily due to deteriorat-ing economic conditions and the September 11th terrorist attacks.
The accounting policies of the reportable segments are the same asthose for the consolidated Company. There are no significant inter-segment sales.
(in millions) 2002 2001 2000
SalesAerostructures and
Aviation Technical Services $ 1,176.9 $ 1,493.6 $ 1,427.0Landing Systems 1,038.2 1,149.1 1,057.7Engine and Safety Systems 638.8 762.6 644.4Electronic Systems 791.9 779.2 571.4Aeronautical Systems 264.4 — —
Total Sales $ 3,910.2 $ 4,184.5 $ 3,700.5
Operating IncomeAerostructures and Aviation
Technical Services $ 169.9 $ 226.0 $ 209.6Landing Systems 140.1 153.1 149.0Engine and Safety Systems 79.2 131.9 117.5Electronic Systems 135.3 133.1 117.5Aeronautical Systems 8.4 — —
532.9 644.1 593.6Corporate General and
Administrative Expenses (59.0) (57.7) (59.7)Restructuring and
Consolidation Costs (41.3) (107.3) (44.2)In-process research and
development written off (12.5) — —Aeronautical System
inventory step-up (58.8) — —Unusual Inventory Adjustments — (94.5) —
Total Operating Income $ 361.3 $ 384.6 $ 489.7
Special ItemsAerostructures and Aviation
Technical Services $ 11.8 $ 130.3 $ 3.6Landing Systems 1.9 44.7 25.3Engine and Safety Systems 20.3 17.7 1.7Electronic Systems 7.0 6.6 0.5Aeronautical Systems 71.3 — —
Total Segment Special Items $ 112.3 $ 199.3 $ 31.1
(in millions) 2002 2001 2000
AssetsAerostructures and Aviation
Technical Services $ 1,135.7 $ 1,176.6 $ 1,216.6Landing Systems 891.8 949.0 935.8Engine and Safety Systems 486.2 529.7 516.6Electronic Systems 927.5 1,013.9 843.4Aeronautical Systems 1,785.1 — —Assets of Discontinued
Operations — 873.9 2,044.0Corporate 763.3 657.3 495.9
Total Assets $ 5,989.6 $ 5,200.4 $ 6,052.3
Capital ExpendituresAerostructures and Aviation
Technical Services $ 28.8 $ 64.9 $ 38.8Landing Systems 34.0 62.3 42.5Engine and Safety Systems 13.0 30.4 26.9Electronic Systems 10.5 23.4 11.7Aeronautical Systems 14.2 — —Corporate 6.8 9.5 13.9
Total Capital Expenditures $ 107.3 $ 190.5 $ 133.8
Depreciation and Amortization Expense
Aerostructures and AviationTechnical Services $ 51.4 $ 46.8 $ 43.9
Landing Systems 55.9 53.9 64.8Engine and Safety Systems 26.8 29.2 24.5Electronic Systems 30.3 41.7 31.5Aeronautical Systems 16.2 — —Corporate 2.9 2.2 0.7
Total Depreciation and Amortization $ 183.5 $ 173.8 $ 165.4
Geographic Areas Net SalesUnited States $ 2,473.2 $ 2,693.5 $ 1,872.7Canada 157.3 177.4 166.5Europe(1) 914.4 938.5 1,043.9Other Foreign 365.3 375.1 617.4
Total $ 3,910.2 $ 4,184.5 $ 3,700.5
PropertyUnited States $ 839.3 $ 839.5 $ 818.4Canada 63.0 65.9 53.0Europe 317.1 42.6 20.3Other Foreign 20.9 7.5 5.3
Total $ 1,240.3 $ 955.5 $ 897.0
(1) In 2002, sales to customers in Great Britain and France represented 38percent and 33 percent, respectively, of sales to customers in Europe.Sales were allocated to geographic areas based on the country to whichthe product was shipped.

70 Goodrich Corporation
Notes to Consolidated Financial Statements
In 2002, 2001 and 2000, direct and indirect sales to Boeing totaled20 percent, 23 percent and 23 percent, respectively, of consolidatedsales. In 2002, 2001 and 2000, direct and indirect sales to Airbustotaled 13 percent of consolidated sales. In 2002, 2001 and 2000,direct and indirect sales to the U.S. government totaled 20 percent,16 percent and 9 percent, respectively, of consolidated sales.
Effective January 1, 2003, the Company reorganized into three busi-ness segments: Airframe Systems, Engine Systems and ElectronicSystems. The Company will begin reporting financial results underthe new segment structure beginning with the first quarter of 2003,and will reclassify all periods based on its revised segment reporting.
Note N. Supplemental Balance Sheet Information
Balance Charged Write-Off BalanceBeginning to Costs and of Doubtful at End
(in millions) of Year Expense Other Accounts of Year
Receivable AllowanceYear ended December 31, 2002 $ 56.6 $ 15.0 $ (5.4)(1) $ (14.5) $ 51.7Year ended December 31, 2001 28.6 23.6 8.4(2) (4.0) 56.6Year ended December 31, 2000 20.1 15.6 — (7.1) 28.6
(1) Allowance related to Aeronautical Systems acquisition and reversal of allowance related to Performance Materials working capital dispute.(2) Allowance related to acquisitions and Performance Materials working capital adjustment dispute (see Note U).
(in millions) 2002 2001
PropertyLand $ 89.4 $ 44.1Buildings and improvements 664.9 585.0Machinery and equipment 1,412.5 1,142.5Construction in progress. 81.1 151.6
2,247.9 1,923.2Less allowances for depreciation (1,007.6) (967.7)
Total $ 1,240.3 $ 955.5
Property includes assets acquired under capital leases, principallybuildings and machinery and equipment, of $22.2 million and $17.4million at December 31, 2002 and 2001, respectively. Relatedallowances for depreciation are $7.1 million and $6.5 million, respec-tively. Interest costs capitalized from continuing operations were$0.4 million in 2002, $1.4 million in 2001 and $1.0 million in 2000.
(in millions) 2002 2001
Accrued ExpensesWages, vacations, pensions and other
employment costs $ 171.9 $ 188.6Postretirement benefits other than
pensions 36.0 35.0Taxes other than federal and
foreign income taxes 21.6 23.3Accrued environmental liabilities 16.8 9.5Accrued interest 37.0 31.8Restructuring and consolidation 23.4 45.2Other 270.6 173.0
Total $ 577.3 $ 506.4
(in millions) 2002 2001
Accumulated Other Comprehensive Income (Loss)
Unrealized foreign currency translation $ (8.0) $ (57.4)Minimum pension liability (380.5) (52.7)Accumulated gain on cash flow hedges 19.4 —
Total $ (369.1) $ (110.1)
The minimum pension liability amounts above are net of deferredtaxes of $204.9 million and $26.8 million in 2002 and 2001, respec-tively. The accumulated gain on cash flow hedges above is net ofdeferred taxes of $9.6 million in 2002.

2002 Annual Report 71
Fair Values of Financial Instruments The Company’s accounting poli-cies with respect to financial instruments are described in Note A.
The carrying amounts of the Company’s significant balance sheetfinancial instruments approximate their respective fair values atDecember 31, 2002 and 2001, and are presented below.
2002 2001Carrying Fair Carrying Fair
(in millions) Value Value Value Value
Long-term debt $ 2,132.8 $ 2,228.0 $ 1,313.1 $ 1,211.7QUIPS (see Note S) $ 125.4 $ 125.7 $ 125.0 $ 128.3PIK Notes $ 141.7 $ 140.2 $ 168.4 $ 167.0
Derivative financial instruments at December 31, 2002 and 2001were as follows:
2002 2001Contract/ Contract/Notional Fair Notional Fair
(in millions) Amount Value Amount Value
Interest rate swaps $ — $ — $ 200.0 $ 7.3Foreign currency
forward contracts 751.2 29.0 $ — —
The Company has an outstanding contingent liability for guaranteeddebt and lease payments of $4.5 million, and for letters of credit andbank guarantees of $43.1 million. It was not practical to obtain inde-pendent estimates of the fair values for the contingent liability forguaranteed debt and lease payments and for letters of credit. In theopinion of management, non-performance by the other parties tothe contingent liabilities will not have a material effect on theCompany’s results of operations or financial condition.
GuaranteesThe Company extends financial and product performance guarantees tothird parties. As of December 31, 2002 the following were outstanding:
Maximum CarryingPotential Amount of
(in millions) Payment Liability
Environmental remediation indemnifications (Note V) No limit $ 20.8
Financial Guarantees:TIDES $ 150.0 $ — Debt and lease payments $ 4.5 $ — Executive loans to purchase
Company stock $ 9.3 $ —
The Company accrues for costs associated with guarantees when it isprobable that a liability has been incurred and the amount can be rea-sonably estimated. The most likely cost to be incurred is accrued basedon an evaluation of currently available facts, and where no amountwithin a range of estimates is more likely, the minimum is accrued.
The Company provides service and warranty policies on its products.Liability under service and warranty policies is based upon a reviewof historical warranty and service claim experience. Adjustments aremade to accruals as claim data and historical experience warrant. In
addition, the Company incurs discretionary costs to service its prod-ucts in connection with product performance issues.
The changes in the carrying amount of service and product war-ranties for the year ended December 31, 2002, are as follows:
(in millions)
Balance at December 31, 2001 $ 57.6Service and product warranty provision 23.0Aeronautical Systems opening balance sheet provision 8.1Payments (19.3)Balance at December 31, 2002 $ 69.4
Note O. Derivatives and Hedging Activities
Cash Flow HedgesOne of the Company’s subsidiaries conducts a substantial portionof its business in Euros but has significant sales contracts that aredenominated in U.S. dollars. In March 2002, we entered into 21 indi-vidual forward contracts that mature on a monthly basis from April2002 to December 2003 to exchange U.S. dollars for Euros.
The Aeronautical Systems businesses conduct a substantial portionof their business in Great Britain Pounds and Euros but have signif-icant sales contracts that are denominated in U.S. dollars. In October2002, the Company entered into forward contracts that mature on amonthly basis from October 2002 to April 2007, with an aggregatenotional amount of $706.8 million to buy Great Britain Pounds and anaggregate notional amount of $89.4 million to buy Euros.
The forward contracts described above are used to mitigate thepotential volatility to cash flow arising from changes in currencyexchange rates. The hedges are being accounted for as cash flowhedges. As of December 31, 2002, forward contracts with an aggre-gate notional amount of $656.0 million to buy Great Britain Poundsand an aggregate notional amount of $95.2 million to buy Euroswere still outstanding. The derivatives are recorded at fair value withthe offset reflected in accumulated other comprehensive income,net of deferred taxes. The fair value of the hedges at December 31,2002 was an asset of $29.0 million, of which $10.0 million isrecorded in Prepaid Expenses and Other Assets and $19.0 million isrecorded in Other Assets.
The $29.0 million gross gain (before deferred taxes of $9.6 million)recorded in accumulated other comprehensive income will be reflect-ed in income as the individual contracts mature, and the hedgeditem impacts earnings. As of December 31, 2002, the portion of the$29.0 million gain that would be reclassified into earnings as anincrease in sales in the next 12 months is a gain of $10.0 million.
Fair Value HedgeIn September 2002, the Company terminated its interest rate swapagreement, prior to its maturity in 2009, on its $200.0 million, 6.6percent senior notes due in 2009. At termination, the Companyreceived $29.4 million in cash, comprised of a $2.6 million receiv-able representing the amount owed on the interest rate swap fromthe previous settlement date and $26.8 million representing the fair
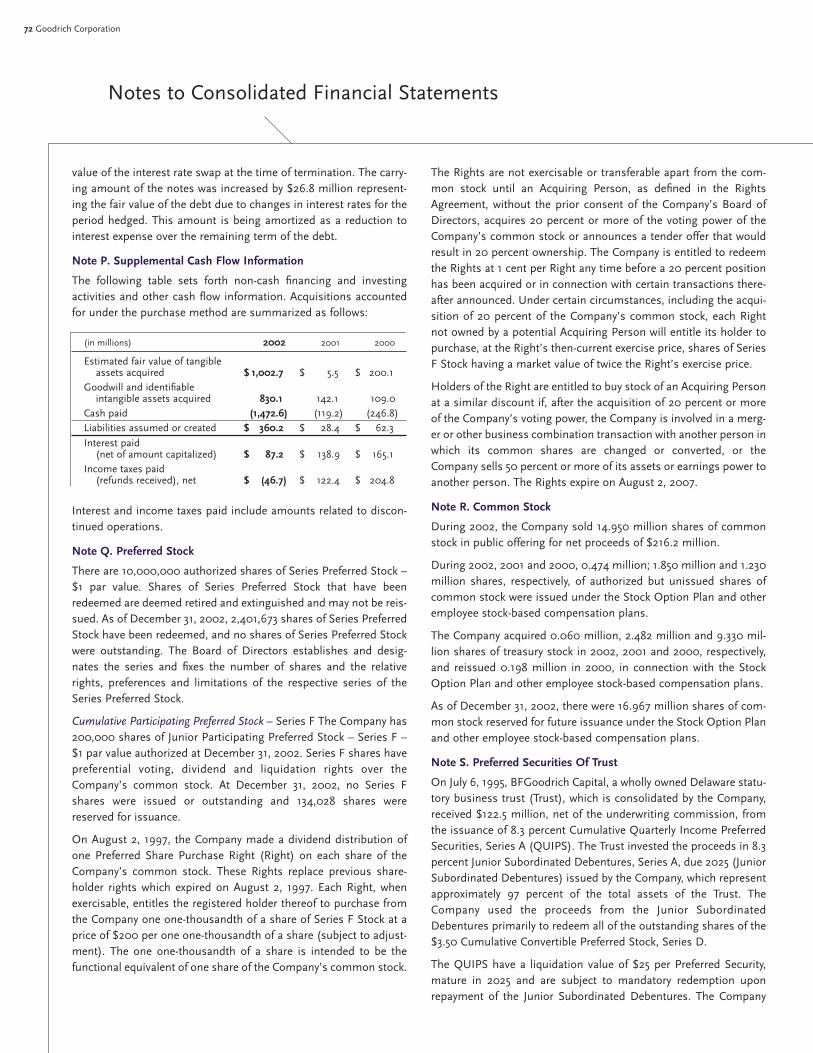
72 Goodrich Corporation
Notes to Consolidated Financial Statements
value of the interest rate swap at the time of termination. The carry-ing amount of the notes was increased by $26.8 million represent-ing the fair value of the debt due to changes in interest rates for theperiod hedged. This amount is being amortized as a reduction tointerest expense over the remaining term of the debt.
Note P. Supplemental Cash Flow Information
The following table sets forth non-cash financing and investingactivities and other cash flow information. Acquisitions accountedfor under the purchase method are summarized as follows:
(in millions) 2002 2001 2000
Estimated fair value of tangible assets acquired $ 1,002.7 $ 5.5 $ 200.1
Goodwill and identifiable intangible assets acquired 830.1 142.1 109.0
Cash paid (1,472.6) (119.2) (246.8)Liabilities assumed or created $ 360.2 $ 28.4 $ 62.3
Interest paid (net of amount capitalized) $ 87.2 $ 138.9 $ 165.1
Income taxes paid (refunds received), net $ (46.7) $ 122.4 $ 204.8
Interest and income taxes paid include amounts related to discon-tinued operations.
Note Q. Preferred Stock
There are 10,000,000 authorized shares of Series Preferred Stock –$1 par value. Shares of Series Preferred Stock that have beenredeemed are deemed retired and extinguished and may not be reis-sued. As of December 31, 2002, 2,401,673 shares of Series PreferredStock have been redeemed, and no shares of Series Preferred Stockwere outstanding. The Board of Directors establishes and desig-nates the series and fixes the number of shares and the relativerights, preferences and limitations of the respective series of theSeries Preferred Stock.
Cumulative Participating Preferred Stock – Series F The Company has200,000 shares of Junior Participating Preferred Stock – Series F –$1 par value authorized at December 31, 2002. Series F shares havepreferential voting, dividend and liquidation rights over theCompany’s common stock. At December 31, 2002, no Series Fshares were issued or outstanding and 134,028 shares werereserved for issuance.
On August 2, 1997, the Company made a dividend distribution ofone Preferred Share Purchase Right (Right) on each share of theCompany’s common stock. These Rights replace previous share-holder rights which expired on August 2, 1997. Each Right, whenexercisable, entitles the registered holder thereof to purchase fromthe Company one one-thousandth of a share of Series F Stock at aprice of $200 per one one-thousandth of a share (subject to adjust-ment). The one one-thousandth of a share is intended to be thefunctional equivalent of one share of the Company’s common stock.
The Rights are not exercisable or transferable apart from the com-mon stock until an Acquiring Person, as defined in the RightsAgreement, without the prior consent of the Company’s Board ofDirectors, acquires 20 percent or more of the voting power of theCompany’s common stock or announces a tender offer that wouldresult in 20 percent ownership. The Company is entitled to redeemthe Rights at 1 cent per Right any time before a 20 percent positionhas been acquired or in connection with certain transactions there-after announced. Under certain circumstances, including the acqui-sition of 20 percent of the Company’s common stock, each Rightnot owned by a potential Acquiring Person will entitle its holder topurchase, at the Right’s then-current exercise price, shares of SeriesF Stock having a market value of twice the Right’s exercise price.
Holders of the Right are entitled to buy stock of an Acquiring Personat a similar discount if, after the acquisition of 20 percent or moreof the Company’s voting power, the Company is involved in a merg-er or other business combination transaction with another person inwhich its common shares are changed or converted, or theCompany sells 50 percent or more of its assets or earnings power toanother person. The Rights expire on August 2, 2007.
Note R. Common Stock
During 2002, the Company sold 14.950 million shares of commonstock in public offering for net proceeds of $216.2 million.
During 2002, 2001 and 2000, 0.474 million; 1.850 million and 1.230million shares, respectively, of authorized but unissued shares ofcommon stock were issued under the Stock Option Plan and otheremployee stock-based compensation plans.
The Company acquired 0.060 million, 2.482 million and 9.330 mil-lion shares of treasury stock in 2002, 2001 and 2000, respectively,and reissued 0.198 million in 2000, in connection with the StockOption Plan and other employee stock-based compensation plans.
As of December 31, 2002, there were 16.967 million shares of com-mon stock reserved for future issuance under the Stock Option Planand other employee stock-based compensation plans.
Note S. Preferred Securities Of Trust
On July 6, 1995, BFGoodrich Capital, a wholly owned Delaware statu-tory business trust (Trust), which is consolidated by the Company,received $122.5 million, net of the underwriting commission, fromthe issuance of 8.3 percent Cumulative Quarterly Income PreferredSecurities, Series A (QUIPS). The Trust invested the proceeds in 8.3percent Junior Subordinated Debentures, Series A, due 2025 (JuniorSubordinated Debentures) issued by the Company, which representapproximately 97 percent of the total assets of the Trust. TheCompany used the proceeds from the Junior SubordinatedDebentures primarily to redeem all of the outstanding shares of the$3.50 Cumulative Convertible Preferred Stock, Series D.
The QUIPS have a liquidation value of $25 per Preferred Security,mature in 2025 and are subject to mandatory redemption uponrepayment of the Junior Subordinated Debentures. The Company

2002 Annual Report 73
has the option at any time on or after July 6, 2000, to redeem, inwhole or in part, the Junior Subordinated Debentures with the pro-ceeds from the issuance and sale of the Company’s common stockwithin two years preceding the date fixed for redemption.
The Company has unconditionally guaranteed all distributionsrequired to be made by the Trust, but only to the extent the Trust hasfunds legally available for such distributions. The only source offunds for the Trust to make distributions to preferred security hold-ers is the payment by the Company of interest on the JuniorSubordinated Debentures. The Company has the right to defer suchinterest payments for up to five years. If the Company defers anyinterest payments, the Company may not, among other things, payany dividends on its capital stock until all interest in arrears is paidto the Trust.
Note T. Stock Option Plan
The 2001 Stock Option Plan, which will expire on April 17, 2011,unless renewed, provides for the awarding of or the granting ofoptions to purchase 6,500,000 shares of common stock of theCompany. Generally, options granted are exercisable at the rate of 35percent after one year, 70 percent after two years and 100 percentafter three years. Certain options are fully exercisable immediatelyafter grant. The term of each option cannot exceed 10 years from thedate of grant. All options granted under the Plan have been grantedat not less than 100 percent of fair market value on the date of grant.
The Company also has outstanding stock options under otheremployee stock-based compensation plans, including the pre-merg-er plans of Coltec and Rohr. These stock options are included in thedisclosures below.
Pro forma information regarding net income and earnings per shareis required by FASB Statement No. 123, “Accounting for Stock-BasedCompensation” (SFAS 123) and has been determined as if theCompany had accounted for its employee stock options under thefair value method of that statement. The fair value for these optionswas estimated at the date of grant using a Black-Scholes option pric-ing model with the following weighted-average assumptions:
2002 2001 2000
Risk-Free Interest Rate (%) 3.7 5.0 5.0Dividend Yield (%) 3.6 3.5 3.4Volatility Factor (%) 47.4 44.2 37.5Weighted-Average Expected Life
of the Options (years) 7.0 7.0 7.0
The option valuation model requires the input of highly subjectiveassumptions, primarily stock price volatility, changes in which canmaterially affect the fair value estimate. The weighted-average fairvalues of stock options granted during 2002, 2001 and 2000 were$9.50, $13.78 and $8.65, respectively.
For purposes of the pro forma disclosures required by SFAS 123, theestimated fair value of the options is amortized to expense over theoptions vesting period. In addition, the grant-date fair value of per-formance shares is amortized to expense over the three-year plancycle without adjustments for subsequent changes in the marketprice of the Company’s common stock. The Company’s pro formainformation is as follows:
(in millions, except per share amounts) 2002 2001 2000
Net income: As reported $ 117.9 $ 289.2 $ 325.9Pro forma $ 106.6 274.6 320.6
Earnings per share:Basic:
As reported $ 1.14 $ 2.80 $ 3.11Pro forma $ 1.03 2.66 3.06
Diluted:As reported $ 1.14 $ 2.76 $ 3.04Pro forma $ 1.03 2.62 3.00
The effects of applying SFAS 123 in this pro forma disclosure are notlikely to be representative of effects on reported net income forfuture years. Additional awards in future years are anticipated.
A summary of the Company’s stock option activity and relatedinformation follows:
Weighted-Average
(options in thousands) Options Exercise Price
Year Ended December 31, 2002Outstanding at beginning of year 8,145.9 $ 33.60
Granted – before EnPro spin-off 1,916.7 26.19Exercised – before EnPro spin-off (157.7) 24.05Forfeited – before EnPro spin-off (408.8) 31.44Adjustment to outstanding options
due to EnPro spin-off (1) 420.5Exercised – after EnPro spin-off (19.1) 26.09Forfeited – after EnPro spin-off (437.0) 36.24
Outstanding at end of year 9,460.5 30.93
Year Ended December 31, 2001Outstanding at beginning of year 8,519.6 $ 31.41
Granted 2,045.6 37.87Exercised (1,834.9) 28.25Forfeited (584.4) 32.55
Outstanding at end of year 8,145.9 33.60
Year Ended December 31, 2000Outstanding at beginning of year
Granted 7,811.1 $ 30.10Exercised 2,483.7 26.66Forfeited (1,401.6) 22.10Expired (373.6) 32.62
Outstanding at end of year 8,519.6 31.41
(1) At the time of the EnPro spin-off, the number of options and the exerciseprice per option were adjusted based on the ratio of the Company’s stockprice before and after the spin-off.
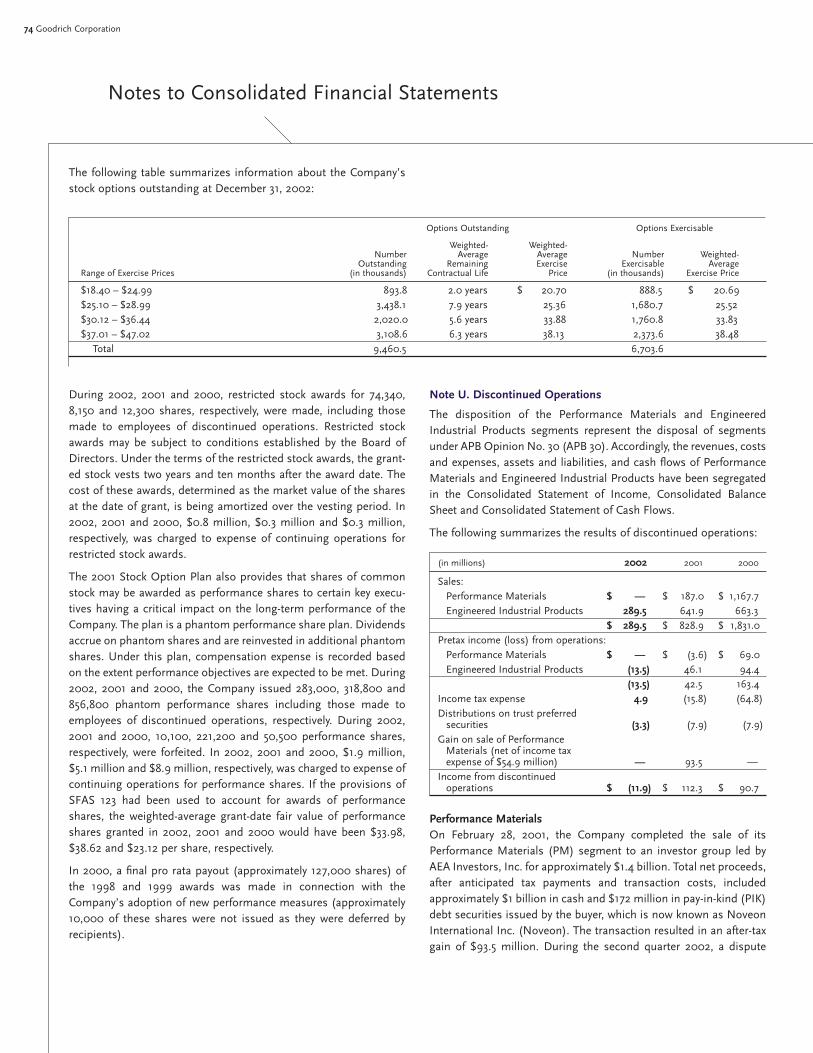
74 Goodrich Corporation
Notes to Consolidated Financial Statements
The following table summarizes information about the Company’sstock options outstanding at December 31, 2002:
Options Outstanding Options Exercisable
Weighted- Weighted-Number Average Average Number Weighted-
Outstanding Remaining Exercise Exercisable AverageRange of Exercise Prices (in thousands) Contractual Life Price (in thousands) Exercise Price
$18.40 – $24.99 893.8 2.0 years $ 20.70 888.5 $ 20.69$25.10 – $28.99 3,438.1 7.9 years 25.36 1,680.7 25.52$30.12 – $36.44 2,020.0 5.6 years 33.88 1,760.8 33.83$37.01 – $47.02 3,108.6 6.3 years 38.13 2,373.6 38.48
Total 9,460.5 6,703.6
During 2002, 2001 and 2000, restricted stock awards for 74,340,8,150 and 12,300 shares, respectively, were made, including thosemade to employees of discontinued operations. Restricted stockawards may be subject to conditions established by the Board ofDirectors. Under the terms of the restricted stock awards, the grant-ed stock vests two years and ten months after the award date. Thecost of these awards, determined as the market value of the sharesat the date of grant, is being amortized over the vesting period. In2002, 2001 and 2000, $0.8 million, $0.3 million and $0.3 million,respectively, was charged to expense of continuing operations forrestricted stock awards.
The 2001 Stock Option Plan also provides that shares of commonstock may be awarded as performance shares to certain key execu-tives having a critical impact on the long-term performance of theCompany. The plan is a phantom performance share plan. Dividendsaccrue on phantom shares and are reinvested in additional phantomshares. Under this plan, compensation expense is recorded basedon the extent performance objectives are expected to be met. During2002, 2001 and 2000, the Company issued 283,000, 318,800 and856,800 phantom performance shares including those made toemployees of discontinued operations, respectively. During 2002,2001 and 2000, 10,100, 221,200 and 50,500 performance shares,respectively, were forfeited. In 2002, 2001 and 2000, $1.9 million,$5.1 million and $8.9 million, respectively, was charged to expense ofcontinuing operations for performance shares. If the provisions ofSFAS 123 had been used to account for awards of performanceshares, the weighted-average grant-date fair value of performanceshares granted in 2002, 2001 and 2000 would have been $33.98,$38.62 and $23.12 per share, respectively.
In 2000, a final pro rata payout (approximately 127,000 shares) ofthe 1998 and 1999 awards was made in connection with theCompany’s adoption of new performance measures (approximately10,000 of these shares were not issued as they were deferred byrecipients).
Note U. Discontinued Operations
The disposition of the Performance Materials and EngineeredIndustrial Products segments represent the disposal of segmentsunder APB Opinion No. 30 (APB 30). Accordingly, the revenues, costsand expenses, assets and liabilities, and cash flows of PerformanceMaterials and Engineered Industrial Products have been segregatedin the Consolidated Statement of Income, Consolidated BalanceSheet and Consolidated Statement of Cash Flows.
The following summarizes the results of discontinued operations:
(in millions) 2002 2001 2000
Sales:Performance Materials $ — $ 187.0 $ 1,167.7Engineered Industrial Products 289.5 641.9 663.3
$ 289.5 $ 828.9 $ 1,831.0Pretax income (loss) from operations:
Performance Materials $ — $ (3.6) $ 69.0 Engineered Industrial Products (13.5) 46.1 94.4
(13.5) 42.5 163.4Income tax expense 4.9 (15.8) (64.8)Distributions on trust preferred
securities (3.3) (7.9) (7.9)Gain on sale of Performance
Materials (net of income tax expense of $54.9 million) — 93.5 —
Income from discontinued operations $ (11.9) $ 112.3 $ 90.7
Performance MaterialsOn February 28, 2001, the Company completed the sale of itsPerformance Materials (PM) segment to an investor group led byAEA Investors, Inc. for approximately $1.4 billion. Total net proceeds,after anticipated tax payments and transaction costs, includedapproximately $1 billion in cash and $172 million in pay-in-kind (PIK)debt securities issued by the buyer, which is now known as NoveonInternational Inc. (Noveon). The transaction resulted in an after-taxgain of $93.5 million. During the second quarter 2002, a dispute
2002 Annual Report 75
over the computation of a post-closing working capital adjustmentwas resolved. The resolution of this matter did not have an effect onthe previously reported gain.
Pursuant to the terms of the transaction, the Company has retainedcertain assets and liabilities, primarily pension, postretirement andenvironmental liabilities, of Performance Materials. The Company hasalso agreed to indemnify Noveon for liabilities arising from certainevents as defined in the agreement. Such indemnification is not expect-ed to be material to the Company’s financial condition, but could bematerial to the Company’s results of operations in a given period.
Spin-Off of Engineered Industrial Products On May 31, 2002, the Company completed the tax-free spin-off of itsEngineered Industrial Products (EIP) segment. The spin-off wasmade through a tax-free distribution to the Company’s shareholdersof all of the capital stock of EnPro Industries, Inc., a subsidiary thatwe formed in connection with the spin-off. In the spin-off, theCompany’s shareholders received one share of EnPro commonstock for every five shares of the Company’s common stock ownedon May 28, 2002, the record date.
At the time of the spin-off, EnPro’s only material asset was all of thecapital stock and certain indebtedness of Coltec Industries Inc(Coltec). Coltec and its subsidiaries owned substantially all of theassets and liabilities of the EIP segment, including the associatedasbestos liabilities and related insurance.
Prior to the spin-off, Coltec also owned and operated an aerospacebusiness. Before completing the spin-off, Coltec’s aerospace busi-ness assumed all intercompany balances outstanding betweenColtec and the Company and Coltec then transferred to theCompany as a dividend all the assets, liabilities and operations of itsaerospace business, including these assumed balances. Followingthis transfer and prior to the spin-off, all of the capital stock ofColtec was contributed to EnPro, with the result that at the time ofthe spin-off Coltec was a wholly owned subsidiary of EnPro.
In connection with the spin-off, the Company and EnPro enteredinto a distribution agreement, a tax matters agreement, a transitionservices agreement, an employee matters agreement and an indem-nification agreement, which govern the relationship between theCompany and EnPro after the spin-off and provide for the allocationof employee benefits, tax and other liabilities and obligations attrib-utable to periods prior to the spin-off.
The spin-off was recorded as a dividend and resulted in a reductionof the Company’s shareholders’ equity of $409.1 million represent-ing the recorded value of the net assets of the business distributed,including cash of $47.0 million. The distribution agreement provid-ed for certain post-distribution adjustments relating to the amountof cash to be included in the net assets distributed. At December 31,2002, the final adjustment had been calculated and is subject to adispute resolution process. The Company expects that the effect ofthe final resolution of this process on the Consolidated FinancialStatements will be immaterial.
The $150 million of outstanding Coltec Capital Trust 5 1/4%convertible trust preferred securities (TIDES) that were reflected inliabilities of discontinued operations remained outstanding as partof the EnPro capital structure following the spin-off. The TIDES areconvertible into shares of both Goodrich and EnPro common stockuntil April 15, 2028. The Company has guaranteed amounts owed byColtec Capital Trust with respect to the TIDES and have guaranteedColtec’s performance of its obligations with respect to the TIDESand the underlying Coltec convertible subordinated debentures.EnPro, Coltec and Coltec Capital Trust have agreed to indemnify theCompany from any costs and liabilities arising under or related tothe TIDES after the spin-off.
Prior to the spin-off, Coltec acquired certain call options on theCompany’s common stock in order to partially hedge its exposure tofluctuations in the market price of the Company’s stock resultingfrom the TIDES. These call options remained an asset of Coltec fol-lowing the spin-off.
Note V: Contingencies
GeneralThere are pending or threatened against the Company or its sub-sidiaries various claims, lawsuits and administrative proceedings,all arising from the ordinary course of business with respect to com-mercial, product liability, asbestos and environmental matters,which seek remedies or damages. The Company believes that anyliability that may finally be determined with respect to commercialand non-asbestos product liability claims should not have a mate-rial effect on its consolidated financial position or results ofoperations. From time to time, the Company is also involved in legal proceedings as a plaintiff involving contract, patent protection,environmental and other matters. Gain contingencies, if any, arerecognized when they are realized.
EnvironmentalThe Company is subject to various domestic and international envi-ronmental laws and regulations which may require that it investigateand remediate the effects of the release or disposal of materials atsites associated with past and present operations, including sites atwhich the Company has been identified as a potentially responsibleparty under the federal Superfund laws and comparable state laws.The Company is currently involved in the investigation and remedi-ation of a number of sites under these laws.
The measurement of environmental liabilities by the Company isbased on currently available facts, present laws and regulations andcurrent technology. Such estimates take into consideration theCompany’s prior experience in site investigation and remediation,the data concerning cleanup costs available from other companiesand regulatory authorities and the professional judgment of theCompany’s environmental specialists in consultation with outsideenvironmental specialists, when necessary. Estimates of the
76 Goodrich Corporation
Notes to Consolidated Financial Statements
Company’s liability are further subject to uncertainties regarding thenature and extent of site contamination, the range of remediationalternatives available, evolving remediation standards, impreciseengineering evaluations and estimates of appropriate cleanup tech-nology, methodology and cost, the extent of corrective actions thatmay be required, and the number and financial condition of otherpotentially responsible parties, as well as the extent of their respon-sibility for the remediation.
Accordingly, as investigation and remediation of these sites pro-ceed, it is likely that adjustments in the Company’s accruals will benecessary to reflect new information. The amounts of any suchadjustments could have a material adverse effect on the Company’sresults of operations in a given period, but the amounts, and thepossible range of loss in excess of the amounts accrued, are not rea-sonably estimable. Based on currently available information, how-ever, the Company does not believe that future environmental costsin excess of those accrued with respect to sites with which theCompany has been identified as a potentially responsible party arelikely to have a material adverse effect on the Company’s financialcondition. There can be no assurance, however, that additionalfuture developments, administrative actions or liabilities relating toenvironmental matters will not have a material adverse effect on theCompany’s results of operations or cash flows in a given period.
Environmental liabilities are recorded when the Company’s liabilityis probable and the costs are reasonably estimable, which generallyis not later than at completion of a feasibility study or when theCompany has recommended a remedy or has committed to anappropriate plan of action. The liabilities are reviewed periodicallyand, as investigations and remediation proceed, adjustments aremade as necessary. Liabilities for losses from environmental reme-diation obligations do not consider the effects of inflation, andanticipated expenditures are not discounted to their present value.The liabilities are not reduced by possible recoveries from insurancecarriers or other third parties, but do reflect anticipated allocationsamong potentially responsible parties at federal Superfund sites orsimilar state-managed sites and an assessment of the likelihoodthat such parties will fulfill their obligations at such sites.
At December 31, 2002, the Company’s liabilities for environmentalremediation obligations totaled $92.7 million, of which $19.0 mil-lion was included in current liabilities as Accrued Liabilities. Of the$92.7 million, $21.5 million was associated with ongoing operationsand $71.2 million was associated with businesses previously dis-posed of or discontinued.
The timing of expenditures depends on a number of factors thatvary by site, including the nature and extent of contamination, thenumber of potentially responsible parties, the timing of regulatoryapprovals, the complexity of the investigation and remediation, andthe standards for remediation. The Company expects that it will
expend present accruals over many years, and will complete reme-diation of all sites with which it has been identified in up to 30 years.This period includes operation and monitoring costs that are gen-erally incurred over 15 to 25 years.
Tolo Litigation In May 2000, the Company and its subsidiary Rohr, Inc. were servedwith a complaint in a lawsuit filed in the Superior Court of OrangeCounty, California, by former shareholders and certain formeremployees of Tolo, Inc. Tolo is a subsidiary of Rohr that was acquiredin 1997 pursuant to a stock purchase agreement. The former share-holders alleged that the Company and Rohr breached the stockpurchase agreement by failing to pay $2.4 million under the termsof the agreement. In September 2001, a jury found that theCompany was liable to the shareholders for the $2.4 million retainedby Rohr under the stock purchase agreement and the Company wasalso assessed punitive damages of $48 million. The court subse-quently reduced the punitive damage award to $24 million. TheCompany and Rohr appealed the judgment.
In December 2002, the appellate court issued a ruling directing thetrial court to enter judgment in favor of the Company and Rohr onboth the fraud claim and the breach of contract claim. The plaintiffs’motion for rehearing of that ruling was subsequently denied. OnFebruary 10, 2003, the plaintiffs filed a petition for review with theCalifornia Supreme Court. The Company has until March 2, 2003 torespond to the petition.
AsbestosThe Company and certain of its subsidiaries have been named asdefendants in various actions by plaintiffs alleging injury or death asa result of exposure to asbestos fibers in products, or which mayhave been present in the Company’s facilities. A number of thesecases involve maritime claims, which have been and are expected tocontinue to be administratively dismissed by the court. Theseactions primarily relate to previously owned businesses. TheCompany believes that it has substantial insurance coverage avail-able to it related to any remaining claims. As a result, the Companybelieves that these pending and reasonably anticipated futureactions are not likely to have a material adverse effect on theCompany’s financial condition or results of operations.
Discontinued Operations At the time of the EIP spin-off, two subsidiaries of Coltec were defen-dants in a significant number of personal injury claims relating toalleged asbestos-containing products sold by those subsidiaries. Itis possible that asbestos-related claims might be asserted againstthe Company on the theory that the Company has some responsi-bility for the asbestos-related liabilities of EnPro, Coltec or its sub-sidiaries, even though the activities that led to those claims
2002 Annual Report 77
occurred prior to the Company’s ownership of any of those sub-sidiaries. Also, it is possible that a claim might be asserted againstthe Company that Coltec’s dividend of its aerospace business to theCompany prior to the spin-off was made at a time when Coltec wasinsolvent or caused Coltec to become insolvent. Such a claim couldseek recovery from the Company on behalf of Coltec of the fair mar-ket value of the dividend.
No such claims have been asserted against the Company to date.The Company believes that it would have substantial legal defensesagainst any such claims. In addition, the agreement between EnProand the Company that was used to effectuate the spin-off providesthe Company with an indemnification from EnPro covering, amongother things, these liabilities. Any such asbestos-related claimswould likely require, as a practical matter, that Coltec’s subsidiarieswere unable to satisfy their asbestos-related liabilities and thatColtec was found to be responsible for these liabilities and wasunable to meet its financial obligations. The Company believes anysuch claims would be without merit and that Coltec was solventboth before and after the dividend. If the Company is ultimatelyfound to be responsible for the asbestos-related liabilities ofColtec’s subsidiaries, the Company believes it would not have amaterial adverse effect on its financial condition, but could have amaterial adverse effect on its results of operations and cash flows ina particular period. However, because of the uncertainty as to thenumber, timing and payments related to future asbestos-relatedclaims, there can be no assurance that any such claims will not havea material adverse effect on the Company’s financial condition,results of operations and cash flows. If a claim related to the divi-dend of Coltec’s aerospace business were successful, it could havea material adverse impact on the Company’s financial condition,results of operations and cash flows.
GuaranteesThe Company has guaranteed amounts owed by Coltec Capital Trustwith respect to the $150 million of outstanding 5 1/4 percent con-vertible trust preferred securities (TIDES) and has guaranteedColtec’s performance of its obligations with respect to the TIDESand the underlying Coltec convertible subordinated debentures.Following the spin-off of the EIP segment, the TIDES remained out-standing as an obligation of Coltec Capital Trust and the Company’sguarantee with respect to the TIDES remains an obligation of theCompany. EnPro, Coltec and Coltec Capital Trust have agreed toindemnify the Company from any costs and liabilities arising underor related to the TIDES after the spin-off.
In addition to the Company’s guarantee of the TIDES, the Companyhas an outstanding contingent liability for guaranteed debt andlease payments of $4.5 million and for letters of credit and bankguarantees of $43.1 million at December 31, 2002.
Note W: Subsequent Event
On January 29, 2003, the Company announced that it had enteredinto a definitive agreement to sell its Avionics business to L-3Communications Corporation (L-3) for $188 million. The transactionwas approved by the boards of directors of the Company and L-3.Subject to customary regulatory approvals, the sale is expected toclose late in the first quarter or early in the second quarter of 2003.After-tax proceeds are expected to be approximately $134 million.Avionics Systems will be reported as a discontinued operationbeginning with the first quarter 2003.
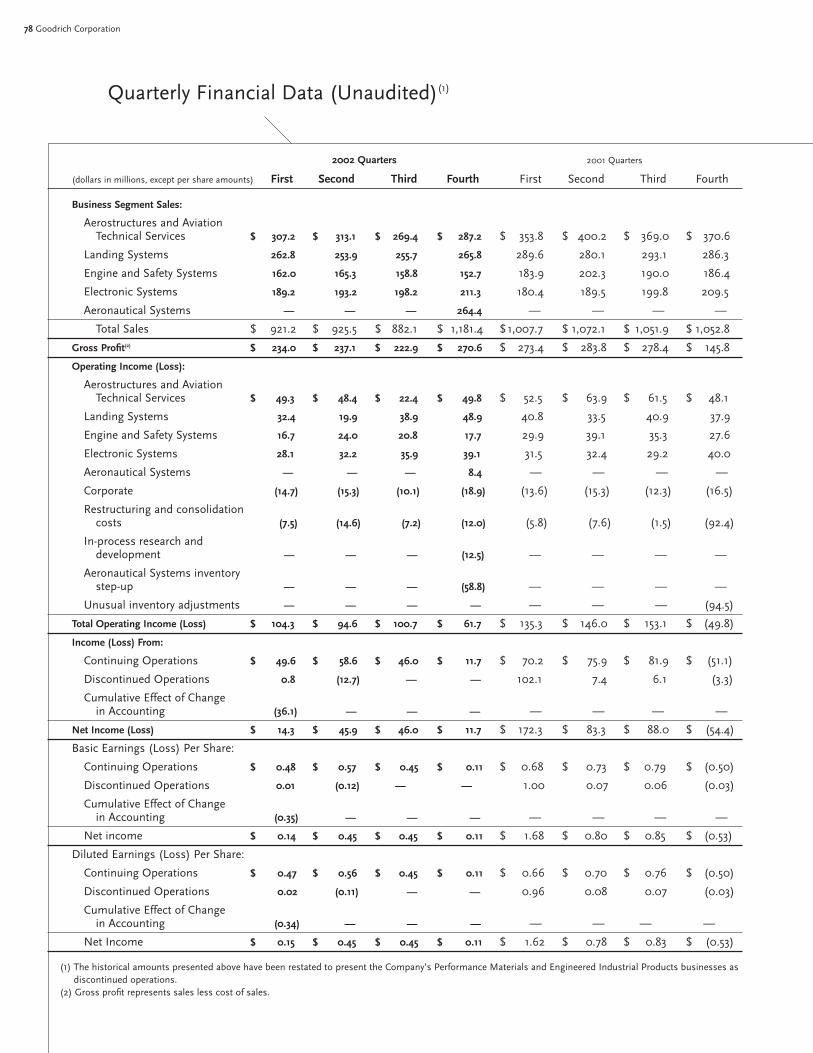
78 Goodrich Corporation
Quarterly Financial Data (Unaudited)(1)
2002 Quarters 2001 Quarters
(dollars in millions, except per share amounts) First Second Third Fourth First Second Third Fourth
Business Segment Sales:
Aerostructures and AviationTechnical Services $ 307.2 $ 313.1 $ 269.4 $ 287.2 $ 353.8 $ 400.2 $ 369.0 $ 370.6
Landing Systems 262.8 253.9 255.7 265.8 289.6 280.1 293.1 286.3
Engine and Safety Systems 162.0 165.3 158.8 152.7 183.9 202.3 190.0 186.4
Electronic Systems 189.2 193.2 198.2 211.3 180.4 189.5 199.8 209.5
Aeronautical Systems — — — 264.4 — — — —
Total Sales $ 921.2 $ 925.5 $ 882.1 $ 1,181.4 $ 1,007.7 $ 1,072.1 $ 1,051.9 $ 1,052.8
Gross Profit(2) $ 234.0 $ 237.1 $ 222.9 $ 270.6 $ 273.4 $ 283.8 $ 278.4 $ 145.8
Operating Income (Loss):
Aerostructures and AviationTechnical Services $ 49.3 $ 48.4 $ 22.4 $ 49.8 $ 52.5 $ 63.9 $ 61.5 $ 48.1
Landing Systems 32.4 19.9 38.9 48.9 40.8 33.5 40.9 37.9
Engine and Safety Systems 16.7 24.0 20.8 17.7 29.9 39.1 35.3 27.6
Electronic Systems 28.1 32.2 35.9 39.1 31.5 32.4 29.2 40.0
Aeronautical Systems — — — 8.4 — — — —
Corporate (14.7) (15.3) (10.1) (18.9) (13.6) (15.3) (12.3) (16.5)
Restructuring and consolidation costs (7.5) (14.6) (7.2) (12.0) (5.8) (7.6) (1.5) (92.4)
In-process research and development — — — (12.5) — — — —
Aeronautical Systems inventory step-up — — — (58.8) — — — —
Unusual inventory adjustments — — — — — — — (94.5)
Total Operating Income (Loss) $ 104.3 $ 94.6 $ 100.7 $ 61.7 $ 135.3 $ 146.0 $ 153.1 $ (49.8)
Income (Loss) From:
Continuing Operations $ 49.6 $ 58.6 $ 46.0 $ 11.7 $ 70.2 $ 75.9 $ 81.9 $ (51.1)
Discontinued Operations 0.8 (12.7) — — 102.1 7.4 6.1 (3.3)
Cumulative Effect of Changein Accounting (36.1) — — — — — — —
Net Income (Loss) $ 14.3 $ 45.9 $ 46.0 $ 11.7 $ 172.3 $ 83.3 $ 88.0 $ (54.4)
Basic Earnings (Loss) Per Share:
Continuing Operations $ 0.48 $ 0.57 $ 0.45 $ 0.11 $ 0.68 $ 0.73 $ 0.79 $ (0.50)
Discontinued Operations 0.01 (0.12) — — 1.00 0.07 0.06 (0.03)
Cumulative Effect of Change in Accounting (0.35) — — — — — — —
Net income $ 0.14 $ 0.45 $ 0.45 $ 0.11 $ 1.68 $ 0.80 $ 0.85 $ (0.53)
Diluted Earnings (Loss) Per Share:
Continuing Operations $ 0.47 $ 0.56 $ 0.45 $ 0.11 $ 0.66 $ 0.70 $ 0.76 $ (0.50)
Discontinued Operations 0.02 (0.11) — — 0.96 0.08 0.07 (0.03)
Cumulative Effect of Changein Accounting (0.34) — — — — — — —
Net Income $ 0.15 $ 0.45 $ 0.45 $ 0.11 $ 1.62 $ 0.78 $ 0.83 $ (0.53)
(1) The historical amounts presented above have been restated to present the Company’s Performance Materials and Engineered Industrial Products businesses asdiscontinued operations.
(2) Gross profit represents sales less cost of sales.

2002 Annual Report 79
The first quarter of 2002 includes a $7.5 million pre-tax charge forrestructuring and consolidation costs.
The second quarter of 2002 includes a $14.6 million pre-tax chargefor restructuring and consolidation costs. The second quarter alsoincludes a $2.4 million pre-tax gain in other income (expense) fromthe sale of a portion of the Company’s interest in a business.
The third quarter of 2002 includes a $7.2 million pre-tax charge forrestructuring and consolidation costs.
The fourth quarter of 2002 includes a $12.0 million pre-tax chargefor restructuring and consolidation costs. The fourth quarter of2002 also includes a $12.5 million pre-tax charge for the write-off ofin-process research and development acquired in the acquisition ofAeronautical Systems and a $58.8 million pre-tax charge related tothe Aeronautical Systems inventory step-up adjustment.
The first quarter of 2001 includes a $5.8 million pre-tax charge forrestructuring and consolidation costs. The first quarter also includesa $7.2 million pre-tax gain in other income (expense) from the saleof a portion of the Company’s interest in a business.
The second quarter of 2001 includes a $7.6 million pre-tax chargefor restructuring and consolidation costs.
The third quarter of 2001 includes a $1.5 million pre-tax charge forrestructuring and consolidation costs.
The fourth quarter of 2001 includes a $92.4 million pre-tax chargefor restructuring and consolidation costs and a $94.5 million pre-taxcharge recorded in cost of sales for unusual inventory adjustments.
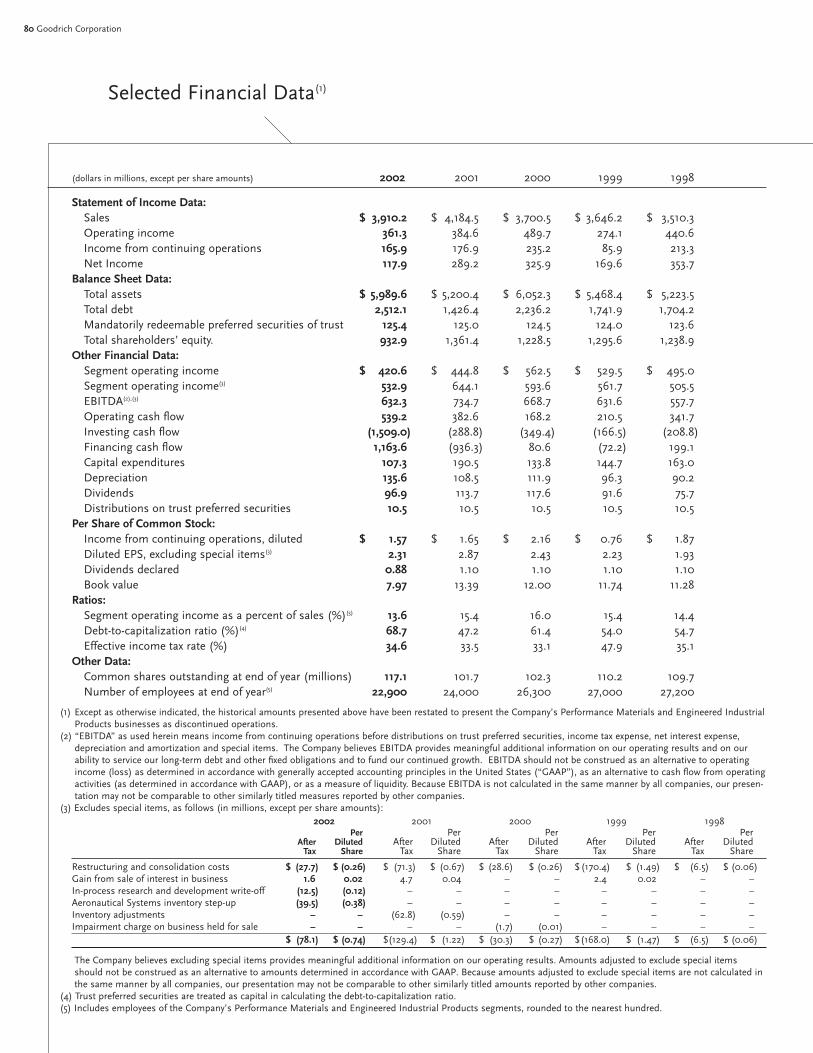
80 Goodrich Corporation
Selected Financial Data(1)
(dollars in millions, except per share amounts) 2002 2001 2000 1999 1998
Statement of Income Data:Sales $ 3,910.2 $ 4,184.5 $ 3,700.5 $ 3,646.2 $ 3,510.3Operating income 361.3 384.6 489.7 274.1 440.6Income from continuing operations 165.9 176.9 235.2 85.9 213.3Net Income 117.9 289.2 325.9 169.6 353.7
Balance Sheet Data:Total assets $ 5,989.6 $ 5,200.4 $ 6,052.3 $ 5,468.4 $ 5,223.5Total debt 2,512.1 1,426.4 2,236.2 1,741.9 1,704.2Mandatorily redeemable preferred securities of trust 125.4 125.0 124.5 124.0 123.6Total shareholders’ equity. 932.9 1,361.4 1,228.5 1,295.6 1,238.9
Other Financial Data:Segment operating income $ 420.6 $ 444.8 $ 562.5 $ 529.5 $ 495.0Segment operating income(3) 532.9 644.1 593.6 561.7 505.5EBITDA(2),(3) 632.3 734.7 668.7 631.6 557.7Operating cash flow 539.2 382.6 168.2 210.5 341.7Investing cash flow (1,509.0) (288.8) (349.4) (166.5) (208.8)Financing cash flow 1,163.6 (936.3) 80.6 (72.2) 199.1Capital expenditures 107.3 190.5 133.8 144.7 163.0Depreciation 135.6 108.5 111.9 96.3 90.2Dividends 96.9 113.7 117.6 91.6 75.7Distributions on trust preferred securities 10.5 10.5 10.5 10.5 10.5
Per Share of Common Stock:Income from continuing operations, diluted $ 1.57 $ 1.65 $ 2.16 $ 0.76 $ 1.87Diluted EPS, excluding special items(3) 2.31 2.87 2.43 2.23 1.93Dividends declared 0.88 1.10 1.10 1.10 1.10Book value 7.97 13.39 12.00 11.74 11.28
Ratios:Segment operating income as a percent of sales (%)(3) 13.6 15.4 16.0 15.4 14.4Debt-to-capitalization ratio (%)(4) 68.7 47.2 61.4 54.0 54.7Effective income tax rate (%) 34.6 33.5 33.1 47.9 35.1
Other Data:Common shares outstanding at end of year (millions) 117.1 101.7 102.3 110.2 109.7Number of employees at end of year(5) 22,900 24,000 26,300 27,000 27,200
(1) Except as otherwise indicated, the historical amounts presented above have been restated to present the Company’s Performance Materials and Engineered IndustrialProducts businesses as discontinued operations.
(2) “EBITDA” as used herein means income from continuing operations before distributions on trust preferred securities, income tax expense, net interest expense,depreciation and amortization and special items. The Company believes EBITDA provides meaningful additional information on our operating results and on ourability to service our long-term debt and other fixed obligations and to fund our continued growth. EBITDA should not be construed as an alternative to operatingincome (loss) as determined in accordance with generally accepted accounting principles in the United States (“GAAP”), as an alternative to cash flow from operatingactivities (as determined in accordance with GAAP), or as a measure of liquidity. Because EBITDA is not calculated in the same manner by all companies, our presen-tation may not be comparable to other similarly titled measures reported by other companies.
(3) Excludes special items, as follows (in millions, except per share amounts): 2002 2001 2000 1999 1998
Per Per Per Per PerAfter Diluted After Diluted After Diluted After Diluted After Diluted
Tax Share Tax Share Tax Share Tax Share Tax Share
Restructuring and consolidation costs $ (27.7) $ (0.26) $ (71.3) $ (0.67) $ (28.6) $ (0.26) $(170.4) $ (1.49) $ (6.5) $ (0.06)Gain from sale of interest in business 1.6 0.02 4.7 0.04 – – 2.4 0.02 – –In-process research and development write-off (12.5) (0.12) – – – – – – – –Aeronautical Systems inventory step-up (39.5) (0.38) – – – – – – – –Inventory adjustments – – (62.8) (0.59) – – – – – –Impairment charge on business held for sale – – – – (1.7) (0.01) – – – –
$ (78.1) $ (0.74) $(129.4) $ (1.22) $ (30.3) $ (0.27) $(168.0) $ (1.47) $ (6.5) $ (0.06)
The Company believes excluding special items provides meaningful additional information on our operating results. Amounts adjusted to exclude special itemsshould not be construed as an alternative to amounts determined in accordance with GAAP. Because amounts adjusted to exclude special items are not calculated inthe same manner by all companies, our presentation may not be comparable to other similarly titled amounts reported by other companies.
(4) Trust preferred securities are treated as capital in calculating the debt-to-capitalization ratio.(5) Includes employees of the Company’s Performance Materials and Engineered Industrial Products segments, rounded to the nearest hundred.
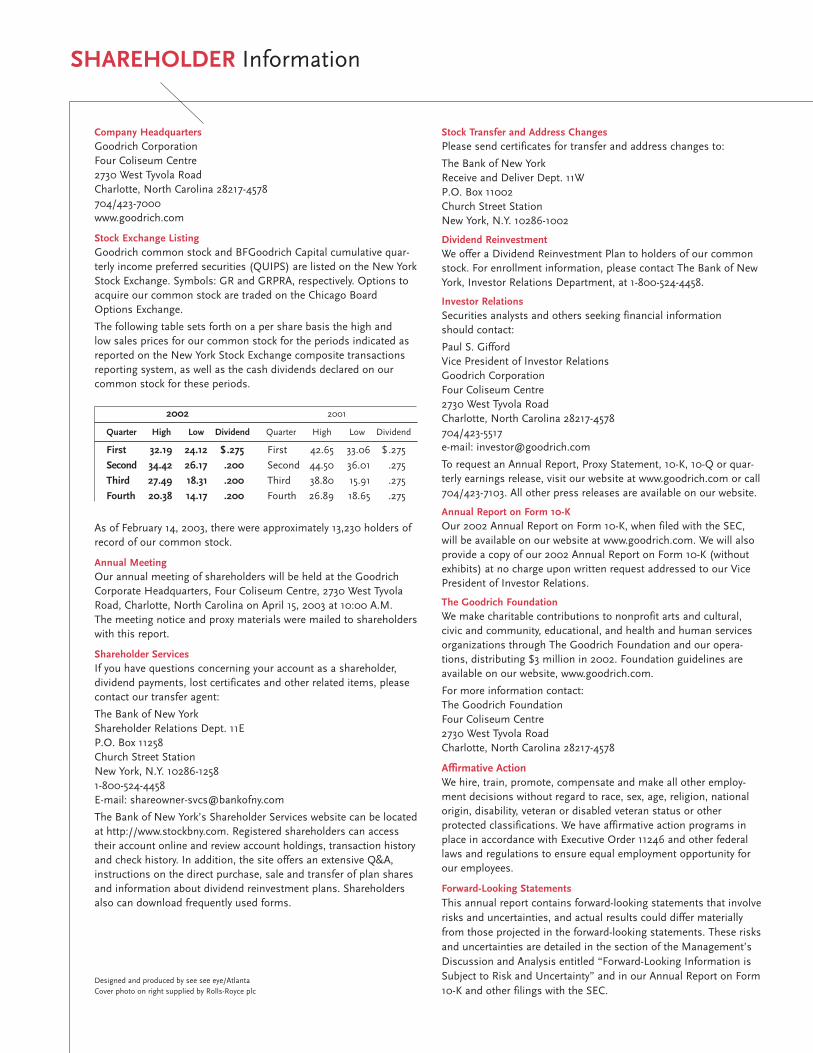
Company HeadquartersGoodrich CorporationFour Coliseum Centre2730 West Tyvola RoadCharlotte, North Carolina 28217-4578704/423-7000www.goodrich.com
Stock Exchange ListingGoodrich common stock and BFGoodrich Capital cumulative quar-terly income preferred securities (QUIPS) are listed on the New YorkStock Exchange. Symbols: GR and GRPRA, respectively. Options toacquire our common stock are traded on the Chicago BoardOptions Exchange.
The following table sets forth on a per share basis the high andlow sales prices for our common stock for the periods indicated asreported on the New York Stock Exchange composite transactionsreporting system, as well as the cash dividends declared on ourcommon stock for these periods.
2002 2001
Quarter High Low Dividend Quarter High Low Dividend
First 32.19 24.12 $.275 First 42.65 33.06 $.275
Second 34.42 26.17 .200 Second 44.50 36.01 .275
Third 27.49 18.31 .200 Third 38.80 15.91 .275
Fourth 20.38 14.17 .200 Fourth 26.89 18.65 .275
As of February 14, 2003, there were approximately 13,230 holders ofrecord of our common stock.
Annual MeetingOur annual meeting of shareholders will be held at the GoodrichCorporate Headquarters, Four Coliseum Centre, 2730 West TyvolaRoad, Charlotte, North Carolina on April 15, 2003 at 10:00 A.M.The meeting notice and proxy materials were mailed to shareholderswith this report.
Shareholder ServicesIf you have questions concerning your account as a shareholder,dividend payments, lost certificates and other related items, pleasecontact our transfer agent:
The Bank of New YorkShareholder Relations Dept. 11EP.O. Box 11258Church Street StationNew York, N.Y. 10286-12581-800-524-4458E-mail: [email protected]
The Bank of New York’s Shareholder Services website can be locatedat http://www.stockbny.com. Registered shareholders can accesstheir account online and review account holdings, transaction historyand check history. In addition, the site offers an extensive Q&A,instructions on the direct purchase, sale and transfer of plan sharesand information about dividend reinvestment plans. Shareholdersalso can download frequently used forms.
Designed and produced by see see eye/AtlantaCover photo on right supplied by Rolls-Royce plc
Stock Transfer and Address ChangesPlease send certificates for transfer and address changes to:
The Bank of New YorkReceive and Deliver Dept. 11WP.O. Box 11002Church Street StationNew York, N.Y. 10286-1002
Dividend ReinvestmentWe offer a Dividend Reinvestment Plan to holders of our commonstock. For enrollment information, please contact The Bank of NewYork, Investor Relations Department, at 1-800-524-4458.
Investor RelationsSecurities analysts and others seeking financial informationshould contact:
Paul S. GiffordVice President of Investor RelationsGoodrich CorporationFour Coliseum Centre2730 West Tyvola RoadCharlotte, North Carolina 28217-4578704/423-5517e-mail: [email protected]
To request an Annual Report, Proxy Statement, 10-K, 10-Q or quar-terly earnings release, visit our website at www.goodrich.com or call704/423-7103. All other press releases are available on our website.
Annual Report on Form 10-KOur 2002 Annual Report on Form 10-K, when filed with the SEC,will be available on our website at www.goodrich.com. We will alsoprovide a copy of our 2002 Annual Report on Form 10-K (withoutexhibits) at no charge upon written request addressed to our VicePresident of Investor Relations.
The Goodrich FoundationWe make charitable contributions to nonprofit arts and cultural,civic and community, educational, and health and human servicesorganizations through The Goodrich Foundation and our opera-tions, distributing $3 million in 2002. Foundation guidelines areavailable on our website, www.goodrich.com.
For more information contact:The Goodrich FoundationFour Coliseum Centre2730 West Tyvola RoadCharlotte, North Carolina 28217-4578
Affirmative ActionWe hire, train, promote, compensate and make all other employ-ment decisions without regard to race, sex, age, religion, nationalorigin, disability, veteran or disabled veteran status or otherprotected classifications. We have affirmative action programs inplace in accordance with Executive Order 11246 and other federallaws and regulations to ensure equal employment opportunity forour employees.
Forward-Looking StatementsThis annual report contains forward-looking statements that involverisks and uncertainties, and actual results could differ materiallyfrom those projected in the forward-looking statements. These risksand uncertainties are detailed in the section of the Management’sDiscussion and Analysis entitled “Forward-Looking Information isSubject to Risk and Uncertainty” and in our Annual Report on Form10-K and other filings with the SEC.
SHAREHOLDER Information
FIVE REASONS TO THINK ABOUT GOODRICH
For over 132 years, through economic ups and downs, Goodrich Corporation has stayedthe course, working to deliver long-term value to our shareholders and customers, and pro-viding a challenging and rewarding place to work for our employees. Our hallmarks include:
Strong financial performance. Our goal is superior returns through consistent, predictablerevenue and income growth.
Global leadership. More than 40 successful acquisitions over the past 16 years, coupled withinternal growth, have created an unparalleled portfolio of world-class aerospace systems.
Balanced business mix. We have purposefully diversified our product market and customermix to counterbalance industry cycles in aircraft production.
Value-creating processes. Strategic planning, value-based management, operational excel-lence, innovation and business platform “roadmaps” are among our purposeful processesthat deliver value.
Innovative solutions. Developing breakthrough innovations is part of our culture. We systemati-cally look for ways to leverage our technological strengths through aerospace – and beyond.
WHAT YOU SEE
GO
OD
RIC
H2
002 Annual R
eport
2002 Annual Report
What you see at Goodrich is a vast array of aerospace products
and services that keep the finest aircraft in the world operating
safely and predictably day after day. You can see our products
on every airplane Airbus makes. page 14. You can see them
across the spectrum of commercial and military aircraft built
by Boeing. page 8. You can see them at work on the Royal Air
Force’s Tornado. page 16. You can see our maintenance, repair
and overhaul services at work on the aircraft of ExpressJet, South
African Airways and Southwest Airlines. page 12.
BUSINESS DESCRIPTION Goodrich Corporation,
a Fortune 500 company, is a leading global supplier
of systems and services to the aerospace industry.
If there’s an aircraft in the sky – we’re on it. Goodrich
technology is involved in making aircraft fly…helping
them land…and keeping them safe. Serving a global
customer base with significant worldwide manufac-
turing and service facilities, Goodrich is one of the
largest “pure play” aerospace companies in the world.
For more information visit http://www.goodrich.com.
Four Coliseum Centre
2730 West Tyvola Road
Charlotte, NC 28217-4578
704/423-7000
www.goodrich.com