good practices in watershed management final -...
TRANSCRIPT

About ICIMOD
The IInntteerrnnaattiioonnaall CCeennttrree ffoorr IInntteeggrraatteedd MMoouunnttaaiinn DDeevveellooppmmeenntt (ICIMOD) is anindependent ‘Mountain Learning and Knowledge Centre’ serving the eightcountries of the Hindu Kush-Himalayas – Afghanistan , Bangladesh ,Bhutan , China , India , Myanmar , Nepal and Pakistan –and the global mountain community. Founded in 1983, ICIMOD is based inKathmandu, Nepal, and brings together a partnership of regional membercountries, partner institutions, and donors with a commitment for developmentaction to secure a better future for the people and environment of the extendedHimalayan region. ICIMOD’s activities are supported by its core programmedonors: the governments of Austria, Denmark, Germany, Netherlands, Norway,Switzerland, and its regional member countries, along with over thirty projectco–financing donors. The primary objective of the Centre is to promote thedevelopment of an economically and environmentally sound mountain ecosystemand to improve the living standards of mountain populations.
People and Resource Dynamics Project – Nepal Team
International Centre for Integrated Mountain Development (ICIMOD)Kathmandu, Nepal
March 2007
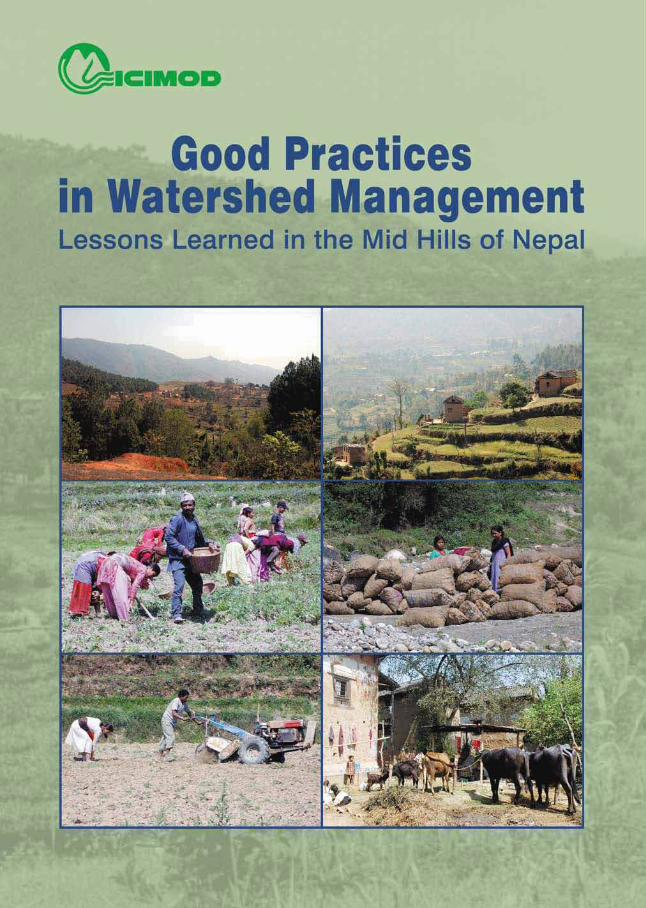
Good Practices inWatershed ManagementLessons Learned in the Mid Hills of Nepal

Copyright © 2007International Centre for Integrated Mountain Development (ICIMOD)All rights reserved
Published by theInternational Centre for Integrated Mountain DevelopmentG.P.O. Box 3226Kathmandu, Nepal
ISBN 978 92 9115 017 5
Editorial TeamMMaatttthheeww ZZaalliicchhiinn (Consultant Editor)AA.. BBeeaattrriiccee MMuurrrraayy (Senior Editor)DDhhaarrmmaa RR.. MMaahhaarrjjaann (Technical Support; and Design Layout)
Photo credits All photos from PARDYP Nepal
Printed and bound in Nepal byQuality Printers (Pvt) Ltd. Kathmandu
ReproductionThis publication may be reproduced in whole or in part and in any form for educational ornon-profit purposes without special permission from the copyright holder, providedacknowledgement of the source is made. ICIMOD would appreciate receiving a copy of anypublication that uses this publication as a source.
No use of this publication may be made for resale or for any other commercial purposewhatsoever without prior permission in writing from ICIMOD.
NoteThe views and interpretations in this publication are those of the author(s). They are notattributable to ICIMOD and do not imply the expression of any opinion concerning the legalstatus of any country, territory, city or area of its authorities, or concerning the delimitationof its frontiers or boundaries, or the endorsement of any product.
iii
The PARDYP Nepal Team
Anil Shrestha Sociologist
Bandana Prajapati On-farm coordinator
Bhawani S. Dongol Research Associate
Bhuban Shrestha Country Coordinator
Birendra Raj Adhikari Hydro-meteorologist
Diwakar Maskey Social Forester
Gopal Nakarmi Geologist
Juerg Merz Hydrologist
Keshar Man Sthapit Country Coordinator
Madhav P. Dhakal Research Associate
Madhav Pandey Social Forester
Megh Rajani Rai Sociologist
Prabhakar Bickram Shah Country Coordinator
Pradeep Man Dangol Research Associate
Prem Raj Neupane Agronomist
Radha Karki Social Forester
Smita Shrestha Water Management Assistant
Yamuna Ghale Agronomist

iv
v
CCoonntteennttss
Foreword viiAcknowledgements viiiExecutive Summary ixAcronyms and Abbreviations xi
11:: IINNTTRROODDUUCCTTIIOONN 11Background 1Brief Description of the Watersheds 3
22:: SSOOIILL LLOOSSSS AANNDD RRUUNNOOFFFF 99Background 9Soil Loss and Runoff Monitoring 10Farmer’s Perceptions 15Farm Management 16Lessons Learned and Recommendations 17
33:: WWAATTEERR SSCCAARRCCIITTYY 1199Background 19Water Demand and Supply 20Management Options 24Lessons Learned and Recommendations 34
44:: WWAATTEERR QQUUAALLIITTYY 3377Background 37Water Quality Monitoring 37Water Quality Improvement Options 38Lessons Learned and Recommendations 40
55:: OONN FFAARRMM 4411How Can Farmers Maintain or Improve Soil Fertility? 41Leachate Study in the Jhikhu Khola Watershed 44How to Rehabilitate Degraded Land 45How Can We Increase Farm Income? 49What Approaches Can be Used to Build the Capacity of Communities? 51How to Reduce Workloads, Especially of Women 54Lessons Learned and Recommendations 56
vi
66:: AACCCCEESSSS 5599Background 59What are Feasible Local Rules and Practices for Ensuring Equitable
Access to Natural Resources? 59Access to Institutions and Information 62Access to Natural Resources 62Decision-making for Different Activities 66Lessons Learned and Recommendations 67
77:: BBIIBBLLIIOOGGRRAAPPHHYY AANNDD FFUURRTTHHEERR RREEAADDIINNGG 6699
AANNNNEEXXEESS (on CD-ROM in back pocket)Annex 1: Rainfall of the Jhikhu and Yarsha Khola WatershedsAnnex 2. Rainfall of the Yarsha Khola WatershedAnnex 3: Description of the Soil Loss and Runoff PlotsAnnex 4: Soil Loss, Runoff, and Rainfall in the Jhikhu Khola WatershedAnnex 5. Soil Loss, Runoff, and Rainfall in the Yarsha Kola WatershedAnnex 6. Crop Water Requirement AnalysisAnnex 7. Rainfall AnalysisAnnex 8: Barabot Spring in Dhotra, Jhikhu Khola WatershedAnnex 9. Roof Rainwater Harvesting JarsAnnex 10. Monitoring of the Water Table in Dug Wells of the Jhikhu Khola
WatershedAnnex 11. Water BalanceAnnex 12. PARDYP’s Experience with the System of Rice IntensificationAnnex 13. Changing Cropping PatternsAnnex 14. Water Quality StudiesAnnex 15. Leachate Study in the Jhikhu Khola Watershed
vii
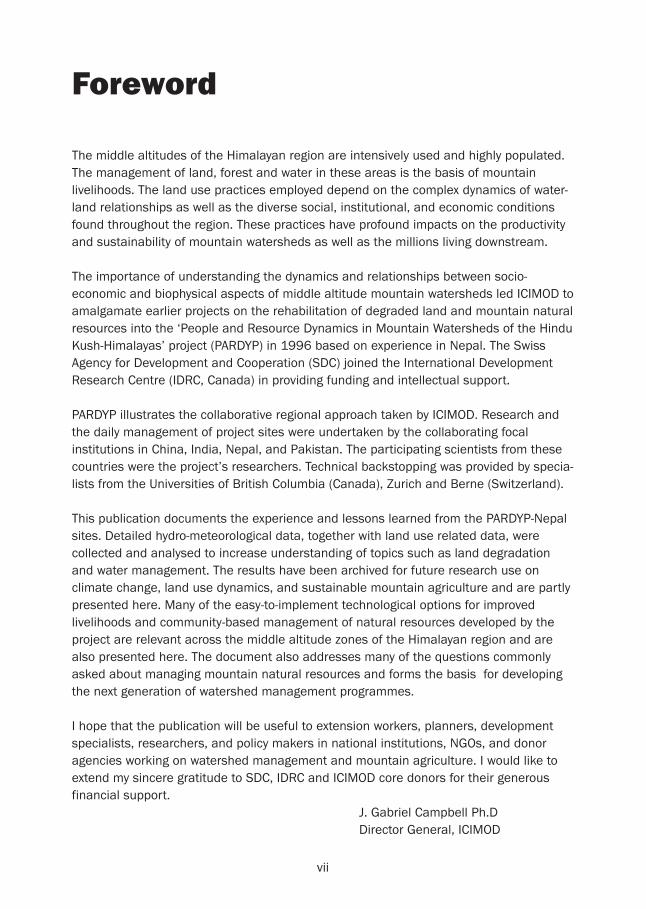
Foreword
The middle altitudes of the Himalayan region are intensively used and highly populated.The management of land, forest and water in these areas is the basis of mountainlivelihoods. The land use practices employed depend on the complex dynamics of water-land relationships as well as the diverse social, institutional, and economic conditionsfound throughout the region. These practices have profound impacts on the productivityand sustainability of mountain watersheds as well as the millions living downstream.
The importance of understanding the dynamics and relationships between socio-economic and biophysical aspects of middle altitude mountain watersheds led ICIMOD toamalgamate earlier projects on the rehabilitation of degraded land and mountain naturalresources into the ‘People and Resource Dynamics in Mountain Watersheds of the HinduKush-Himalayas’ project (PARDYP) in 1996 based on experience in Nepal. The SwissAgency for Development and Cooperation (SDC) joined the International DevelopmentResearch Centre (IDRC, Canada) in providing funding and intellectual support.
PARDYP illustrates the collaborative regional approach taken by ICIMOD. Research andthe daily management of project sites were undertaken by the collaborating focalinstitutions in China, India, Nepal, and Pakistan. The participating scientists from thesecountries were the project’s researchers. Technical backstopping was provided by specia-lists from the Universities of British Columbia (Canada), Zurich and Berne (Switzerland).
This publication documents the experience and lessons learned from the PARDYP-Nepalsites. Detailed hydro-meteorological data, together with land use related data, werecollected and analysed to increase understanding of topics such as land degradationand water management. The results have been archived for future research use onclimate change, land use dynamics, and sustainable mountain agriculture and are partlypresented here. Many of the easy-to-implement technological options for improvedlivelihoods and community-based management of natural resources developed by theproject are relevant across the middle altitude zones of the Himalayan region and arealso presented here. The document also addresses many of the questions commonlyasked about managing mountain natural resources and forms the basis for developingthe next generation of watershed management programmes.
I hope that the publication will be useful to extension workers, planners, developmentspecialists, researchers, and policy makers in national institutions, NGOs, and donoragencies working on watershed management and mountain agriculture. I would like toextend my sincere gratitude to SDC, IDRC and ICIMOD core donors for their generousfinancial support.
J. Gabriel Campbell Ph.DDirector General, ICIMOD
viii
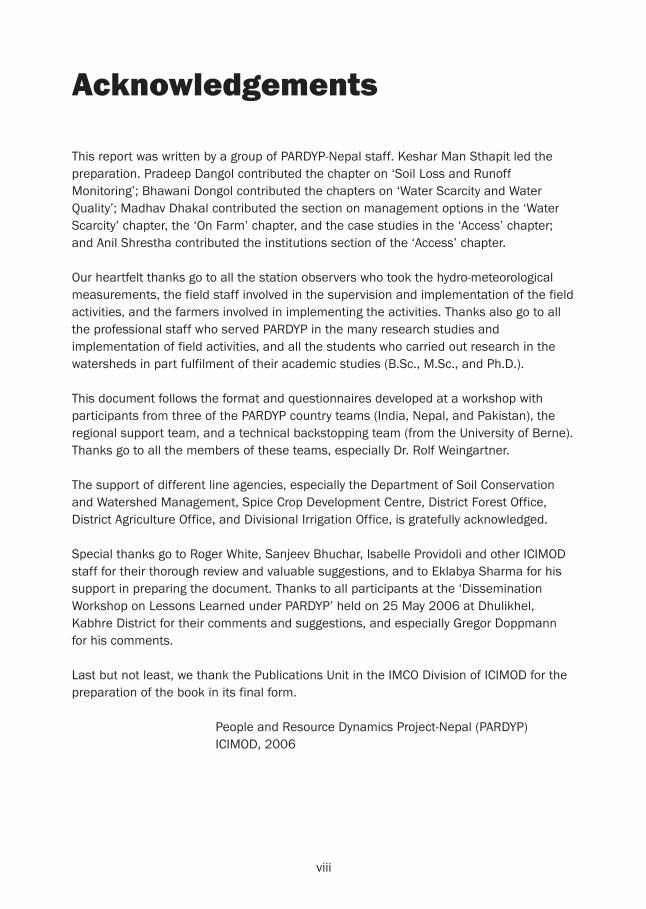
Acknowledgements
This report was written by a group of PARDYP-Nepal staff. Keshar Man Sthapit led thepreparation. Pradeep Dangol contributed the chapter on ‘Soil Loss and RunoffMonitoring’; Bhawani Dongol contributed the chapters on ‘Water Scarcity and WaterQuality’; Madhav Dhakal contributed the section on management options in the ‘WaterScarcity’ chapter, the ‘On Farm’ chapter, and the case studies in the ‘Access’ chapter;and Anil Shrestha contributed the institutions section of the ‘Access’ chapter.
Our heartfelt thanks go to all the station observers who took the hydro-meteorologicalmeasurements, the field staff involved in the supervision and implementation of the fieldactivities, and the farmers involved in implementing the activities. Thanks also go to allthe professional staff who served PARDYP in the many research studies andimplementation of field activities, and all the students who carried out research in thewatersheds in part fulfilment of their academic studies (B.Sc., M.Sc., and Ph.D.).
This document follows the format and questionnaires developed at a workshop withparticipants from three of the PARDYP country teams (India, Nepal, and Pakistan), theregional support team, and a technical backstopping team (from the University of Berne).Thanks go to all the members of these teams, especially Dr. Rolf Weingartner.
The support of different line agencies, especially the Department of Soil Conservationand Watershed Management, Spice Crop Development Centre, District Forest Office,District Agriculture Office, and Divisional Irrigation Office, is gratefully acknowledged.
Special thanks go to Roger White, Sanjeev Bhuchar, Isabelle Providoli and other ICIMODstaff for their thorough review and valuable suggestions, and to Eklabya Sharma for hissupport in preparing the document. Thanks to all participants at the ‘DisseminationWorkshop on Lessons Learned under PARDYP’ held on 25 May 2006 at Dhulikhel,Kabhre District for their comments and suggestions, and especially Gregor Doppmannfor his comments.
Last but not least, we thank the Publications Unit in the IMCO Division of ICIMOD for thepreparation of the book in its final form.
People and Resource Dynamics Project-Nepal (PARDYP)ICIMOD, 2006
ix
Executive Summary
From September 1996 to June 2006, ICIMOD conducted research to investigate thedynamics and relationships between socioeconomic and natural resources’ factors infive middle-mountain watersheds across the Himalayas (in China, India, Nepal, andPakistan). The People and Resource Dynamics Project (PARDYP) in Mountain Watershedsof the Hindu Kush-Himalayas was funded by the Swiss Agency for Development andCooperation (SDC) and the International Development Research Centre (IDRC).
The research focused on farming systems, agricultural productivity, water managementand access, and equity issues in resource management for middle-mountain watershedareas of the region. It aimed to design future interventions, and to scale up thesuccesses thus far achieved. This publications summarises the lessons learned andrecommendations from the project activities in Nepal as follows.• Erosion studies from Jhikhu and Yarsha Khola watersheds show that soil erosion
from properly farmer managed agricultural land is much less than originallybelieved. However, erosion increases when the slope is more than 10 degrees.Most sedimentation originates from areas such as landslips, degraded slopes,roadsides, gullies, and stream banks. Peak runoff is generally observed duringintense and high rainfall reaching daily amounts of 100 mm or more.
• Nutrient leaching is a far more important issue to farmers than farm soil erosion.In rainfed agricultural land, the leaching volume at 45 cm depth in the soil profile issignificantly higher than surface runoff.
• Increasing demand for water. Upland communities are concerned about low flowsduring the pre- and post-monsoon seasons, which affect both irrigation andhousehold needs. However, the data show that the low-flow problem is not due toreduced precipitation or water supply within the watershed, but mainly to increasingdemand for water – both for irrigation and drinking – and to poor local watermanagement.
• Improving water management. Some tested technological options include eyebrowpitting in degraded land for improving soil moisture, catchment conservation toimprove water availability for drinking water, plastic lined conservation ponds toharvest surface water for irrigation, and harvesting roof-water for drinking purposes.Drip and sprinkler irrigation techniques and the System of Rice Intensification (SRI)are among other options tested for increasing the efficiency of water use.
• PARDYP’s research on water quality shows that microbiological contamination ofdrinking water is severe and must be addressed through preventing contaminationand improved treatment of both catchments and water sources.
• Forest area cover in the Jhikhu Khola watershed remained stable between 1972and 1996. Forest density improved significantly during the same period mainly asa result of community forestry programmes that increased people’s participation andownership in the management of forests. The entire community forest area within

x
the Jhikhu Khola watershed was mapped showing forest types, tree density, andmaturity class. These maps helped the District Forest Office Kabhre in planning thecommunity forestry programme in the watershed.
• Agriculture in the middle-mountain watersheds of the Himalayan region isintensifying and becoming more market oriented, especially in areas with irrigationfacilities and links to markets. However, in order to sustain higher production levels,farmers are applying very high doses of pesticides and chemical fertilisers, whichhas a negative impact on ecosystems.
• Black plastic composting with the use of effective micro-organisms has enhancedthe decomposition process and produced better fertiliser to address soil-nutrientneeds.
• The challenge in the middle mountain watersheds is to increase the income ofsmallholder farmers, especially those cultivating rainfed land. Low levels ofproduction and small landholdings are pushing young farmers to migrate tourban/semi-urban areas.
• Issues of poor access, equity, and governance are still of concern and needproper attention. The workload for mountain women remains higher than for menthroughout the year, especially in fetching water, collecting fodder and fuelwood, andhousehold work. In the Jhikhu Khola watershed, women typically work 3.8 hourslonger per day than men, and 68% of water fetching is done by women. Roofwaterharvesting saved women up to 27 minutes on average for each trip to fetch water inthe Jhikhu Khola watershed. Similarly, fodder development on their private land cansave women 60 to 90 minutes per day for fodder collection.
• Dissemination and scaling up of the lessons is a major challenge. Sharing ofmessages (success and failure stories) among villages through exchange visits, on-site training camps, farmer field schools, national workshops, farmer days, andsimilar, has been very effective. In addition, participatory action research proved tobe effective in testing new technologies together with farmers. This approachstrengthened farmers’ behaviour to be research oriented in other areas, which isessential for improving livelihoods.
xi
Acronyms and Abbreviations
DAP diammonium phosphateDDC district development committeeDSCWM Department of Soil Conservation and Watershed ManagementEC electrical conductivityEEC European Economic CommissionEM effective microorganismsGOs government officesICIMOD International Centre for Integrated Mountain Development IDRC International Development Research CentreNGO non-government organisationNRs Nepalese rupeesNTU nephelometric turbidity unitPARDYP People and Resource Dynamics ProjectRWSSSP Rural Water Supply and Sanitation Support ProgrammeSCDC Spice Crop Development CentreSDC Swiss Agency for Development and CooperationSODIS solar water disinfectionSRI System of Rice IntensificationUSD United States dollarVDC village development committee
Currency EquivalentIn this report all references to rupees (Rs) are to Nepalese rupees
Currency Unit – Nepalese rupees (NRs)$1 = NRs 56.75 (as of December 1996)$1 = NRs 71.40 (as of December 2006)
Notes(i) The Nepalese calendar year (B.S.) runs from mid April to mid April. Unless
otherwise stated, year ranges written in the form 2005/06 denote a singlecalendar year.
(ii) In this report, $ refers to US dollars.(iii) In this report, tons (t) refer to metric tons or tonnes (1,000 kg).

xii

1Introduction
1 –
Intr
odu
ctio
n
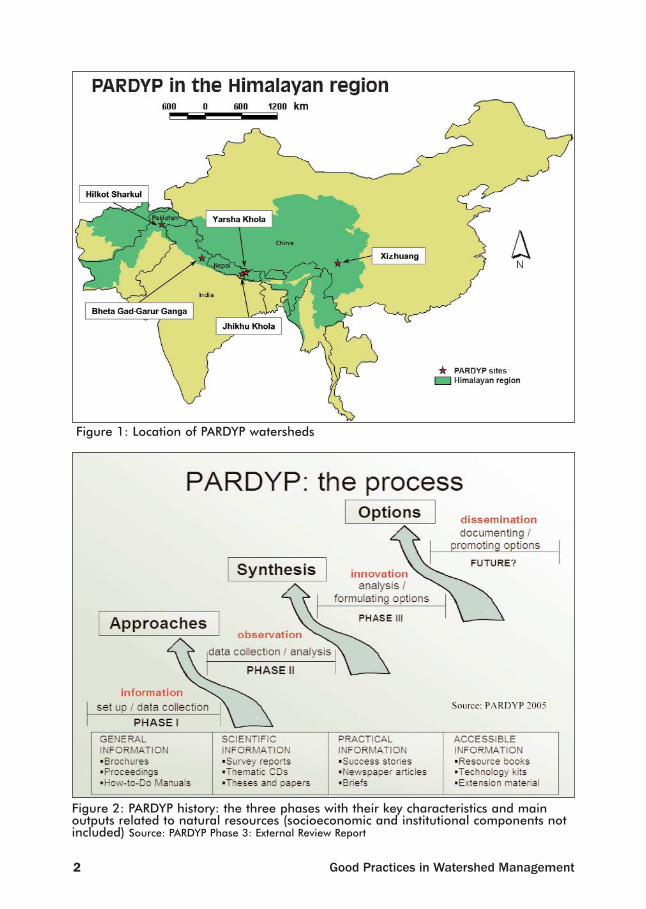
BackgroundThe ‘People and Resource Dynamics Project’ (PARDYP) in mountain watersheds of theHindu Kush-Himalayas started in October 1996 and continued through three phases toJune 2006. It evolved from two projects funded by the International DevelopmentResearch Centre (IDRC): the ‘Mountain Resource Management Project’ (in collaborationwith the University of British Columbia) and the ‘Rehabilitation of Degraded Lands inMountain Ecosystems Project’. PARDYP was a long-term regional interdisciplinaryresearch programme for watershed development concerned primarily with naturalresource dynamics and degradation processes and their effects on livelihoods. Theproject covered four countries – China, India, Nepal, and Pakistan – with fivewatersheds: two in Nepal (Jhikhu Khola and Yarsha Khola), and one each in India (BhetaGad Garur Ganga), Pakistan (Hilkot-Sharkul), and China (Xi Zhuang) (Figure 1). Activitiesin the Yarsha Khola were discontinued in June 2001 as a result of security problems.ICIMOD was able to broaden PARDYP’s partnership and funding support to include notonly IDRC but also the Swiss Agency for Development and Cooperation (SDC). Thestrategic inputs and support of the University of British Columbia continued, and werejoined by the University of Berne and the University of Zurich.
The first phase of PARDYP (October 1996 to September 1999) was devoted toestablishing research infrastructure, human resources, and systems (Figure 2). In Phase1 the natural resources research dimensions received more emphasis than social,institutional, or economic issues. The second phase of PARDYP (October 1999 toDecember 2002) was designed to enhance the community-based approach and to targetpoverty reduction and improved management of natural resources. The project focusedon the development and use of participatory, community-based decision-makingprocesses and developing relevant methodologies. During the third phase of PARDYP(January 2003 to June 2006), the focus was on research for development, with a betterbalance between natural resources, socioeconomic, and institutional components. Anexternal review portrayed the three phases of PARDYP as an evolutionary process fromestablishment (set up/data collection), through implementation (data collection/analysis), to consolidation (analysis/formulating of options).
Sharing of ideas, successes and failures, and research methods by PARDYP partnersfrom all the participating countries contributed significantly to the success of PARDYPresearch at the country level. Following completion of the project, we are following anumber of pathways to disseminate the learning more widely with the aim of contributingto the development of more effective watershed management approaches in other
1 INTRODUCTION
2 Good Practices in Watershed Management
Figure 1: Location of PARDYP watersheds
Figure 2: PARDYP history: the three phases with their key characteristics and mainoutputs related to natural resources (socioeconomic and institutional components notincluded) Source: PARDYP Phase 3: External Review Report
3Introduction
1 –
Intr
odu
ctio
n
watersheds in the Himalayan region. The present document is one of these pathways. Init, we summarise the learning from the two watersheds in Nepal during the lifetime ofthe project in order to share the knowledge with others, as well as to provide a record ofthe achievements.
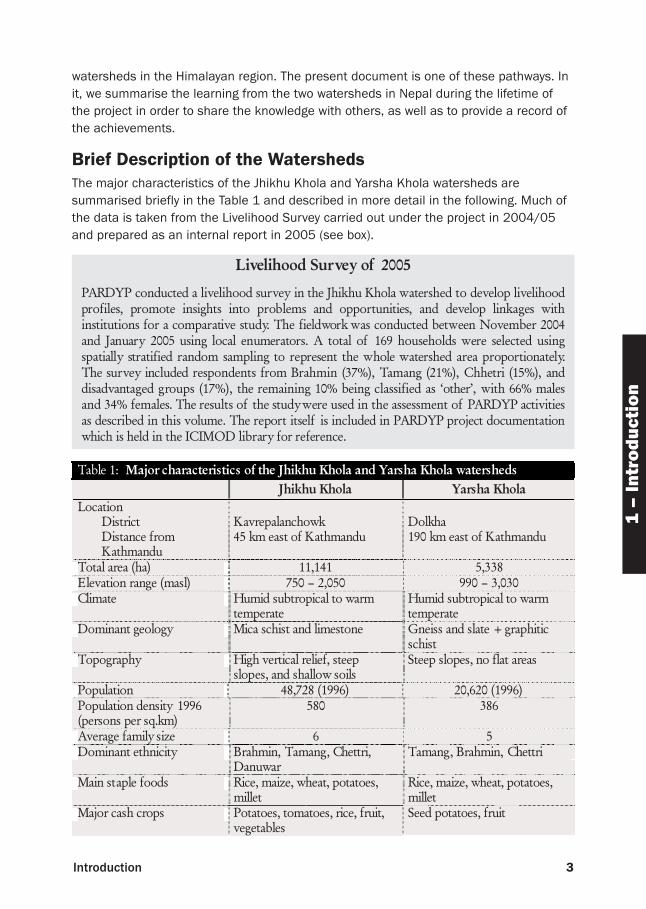
Brief Description of the Watersheds The major characteristics of the Jhikhu Khola and Yarsha Khola watersheds aresummarised briefly in the Table 1 and described in more detail in the following. Much ofthe data is taken from the Livelihood Survey carried out under the project in 2004/05and prepared as an internal report in 2005 (see box).
Table 1: Major characteristics of the Jhikhu Khola and Yarsha Khola watersheds Jhikhu Khola Yarsha Khola
Location District Distance from Kathmandu
Kavrepalanchowk 45 km east of Kathmandu
Dolkha 190 km east of Kathmandu
Total area (ha) 11,141 5,338 Elevation range (masl) 750 – 2,050 990 – 3,030 Climate Humid subtropical to warm
temperate Humid subtropical to warm temperate
Dominant geology Mica schist and limestone Gneiss and slate + graphitic schist
Topography High vertical relief, steep slopes, and shallow soils
Steep slopes, no flat areas
Population 48,728 (1996) 20,620 (1996) Population density 1996 (persons per sq.km)
580 386
Average family size 6 5 Dominant ethnicity Brahmin, Tamang, Chettri,
Danuwar Tamang, Brahmin, Chettri
Main staple foods Rice, maize, wheat, potatoes, millet
Rice, maize, wheat, potatoes, millet
Major cash crops Potatoes, tomatoes, rice, fruit, vegetables
Seed potatoes, fruit
Livelihood Survey of 2005
PARDYP conducted a livelihood survey in the Jhikhu Khola watershed to develop livelihoodprofiles, promote insights into problems and opportunities, and develop linkages withinstitutions for a comparative study. The fieldwork was conducted between November 2004and January 2005 using local enumerators. A total of 169 households were selected usingspatially stratified random sampling to represent the whole watershed area proportionately.The survey included respondents from Brahmin (37%), Tamang (21%), Chhetri (15%), anddisadvantaged groups (17%), the remaining 10% being classified as ‘other’, with 66% malesand 34% females. The results of the study were used in the assessment of PARDYP activitiesas described in this volume. The report itself is included in PARDYP project documentationwhich is held in the ICIMOD library for reference.
4 Good Practices in Watershed Management
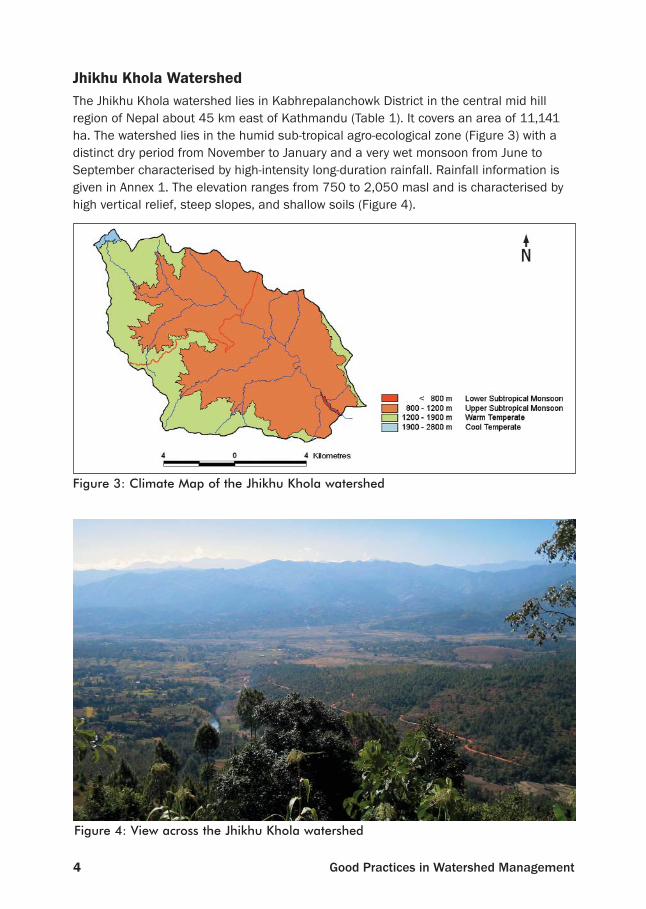
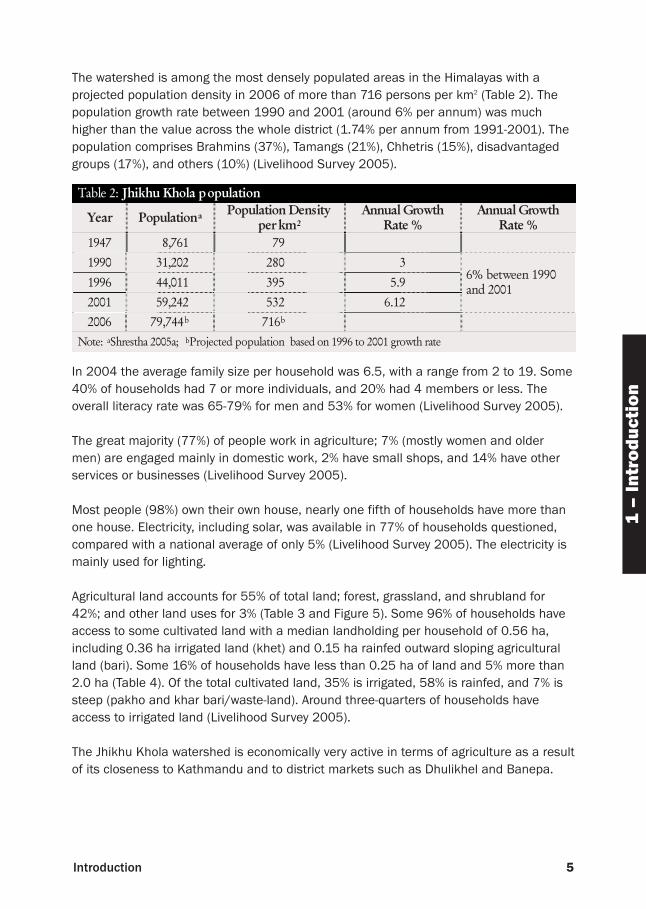
Jhikhu Khola WatershedThe Jhikhu Khola watershed lies in Kabhrepalanchowk District in the central mid hillregion of Nepal about 45 km east of Kathmandu (Table 1). It covers an area of 11,141ha. The watershed lies in the humid sub-tropical agro-ecological zone (Figure 3) with adistinct dry period from November to January and a very wet monsoon from June toSeptember characterised by high-intensity long-duration rainfall. Rainfall information isgiven in Annex 1. The elevation ranges from 750 to 2,050 masl and is characterised byhigh vertical relief, steep slopes, and shallow soils (Figure 4).
Figure 3: Climate Map of the Jhikhu Khola watershed
Figure 4: View across the Jhikhu Khola watershed
5Introduction
1 –
Intr
odu
ctio
n
The watershed is among the most densely populated areas in the Himalayas with aprojected population density in 2006 of more than 716 persons per km2 (Table 2). Thepopulation growth rate between 1990 and 2001 (around 6% per annum) was muchhigher than the value across the whole district (1.74% per annum from 1991-2001). Thepopulation comprises Brahmins (37%), Tamangs (21%), Chhetris (15%), disadvantagedgroups (17%), and others (10%) (Livelihood Survey 2005).
In 2004 the average family size per household was 6.5, with a range from 2 to 19. Some40% of households had 7 or more individuals, and 20% had 4 members or less. Theoverall literacy rate was 65-79% for men and 53% for women (Livelihood Survey 2005).
The great majority (77%) of people work in agriculture; 7% (mostly women and oldermen) are engaged mainly in domestic work, 2% have small shops, and 14% have otherservices or businesses (Livelihood Survey 2005).
Most people (98%) own their own house, nearly one fifth of households have more thanone house. Electricity, including solar, was available in 77% of households questioned,compared with a national average of only 5% (Livelihood Survey 2005). The electricity ismainly used for lighting.
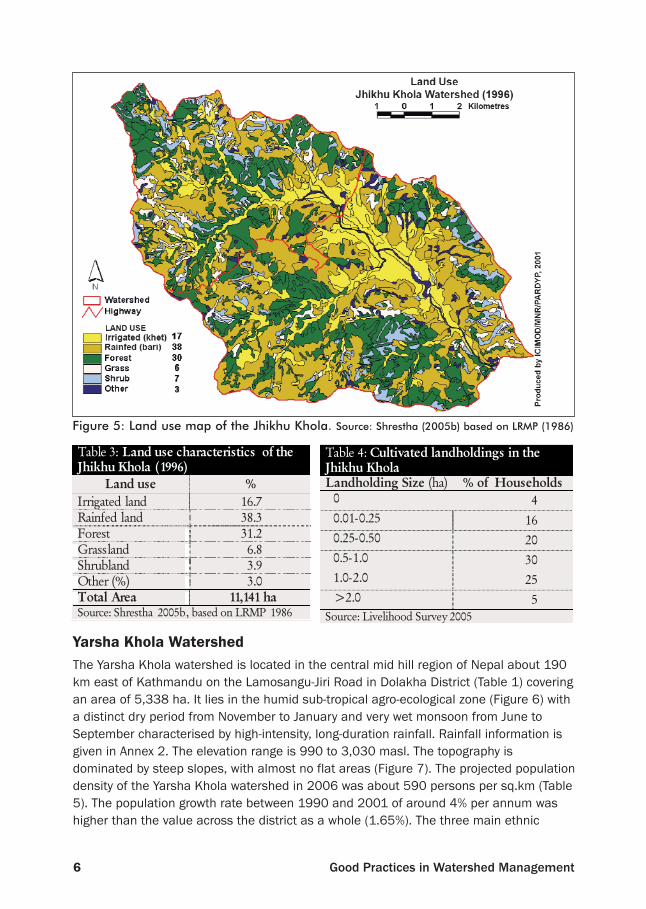
Agricultural land accounts for 55% of total land; forest, grassland, and shrubland for42%; and other land uses for 3% (Table 3 and Figure 5). Some 96% of households haveaccess to some cultivated land with a median landholding per household of 0.56 ha,including 0.36 ha irrigated land (khet) and 0.15 ha rainfed outward sloping agriculturalland (bari). Some 16% of households have less than 0.25 ha of land and 5% more than2.0 ha (Table 4). Of the total cultivated land, 35% is irrigated, 58% is rainfed, and 7% issteep (pakho and khar bari/waste-land). Around three-quarters of households haveaccess to irrigated land (Livelihood Survey 2005).
The Jhikhu Khola watershed is economically very active in terms of agriculture as a resultof its closeness to Kathmandu and to district markets such as Dhulikhel and Banepa.
Table 2: Jhikhu Khola population
Year Populationa Population Density per km2
Annual Growth Rate %
Annual Growth Rate %
1947 8,761 79
1990 31,202 280 3
1996 44,011 395 5.9
2001 59,242 532 6.12
6% between 1990 and 2001
2006 79,744b 716b
Note: aShrestha 2005a; bProjected population based on 1996 to 2001 growth rate
6 Good Practices in Watershed Management
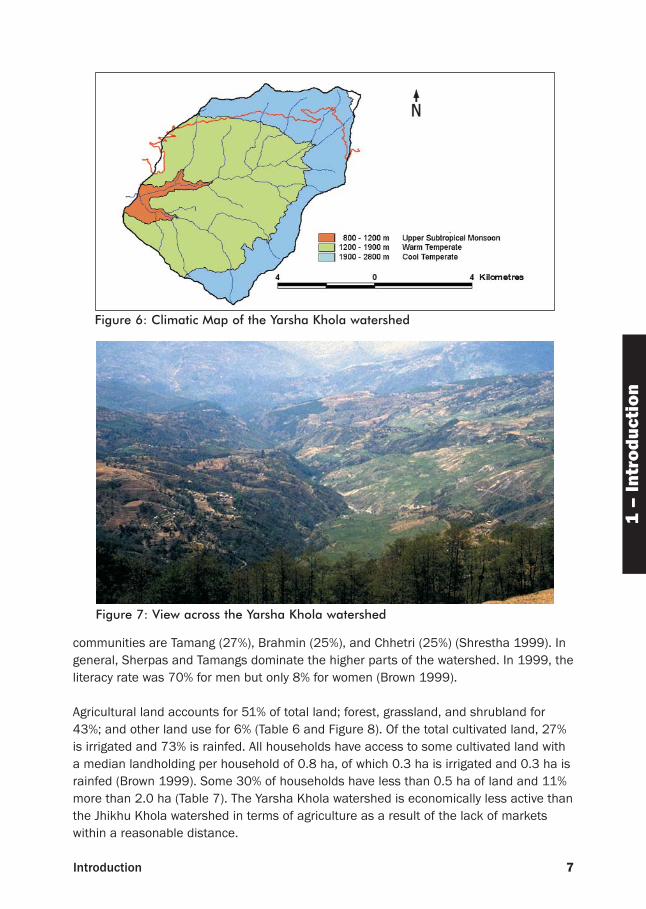
Yarsha Khola WatershedThe Yarsha Khola watershed is located in the central mid hill region of Nepal about 190km east of Kathmandu on the Lamosangu-Jiri Road in Dolakha District (Table 1) coveringan area of 5,338 ha. It lies in the humid sub-tropical agro-ecological zone (Figure 6) witha distinct dry period from November to January and very wet monsoon from June toSeptember characterised by high-intensity, long-duration rainfall. Rainfall information isgiven in Annex 2. The elevation range is 990 to 3,030 masl. The topography isdominated by steep slopes, with almost no flat areas (Figure 7). The projected populationdensity of the Yarsha Khola watershed in 2006 was about 590 persons per sq.km (Table5). The population growth rate between 1990 and 2001 of around 4% per annum washigher than the value across the district as a whole (1.65%). The three main ethnic
Figure 5: Land use map of the Jhikhu Khola. Source: Shrestha (2005b) based on LRMP (1986)
Table 3: Land use characteristics of the Jhikhu Khola (1996)
Land use % Irrigated land 16.7 Rainfed land 38.3 Forest 31.2 Grassland 6.8 Shrubland 3.9 Other (%) 3.0 Total Area 11,141 ha Source: Shrestha 2005b, based on LRMP 1986
Table 4: Cultivated landholdings in the Jhikhu Khola Landholding Size (ha) % of Households
0 4
0.01-0.25 16
0.25-0.50 20
0.5-1.0 30
1.0-2.0 25
> 2.0 5
Source: Livelihood Survey 2005
7Introduction
1 –
Intr
odu
ctio
ncommunities are Tamang (27%), Brahmin (25%), and Chhetri (25%) (Shrestha 1999). Ingeneral, Sherpas and Tamangs dominate the higher parts of the watershed. In 1999, theliteracy rate was 70% for men but only 8% for women (Brown 1999).
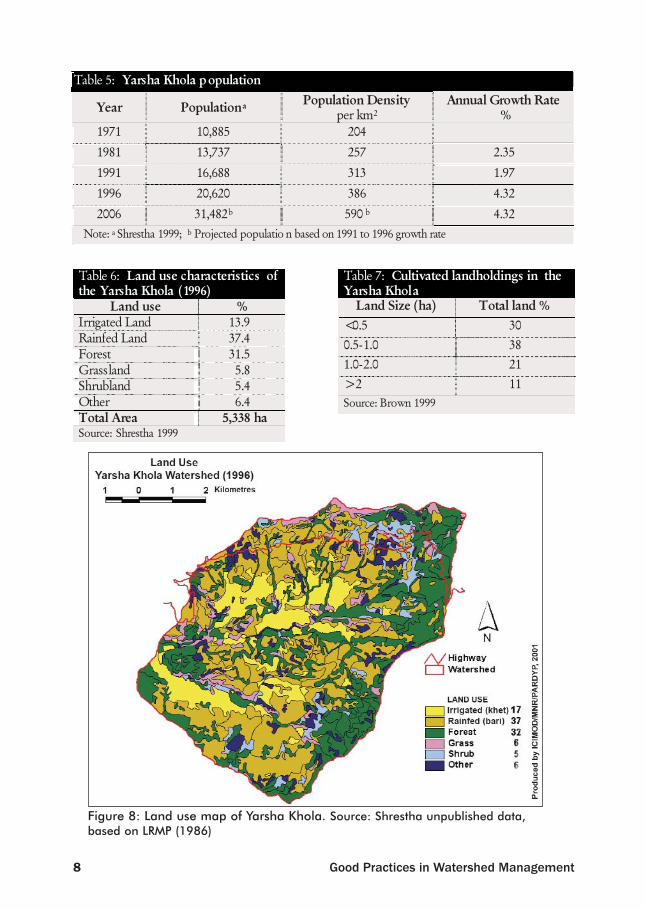
Agricultural land accounts for 51% of total land; forest, grassland, and shrubland for43%; and other land use for 6% (Table 6 and Figure 8). Of the total cultivated land, 27%is irrigated and 73% is rainfed. All households have access to some cultivated land witha median landholding per household of 0.8 ha, of which 0.3 ha is irrigated and 0.3 ha israinfed (Brown 1999). Some 30% of households have less than 0.5 ha of land and 11%more than 2.0 ha (Table 7). The Yarsha Khola watershed is economically less active thanthe Jhikhu Khola watershed in terms of agriculture as a result of the lack of marketswithin a reasonable distance.
Figure 6: Climatic Map of the Yarsha Khola watershed
Figure 7: View across the Yarsha Khola watershed
8 Good Practices in Watershed Management
Figure 8: Land use map of Yarsha Khola. Source: Shrestha unpublished data,based on LRMP (1986)
Table 7: Cultivated landholdings in the Yarsha Khola
Land Size (ha) Total land % <0.5 30
0.5-1.0 38
1.0-2.0 21
> 2 11
Source: Brown 1999
Table 6: Land use characteristics of the Yarsha Khola (1996)
Land use % Irrigated Land 13.9 Rainfed Land 37.4 Forest 31.5 Grassland 5.8 Shrubland 5.4 Other 6.4 Total Area 5,338 ha Source: Shrestha 1999
Table 5: Yarsha Khola population
Year Populationa Population Density per km2
Annual Growth Rate %
1971 10,885 204
1981 13,737 257 2.35
1991 16,688 313 1.97
1996 20,620 386 4.32
2006 31,482b 590 b 4.32
Note: a Shrestha 1999; b Projected populatio n based on 1991 to 1996 growth rate
9Soil Loss and Runoff
2 –
So
il L
oss
and
Run
off
BackgroundOne of the underlying assumptions behind the PARDYP research was that soil erosion isa major problem, leading to environmental degradation, lower yield, and ultimatelyincreasing the poverty of mountain farmers. This is a plausible scenario and fits well withreports of deforestation and soil erosion in the Himalayas. However, the question ofwhether there is a soil erosion problem, especially on rainfed agricultural land in themiddle mountains of the Himalayan region, demands critical review. PARDYP’s studiesindicate that the amount of soil erosion from agricultural land is much less thangenerally perceived; the greater part of transported sediment comes from stream andriverbank cuttings, landslips, and erosion from increased runoff associated with roads,footpaths, and settlements. It appears that the soil conservation measures adopted byfarmers are effective in reducing soil erosion.
Several studies have shown that significant erosion is taking place in the Himalayanregion and that these mountains are a huge source of sediment. In 1976, E.P. Eckholmconcluded in his book Losing Ground, Environmental Stress and World Food Prospectusthat “There is no better place to begin an examination of deteriorating mountainenvironments than Nepal”. Some sediment observations are described in the following.
• The annual sediment measured at Tribeni in the Tamur, Sunkoshi, and Arun riverswere equivalent to losses of 61, 27, and 12 m3/ha in the watershed areas,respectively (after Gupta 1975).
• The Koshi River in Bihar shifted over 110 km from east to west between 1731 and1963, destroying about 7,800 sq.km of land in Bihar, India (Gole and Chitale 1966),and 1,300 sq.km in Nepal with sand deposits, wiping out towns and villages, anddisplacing 6.5 million people (Rieger 1976).
• Satellite imagery reveals that a 40,000 sq.km island is forming in the Bay of Bengalfrom the silt transferred by Himalayan rivers (Sterling 1976), of which Nepal is themajor contributor. The riverbeds are estimated to be rising by 10 to 30 cm per yearfrom silt being deposited (HMGN 1975).
• A sedimentation survey of the Kulekhani Reservoir indicated that the averagesediment contribution between the time it was dammed in 1982 to March 1993 wasequivalent to a loss of 42 m3 per ha per yr across the 125 sq.km watershed. Duringthe disastrous 1993 monsoon, this rate increased to 415 m3 per ha (Sthapit 1996).
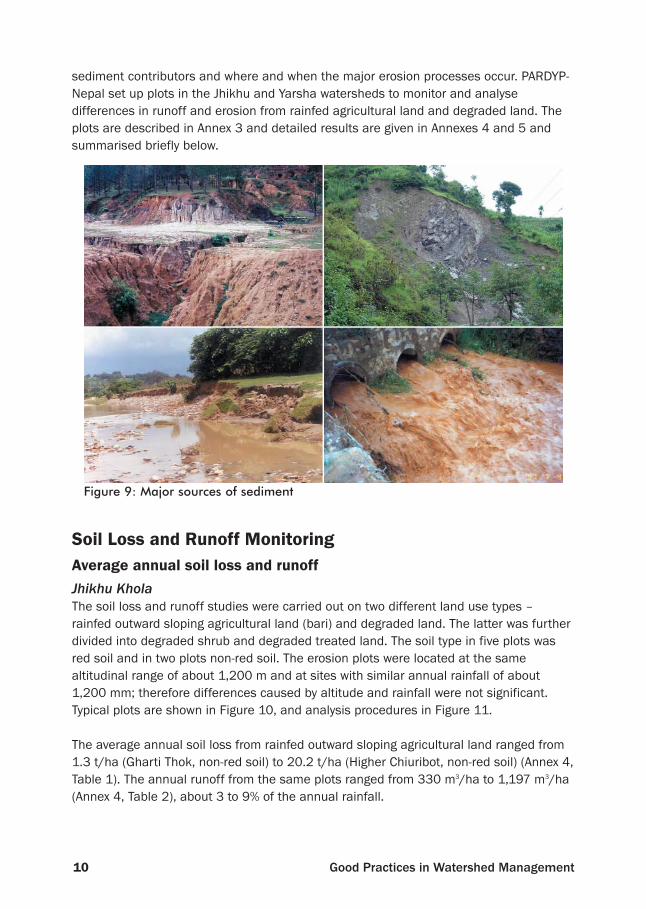
The various studies indicate that the major sources of sediment are gully erosion,landslides, stream bank cutting, and sediment-laden flow (Figure 9). The PARDYP studysought to find out which part of the watershed and what land uses are the major
2 SOIL LOSS AND RUNOFF
10 Good Practices in Watershed Management
sediment contributors and where and when the major erosion processes occur. PARDYP-Nepal set up plots in the Jhikhu and Yarsha watersheds to monitor and analysedifferences in runoff and erosion from rainfed agricultural land and degraded land. Theplots are described in Annex 3 and detailed results are given in Annexes 4 and 5 andsummarised briefly below.
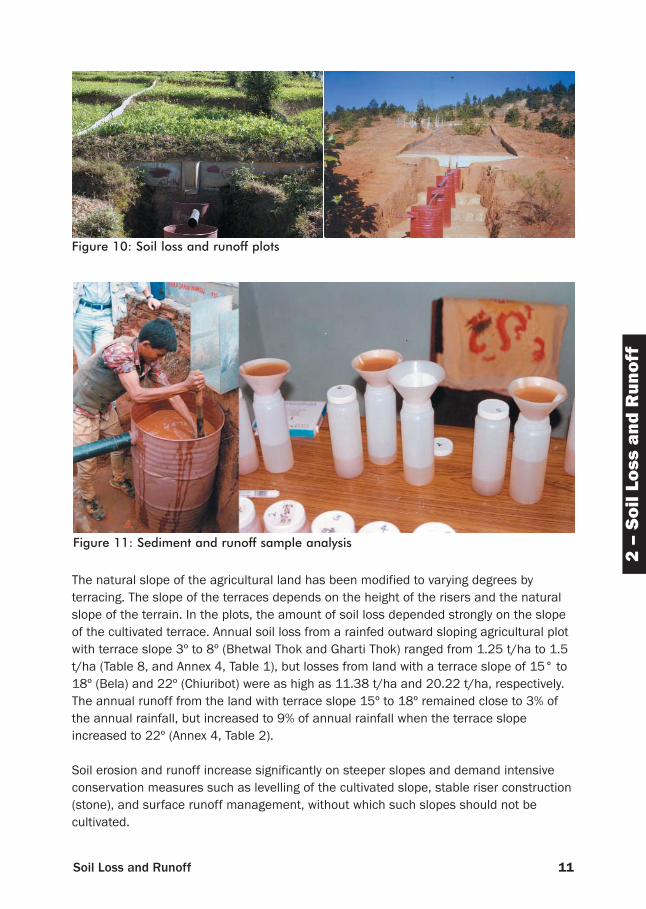
Soil Loss and Runoff MonitoringAverage annual soil loss and runoffJhikhu Khola The soil loss and runoff studies were carried out on two different land use types –rainfed outward sloping agricultural land (bari) and degraded land. The latter was furtherdivided into degraded shrub and degraded treated land. The soil type in five plots wasred soil and in two plots non-red soil. The erosion plots were located at the samealtitudinal range of about 1,200 m and at sites with similar annual rainfall of about1,200 mm; therefore differences caused by altitude and rainfall were not significant.Typical plots are shown in Figure 10, and analysis procedures in Figure 11.
The average annual soil loss from rainfed outward sloping agricultural land ranged from1.3 t/ha (Gharti Thok, non-red soil) to 20.2 t/ha (Higher Chiuribot, non-red soil) (Annex 4,Table 1). The annual runoff from the same plots ranged from 330 m3/ha to 1,197 m3/ha(Annex 4, Table 2), about 3 to 9% of the annual rainfall.
Figure 9: Major sources of sediment
11Soil Loss and Runoff
2 –
So
il L
oss
and
Run
off
The natural slope of the agricultural land has been modified to varying degrees byterracing. The slope of the terraces depends on the height of the risers and the naturalslope of the terrain. In the plots, the amount of soil loss depended strongly on the slopeof the cultivated terrace. Annual soil loss from a rainfed outward sloping agricultural plotwith terrace slope 3º to 8º (Bhetwal Thok and Gharti Thok) ranged from 1.25 t/ha to 1.5t/ha (Table 8, and Annex 4, Table 1), but losses from land with a terrace slope of 15° to18º (Bela) and 22º (Chiuribot) were as high as 11.38 t/ha and 20.22 t/ha, respectively.The annual runoff from the land with terrace slope 15º to 18º remained close to 3% ofthe annual rainfall, but increased to 9% of annual rainfall when the terrace slopeincreased to 22º (Annex 4, Table 2).
Soil erosion and runoff increase significantly on steeper slopes and demand intensiveconservation measures such as levelling of the cultivated slope, stable riser construction(stone), and surface runoff management, without which such slopes should not becultivated.
Figure 10: Soil loss and runoff plots
Figure 11: Sediment and runoff sample analysis
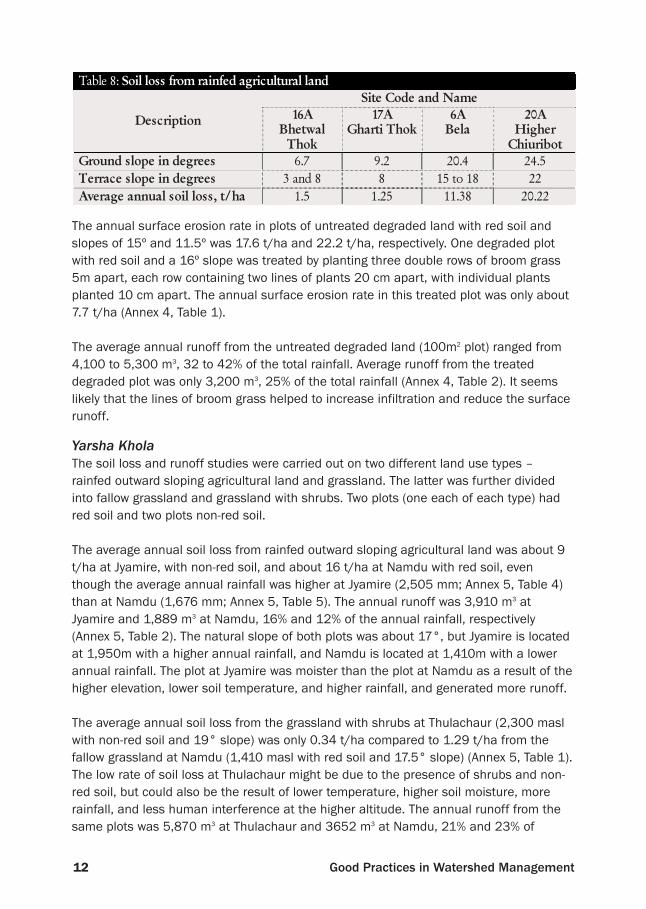
12 Good Practices in Watershed Management
The annual surface erosion rate in plots of untreated degraded land with red soil andslopes of 15º and 11.5º was 17.6 t/ha and 22.2 t/ha, respectively. One degraded plotwith red soil and a 16º slope was treated by planting three double rows of broom grass5m apart, each row containing two lines of plants 20 cm apart, with individual plantsplanted 10 cm apart. The annual surface erosion rate in this treated plot was only about7.7 t/ha (Annex 4, Table 1).
The average annual runoff from the untreated degraded land (100m2 plot) ranged from4,100 to 5,300 m3, 32 to 42% of the total rainfall. Average runoff from the treateddegraded plot was only 3,200 m3, 25% of the total rainfall (Annex 4, Table 2). It seemslikely that the lines of broom grass helped to increase infiltration and reduce the surfacerunoff.
Yarsha KholaThe soil loss and runoff studies were carried out on two different land use types –rainfed outward sloping agricultural land and grassland. The latter was further dividedinto fallow grassland and grassland with shrubs. Two plots (one each of each type) hadred soil and two plots non-red soil.
The average annual soil loss from rainfed outward sloping agricultural land was about 9t/ha at Jyamire, with non-red soil, and about 16 t/ha at Namdu with red soil, eventhough the average annual rainfall was higher at Jyamire (2,505 mm; Annex 5, Table 4)than at Namdu (1,676 mm; Annex 5, Table 5). The annual runoff was 3,910 m3 atJyamire and 1,889 m3 at Namdu, 16% and 12% of the annual rainfall, respectively(Annex 5, Table 2). The natural slope of both plots was about 17°, but Jyamire is locatedat 1,950m with a higher annual rainfall, and Namdu is located at 1,410m with a lowerannual rainfall. The plot at Jyamire was moister than the plot at Namdu as a result of thehigher elevation, lower soil temperature, and higher rainfall, and generated more runoff.
The average annual soil loss from the grassland with shrubs at Thulachaur (2,300 maslwith non-red soil and 19° slope) was only 0.34 t/ha compared to 1.29 t/ha from thefallow grassland at Namdu (1,410 masl with red soil and 17.5° slope) (Annex 5, Table 1).The low rate of soil loss at Thulachaur might be due to the presence of shrubs and non-red soil, but could also be the result of lower temperature, higher soil moisture, morerainfall, and less human interference at the higher altitude. The annual runoff from thesame plots was 5,870 m3 at Thulachaur and 3652 m3 at Namdu, 21% and 23% of
Table 8: Soil loss from rainfed agricultural land Site Code and Name
Description 16A Bhetwal
Thok
17A Gharti Thok
6A Bela
20A Higher
Chiuribot Ground slope in degrees 6.7 9.2 20.4 24.5
Terrace slope in degrees 3 and 8 8 15 to 18 22
Average annual soil loss, t/ha 1.5 1.25 11.38 20.22
13Soil Loss and Runoff
2 –
So
il L
oss
and
Run
off
annual rainfall respectively. Namdu had significantly less rainfall than Thulachaur (1,585and 2,768 mm respectively, see Annex 5, Table 2).
Seasonal variation and maximum eventsThere were marked seasonal variations in soil loss and runoff, which are highest duringthe monsoon, followed by the pre-monsoon, and then the post-monsoon. Soil loss andrunoff were insignificant during winter in all land use types.
Jhikhu Khola Soil loss during the pre-monsoon period (March-May) was significant even though onlyabout 15% of annual rainfall occurs in this period. About 44 % of the annual soil lossfrom degraded land, 26% from degraded shrubland, 8% from treated degraded land, and32 to 68% from rainfed outward sloping agricultural land occurred during the pre-monsoon period (Annex 4, Table 7).
More than 75% of annual rainfall occurs during the monsoon (June-September); theannual soil loss during this period was 54% from degraded land, 72% from degradedshrubland, 91% from treated degraded land, and 31 to 68% from rainfed outward slopingagricultural land (Annex 4, Table 7). Soil loss during the post-monsoon and winter periodswas insignificant.
The highest soil loss events observed in each of the plot types were during the pre-monsoon period (Annex 4, Table 8). The highest event in untreated degraded land was9.66 t/ha on 8 May 1998, when 10 minute (I10), 30 minute (I30), and 60 minute (I60)rainfall intensities were 100, 44.3, and 23.2 mm/hr, respectively, and in the treateddegraded plot was 10.05 t/ha on 10 June 1999, when I10, I30, and I60 were 65.7, 37.8,and 20.9 mm/h, respectively. The highest soil loss event observed in rainfed outwardsloping agricultural land was 25.96 t/ha on 28 May 1993, during a cloudburst. Thisrunoff plot was only established in 1993, and the high value of soil loss might have beencaused by excessive soil work. The highest soil loss events observed during the monsoonwere 8.34 t/ha on 10 June 1999 from degraded land, when I10, I30, and I60 rainfallintensities were 93, 36, and 23 mm/hr, respectively; and 11.95 t/ha on 27 June 1996from rainfed outward sloping agricultural land, when I10, I30, and I60 rainfall intensitieswere 76, 42, and 33 mm/h, respectively (Annex 4, Table 9).
Seasonal runoff correlated well with seasonal rainfall in rainfed outward sloping agriculturalland — annual runoff during the monsoon period from 70 to 82% compared to rainfallproportion of 78% — and for the degraded shrubland at Baghkhor — annual runoff duringthe monsoon period 77%, compared to rainfall proportion of 80% (Annex 4, Table 7).However, the proportion of runoff during the monsoon from the untreated degraded land atKubinde was higher than the proportion of rainfall — 85% compared to 71%.
The highest runoff events occurred during the monsoon (5 plots) or pre-monsoon (2plots) (Annex 4, Table 10). The highest runoffs were generally the outcome of intenseand high rainfall. The highest daily runoffs recorded were all from degraded land (shrub,
14 Good Practices in Watershed Management
treated, and untreated) and above 500 m3/ha, with daily rainfall of were 140 mm orhigher. One day with similarly high rainfall in the rainfed agricultural land plot led to asimilarly high runoff of 457 m3/ha. Land use did have an effect on runoff, but whenrainfall exceeds the absorptive capacity of the soil there will always be excess runoff.High runoff can contribute to flooding.
Yarsha KholaSoil loss during the pre-monsoon period (March-May) was also significant in the sites inthe Yarsha Khola watershed, 19 to 24% of annual soil loss from grassland and 25 to53% from rainfed outward sloping agricultural land compared with only 15% of annualrainfall. The proportion of soil loss during the monsoon period — with 75% of the annualrainfall — was 75 to 80% of the annual total for grassland and 47 to 75% for rainfedoutward sloping agricultural land (Annex 5, Table 6).
The highest soil loss event observed in grassland was during the monsoon: 0.56 t/ha on11 July 1998, when I10, I30, and I60 were 74.4, 43.2, and 29.2 mm/hr, respectively(Annex 5, Table 7). The highest soil loss event observed in rainfed outward slopingagriculture was during the pre-monsoon: 5.23 t/ha on 25 May 1999, when I10, I30, andI60 were 34.8, 24, and 22.2 mm/h, respectively. The highest soil loss event observed inrainfed outward sloping agricultural land during the monsoon was 2.54 t/ha on 18 July1997 (Annex 5, Table 8).
Overall, the percentage of runoff during the monsoon in grassland and rainfed outwardsloping agricultural land was slightly higher than the percentage of annual rainfall;whereas the percentage of runoff during the pre-monsoon, post-monsoon, and winterseasons was lower (Annex 5, Table 6).
All the highest runoff events per plot occurred during the monsoon, with a maximum of432 m3/ha in grassland and 513 m3/ha in rainfed outward sloping agricultural land,following a total daily rainfall of 119 and 98 mm, respectively (Annex 5, Table 9).
DiscussionAlthough soil loss from the rainfed outward sloping agricultural land with a terrace slopeof more than 15° and from degraded land was significant, the greater part of soil lossactually appears to come from non-agricultural land. Sthapit (1996) showed that the highrate of sediment contribution from the watershed to the Kulekhani reservoir under theextreme rainfall conditions in 1993 (377 mm in Simlang, 419 mm in Sarbang, and 535mm in Tistung over a 24-hour period with intensities of 67 and 70 mm/h in Simlang andTistung, respectively) was mainly from slope failures and stream-bank cutting, ratherthan from surface erosion from agricultural land.
In general, the quantity of soil loss from surface erosion of agricultural land is less thansoil loss from degraded land. However, the value of the soil lost from agricultural land ishigher because agricultural land gives higher economic returns than degraded land.

15Soil Loss and Runoff
2 –
So
il L
oss
and
Run
off
Therefore, conservation measures on agricultural land must be given high priority.Effective conservation measures include improved farmland water management, grassplanting on risers, hedgerow planting, terracing, and multiple cropping.
In rainfed outward sloping agricultural land, the coincidence of intense rainfall with soilpreparation for planting crops results in high soil loss events. The highest soil loss eventobserved in rainfed agricultural land was 25.96 t/ha in the Jhikhu Khola during the pre-monsoon period on 28 May 1993, and resulted from land preparation for a new Maycrop. The ground cover was almost nil and the rainfall intensity high. This is a primaryreason for the high erosion rate during the pre-monsoon in rainfed outward slopingagricultural land. Although the exceptionally high value of soil loss in the Jhikhu Kholaplot was partly due to soil work for plot construction, the second-highest soil loss event inrainfed agricultural land was from a plot that had been established for six years: 17.2t/ha at Chiuribot on 22 June 2004. This loss also occurred during the early monsoonwhen ground cover was low.
Designing cropping patterns to maintain some cover crop during the pre-monsoon, alongwith conservation measures such as multiple cropping, mulching, and conservationtillage, could help reduce loss of fertile topsoil during the pre-monsoon period. Managingwater for growing cover crops during the dry period would be the first step for addressingthis issue.
High-intensity rainfall and lack of ground cover also resulted in high soil loss events indegraded land in both the pre-monsoon and monsoon periods.
Farmer’s PerceptionsIn the ‘Water Demand and Supply Survey’ carried out in 1998 in the Yarsha Khola and in1999 in the Jhikhu Khola, PARDYP asked farmers about major water related issues(Merz et al. 2002). Farmers in both watersheds considered water quantity for irrigation tobe the most important issue followed by water quantity for drinking. Only a fewrespondents considered flooding, surface erosion, or slumping, respectively, to be themajor water related issue (see Chapter 3).
If separate questions had been asked on erosion issues (landslide, slumping, gullyerosion, riser failure, surface erosion, and flooding) rather than mixing the issue withwater availability and quality, the responses might have been different. The perception offarmers depends on the information and knowledge they have. If the farmers had beenaware that most of their total manure inputs are washed away in the first few rains, theirperception towards erosion issues might have changed. Furthermore, if people don’thave solutions to their problems, they may not perceive them as problems but ratherconsider them as simply part of life. Therefore, farmers might not have perceived surfaceerosion as a problem.
16 Good Practices in Watershed Management
Farm ManagementStream bank erosion, gullying, road slope erosion, riser failure,and slumping are actuallymajor soil erosion problems. Stream bank erosion, however, only affects a small numberof farmers who own land along rivers. Gullying is often observed along trails and onseverely degraded, often community-owned land. Stream bank erosion and gullyingrequire external support for treatment. Treating road slope erosion is generally beyondthe scope of the community and is best left to the concerned agencies. Generallyfarmers repair small riser failures that affect a few terraces in bari and khet lands.Larger-scale slope failures affecting dozens of terraces can take several years to repair.Slope failure on agricultural land is normally managed by farmers within a fairly shorttime, reducing the sediment yield and overland flow.
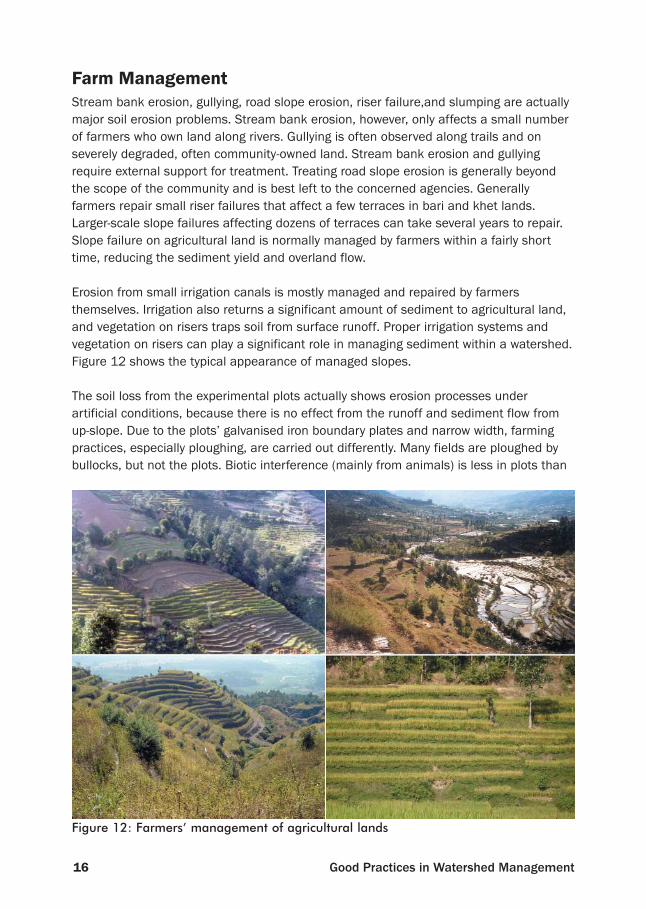
Erosion from small irrigation canals is mostly managed and repaired by farmersthemselves. Irrigation also returns a significant amount of sediment to agricultural land,and vegetation on risers traps soil from surface runoff. Proper irrigation systems andvegetation on risers can play a significant role in managing sediment within a watershed.Figure 12 shows the typical appearance of managed slopes.
The soil loss from the experimental plots actually shows erosion processes underartificial conditions, because there is no effect from the runoff and sediment flow fromup-slope. Due to the plots’ galvanised iron boundary plates and narrow width, farmingpractices, especially ploughing, are carried out differently. Many fields are ploughed bybullocks, but not the plots. Biotic interference (mainly from animals) is less in plots than
Figure 12: Farmers’ management of agricultural lands
17Soil Loss and Runoff
2 –
So
il L
oss
and
Run
off
on farmers’ land. Slope failure is thus less likely in the runoff plots than in farmers’fields. On the other hand, soil is significantly more disturbed when establishing runoffplots. Overall, soil loss from runoff plots is generally higher in the initial period and lowerin the following years compared to the real situation.
According to Mathema and Singh (2003), erosion plots only provide information onsurface soil loss. Simple extrapolation of research results from these small-scale studiesto a larger scale can lead to meaningless or even dangerous generalisations, becausethe processes involved are different at different scales. Misleading or inappropriateconclusions can be drawn when erosion plot data are quoted out of context.
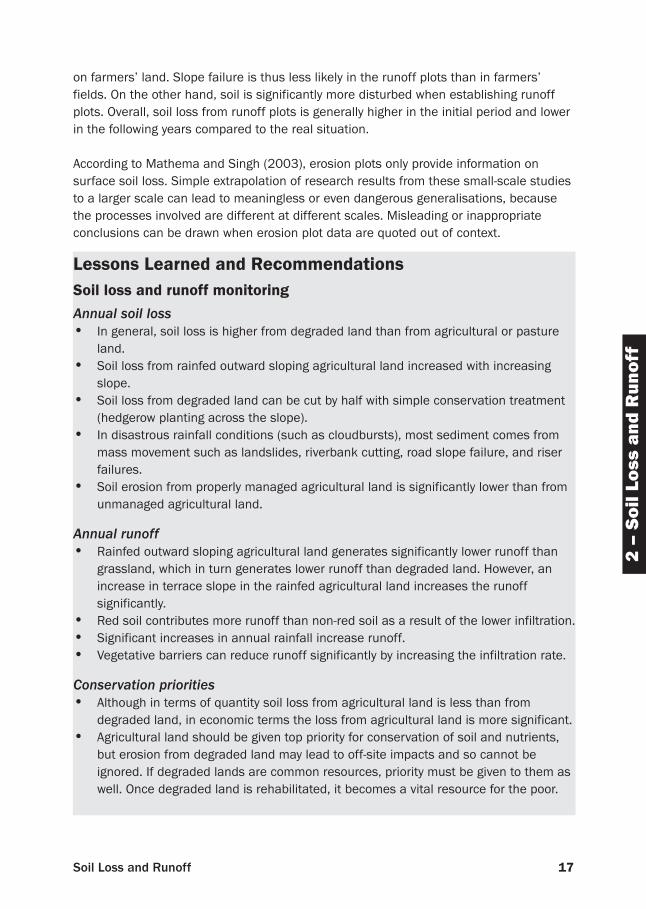
Lessons Learned and RecommendationsSoil loss and runoff monitoringAnnual soil loss• In general, soil loss is higher from degraded land than from agricultural or pasture
land.• Soil loss from rainfed outward sloping agricultural land increased with increasing
slope. • Soil loss from degraded land can be cut by half with simple conservation treatment
(hedgerow planting across the slope).• In disastrous rainfall conditions (such as cloudbursts), most sediment comes from
mass movement such as landslides, riverbank cutting, road slope failure, and riserfailures.
• Soil erosion from properly managed agricultural land is significantly lower than fromunmanaged agricultural land.
Annual runoff• Rainfed outward sloping agricultural land generates significantly lower runoff than
grassland, which in turn generates lower runoff than degraded land. However, anincrease in terrace slope in the rainfed agricultural land increases the runoffsignificantly.
• Red soil contributes more runoff than non-red soil as a result of the lower infiltration.• Significant increases in annual rainfall increase runoff. • Vegetative barriers can reduce runoff significantly by increasing the infiltration rate.
Conservation priorities• Although in terms of quantity soil loss from agricultural land is less than from
degraded land, in economic terms the loss from agricultural land is more significant. • Agricultural land should be given top priority for conservation of soil and nutrients,
but erosion from degraded land may lead to off-site impacts and so cannot beignored. If degraded lands are common resources, priority must be given to them aswell. Once degraded land is rehabilitated, it becomes a vital resource for the poor.
18 Good Practices in Watershed Management
Seasonal variations and maximum events• The study of seasonal variations in surface erosion processes is very important for
designing conservation measures, but the total amount of annual soil loss shouldalso be considered when deciding on investments.
• Cover crop and soil work during land preparation are key factors affecting theamount of surface erosion occurring during intense rain.
• Conservation measures to maintain ground cover during intense rain play animportant role in reducing surface erosion. These include maintaining cover cropsduring the pre-monsoon period, mulching, relay cropping (growing of another cropbefore clearing the previous one), and multiple cropping.
• Year-round irrigation with full management control is essential so that appropriatecrop cover patterns can be designed and implemented.
• Stall feeding with a cut-and-carry system can reduce surface erosion in grasslandand pasture; erosion rates are very low in protected grassland runoff plots but arequite high in free-grazing areas.
• The highest runoffs are generally the outcome of intense and high rainfall. Land usedoes effect runoff, but when rainfall exceeds the absorptive capacity of the soil,excess runoff will cause floods.
• In general, peak runoffs are observed when daily rainfall exceeds 100 mm.
Farmers’ perceptions• It is important to consider farmers’ perceptions when managing natural resources.
When designing survey questions, it is appropriate to separate questions regardingwater availability from those related to erosion.
• Research on nutrient loss due to surface erosion needs to quantify the nutrient loss.Extension services must share information with farmers and encourage farmers toadopt necessary conservation measures.
• Proper conservation of agricultural land is essential for its sustainable use.
Overall• Soil erosion is a complex process. For better comparison of results, it is
recommended to establish erosion plots under similar climatic, soil, geology, andlandform conditions, preferably in one place, rather than in different places withdifferent conditions.
• The complex nature of erosion and runoff studies can result in unexplainable data.The probable causes of such unexplained data must be verified and documented topermit appropriate analysis. For example, on some days with high rainfall and runoffthere may be no soil loss, whereas on other days in the same week with low rainfalland runoff there may be significant soil loss.
• Systematic documentation of the information and process is essential, especially ifthere is staff turnover, to permit valid data analysis at the end of a project.
• Standard procedures for measurement must be strictly followed if valid data are tobe obtained. Continuous supervision and reflection must be integral to the study anddeviations from stated procedures must be documented.
19Water Scarcity
3 –
Wat
er S
carc
ity
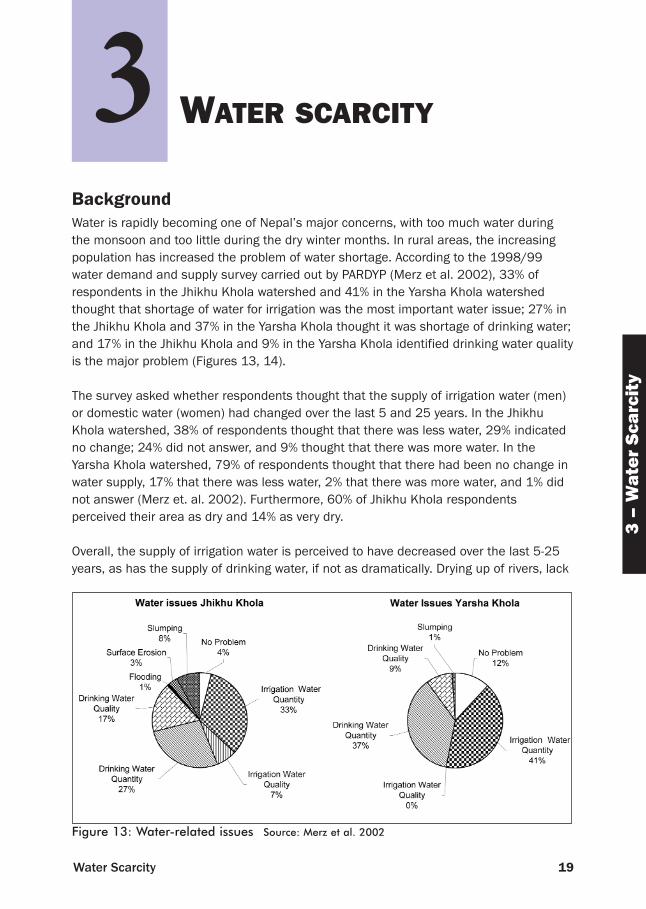
BackgroundWater is rapidly becoming one of Nepal’s major concerns, with too much water duringthe monsoon and too little during the dry winter months. In rural areas, the increasingpopulation has increased the problem of water shortage. According to the 1998/99water demand and supply survey carried out by PARDYP (Merz et al. 2002), 33% ofrespondents in the Jhikhu Khola watershed and 41% in the Yarsha Khola watershedthought that shortage of water for irrigation was the most important water issue; 27% inthe Jhikhu Khola and 37% in the Yarsha Khola thought it was shortage of drinking water;and 17% in the Jhikhu Khola and 9% in the Yarsha Khola identified drinking water qualityis the major problem (Figures 13, 14).
The survey asked whether respondents thought that the supply of irrigation water (men)or domestic water (women) had changed over the last 5 and 25 years. In the JhikhuKhola watershed, 38% of respondents thought that there was less water, 29% indicatedno change; 24% did not answer, and 9% thought that there was more water. In theYarsha Khola watershed, 79% of respondents thought that there had been no change inwater supply, 17% that there was less water, 2% that there was more water, and 1% didnot answer (Merz et. al. 2002). Furthermore, 60% of Jhikhu Khola respondentsperceived their area as dry and 14% as very dry.
Overall, the supply of irrigation water is perceived to have decreased over the last 5-25years, as has the supply of drinking water, if not as dramatically. Drying up of rivers, lack
Figure 13: Water-related issues Source: Merz et al. 2002
3 WATER SCARCITY
20 Good Practices in Watershed Management
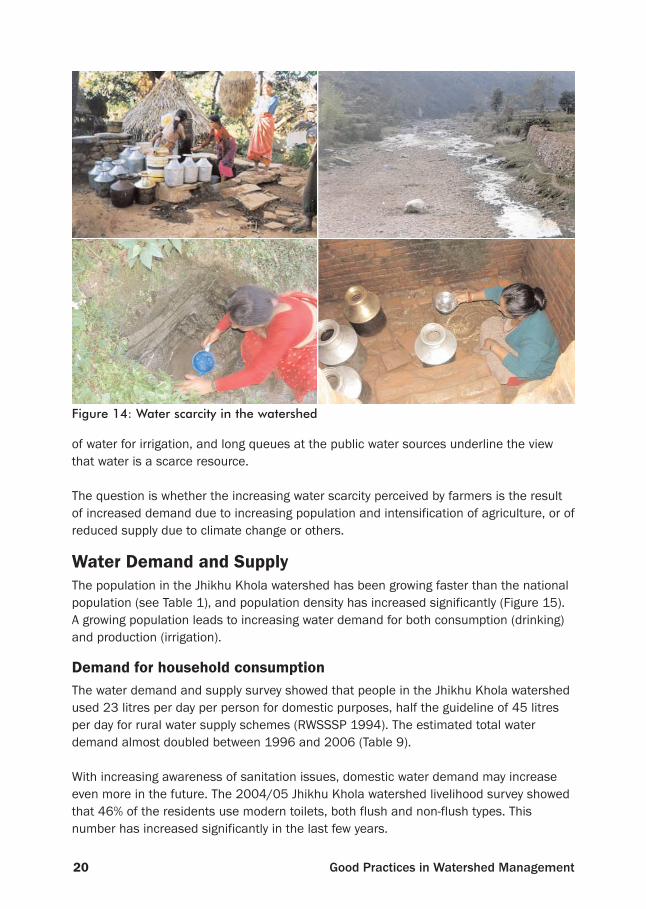
of water for irrigation, and long queues at the public water sources underline the viewthat water is a scarce resource.
The question is whether the increasing water scarcity perceived by farmers is the resultof increased demand due to increasing population and intensification of agriculture, or ofreduced supply due to climate change or others.
Water Demand and SupplyThe population in the Jhikhu Khola watershed has been growing faster than the nationalpopulation (see Table 1), and population density has increased significantly (Figure 15).A growing population leads to increasing water demand for both consumption (drinking)and production (irrigation).
Demand for household consumptionThe water demand and supply survey showed that people in the Jhikhu Khola watershedused 23 litres per day per person for domestic purposes, half the guideline of 45 litresper day for rural water supply schemes (RWSSSP 1994). The estimated total waterdemand almost doubled between 1996 and 2006 (Table 9).
With increasing awareness of sanitation issues, domestic water demand may increaseeven more in the future. The 2004/05 Jhikhu Khola watershed livelihood survey showedthat 46% of the residents use modern toilets, both flush and non-flush types. Thisnumber has increased significantly in the last few years.
Figure 14: Water scarcity in the watershed

21Water Scarcity
3 –
Wat
er S
carc
ity
In 1998 people started digging wells, and by 2005 more than 200 dug wells had alreadybeen constructed for domestic use.
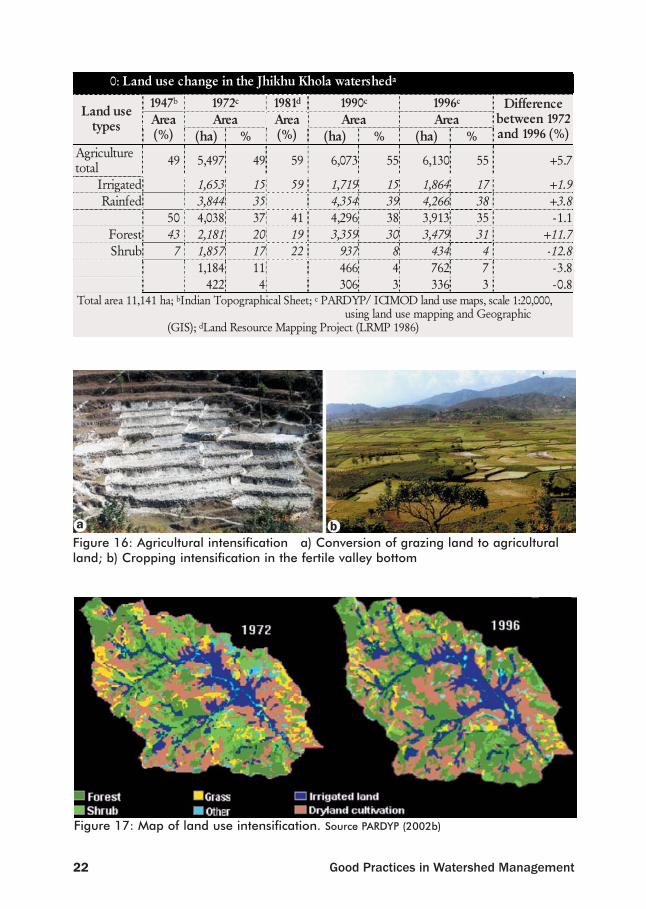
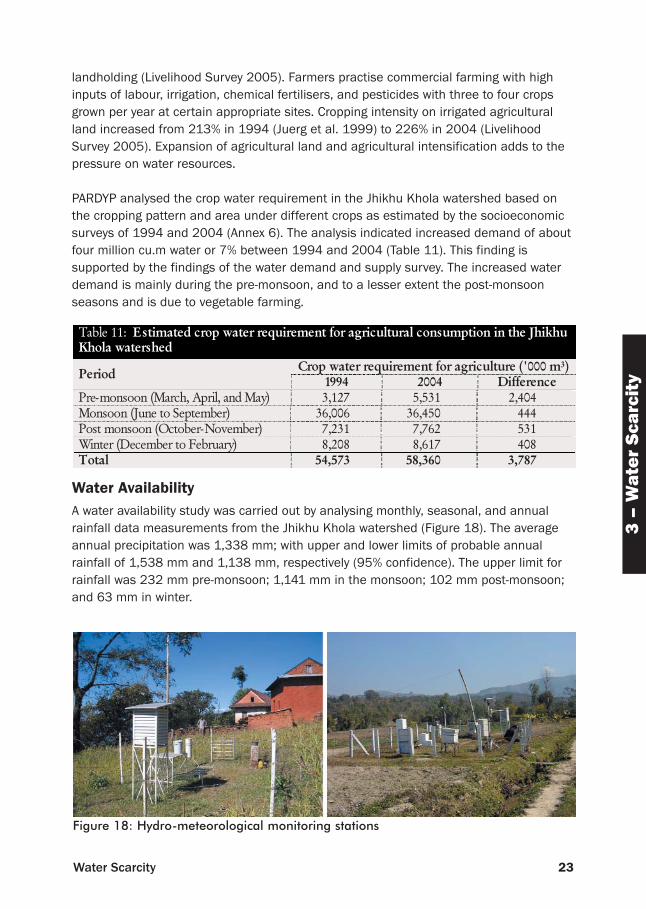
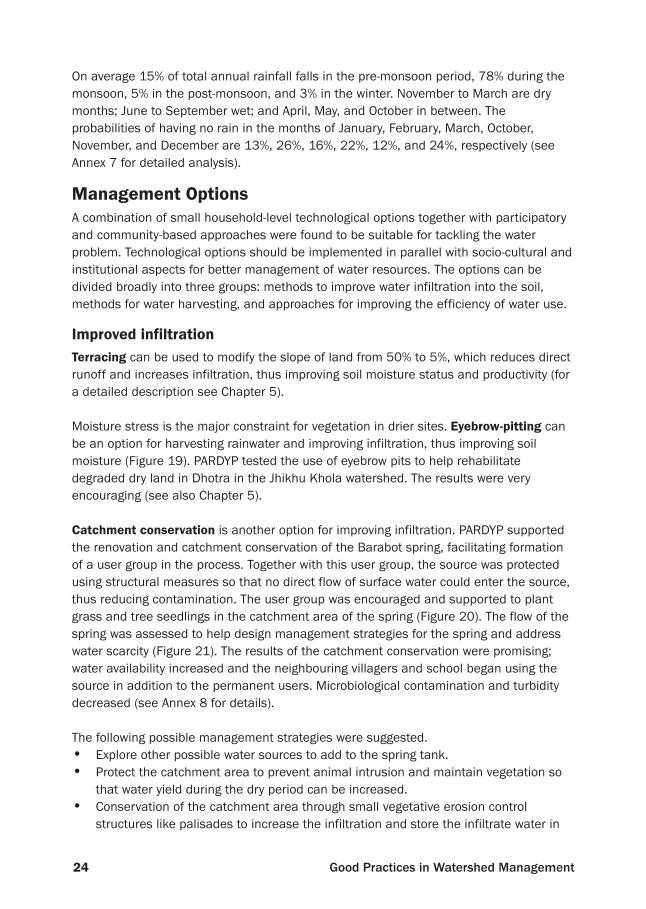
Demand for agricultureAgriculture is the main occupation of people in the Jhikhu Khola watershed, with 77% ofwatershed residents involved. However, the growing population builds pressure throughintensification of land use (Figure 16). Over the last 24 years (1972-1996) non-irrigatedland (bari) has increased by 4 % and irrigated fields (khet) by 2 %. Most of the suitableland has been converted into paddy, and grassland has decreased by 4%. Mostshrubland has been turned into forest land; the former decreased by 12% and the latterincreased by about the same amount (Table 10 and Figure 17).
In the 1950s the whole valley bottom of the Jhikhu Khola watershed was only used forgrowing rice in the monsoon and was left fallow during the rest of the year. During themonsoon, the farmers who lived at higher elevations came down to the valley each dayto work their farms and returned home before dark. Farmers in the hills liked to keep theprime agricultural land for cultivation of rice and in many cases did not want to stay inthe lowlands because of malaria. Nowadays the situation has changed due to improvedmedical facilities, eradication of malaria, improved access, and growth of communica-tions and transportation. These improvements have led people to move from the hills tothe valley bottom and to shift from subsistence to more commercial farming.
The Jhikhu Khola watershed is characterised by a very high population density and smalllandholding sizes — 0.56 ha median total landholding and 0.51 ha median agricultural
Figure 15: Population density in the Jhikhu Khola watershed
Table 9: Estimated domestic water demand in the Jhikhu Khola watershed Water demand for household purposesa
1990 1996 2001 2006 (projected)
Population 31,202 44,011 59,242 79,744
Annual water demand in m3 261,941 369,472 497,337 669,451 a Calculated at 23 litres per person per day
22 Good Practices in Watershed Management
Figure 17: Map of land use intensification. Source PARDYP (2002b)
Figure 16: Agricultural intensification a) Conversion of grazing land to agriculturalland; b) Cropping intensification in the fertile valley bottom
0: Land use change in the Jhikhu Khola watersheda
1947b 1972c 1981d 1990c 1996c Area Area Area
Land use types Area
(%) (ha) % Area (%) (ha) % (ha) %
Difference between 1972 and 1996 (%)
Agriculture total
49 5,497 49 59 6,073 55 6,130 55 +5.7
Irrigated 1,653 15 59 1,719 15 1,864 17 +1.9 Rainfed 3,844 35 4,354 39 4,266 38 +3.8
50 4,038 37 41 4,296 38 3,913 35 -1.1
Forest 43 2,181 20 19 3,359 30 3,479 31 +11.7 Shrub 7 1,857 17 22 937 8 434 4 -12.8
1,184 11 466 4 762 7 -3.8
422 4 306 3 336 3 -0.8 Total area 11,141 ha; bIndian Topographical Sheet; c PARDYP/ ICIMOD land use maps, scale 1:20,000,
using land use mapping and Geographic (GIS); dLand Resource Mapping Project (LRMP 1986)
a b
23Water Scarcity
3 –
Wat
er S
carc
ity
landholding (Livelihood Survey 2005). Farmers practise commercial farming with highinputs of labour, irrigation, chemical fertilisers, and pesticides with three to four cropsgrown per year at certain appropriate sites. Cropping intensity on irrigated agriculturalland increased from 213% in 1994 (Juerg et al. 1999) to 226% in 2004 (LivelihoodSurvey 2005). Expansion of agricultural land and agricultural intensification adds to thepressure on water resources.
PARDYP analysed the crop water requirement in the Jhikhu Khola watershed based onthe cropping pattern and area under different crops as estimated by the socioeconomicsurveys of 1994 and 2004 (Annex 6). The analysis indicated increased demand of aboutfour million cu.m water or 7% between 1994 and 2004 (Table 11). This finding issupported by the findings of the water demand and supply survey. The increased waterdemand is mainly during the pre-monsoon, and to a lesser extent the post-monsoonseasons and is due to vegetable farming.
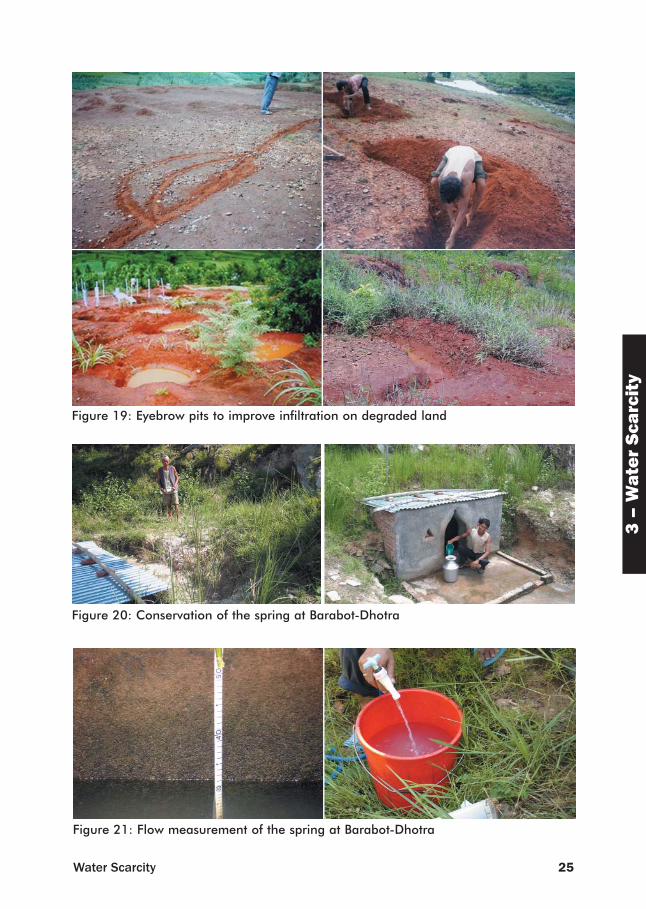
Water Availability A water availability study was carried out by analysing monthly, seasonal, and annualrainfall data measurements from the Jhikhu Khola watershed (Figure 18). The averageannual precipitation was 1,338 mm; with upper and lower limits of probable annualrainfall of 1,538 mm and 1,138 mm, respectively (95% confidence). The upper limit forrainfall was 232 mm pre-monsoon; 1,141 mm in the monsoon; 102 mm post-monsoon;and 63 mm in winter.
Table 11: Estimated crop water requirement for agricultural consumption in the Jhikhu Khola watershed
Crop water requirement for agriculture ('000 m3) Period 1994 2004 Difference Pre-monsoon (March, April, and May) 3,127 5,531 2,404 Monsoon (June to September) 36,006 36,450 444 Post monsoon (October-November) 7,231 7,762 531 Winter (December to February) 8,208 8,617 408 Total 54,573 58,360 3,787
Figure 18: Hydro-meteorological monitoring stations
24 Good Practices in Watershed Management
On average 15% of total annual rainfall falls in the pre-monsoon period, 78% during themonsoon, 5% in the post-monsoon, and 3% in the winter. November to March are drymonths; June to September wet; and April, May, and October in between. Theprobabilities of having no rain in the months of January, February, March, October,November, and December are 13%, 26%, 16%, 22%, 12%, and 24%, respectively (seeAnnex 7 for detailed analysis).
Management OptionsA combination of small household-level technological options together with participatoryand community-based approaches were found to be suitable for tackling the waterproblem. Technological options should be implemented in parallel with socio-cultural andinstitutional aspects for better management of water resources. The options can bedivided broadly into three groups: methods to improve water infiltration into the soil,methods for water harvesting, and approaches for improving the efficiency of water use.
Improved infiltrationTerracing can be used to modify the slope of land from 50% to 5%, which reduces directrunoff and increases infiltration, thus improving soil moisture status and productivity (fora detailed description see Chapter 5).
Moisture stress is the major constraint for vegetation in drier sites. Eyebrow-pitting canbe an option for harvesting rainwater and improving infiltration, thus improving soilmoisture (Figure 19). PARDYP tested the use of eyebrow pits to help rehabilitatedegraded dry land in Dhotra in the Jhikhu Khola watershed. The results were veryencouraging (see also Chapter 5).
Catchment conservation is another option for improving infiltration. PARDYP supportedthe renovation and catchment conservation of the Barabot spring, facilitating formationof a user group in the process. Together with this user group, the source was protectedusing structural measures so that no direct flow of surface water could enter the source,thus reducing contamination. The user group was encouraged and supported to plantgrass and tree seedlings in the catchment area of the spring (Figure 20). The flow of thespring was assessed to help design management strategies for the spring and addresswater scarcity (Figure 21). The results of the catchment conservation were promising;water availability increased and the neighbouring villagers and school began using thesource in addition to the permanent users. Microbiological contamination and turbiditydecreased (see Annex 8 for details).
The following possible management strategies were suggested.• Explore other possible water sources to add to the spring tank.• Protect the catchment area to prevent animal intrusion and maintain vegetation so
that water yield during the dry period can be increased. • Conservation of the catchment area through small vegetative erosion control
structures like palisades to increase the infiltration and store the infiltrate water in
25Water Scarcity
3 –
Wat
er S
carc
ity
Figure 19: Eyebrow pits to improve infiltration on degraded land
Figure 20: Conservation of the spring at Barabot-Dhotra
Figure 21: Flow measurement of the spring at Barabot-Dhotra
26 Good Practices in Watershed Management
the soil mantle — the water thus conserved later seeps into the spring. Selecting theright species for planting in the catchment areas will help keep evapo-transpirationlow. Broadleaved species indigenous to the locality are preferable. Species likebamboo, pine, and eucalyptus that have high evapo-transpiration rates should beavoided.
• Close the spring with structural measures to protect it from direct runoff and stopfetching water directly from the spring, which will significantly reduce the waterpollution. Instead siphon water from the spring to a collection tank and collect waterfrom the collection tank through taps. Beyond the highest water level limit, the inflowwater will be lost through underground seepage. Siphoning the spring water to thecollection tank will save such underground seepage loss and help store all water forproper use.
• Set a seasonal limit on the quantity of water that each household can collect per day(total water yield per day in litres divided by number of households). This might varywith dependency on the source. For example, people living nearby depending solelyon the Barabot spring might get more than other households that have access toother sources as well. It might also depend on the number of people in a household.
• Charge fees to users for regular maintenance as per the consumption rate ornumber of people in the household.
Water harvestingWater availability is a major constraint to multiple cropping on rainfed agricultural land.Traditionally, upland farmers are restricted to a single crop while counterparts in thevalley bottom with irrigation facilities grow multiple crops. One possibility for increasingwater availability is to store excess runoff water in conservation ponds or use it torecharge groundwater, especially by putting it in a well for use when the crop waterrequirement is higher than rainfall. PARDYP tested the options of storing excess water inplastic-lined conservation ponds and in underground cisterns (tank) for later use inirrigation, as well as of rooftop rainwater harvesting and improving dug wells.
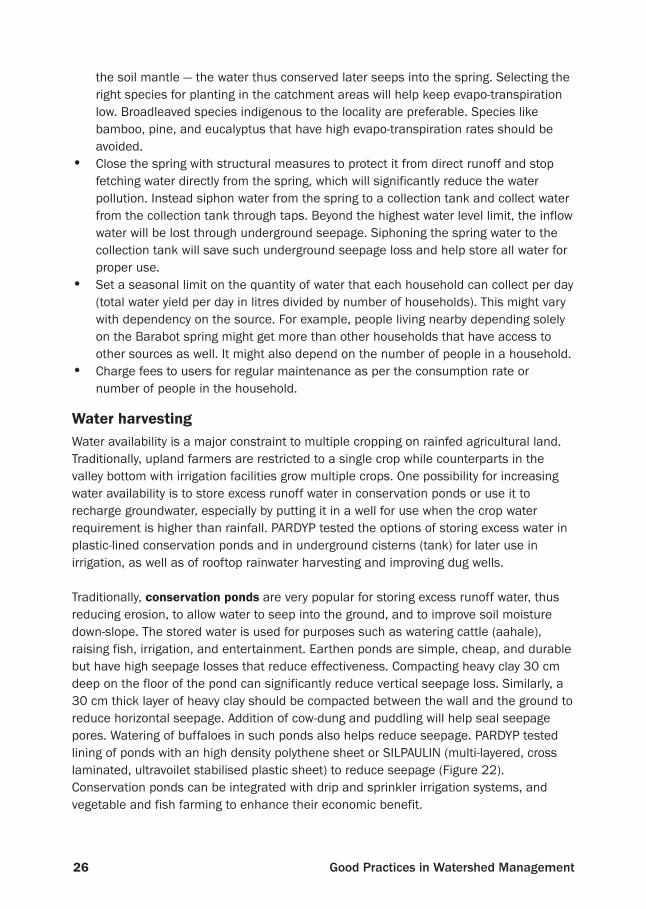
Traditionally, conservation ponds are very popular for storing excess runoff water, thusreducing erosion, to allow water to seep into the ground, and to improve soil moisturedown-slope. The stored water is used for purposes such as watering cattle (aahale),raising fish, irrigation, and entertainment. Earthen ponds are simple, cheap, and durablebut have high seepage losses that reduce effectiveness. Compacting heavy clay 30 cmdeep on the floor of the pond can significantly reduce vertical seepage loss. Similarly, a30 cm thick layer of heavy clay should be compacted between the wall and the ground toreduce horizontal seepage. Addition of cow-dung and puddling will help seal seepagepores. Watering of buffaloes in such ponds also helps reduce seepage. PARDYP testedlining of ponds with an high density polythene sheet or SILPAULIN (multi-layered, crosslaminated, ultravoilet stabilised plastic sheet) to reduce seepage (Figure 22).Conservation ponds can be integrated with drip and sprinkler irrigation systems, andvegetable and fish farming to enhance their economic benefit.
27Water Scarcity
3 –
Wat
er S
carc
ity
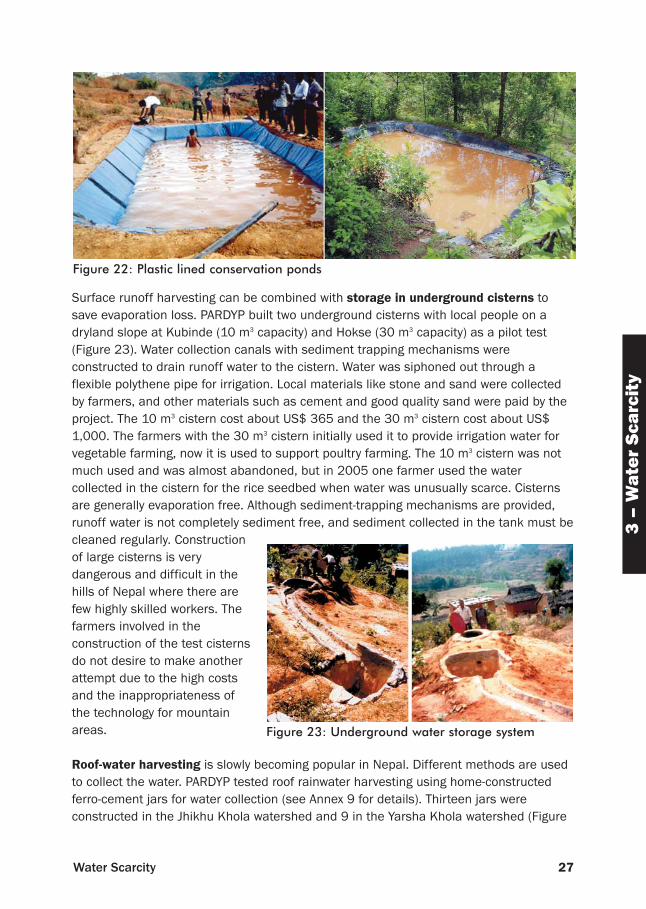
Surface runoff harvesting can be combined with storage in underground cisterns tosave evaporation loss. PARDYP built two underground cisterns with local people on adryland slope at Kubinde (10 m3 capacity) and Hokse (30 m3 capacity) as a pilot test(Figure 23). Water collection canals with sediment trapping mechanisms wereconstructed to drain runoff water to the cistern. Water was siphoned out through aflexible polythene pipe for irrigation. Local materials like stone and sand were collectedby farmers, and other materials such as cement and good quality sand were paid by theproject. The 10 m3 cistern cost about US$ 365 and the 30 m3 cistern cost about US$1,000. The farmers with the 30 m3 cistern initially used it to provide irrigation water forvegetable farming, now it is used to support poultry farming. The 10 m3 cistern was notmuch used and was almost abandoned, but in 2005 one farmer used the watercollected in the cistern for the rice seedbed when water was unusually scarce. Cisternsare generally evaporation free. Although sediment-trapping mechanisms are provided,runoff water is not completely sediment free, and sediment collected in the tank must becleaned regularly. Constructionof large cisterns is verydangerous and difficult in thehills of Nepal where there arefew highly skilled workers. Thefarmers involved in theconstruction of the test cisternsdo not desire to make anotherattempt due to the high costsand the inappropriateness ofthe technology for mountainareas.
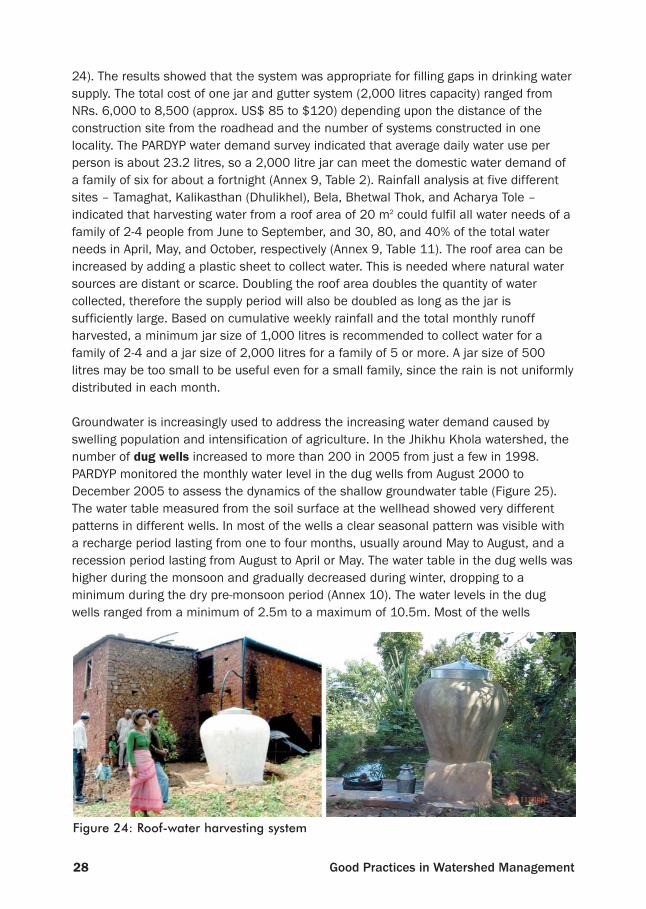
Roof-water harvesting is slowly becoming popular in Nepal. Different methods are usedto collect the water. PARDYP tested roof rainwater harvesting using home-constructedferro-cement jars for water collection (see Annex 9 for details). Thirteen jars wereconstructed in the Jhikhu Khola watershed and 9 in the Yarsha Khola watershed (Figure
Figure 22: Plastic lined conservation ponds
Figure 23: Underground water storage system
28 Good Practices in Watershed Management
24). The results showed that the system was appropriate for filling gaps in drinking watersupply. The total cost of one jar and gutter system (2,000 litres capacity) ranged fromNRs. 6,000 to 8,500 (approx. US$ 85 to $120) depending upon the distance of theconstruction site from the roadhead and the number of systems constructed in onelocality. The PARDYP water demand survey indicated that average daily water use perperson is about 23.2 litres, so a 2,000 litre jar can meet the domestic water demand ofa family of six for about a fortnight (Annex 9, Table 2). Rainfall analysis at five differentsites – Tamaghat, Kalikasthan (Dhulikhel), Bela, Bhetwal Thok, and Acharya Tole –indicated that harvesting water from a roof area of 20 m2 could fulfil all water needs of afamily of 2-4 people from June to September, and 30, 80, and 40% of the total waterneeds in April, May, and October, respectively (Annex 9, Table 11). The roof area can beincreased by adding a plastic sheet to collect water. This is needed where natural watersources are distant or scarce. Doubling the roof area doubles the quantity of watercollected, therefore the supply period will also be doubled as long as the jar issufficiently large. Based on cumulative weekly rainfall and the total monthly runoffharvested, a minimum jar size of 1,000 litres is recommended to collect water for afamily of 2-4 and a jar size of 2,000 litres for a family of 5 or more. A jar size of 500litres may be too small to be useful even for a small family, since the rain is not uniformlydistributed in each month.
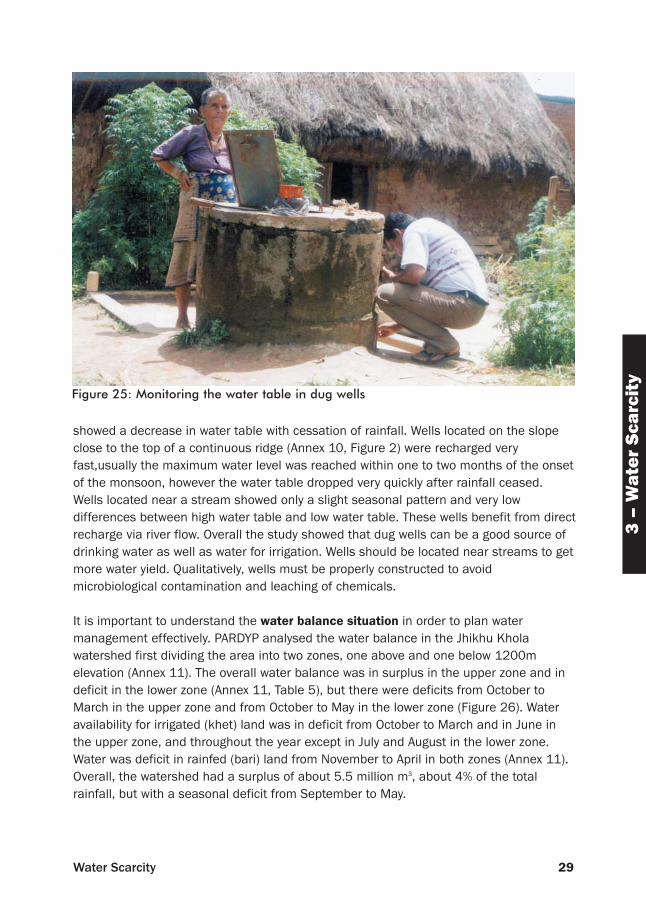
Groundwater is increasingly used to address the increasing water demand caused byswelling population and intensification of agriculture. In the Jhikhu Khola watershed, thenumber of dug wells increased to more than 200 in 2005 from just a few in 1998.PARDYP monitored the monthly water level in the dug wells from August 2000 toDecember 2005 to assess the dynamics of the shallow groundwater table (Figure 25).The water table measured from the soil surface at the wellhead showed very differentpatterns in different wells. In most of the wells a clear seasonal pattern was visible witha recharge period lasting from one to four months, usually around May to August, and arecession period lasting from August to April or May. The water table in the dug wells washigher during the monsoon and gradually decreased during winter, dropping to aminimum during the dry pre-monsoon period (Annex 10). The water levels in the dugwells ranged from a minimum of 2.5m to a maximum of 10.5m. Most of the wells
Figure 24: Roof-water harvesting system
29Water Scarcity
3 –
Wat
er S
carc
ity
showed a decrease in water table with cessation of rainfall. Wells located on the slopeclose to the top of a continuous ridge (Annex 10, Figure 2) were recharged veryfast,usually the maximum water level was reached within one to two months of the onsetof the monsoon, however the water table dropped very quickly after rainfall ceased.Wells located near a stream showed only a slight seasonal pattern and very lowdifferences between high water table and low water table. These wells benefit from directrecharge via river flow. Overall the study showed that dug wells can be a good source ofdrinking water as well as water for irrigation. Wells should be located near streams to getmore water yield. Qualitatively, wells must be properly constructed to avoidmicrobiological contamination and leaching of chemicals.
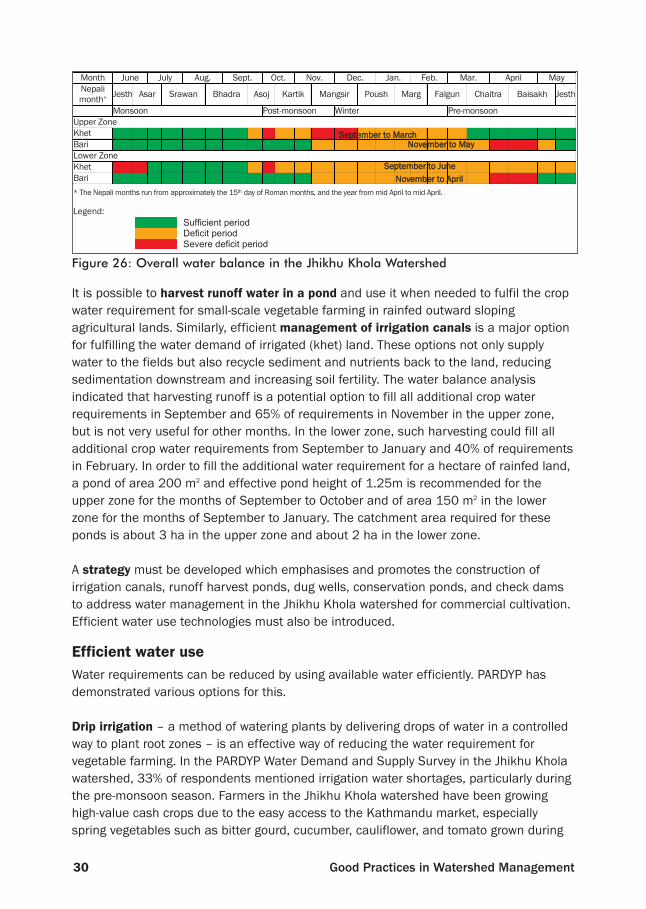
It is important to understand the water balance situation in order to plan watermanagement effectively. PARDYP analysed the water balance in the Jhikhu Kholawatershed first dividing the area into two zones, one above and one below 1200melevation (Annex 11). The overall water balance was in surplus in the upper zone and indeficit in the lower zone (Annex 11, Table 5), but there were deficits from October toMarch in the upper zone and from October to May in the lower zone (Figure 26). Wateravailability for irrigated (khet) land was in deficit from October to March and in June inthe upper zone, and throughout the year except in July and August in the lower zone.Water was deficit in rainfed (bari) land from November to April in both zones (Annex 11).Overall, the watershed had a surplus of about 5.5 million m3, about 4% of the totalrainfall, but with a seasonal deficit from September to May.
Figure 25: Monitoring the water table in dug wells
30 Good Practices in Watershed Management
It is possible to harvest runoff water in a pond and use it when needed to fulfil the cropwater requirement for small-scale vegetable farming in rainfed outward slopingagricultural lands. Similarly, efficient management of irrigation canals is a major optionfor fulfilling the water demand of irrigated (khet) land. These options not only supplywater to the fields but also recycle sediment and nutrients back to the land, reducingsedimentation downstream and increasing soil fertility. The water balance analysisindicated that harvesting runoff is a potential option to fill all additional crop waterrequirements in September and 65% of requirements in November in the upper zone,but is not very useful for other months. In the lower zone, such harvesting could fill alladditional crop water requirements from September to January and 40% of requirementsin February. In order to fill the additional water requirement for a hectare of rainfed land,a pond of area 200 m2 and effective pond height of 1.25m is recommended for theupper zone for the months of September to October and of area 150 m2 in the lowerzone for the months of September to January. The catchment area required for theseponds is about 3 ha in the upper zone and about 2 ha in the lower zone.
A strategy must be developed which emphasises and promotes the construction ofirrigation canals, runoff harvest ponds, dug wells, conservation ponds, and check damsto address water management in the Jhikhu Khola watershed for commercial cultivation.Efficient water use technologies must also be introduced.
Efficient water use Water requirements can be reduced by using available water efficiently. PARDYP hasdemonstrated various options for this.
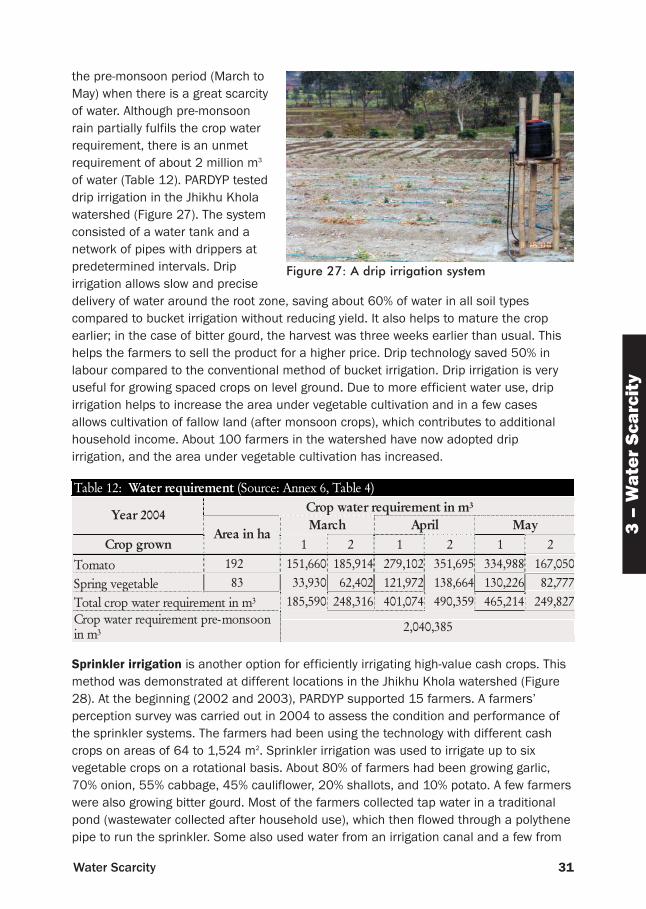
Drip irrigation – a method of watering plants by delivering drops of water in a controlledway to plant root zones – is an effective way of reducing the water requirement forvegetable farming. In the PARDYP Water Demand and Supply Survey in the Jhikhu Kholawatershed, 33% of respondents mentioned irrigation water shortages, particularly duringthe pre-monsoon season. Farmers in the Jhikhu Khola watershed have been growinghigh-value cash crops due to the easy access to the Kathmandu market, especiallyspring vegetables such as bitter gourd, cucumber, cauliflower, and tomato grown during
Month June July Aug. Sept. Oct. Nov. Dec. Jan. Feb. Mar. April May Nepali month* Jesth Asar Srawan Bhadra Asoj Kartik Mangsir Poush Marg Falgun Chaitra Baisakh Jesth
Monsoon Post-monsoon Winter Pre-monsoon Upper Zone Khet Bari Lower Zone Khet Bari
* The Nepali months run from approximately the 15th day of Roman months, and the year from mid April to mid April. Legend:
Sufficient period Deficit period Severe deficit period
SSeepptteemmbbeerr ttoo MMaarrcchh NNoovveemmbbeerr ttoo MMaayy
SSeepptteemmbbeerr ttoo JJuunnee NNoovveemmbbeerr ttoo AApprriill
Figure 26: Overall water balance in the Jhikhu Khola Watershed
31Water Scarcity
3 –
Wat
er S
carc
ity
the pre-monsoon period (March toMay) when there is a great scarcityof water. Although pre-monsoonrain partially fulfils the crop waterrequirement, there is an unmetrequirement of about 2 million m3
of water (Table 12). PARDYP testeddrip irrigation in the Jhikhu Kholawatershed (Figure 27). The systemconsisted of a water tank and anetwork of pipes with drippers atpredetermined intervals. Dripirrigation allows slow and precisedelivery of water around the root zone, saving about 60% of water in all soil typescompared to bucket irrigation without reducing yield. It also helps to mature the cropearlier; in the case of bitter gourd, the harvest was three weeks earlier than usual. Thishelps the farmers to sell the product for a higher price. Drip technology saved 50% inlabour compared to the conventional method of bucket irrigation. Drip irrigation is veryuseful for growing spaced crops on level ground. Due to more efficient water use, dripirrigation helps to increase the area under vegetable cultivation and in a few casesallows cultivation of fallow land (after monsoon crops), which contributes to additionalhousehold income. About 100 farmers in the watershed have now adopted dripirrigation, and the area under vegetable cultivation has increased.
Sprinkler irrigation is another option for efficiently irrigating high-value cash crops. Thismethod was demonstrated at different locations in the Jhikhu Khola watershed (Figure28). At the beginning (2002 and 2003), PARDYP supported 15 farmers. A farmers’perception survey was carried out in 2004 to assess the condition and performance ofthe sprinkler systems. The farmers had been using the technology with different cashcrops on areas of 64 to 1,524 m2. Sprinkler irrigation was used to irrigate up to sixvegetable crops on a rotational basis. About 80% of farmers had been growing garlic,70% onion, 55% cabbage, 45% cauliflower, 20% shallots, and 10% potato. A few farmerswere also growing bitter gourd. Most of the farmers collected tap water in a traditionalpond (wastewater collected after household use), which then flowed through a polythenepipe to run the sprinkler. Some also used water from an irrigation canal and a few from
Figure 27: A drip irrigation system
Table 12: Water requirement (Source: Annex 6, Table 4) Crop water requirement in m3 Year 2004 March April May
Crop grown Area in ha
1 2 1 2 1 2
Tomato 192 151,660 185,914 279,102 351,695 334,988 167,050
Spring vegetable 83 33,930 62,402 121,972 138,664 130,226 82,777
Total crop water requirement in m3 185,590 248,316 401,074 490,359 465,214 249,827
Crop water requirement pre-monsoon in m3
2,040,385

32 Good Practices in Watershed Management
water harvested from theroof (during the monsoon)stored in a cement jar.
Farmers thought thatsprinkler irrigation had thefollowing advantages: • it is appropriate for
irrigating sloping aswell as level land;
• it saves time – onceinstalled andsprinkling it does notneed to be looked atfor 3-4 hours;
• it provides uniformapplication of water;
• it reduces soil loss from sloping land and increases soil moisture;• it is easy to handle and transport to the desired location;• a single set is sufficient for 2 to 3 households; • the water drives away insects;
and the following disadvantages: • it requires frequent maintenance against blockage of holes;• it needs sufficient head pressure and is therefore not very useful for flat land;• sometimes it stops functioning (does not rotate at all and disconnects from the main
pipe).
The differences perceived by farmers between drip and sprinkler irrigation systems aresummarised below.
Figure 28: Sprinkler irrigation
Sprinkler Irrigation Drip Irrigation Useful in closely grown crops such as garlic and onion
Useful for crops planted widely apart such as bitter gourd and cauliflower
Can be used on sloping land Difficult to use on sloping land Easy to transport, and possible to use for different crops in rotation
Difficult to transport; it is fixed for one crop and stays the whole growing season
Repels insects Does not repel insects Easily available in local market and cheap Not easily available in local market and
expensive Requires more water therefore requires perennial water source
Requires less water and is highly water efficient
Requires frequent maintenance against blockage Requires low maintenance Requires sufficient head pressure, therefore not applicable in flat areas
Low head pressure is adequate for irrigation
Likely to be stolen because of easy dismantling Difficult to dismantle once crop is grown
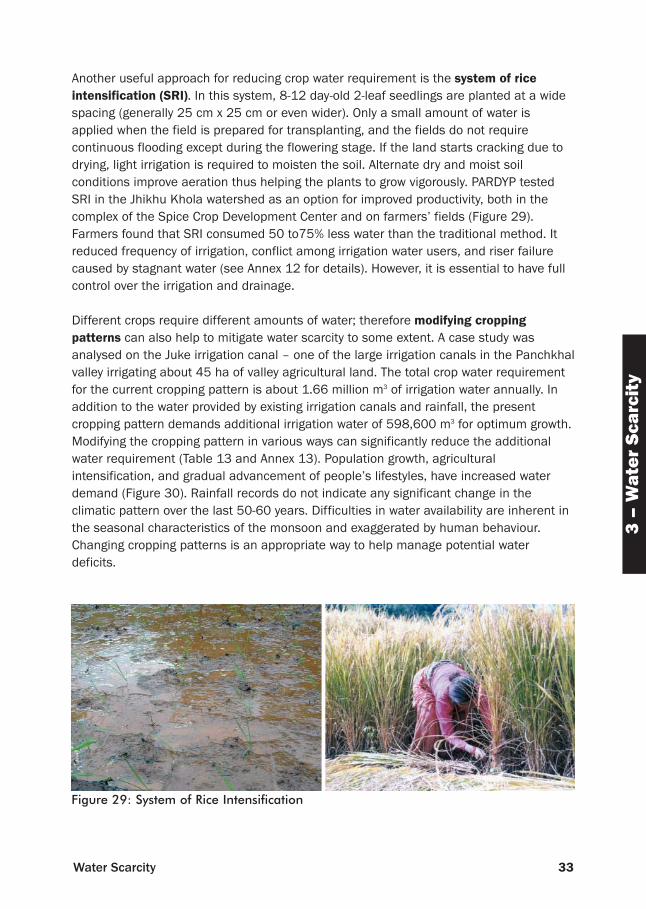
33Water Scarcity
3 –
Wat
er S
carc
ity
Another useful approach for reducing crop water requirement is the system of riceintensification (SRI). In this system, 8-12 day-old 2-leaf seedlings are planted at a widespacing (generally 25 cm x 25 cm or even wider). Only a small amount of water isapplied when the field is prepared for transplanting, and the fields do not requirecontinuous flooding except during the flowering stage. If the land starts cracking due todrying, light irrigation is required to moisten the soil. Alternate dry and moist soilconditions improve aeration thus helping the plants to grow vigorously. PARDYP testedSRI in the Jhikhu Khola watershed as an option for improved productivity, both in thecomplex of the Spice Crop Development Center and on farmers’ fields (Figure 29).Farmers found that SRI consumed 50 to75% less water than the traditional method. Itreduced frequency of irrigation, conflict among irrigation water users, and riser failurecaused by stagnant water (see Annex 12 for details). However, it is essential to have fullcontrol over the irrigation and drainage.
Different crops require different amounts of water; therefore modifying croppingpatterns can also help to mitigate water scarcity to some extent. A case study wasanalysed on the Juke irrigation canal – one of the large irrigation canals in the Panchkhalvalley irrigating about 45 ha of valley agricultural land. The total crop water requirementfor the current cropping pattern is about 1.66 million m3 of irrigation water annually. Inaddition to the water provided by existing irrigation canals and rainfall, the presentcropping pattern demands additional irrigation water of 598,600 m3 for optimum growth.Modifying the cropping pattern in various ways can significantly reduce the additionalwater requirement (Table 13 and Annex 13). Population growth, agriculturalintensification, and gradual advancement of people’s lifestyles, have increased waterdemand (Figure 30). Rainfall records do not indicate any significant change in theclimatic pattern over the last 50-60 years. Difficulties in water availability are inherent inthe seasonal characteristics of the monsoon and exaggerated by human behaviour.Changing cropping patterns is an appropriate way to help manage potential waterdeficits.
Figure 29: System of Rice Intensification
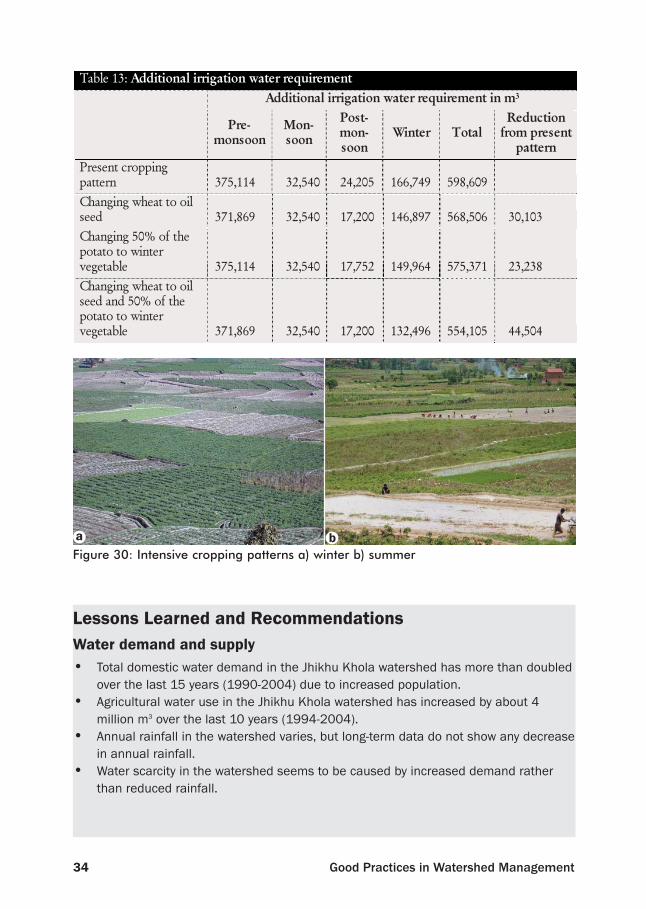
34 Good Practices in Watershed Management
Figure 30: Intensive cropping patterns a) winter b) summer
Table 13: Additional irrigation water requirement Additional irrigation water requirement in m3
Pre-monsoon
Mon-soon
Post-mon-soon
Winter Total Reduction
from present pattern
Present cropping pattern 375,114 32,540 24,205 166,749 598,609
Changing wheat to oil seed 371,869 32,540 17,200 146,897 568,506 30,103
Changing 50% of the potato to winter vegetable 375,114 32,540 17,752 149,964 575,371 23,238
Changing wheat to oil seed and 50% of the potato to winter vegetable 371,869 32,540 17,200 132,496 554,105 44,504
a b
Lessons Learned and RecommendationsWater demand and supply• Total domestic water demand in the Jhikhu Khola watershed has more than doubled
over the last 15 years (1990-2004) due to increased population.• Agricultural water use in the Jhikhu Khola watershed has increased by about 4
million m3 over the last 10 years (1994-2004).• Annual rainfall in the watershed varies, but long-term data do not show any decrease
in annual rainfall. • Water scarcity in the watershed seems to be caused by increased demand rather
than reduced rainfall.
35Water Scarcity
3 –
Wat
er S
carc
ity
Management optionsImproved infiltration• Levelling sloping agricultural land increases infiltration thereby improving soil
moisture and reducing nutrient loss, which help productivity.• Terraces can be developed over two or three years by introducing biological barriers
and using appropriate cultivation practices.• Eyebrow pitting is a very good way of increasing soil moisture status, creating a
favourable micro-environment for plants to grow. • Protecting a spring source and its catchment area from pollution improves water
quality.• Vegetative measures in the catchment area improve the water regime of a spring.• Collecting spring water in a tank improves water availability.• Flow measurement in a spring can play a crucial role in preparing strategies to
reduce conflict in areas of water scarcity.
Water harvesting• Storing water in conservation ponds is an important option for meeting water
demands.• The local technology of lining ponds with a clay layer and puddling reduces seepage
loss in earthen ponds.• High density plastic sheet or SILPAULIN is an effective lining material to reduce
seepage loss. • Large underground cisterns are dangerous, costly, and not recommended in
earthquake-prone hill areas, and are generally not applicable for irrigation becauseof the size required to store enough water.
• Underground cisterns could be used to store drinking water to reduce evaporationloss.
• Wells are an important source of water to manage water scarcity.• Wells located close to the top of a continuous ridge recharge quickly with the onset
of rain.• Water table fluctuation in wells close to streams is low, but high in wells located
close to the top of a continuous ridge. • The water table in wells located at the foot of a slope decreases with decreasing
rainfall.• Roof-water harvesting is an important option to fulfil the needs for drinking water in
water scarcity areas.• A minimum of 1,000 litres storage is essential for useful roof-water harvesting.
Although water need is greatest from October to March, more water can be collectedfrom May to September, and roof-water harvesting is generally more pragmaticduring this period.
• The overall annual water status for agricultural land in the Jhikhu Khola watershed isin surplus, except for irrigated land in the lower zone. However, all agricultural landhad seasonal water scarcity with a particular deficit from October to April.
36 Good Practices in Watershed Management
• Runoff harvest can potentially fill a significant additional crop water requirement forrainfed land in September and November in the upper zone and from September toFebruary in the lower zone of the Jhikhu Khola watershed.
• The recommended pond size for a collecting pond for surface runoff to fill theadditional water requirement for a hectare of rainfed land is 200 m2 with aneffective pond height of 1.25 m in the upper zone and 125 m2 in the lower zone ofthe Jhikhu Khola watershed. The recommended catchment area is 3 ha in the upperzone and 2 ha in the lower zone.
• Water harvesting measures such as conservation ponds and irrigation canals notonly fulfil crop water requirements but also conserve sediment and nutrients.
• Further research is needed on runoff harvest coefficients, stream flow coefficients,and the water requirement of other crops.
Efficient water use• Drip irrigation is an efficient option for crops grown on level surfaces at a distance
from each other such as bitter gourd and cauliflower; it saves up to 60% of watercompared to bucket irrigation without decreasing production.
• Drip irrigation saves about 50% of labour compared to bucket irrigation.• Drip irrigation helps crops to mature earlier, enabling the farmers to get better
prices. The early maturation is due to uniform moisture availability for efficientphotosynthesis.
• Drip irrigation is not an appropriate option for closely grown crops such as garlic andonions.
• Availability of drip irrigation equipment is still a constraint in the hills of Nepal.• Sprinkler irrigation is a time saving irrigation option for closely grown crops in the
hills where sufficient head pressure can be easily achieved.• The SRI allows paddy fields to be cultivated with less water, which helps to reduce
irrigation conflict in the community.• SRI increases yield and requires less inputs such as seedlings and labour than
traditional methods.• For successful SRI, it is essential to control irrigation and drainage to maintain soil at
the right moisture level. • Modifying cropping patterns can reduce crop water requirements to some extent,
and therefore could be an important strategy in irrigation water management.
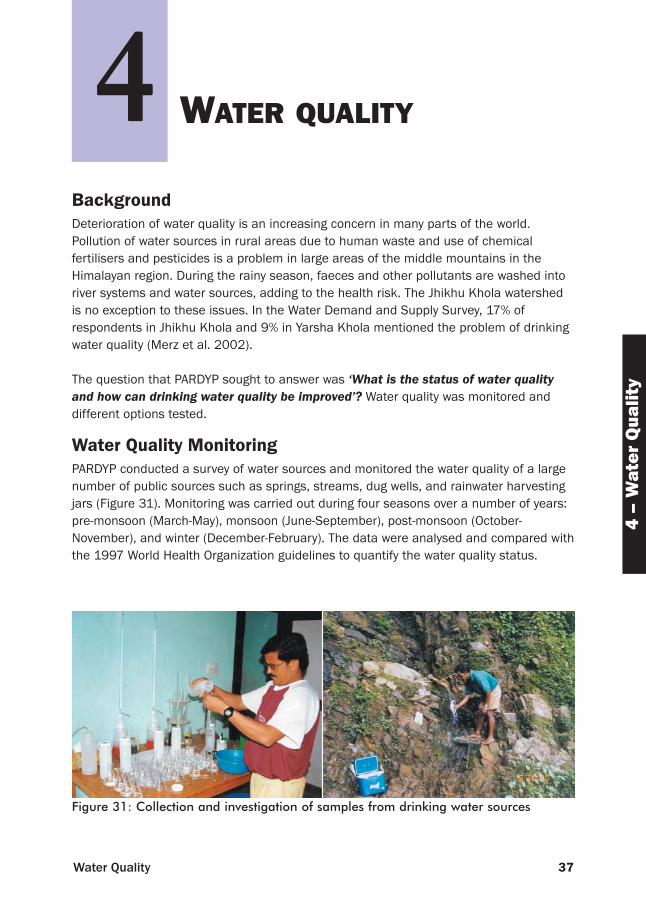
37Water Quality
BackgroundDeterioration of water quality is an increasing concern in many parts of the world.Pollution of water sources in rural areas due to human waste and use of chemicalfertilisers and pesticides is a problem in large areas of the middle mountains in theHimalayan region. During the rainy season, faeces and other pollutants are washed intoriver systems and water sources, adding to the health risk. The Jhikhu Khola watershedis no exception to these issues. In the Water Demand and Supply Survey, 17% ofrespondents in Jhikhu Khola and 9% in Yarsha Khola mentioned the problem of drinkingwater quality (Merz et al. 2002).
The question that PARDYP sought to answer was ‘What is the status of water qualityand how can drinking water quality be improved’? Water quality was monitored anddifferent options tested.
Water Quality MonitoringPARDYP conducted a survey of water sources and monitored the water quality of a largenumber of public sources such as springs, streams, dug wells, and rainwater harvestingjars (Figure 31). Monitoring was carried out during four seasons over a number of years:pre-monsoon (March-May), monsoon (June-September), post-monsoon (October-November), and winter (December-February). The data were analysed and compared withthe 1997 World Health Organization guidelines to quantify the water quality status.
4 –
Wat
er Q
uali
ty
Figure 31: Collection and investigation of samples from drinking water sources
4 WATER QUALITY
38 Good Practices in Watershed Management
SpringsBasic physical and chemical parameters were investigated in a total of 319 springs in theJhikhu Khola and 215 springs in the Yarsha Khola watersheds (Annex 14, Table 1). Themajority of the springs in both watersheds had a turbidity of less than one nephelometricturbidity unit (NTU). In terms of pH and electrical conductivity (EC), water quality wasbetter in the Jhikhu Khola than in the Yarsha Khola springs (Annex 14, Table 3). All otherwater quality studies were carried out in the Jhikhu Khola watershed only.
Microbiological and other contaminationTotal and faecal coliform contamination was very high in stream water at all sites tested.Phosphate was above the European Commission (EC) recommended limit of 0.4 mg/l atabout 60% of the stream sites. Turbidity was high (> 25 NTU) in most seasons butparticularly so in pre-monsoon and monsoon (Annex 14, Tables 4 and 5).
Total and faecal coliform/E. coli contamination was very high in all spring sources.Phosphate exceeded the EC limit in more than 50% of the spring sources; however, thesprings in the Kubinde area and the Barabot spring in the Dhotra area had phosphatelevels within the limit (Annex 14, Tables 6 to 10).
Total coliform and faecal coliform/E. coli contamination was very high in all the shallowdug wells investigated. Phosphate exceeded the EC recommendations in most cases.High turbidity was observed especially in the pre-monsoon and monsoon seasons.Ammonia was also a problem in a number of wells, especially in the monsoon season.The pre-monsoon and monsoon seasons were more problematic generally than otherseasons (Annex 14, Tables 11 and 12).
Total coliform and E. coli contamination was found in the majority of rainwater harvestingjars investigated, particularly in the pre-monsoon and monsoon seasons. Phosphate wasabove the EC limit in a number of jars; the pH was mostly above 8 (Annex 14, Table 12).
Water Quality Improvement OptionsPARDYP tested various options for addressing drinking water quality issues, includingorganising dissemination and awareness building workshops, solar water disinfection(SODIS), low cost water filters, and a case study on spring source protection withcommunity participation.
Awareness buildingPARDYP organised a number of workshops for local residents, authorities, scienceteachers, school children, and health volunteers to discuss and present the water qualitystatus and potential treatment measures. People were made aware of water qualityproblems, health, and sanitation improvement systems. Pamphlets on low-cost waterfilters and SODIS were disseminated and the methods promoted. People were trained totackle the microbiological problems of drinking water by using methods such as boiling,chlorination, SODIS, and low-cost water filters.
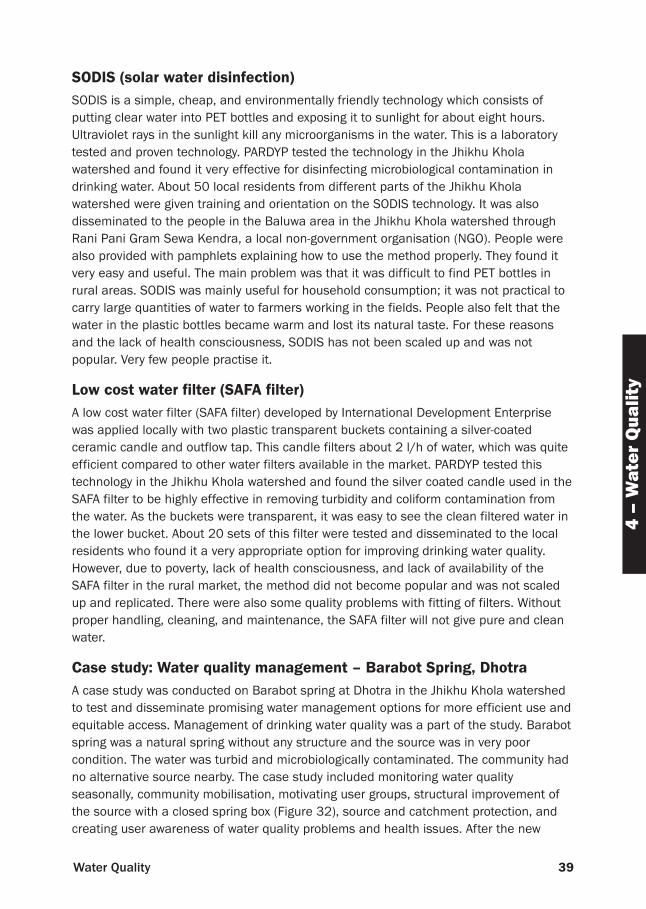
39Water Quality
4 –
Wat
er Q
uali
ty
SODIS (solar water disinfection)SODIS is a simple, cheap, and environmentally friendly technology which consists ofputting clear water into PET bottles and exposing it to sunlight for about eight hours.Ultraviolet rays in the sunlight kill any microorganisms in the water. This is a laboratorytested and proven technology. PARDYP tested the technology in the Jhikhu Kholawatershed and found it very effective for disinfecting microbiological contamination indrinking water. About 50 local residents from different parts of the Jhikhu Kholawatershed were given training and orientation on the SODIS technology. It was alsodisseminated to the people in the Baluwa area in the Jhikhu Khola watershed throughRani Pani Gram Sewa Kendra, a local non-government organisation (NGO). People werealso provided with pamphlets explaining how to use the method properly. They found itvery easy and useful. The main problem was that it was difficult to find PET bottles inrural areas. SODIS was mainly useful for household consumption; it was not practical tocarry large quantities of water to farmers working in the fields. People also felt that thewater in the plastic bottles became warm and lost its natural taste. For these reasonsand the lack of health consciousness, SODIS has not been scaled up and was notpopular. Very few people practise it.
Low cost water filter (SAFA filter)A low cost water filter (SAFA filter) developed by International Development Enterprisewas applied locally with two plastic transparent buckets containing a silver-coatedceramic candle and outflow tap. This candle filters about 2 l/h of water, which was quiteefficient compared to other water filters available in the market. PARDYP tested thistechnology in the Jhikhu Khola watershed and found the silver coated candle used in theSAFA filter to be highly effective in removing turbidity and coliform contamination fromthe water. As the buckets were transparent, it was easy to see the clean filtered water inthe lower bucket. About 20 sets of this filter were tested and disseminated to the localresidents who found it a very appropriate option for improving drinking water quality.However, due to poverty, lack of health consciousness, and lack of availability of theSAFA filter in the rural market, the method did not become popular and was not scaledup and replicated. There were also some quality problems with fitting of filters. Withoutproper handling, cleaning, and maintenance, the SAFA filter will not give pure and cleanwater.
Case study: Water quality management – Barabot Spring, Dhotra A case study was conducted on Barabot spring at Dhotra in the Jhikhu Khola watershedto test and disseminate promising water management options for more efficient use andequitable access. Management of drinking water quality was a part of the study. Barabotspring was a natural spring without any structure and the source was in very poorcondition. The water was turbid and microbiologically contaminated. The community hadno alternative source nearby. The case study included monitoring water qualityseasonally, community mobilisation, motivating user groups, structural improvement ofthe source with a closed spring box (Figure 32), source and catchment protection, andcreating user awareness of water quality problems and health issues. After the new
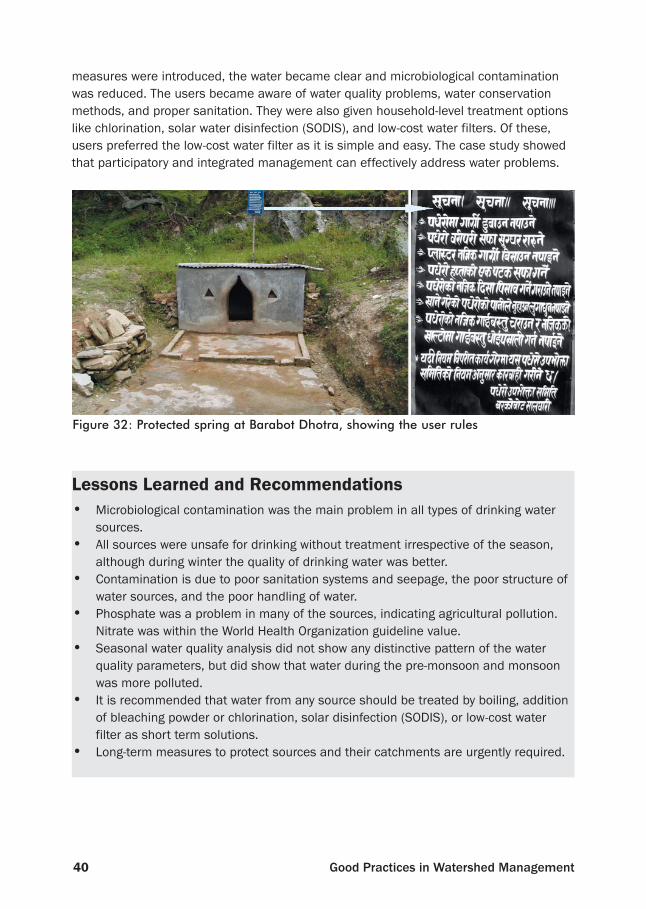
40 Good Practices in Watershed Management
measures were introduced, the water became clear and microbiological contaminationwas reduced. The users became aware of water quality problems, water conservationmethods, and proper sanitation. They were also given household-level treatment optionslike chlorination, solar water disinfection (SODIS), and low-cost water filters. Of these,users preferred the low-cost water filter as it is simple and easy. The case study showedthat participatory and integrated management can effectively address water problems.
Lessons Learned and Recommendations• Microbiological contamination was the main problem in all types of drinking water
sources.• All sources were unsafe for drinking without treatment irrespective of the season,
although during winter the quality of drinking water was better.• Contamination is due to poor sanitation systems and seepage, the poor structure of
water sources, and the poor handling of water.• Phosphate was a problem in many of the sources, indicating agricultural pollution.
Nitrate was within the World Health Organization guideline value.• Seasonal water quality analysis did not show any distinctive pattern of the water
quality parameters, but did show that water during the pre-monsoon and monsoonwas more polluted.
• It is recommended that water from any source should be treated by boiling, additionof bleaching powder or chlorination, solar disinfection (SODIS), or low-cost waterfilter as short term solutions.
• Long-term measures to protect sources and their catchments are urgently required.
Figure 32: Protected spring at Barabot Dhotra, showing the user rules
41On Farm
5 –
On
Farm
Some of the major concerns related to livelihood improvement are maintaining soilfertility, degradation of community lands, increasing farm income, building capacity ofthe community, and decreasing women’s workloads. Several questions arose concerningthese issues and PARDYP tested and synthesised a number of options to address them.
How Can Farmers Maintain or Improve Soil Fertility? Soil fertility is a key concern of every farmer. Soil fertility can be supported throughappropriate agronomic practices as well as appropriate use of fertilisers. PARDYP testedvarious agronomic practices in the different project watersheds. The main agronomicpractices considered were inter-cropping, crop rotation, mulching, and liming. The mainsoil fertility management options were pit composting, black plastic composting,vermicomposting, and use of effective micro-organisms (EM) (rhizobium, azatobacter,and boakshi). The tests in PARDYP-Nepal focused on on-farm composting using blackplastic and EM, and lime application in acidic soils. PARDYP-Nepal also monitoredleachate in the soil erosion monitoring plots in agricultural and degraded land to helpunderstanding of the nutrient dynamics in the soil profile.
On-farm compostingCompost or farmyard manure has played a crucial role in maintaining and building upsoil fertility in Nepal. Many different composting methods were tested and demonstratedin the Jhikhu Khola watershed. Among the different methods, farmers considered blackplastic covered composting as recommended by the Sustainable Soil ManagementProject to be the best.
Black plastic composting was first tested with 16 farmers in 2004. By 2005, about 50farmers had started using this method in the Jhikhu Khola watershed. In this method, atraditional compost heap is covered with a piece of black plastic, which protectsnutrients from leaching during rainy days and provides a favourable environment(increased temperature and decreased evaporation loss) for the growth of microbes(Figure 33). The method is based on a passive aeration approach, the black plastic isremoved from the compost heap for a short period each day. Using this method, compostdecomposed within 45-50 days compared to about 4-6 months without the plastic sheet.Black plastic (thickness ~ 800 μm) is light, easy to use, and durable. Compost isproduced with less time and labour than by the standard method.
Use of effective micro-organisms (EM) is another method being adopted by thewatershed residents. In this method, composting is based on aerobic decomposition and
5 ON FARM
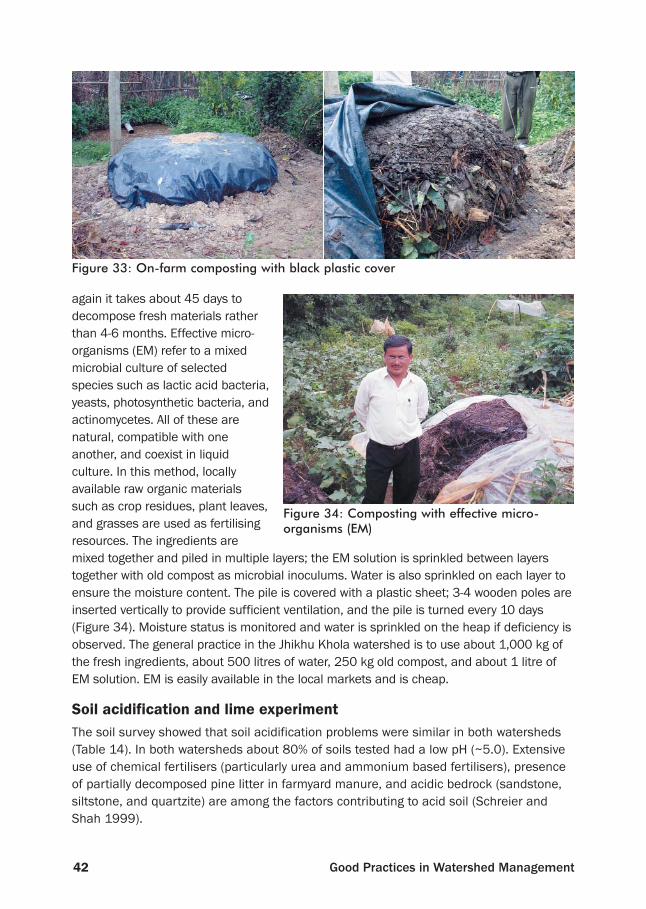
42 Good Practices in Watershed Management
again it takes about 45 days todecompose fresh materials ratherthan 4-6 months. Effective micro-organisms (EM) refer to a mixedmicrobial culture of selectedspecies such as lactic acid bacteria,yeasts, photosynthetic bacteria, andactinomycetes. All of these arenatural, compatible with oneanother, and coexist in liquidculture. In this method, locallyavailable raw organic materialssuch as crop residues, plant leaves,and grasses are used as fertilisingresources. The ingredients aremixed together and piled in multiple layers; the EM solution is sprinkled between layerstogether with old compost as microbial inoculums. Water is also sprinkled on each layer toensure the moisture content. The pile is covered with a plastic sheet; 3-4 wooden poles areinserted vertically to provide sufficient ventilation, and the pile is turned every 10 days(Figure 34). Moisture status is monitored and water is sprinkled on the heap if deficiency isobserved. The general practice in the Jhikhu Khola watershed is to use about 1,000 kg ofthe fresh ingredients, about 500 litres of water, 250 kg old compost, and about 1 litre ofEM solution. EM is easily available in the local markets and is cheap.
Soil acidification and lime experimentThe soil survey showed that soil acidification problems were similar in both watersheds(Table 14). In both watersheds about 80% of soils tested had a low pH (~5.0). Extensiveuse of chemical fertilisers (particularly urea and ammonium based fertilisers), presenceof partially decomposed pine litter in farmyard manure, and acidic bedrock (sandstone,siltstone, and quartzite) are among the factors contributing to acid soil (Schreier andShah 1999).
Figure 33: On-farm composting with black plastic cover
Figure 34: Composting with effective micro-organisms (EM)
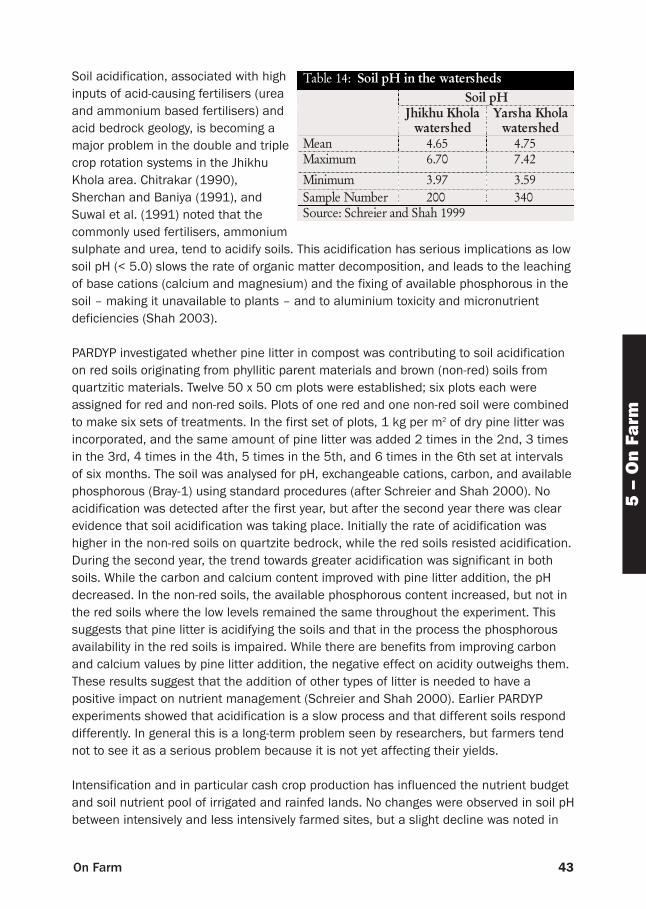
43On Farm
5 –
On
Farm
Soil acidification, associated with highinputs of acid-causing fertilisers (ureaand ammonium based fertilisers) andacid bedrock geology, is becoming amajor problem in the double and triplecrop rotation systems in the JhikhuKhola area. Chitrakar (1990),Sherchan and Baniya (1991), andSuwal et al. (1991) noted that thecommonly used fertilisers, ammoniumsulphate and urea, tend to acidify soils. This acidification has serious implications as lowsoil pH (< 5.0) slows the rate of organic matter decomposition, and leads to the leachingof base cations (calcium and magnesium) and the fixing of available phosphorous in thesoil – making it unavailable to plants – and to aluminium toxicity and micronutrientdeficiencies (Shah 2003).
PARDYP investigated whether pine litter in compost was contributing to soil acidificationon red soils originating from phyllitic parent materials and brown (non-red) soils fromquartzitic materials. Twelve 50 x 50 cm plots were established; six plots each wereassigned for red and non-red soils. Plots of one red and one non-red soil were combinedto make six sets of treatments. In the first set of plots, 1 kg per m2 of dry pine litter wasincorporated, and the same amount of pine litter was added 2 times in the 2nd, 3 timesin the 3rd, 4 times in the 4th, 5 times in the 5th, and 6 times in the 6th set at intervalsof six months. The soil was analysed for pH, exchangeable cations, carbon, and availablephosphorous (Bray-1) using standard procedures (after Schreier and Shah 2000). Noacidification was detected after the first year, but after the second year there was clearevidence that soil acidification was taking place. Initially the rate of acidification washigher in the non-red soils on quartzite bedrock, while the red soils resisted acidification.During the second year, the trend towards greater acidification was significant in bothsoils. While the carbon and calcium content improved with pine litter addition, the pHdecreased. In the non-red soils, the available phosphorous content increased, but not inthe red soils where the low levels remained the same throughout the experiment. Thissuggests that pine litter is acidifying the soils and that in the process the phosphorousavailability in the red soils is impaired. While there are benefits from improving carbonand calcium values by pine litter addition, the negative effect on acidity outweighs them.These results suggest that the addition of other types of litter is needed to have apositive impact on nutrient management (Schreier and Shah 2000). Earlier PARDYPexperiments showed that acidification is a slow process and that different soils responddifferently. In general this is a long-term problem seen by researchers, but farmers tendnot to see it as a serious problem because it is not yet affecting their yields.
Intensification and in particular cash crop production has influenced the nutrient budgetand soil nutrient pool of irrigated and rainfed lands. No changes were observed in soil pHbetween intensively and less intensively farmed sites, but a slight decline was noted in
Table 14: Soil pH in the watersheds Soil pH
Jhikhu Khola
watershed Yarsha Khola
watershed Mean 4.65 4.75 Maximum 6.70 7.42
Minimum 3.97 3.59
Sample Number 200 340 Source: Schreier and Shah 1999
44 Good Practices in Watershed Management
irrigated fields and a slight increase in rainfed fields. Intensification has not led to moreacidic soils as the soils are already acidic and would probably need higher levels ofacidic inputs to cause further acidification. Also the calcium-enriched irrigation watertends to buffer the effects of soil acidity in irrigated sites (Shah 2003).
PARDYP tested the effects of applying lime to the acidic soils of the Jhikhu Kholawatershed. Eight sites with low soil pH were selected. A recommended dose of lime wasapplied to five ropanis of land (1 ropani = 508 m2) by each of three farmers (three sites)in Lamdihi to test its effects on maize – for example: 120, 230, and 294 kg of lime perropani on clay loam soil with pH 6.0, 5.5, and 5.2 respectively, as per AgricultureDevelopment Diary 2005 (AICC 2005). Likewise, lime was applied to five vegetablefarming sites (cauliflower, potato, tomato, and brinjal). At each site control plots wereestablished, and soil pH and production before and after lime application studied. Theresults showed a slight increase in soil pH (by 0.1-0.3) after one crop season followinglime application. Interestingly, the production of potato increased by about 50% in plotswhere lime was applied. A few research farmers pointed out that it was easier to till theland after lime application. The effect of lime on soil pH and production demands muchmore intensive scientific study, including cost:benefit analysis, proper design, andaccuracy of measurement.
Leachate Study in the Jhikhu Khola WatershedNutrient loss through leaching reduces soil fertility and thus production. PARDYPmonitored leaching in its soil erosion monitoring plots on agricultural and degraded landto understand the nutrient dynamics in the soil profile, which might be very important forsustainable soil fertility management.
The leachate volume (6 to 58% of rainfall) in rainfed agricultural land was significantlyhigher than runoff (2 to 7% of rainfall), whereas in degraded land the leachate volume(12 to 16% of rainfall) was slightly lower than runoff (18 to 29% of rainfall). The totalleachate volume was higher in agricultural land than in degraded land, ranging from 541to 4,712 m3/ha in rainfed agricultural land and from 389 to 865 m3/ha in degraded land.The reason might have been the effect of the red soil in the degraded plot, which wasvery compact due to inadequate vegetation resulting in low infiltration. The agricultureplots were somewhat levelled, and due to soil working for cultivation, infiltration inagricultural land is significantly higher than in degraded land. Also, farmers applychemical fertilisers to rainfed agricultural land while no chemical fertilisers are applied todegraded land (see Annex 15).
In rainfed agricultural land, nitrate leaching ranged from 306 to 2,518 kg/ha, which isequivalent to 147 to 1,230 kg/ha of urea fertiliser. Leaching of nitrate from degradedland ranged from 59 to 237 kg/ha, equivalent to 29 and 115 kg/ha of urea fertiliser.Phosphate leaching ranged from 5 to of 94 kg/ha in rainfed agricultural land, equivalentto 3 to 66 kg/ha of diammonium phosphate (DAP) fertiliser, while from degraded land itranged from 1 to 5 kg/ha, equivalent to 1 to 3 kg/ha of DAP fertiliser. Potassium
45On Farm
5 –
On
Farm
leaching ranged from 41 to 801 kg/ha in rainfed agricultural land, which is equivalent to68 and 1,334 kg/ha of murate of potash fertiliser, and from 52 to 160 kg/ha indegraded land, equivalent to 86 and 267 kg/ha of murate of potash fertiliser (see Annex15). Among the three nutrient parameters, nitrate was most leached from the soil,followed by potassium and then phosphate. Phosphate leaching was comparativelysmall.
How to Rehabilitate Degraded LandDegraded land is a major problem in the Jhikhu Khola watershed, and rehabilitation ofdegraded land is one of the major concerns of local people. Degradation is common oncommunal lands as well as on rainfed sloping agricultural (bari) land. PARDYP tested twomajor options to improve these lands: rainfed hill terrace improvement and rehabilitationof degraded communal lands.
Rainfed hill terrace improvementIn Nepali, improvement of rainfed hill terraces is known as ‘gara sudhar’. Rainfed slopingagriculture is very common in the mid-hills of Nepal. Soil fertility is maintained by addingcompost and/or fertiliser, but most of the added nutrients are usually washed out in thefirst rains of the monsoon season. Soil erosion, nutrient leaching, high runoff, and lowsoil moisture status are major concerns on this type of land. At the same time, theproductivity of the crops grown and the scope for crop diversification is limited by theslope. PARDYP joined with the Nepal Government’s Department of Soil Conservation andWatershed Management to test and demonstrate rainfed hill terrace improvement withfarmers in the Jhikhu Khola watershed. The improvements involved slope correction ofthe terrace (thus increasing terrace stability), conserving soil nutrients and moisture, andplanting nitrogen-fixing hedgerow species along the terrace margins in single or multiplerows (thus increasing fodder availability, reducing erosion and runoff, and stabilising theriser). All technical activities were performed manually using locally available tools andmaterials. The species preferred by farmers in the Jhikhu Khola watershed for terracestabilising were:
1) grasses: napier (Pennisetum purpureum), molasses (Melinis minutiflora), and stylo(Stylosanthes guianensis);
2) shrubs: sunhemp (Crotalaria juncea), tephrosia (Tephrosia candida), and flemingia(Flemingia macrophylla).
Typical plantations are shown in Figure 35.
As a result of levelling and planting of vegetative hedgerows, the slope of agriculturalland was reduced from about 30% to around 5%. The technology took about a year to befully established and cost approximately USD 1,300 per ha during the establishmentphase including labour and USD 340 per ha for maintenance. The activity was carriedout by the farmers themselves; PARDYP supported 25% of the total cost of the activity inthe establishment phase and of the planting materials in the following years.
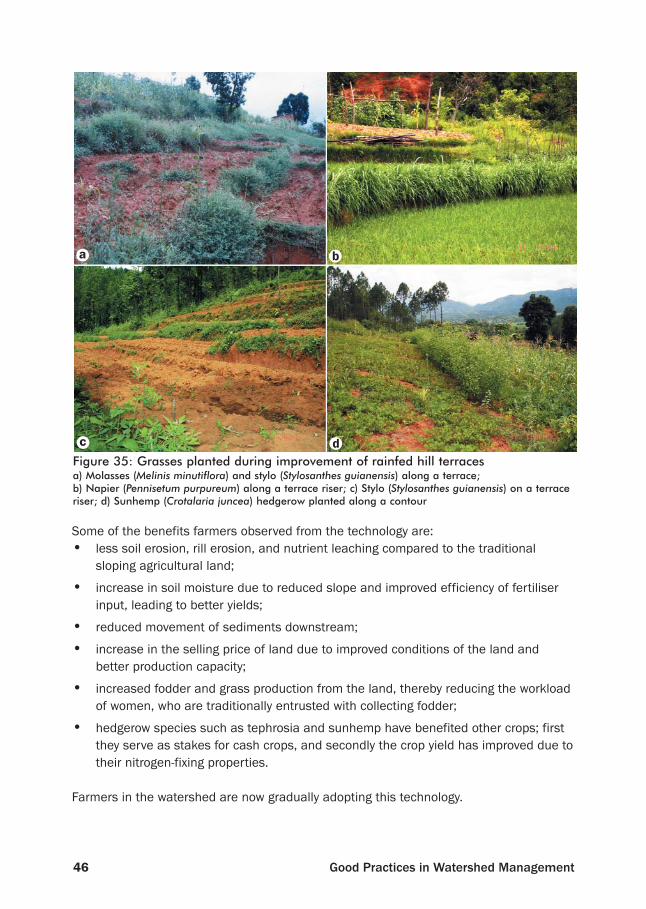
46 Good Practices in Watershed Management
Some of the benefits farmers observed from the technology are: • less soil erosion, rill erosion, and nutrient leaching compared to the traditional
sloping agricultural land;
• increase in soil moisture due to reduced slope and improved efficiency of fertiliserinput, leading to better yields;
• reduced movement of sediments downstream;
• increase in the selling price of land due to improved conditions of the land andbetter production capacity;
• increased fodder and grass production from the land, thereby reducing the workloadof women, who are traditionally entrusted with collecting fodder;
• hedgerow species such as tephrosia and sunhemp have benefited other crops; firstthey serve as stakes for cash crops, and secondly the crop yield has improved due totheir nitrogen-fixing properties.
Farmers in the watershed are now gradually adopting this technology.
Figure 35: Grasses planted during improvement of rainfed hill terracesa) Molasses (Melinis minutiflora) and stylo (Stylosanthes guianensis) along a terrace; b) Napier (Pennisetum purpureum) along a terrace riser; c) Stylo (Stylosanthes guianensis) on a terraceriser; d) Sunhemp (Crotalaria juncea) hedgerow planted along a contour
a b
c d
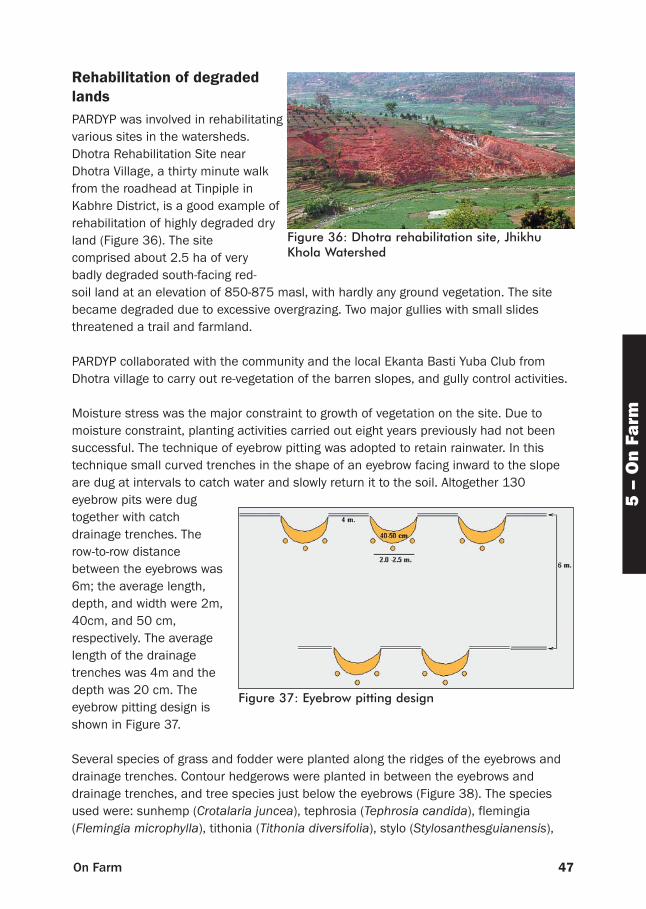
47On Farm
5 –
On
Farm
Rehabilitation of degradedlandsPARDYP was involved in rehabilitatingvarious sites in the watersheds.Dhotra Rehabilitation Site nearDhotra Village, a thirty minute walkfrom the roadhead at Tinpiple inKabhre District, is a good example ofrehabilitation of highly degraded dryland (Figure 36). The sitecomprised about 2.5 ha of verybadly degraded south-facing red-soil land at an elevation of 850-875 masl, with hardly any ground vegetation. The sitebecame degraded due to excessive overgrazing. Two major gullies with small slidesthreatened a trail and farmland.
PARDYP collaborated with the community and the local Ekanta Basti Yuba Club fromDhotra village to carry out re-vegetation of the barren slopes, and gully control activities.
Moisture stress was the major constraint to growth of vegetation on the site. Due tomoisture constraint, planting activities carried out eight years previously had not beensuccessful. The technique of eyebrow pitting was adopted to retain rainwater. In thistechnique small curved trenches in the shape of an eyebrow facing inward to the slopeare dug at intervals to catch water and slowly return it to the soil. Altogether 130eyebrow pits were dugtogether with catchdrainage trenches. Therow-to-row distancebetween the eyebrows was6m; the average length,depth, and width were 2m,40cm, and 50 cm,respectively. The averagelength of the drainagetrenches was 4m and thedepth was 20 cm. Theeyebrow pitting design isshown in Figure 37.
Several species of grass and fodder were planted along the ridges of the eyebrows anddrainage trenches. Contour hedgerows were planted in between the eyebrows anddrainage trenches, and tree species just below the eyebrows (Figure 38). The speciesused were: sunhemp (Crotalaria juncea), tephrosia (Tephrosia candida), flemingia(Flemingia microphylla), tithonia (Tithonia diversifolia), stylo (Stylosanthesguianensis),
Figure 36: Dhotra rehabilitation site, JhikhuKhola Watershed
Figure 37: Eyebrow pitting design
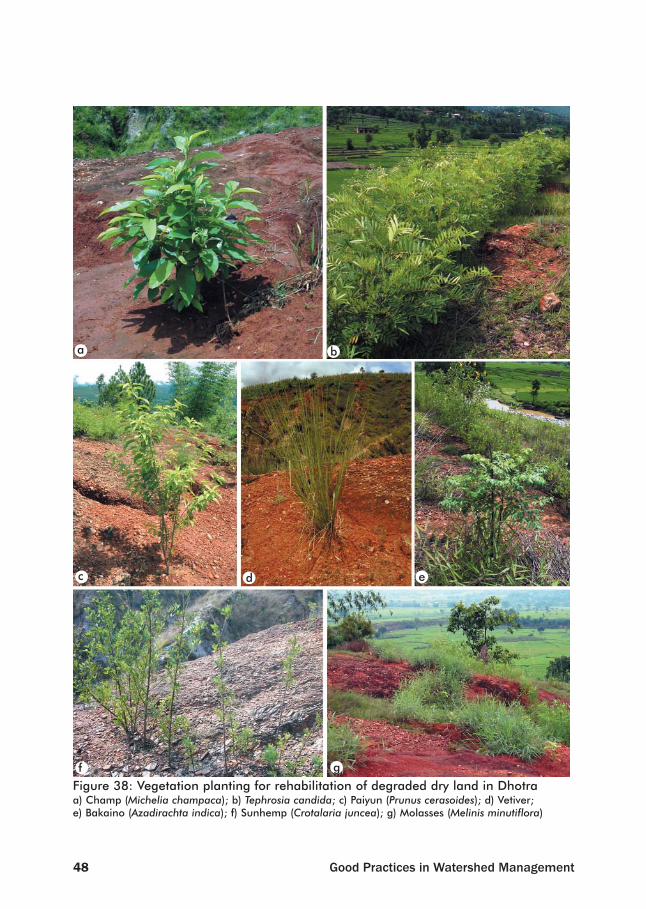
48 Good Practices in Watershed Management
Figure 38: Vegetation planting for rehabilitation of degraded dry land in Dhotraa) Champ (Michelia champaca); b) Tephrosia candida; c) Paiyun (Prunus cerasoides); d) Vetiver; e) Bakaino (Azadirachta indica); f) Sunhemp (Crotalaria juncea); g) Molasses (Melinis minutiflora)
a b
c d e
f g
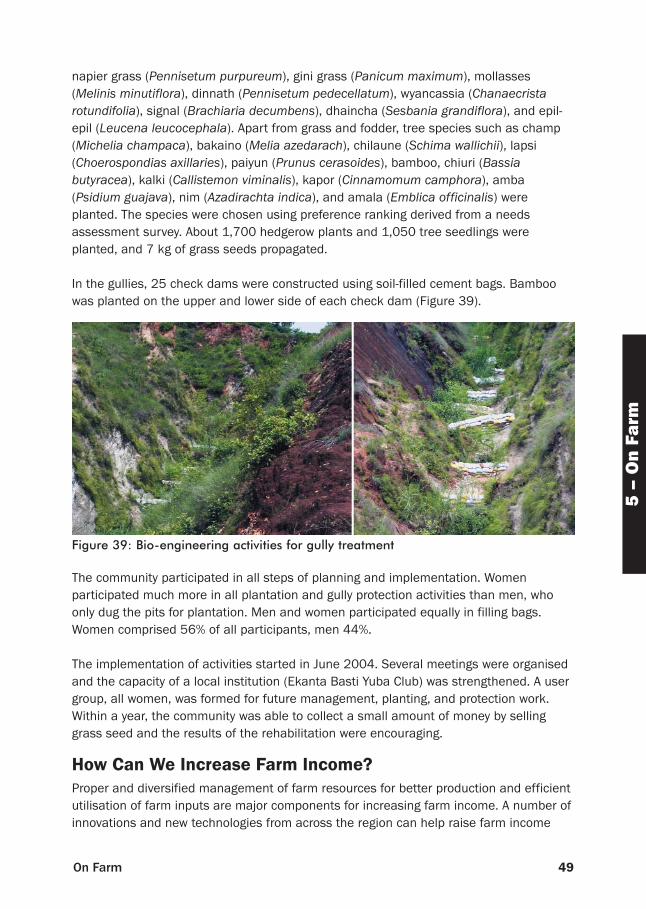
49On Farm
5 –
On
Farm
napier grass (Pennisetum purpureum), gini grass (Panicum maximum), mollasses(Melinis minutiflora), dinnath (Pennisetum pedecellatum), wyancassia (Chanaecristarotundifolia), signal (Brachiaria decumbens), dhaincha (Sesbania grandiflora), and epil-epil (Leucena leucocephala). Apart from grass and fodder, tree species such as champ(Michelia champaca), bakaino (Melia azedarach), chilaune (Schima wallichii), lapsi(Choerospondias axillaries), paiyun (Prunus cerasoides), bamboo, chiuri (Bassiabutyracea), kalki (Callistemon viminalis), kapor (Cinnamomum camphora), amba(Psidium guajava), nim (Azadirachta indica), and amala (Emblica officinalis) wereplanted. The species were chosen using preference ranking derived from a needsassessment survey. About 1,700 hedgerow plants and 1,050 tree seedlings wereplanted, and 7 kg of grass seeds propagated.
In the gullies, 25 check dams were constructed using soil-filled cement bags. Bamboowas planted on the upper and lower side of each check dam (Figure 39).
The community participated in all steps of planning and implementation. Womenparticipated much more in all plantation and gully protection activities than men, whoonly dug the pits for plantation. Men and women participated equally in filling bags.Women comprised 56% of all participants, men 44%.
The implementation of activities started in June 2004. Several meetings were organisedand the capacity of a local institution (Ekanta Basti Yuba Club) was strengthened. A usergroup, all women, was formed for future management, planting, and protection work.Within a year, the community was able to collect a small amount of money by sellinggrass seed and the results of the rehabilitation were encouraging.
How Can We Increase Farm Income?Proper and diversified management of farm resources for better production and efficientutilisation of farm inputs are major components for increasing farm income. A number ofinnovations and new technologies from across the region can help raise farm income
Figure 39: Bio-engineering activities for gully treatment
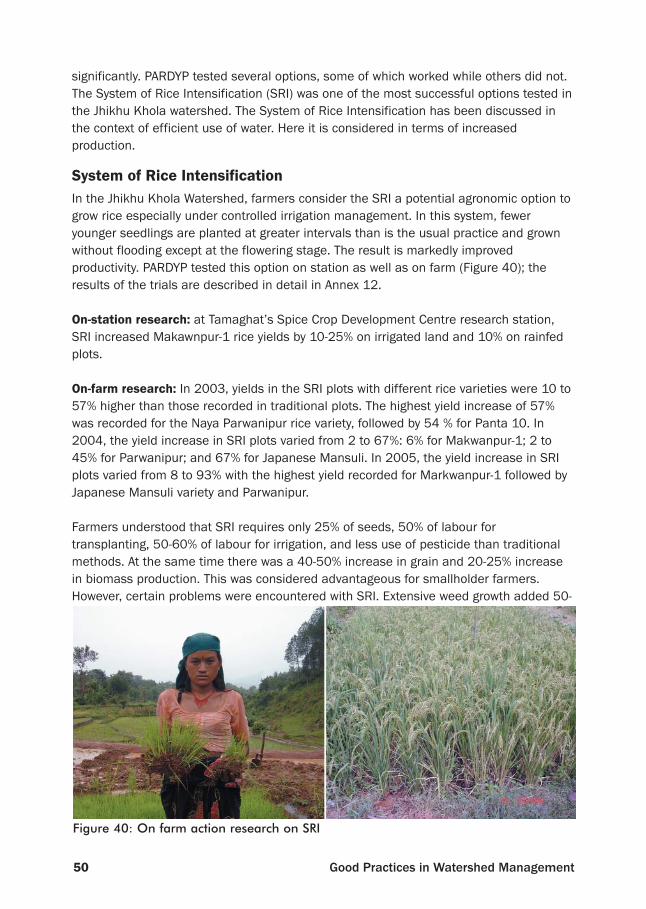
50 Good Practices in Watershed Management
significantly. PARDYP tested several options, some of which worked while others did not.The System of Rice Intensification (SRI) was one of the most successful options tested inthe Jhikhu Khola watershed. The System of Rice Intensification has been discussed inthe context of efficient use of water. Here it is considered in terms of increasedproduction.
System of Rice IntensificationIn the Jhikhu Khola Watershed, farmers consider the SRI a potential agronomic option togrow rice especially under controlled irrigation management. In this system, feweryounger seedlings are planted at greater intervals than is the usual practice and grownwithout flooding except at the flowering stage. The result is markedly improvedproductivity. PARDYP tested this option on station as well as on farm (Figure 40); theresults of the trials are described in detail in Annex 12.
On-station research: at Tamaghat’s Spice Crop Development Centre research station,SRI increased Makawnpur-1 rice yields by 10-25% on irrigated land and 10% on rainfedplots.
On-farm research: In 2003, yields in the SRI plots with different rice varieties were 10 to57% higher than those recorded in traditional plots. The highest yield increase of 57%was recorded for the Naya Parwanipur rice variety, followed by 54 % for Panta 10. In2004, the yield increase in SRI plots varied from 2 to 67%: 6% for Makwanpur-1; 2 to45% for Parwanipur; and 67% for Japanese Mansuli. In 2005, the yield increase in SRIplots varied from 8 to 93% with the highest yield recorded for Markwanpur-1 followed byJapanese Mansuli variety and Parwanipur.
Farmers understood that SRI requires only 25% of seeds, 50% of labour fortransplanting, 50-60% of labour for irrigation, and less use of pesticide than traditionalmethods. At the same time there was a 40-50% increase in grain and 20-25% increasein biomass production. This was considered advantageous for smallholder farmers. However, certain problems were encountered with SRI. Extensive weed growth added 50-
Figure 40: On farm action research on SRI
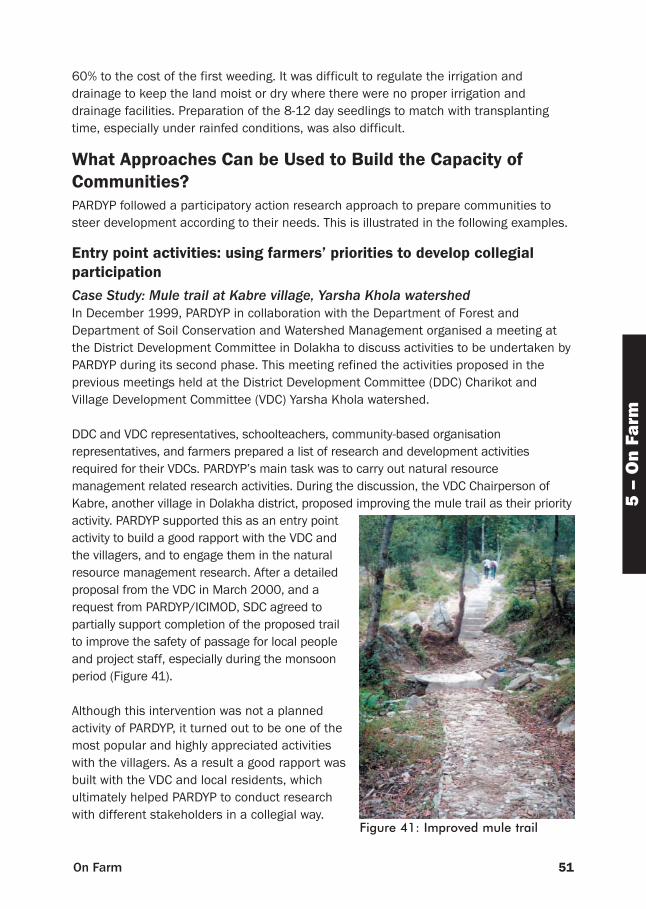
51On Farm
5 –
On
Farm
60% to the cost of the first weeding. It was difficult to regulate the irrigation anddrainage to keep the land moist or dry where there were no proper irrigation anddrainage facilities. Preparation of the 8-12 day seedlings to match with transplantingtime, especially under rainfed conditions, was also difficult.
What Approaches Can be Used to Build the Capacity ofCommunities? PARDYP followed a participatory action research approach to prepare communities tosteer development according to their needs. This is illustrated in the following examples.
Entry point activities: using farmers’ priorities to develop collegialparticipationCase Study: Mule trail at Kabre village, Yarsha Khola watershedIn December 1999, PARDYP in collaboration with the Department of Forest andDepartment of Soil Conservation and Watershed Management organised a meeting atthe District Development Committee in Dolakha to discuss activities to be undertaken byPARDYP during its second phase. This meeting refined the activities proposed in theprevious meetings held at the District Development Committee (DDC) Charikot andVillage Development Committee (VDC) Yarsha Khola watershed.
DDC and VDC representatives, schoolteachers, community-based organisationrepresentatives, and farmers prepared a list of research and development activitiesrequired for their VDCs. PARDYP’s main task was to carry out natural resourcemanagement related research activities. During the discussion, the VDC Chairperson ofKabre, another village in Dolakha district, proposed improving the mule trail as their priorityactivity. PARDYP supported this as an entry pointactivity to build a good rapport with the VDC andthe villagers, and to engage them in the naturalresource management research. After a detailedproposal from the VDC in March 2000, and arequest from PARDYP/ICIMOD, SDC agreed topartially support completion of the proposed trailto improve the safety of passage for local peopleand project staff, especially during the monsoonperiod (Figure 41).
Although this intervention was not a plannedactivity of PARDYP, it turned out to be one of themost popular and highly appreciated activitieswith the villagers. As a result a good rapport wasbuilt with the VDC and local residents, whichultimately helped PARDYP to conduct researchwith different stakeholders in a collegial way.
Figure 41: Improved mule trail

52 Good Practices in Watershed Management
Participatory action research Participatory action research methodology pursues action and research at the sametime. It aims to change an organisation or community by increasing knowledge andunderstanding through learning by doing. There are several forms of action research. Inparticipatory action research, the researchers (as facilitators) and villagers jointlydiagnose problems, their causes, and possible solutions (Figure 42). An example of suchresearch conducted by PARDYP was micro-irrigation combined with high-value cash crops(vegetables).
The PARDYP Water Demand and Supply Survey conducted in 1999 (ICIMOD 2002c)identified irrigation water shortage during the dry season as a major concern for farmers.Several village-level discussions were held in the Jhikhu Khola watershed to identify thepossible causes of water shortage, which crops were adversely affected, and thepractices and technologies adopted by farmers to cope with the situation. Theadvantages and disadvantages of the different technologies, and farmers’ opinions
Improvement of the trail connecting Bagar with Jyamire
The population of the three VDCs (Kabre, Mirge, and Gairimudi) used this trail extensively toreach the roadhead at Minapokhari and to visit the weekly market at Bagar. The biggest partof the trail improvement included mending damaged steep slippery slopes and watercourses(the most difficult part), which were a major problem, especially for schoolchildren, duringflooding. The trail was 406m long with an average width of 1.2m. Concrete, cement, andstones were used to make steps on the steepest slopes and stone soling was done on levelsections. The trail included three small culverts (underground channels to carry water) to crossthe small streams and an irrigation canal. Two big reinforced culverts were constructed overthe Khahare Khola using cement, stone, sand, and iron rods.
Construction work started in August 2000 under the supervision of the VDC chairperson ofKabre, and with the participation of the local people. The work was successfully completed inOctober 2000.
Figure 42: Participatory action research in the field
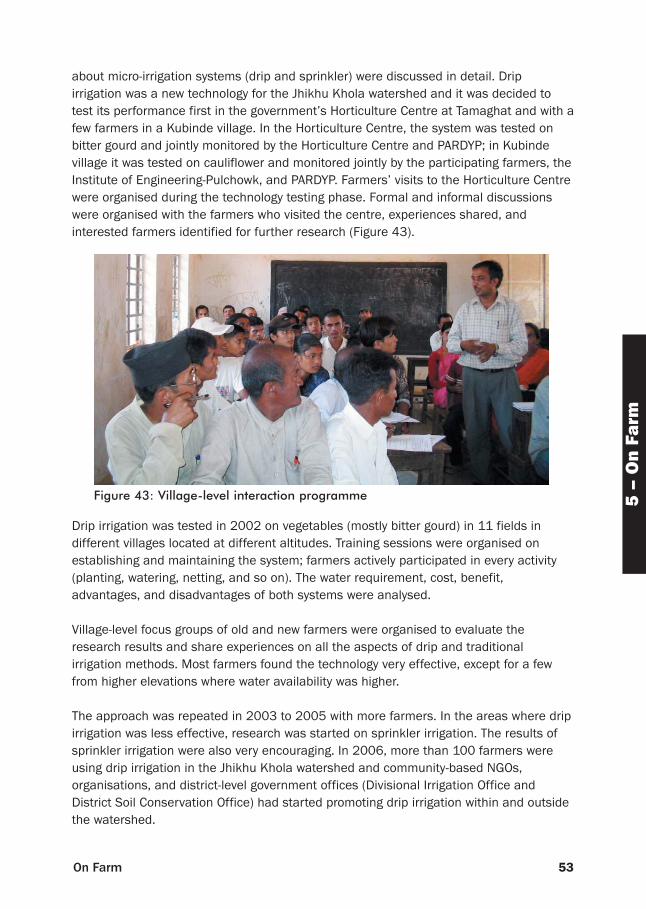
about micro-irrigation systems (drip and sprinkler) were discussed in detail. Dripirrigation was a new technology for the Jhikhu Khola watershed and it was decided totest its performance first in the government’s Horticulture Centre at Tamaghat and with afew farmers in a Kubinde village. In the Horticulture Centre, the system was tested onbitter gourd and jointly monitored by the Horticulture Centre and PARDYP; in Kubindevillage it was tested on cauliflower and monitored jointly by the participating farmers, theInstitute of Engineering-Pulchowk, and PARDYP. Farmers’ visits to the Horticulture Centrewere organised during the technology testing phase. Formal and informal discussionswere organised with the farmers who visited the centre, experiences shared, andinterested farmers identified for further research (Figure 43).
Drip irrigation was tested in 2002 on vegetables (mostly bitter gourd) in 11 fields indifferent villages located at different altitudes. Training sessions were organised onestablishing and maintaining the system; farmers actively participated in every activity(planting, watering, netting, and so on). The water requirement, cost, benefit,advantages, and disadvantages of both systems were analysed.
Village-level focus groups of old and new farmers were organised to evaluate theresearch results and share experiences on all the aspects of drip and traditionalirrigation methods. Most farmers found the technology very effective, except for a fewfrom higher elevations where water availability was higher.
The approach was repeated in 2003 to 2005 with more farmers. In the areas where dripirrigation was less effective, research was started on sprinkler irrigation. The results ofsprinkler irrigation were also very encouraging. In 2006, more than 100 farmers wereusing drip irrigation in the Jhikhu Khola watershed and community-based NGOs,organisations, and district-level government offices (Divisional Irrigation Office andDistrict Soil Conservation Office) had started promoting drip irrigation within and outsidethe watershed.
53On Farm
5 –
On
Farm
Figure 43: Village-level interaction programme
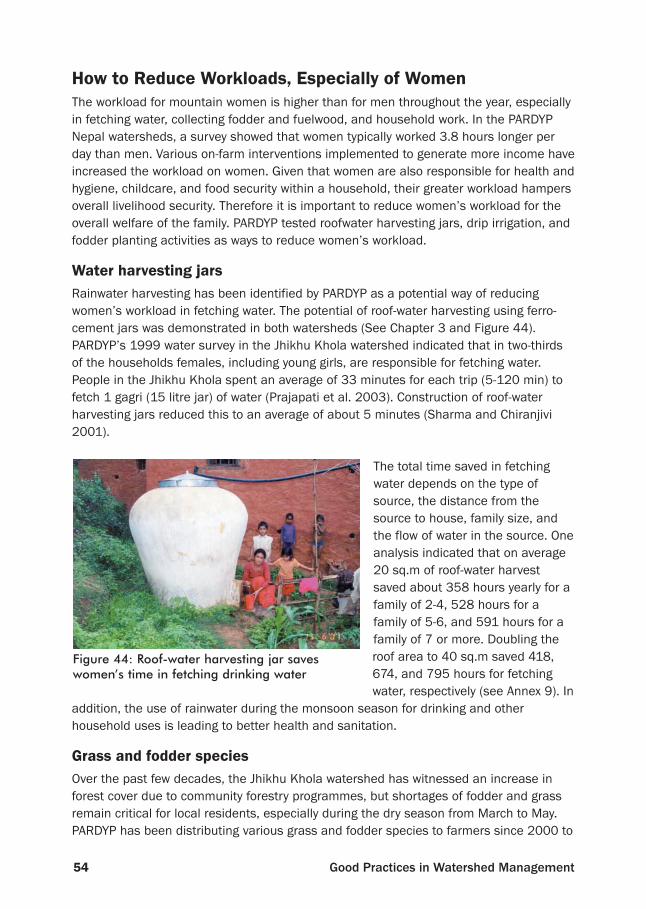
54 Good Practices in Watershed Management
How to Reduce Workloads, Especially of WomenThe workload for mountain women is higher than for men throughout the year, especiallyin fetching water, collecting fodder and fuelwood, and household work. In the PARDYPNepal watersheds, a survey showed that women typically worked 3.8 hours longer perday than men. Various on-farm interventions implemented to generate more income haveincreased the workload on women. Given that women are also responsible for health andhygiene, childcare, and food security within a household, their greater workload hampersoverall livelihood security. Therefore it is important to reduce women’s workload for theoverall welfare of the family. PARDYP tested roofwater harvesting jars, drip irrigation, andfodder planting activities as ways to reduce women’s workload.
Water harvesting jarsRainwater harvesting has been identified by PARDYP as a potential way of reducingwomen’s workload in fetching water. The potential of roof-water harvesting using ferro-cement jars was demonstrated in both watersheds (See Chapter 3 and Figure 44).PARDYP’s 1999 water survey in the Jhikhu Khola watershed indicated that in two-thirdsof the households females, including young girls, are responsible for fetching water.People in the Jhikhu Khola spent an average of 33 minutes for each trip (5-120 min) tofetch 1 gagri (15 litre jar) of water (Prajapati et al. 2003). Construction of roof-waterharvesting jars reduced this to an average of about 5 minutes (Sharma and Chiranjivi2001).
The total time saved in fetchingwater depends on the type ofsource, the distance from thesource to house, family size, andthe flow of water in the source. Oneanalysis indicated that on average20 sq.m of roof-water harvestsaved about 358 hours yearly for afamily of 2-4, 528 hours for afamily of 5-6, and 591 hours for afamily of 7 or more. Doubling theroof area to 40 sq.m saved 418,674, and 795 hours for fetchingwater, respectively (see Annex 9). In
addition, the use of rainwater during the monsoon season for drinking and otherhousehold uses is leading to better health and sanitation.
Grass and fodder speciesOver the past few decades, the Jhikhu Khola watershed has witnessed an increase inforest cover due to community forestry programmes, but shortages of fodder and grassremain critical for local residents, especially during the dry season from March to May.PARDYP has been distributing various grass and fodder species to farmers since 2000 to
Figure 44: Roof-water harvesting jar saveswomen’s time in fetching drinking water
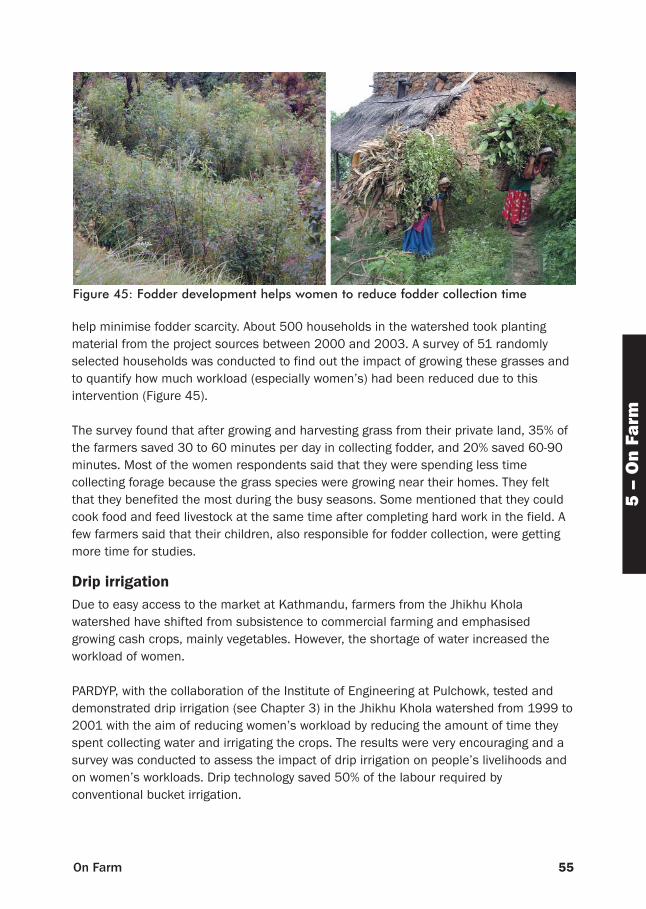
55On Farm
5 –
On
Farm
help minimise fodder scarcity. About 500 households in the watershed took plantingmaterial from the project sources between 2000 and 2003. A survey of 51 randomlyselected households was conducted to find out the impact of growing these grasses andto quantify how much workload (especially women’s) had been reduced due to thisintervention (Figure 45).
The survey found that after growing and harvesting grass from their private land, 35% ofthe farmers saved 30 to 60 minutes per day in collecting fodder, and 20% saved 60-90minutes. Most of the women respondents said that they were spending less timecollecting forage because the grass species were growing near their homes. They feltthat they benefited the most during the busy seasons. Some mentioned that they couldcook food and feed livestock at the same time after completing hard work in the field. Afew farmers said that their children, also responsible for fodder collection, were gettingmore time for studies.
Drip irrigationDue to easy access to the market at Kathmandu, farmers from the Jhikhu Kholawatershed have shifted from subsistence to commercial farming and emphasisedgrowing cash crops, mainly vegetables. However, the shortage of water increased theworkload of women.
PARDYP, with the collaboration of the Institute of Engineering at Pulchowk, tested anddemonstrated drip irrigation (see Chapter 3) in the Jhikhu Khola watershed from 1999 to2001 with the aim of reducing women’s workload by reducing the amount of time theyspent collecting water and irrigating the crops. The results were very encouraging and asurvey was conducted to assess the impact of drip irrigation on people’s livelihoods andon women’s workloads. Drip technology saved 50% of the labour required byconventional bucket irrigation.
Figure 45: Fodder development helps women to reduce fodder collection time
56 Good Practices in Watershed Management
After implementing drip irrigation, 43% of women found that their workload haddecreased, 29% found no change, and 15% didn’t know. Around 14% experienced anincrease of workload because they had started growing vegetables during the fallowperiod when they had not done so previously. Men also saved time because of driptechnology, and 26% of women mentioned their husbands now helped them to do somehousehold work; 40% of women perceived their self-esteem was enhanced because ofdrip irrigation as they could grow cash crops on their own.
Lessons Learned and Recommendations
Maintaining and improving soil fertilityOn-farm composting• Covering traditional compost with black plastic and use of EM enhanced the
compost formation process and produced well-cooked compost within 45-50 daysrather than 4-6 months with the traditional method.
• The moisture requirement for EM is quite significant. This could be a constraintespecially when there is water scarcity.
Soil acidification and lime• In the Jhikhu Khola watershed, soil acidification is associated with acid causing
fertilisers (urea and ammonium sulphate).• Low soil pH (<5) slows the rate of organic decomposition, makes phosphorous
unavailable, and leads to aluminium toxicity.• The benefits of improved carbon and calcium values are outweighed by the decrease
of pH when manure made from pine litter is added.
Leachate • Leaching volume is significantly higher than runoff in rainfed agricultural land,
whereas in degraded land it is slightly lower than runoff.• Nitrate was most leached from the soil, followed by potassium and then phosphate.• The average leachate of nitrate, phosphate, and potassium is equivalent to the loss
of 683 kg/ha of urea, 17 kg/ha of DAP, and 846 kg/ha of murate of potash inrainfed agricultural land, and 70 kg/ha of urea, 2 kg/ha of DAP, and 174 kg/ha ofmurate of potash from degraded land.
Rehabilitation of degraded landRainfed hill terrace improvement• Levelling terraces, water management, introducing grasses to the risers, and
multiple cropping all raise production, making hill terrace improvement attractive tofarmers.
Rehabilitation of degraded lands• Eyebrow pitting is a technological option to improve soil moisture for vegetative
growth in reclamation of dry degraded land.
57On Farm
5 –
On
Farm
• Planting various grasses and trees, especially leguminous species, is important forthe successful reclamation of degraded land.
• Involvement of the beneficiaries, especially women, must be an integral part ofmanaging the natural resource from the beginning.
Increasing farm incomeSystem of Rice Intensification• The system of Rice Intensification (SRI) increases yield with fewer farm inputs;
therefore it is an option to increase farm income.• Extensive weed growth is the foremost problem at the initial stage of the SRI, adding
50-60% more to the cost of the first weeding.• Lack of controlled irrigation and drainage is the major constraint for successful SRI.
Approaches to building community capacityFarmers’ priorities for collegial participation• Trust building is essential for work in rural communities.• Entry point activities are important for building trust with a community.
Participatory action research• People’s involvement in research builds ownership, which helps in scaling up. • Participatory action research not only eased scaling up of the technology but also
helped orient people’s behaviour to research in other areas, which is essential forthe long-term improvement of livelihoods.
Reducing workloads• Roof-water harvesting, fodder development, and drip irrigation are key activities for
saving women’s working time.

58 Good Practices in Watershed Management
6 –
Acc
ess
59Access
BackgroundSociocultural norms and practices shape people’s ownership rights and access to assetssuch as land, water, and household property (livestock, income). Different members ofthe family have different access and responsibilities. Men are often engaged inploughing fields, whereas women are engaged in collecting and fetching water, fodder,and fuelwood. Apart from sharing almost half of the farm work, women also havehousehold duties. Hence it is necessary to look into men’s and women’s roles,responsibilities, knowledge, needs, contributions, and rules and regulations governingthe natural resources. Several questions were asked regarding the access to and controlover assets so that natural resources could be properly managed on an equitable basis.PARDYP carried out studies in the Jhikhu Khola watershed to address these issues.
What are Feasible Local Rules and Practices for EnsuringEquitable Access to Natural Resources?Some of the rules and practices used by the inhabitants of the watershed weredocumented through case studies.
Case study: Gaukhureshwor Community ForestEquitable distribution of resources among different populations and between men andwomen is essential for the balanced development of a community. Traditionally, differentrules and regulations were practised for equitable distribution. One practice in the JhikhuKhola watershed is ‘gola pratha’ (lucky draw). This traditional approach has beenincorporated into the community forest regulations.
Gaukhureshwor Community Forest is a 21.5 ha mixed forest of Schima wallichii,Castanopsis indica, Castanopsis tribuloides, and Rhododendron arboreum located inDhulikhel municipality, Kabhrepalanchowk district. The District Forest Office handed overthe forest to the community in July 1992. The forest has users from eight major villages,with about 52 households in total, a population of 302, and an average populationdensity of 16 persons per ha (as of 2004). Brahmins and Chettris are the dominantethnic groups, providing 67% of the users.
Forest products are distributed on a household basis; each household has to pay NRs240 annually, or NRs 20 per month. Each year the user committee issues membershipcards to each household. The forest user group has an operational plan, which includesdescriptions of rules and regulations, to ensure equal benefits and equitable distribution
6 ACCESS

60 Good Practices in Watershed Management
of available forest products to all members, and for forest protection and management.The plan is submitted to the District Forest Office during the forest handover process.The forest user group manages and distributes forest products according to the agreedplan.
In Gaukhureswor, the community forest is opened twice a year for grass collection: twodays in Bhadra (mid August - mid September) and two days in Asoj (mid September –mid October). During these days, all members of the user group are allowed to collectone bhari (~30-35 kg) of grass per day free of cost. Only one member from a householdis allowed to collect grass. From Mansir to Falgun (mid November to mid February),fuelwood is collected by pruning and thinning, for which the forest is open four days amonth. During this time one member can collect one bhari of fuelwood each day for free.All members can collect up to two extra bharis of fuelwood per day, but have to pay NRs10 for the first bhari and NRs 40 for the second.
To ensure equitable distribution of fuelwood, the user committee has set up a rule ofgola pratha (lucky draw). In this system, all wood from pruning is collected in one placeand divided into equal bundles (bhari). To ensure reasonable distribution, each bundle isnumbered and the number is put in a container. Each member picks a number from thecontainer and receives the corresponding bundle.
From Mangsir to Jestha (mid November to mid May), members are allowed to collect asmuch dry litter for animal bedding as they can free of cost. Dry litter encourages forestfires, so unlimited collection is allowed on the assumption that its removal will help toreduce fire hazards. No one is allowed to collect timber from the forest, but if ahousehold encounters natural disasters or calamities, a member can buy timber fromthe forest at a price 40% lower than the local rate. The maximum limit is set at five cubicfeet per member. Non timber forest products (NTFPs) like lokta are the main source ofincome from this forest and are not distributed to the users but collected and soldcommunally.
One paid guard is appointed for security against illegal use. So far, the members havefollowed the rules and regulations, and very few members have been penalised.However, if someone cuts a tree illegally, collects fuelwood, damages small plants, orstarts a forest fire, they have to pay a penalty decided by the committee based on thescale of damage. If someone cuts grass illegally, they have to pay NRs. 15, 20, and 40for the first, second, and third offences, respectively. At the fourth offence the forestguard seizes the equipment and materials used for collecting grass. Similarly, ifsomeone’s livestock enters into the community forest, they will be charged depending onthe animal: NRs 5, 10, and 20 for a goat; NRs 10, 20, and 40 for a cow; and NRs 20,30, and 60 for a buffalo for the first, second, and third offences, respectively. The users’committee decides the penalty for the fourth offence. The annual income is spent on theguard’s salary and establishment and maintenance of a nursery.
6 –
Acc
ess
61Access
Users claim that because of the good understanding, cooperation among the members,and better management, the quality of the forest and availability of forest products hasimproved over the past 10 years.
Case Study: Juke Irrigation Canals, Jhikhu Khola watershed Juke canal is a farmer-managed irrigation system that extracts water close to Tamaghatbridge on the right hand side of the Jhikhu Khola. The system benefits 250 householdsin 13 villages. It serves command areas of about 45 ha of Panchkhal VDC with anaverage elevation of about 850m. The development of the Juke irrigation system isbelieved to have been associated with a traditional water mill that existed until 1983.The total length of the canal is 9.3 km, of which the primary canal is 2.7 km, thesecondary 3.5 km, and the tertiary 3.1 km. The whole canal is simple earthen type, but50m was cemented about 20m downstream of the main intake with the support of theSINKLAMA project in 1983.
The command area is divided into two parts: the head-end and tail-end. The croppingintensity of the Juke command area is about 250%. Around 92% of the farmers cultivatethree crops per annum; four crops per annum has also been seen at suitable sites. Inirrigated khet land, rice-potato-maize is the most common cropping pattern. Many newvegetables like chilli, bitter gourd, and brinjal have been introduced in the last 5 to 10years. Farmers have also practiced intercropping mustard, sesame, pulses, and beanswith wheat or other vegetables for home consumption.
With the intensification of cropping, the demand for irrigation water is increasing.Because of scarcity of water at the source and seepage, the Juke canal cannot supplywater simultaneously to all command areas. Users of the head-end irrigate their landbefore the users from the tail-end. Having water allows farmers from the head-end tocultivate a higher number of crops compared to the tail-end. Regular cleaning of thecanal is essential for irrigating the land in the lower strata. Therefore, to irrigate the land,users from the tail-end have to clean the canal regularly, although they only enjoy theirrigation facilities for a limited time. This has been the practice in the past.
To compensate for this disparity, the water user group charges different service fees forthe users of the upper and lower end. The principle is that users who have more andeasier irrigation facilities will pay more service fees. This rule was formulated by theusers themselves in 2004 and has worked smoothly. The service fee for the upper areais set at NRs. 30 per ropani per year, whereas it is only NRs. 20 for the lower area. All themaintenance and cleaning is carried out by the fund raised from the service fees.
Irrigation always starts from the head because of the perception that water from thehead will gradually seep downward. If somebody downstream is irrigating, upstreamusers generally do not divert water. However if someone needs water urgently, withmutual understanding they can share water at the same time. For the winter crop, themajority of tail-end users irrigate their land at night.
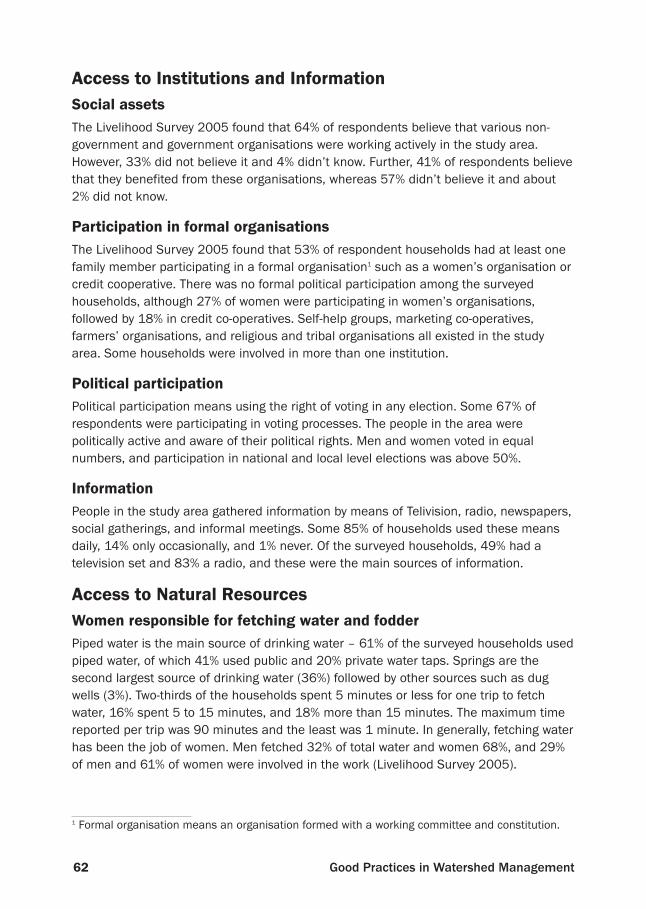
62 Good Practices in Watershed Management
Access to Institutions and InformationSocial assetsThe Livelihood Survey 2005 found that 64% of respondents believe that various non-government and government organisations were working actively in the study area.However, 33% did not believe it and 4% didn’t know. Further, 41% of respondents believethat they benefited from these organisations, whereas 57% didn’t believe it and about2% did not know.
Participation in formal organisationsThe Livelihood Survey 2005 found that 53% of respondent households had at least onefamily member participating in a formal organisation1 such as a women’s organisation orcredit cooperative. There was no formal political participation among the surveyedhouseholds, although 27% of women were participating in women’s organisations,followed by 18% in credit co-operatives. Self-help groups, marketing co-operatives,farmers’ organisations, and religious and tribal organisations all existed in the studyarea. Some households were involved in more than one institution.
Political participationPolitical participation means using the right of voting in any election. Some 67% ofrespondents were participating in voting processes. The people in the area werepolitically active and aware of their political rights. Men and women voted in equalnumbers, and participation in national and local level elections was above 50%.
InformationPeople in the study area gathered information by means of Telivision, radio, newspapers,social gatherings, and informal meetings. Some 85% of households used these meansdaily, 14% only occasionally, and 1% never. Of the surveyed households, 49% had atelevision set and 83% a radio, and these were the main sources of information.
Access to Natural ResourcesWomen responsible for fetching water and fodder Piped water is the main source of drinking water – 61% of the surveyed households usedpiped water, of which 41% used public and 20% private water taps. Springs are thesecond largest source of drinking water (36%) followed by other sources such as dugwells (3%). Two-thirds of the households spent 5 minutes or less for one trip to fetchwater, 16% spent 5 to 15 minutes, and 18% more than 15 minutes. The maximum timereported per trip was 90 minutes and the least was 1 minute. In generally, fetching waterhas been the job of women. Men fetched 32% of total water and women 68%, and 29%of men and 61% of women were involved in the work (Livelihood Survey 2005).
1 Formal organisation means an organisation formed with a working committee and constitution.
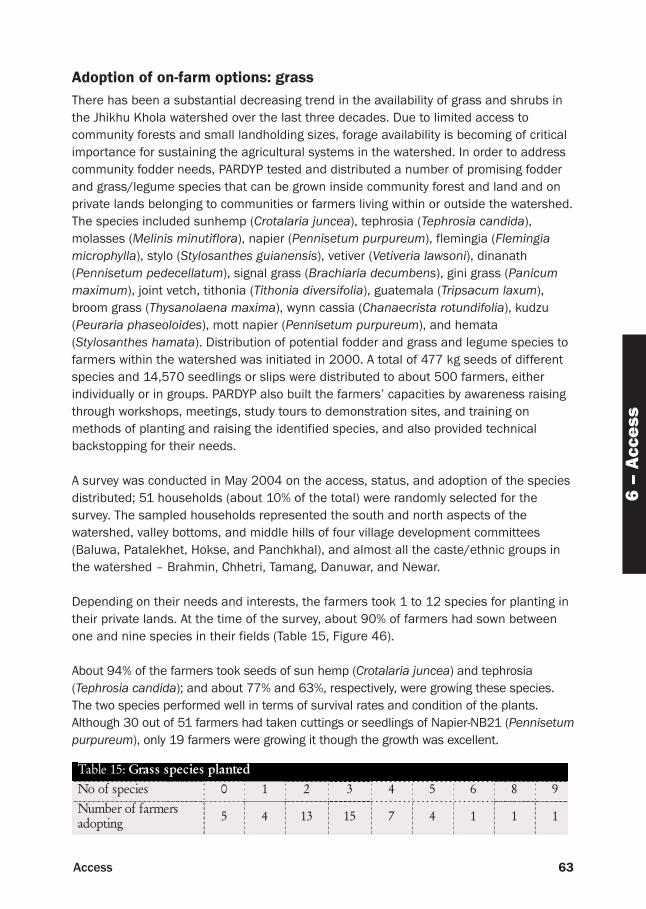
6 –
Acc
ess
63Access
Adoption of on-farm options: grassThere has been a substantial decreasing trend in the availability of grass and shrubs inthe Jhikhu Khola watershed over the last three decades. Due to limited access tocommunity forests and small landholding sizes, forage availability is becoming of criticalimportance for sustaining the agricultural systems in the watershed. In order to addresscommunity fodder needs, PARDYP tested and distributed a number of promising fodderand grass/legume species that can be grown inside community forest and land and onprivate lands belonging to communities or farmers living within or outside the watershed.The species included sunhemp (Crotalaria juncea), tephrosia (Tephrosia candida),molasses (Melinis minutiflora), napier (Pennisetum purpureum), flemingia (Flemingiamicrophylla), stylo (Stylosanthes guianensis), vetiver (Vetiveria lawsoni), dinanath(Pennisetum pedecellatum), signal grass (Brachiaria decumbens), gini grass (Panicummaximum), joint vetch, tithonia (Tithonia diversifolia), guatemala (Tripsacum laxum),broom grass (Thysanolaena maxima), wynn cassia (Chanaecrista rotundifolia), kudzu(Peuraria phaseoloides), mott napier (Pennisetum purpureum), and hemata(Stylosanthes hamata). Distribution of potential fodder and grass and legume species tofarmers within the watershed was initiated in 2000. A total of 477 kg seeds of differentspecies and 14,570 seedlings or slips were distributed to about 500 farmers, eitherindividually or in groups. PARDYP also built the farmers’ capacities by awareness raisingthrough workshops, meetings, study tours to demonstration sites, and training onmethods of planting and raising the identified species, and also provided technicalbackstopping for their needs.
A survey was conducted in May 2004 on the access, status, and adoption of the speciesdistributed; 51 households (about 10% of the total) were randomly selected for thesurvey. The sampled households represented the south and north aspects of thewatershed, valley bottoms, and middle hills of four village development committees(Baluwa, Patalekhet, Hokse, and Panchkhal), and almost all the caste/ethnic groups inthe watershed – Brahmin, Chhetri, Tamang, Danuwar, and Newar.
Depending on their needs and interests, the farmers took 1 to 12 species for planting intheir private lands. At the time of the survey, about 90% of farmers had sown betweenone and nine species in their fields (Table 15, Figure 46).
About 94% of the farmers took seeds of sun hemp (Crotalaria juncea) and tephrosia(Tephrosia candida); and about 77% and 63%, respectively, were growing these species.The two species performed well in terms of survival rates and condition of the plants.Although 30 out of 51 farmers had taken cuttings or seedlings of Napier-NB21 (Pennisetumpurpureum), only 19 farmers were growing it though the growth was excellent.
Table 15: Grass species planted No of species 0 1 2 3 4 5 6 8 9
Number of farmers adopting
5 4 13 15 7 4 1 1 1
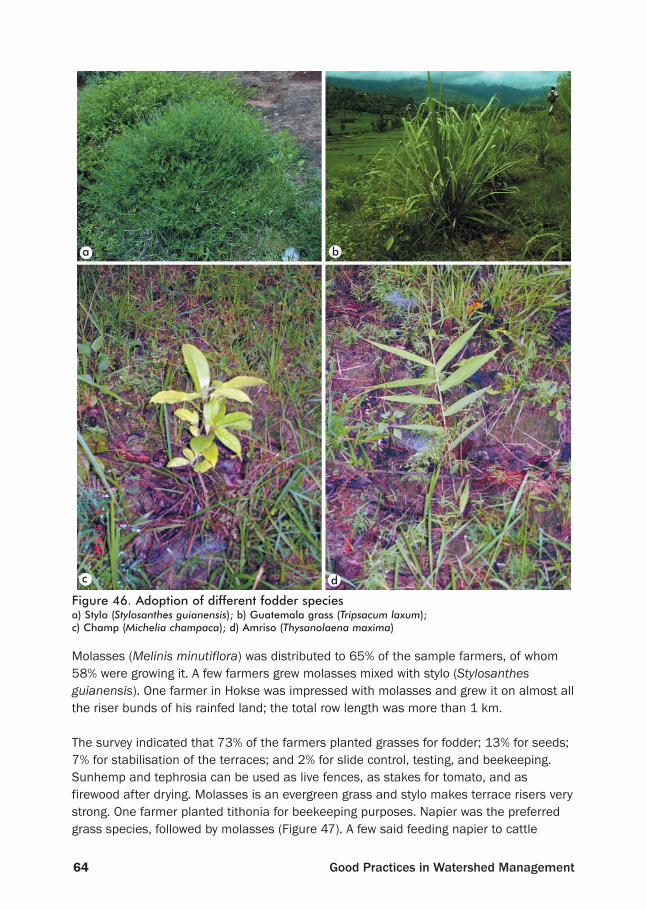
64 Good Practices in Watershed Management
Molasses (Melinis minutiflora) was distributed to 65% of the sample farmers, of whom58% were growing it. A few farmers grew molasses mixed with stylo (Stylosanthesguianensis). One farmer in Hokse was impressed with molasses and grew it on almost allthe riser bunds of his rainfed land; the total row length was more than 1 km.
The survey indicated that 73% of the farmers planted grasses for fodder; 13% for seeds;7% for stabilisation of the terraces; and 2% for slide control, testing, and beekeeping.Sunhemp and tephrosia can be used as live fences, as stakes for tomato, and asfirewood after drying. Molasses is an evergreen grass and stylo makes terrace risers verystrong. One farmer planted tithonia for beekeeping purposes. Napier was the preferredgrass species, followed by molasses (Figure 47). A few said feeding napier to cattle
Figure 46. Adoption of different fodder speciesa) Stylo (Stylosanthes guianensis); b) Guatemala grass (Tripsacum laxum); c) Champ (Michelia champaca); d) Amriso (Thysanolaena maxima)
a b
c d
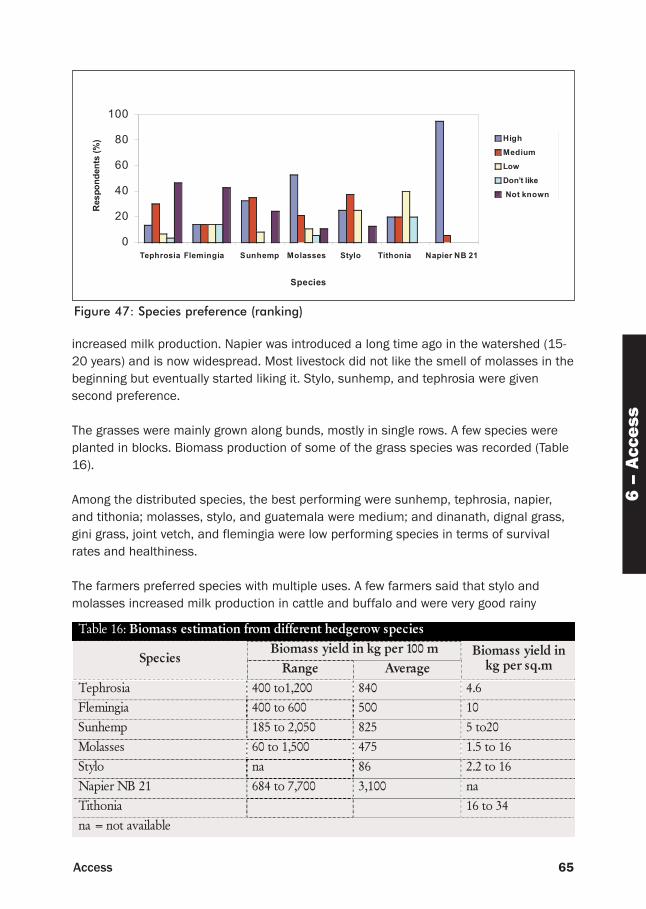
6 –
Acc
ess
65Access
increased milk production. Napier was introduced a long time ago in the watershed (15-20 years) and is now widespread. Most livestock did not like the smell of molasses in thebeginning but eventually started liking it. Stylo, sunhemp, and tephrosia were givensecond preference.
The grasses were mainly grown along bunds, mostly in single rows. A few species wereplanted in blocks. Biomass production of some of the grass species was recorded (Table16).
Among the distributed species, the best performing were sunhemp, tephrosia, napier,and tithonia; molasses, stylo, and guatemala were medium; and dinanath, dignal grass,gini grass, joint vetch, and flemingia were low performing species in terms of survivalrates and healthiness.
The farmers preferred species with multiple uses. A few farmers said that stylo andmolasses increased milk production in cattle and buffalo and were very good rainy
Table 16: Biomass estimation from different hedgerow species
Biomass yield in kg per 100 m Species
Range Average Biomass yield in
kg per sq.m
Tephrosia 400 to1,200 840 4.6
Flemingia 400 to 600 500 10
Sunhemp 185 to 2,050 825 5 to20
Molasses 60 to 1,500 475 1.5 to 16
Stylo na 86 2.2 to 16
Napier NB 21 684 to 7,700 3,100 na
Tithonia 16 to 34
na = not available
0
20
40
60
80
100
Tephrosia Flemingia Sunhemp Molasses Stylo Tithonia Napier NB 21
Species
Res
po
nd
en
ts (
%) High
Medium
Low
Don’t like
Not known
Figure 47: Species preference (ranking)
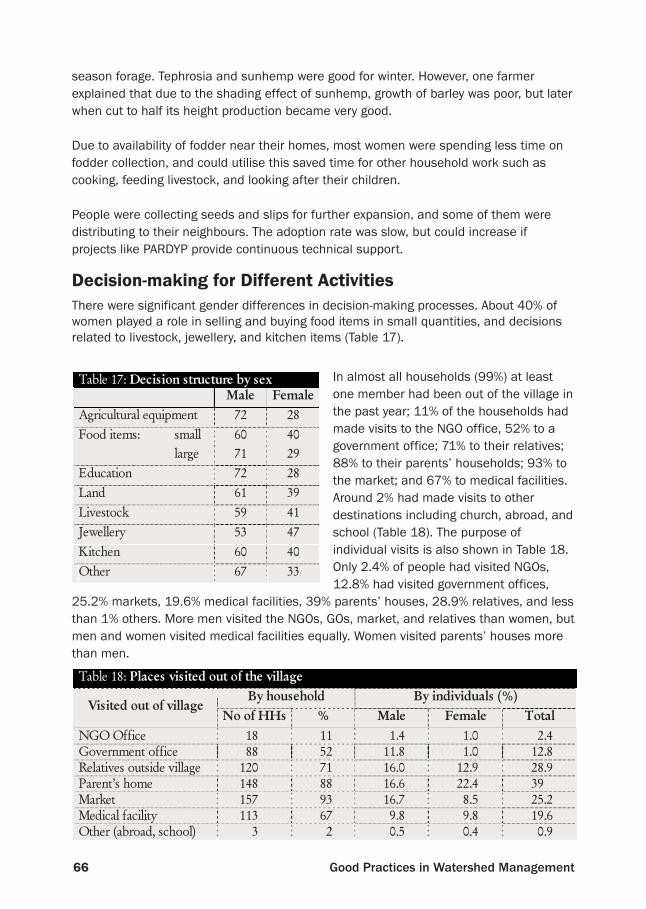
66 Good Practices in Watershed Management
season forage. Tephrosia and sunhemp were good for winter. However, one farmerexplained that due to the shading effect of sunhemp, growth of barley was poor, but laterwhen cut to half its height production became very good.
Due to availability of fodder near their homes, most women were spending less time onfodder collection, and could utilise this saved time for other household work such ascooking, feeding livestock, and looking after their children.
People were collecting seeds and slips for further expansion, and some of them weredistributing to their neighbours. The adoption rate was slow, but could increase ifprojects like PARDYP provide continuous technical support.
Decision-making for Different ActivitiesThere were significant gender differences in decision-making processes. About 40% ofwomen played a role in selling and buying food items in small quantities, and decisionsrelated to livestock, jewellery, and kitchen items (Table 17).
In almost all households (99%) at leastone member had been out of the village inthe past year; 11% of the households hadmade visits to the NGO office, 52% to agovernment office; 71% to their relatives;88% to their parents’ households; 93% tothe market; and 67% to medical facilities.Around 2% had made visits to otherdestinations including church, abroad, andschool (Table 18). The purpose ofindividual visits is also shown in Table 18.Only 2.4% of people had visited NGOs,12.8% had visited government offices,
25.2% markets, 19.6% medical facilities, 39% parents’ houses, 28.9% relatives, and lessthan 1% others. More men visited the NGOs, GOs, market, and relatives than women, butmen and women visited medical facilities equally. Women visited parents’ houses morethan men.
Table 17: Decision structure by sex Male Female
Agricultural equipment 72 28
Food items: small 60 40
large 71 29
Education 72 28
Land 61 39
Livestock 59 41
Jewellery 53 47
Kitchen 60 40
Other 67 33
Table 18: Places visited out of the village By household By individuals (%)
Visited out of village No of HHs % Male Female Total
NGO Office 18 11 1.4 1.0 2.4 Government office 88 52 11.8 1.0 12.8 Relatives outside village 120 71 16.0 12.9 28.9 Parent’s home 148 88 16.6 22.4 39 Market 157 93 16.7 8.5 25.2 Medical facility 113 67 9.8 9.8 19.6 Other (abroad, school) 3 2 0.5 0.4 0.9
6 –
Acc
ess
67Access
Lessons Learned and RecommendationsLocal rules and practices• Indigenous methods such as gola pratha (lucky draw) rooted in community practices
are sustainable natural management tools, and need to be explored to promoteequitable distribution of benefits.
• Equitable contribution (service fee) and distribution of benefits is a key strategy forsustainable management of community activities.
Adoption of on-farm options• Activities that can be easily sustained and that fulfil people’s daily needs are
generally adopted. • Napier is the most preferred grass species because of its growth and acceptance by
livestock.

68 Good Practices in Watershed Management
69References
7 –
Bib
lio
grap
hy
BBiibblliiooggrraapphhyy
AICC (2005) Agriculture Development Diary-2005 Kathmandu: Agriculture Informationand Communication Centre, Lalitpur, Ministry of Agriculture and Cooperatives
ATS/CIIFAD (nd) How to Help Rice Plants to Grow Better and Produce More: TeachYourself and Others. Antananarivo (Madagascar): Association Tefy Saina and NewYork: Cornell International Institute for Food, Agriculture and Development. URL:http://ciifad.cornell.edu/sri/manuals.html
Brown, S. (1999) Gender and Resources in the Middle Mountains of Nepal. Vancouver:University of British Columbia, Institute of Resources and Environment
Chitrakar, P.L. (1990) Planning, Agriculture and Farmers; Strategy for Nepal. Kathmandu:Kedar Pradhan Printing Support Ltd
Dominique, G.; Gonsalves, J.; Upadhyay, K. (2005) External Review Report, InternalReport prepared for People and Resource Dynamics Project. Kathmandu: ICIMOD
Eckholm, E.P. (1976) Losing Ground. Environmental Stress and World Food Prospectus.Washington D.C.: Worldwatch Institute
FAO (1998) Crop Evapotranspiration - Guidelines for Computing Crop WaterRequirement, Irrigation and Drainage Paper 56. Rome: Food and AgricultureOrganization
Gole, C.V.; Chitale, S.V. (1966) ‘Inland Delta Building Activity of Koshi River.’ In Journal ofthe Hydraulics Division, Proceedings of the American Society of Civil Engineers,March 1966
Gupta, G.P. (1975) ‘Sediment Production – Status Report on Data Collection andUtilization.’ In Soil Conservation Digest, 3 (2), September 1975. Dehra Dun:Association of Soil and Water Conservationists and Trainees
HMGN (1975) Experience of Anti-Desertification Campaigns in Nepal. A Country Paperon Desertification. Kathmandu: His Majesty’s Government of Nepal
ICIMOD (2002a) Water and Erosion Studies of PARDYP-Nepal: Data of the Jhikhu KholaWatershed, with updates to 2006. Kathmandu: ICIMOD
ICIMOD (2002b) Water and Erosion Studies of PARDYP-Nepal: Data of the Yarsha KholaWatershed. Kathmandu: ICIMOD
ICIMOD (2002c) Water Demand and Supply Survey. Kathmandu: ICIMOD
ICIMOD (2002d) PARDYP in the HKH Region, CD-ROM. Kathmandu: ICIMOD
Livelihood Survey (2005), unpublished internal report prepared for PARDYP, ICIMOD,Kathmandu
7 BIBLIOGRAPHY ANDFURTHER READING
70 Good Practices in Watershed Management
LRMP (1986) Land Use Map, Land Resource Mapping Project. Kathmandu: Departmentof Survey
Mathema P.; Singh, B. K. (2003) Soil Erosion Studies in Nepal: Results and Implications.Kathmandu: Department of Soil Conservation and Watershed Management
Merz, J. (2004) Water Balance, Floods and Sediment Transport in the Hindu Kush-Himalayas: Data Analyses, Modelling and Comparison of Selected Meso-scaleCatchments, Ph.D.Thesis. Berne: University of Berne, Geographica Bernensia andKathmandu: ICIMOD
Merz, J.; Dangol P.; Dhakal, M. (2000) ‘Comparison of Climatological Balances for theJhikhu Khola and Yarsha Khola Watersheds, Nepal.’ In Allen, R.; Schreier, H.; Brown,S.; Shah, P.B. (eds) The People and Resource Dynamics Project, The First ThreeYears (1996-1999). Kathmandu: ICIMOD
Merz, J.; Nakarmi, G.; Shrestha, S. K.; Dahal, B. M.; Dangol, P. M.; Dhakal, M .P.; Dongol,B. S.; Sharma, S.; Shah, P. B.; Weingartner, R. (2003) ‘Water: A Scarce Resource inRural Watersheds of Nepal’s Middle Mountains’. In Journal of Mountain Researchand Development, 23: 41-49
Merz, J.; Nakarmi, G.; Shrestha, S.; Shrestha, B.; Shah, P.B.; Weingartner, R. (2002)Water Demand and Supply in Rural Watersheds of the Nepal Middle Mountains: theLocal Perception in the Yarsha and Jhikhu Khola Watersheds. Kathmandu: ICIMOD
Nakarmi, G. (2003) Executive Summary of Soil Erosion Research Conducted in JhikhuKhola (1992-2002), and Yarsha Watersheds (1997-2000), unpublished paperprepared for PARDYP- Nepal
Nakarmi, G.; Merz, J.; Dhakal, M. (2003) ‘Harvesting Roof Water for LivelihoodImprovement: A Case Study of the Yarsha Khola Watershed, Eastern Nepal’. In NewsBulletin of Nepal Geological Society, 20: 83-87
Prajapati, B.; Shah, P. B.; Nakarmi, G.; Shrestha, B.; Merz, J. (2003) ‘Initiative TowardsReducing Women’s Workload’, unpublished paper prepared for PARDYP-Nepal
Rieger, H.C. (1976) ‘Floods and Droughts: The Himalaya and the Ganges Plains as anEcological System’. In Mountain Environment and Development, a collection ofpapers published on the occasion of the 20th Anniversary of the Swiss Association forTechnical Assistance in Nepal (SATA). Kathmandu: SATA
RWSSSP (1994) Palpa District – Water Supply and Sanitation Development Plan (Draft).Kathmandu: Department of Water Supply and Sewerage, HMG/Ministry of Housingand Physical Planning
Schreier, H.; Shah, P. B. (2000) ‘Soil Fertility Status and Dynamics in the Jhikhu andYarsha Khola Watersheds’. In Allen, R.; Schreier, H.; Brown, S.; Shah, P.B. (eds) ThePeople and Resource Dynamics Project, The First Three Years (1996-1999).Kathmandu: ICIMOD
SCWMC (2004) Soil Conservation and Watershed Management Measures and Low CostTechniques. Kathmandu: Soil Conservation and Watershed ManagementComponent-Department of Soil Conservation and Watershed Management
Shah, P.B. (2003) ‘Nutrient Dynamics in Farming Systems of Jhikhu Khola Watershed’ InWhite, R.; Bhuchar, S.K. (eds) Resource Constraints and Management Options inMountain Watersheds of the Himalaya. Kathmandu: ICIMOD
71References
7 –
Bib
lio
grap
hy
Sharma, C. (2001) Socioeconomic Indicative Impact Assessment and Benchmark Studyon Rooftop Rainwater Harvesting Kavre Palanchok District, Nepal, unpublishedpaper prepared for ICIMOD
Sherchan, K.K.; Banyia, B.K. (1991) ‘Crop Production and its Trend in Response to Soiland Nutrients’. In Shah, P.B.; Schreier, H.; Brown, S.; Riley, W.K. (eds) Soil Fertilityand Erosion Issues in the Middle Mountains of Nepal. Ottawa: InternationalDevelopment Research Centre
Shrestha, B. (1999) ‘Population Dynamics and Land Use in the Yarsha Khola Watershed.’In Allen, R.; Schreier, H.; Brown, S.; Shah, P.B. (eds) The People and ResourceDynamics Project, The First Three Years (1996-1999). Kathmandu: ICIMOD
Shrestha, B. (2005a) Population Dynamics in the Jhikhu Khola Watershed, unpublishedpaper prepared for PARDYP-Nepal
Shrestha, B. (2005b) Land Use Dynamics and Agricultural Intensification in the JhikhuKhola Watershed, unpublished paper prepared for PARDYP-Nepal
Shrestha, B. Land Use Mapping and GIS, unpublished report prepared for PARDYP-Nepal
Sinclair, T. R. (2004) ‘Agronomic UFOs Waste Valuable Scientific Resources’. In RiceToday, 3(3):43
Sterling, C. (1976) ‘Nepal’. In The Atlantic Magazine, USA
Sthapit, K. M.; Balla, M. K. (1998) Review of Runoff and Soil Loss Studies. A TeachingMaterial for Soil Conservation and Watershed Management for B.Sc. Forestry.Pokhara: Training and Manpower Development in Community Forestry ManagementProject, Institute of Forestry / International Tropical Timber Organization
Sthapit, K.M. (1996) Sedimentation Monitoring of Kulekhani Reservoir. Paper presentedat the International Conference on Reservoir Sedimentation, held September 9 - 13,1996, Fort Collins, Colorado, USA
Suwal, M.; Subedi, K.; Gurung, G. (1991) ‘Soil Fertility Thrust Towards SustainableAgriculture: Experiences of Lumle Regional Agricultural Research Centre’. In Shah,P.B.; Schreier, H.; Brown, S.; Riley, K. (eds) Soil Fertility and Erosion Issues in theMiddle Mountains of Nepal, pp.61-82. Ottawa: International Development ResearchCentre
Uphoff, N. (2004) ‘System of Rice Intensification Responds to 21st Century Needs’. InRice Today, 3 (3):42
WHO (1997) Guidelines for Drinking Water Quality. Volume 1: Recommendations, SecondEdition. Geneva: World Health Organization

72 Good Practices in Watershed Management
FFuurrtthheerr rreeaaddiinngg
PARDYP has prepared many documents and publications. Some of the publicationsrelated to this report are listed below; they are available in the ICIMOD library.
CD-ROMs Brown, S. (1999) Gender and Resources in the Middle Mountains of Nepal, Yarsha Khola
Watershed. Vancouver: University of British Columbia, Institute for Resource andEnvironment
Brown, S. et al. (2002) Yarsha Khola Watershed, Nepal. Vancouver: University of BritishColumbia, Institute for Resource and Environment
ICIMOD (2002a) Water and Erosion Studies of PARDYP Nepal: Data of the Jhikhu KholaWatershed, with updates to 2006. Kathmandu: ICIMOD
ICIMOD (2002b) Water and Erosion Studies of PARDYP Nepal: Data of the Yarsha KholaWatershed. Kathmandu: ICIMOD
ICIMOD (2002c) Water Demand and Supply Survey. Kathmandu: ICIMODICIMOD (2002d) PARDYP in the HKH Region, CD-ROM. Kathmandu: ICIMODLivelihood Survey (2005), unpublished internal report prepared for PARDYP, ICIMOD,
KathmanduSchreier, H. et al. (2002) Jhikhu Khola Watershed, Nepal. Vancouver: University of British
Columbia, Institute for Resource and EnvironmentShah, P.B.; Shrestha, B.; Nakarmi, G; Allen. R. (1997) Complex problems - complex
options: preservation, degradation and rehabilitation in a Nepalese Watershed,PARDYP Project on People and Resource Dynamics in the Himalayas. Vancouver:University of British Columbia, Institute for Resources and Environment
ThesesBrown, S. (1997) Soil Fertility, Nutrient Dynamics and Socioeconomic Interactions in the
Middle Mountains of Nepal, Ph.D.Thesis. Vancouver: University of British Columbia,Institute for Resources and Environment
Merz, J. (2004) Water Balance, Floods and Sediment Transport in the Hindu Kush-Himalayas: Data Analyses, Modelling and Comparison of Selected Meso-scaleCatchments, Ph.D.Thesis. Berne: University of Berne, Geographica Bernensia andKathmandu: ICIMOD
Schaffner, M. (2003) Drinking Water Quality Assessment and Improvement in the JhikhuKhola Catchment, Nepal, Master’s Thesis. Berne: University of Berne
Von Westarp, S. (2002) Agricultural Intensification, Soil Fertility Dynamics, and Low CostDrip Irrigation in the Middle Mountains of Nepal, Master’s Thesis. Vancouver:University of British Columbia, Institute for Resources and Environment
ProceedingsAllen, R.; Schreier, H.; Brown, S.; Shah, P.B. (eds) (2000) The People and Resource
Dynamics Project, The First Three Years (1996-1999). Kathmandu: ICIMODWhite, R.; Bhuchar, S.K. (eds) (2005) Resource Constraints and Management Options in
Mountain Watersheds of the Himalaya. Kathmandu: ICIMOD