good morning. i am joe o’reilly, executive director for
TRANSCRIPT
Good morning. I am Joe O’Reilly, Executive Director for Student Achievement Support at Mesa Schools.
We are getting very close to the debut of the AzMERIT results for your districts so we thought it would be a good idea to share with you more information that will help you and your district have a smoother rollout.

The debut begins in a little over 2 weeks when you will receive school and district level reports and a data file electronically.
About two weeks after that you will receive the paper Family Reports to distribute to students and their parents.
And some time in November the state will release the results by school and district. By the way, once the press knows that the reports are out it is likely that we will get requests for them. I want to take some time to digest the results and understand them before we comment on them, so we plan to wait for the state release.

Last webinar we covered what the items looked like, how the performance levels were going to be set, how we thought the results would turn out and what the implications were for schools and students.
Today I want to just repeat two points about the test that may help you better explain the results. Then I will describe exactly how the performance standards were set and by who, What the results actually are, and then cover the Family Report and communicating AzMERIT results to your communities.
3
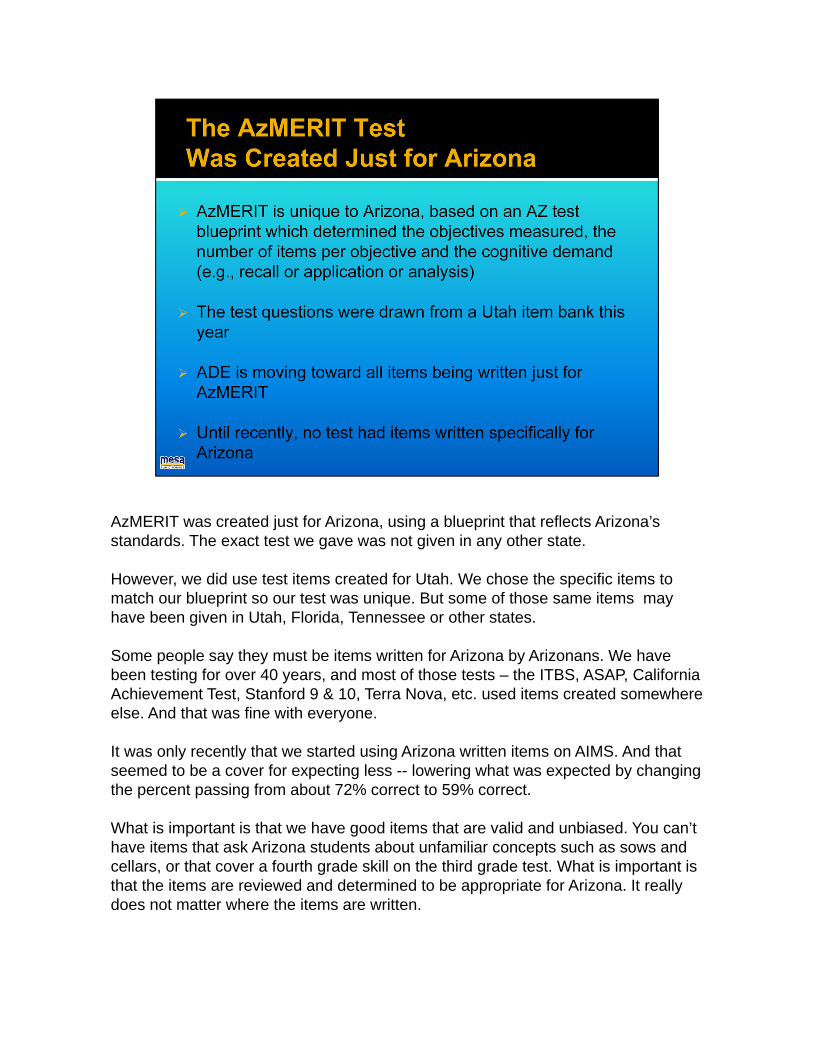
AzMERIT was created just for Arizona, using a blueprint that reflects Arizona’s standards. The exact test we gave was not given in any other state.
However, we did use test items created for Utah. We chose the specific items to match our blueprint so our test was unique. But some of those same items may have been given in Utah, Florida, Tennessee or other states.
Some people say they must be items written for Arizona by Arizonans. We have been testing for over 40 years, and most of those tests – the ITBS, ASAP, California Achievement Test, Stanford 9 & 10, Terra Nova, etc. used items created somewhere else. And that was fine with everyone.
It was only recently that we started using Arizona written items on AIMS. And that seemed to be a cover for expecting less -- lowering what was expected by changing the percent passing from about 72% correct to 59% correct.
What is important is that we have good items that are valid and unbiased. You can’t have items that ask Arizona students about unfamiliar concepts such as sows and cellars, or that cover a fourth grade skill on the third grade test. What is important is that the items are reviewed and determined to be appropriate for Arizona. It really does not matter where the items are written.
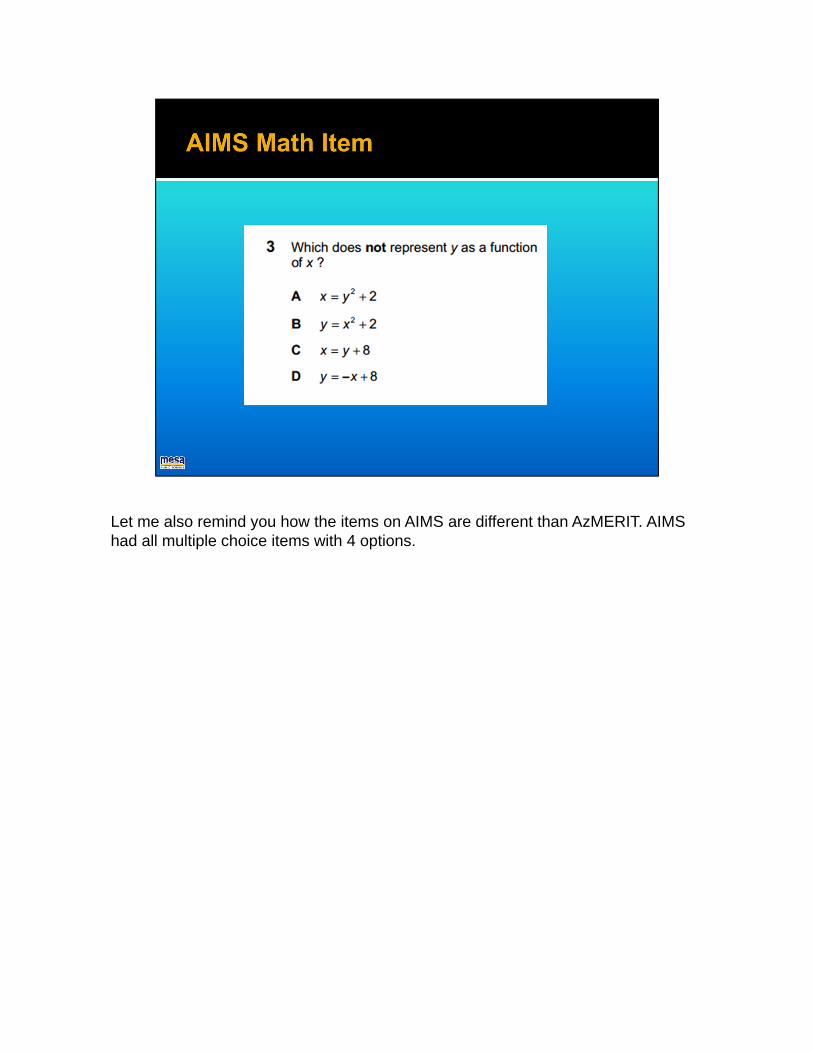
Let me also remind you how the items on AIMS are different than AzMERIT. AIMS had all multiple choice items with 4 options.
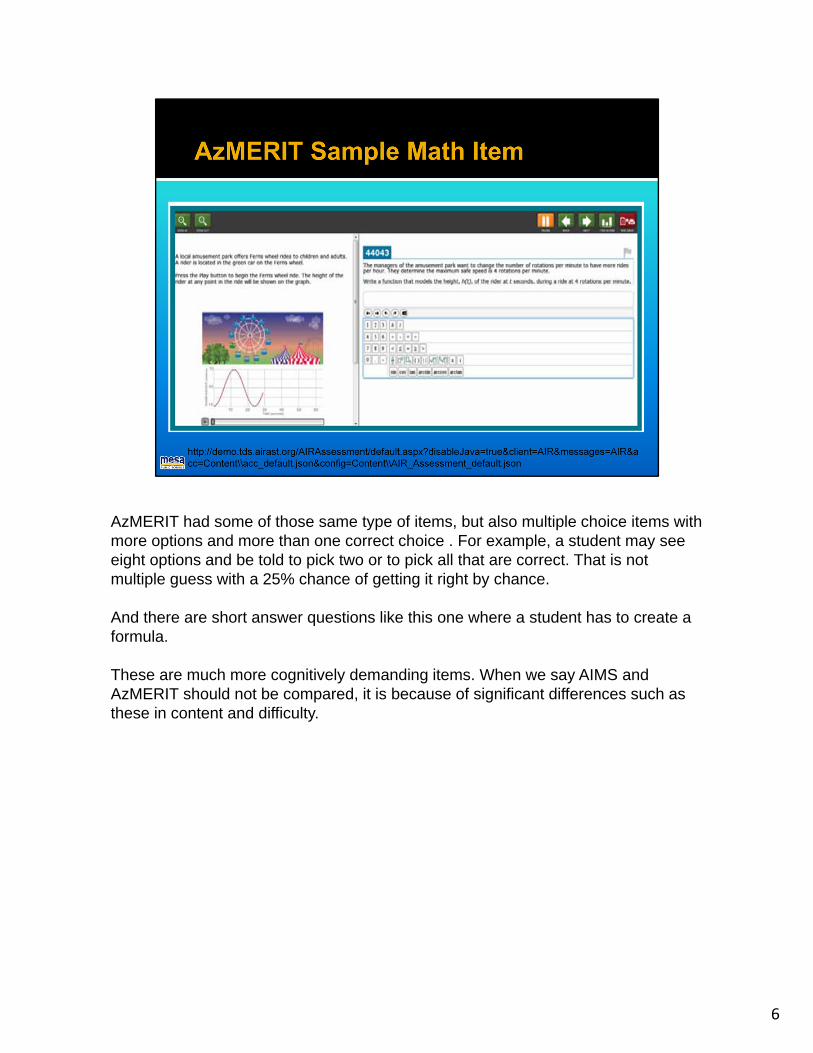
AzMERIT had some of those same type of items, but also multiple choice items with more options and more than one correct choice . For example, a student may see eight options and be told to pick two or to pick all that are correct. That is not multiple guess with a 25% chance of getting it right by chance.
And there are short answer questions like this one where a student has to create a formula.
These are much more cognitively demanding items. When we say AIMS and AzMERIT should not be compared, it is because of significant differences such as these in content and difficulty.
6

I thought you may also find interesting a survey we did of Mesa teachers and students after the testing. What did they think of the test they just took?• Almost 8 in 10 teachers felt that azMERIT was harder than AIMS while only about
half of students felt that way.• Everyone felt it mostly covered the content that was taught. • Teachers thought the format was more difficult than students, but many students
also found the format difficult. Getting students familiar with the format will be one way we improve performance this year.
• The majority of all groups want to use computers going forward, with students being much more positive about using computers than teachers. I should also add that teachers felt the administrivia of testing – collecting booklets, counting them in and out, being responsible for any lost booklet or answer sheet, etc. was much easier and less time intensive with online testing.

So lets talk about how the performance levels were set.
Spoiler alert – the bottom line is they were set by teachers who were experienced with those grade levels and subjects.
8

Before the standard setting process ADE and teachers developed Performance Level Descriptors for each individual standard that described students who were solidly proficient, highly proficient partially proficient and minimally proficient.
Do you see the vertical black lines between each performance standard? That is what was not defined in this process. When is a student just barely over the line to proficient or just barely below that line, not solidly in that category?
That is what the teachers did this summer – define the boundary or cut point between performance levels. And this document helped them do that.
This is a very detailed document with a lot of good information for teachers. When I asked the teachers who set the boundaries how they were going to get their students to mastery they told me their teaching was now going to be guided by these PLDs, not their textbooks. So it is something that all districts should look at.

So How did they set the cut points or boundaries?
10

We were told we could not take pictures, but I got there early and had taken a picture before the ban was announced. I wanted to show you the luxurious accommodations the teachers spent a week in.
Each room covered one subject area, ELA or math, and one grade span. So, this room was grades 9-11 math. There were also rooms for grades 3-4, 5-6, and 7-8 math. There were similar rooms set up for ELA.
There were three tables with up to 4 teachers each, and you can see the computers they used to get data and information.
11
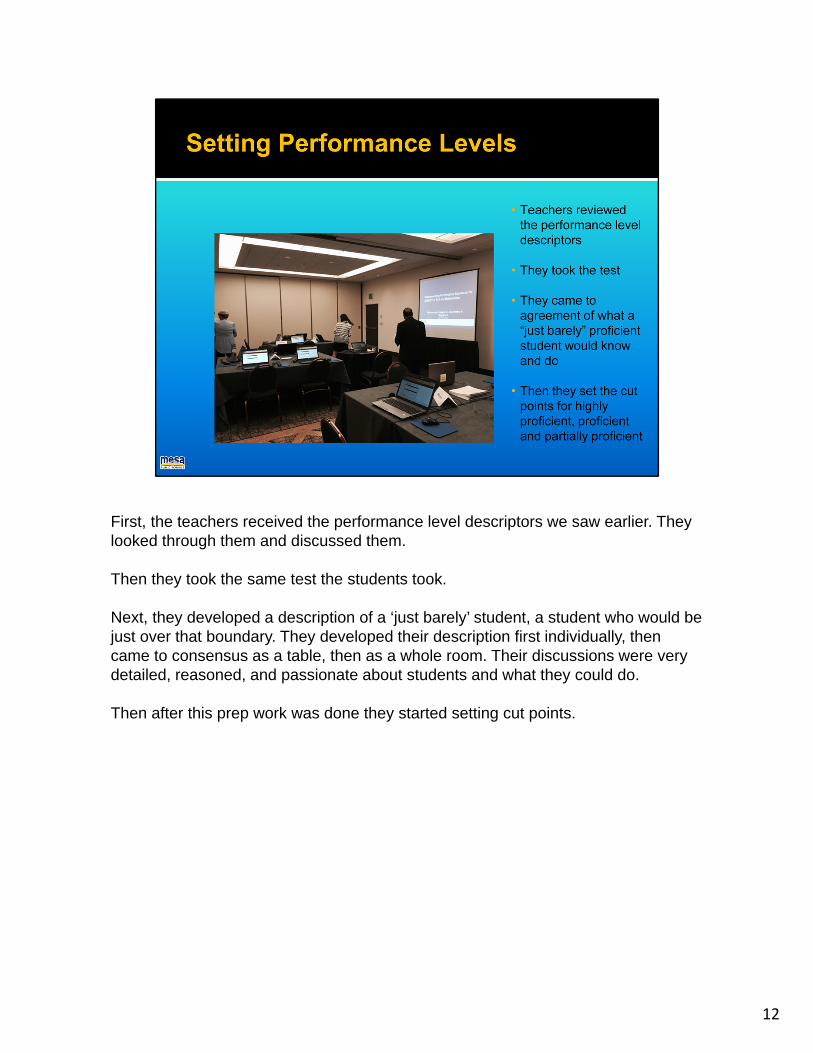
First, the teachers received the performance level descriptors we saw earlier. They looked through them and discussed them.
Then they took the same test the students took.
Next, they developed a description of a ‘just barely’ student, a student who would be just over that boundary. They developed their description first individually, then came to consensus as a table, then as a whole room. Their discussions were very detailed, reasoned, and passionate about students and what they could do.
Then after this prep work was done they started setting cut points.
12

They did it using the bookmark method.
They were given the items in order of difficulty from the easiest to hardest. It used to be these would be in an actual book and the teacher would place a physical bookmark in the book at the item he or she thought a just barely student would get right and a student just below that would not get right. Now it is done on a computer, but the process is the same.
In addition to seeing the item, the teachers also saw information about other tests. For example, an item of this difficulty is equivalent to approaches standard on AIMS or is equivalent to the proficient level on NAEP or college and career ready on the ACT College and Career Ready Index. They were told this was to provide ‘context for their standard setting decisions’ and was not intended for them to set it the same as these other tests.
The teachers set their bookmarks individually, then as a table of 4 and then as a whole group. They did this for proficient, highly proficient and partially proficient.
13

Then they saw the impact of their decisions – how many students would fall in each category. Then they were asked to review their decisions and make any adjustments they thought necessary.
There were very few changes, if any, based on the impact data. What I heard the teachers say is that they were setting it for should, not would – what students should know and do, not what current students can do.
14

People ask me if the fix was in. Another observer had a training with the principals in his district and before he could start he was asked “tell us the truth – were these levels really set by ADE or AIR? He said no, they really were set by the teachers.
I also saw it that way. I saw a very teacher driven approach to setting performance levels. They put a structure in place, had the teachers think deeply about what a just barely student was, and then they trusted the teachers. The State Board’s guideline that it should be comparable to other states gave them a framework, but they decided the levels.
After it was all over I asked the Mesa teachers who participated what they thought. This is one representative answer. As you can see, she felt the teachers set the levels.
15

The state board accepted the teachers recommendations without any changes. They trusted the teachers to know best.
So if someone asks who decided that was passing? You can tell them experienced, expert Arizona teachers did. Teachers that had high hopes and expectations for Arizona students, for their students that they see in class every day.
They have set a big challenge for themselves and all of us.
16
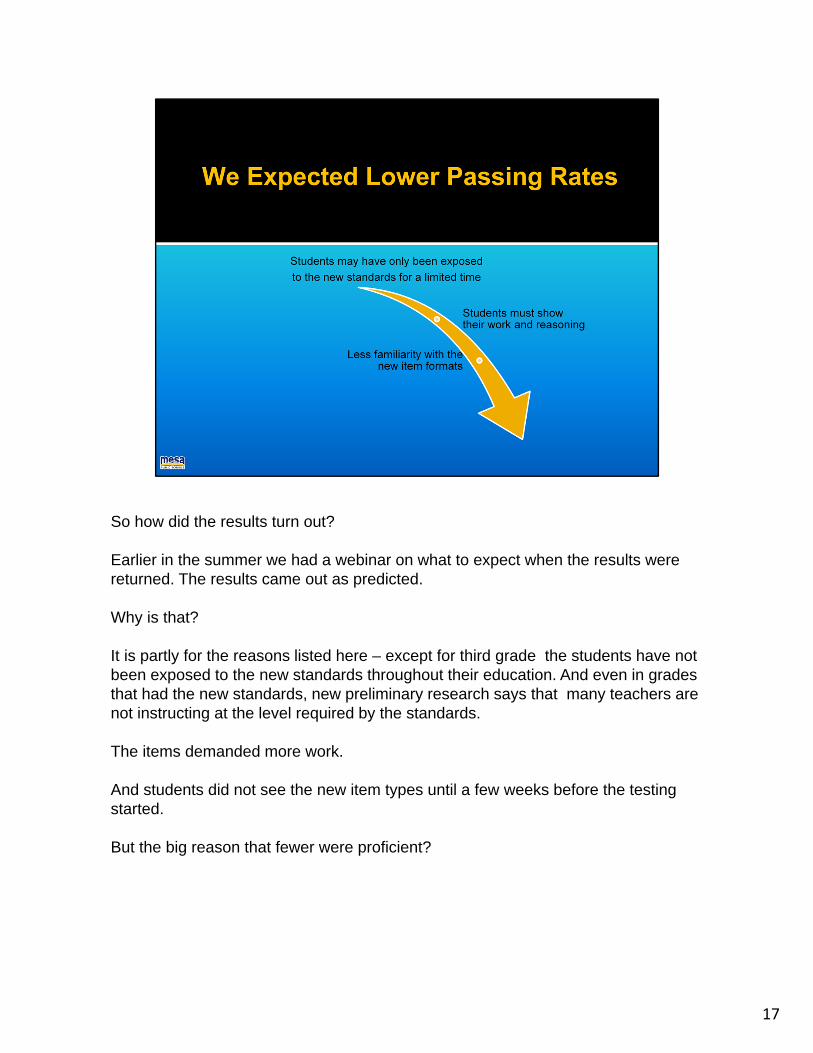
So how did the results turn out?
Earlier in the summer we had a webinar on what to expect when the results were returned. The results came out as predicted.
Why is that?
It is partly for the reasons listed here – except for third grade the students have not been exposed to the new standards throughout their education. And even in grades that had the new standards, new preliminary research says that many teachers are not instructing at the level required by the standards.
The items demanded more work.
And students did not see the new item types until a few weeks before the testing started.
But the big reason that fewer were proficient?
17

The real reason scores are falling is because the expectations are soaring. That is the message we should be sharing .
That is the story we should be telling. What we expect students to know and do, and how we measure it, is very different than than AIMS. In fact, several states have refused to compare their new test results to their old test because they are so different the comparison is misleading.
The teachers who set the performance levels saw where passing was on AIMS, and they blew right past that. If we were at the difficulty of AIMS Meets we would probably have high passing rates like we used to. But these teachers focused on what students should do given the new standards.
Scores are falling because expectations are soaring.
18

What has happened in testing in Arizona, and most other states, is that the expectations for student performance has been raised from about the NAEP Basic level to proficient. NAEP is the National Assessment of Educational Progress. Every 2-4 years a sample of students around the state and nation tested.
This graph has the most recent Arizona results. NAEP has 4 performance levels –highly proficient, proficient, basic and below basic. And as you can see they have high expectations for proficient.
Ten years ago passing on most state tests were set about the NAEP Basic level –that is the gold bars. Here you can see that the percent of Arizona students at Basic or higher was around the 60-70% passing, rates we saw on AIMS. Proficient on NAEP – the red bars, was considered an “aspirational goal,” it was where we ideally wanted all students to be but we assumed that that would not happen for most. And we can see that Arizona students, not unlike other students in other states, had only a minority getting to proficient.
Well, with these new proficiency levels set around NAEP proficient, we have made an aspirational goal into what I would call a “perspirational goal,” because it is going to take a lot of hard work to get more students to proficient.

What we saw with NAEP we also can see if we compare AIMS passing rates to AzMERITproficiency rates. As we discussed earlier, AIMS is a very different test than AzMERIT, so comparing the results as if they were similar tests is inappropriate. AzMERIT is the new baseline.
However, I do compare them here for you, so you see how different the experience of parents will be this year compared to past years on AIMS.
The gold bars represent Meets and Exceeds on AIMS and the red bars are proficient and highly proficient on AzMERIT. Looking at 10th grade reading/Writing for example, last year 86% of families received the good news that their students met the standards. This year only 30% will get the good news that their student is proficient. 70% will be told their child is partially or minimally proficient.
From a policy point of view, this is good news because if we maintained the same passing rate that would indicate we really have not raised our expectations.
A drop shows that we are expecting much more from students, teachers, schools and families. This will result in more options and opportunities for students and a brighter future. It does not show that students, teachers and schools are failures.
By the way, early indications from other states show that students and schools are rising to

these new expectations and the percent of students mastering the new expectations are increasing somewhat.
20

What we are experiencing is the same thing that other states are experiencing as Smarter Balanced and PARCC consortia release their results for the first time this fall.
Pennsylvania, Illinois, Delaware, Connecticut, and California, to name just a few, had similar headlines. Misery loves company.
21
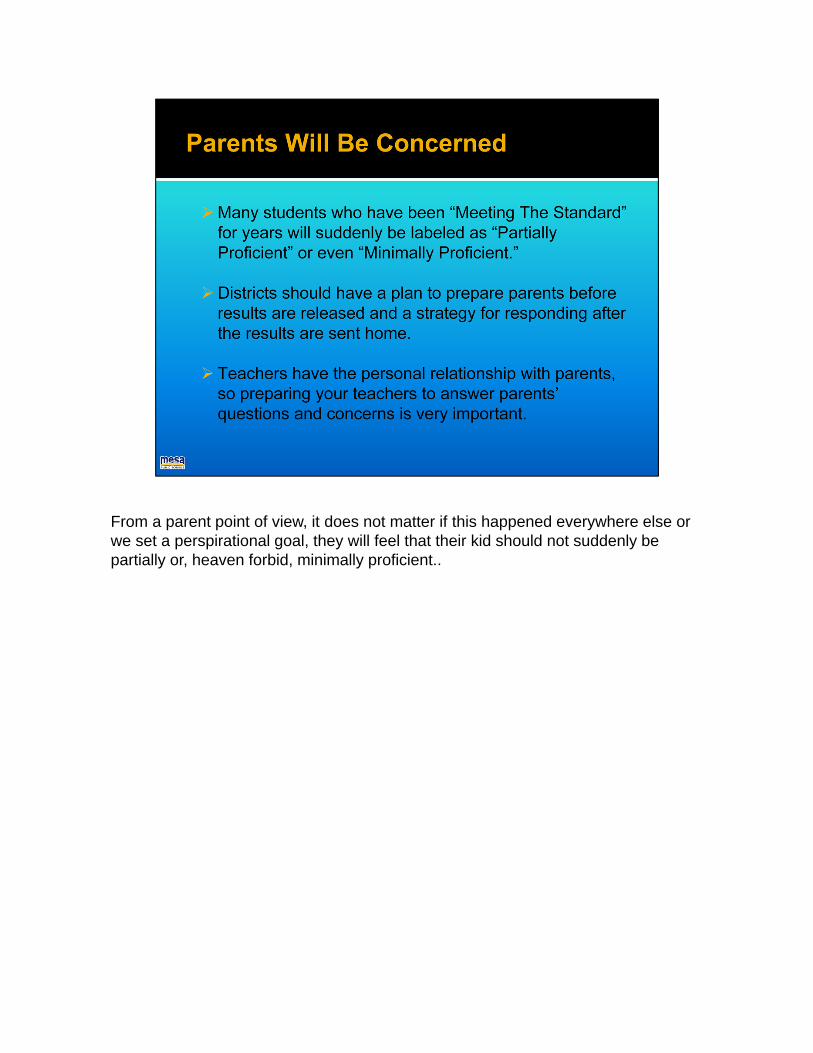
From a parent point of view, it does not matter if this happened everywhere else or we set a perspirational goal, they will feel that their kid should not suddenly be partially or, heaven forbid, minimally proficient..

How will parents react?
Communication professionals that have run focus groups say they respond in one of two ways.
One group of parents will ask what can they do to prepare their students.
The other group will blame the test, the standards, the schools, etc.
I have news for the communication professionals, there is a third group. They don’t look in the backpack, they don’t respond to requests to participate in focus groups, and they just say ‘whatever.’
23
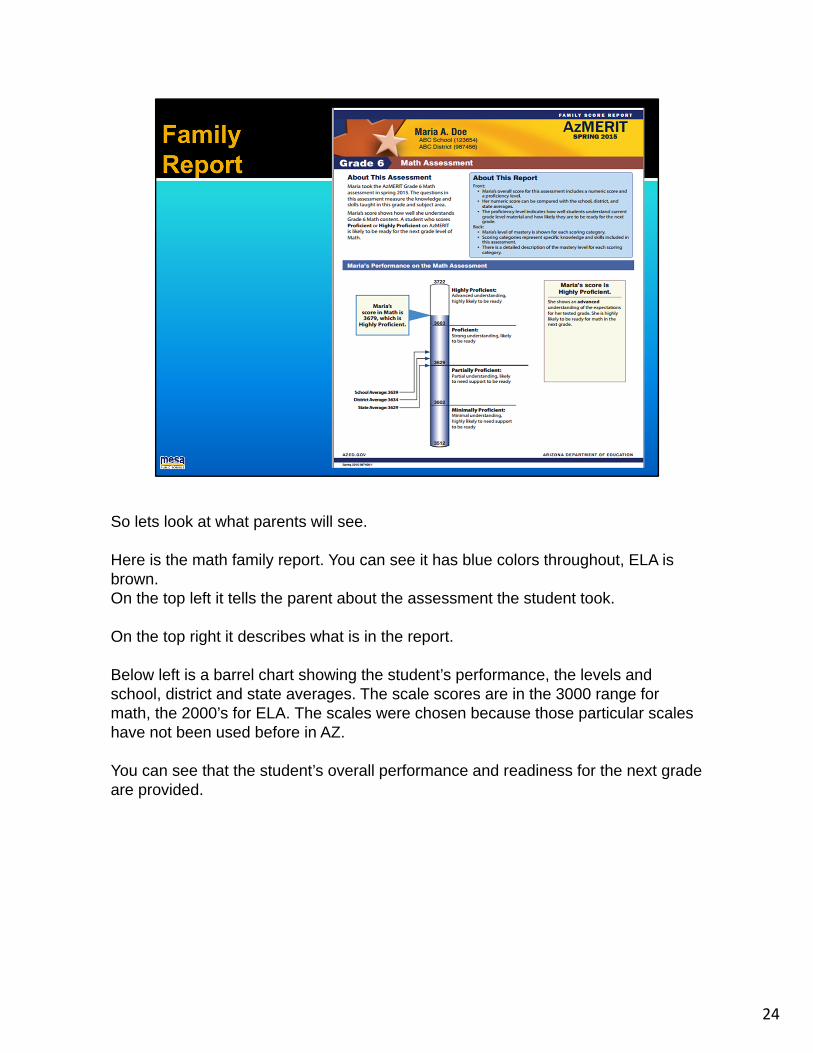
So lets look at what parents will see.
Here is the math family report. You can see it has blue colors throughout, ELA is brown. On the top left it tells the parent about the assessment the student took.
On the top right it describes what is in the report.
Below left is a barrel chart showing the student’s performance, the levels and school, district and state averages. The scale scores are in the 3000 range for math, the 2000’s for ELA. The scales were chosen because those particular scales have not been used before in AZ.
You can see that the student’s overall performance and readiness for the next grade are provided.
24

On the back of the one page report is the results by standard. In this case, rations, equations, number system and geometry and statistics.
At the top it tells you the scoring categories – below mastery, at or near mastery and above mastery.
For each standard there is a description of what was measured and a description of the student’s performance. Notice there are no numbers – just a description and a symbol.
I should also note that this will be in English only, just like the AIMS reports. ADE has provided the wording to translate, so there will be something you can access to give to your Spanish speaking parents.
I also want to point out this is a number free zone. Where is the score for each standard? There isn’t one. There is a symbol and a description. This may be more informative fpor a parent about what a student knows and can do. But it is not what a parent is used to receiving.
Parents will need the assistance of teachers to understand this change. This will be especially true this year because with low proficiency rates, I expect a lot of exclamation points showing up on the reports.
25

This is what parents are used to. Even if you don’t know what the terms mean, you know that 50% is poor and 90% is good. With AzMERIT parents no longer have that. They have to understand what the performance descriptions mean.
26

This is the ELA standard report. You can see three standards – reading for information, reading for literature, and writing. Since there is an essay you also get a score for that. You can see there is a score for each of three areas.
27
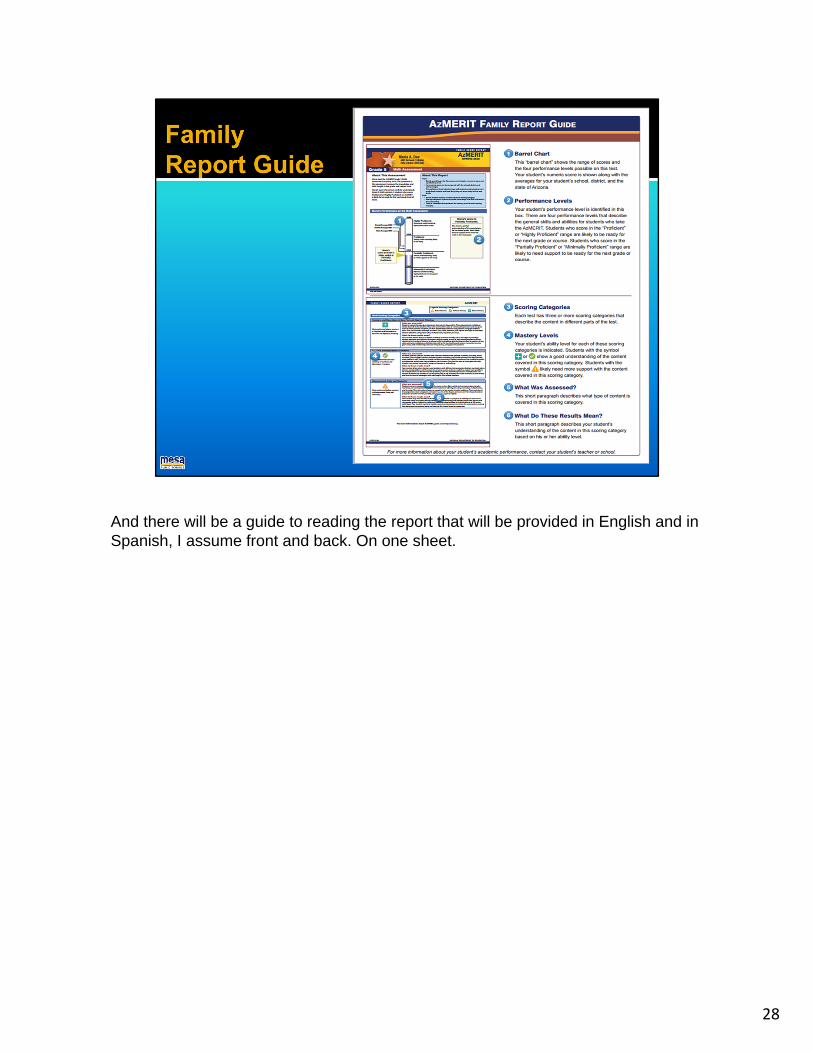
And there will be a guide to reading the report that will be provided in English and in Spanish, I assume front and back. On one sheet.
28

I was asked what are the 3-5 things I would emphasize when communicating the results. This is, generally, what I would say.
29
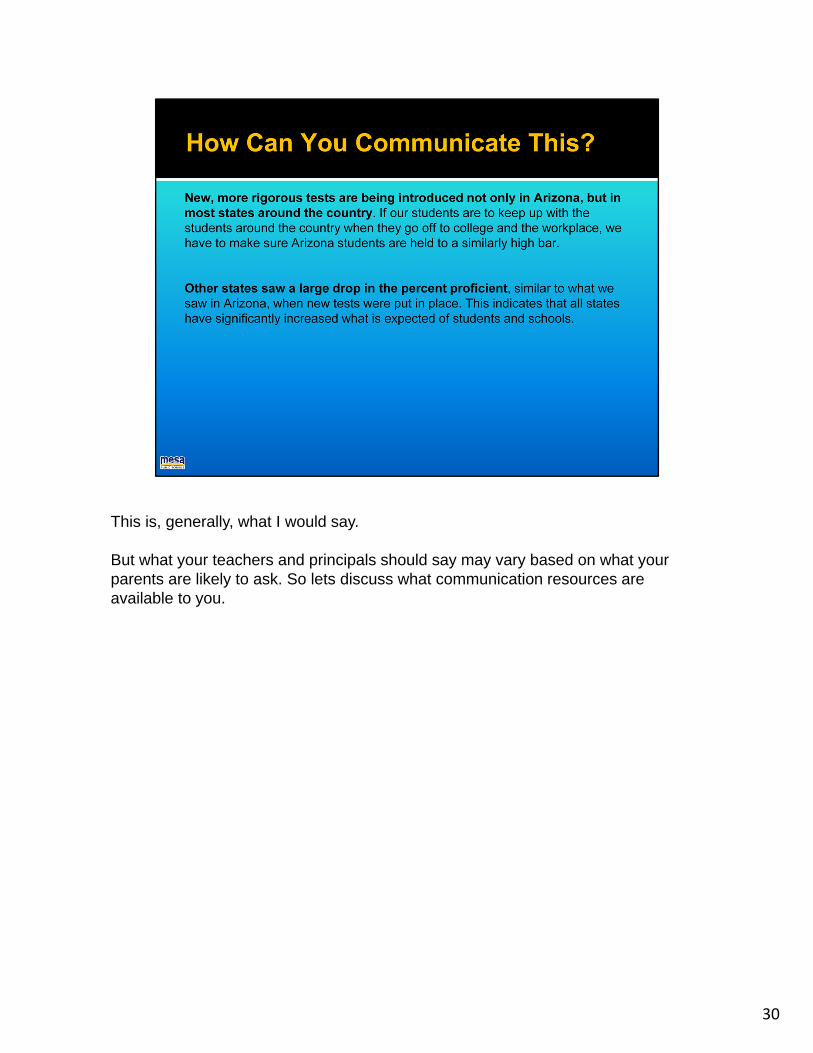
This is, generally, what I would say.
But what your teachers and principals should say may vary based on what your parents are likely to ask. So lets discuss what communication resources are available to you.
30

So what supports are available to help you communicate with parents?
ADE has a lot of things on the azmerit portal.
31
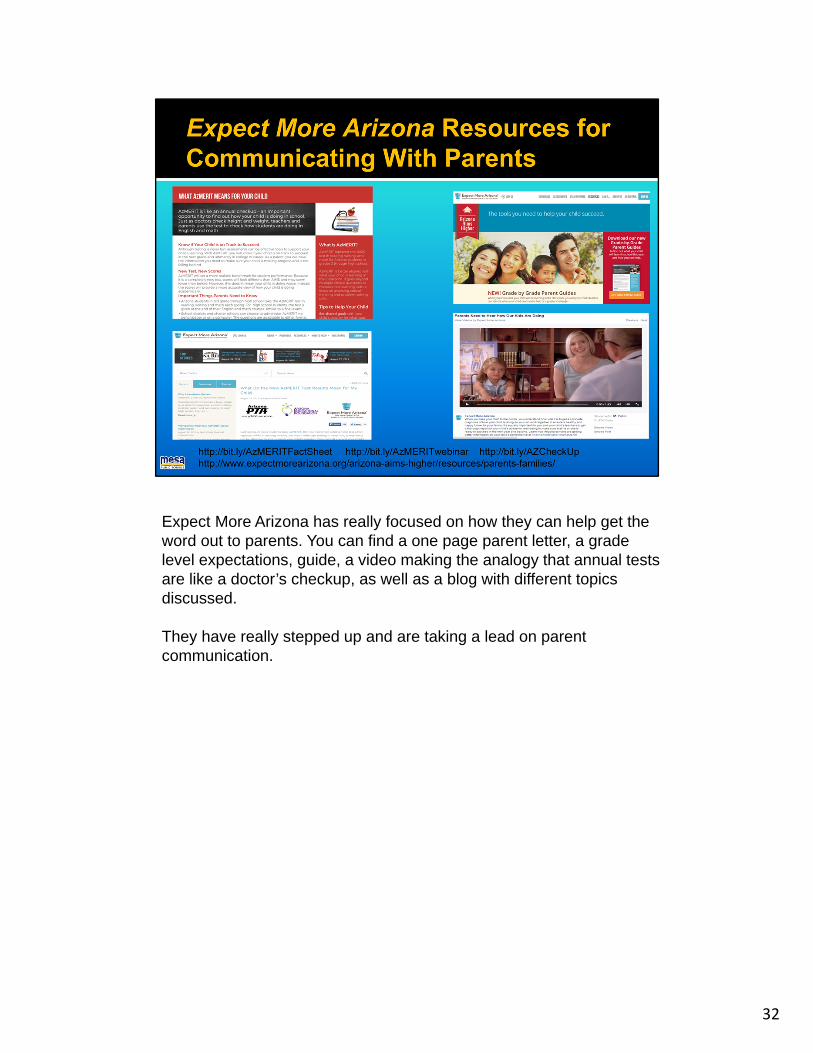
Expect More Arizona has really focused on how they can help get the word out to parents. You can find a one page parent letter, a grade level expectations, guide, a video making the analogy that annual tests are like a doctor’s checkup, as well as a blog with different topics discussed.
They have really stepped up and are taking a lead on parent communication.
32

And districts will be posting materials. Her is what Mesa will be posting. Feel free to repurpose some of our materials.
33

OK, hopefully you can now answer these questions.
The performance levels were set by veteran, dedicated Arizona teachers.
The results were expected, and were like other states and our past NAEP results. Rather than a bad thing, these results prove expectations have soared and what is expected of students and schools is much higher today.
The real scary challenge facing all of us is not the release of these scores next month. It is significantly moving the passing rate up within the next two years. That is the challenge we should be tackling now.
You now know what the Family Report looks like and how it differs from past reports.
And hopefully we have shared some resources for communicating from ADE, Expect More Arizona, Mesa and other districts.
Finally, I have included my e-mail and phone number, so feel free to contact me if I can answer any questions or be of help. Several of you did so after that last webinar, so I am sincere in my offer.