good luck with the blue book!
TRANSCRIPT

Good Luck with the Blue Book!An IRT mixture model for position effects
Klint Kanopka and Benjamin W. Domingue
Stanford Graduate School of Education

Overview- Motivation
- Previous work
- Mixture model approach
- Simulation results
- Empirical application
Special thanks to: Ayita Ruiz-Primo, Sebastian Otero, Ricardo Primi, and Filipe Recch

Motivation

ENEM: The Brazilian National High School Exam- 180 multiple select items across four domains:
- Language
- Social science
- Natural science
- Mathematics
- One administration per year on two consecutive Sundays
- Administration is simultaneous across the country
- Start time ranges from 10:30 AM to 1:30 PM, depending on location
- Typically used for college admissions

ENEM: The Benefits of Simultaneous Administration- Drastically reduces the size of the active item pool
- Students can’t take the test more than once per year
- Not an adaptive design
- Main test security concern is cheating, not item integrity!
- To combat cheating, ENEM uses multiple booklets
- Four booklets, labeled by color (blue, pink, yellow, grey)
- Each booklet contains exactly the same items in a different order
- Item order randomized by shuffling pages
- Booklets are randomly assigned to students within classrooms
- All booklets scored using a 3PL with precalibrated item parameters

ENEM 2014 Math: Ability distribution by booklet color

Ability Distribution Quantiles Relative to Blue Book Quantiles

What’s going on here?A perfect storm of three major factors:
1. Item position: The blue books have easier items at the end
2. Time pressure: ENEM has strict time pressure!
3. The 3PL: Intuitively, if students burn time solving the harder items and run out of
time for the easier items, the 3PL scoring model assumes the correct hard
responses were lucky guesses by low ability respondents
Primary research question:
Can we include position effects directly in the scoring model in a way that provides
more information about persons and items while also obviating the need for
post-scoring equating?

Previous Work

Three Main Approaches to Position Effects- Item-side: Item parameters vary based on item location in a test booklet
- Debeer and Janssen (2013) propose a framework for studying this and a wide variety of functional
forms
- This is the most common formulation
- Person-side: Individual abilities change as respondents progress through the test
- Usually thought of as performance decline, as in Jin and Wang (2014)
- Could potentially reflect practice effects
- Potpourri: Typically a little from column A, a little from column B
- Sometimes look at individual differences in how item position effects are experienced, as in
Trendtel and Robitzch (2018)
- Sometimes speededness gets in here, like in Bolt, Cohen, & Wollack (2002)
- We live here

IRT Mixture Models- Long history in psychometrics!
- Often used to model respondent group membership
- Saltus Model (Wilson 1989)
- Student Motivation (Johns and Woolf 2005)
- Sometimes used to model response processes
- With response time (Molenaar and de Boeck, 2018)
- We live here

A Mixture Model Approach

Why might we need something different?- Domingue, et al. (in press) find evidence of within-person variation in response
process over the course of the test based on response time and accuracy from a
large computer adaptive test
- The relationship between time use and accuracy at the start is different from at
the end, and the transition appears smooth
- There is between-person variation in this transition
- Key ideas:
- Items may behave differently early in a test and late in a test
- What constitutes “early” and “late” may vary by person
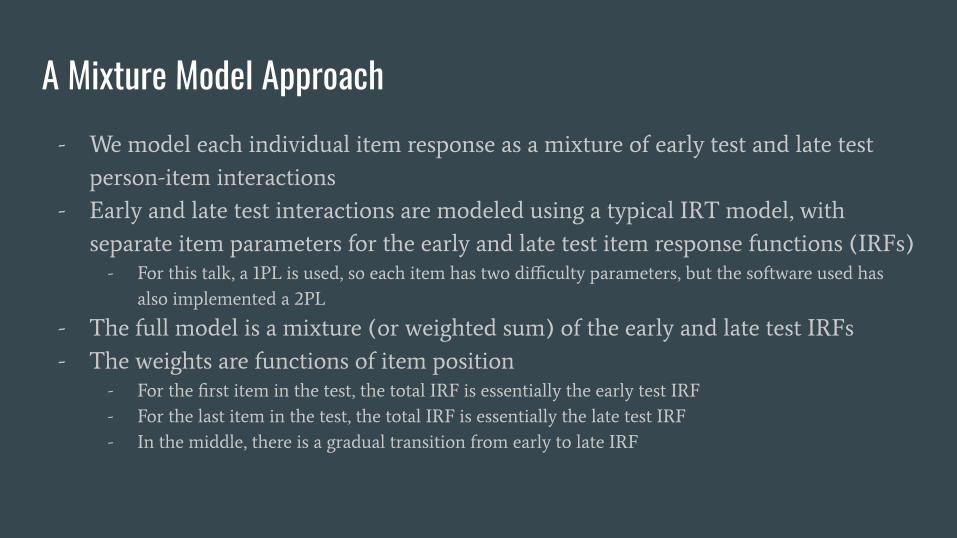
A Mixture Model Approach- We model each individual item response as a mixture of early test and late test
person-item interactions
- Early and late test interactions are modeled using a typical IRT model, with
separate item parameters for the early and late test item response functions (IRFs)
- For this talk, a 1PL is used, so each item has two difficulty parameters, but the software used has
also implemented a 2PL
- The full model is a mixture (or weighted sum) of the early and late test IRFs
- The weights are functions of item position
- For the first item in the test, the total IRF is essentially the early test IRF
- For the last item in the test, the total IRF is essentially the late test IRF
- In the middle, there is a gradual transition from early to late IRF

Model SpecificationThe probability student i responds correctly to item j when encountered in position s
ij
is given by:
where i indexes persons, j indexes items, and e/l differentiate between early/late
and
and

How does 𝜋ij work?

How does an IRF vary with item position?

Model Fitting- Model is fit using the EM algorithm and joint maximum likelihood estimation
- Custom software written in Python using PyTorch
- Takes advantage of GPU for computation if available
- Optimization is done using an Adam optimizer
- Minibatches, momentum, variable learning rate, and regularization
- Optimizers can be tuned separately for the E and M steps
- Software implementation can use either a 1PL or 2PL kernel IRF
- Software can also estimate a person-specific mixture slope

Simulation Studies

Simulation Design- Data was simulated by Ben Domingue and analyzed by Klint Kanopka
- Ben did not tell Klint what each data generating model was!
- There’s a paper in the works describing how/why you might want to do this (happy to talk more)
- Each simulated dataset has:
- N = 1000 respondents
- M = 50 dichotomous items
- Variation in sequence position
- Comparison IRT models are estimated in R using mirt

Dataset 1: Do items show position effects?

Dataset 1: Do persons experience position effects?

Dataset 1: Mixture model difficulties

Dataset 1: Comparison of Rasch and mixture model difficulties

Dataset 1: Comparison of Rasch and mixture model thetas

Dataset 1: Conclusions- The Rasch model was the true data generating model
- The mixture model didn’t seem to have enough evidence to spread out the
early/late item difficulties (which is good)
- The mixture model estimated item parameters that very closely agreed with those
from the Rasch model
- Person abilities were similar, but not spot on
- Differences in thetas is most likely due to differences in how they were estimated
- Recall the mixture model implementation uses JMLE, estimating thetas alongside item parameters
- mirt estimates theta in two steps: first using MMLE to estimate item parameters and then using
MLE to estimate thetas

Dataset 3: Do items show position effects?

Dataset 3: Do persons experience position effects?

Dataset 3: Mixture model difficulties

Dataset 3: Comparison of Rasch and mixture model difficulties

Dataset 3: Comparison of Rasch and mixture model thetas

Dataset 3: Conclusions- The mixture model was the true data generating model
- The mixture model didn’t seem to have enough evidence to spread out the
early/late item difficulties (which is bad)
- The mixture model estimated person and item parameters that very closely agreed
with those from the Rasch model
- Somewhat promisingly, the model tends to “fail down” toward a simpler model
instead of overfitting
- Begs the question: How much data is enough data?

Simulation 2 Design- Data was simulated for Klint by Klint
- Each simulated dataset has:
- M = 20 dichotomous items
- Variation in sequence position
- Seven datasets were created, with a varying number of simulated respondents
- At this moment, only N = 1000, 5000, and 10,000 have finished
- Data was simulated according to the mixture model specification
- Each item has a fixed difficulty gap where the late test difficulty is 0.5 higher than the early test
difficulty
- Each respondent has the same k
i
= 0.5
- The goal is to look at the model’s ability to recover this difficulty gap as a function
of the number of respondents
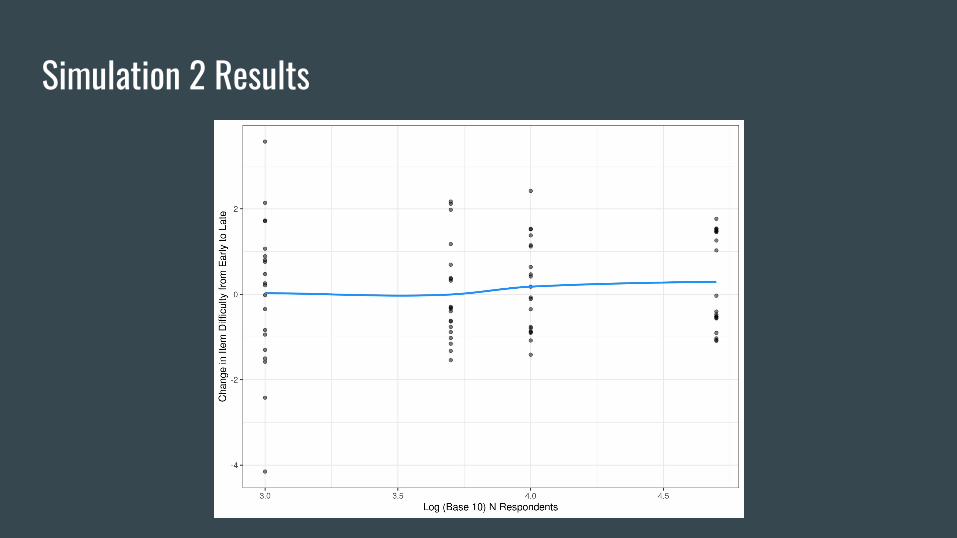
Simulation 2 Results

Simulation 2 with “Smarter” Starting Values

A Return to ENEM

Estimated Item Parameters

Naive Position Effects in ENEM

Are the Item Parameters Reasonable?

Ability Distribution Quantiles Relative to Blue Book Quantiles

ENEM 2014 Math: Ability distribution by booklet color

Conclusions- The mixture model approach seems reasonably “safe”
- In simulation, the model doesn’t find position effects where they don’t exist
- In low data, the model “fails downward” and closely approximates a non-mixture IRT model
- Item parameters produced from this appear interpretable
- Item parameters should be interpreted alongside item content and context
- Item parameters reflect expectation from naive analysis
- The mixture model approach seems to have some of the desired equating effect
- There is some weirdness in the ability distributions when applied to ENEM 2014
- 1PL kernel results in “bucketed” abilities which may not align across booklets
- Using a 2PL kernel should improve this

Conclusions - continued- Modeling position effects this way is data hungry
- In low data, both learning rate and starting parameters are extremely important
for successful fitting
- The mixture model approach seems to have some of the desired equating effect,
but there is weirdness in the ability distributions when applied to ENEM 2014
- 1PL kernel results in “bucketed” abilities which may not align across booklets
- With bidirectional position effects, interpretation of endurance parameter unclear

Thank [email protected]