golf participation report · page 3 2014 golf participation report the key findings from 2014 are...
TRANSCRIPT
2014 Golf Participation Report
Published by Golf AustrAliA may 2015

01. KEY FINDINGS ...........................................................................3
02. REPORT BACKGROUND ...........................................................5introduction ..................................................................................... 5About the Author ........................................................................... 5
03. NATIONAL CLUB MEMBERSHIP OVERVIEW ......................6introduction ..................................................................................... 6total Participation in Golf ............................................................. 6Member Golf Association reporting ......................................... 6Profile of Australian Clubs .......................................................... 7Club Playing Members.................................................................. 9
2014 National Total .................................................................9Historical Trends .....................................................................10Results by Geographic Area ...............................................11Results by Gender .................................................................11Level of Movement .................................................................12
Playing Member Age Profile ......................................................13Average Age ............................................................................13Age Distribution ......................................................................14Junior Members ......................................................................15
Attraction & Attrition rates ........................................................16New Member Profile ....................................................................17
04. STATE MEMBERSHIP OUTCOMES .....................................18introduction ...................................................................................18New south Wales ........................................................................18Queensland ...................................................................................19south Australia .............................................................................20Victoria ............................................................................................21tasmania ........................................................................................22Western Australia .........................................................................22
05. GOLF ROUNDS ........................................................................23National results ...........................................................................23results by state ..........................................................................24results by Capital City ...............................................................25
06. PROGRAMS, EVENTS, DELIVERERS & OFFICIALS ........ 26
contents
PAGE 2 2014 Golf participation report
PAGE 3 2014 Golf participation report
The key findings from 2014 are outlined below:
• Based on current research and other industry reports it is presently estimated that total golf participants in Australia approximate 1.1 to 1.2 million golfers.
• For the year ending 2014, national membership numbers across Australia approximated 397,000 golfers, representing a reduction of 0.7% from the previous year. In actual terms, the decline nationally approximates 3,200 members.
• Approximately two thirds of golf clubs in Australia have less than 200 members in size, with 83% having less than 500 members.
• 73% of all clubs in Australia are located in a regional area.
• Whilst accounting for only 5% of clubs across the country, clubs of over 1,000 members account for 25% of total members.
• NSW has the most number of golf clubs with 378, and the highest average member count with 396. Western Australia has the lowest average member count with 146.
• A cumulative loss of 7.2% has been recorded across the membership base since 2010, which equates to an average annual reduction of 1.7%. The overall 2014 outcome saw a continuation of the pattern evident over the prior three years, albeit the rate of decline slowed compared to the 2011, 2012 and 2013 outcomes.
• In percentage terms, Western Australia was the strongest performing state in 2014 with an increase in their membership base of 2.2%. This result was driven by increases at metropolitan clubs. Victoria and South Australia experienced small increases in membership numbers.
• NSW was the poorest performing state and accounts for most of the overall reduction in membership numbers across Australia. The reduction of 2.4% was driven by reductions in both the metropolitan and regional areas. Queensland, Tasmania and the Northern Territory experienced small declines in their membership base.
• Metropolitan and regional clubs nationally each experienced a decline in the membership bases of 0.7%.
• When assessed by gender, male members declined by 0.5% while female membership declined by 1.4%.
• Nationally, female members account for 21% of the total membership base.
• The national attraction and attrition rates for the past year are 11.7% and 12.5% respectively, although attraction and attrition rates vary significantly according to club size.
• The three states with the lowest attrition rates, Western Australia (10.2%), Victoria (11.2%) and South Australia (12.6%) are the three states which experienced positive membership growth.
• 44% of clubs nationally (with more than 100 members) experienced positive movement in their membership levels for the year, with 15% of clubs reporting more than 10% growth.
• The Australian population base exhibits a much more even age spread than that of the club golf profile, with approximately 60% of the national club golf membership base aged 55 years or greater.
• Reported junior members (under the age of 18) account for 3.5% of total members across the nation. This proportion is higher for males than females, with 4.0% of male members being juniors while 2.3% of female members are juniors. NSW has the highest proportion of junior members at 3.6%.
Key
FINDINGS01Golf Australia, in conjunction with Golf Management Australia (GMA), is pleased to present to you the 2014 National Participation Report.
Despite an overall decline in club membership of 7% since 2010, approximately 44% of golf clubs have experienced a net increase in membership in the last 12 month period.

PAGE 4 2014 Golf participation report
01 Key FINDINGS (cont)
• For the twelve month period to end December 2014 approximately 14.3 million rounds were recorded by GolfLink across the same facility base, a 7.2% increase over calendar year 2013.
• Queensland experienced the largest increase in rounds played for the year, recording approximately 13% growth over 2013, largely due to an exceptional strong 1st quarter.
• Victoria and South Australia were the only other two states to record growth in all four quarters of the year.
• The national result of 7.2% was reasonably consistent across the metropolitan and regional market, with 6.2% and 8.0% rounds growth respectively recorded for these markets.
The key findings with regard to competition rounds played trends from 2014 are outlined below:
For the twelve month period to end December 2014 approximately 14.3 million rounds were recorded by GolfLink across the same facility base, a 7.2% increase over calendar year 2013. 7.2%

PAGE 5 2014 Golf participation report
report
BACKGROUND02introductionGolf Australia, in conjunction with Golf Management Australia (GMA), is pleased to present to you the 2014 National Participation Report. It continues to be the goal of both bodies to provide the wider golf industry with key participation information that enables the sport to understand the current landscape and trends in golf participation. It is hoped that this report therefore becomes a valuable reference for the development of evidenced based strategies designed to drive the future growth and overall sustainability of the game.
About the AuthorSeeking independence of data analysis and subsequent interpretation with this project, Golf Australia and GMA sought the expertise of Golf Business Advisory Services (GBAS) to draft this report. GBAS authored the 2013 report and have also authored a number of other industry reports covering such topics as club operational and salary benchmarking, membership attrition and retention, national rounds played, golf retail and other industry challenges including land management, the environment, cost structures, and corporate governance. For more information on GBAS please visit www.golfbas.com
GOLF BUSINESS ADVISORY SERVICES

PAGE 6 2014 Golf participation report
NatioNal Club MEMBERSHIP OVERVIEW03
introductionThe following section provides an overview of current national golf participation data. This section relies upon data published by the Australian Sports Commission (ASC) between 2001 and 2011. We note that no national participation data is available beyond 2010, the last year in which the ASC delivered its Participation in Exercise, Recreation and Sports (ERASS) Report.
total Participation in GolfIn 2011 the Australian Sports Commission ceased producing its annual sports participation survey. This report, known as the ERASS report was utilised by Golf Australia to monitor overall participation in golf. At that time it was estimated that approximately 1.18 million people or 6.7% of the Australian adult population aged 15 or over play golf. This estimate had been relatively steady since 2009.
In its recently released Play.Sport.Australia - National Participation Game Plan, the ASC announced that it is to resume its national sports participation research with a new annual survey to be developed to better understand participation trends in Australia, inform policy decisions and guide sports strategy with a strong evidence base. Golf Australia is supportive of this initiative and looks forward to providing wider, up to date clarity regarding total participation in golf.
Via the ASC, national research house Repucom produces an annual report for the major national sporting organisations titled “The Australian Sporting Landscape – the Consumer Perspective.” Amongst other things such as consumer engagement, motivations, brand imagery, and attendance, the reports contain a high level analysis of participation levels. For the past two reports, the national participation level for golf has been estimated at 7%. This estimate is in line with estimates made for golf when the ASC stopped publishing its ERASS report.
In light of no other data being available or collected and with no other data suggesting anything to the contrary, Golf Australia is of the view that the participation estimates made by the ASC in 2011 and the outcomes currently presented by Repucom remain a reliable indicator of current wider golf participation demand trends.
Member Golf Association reportingClub golfer numbers are reported annually each year by the seven respective state and territory member golf association (MGA) bodies. The reported numbers reflect those members who pay a capitation fee to their respective body, generally defined as those classified as ‘having a class of membership that provides regular golf course access.’ The respective reporting periods and the respective membership timing they represent are depicted in the chart below:
State / Territory annual Report Data Collected Period
NSW 2013/14 May 2014Most recent completed
financial year
VICCalendar Year
2014December 2014
Most recent completed
financial year
QLDCalendar Year
2014December 2013 Point in time
SA 2014/14 December 2013 Point in time
WA 2013/14 December 2013 Point in time
TASCalendar Year
2014June 2014 Point in time
NT 2013/14 December 2013 Point in time
Note: Throughout the report, NSW includes results from the ACT.
As outlined above, different collection and reporting periods exist within the MGA’s. As a result the reported numbers are not for the same comparable 12 month period. The MGA reports however remain the most accurate data sources available, with data provided by individual club by gender for 74 national regions and 1,591 clubs. As in 2013, in order for annual trends to be determined, the most recently published (or to be published) numbers have been aggregated and classified as year ending 2014 numbers with the three prior years of historical results classified as the 2011, 2012 & 2013 years respectively.
Note: A different capitation fee collection methodology is being undertaken in Victoria this year and this has prevented it from providing annual numbers in time for this publication. The Victorian data used for aggregation in this report is thus more dated this year.

PAGE 7 2014 Golf participation report
03 NatioNal Club MEMBERSHIP OVERVIEW (cont)
Profile of Australian ClubsThe current size profile of Australian golf clubs, based on the 1,590 clubs that reported playing membership numbers for 2014, is outlined by general geographic location / club type in Table 1.
Club membership Size metro Regional Social Total % of Clubs % of members
<100 11 613 196 820 52% 8%
100-199 9 192 20 221 14% 8%
200-299 13 101 6 120 8% 8%
300-399 19 58 6 83 5% 7%
400-499 15 48 1 64 4% 7%
500-599 18 44 – 62 4% 9%
600-699 17 31 1 49 3% 8%
700-799 13 20 – 33 2% 6%
800-899 21 15 – 36 2% 8%
900-999 17 11 – 28 2% 7%
1000-1099 20 6 – 26 2% 7%
1100-1199 9 5 – 14 1% 4%
1200-1299 5 1 – 6 0% 2%
1300-1399 9 2 – 11 1% 4%
1400-1499 2 1 – 3 0% 1%
1500+ 8 7 – 15 1% 7%
Total 206 1,155 230 1,591 100% 100%
average Size 729 201 66 250 – –
Source: Golf Australia Database
Table 1
• The average club size in Australia is 250 members, with metropolitan clubs on average being more than three times greater in size than regionally located clubs.
• Approximately two thirds of clubs in Australia have less than 200 members, with 83% having less than 500 members.
• 73% of all clubs in Australia are located in a regional area.
• While clubs of over 1,000 members account for only 5% of all clubs across Australia, they account for 25% of individual members.
• There are 230 Social clubs affiliated to various state bodies. These clubs either typically have semi-permanent access rights to a public course facility (eg. Golf League Clubs (VGL) in Victoria) or are a club that utilise Golflink for handicapping purposes in the events they deliver to their members.
Key observations noted from the size profile data outlined above include:

PAGE 8 2014 Golf participation report
03 NatioNal Club MEMBERSHIP OVERVIEW (cont)
Profile of Australian Clubs (cont)The current size profile by state/territory for 2014 is outlined by general geographic in Table 2.
Club membership Size NSW VIC QLD Sa Wa TaS NT Total
Social Clubs 0 53 1 72 103 1 0 230
Golf Clubs
<100 114 136 99 95 146 30 4 624
100-199 49 52 42 21 12 20 5 201
200-299 42 35 18 6 7 6 – 114
300-399 26 18 14 7 6 6 – 77
400-499 20 17 14 5 3 3 1 63
500-599 28 17 9 2 4 2 – 62
600-699 22 9 10 2 5 – – 48
700-799 12 10 8 – 2 – 1 33
800-899 16 10 7 2 1 – – 36
900-999 15 4 4 – 4 1 – 28
1000-1099 14 6 2 3 1 – – 26
1100-1199 8 4 1 1 – – – 14
1200-1299 4 1 1 – – – – 6
1300-1399 1 4 2 1 3 – – 11
1400-1499 1 2 – – – – – 3
1500+ 6 4 4 1 – – – 15
Total Golf Clubs 378 329 235 146 194 68 11 1,361
avg. Golf Club Size 396 303 283 166 146 163 201 281
Source: Golf Australia Database
Table 2
• NSW has the most number of golf clubs with 378, and the highest average member count with 396.
• Western Australia has the highest number of social clubs with 103.
• Western Australia has the lowest average golf club member count with 146.
Key observations noted from the size profile data outlined above include:

PAGE 9 2014 Golf participation report
03 NatioNal Club MEMBERSHIP OVERVIEW (cont)
Club Playing Members2014 National totalFor the 2014 period, national membership numbers across Australia were reported as 397,234 golfers. This result marked a 0.7% decline on numbers reported for the prior 12 month period, equating to 2,852 individual members. Three states experienced nett increases in membership numbers, namely Victoria, South Australia and Western Australia. Western Australia was the best performing state with a 2.2% increase in members. The other three states experienced small declines.
Table 3 summarises the national results recorded for 2014.
Table 3
historical trendsHistory shows that club membership numbers peaked in Australia in 1998 at approximately 500,000 golfers. Since this time a steady decline has materialised with an overall decline of 21%, averaging 1.4% per year. The annual reduction rate for male and female golfers over this period has been 1.4% and 1.5% respectively. In the past five years, the average annual rate of reduction has increased slightly to 1.6% per year (1.6% for males and 1.5% for females).
The long term membership picture (male, female and combined) is illustrated in Chart 1, along with the relevant annual percentage change. This annual percentage change, depicted by the orange line, indicates that there has been negative annual movement in membership numbers since 1999.
Chart 1
Source: Golf Australia Database
The overall 2014 outcome saw a continuation of the membership demand pattern generally evident over the prior three year period. A cumulative loss of 7.2% is evident in the past five years, averaging 1.9% per year. The only state to experience a nett increase in membership numbers over this period is Western Australia, with a 9.6% increase. The best performing state otherwise is Victoria, where membership numbers have declined by 4.9%.
State/Territory 2013 2014 Change % Change
NSW 153,606 149,855 -3,751 -2.4%
VIC 107,365 107,996 631 0.6%
QLD 67,009 66,558 -451 -0.7%
SA 25,683 25,907 224 0.9%
WA 32,837 33,571 734 2.2%
TAS 11,310 11,131 -179 -1.6%
NT 2,276 2,216 -60 -2.6%
Total 400,086 397,234 -2,852 -0.7%
Source: Golf Australia Database
Note: comparative numbers from 2013 have been reset as a result of a small correction to WA numbers and no new numbers being available for Victoria.
Annual decline of 0.7% recorded in 2014, the lowest annual decline in membership reported since 2007
- 0.7%
600,000 +5%
+3%
+1%
- 5%
- 3%
- 1%
500,000
400,000
300,000
200,000
100,000
Male Female Total % Rate Change
1970
1974
1978
19821986
19901994
19982002
20062010
2014-
PAGE 10 2014 Golf participation report
03 NatioNal Club MEMBERSHIP OVERVIEW (cont)
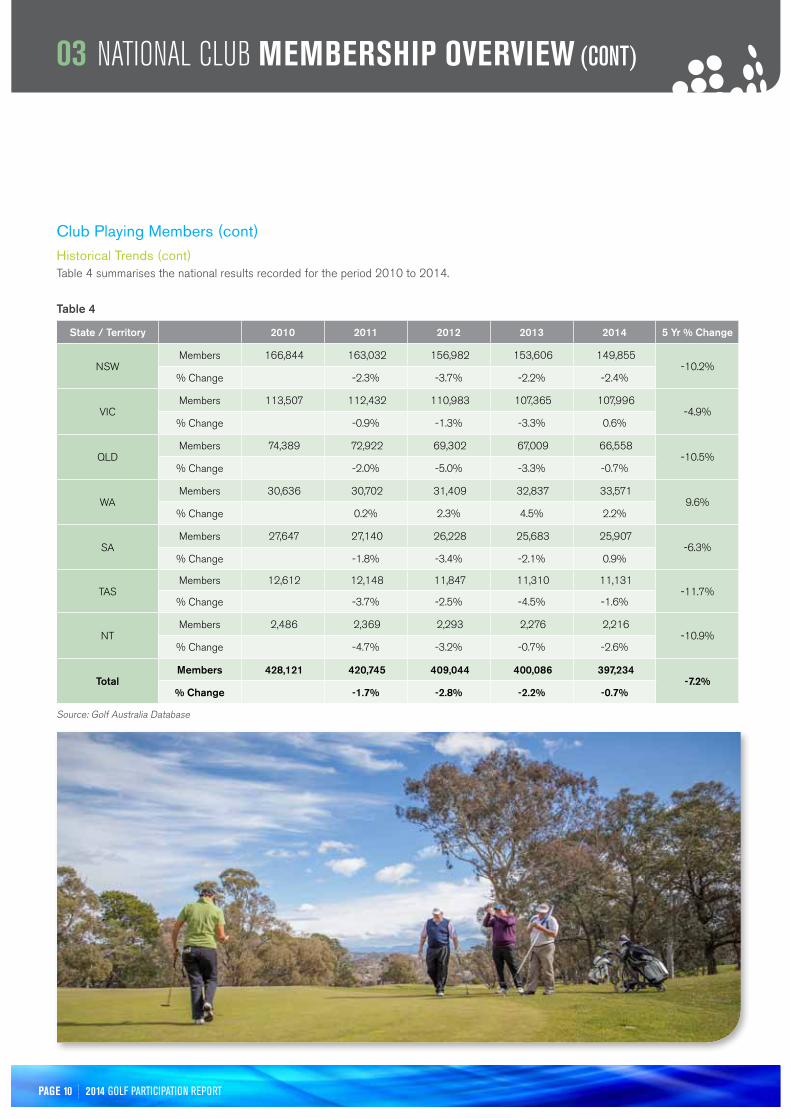
Club Playing Members (cont)historical trends (cont)Table 4 summarises the national results recorded for the period 2010 to 2014.
State / Territory 2010 2011 2012 2013 2014 5 yr % Change
NSWMembers 166,844 163,032 156,982 153,606 149,855
-10.2%% Change -2.3% -3.7% -2.2% -2.4%
VICMembers 113,507 112,432 110,983 107,365 107,996
-4.9%% Change -0.9% -1.3% -3.3% 0.6%
QLDMembers 74,389 72,922 69,302 67,009 66,558
-10.5%% Change -2.0% -5.0% -3.3% -0.7%
WAMembers 30,636 30,702 31,409 32,837 33,571
9.6%% Change 0.2% 2.3% 4.5% 2.2%
SAMembers 27,647 27,140 26,228 25,683 25,907
-6.3%% Change -1.8% -3.4% -2.1% 0.9%
TASMembers 12,612 12,148 11,847 11,310 11,131
-11.7%% Change -3.7% -2.5% -4.5% -1.6%
NTMembers 2,486 2,369 2,293 2,276 2,216
-10.9%% Change -4.7% -3.2% -0.7% -2.6%
Totalmembers 428,121 420,745 409,044 400,086 397,234
-7.2%% Change -1.7% -2.8% -2.2% -0.7%
Source: Golf Australia Database
Table 4

PAGE 11 2014 Golf participation report
men Women
State / Territory 2013 2014 % Change 2013 2014 % Change
NSW 122,576 119,669 -2.4% 31,030 30,186 -2.7%
VIC 82,627 83,891 1.5% 24,738 24,105 -2.6%
QLD 54,098 53,403 -1.3% 12,911 13,155 1.9%
SA 20,577 20,816 1.2% 5,106 5,091 -0.3%
WA 25,701 26,269 2.2% 7,136 7,302 2.3%
TAS 9,280 9,153 -1.4% 2,030 1,978 -2.6%
NT 1,898 1,850 -2.5% 378 366 -3.2%
Total 316,757 315,051 -0.5% 83,329 82,183 -1.4%
Source: Golf Australia Database
metropolitan Regional
State / Territory 2013 2014 % Change 2013 2014 % Change
NSW 65,599 63,515 -3.2% 88,007 86,340 -1.9%
VIC 47,521 48,344 1.7% 59,844 59,652 -0.3%
QLD 15,604 14,896 -4.5% 51,405 51,662 0.5%
SA 14,722 14,829 0.7% 10,961 11,078 1.1%
WA 20,985 21,711 3.5% 11,852 11,860 0.1%
TAS 2,170 2,196 1.2% 9,140 8,935 -2.2%
NT – – – 2,276 2,216 -2.6%
Total 166,601 165,491 -0.7% 233,485 231,743 -0.7%
Source: Golf Australia Database
03 NatioNal Club MEMBERSHIP OVERVIEW (cont)
Club Playing Members (cont)results by Geographic AreaWhen assessed on a regional basis, it is apparent that the positive membership growth recorded in Western Australia and Victoria was driven by outcomes achieved in its metropolitan market, with 3.5% and 1.7% increases respectively. Significant declines are apparent in other metropolitan markets, namely New South Wales and Queensland. Other metropolitan markets are relatively stable.
With respect to regional areas, South Australia was the best performing state with a 1.1% increase while New South Wales, Tasmania and the Northern Territory all experienced declines in excess of 1%.
The results for each state/territory for metropolitan and regional areas are represented in Table 5.
Table 5
results by GenderWhen assessed by gender, positive male and female membership growth was recorded in Western Australia. By comparison, New South Wales, Tasmania and the Northern Territory all experienced negative movement for both male and female membership. The overall decline for male membership was 0.5% for the year, and 1.4% for females, as summarised in Table 6.
Table 6

PAGE 12 2014 Golf participation report
Club Size - >10% - 5% to 10% - 1% to 4% 0% + 1% to 5% +5% to 10% + >10%
100-249 16% 19% 16% 5% 16% 8% 21%
250-499 18% 12% 19% 4% 20% 12% 15%
500-749 20% 15% 23% 5% 13% 6% 17%
750-999 8% 17% 24% 10% 15% 12% 14%
1,000+ 4% 12% 26% 11% 21% 14% 12%
Total 15% 15% 20% 6% 17% 10% 17%
50% 6% 44%
Source: Golf Australia Database
03 NatioNal Club MEMBERSHIP OVERVIEW (cont)
Club Playing Members (cont)results by Gender (cont)On a national basis, female members account for 21% of the total membership base. The gender mix evident by state/territory for the 2014 year, as summarised in Table 7, shows some variation between states/territories. Victoria has the highest percentage of female members while the lowest is in the Northern Territory. Little movement in these percentages has been evident from the previous year. A summary of the gender mix which is evident by state/territory is below.
Chart 2
level of Movement 44% of clubs with at least 100 members experienced a nett increase in membership numbers for 2014, compared to 51% of clubs that experienced a nett decrease in numbers. Table 7 summarizes the number of clubs that have experienced positive and negative shifts in their membership base for each size category, and the scale of such shifts.
Table 7
female share of membership base
21%100%
90%
80%
70%
50%
60%
40%
30%
20%
10%
Men Women
NSW VIC QLD SA WA TAS NT Total0%
20%
80% 77% 81% 80% 78% 82% 83% 79%
23% 19% 20% 22% 18% 17%21%
Source: Golf Australia Database

PAGE 13 2014 Golf participation report
State/Terr. male Female Total
NSW 54.1 62.9 55.7
VIC 53.7 63.1 55.6
QLD 52.8 61.0 54.2
SA 54.1 63.1 55.8
WA 51.9 59.7 53.4
TAS 53.1 62.4 54.6
NT 46.8 52.2 47.6
Total 53.4 62.2 55.1
03 NatioNal Club MEMBERSHIP OVERVIEW (cont)
Playing Member Age ProfileAverage AgeThe average age of club members across the country is just over 55 years, with some variation evident across different states/territories. The state/territory with the youngest average member is the Northern Territory at 47½ years, while the average member age of other states/territories range from 53½ years (WA) to just under 56 years (SA). This table also reveals a significant age disparity between male and female members, with the average female member across all states/territories being nine years older than the average male member. Full results of the age breakdown for male and female club members by states/territory are depicted in Table 8.
Table 8
Average age of male and female members is 53.4 years and 62.2 years respectively
53.4yrs 62.2yrs

PAGE 14 2014 Golf participation report
03 NatioNal Club MEMBERSHIP OVERVIEW (cont)
Playing Member Age Profile (cont)Age distribution55% of the national club golf membership base is aged 55 years or greater, with the average and median age of the golf member population being 55 and 57 years respectively. By comparison, the median age of the national population is 37 years. The relative breakdown of club members by age bracket for each state/territory is depicted in Table 10.
Table 9
The age profile of club golfers with comparison to the wider Australian population base and total golf population is depicted in Chart 3. This demonstrates an older age profile of golf club members compared to all golfers and the national population.
Chart 3
age Bracket NSW VIC QLD Sa Wa TaS NT Total
<18 2% 3% 3% 4% 5% 3% 3% 3%
18-24 4% 3% 4% 3% 4% 5% 4% 4%
25-34 10% 9% 11% 9% 9% 8% 17% 10%
35-44 12% 12% 13% 11% 11% 11% 17% 12%
45-54 16% 16% 17% 16% 18% 16% 21% 16%
55-64 20% 21% 19% 20% 22% 22% 22% 20%
65+ 36% 36% 33% 37% 31% 34% 16% 35%
0.4
0.35
0.3
0.25
0.2
0.15
0.1
0.05
Total Golf Population Golf Club Members National Population
<18 18-24 25-34 35-44 45-54 55-64 65+
3% 4%
10%12%
16%15%
20%
35%
16%
23%
14%
21%19%
16%18%
16%14%
8%
15%
5%
0
Source: ASC, Golf Australia Database, Golflink, ABS Cat. 3235.0

PAGE 15 2014 Golf participation report
male Junior Female Junior Total Juniors
State/Territory 2014 % of males 2014 % of Females 2014 % of Total
NSW 5,353 4.5% 739 2.4% 6,092 4.1%
VIC 3,747 4.5% 523 2.2% 4,270 4.0%
QLD 1,731 3.2% 329 2.5% 2,060 3.1%
WA 699 3.4% 121 2.4% 820 3.2%
SA 628 2.4% 120 1.6% 748 2.2%
TAS 336 3.7% 33 1.7% 369 3.3%
NT 59 3.2% 23 6.3% 82 3.7%
Total 12,553 4.0% 1,888 2.3% 14,441 3.6%
NB: As Victoria does not collate membership number for male juniors, the relative percentage of male juniors from NSW is applied to Victoria’s total male membership figure to arrive at a junior male figure.
03 NatioNal Club MEMBERSHIP OVERVIEW (cont)
Playing Member Age Profile (cont)Junior MembersReported junior members (under the age of 18) account for 3.6% of total members across the nation. This proportion is higher for males than females, with 4% of male members being juniors while 2.3% of female members are juniors. There is some variation across different states, with a higher proportion of junior members evident in New South Wales (4.1%) and Victoria (4%). South Australia reported the lowest proportion of junior members, with 2.2% members. A summary of junior membership is found in Table 10.
Table 10

PAGE 16 2014 Golf participation report
State/Territory metro Regional Overall
NSW 11.9% 13.7% 12.9%
VIC 8.4% 13.2% 11.2%
QLD 14.0% 13.9% 13.9%
WA 8.0% 14.1% 10.2%
SA 11.2% 14.3% 12.6%
TAS 7.8% 15.3% 14.0%
NT 17.7% 17.7%
National 10.7% 13.8% 12.5%
Club Size metro Regional Overall
<250 31.3% 19.9% 20.5%
250-499 14.6% 14.5% 14.5%
500-749 16.7% 12.6% 14.1%
750-999 9.3% 8.3% 8.9%
1,000+ 6.7% 6.3% 6.5%
National 10.7% 13.8% 12.5%
03 NatioNal Club MEMBERSHIP OVERVIEW (cont)
Tables 12 and 13 below depict attrition rates only, by state/territory and by club size.
Table 12 Table 13
State / Territory 2013 New members
attraction Rate
attrition Rate
Resigned members
actual Change % Change 2014
NSW 153,606 16,064 10.5% 12.9% 19,815 -3,751 -2.4% 149,855
VIC 107,365 12,656 11.8% 11.2% 12,025 631 0.6% 107,996
QLD 67,009 8,863 13.2% 13.9% 9,314 -451 -0.7% 66,558
SA 25,683 3,460 13.5% 12.6% 3,236 224 0.9% 25,907
WA 32,837 4,083 12.4% 10.2% 3,349 734 2.2% 33,571
TAS 11,310 1,404 12.4% 14.0% 1,583 -179 -1.6% 11,131
NT 2,276 343 15.1% 17.7% 403 -60 -2.6% 2,216
Total 400,086 47,159 11.8% 12.5% 50,011 -2,852 -0.7% 397,234
NB: As Victoria does not collate membership number for male juniors, the relative percentage of male juniors from NSW is applied to Victoria’s total male membership figure to arrive at a junior male figure.
Attraction & Attrition ratesUtilising data from Golflink, GA is for the first time able to report annual national club attraction & attrition rates. With national new member data (defined as being those golf club members that were allocated a new GolfLink number during the year) sourced from GolfLink merged with stated year-end numbers from the state body annual reports, these rates can be accurately calculated.
Table 11 depicts the movement in members on a state/territory basis, showing the relevant attraction and attrition rates that apply.
Table 11
Key observations noted from these tables include:• The national attraction and attrition rates are 11.7% and 12.5% respectively.
• The three states with the lowest attrition rates, Western Australia (10.2%), Victoria (11.2%) and South Australia (12.6%) are the three states which experienced positive membership growth.
• Attrition rates vary significantly by club size and by region. Smaller clubs naturally have higher attrition rates than larger clubs due to their lower membership base.

PAGE 17 2014 Golf participation report
03 NatioNal Club MEMBERSHIP OVERVIEW (cont)
New Member ProfileOutlined earlier in this report is the level of new demand recorded in 2014, approximately 12% of total golf club membership. With data sourced from Golflink, the age profile of new members is depicted in Chart 4 and the gender profile in Chart 5.
Chart 4 indicates that there is a younger age profile evident in new members than the wider total membership base. Specifically, 38% of new members are aged between 25 and 44.
With regard to gender, the new member profile indicates a higher proportion of male members than club members generally with 83% male and 17% female. This compares to a 79%/21% gender mix for all club members. Chart 5 indicates that 42% of new male members are aged 25-44 while for females, 53% are aged 55+.
Chart 4 Chart 5
57%
35%
40%
30%
25%
20%
15%
10%
5%
Golf Club Members New Members
<18 18-24 25-34 35-44 45-54 55-64 65+0%
3%
6%4%5%
10%
19%
12%
19%16%
19%20%
19%
35%
12%
35%
40%
30%
25%
20%
15%
10%
5%
Male Female
<18 18-24 25-34 35-44 45-54 55-64 65+0%
6%6% 6%
2%
22%
6%
20%
11%
19%22%
16%
34%
11%
19%
of new members in 2014 are aged between 25 and 54 years compared to 38% of existing members.

PAGE 18 2014 Golf participation report
introductionWhere female members of clubs may be classified in a different district to the male members of the same club, female membership numbers have been allocated to the male districts to allow district analysis to occur. No district analysis has been undertaken for the Northern Territory as no separate golf districts exist in this area.
NsWNSW combined, with a 3,751 or 2.4% decline in club membership numbers, contributed 117% of the overall national decline in membership for the year. Since 2010,
Eight of the 21 districts in NSW experienced a nett increase in membership numbers as follows:
• murray - 323 members, representing a 7% increase
• mid North Coast – 338 members, representing a 6% increase
• Riverina – 67 members, representing a 6% increase
• North-West, New England, Lachlan Valley, Western and Central-Western districts all achieved modest increases
The remaining 13 districts all experienced a reduction in membership numbers. This includes the metropolitan area, which experienced a decrease in membership numbers of 2,084, representing 3.2%. Details are as follows:
• Lower North Coast – 474 members, representing a 9% decline
• Central North – 150 members, representing a 5% decline
• Far South Coast – 298 members, representing a 5% decline
• Illawarra – 5.3 members, representing a 5% decline
• Northern Rivers – 345 members, representing a 4% decline
• Blue mountains – 111 members, representing a 4% decline
• The Hunter River, Brisbane Water, Newcastle aCT-monaro, Western Riverina, and South-West regions all experienced small declines
% Change in membership numbers from 2013 to 2014:
Greater than -5% change
-2% to -5% change
-2 to +2% change
+2 to +5% change
Greater than +5% change
state membership
OUTCOMES04
Western district
lachlan Valley
Western riverina
riverina
Murray
far south Coast
illawarra
Metropolitan
Central Coast
Newcastle
lower North Coast
Mid North Coast
Northern rivers
New england
North West
Central North
hunter river
blue MountainsCentral
West
south West
ACt Monaro
PAGE 19 2014 Golf participation report
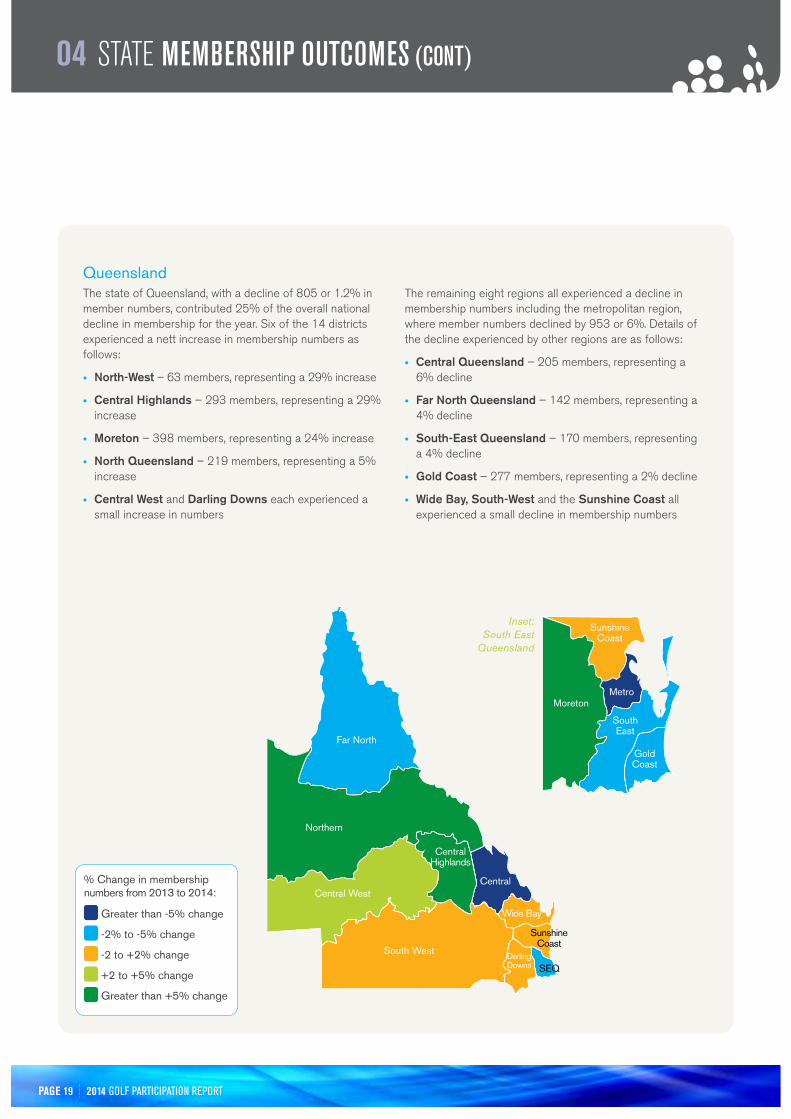
QueenslandThe state of Queensland, with a decline of 805 or 1.2% in member numbers, contributed 25% of the overall national decline in membership for the year. Six of the 14 districts experienced a nett increase in membership numbers as follows:
• North-West – 63 members, representing a 29% increase
• Central Highlands – 293 members, representing a 29% increase
• moreton – 398 members, representing a 24% increase
• North Queensland – 219 members, representing a 5% increase
• Central West and Darling Downs each experienced a small increase in numbers
The remaining eight regions all experienced a decline in membership numbers including the metropolitan region, where member numbers declined by 953 or 6%. Details of the decline experienced by other regions are as follows:
• Central Queensland – 205 members, representing a 6% decline
• Far North Queensland – 142 members, representing a 4% decline
• South-East Queensland – 170 members, representing a 4% decline
• Gold Coast – 277 members, representing a 2% decline
• Wide Bay, South-West and the Sunshine Coast all experienced a small decline in membership numbers
far North
Northern
Central West
south West
Central highlands
Central
Wide bay
sunshine Coast
seQdarling downs
Inset: South East
Queensland
Moreton
sunshine Coast
Metro
south east
Gold Coast
04 state membership outcomes (cont)
% Change in membership numbers from 2013 to 2014:
Greater than -5% change
-2% to -5% change
-2 to +2% change
+2 to +5% change
Greater than +5% change

PAGE 20 2014 Golf participation report
south AustraliaThe state of South Australia experienced an increase of 224 members, representing a 1% increase. Six of the nine districts experienced a nett increase in membership numbers including the metropolitan area with 1,182 additional members, representing a 9% increase. Other strong performing regions include;
• Riverland – 69 members, representing a 12.3% increase
• Southern – 126 members, representing a 3.7% increase
• yorke, murraylands and Eyre all experienced a small increase in member numbers
Of the remaining three regions, South Eastern experienced the largest decrease with 93 members, representing a 5% decrease. The Mid-North and Northern districts experienced declines on 1% (19 members) and 1% (4 members) respectively.
04 state membership outcomes (cont)
Northern
Mid North
southern
south eastern
MurraylandsMetro
eyre
yorke
% Change in membership numbers from 2013 to 2014:
Greater than -5% change
-2% to -5% change
-2 to +2% change
+2 to +5% change
Greater than +5% change
PAGE 21 2014 Golf participation report
04 state membership outcomes (cont)
North east
east GippslandWest
GippslandMetroballarat
Goulburn Valley
south Western
Wimmera
Kara Kara
bendigo
Northern
North West
Mornington Peninsula
south Gippsland
GeelongConrangamite
dalhousie
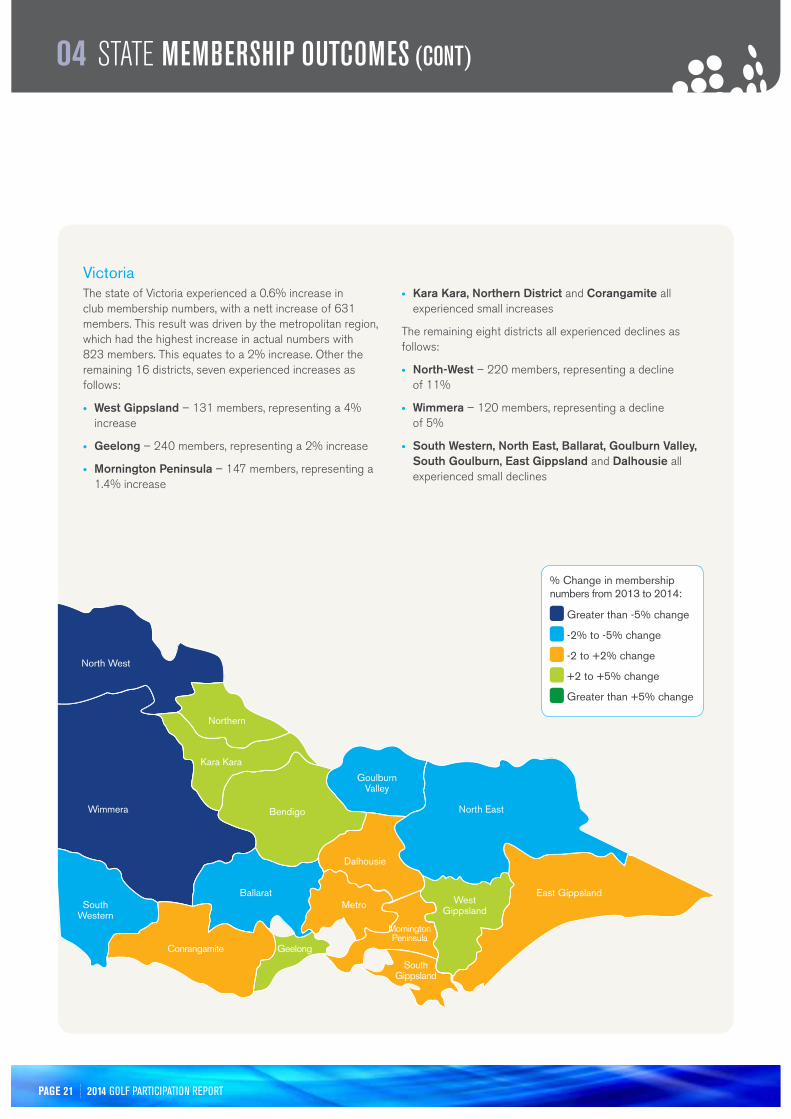
VictoriaThe state of Victoria experienced a 0.6% increase in club membership numbers, with a nett increase of 631 members. This result was driven by the metropolitan region, which had the highest increase in actual numbers with 823 members. This equates to a 2% increase. Other the remaining 16 districts, seven experienced increases as follows:
• West Gippsland – 131 members, representing a 4% increase
• Geelong – 240 members, representing a 2% increase
• mornington Peninsula – 147 members, representing a 1.4% increase
• Kara Kara, Northern District and Corangamite all experienced small increases
The remaining eight districts all experienced declines as follows:
• North-West – 220 members, representing a decline of 11%
• Wimmera – 120 members, representing a decline of 5%
• South Western, North East, Ballarat, Goulburn Valley, South Goulburn, East Gippsland and Dalhousie all experienced small declines
% Change in membership numbers from 2013 to 2014:
Greater than -5% change
-2% to -5% change
-2 to +2% change
+2 to +5% change
Greater than +5% change

PAGE 22 2014 Golf participation report
04 state membership outcomes (cont)
tasmaniaThe state of Tasmania, with a 1.6% decline in club membership numbers, contributed 6% of the overall national decline in membership for the year. Three of the four golf districts recorded declining demand, with the exception being the Southern Metropolitan district which recorded an increase of 1% of 26 members. The North district (93 members or 4%), Southern district (70 members or 2%) and the North district (42 members 1%) all experienced small declines.
Western AustraliaThe state of Western Australia was the strongest performing, recording a 2.2% increase in numbers with an additional 734 members. This result was driven by strong demand in the metropolitan region which grew by 3.5%, equating to an additional 726 members. Of the nine other regions, five experienced a small increase membership numbers. Those regions were the Great Southern, South-West, Gascoyne, Peel and Wheatbelt regions. The remaining four regions, Kimberley, Goldfields, Pilbara and the Mid-West, all experienced small declines.
North
southern
North West
Kimberley
Pilbara
Mid West
Gascoyne
Goldfields
Wheatbelt
Great southernsouth
West
Peel
Metro
% Change in membership numbers from 2013 to 2014:
Greater than -5% change
-2% to -5% change
-2 to +2% change
+2 to +5% change
Greater than +5% change

PAGE 23 2014 Golf participation report
golf
ROUNDS05National resultsFor the twelve month period to end December 2014 approximately 14.3 million rounds were recorded by GolfLink across the same facility base, a 7.2% increase over calendar year 2013. On a year-end basis, slightly higher growth was recorded in rounds played by male golfers, accounting for 82% of all rounds played, as summarised in Table 14.
Table 14
2013 2014 % Change
Male 10,898,945 11,709,938 +7.4%
Female 2,441,871 2,592,373 +6.2%
Total 13,340,816 14,302,311 +7.2%
% male share 82% 82%
Source: GolfLink, Golf Australia, GBAS
Male and female competition rounds in 2014 grew by 7.4% and
6.2% respectively.
Month over month competition rounds growth was achieved for all months of the year through to November, as illustrated in Chart 6.
Chart 6
1,400,000 35%
1,200,000 30%
1,000,000 25%
800,000 20%
600,000 15%
400,000 10%
200,000 5%
2013 2014
Jan Feb Mar Apr May Jun Jul Aug Sep Oct Nov Dec
- 0%
7%
4%
13%
9%
12%
5%
8%
0% 0%
9% 9%
8%
Total % Change
Source: GolfLink, Golf Australia, GBAS

PAGE 24 2014 Golf participation report
05 golf rounds (cont)
results by state/territoryWith a generally drier continent, particularly in the key population centres, growth was evident across all states/territories through 2014. Queensland experienced the largest increase in rounds played for the year, recording approximately 13% growth over 2013, largely due to an exceptional strong 1st quarter. Victoria and South Australia were the only other two states to record growth in all four quarters of the year.
Rounds played by state/territory for the each quarter of 2014 and the movement recorded over the corresponding period in 2013 are summarised in Table 15.
Table 15
2014 Jan – mar april – June July – Sept Oct – Dec Total
NSW 1,353,095 1,368,143 1,277,650 1,367,409 5,366,297
VIC 994,855 942,282 874,896 971,098 3,783,131
QLD 631,402 683,804 665,803 609,044 2,590,053
WA 272,429 269,175 268,599 277,590 1,087,793
SA 260,976 288,947 253,821 263,701 1,067,445
TAS 90,459 84,376 71,994 95,379 342,208
NT 13,096 17,546 19,289 15,453 65,384
Total 3,616,312 3,654,273 3,432,052 3,599,674 14,302,311
% change over Py
NSW +9.9% +12.8% (2.5%) +6.0% +6.4%
VIC +1.6% +3.3% +6.7% +13.2% +6.0%
QLD +29.8% +15.3% +4.6% +5.0% +12.8%
WA +3.8% (6.8%) +1.0% +8.2% +1.3%
SA +2.4% +14.6% +11.1% +12.1% +10.0%
TAS (3.7%) (0.9%) +6.6% +20.5% +5.0%
NT (8.5%) +2.6% +15.9% +16.8% +6.7%
Total +8.9% +8.7% +2.6% +8.7% +7.2%
Source: GolfLink, Golf Australia, GBAS
PAGE 25 2014 Golf participation report
05 golf rounds (cont)
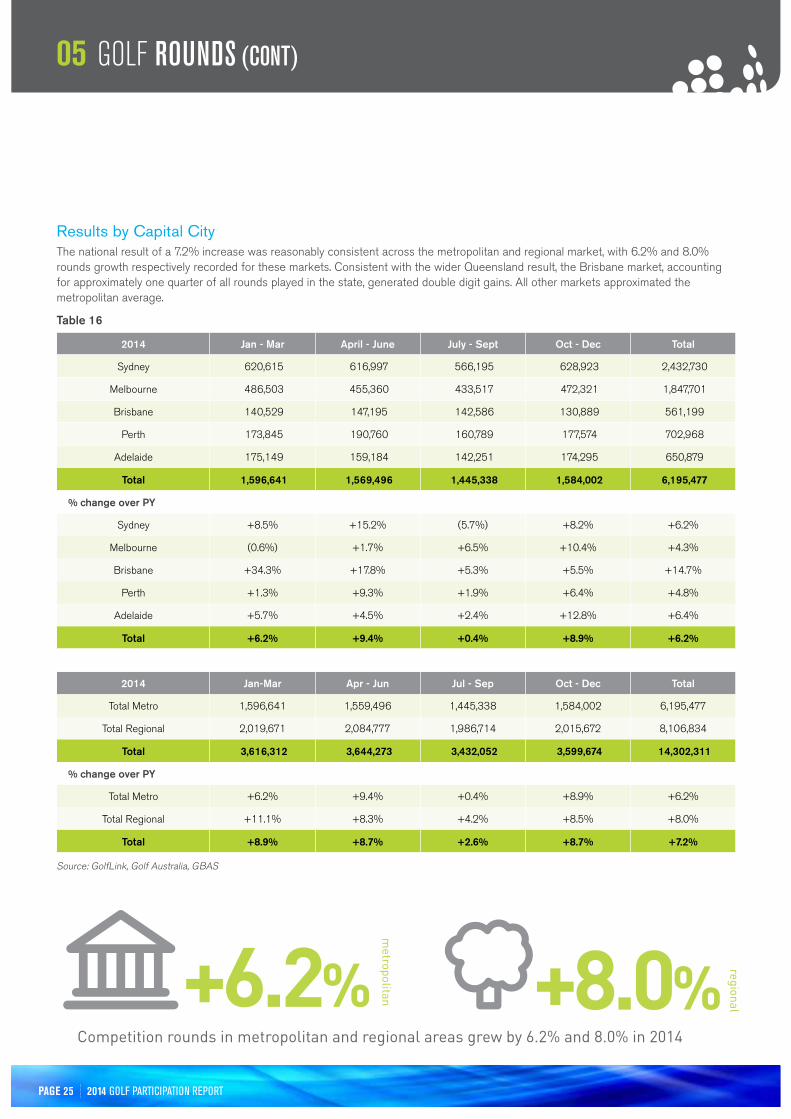
results by Capital CityThe national result of a 7.2% increase was reasonably consistent across the metropolitan and regional market, with 6.2% and 8.0% rounds growth respectively recorded for these markets. Consistent with the wider Queensland result, the Brisbane market, accounting for approximately one quarter of all rounds played in the state, generated double digit gains. All other markets approximated the metropolitan average.
Table 16
2014 Jan - mar april - June July - Sept Oct - Dec Total
Sydney 620,615 616,997 566,195 628,923 2,432,730
Melbourne 486,503 455,360 433,517 472,321 1,847,701
Brisbane 140,529 147,195 142,586 130,889 561,199
Perth 173,845 190,760 160,789 177,574 702,968
Adelaide 175,149 159,184 142,251 174,295 650,879
Total 1,596,641 1,569,496 1,445,338 1,584,002 6,195,477
% change over Py
Sydney +8.5% +15.2% (5.7%) +8.2% +6.2%
Melbourne (0.6%) +1.7% +6.5% +10.4% +4.3%
Brisbane +34.3% +17.8% +5.3% +5.5% +14.7%
Perth +1.3% +9.3% +1.9% +6.4% +4.8%
Adelaide +5.7% +4.5% +2.4% +12.8% +6.4%
Total +6.2% +9.4% +0.4% +8.9% +6.2%
2014 Jan-mar apr - Jun Jul - Sep Oct - Dec Total
Total Metro 1,596,641 1,559,496 1,445,338 1,584,002 6,195,477
Total Regional 2,019,671 2,084,777 1,986,714 2,015,672 8,106,834
Total 3,616,312 3,644,273 3,432,052 3,599,674 14,302,311
% change over Py
Total Metro +6.2% +9.4% +0.4% +8.9% +6.2%
Total Regional +11.1% +8.3% +4.2% +8.5% +8.0%
Total +8.9% +8.7% +2.6% +8.7% +7.2%
Competition rounds in metropolitan and regional areas grew by 6.2% and 8.0% in 2014
+6.2% +8.0%
Source: GolfLink, Golf Australia, GBAS
metropolitan
regional

PAGE 26 2014 Golf participation report
programs, eVeNts, deLiVerers & oFFiciALs06
Table 17 summarises a number of key participation areas that are measured by Golf Australia as a requirement to report to the Australian Sports Commission.
Table 17
Program Participants 2012-13 2013-14
MyGolf National Junior Program 4,846 939
PumpGolf Shootout 1,674 N/A
Other Non-MYGolf Junior Programs 8,974 12,577
Crown Lager Social/GA Social Golf Club 2,478 2,898
Other Casual Golf Programs 7,550 7,027
Indigenous 2,513 1,458
Disability 1,549 2,224
Female 15,005 12,536
Seniors 13,213 14,063
Other programs 1,004 2,576
Total 58,806 56,298
Event Entries (men/Women/mixed/Jnrs)
Member Association State & Territory Events 56,575 50,894
Junior Foundation Events 7,447 7,696
Golf Australia National Events 1,724 1,665
PGA Events 96,748 93,829
ALPG Events 791 959
Total 163,285 155,043
School Delivered Programs Participants
MYGolf Schools 1 (primary) program 45,936 56,499
MYGolf Schools 1 (primary) "tasters" 47,556 36,781
AASC Golf Program 13,820 16,035
MYGolf Schools 2 (secondary) program 24,854 22,748
MYGolf Schools 2 (secondary) "tasters" 2,312 1,518
Other Non-MYGolf School Programs 5,687 7,991
Total 140,165 141,572
School managed Competitions Participants
SSA 12 Yrs & Under Championship 2,401 3,698
SSA 19 Yrs & Under Championship 1,014 1,639
Total 3,415 5,337
Program Deliverers & Officials
Development Personnel 33 34
Community Golf Leaders & Coaches 1,383 1,728
AASC Golf Coaches 678 502
PGA Coaches 1,615 1,562
ALPG Coaches 57 57
Rules Officials 4,886 4,796
Course Raters 418 248
Total 9,070 8,927
NB: The data may include the counting of a participant each time they engage in the activity. Participants may be recorded across multiple categories. Development personnel are those employed by Golf Australia, Member Associations and Junior Foundations.
Points to note from table 17 include;
1. MyGolf National Junior Program• 2013/14 data reflects new participants
only for the 2013/14 period whereby 2012/13 data reflects an accumulative total since 2010/11.
• MyGolf participant data from now on is to be reported to reflect new participants only.
2. PumpGolf shootout• Event ceased in 2013/14 with review of
MyGolf program and establishment of GA and PGA joint junior venture agreement.
3. Member Association state & territory event Participants• Victoria & NSW reported event participant
declines of 1,293 and 3,656 respectively.
4. MyGolf school Participants• Program participants up due to shift
away from “taster” programs (which has declined) and now greater focus on 5 week programs.
5. Course raters down due to completion of course rating exercise.

© 2015 Golf australia - all Rights Reserved.
level 3, 95 Coventry st south Melbourne
ViC 3205 AustraliaT: 03 9626 5050