goldquest corporate presentation - february 2015
TRANSCRIPT

FEBRUARY 2015

2 | FEBRUARY 2015
FORWARD LOOKING STATEMENT AND QUALIFIED PERSON Statements contained in this presentation that are not historical facts are forward-looking information that involves known and unknown risks and uncertainties. Forward-looking statements in this presentation include, but are not limited to, statements with respect to the merits of the Company's mineral properties, mineral resource estimates, and the Company's plans, exploration programs and studies for its mineral properties, including the timing of such plans, programs and studies. In certain cases, forward-looking statements can be identified by the use of words such as "plans", "has proven", "expects" or "does not expect", "is expected", "potential", "appears", "budget", "scheduled", "estimates", "forecasts", "at least", "intends", "anticipates" or "does not anticipate", or "believes", or variations of such words and phrases or state that certain actions, events or results "may", "could", "would", "should", "might" or "will be taken", "occur" or "be achieved". Forward-looking statements involve known and unknown risks, uncertainties and other factors which may cause the actual results, performance or achievements of the Company to be materially different from any future results, performance or achievements expressed or implied by the forward-looking statements. Such risks and other factors include, among others, risks related to uncertainties inherent in the estimation of mineral resources; commodity prices; changes in general economic conditions; market sentiment; currency exchange rates; the Company's ability to continue as a going concern; the Company's ability to raise funds through equity financings; risks inherent in mineral exploration; risks related to operations in foreign countries; future prices of metals; failure of equipment or processes to operate as anticipated; accidents, labor disputes and other risks of the mining industry; delays in obtaining governmental approvals; government regulation of mining operations; environmental risks; title disputes or claims; limitations on insurance coverage and the timing and possible outcome of litigation. Although the Company has attempted to identify important factors that could affect the Company and may cause actual actions, events or results to differ materially from those described in forward-looking statements, there may be other factors that cause actions, events or results not to be as anticipated, estimated or intended. There can be no assurance that forward-looking statements will prove to be accurate, as actual results and future events could differ materially from those anticipated in such statements. Accordingly, do not place undue reliance on forward-looking statements. All statements are made as of the date of this presentation and the Company is under no obligation to update or alter any forward-looking statements. Forward-looking statements are based on assumptions that the Company believes to be reasonable, including expectations regarding mineral exploration and development costs; expected trends in mineral prices and currency exchange rates; the accuracy of the Company's current mineral resource estimates; that the Company's activities will be in accordance with the Company's public statements and stated goals; that there will be no material adverse change affecting the Company or its properties; that all required approvals will be obtained and that there will be no significant disruptions affecting the Company or its properties. Certain technical information in this presentation was taken from the technical report entitled “A Mineral Resource Estimate for the Romero Project, Tireo Property, Province of San Juan, Dominican Republic” dated December 13, 2013 (effective date of resource is October 29, 2013), prepared by B. Terrance Hennessey, P.Geo., Ing. Alan J. San Martin, MAusIMM (CP) and Richard M. Gowans, P.Eng. of Micon International Limited, and is subject to all of the assumptions, qualifications and procedures described therein. Mineral resources that are not mineral reserves do not have demonstrated economic viability. There is no certainty that the mineral resources will be categorized as mineral reserves. Jeremy K. Niemi, P.Geo., VP Exploration, GoldQuest Mining Inc., is the Qualified Person who supervised the preparation of the exploration technical data in this presentation. Please refer to the Company's most recent Management's Discussion & Analysis (available at www.sedar.com) for further information regarding the Company's mineral resources.

3 | FEBRUARY 2015
§ Experienced Board & Management with proven development success in the Dominican Republic
§ Dominican Republic mining friendly jurisdiction
§ $6.9 million at September 30, 2014
§ Discovery - May 2012 § NI 43-101 Resource
- Oct 2013 § PEA completed
- May 2014 § 90,000 ounces of gold per
year at AISC* of $353/oz § PEA being optimized
§ COMPLETED ZTEM Airborne Survey (March 2014)
§ Ground Induced Polarization (“IP”) 2014 program completed
§ 5,000m drill program IN PROGRESS
WHY GoldQuest?
EXPERIENCE DEVELOPMENT EXPLORATION The ROMERO PROJECT INDICATED 2.4M oz. Gold Eq. INFERRED 0.8M oz. Gold Eq.
The TIREO PROJECT 2014/15 Exploration Program
Julio Espaillat, CEO & Bill Fisher, Executive Chairman
*All In Sustaining Costs (“AISC”)

4 | FEBRUARY 2015
THE ROMERO PROJECT Development
May 2012 – May 2014 Discovery > NI 43-101 > PEA
THE TIREO PROJECT Exploration
2014/15 Exploration Program ZTEM > Map/IP > Drill
Thorough knowledge of Romero increases odds
of discovery in highly prospective district
GoldQuest: Focused in Western Dominican Republic

5 | FEBRUARY 2015
ROMERO DISCOVERY
HONDO VALLE VILLAGE
EXPLORATION CAMP
The ROMERO PROJECT – Road – Camp – Hydro-electric

6 | FEBRUARY 2015
East-West Cross Section through Romero Resource Model with local geology and alteration halo
7 | FEBRUARY 2015
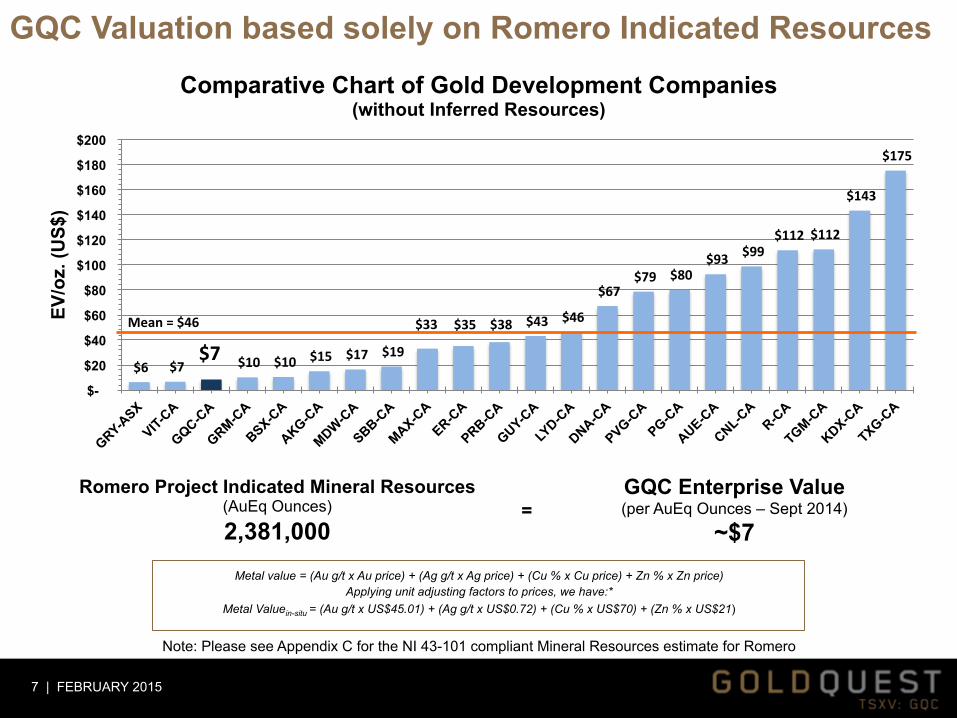
GQC Valuation based solely on Romero Indicated Resources
Note: Please see Appendix C for the NI 43-101 compliant Mineral Resources estimate for Romero
Metal value = (Au g/t x Au price) + (Ag g/t x Ag price) + (Cu % x Cu price) + Zn % x Zn price) Applying unit adjusting factors to prices, we have:*
Metal Valuein-situ = (Au g/t x US$45.01) + (Ag g/t x US$0.72) + (Cu % x US$70) + (Zn % x US$21)
Romero Project Indicated Mineral Resources (AuEq Ounces)
2,381,000 =
GQC Enterprise Value (per AuEq Ounces – Sept 2014)
~$7
$6 $7 $7 $10 $10 $15 $17 $19
$33 $35 $38 $43 $46
$67 $79 $80
$93 $99 $112 $112
$143
$175
$-
$20
$40
$60
$80
$100
$120
$140
$160
$180
$200
EV/o
z. (U
S$)
Comparative Chart of Gold Development Companies (without Inferred Resources)
Mean = $46

8 | FEBRUARY 2015
Romero Preliminary Economic Assessment (unoptimized)
Romero Preliminary Economic Assessment (unoptimized)
Mine Life 15 years
Throughput 3,800 tpd
Product Copper, Gold concentrate
Production per year 90,000 oz Gold, 15.6 Mlbs Copper
AISC* $353/oz* - Copper credited against costs
NPV (5%) – unoptimized – post tax
$294 million
IRR – unoptimized – post-tax
15.1%
Capital (Preproduction) - unoptimized
$334 million
Capital (Sustaining) $40 million
*AISC All In Sustaining Costs (“AISC”) includes all site costs, treatment and refining charges royalties and sustaining capital – Full analysis may be found in Appendix D

9 | FEBRUARY 2015
THE ROMERO PROJECT – Life Of Mine Costs Higher “up front” capex (resulting in lower IRRs) mitigated by low All-In Sustaining Costs (AISC). The Romero project compares well within peer group of project developers
* Romero project at 90,000 oz/year gold only (costs net of by-products)
Going forward: § Optimize PEA § Seek further ounces in district (Tireo Project)
$578 $602 $617 $652 $728 $732 $807
$844 $859 $934
$1,033 $1,049
$0
$200
$400
$600
$800
$1,000
$1,200
R TXG GQC (Au)*
LYD SUE GUY VIT RR PMV AUE GRV BSX
Total cash costs (per oz) Sustaining Capital (per oz) Up front Capital (per oz)
90,000 oz/year gold
Costs Per Ounce (Life Of Mine) (All-In Operating Costs plus Initial and Sustaining Capital per ounce of gold produced)

10 | FEBRUARY 2015
Deposits are found in resistivity lows (in pink) due to altered host rocks
RESISITIVITY IP CHARGEABILITY MAG MAPPING
Deposits are found in magnetic lows (in blue) due to hydrothermal magnetite destruction
Deposits found within chargeability highs (in pink) due to the presence of sulphides
Deposits are close to rhyolite (shown in pink)
LOW HIGH LOW RHYOLITES + ALTERATION
ROMERO
ROMERO SOUTH
THE TIREO PROJECT – How does Romero help to find more GOLD?

11 | FEBRUARY 2015
2012
2013
MAY 2014
JUNE / JULY 2014
AUGUST 2014
SEPTEMBER 2014
TIREO PROJECT
§ 2012: First ever IP Program § 2013: Follow-up IP & Drilling § 2014:
§ Fast-track generation of new targets
§ Rigorous selection of IP grid locations leads to target definition
§ All targets slated to be drilled in 2014/early 2015

12 | FEBRUARY 2015
100m 0m 200m IMPERIAL – Many Similarities to Romero
DRILLING IN PROGRESS – ASSAYS PENDING
Peak 8 mV/V Peak 10 mV/V
1 km 1 km
DRILLHOLE IMP-03
ROMERO IMPERIAL
POTENTIAL NEXT HOLE
Key to Drilling at Romero only

13 | FEBRUARY 2015
TOP 20 ANOMALIES

14 | FEBRUARY 2015
TIREO PROJECT 2014 - 2015 PROGRAM
§ 2014 – The Groundwork § Property wide ZTEM and Magnetic
Airborne survey (Mag shown) § Systematic ground follow up
§ Mapping § Sampling § IP* (coverage so far 25%) § 4,200 metres drilling
§ 2015 – Follow-up § Mapping § Sampling § 5,000 metres additional drilling
* As of October, 2014

15 | FEBRUARY 2015
§ Discovered Romero – AISC $353/oz - $471M Pre-tax NPV (5%) valuation § Most prospective land package in the Tireo Formation § Valued at ~$7/oz of M&I gold (net of cash) § $6.9 million cash at Sept 30, 2014 § Low valuation due to market conditions
Why GoldQuest?
GQC three year share price chart – Discovery of Romero May 2012

Corporate Information
Directors Bill Fisher, Executive Chairman Julio Espaillat Florian Siegfried Patrick Michaels Frank Balint
Management Julio Espaillat, CEO Paul Robertson, CFO Jeremy Niemi, VP, Exploration Ann Wilkinson, VP, Investor Relations
GoldQuest Mining Corp. 155 Wellington St W., Suite 2920 Toronto ON, Canada M5V 3H1 Investor Relations – Ann Wilkinson Tel: 416-583-5606 [email protected] www.goldquestcorp.com @GQCmining
SHARE PRICE* $0.13
3 YEAR RANGE* $2.03 - $0.04
SHARES OUTSTANDING* 145,755,044
FULLY DILUTED SHARES* 160,311,207
NET MARKET CAPITALIZATION* C$11.9 million
CASH & CASH EQUIVALENTS** C$6.9 million * As at January 27, 2015 ** As at September 30, 2014

17 | FEBRUARY 2015
§ Constructed 1st Church in Hondo Valle
§ Established village Medical Clinic
§ Sponsors local San Juan softball team
§ We employ locally
§ Built the 1st Primary School in Hondo Valle
§ Active Supporter of Cotui University Geology Dept. § Established GQC BSc.
Scholarship program § 2013 – 2 Geology Scholars
§ We operate with a very small footprint
§ We protect and respect our environment
§ Water monitoring & testing program in place
APPENDIX A: Social & Environment
COMMUNITY EDUCATION ENVIRONMENT
“We pride ourselves in being an active member in the communities in which we operate. We have a common goal and vision for creating lasting communities and relationships, which is key to ensuring a sustainable future here in the Dominican Republic.” – Julio Espaillat, CEO

18 | FEBRUARY 2015
Appendix B: History of Discovery in the Dominican Republic
Maiden Resource at ROMERO (incl. Romero South) § Indicated resource 2.4 million ounces of gold eq. § Inferred resource 0.8 million ounces of gold eq. § Preliminary Economic Assessment (PEA) initiated § C$8.2 million cash in hand (End Q2 2014)
2013
2006 Discovered ROMERO SOUTH
2009 Maiden Resource at LAS ANIMAS (Copper/Gold) § Drilling incl. 142 m @ 2.5 g/t Au, 2.59% Cu
2010 Maiden Resource at ROMERO SOUTH (Copper/Gold) § Inferred Resource 0.3 million ounces of gold equivalent § Drilling incl. 26 m @ 11 g/t gold
2012 Discovery of ROMERO § Incl. 235m @ 7.9 g/t gold and 1.4% copper § Raised over $20 million to fast track discovery
Feb 2014 First ever airborne Electro Magnetic survey completed May 2014 Positive PEA completed for ROMERO July 2014 Identified La Bestia Zone Sept 2014 Identified Imperial Zone

19 | FEBRUARY 2015
Appendix C - ROMERO PROJECT – Mineral Resources National Instrument 43-101 Compliant Mineral Resource
Value of Gold Eq. in GoldQuest’s market cap (Indicated Resources only. circa $7/oz)
Category Zone Tonnes Au (g/t)
Cu (%)
Zn (%)
Ag (g/t)
AuEq (g/t)
Au Ounces
AuEq Ounces
Indicated Romero 17,310,000 2.55 0.68 0.30 4.0 3.81 1,419,000 2,123,000
Romero South 2,110,000 3.33 0.23 0.17 1.5 3.8 226,000 258,000
Total Indicated Resources 19,420,000 2.63 0.63 0.29 3.7 3.81 1,645,000 2,381,000
Inferred Romero 8,520,000 1.59 0.39 0.46 4.0 2.47 437,000 678,000
Romero South 1,500,000 1.92 0.19 0.18 2.3 2.33 92,000 112,000
Total Inferred Resources 10,020,000 1.64 0.36 0.42 3.8 2.45 529,000 790,000
Mineral Resources for Romero and Romero South Estimated by Micon International Limited. Technical Report Published December 13th 2013(Effective date October 29, 2013). Please refer to the Company's most recent Management's Discussion & Analysis (available at www.sedar.com) for further information regarding the Company's mineral resources.
The metal prices assumed for this calculation were; Au=US$1,400/oz, Ag=US$22.50/oz; Cu=US$3.18/lb and Zn=US$0.95/lb
Metal value = (Au g/t x Au price) + (Ag g/t x Ag price) + (Cu % x Cu price) + Zn % x Zn price) Applying unit adjusting factors to prices, we have:*
Metal Valuein-situ = (Au g/t x US$45.01) + (Ag g/t x US$0.72) + (Cu % x US$70) + (Zn % x US$21)
* - Gold and silver units are in ppm and copper and zinc prices are in weight %

20 | FEBRUARY 2015
Appendix D - ROMERO PROJECT – The Numbers PRODUCTION DATA Per year Life of Mine MINE LIFE (at $1300/oz Gold & $3.25/lb. of Copper) 15 years
PRODUCTION Tonnes t. 1.38 million 18.46 million (80% indicated) Gold grade g/t 2.69 Copper grade % 0.61 Payable gold ounces 90,000 1.26 million Payable copper lbs 15.6 million 213.7 million Gold & Copper ounces gold equiv. 129,000 1.75 million CAPITAL COSTS Pre-production $334 million
LOM sustaining capital $40 million
Total Capital Cost $374 million
OPERATING COSTS Per ounce of gold production Gold only*
Average annual production 90,000
On-site cash operating costs $153
Transportation & Treatment/Refining $147
Royalties $21
Sustaining Capital $32
All-in sustaining operating costs $353 *net of copper by-products
NET PRESENT VALUE & IRR Pre tax Post tax Net Present value @ 5% discount rate $471 million $294 million
Net Present value @ 8% discount rate $318 million $176 million
IRR 19.7% 15.1%
GoldQuest’s Market Cap (net of cash) C$16.5 million