goldman sachs class a: gfrax class ir: gfrix high yield ... · high yield floating rate fund high...
TRANSCRIPT
Date of First Use: July 19, 2013
Goldman SachsHigh Yield Floating Rate Fund
High Income Potential for an Uncertain Rate Environment
SEEKS A HIGH LEVEL OF CURRENT INCOME
Navigate Interest Rates
Floating-rate bank loans offer a
coupon that adjusts to changing
interest rates.
Enhance Risk Diversification
The Fund employs a two-tiered
approach to mitigate risk, seeking
to reduce volatility within a
portfolio.
“Intelligent” Source of Income
The Fund seeks to uncover
differentiated income
opportunities.
Total Fund Net Assets (MM) $2347.6 30-Day Distribution Rate - Class I 3.64%
NAV - Class I $10.03 Interest Rate Duration (years) 0.19
Total Number of Holdings 354 Spread Duration (years) 2.58
Standardized 30-Day Subsidized Yield - Class I 3.72% Net Expense Ratio - Class I (Current) 0.74%
Standardized 30-Day Unsubsidized Yield - Class I 3.72% Gross Expense Ratio - Class I (Before Waiver) 0.79%
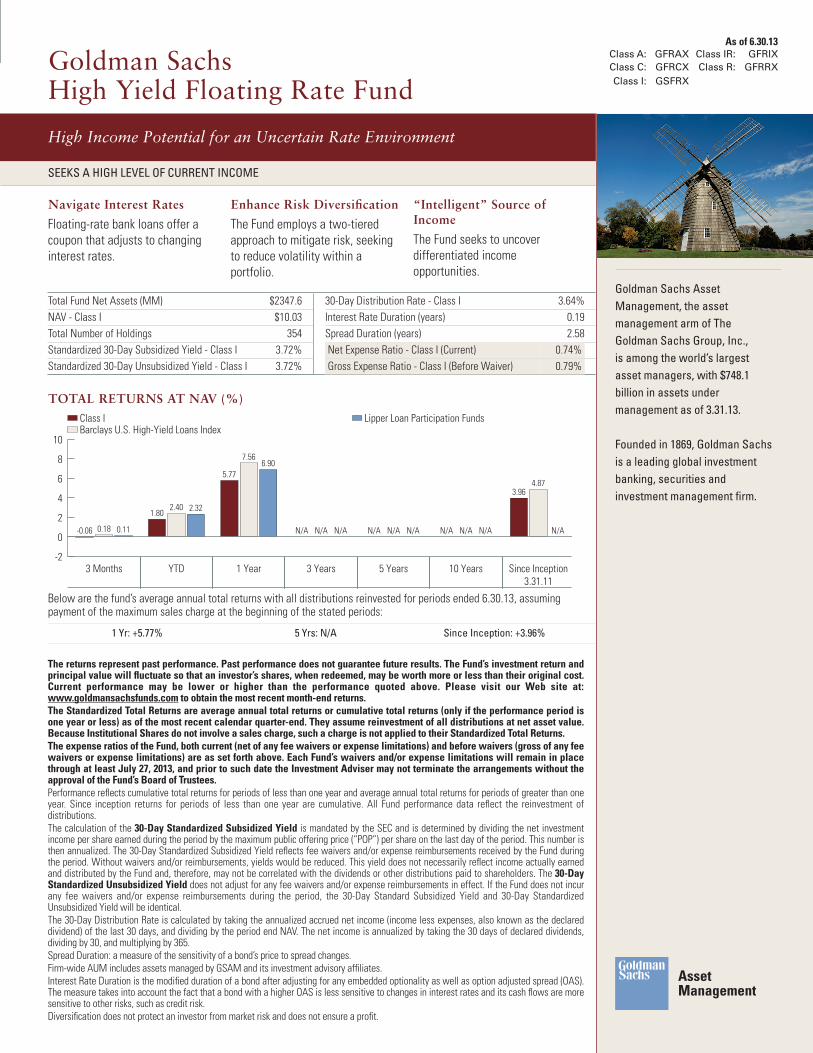
TOTAL RETURNS AT NAV (%)
-0.06
1.80
5.77
N/A N/A N/A
3.96
0.18
2.40
7.56
N/A N/A N/A
4.87
0.11
2.32
6.90
N/A N/A N/A N/A
3 Months YTD 1 Year 3 Years 5 Years 10 Years Since Inception
3.31.11
-2
0
2
4
6
8
10
Class IBarclays U.S. High-Yield Loans Index
Lipper Loan Participation Funds
Below are the fund’s average annual total returns with all distributions reinvested for periods ended 6.30.13, assuming payment of the maximum sales charge at the beginning of the stated periods:
1 Yr: +5.77% 5 Yrs: N/A Since Inception: +3.96%
The returns represent past performance. Past performance does not guarantee future results. The Fund’s investment return and principal value will fluctuate so that an investor’s shares, when redeemed, may be worth more or less than their original cost. Current performance may be lower or higher than the performance quoted above. Please visit our Web site at: www.goldmansachsfunds.com to obtain the most recent month-end returns.
The Standardized Total Returns are average annual total returns or cumulative total returns (only if the performance period is one year or less) as of the most recent calendar quarter-end. They assume reinvestment of all distributions at net asset value. Because Institutional Shares do not involve a sales charge, such a charge is not applied to their Standardized Total Returns.
The expense ratios of the Fund, both current (net of any fee waivers or expense limitations) and before waivers (gross of any fee waivers or expense limitations) are as set forth above. Each Fund’s waivers and/or expense limitations will remain in place through at least July 27, 2013, and prior to such date the Investment Adviser may not terminate the arrangements without the approval of the Fund’s Board of Trustees.
Performance reflects cumulative total returns for periods of less than one year and average annual total returns for periods of greater than one year. Since inception returns for periods of less than one year are cumulative. All Fund performance data reflect the reinvestment of distributions.
The calculation of the 30-Day Standardized Subsidized Yield is mandated by the SEC and is determined by dividing the net investment income per share earned during the period by the maximum public offering price (“POP”) per share on the last day of the period. This number is then annualized. The 30-Day Standardized Subsidized Yield reflects fee waivers and/or expense reimbursements received by the Fund during the period. Without waivers and/or reimbursements, yields would be reduced. This yield does not necessarily reflect income actually earned and distributed by the Fund and, therefore, may not be correlated with the dividends or other distributions paid to shareholders. The 30-Day Standardized Unsubsidized Yield does not adjust for any fee waivers and/or expense reimbursements in effect. If the Fund does not incur any fee waivers and/or expense reimbursements during the period, the 30-Day Standard Subsidized Yield and 30-Day Standardized Unsubsidized Yield will be identical.
The 30-Day Distribution Rate is calculated by taking the annualized accrued net income (income less expenses, also known as the declared dividend) of the last 30 days, and dividing by the period end NAV. The net income is annualized by taking the 30 days of declared dividends, dividing by 30, and multiplying by 365.
Spread Duration: a measure of the sensitivity of a bond’s price to spread changes.
Firm-wide AUM includes assets managed by GSAM and its investment advisory affiliates.
Interest Rate Duration is the modified duration of a bond after adjusting for any embedded optionality as well as option adjusted spread (OAS). The measure takes into account the fact that a bond with a higher OAS is less sensitive to changes in interest rates and its cash flows are more sensitive to other risks, such as credit risk.
Diversification does not protect an investor from market risk and does not ensure a profit.
As of 6.30.13
Class A: GFRAX Class IR: GFRIX
Class C: GFRCX Class R: GFRRX
Class I: GSFRX
Goldman Sachs Asset
Management, the asset
management arm of The
Goldman Sachs Group, Inc.,
is among the world’s largest
asset managers, with $748.1
billion in assets under
management as of 3.31.13.
Founded in 1869, Goldman Sachs
is a leading global investment
banking, securities and
investment management firm.

Date of First Use: July 19, 2013
Goldman Sachs High Yield Floating Rate Fund
Benefit from an
experienced, dedicated
team
Fully integrated credit team of investment professionals in New York, London and Tokyo.
Credit team of over 60 professionals, including 40+ research analysts looking for value across high yield, bank loans and investment grade credit.
A rigorous investment process that combines active management with disciplined risk management.
Jean Joseph
Portfolio Manager
16 Years of Investment
Experience
Michael Chang, CFA
Portfolio Manager
13 Years of Investment
Experience
Michael Goldstein
Co-Head of High Yield and
Bank Loan Team
23 Years of Investment
Experience
TOP TEN CORPORATE HOLDINGS (%)
H.J. Heinz 2.0
HCA 1.9
First Data 1.6
Delta Air Lines 1.5
Intelsat 1.5
CC Media 1.3
Neiman Marcus 1.3
CIH International 1.2
Bright Horizons Family Solutions 1.2
Liberty Global 1.1
DIVIDENDS
Class Inst
4.30.13 $0.030
5.31.13 $0.034
6.30.13 $0.030
SECTOR ALLOCATION (%)
Bank Loans 82.1
High Yield Corporates 8.5
CLO 0.9
Cash 8.3
Derivatives 0.3
CREDIT ALLOCATION (%)
A 0.9
BBB 4.5
BB 41.9
B 37.3
CCC 4.5
NR 2.3
Cash 8.3
Derivs 0.3
The Goldman Sachs High Yield Floating Rate Fund invests primarily in domestic or foreign floating rate loans and other floating or variable rate obligations rated below investment grade. Indirect loan participations may subject the Fund to greater delays, expenses and risks than direct obligations in the case that a borrower fails to pay scheduled principal and interest. Investments in loans and fixed income instruments are subject to the risks associated with debt instruments generally, including credit, liquidity and interest rate risk. Foreign and emerging markets investments may be more volatile and less liquid than investments in U.S. securities and are subject to the risks of currency fluctuations and adverse economic or political developments. High yield, lower rated investments involve greater price volatility and present greater risks than higher rated investments. At times, the Fund may be unable to sell certain of its illiquid investments without a substantial drop in price, if at all. Derivative instruments may involve a high degree of financial risk. These risks include the risk that a small movement in the price of the underlying security or benchmark may result in a disproportionately large movement, unfavorable or favorable, in the price of the derivative instrument; the risk of default by a counterparty; and liquidity risk.
This Fund and its respective benchmark have not been rated by an independent rating agency. The credit allocation provided refers to the Fund’s underlying portfolio securities. GSAM may receive credit quality ratings on the underlying securities of the Fund and its respective benchmark from the three major rating agencies: S&P, Moody’s and Fitch. GSAM develops the credit quality breakdown for both Funds and their respective benchmarks by taking the highest rating if more than one agency rates a security. This method may differ from the method independently used by benchmark providers. GSAM will use a single rating if that is the only one available. Securities that are not rated by all three agencies are reflected as such in the breakdown. GSAM converts all ratings to the equivalent S&P major rating category when illustrating credit rating breakdowns. Ratings and fund/benchmark credit quality may change over time. Unrated securities do not necessarily indicate low quality, and for such securities the investment adviser will evaluate the credit quality.
The Barclays Bank Loan Index provides broad and comprehensive total return metrics of the universe of syndicated term loans. To be included in the index, a bank loan must be dollar denominated, have at least $150 million funded loan, a minimum term of one year, and a minimum initial spread of LIBOR+125.
Holdings and allocations shown are unaudited, and may not be representative of current or future investments. Holdings and allocations may not include the Fund’s entire investment portfolio, which may change at any time. Fund holdings should not be relied on in making investment decisions and should not be construed as research or investment advice regarding particular securities. Current and future holdings are subject to risk.
Percentages may not sum to 100% due to rounding.
Dividends are accrued daily and paid Monthly.
Cash may include local currency, foreign currency, short-term investment funds, bank acceptances, commercial paper, margin, repurchase agreements, time deposits, variable-rate demand notes, and/or money market mutual funds. The Cash category may show a negative market value percentage as a result of a) the timing of trade date versus settlement date transactions and/or b) the portfolio’s derivative investments, which are collateralized by the portfolio’s available cash and securities. Such securities are AAA rated by an independent rating agency, have durations between -2 and 1 years, and are limited to the following sectors: governments, agencies, supranationals, corporates, and agency-backed adjustable-rate mortgages.
Non-Rated (NR) includes holdings of securities not rated by any major rating agency. Unrated securities held in the fund may be of higher, lower, or comparable credit quality to securities that have a credit rating from a Nationally Recognized Statistical Rating Organization (NRSRO). Therefore, investors should not assume that the unrated securities in the fund increase or decrease the fund’s overall credit quality.
The Net Asset Value (NAV) is the market value of one share of the Fund.
This material is not authorized for distribution unless preceded or accompanied by a current prospectus or summary prospectus, if applicable. Investors should consider a fund’s objectives, risks, and charges and expenses, and read the summary prospectus, if available, and the prospectus carefully before investing or sending money. The summary prospectus, if available, and the Prospectus contains this and other information about the Fund.Goldman, Sachs & Co. is the distributor of the Goldman Sachs Funds. © 2013 Goldman Sachs. All rights reserved. HYFRFCT_IAS/7-13
NOT FDIC-INSURED May Lose Value No Bank Guarantee