gold prices december 2000 to september 2011
DESCRIPTION
GOLD PRICES December 2000 to September 2011. US$1 771. US$ per Ounce. | 2001 | 2002 | 2003 | 2004 | 2005 | 2006 | 2007 | 2008 | 2009 | 2010 | 2011. Robertson Economic Information Services. GOLD PRICES December 2000 to October 28 2011. US$1 741. US$ per Ounce. - PowerPoint PPT PresentationTRANSCRIPT


0
200
400
600
800
1 000
1 200
1 400
1 600
1 800
GOLD PRICESDecember 2000 to September 2011
| 2001 | 2002 | 2003 | 2004 | 2005 | 2006 | 2007 | 2008 | 2009 | 2010 | 2011
US
$ p
er O
un
ce
Robertson Economic Information Services
US$1 771

0
200
400
600
800
1 000
1 200
1 400
1 600
1 800
GOLD PRICESDecember 2000 to October 28 2011
| 2001 | 2002 | 2003 | 2004 | 2005 | 2006 | 2007 | 2008 | 2009 | 2010 | 2011
US
$ p
er O
un
ce
Robertson Economic Information Services
US$1 741

0
200
400
600
800
1 000
1 200
1 400
1 600
1 800
2 000
GOLD PRICESDecember 2000 to December 2011
Month-End Prices
| 2001 | 2002 | 2003 | 2004 | 2005 | 2006 | 2007 | 2008 | 2009 | 2010 | 2011
US
$ p
er O
un
ce
Robertson Economic Information Services
US$1 574

GOLD PRODUCTION VOLUMES
0
5 000
10 000
15 000
20 000
25 000
30 000
19971998199920002001200220032004200520062007200820092010
Robertson Economic Information Services
KIL
OG
RA
MS
PE
R Y
EA
R

GOLD PRODUCTION VOLUMES
0
5 000
10 000
15 000
20 000
25 000
30 000
199719981999200020012002200320042005200620072008200920102011
Robertson Economic Information Services
KIL
OG
RA
MS
PE
R Y
EA
R
FIRST 8 MONTHS
2011
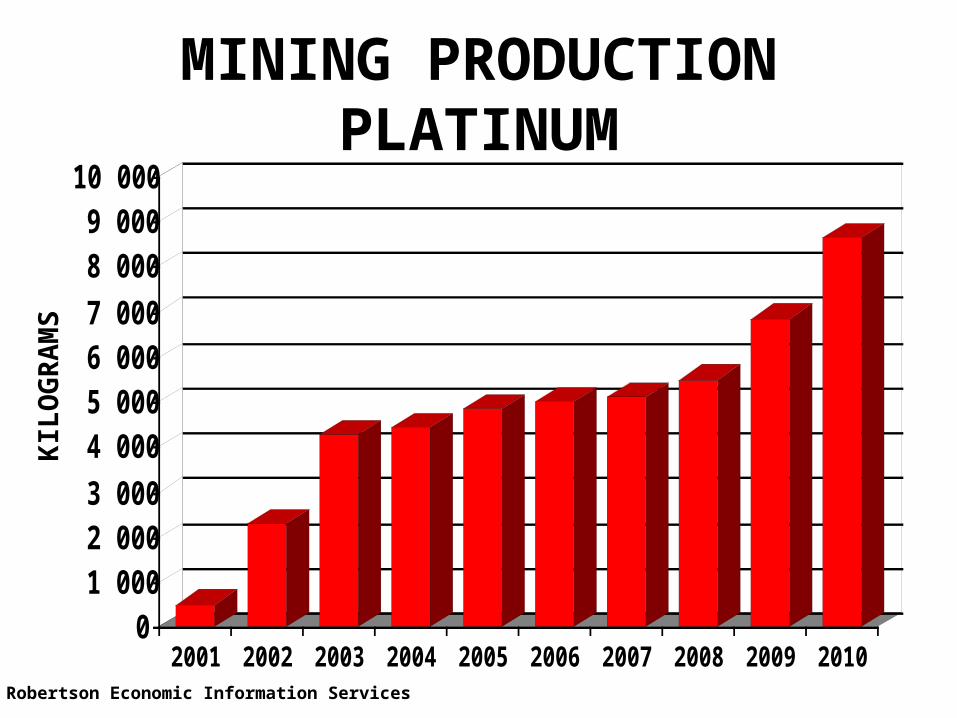
MINING PRODUCTION PLATINUM
01 0002 0003 000
4 0005 0006 0007 000
8 0009 000
10 000
2001 2002 2003 2004 2005 2006 2007 2008 2009 2010Robertson Economic Information Services
KIL
OG
RA
MS

MINING PRODUCTION PLATINUM
01 0002 0003 000
4 0005 0006 000
7 0008 0009 000
10 000
2001 2002 2003 2004 2005 2006 2007 2008 2009 2010 2011Robertson Economic Information Services
KIL
OG
RA
MS
FIRST 8 MONTHS
2011

MINING PRODUCTION PALLADIUM
0
1 000
2 000
3 000
4 000
5 000
6 000
7 000
8 000
2001 2002 2003 2004 2005 2006 2007 2008 2009 2010Robertson Economic Information Services
KIL
OG
RA
MS

MINING PRODUCTION RHODIUM
0
100
200
300
400
500
1998 1999 2000 2001 2002 2003 2004 2005 2006 2007 2008 2009 2010
Robertson Economic Information Services
KIL
OG
RA
MS
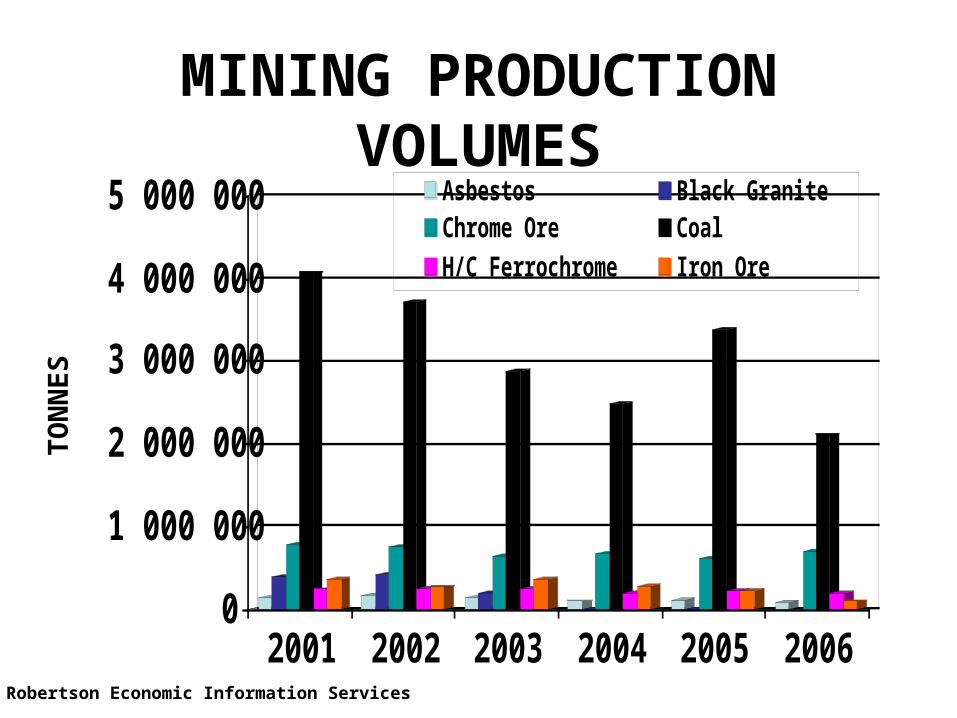
MINING PRODUCTION VOLUMES
0
1 000 000
2 000 000
3 000 000
4 000 000
5 000 000
2001 2002 2003 2004 2005 2006
Asbestos Black Granite Chrome Ore Coal
H/C Ferrochrome Iron Ore
TO
NN
ES
Robertson Economic Information Services

MINING PRODUCTION VOLUMES - BASE MINERALS
0
100 000
200 000
300 000
400 000
500 000
600 000
700 000
800 000
1998 2000 2002 2004 2006 2008 2010
Asbestos Black Granite Chrome Ore H/C FerrochromeIron Ore Lithium minerals Nickel Phosphate
TO
NN
ES
Robertson Economic Information Services

COAL PRODUCTION Tonnes per Month - Jan 1996 to Aug 2011
0
50 000
100 000
150 000
200 000
250 000
300 000
350 000
400 000
450 000
500 000
Tonnes
Robertson Economic Information ServicesTo August 2011
| 1996 | 1997 | 1998 | 1999 | 2000 | 2001 | 2002 | 2003 | 2004 | 2005 | 2006 | 2007 | 2008 | 2009 | 2010 | 2011

HWANGE COLLIERYImproving Performance
First six months 2011 2010• Coal sales, millions of tonnes 1,16 1,18• Coking coal, tonnes 364 000 319 159• Revenue US$’m 48,6 45,2
-------------------------------------------------------------
US$180 million needed to update underground and opencast mining operations
Robertson Economic Information Services

COAL PRODUCTION Tonnes per Month - Jan 1996 to Aug 2011
0
50 000
100 000
150 000
200 000
250 000
300 000
350 000
400 000
450 000
500 000
Tonnes
Robertson Economic Information Services
| 1996 | 1997 | 1998 | 1999 | 2000 | 2001 | 2002 | 2003 | 2004 | 2005 | 2006 | 2007 | 2008 | 2009 | 2010 | 2011

MINING PRODUCTION HIGH CARBON FERROCHROME
0
50 000
100 000
150 000
200 000
250 000
300 000
2001200220032004200520062007200820092010
TO
NN
ES
Robertson Economic Information Services

MINING PRODUCTION NICKEL
0
2 000
4 000
6 000
8 000
10 000
12 000
2001 2002 2003 2004 2005 2006 2007 2008 2009 2010
TO
NN
ES
PE
R Y
EA
R
Robertson Economic Information Services

0
5001 0001 5002 0002 5003 0003 5004 0004 5005 000
1998 2000 2002 2004 2006 2008 2010
TO
NN
ES
PE
R Y
EA
R
Robertson Economic Information Services
MINING PRODUCTION COPPER

MINING PRODUCTION COBALT
0
50
100
150
200
250
300
1998 1999 2000 2001 2002 2003 2004 2005 2006 2007 2008 2009 2010
TO
NN
ES

MINING PRODUCTION IRON ORE
0
50 000
100 000
150 000
200 000
250 000
300 000
350 000
400 000
2001 2002 2003 2004 2005 2006 2007 2008 2009 2010
TO
NN
ES
Robertson Economic Information Services

MINING PRODUCTION PHOSPHATE ROCK
0
20 000
40 000
60 000
80 000
100 000
120 000
2001200220032004200520062007200820092010
TO
NN
ES
PE
R Y
EA
R
Robertson Economic Information Services

ASBESTOS PRODUCTION VOLUMES
0
20 000
40 000
60 000
80 000
100 000
120 000
140 000
160 000
180 000
199619971998199920002001200220032004200520062007200820092010
TO
NN
ES
Robertson Economic Information Services

MINING PRODUCTION IRON ORE
0
200 000
400 000
600 000
800 000
1 000 000
1 200 000
1 400 000
1 600 000
1 800 000
19781980198219841986198819901992199419961998200020022004200620082010
TO
NN
ES
Robertson Economic Information Services

MINING PRODUCTION IRON ORE
0
50 000
100 000
150 000
200 000
250 000
300 000
350 000
400 000
2001 2002 2003 2004 2005 2006 2007 2008 2009 2010
TO
NN
ES
Robertson Economic Information Services

ZISCO STEEL SALES
0
5 000
10 000
15 000
20 000
25 000
30 000
Jan Mar May Jul Sep Nov
Deformed Bars
Square Bars
Round Bars
Rods
Plough Beams
Fencing Standards
Window Section
Light Flats
Light Angles
Grader Blades
Plough Shares
Rails
Round Bars
Channels
Flats
Angles
Prime Billets
Pig Iron
2000FIRST MERCHANT BANK
TO
NN
ES
PER
MO
NTH

COMMODITY PRICESINDEX: DEC 2006=100
0
50
100
150
200
250
300
350CopperGoldNickelSilver
IND
EX
: D
ecem
ber
2006
=10
0
|| 2007 | 2008 | 2009 | 2010 | 2011 |

PLATINUM PRICES
0200400600800
1 0001 2001 4001 6001 8002 000
| Jan | Feb | Mar | Apr | May | Jun | Jul | Aug | Sep | Oct | Nov | Dec |
US
$ p
er O
un
ce
2011
2010
Robertson Economic Information Services
2012
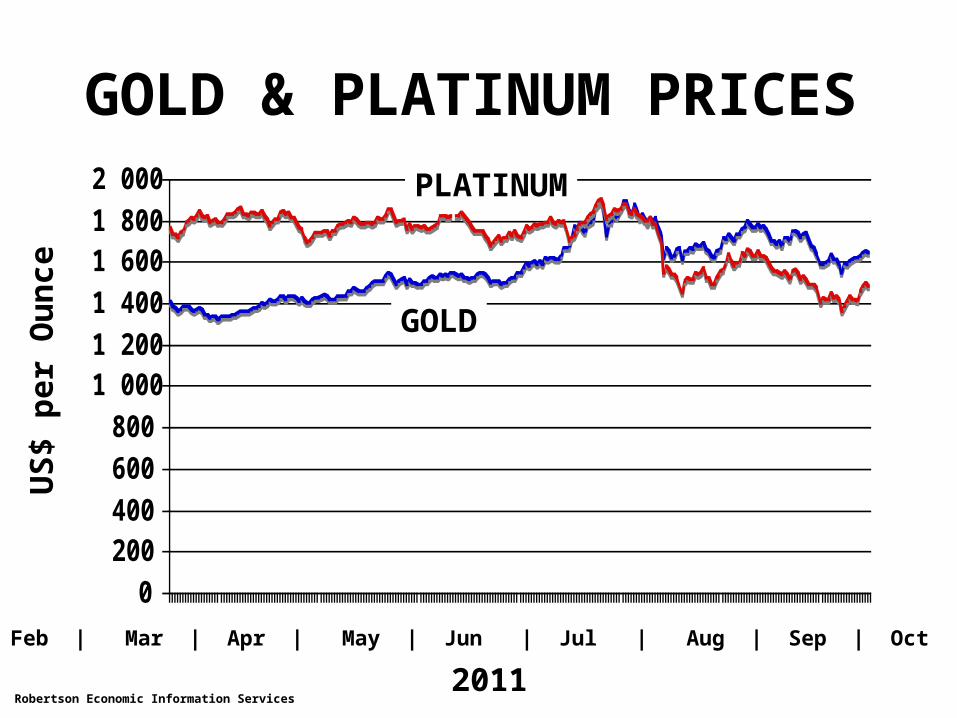
GOLD & PLATINUM PRICES
0200400600800
1 0001 2001 4001 6001 8002 000
| Jan | Feb | Mar | Apr | May | Jun | Jul | Aug | Sep | Oct | Nov | Dec |
US
$ p
er O
un
ce
PLATINUM
2011Robertson Economic Information Services
GOLD

PALLADIUM PRICES
0100200300400500600700800900
1 000
| Jan | Feb | Mar | Apr | May | Jun | Jul | Aug | Sep | Oct | Nov | Dec |
US
$ p
er O
un
ce
2011
2010
Robertson Economic Information Services

GOLD PRICES
0200400600800
1 0001 2001 4001 6001 8002 000
| Jan | Feb | Mar | Apr | May | Jun | Jul | Aug | Sep | Oct | Nov | Dec |
US
$ p
er O
un
ce
2011
2010
Robertson Economic Information Services
2012

MINING PRODUCTION VOLUMES
0
50 000
100 000
150 000
200 000
250 000
300 000
2001 2002 2003 2004
Asbestos
H/C Ferrochrome
Phosphate
TO
NN
ES
Robertson Economic Information Services
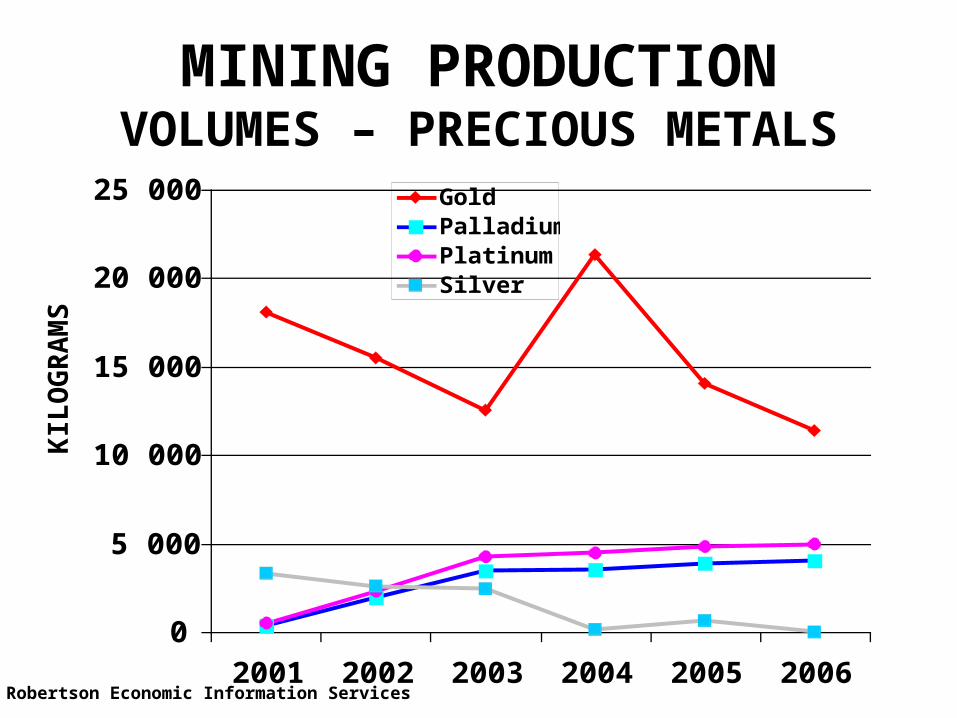
MINING PRODUCTION VOLUMES – PRECIOUS METALS
Robertson Economic Information Services
KIL
OG
RA
MS
0
5 000
10 000
15 000
20 000
25 000
2001 2002 2003 2004 2005 2006
GoldPalladiumPlatinumSilver

RESOURCE CONVERSION: Sales Revenue becomes Payments for Goods and Services needed to extract Minerals. Profits are made only if Revenue
from the Mineral Sales exceeds Costs
0
20
40
60
80
100
120
Payments ofwages and
salaries
Payments to
local
suppliers
Payments for
local
infrastructure Payments to
build housing Payments to
providetraining
Payment of
rents and feesto landowners Payments tocompensatelandowners Payment of
taxes to local
bodies
Payments for
health &educationservices
Payment ofroyalties
COSTS AFTER VERY LARGE CAPITAL OUTLAY

RESOURCE CONVERSION: Sales Revenue becomes Payments for Goods and Services needed to extract Minerals. Profits are made only if Revenue
from the Mineral Sales exceeds Costs
0
20
40
60
80
100
120
Payments ofwages and
salaries
Payments to
local
suppliers
Payments for
local
infrastructure Payments to
build housing Payments to
providetraining
Payment of
rents and feesto landowners Payments tocompensatelandowners Payment of
taxes to local
bodies
Payments for
health &educationservices
Payment ofroyalties
COSTS AFTER VERY LARGE CAPITAL OUTLAYARE INCREASED BY ADDITION OF ROYALTIES

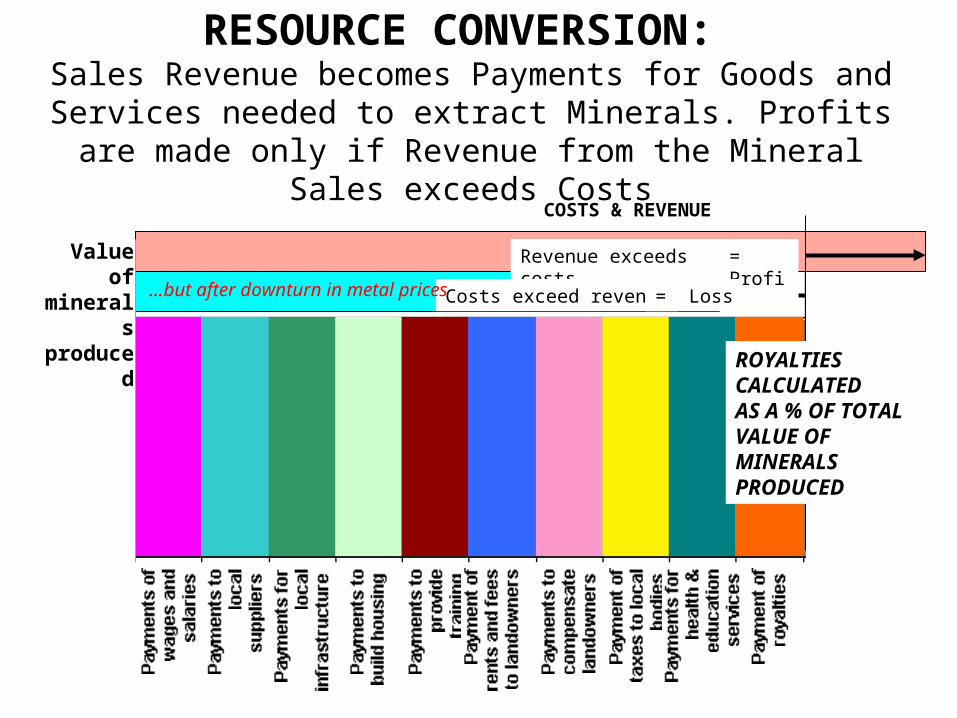
RESOURCE CONVERSION: Sales Revenue becomes Payments for Goods and Services needed to extract Minerals. Profits are made only if Revenue
from the Mineral Sales exceeds Costs
0
20
40
60
80
100
120
Payments ofwages and
salaries
Payments to
local
suppliers
Payments for
local
infrastructure Payments to
build housing Payments to
providetraining
Payment of
rents and feesto landowners Payments tocompensatelandowners Payment of
taxes to local
bodies
Payments for
health &educationservices
Payment ofroyalties
Revenue exceeds costs = Profit
COSTS & REVENUEValue of mineral
s produce
d
ROYALTIESCALCULATEDAS A % OF TOTALVALUE OFMINERALS PRODUCED
RESOURCE CONVERSION: Sales Revenue becomes Payments for Goods and Services needed to extract Minerals. Profits are made only if Revenue
from the Mineral Sales exceeds Costs
0
20
40
60
80
100
120
Payments ofwages and
salaries
Payments to
local
suppliers
Payments for
local
infrastructure Payments to
build housing Payments to
providetraining
Payment of
rents and feesto landowners Payments tocompensatelandowners Payment of
taxes to local
bodies
Payments for
health &educationservices
Payment ofroyalties
Revenue exceeds costs
Costs exceed revenue
= Profit
= Loss
COSTS & REVENUE
Value of mineral
s produce
d ROYALTIESCALCULATEDAS A % OF TOTALVALUE OFMINERALS PRODUCED
…but after downturn in metal prices

RESOURCE CONVERSION: Sales Revenue becomes Payments for Goods and Services needed to extract Minerals. Profits are made only if Revenue
from the Mineral Sales exceeds Costs
0
20
40
60
80
100
120
Payments ofwages and
salaries
Payments to
local
suppliers
Payments for
local
infrastructure Payments to
build housing Payments to
providetraining
Payment of
rents and feesto landowners Payments tocompensatelandowners Payment of
taxes to local
bodies
Payments for
health &educationservices
Payment ofroyalties
Revenue exceeds costs
Costs exceed revenue Loss
COSTS & REVENUE
Value of mineral
s produce
d
= Profit
Mining company’s entire
investment
is to earn this profit

RESOURCE CONVERSION: Sales Revenue becomes Payments for Goods and Services needed to extract Minerals. Profits are made only if Revenue
from the Mineral Sales exceeds Costs
0
20
40
60
80
100
120
Payments ofwages and
salaries
Payments to
local
suppliers
Payments for
local
infrastructure Payments to
build housing Payments to
providetraining
Payment of
rents and feesto landowners Payments tocompensatelandowners Payment of
taxes to local
bodies
Payments for
health &educationservices
Payment ofroyalties
Doubling ofroyalties
Revenue exceeds costs
Costs exceed revenue
Profit
Loss
COSTS & REVENUE
Value of mineral
s produce
d
…but after downturn in metal prices

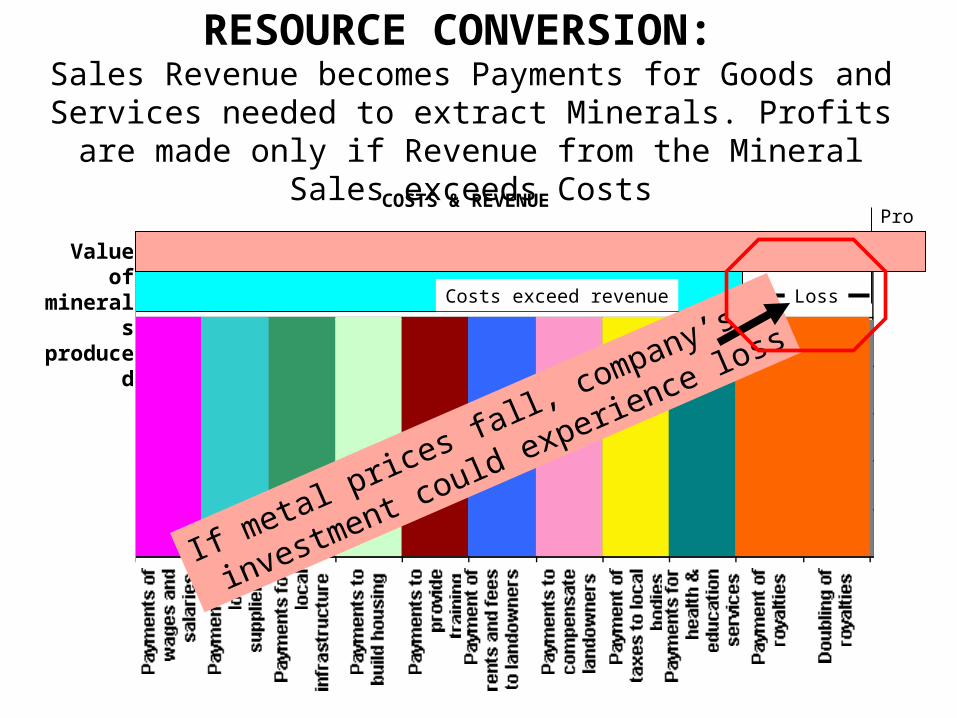
RESOURCE CONVERSION: Sales Revenue becomes Payments for Goods and Services needed to extract Minerals. Profits are made only if Revenue
from the Mineral Sales exceeds Costs
0
20
40
60
80
100
120
Payments ofwages and
salaries
Payments to
local
suppliers
Payments for
local
infrastructure Payments to
build housing Payments to
providetraining
Payment of
rents and feesto landowners Payments tocompensatelandowners Payment of
taxes to local
bodies
Payments for
health &educationservices
Payment ofroyalties
Doubling ofroyalties
Revenue exceeds costs
Costs exceed revenue
Profit
Loss
COSTS & REVENUE
Value of mineral
s produce
d
This profit not be sufficient to justify
the mining company’s investment
…but after downturn in metal prices
RESOURCE CONVERSION: Sales Revenue becomes Payments for Goods and Services needed to extract Minerals. Profits are made only if Revenue
from the Mineral Sales exceeds Costs
0
20
40
60
80
100
120
Payments ofwages and
salaries
Payments to
local
suppliers
Payments for
local
infrastructure Payments to
build housing Payments to
providetraining
Payment of
rents and feesto landowners Payments tocompensatelandowners Payment of
taxes to local
bodies
Payments for
health &educationservices
Payment ofroyalties
Doubling ofroyalties
Revenue exceeds costs
Costs exceed revenue
Profit
Loss
COSTS & REVENUE
Value of mineral
s produce
d
If metal prices fall, c
ompany’s
investment could experience loss

DIAMOND REVENUES 2011US$122 256 491
| Jan | Feb | Mar | Apr | May | Jun | Jul | Aug | Sep | Oct | Nov | Dec |
US
$’00
0


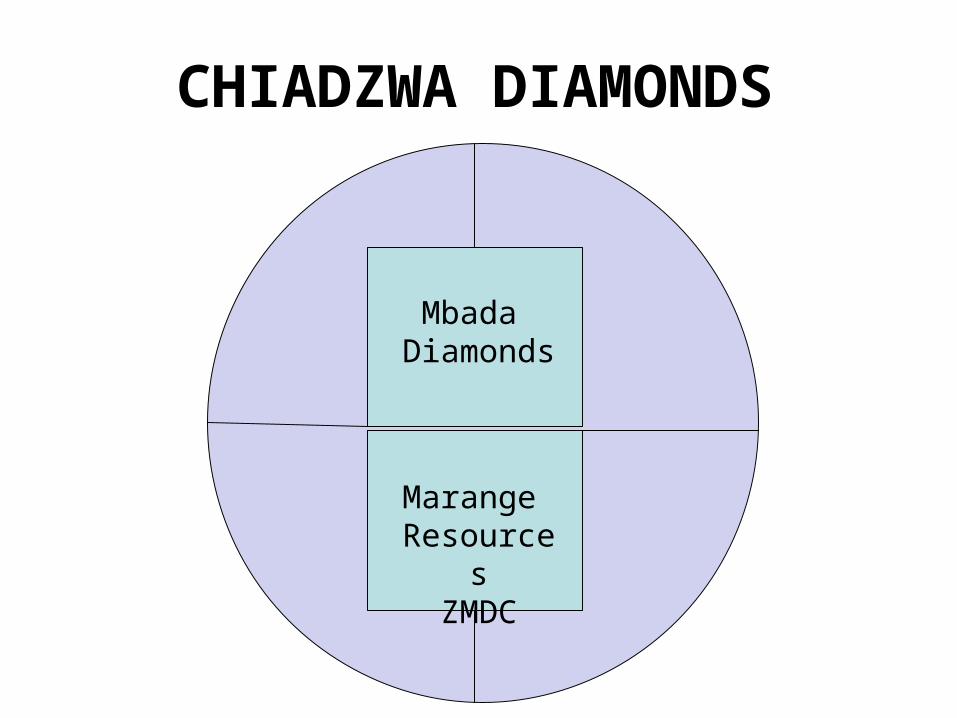
CHIADZWA DIAMONDS
Afri
can
Con
solid
ated
Res
ourc
es C
laim

CHIADZWA DIAMONDS
Mbada Diamonds
MarangeResources
Marange Resources
ZMDC
CHIADZWA DIAMONDS
Mbada Diamonds
MarangeResources
Marange Resources
ZMDC

CHIADZWA DIAMONDS
Mbada Diamonds
MarangeResources
Marange Resources
ZMDC
CIO
PRISONS
ANJIN
ARMY
POLICE

CHIADZWA DIAMONDS
Mbada Diamonds
US$600mm
MarangeResources
Marange Resources
ZMDC
CIO
PRISONS
ANJIN
ARMY
POLICE

CHIADZWA DIAMONDS
Mbada Diamonds
US$600mm
MarangeResources
Marange Resources
ZMDC
CIO
PRISONS
ANJIN
ARMY
POLICE

MINING STATISTICSJan to Aug 2011
MineralVolume Value Volume Value Volume Value
Chrome 398 755,38 47 993 098,28 341 056,10 35 759 114,14 16,92 34,21Coal 1 240 656,00 48 491 369,00 1 137 725,00 41 227 034,00 9,05 17,62Cobalt 107,73 2 068 191,27 37,11 448 315,16 190,25 361,33Copper 4 205,35 29 370 658,71 3 097,04 18 398 070,00 35,79 59,64Gold 7 839,32 378 048 780,93 5 768,1323 215 347 366,30 35,91 75,55Graphite 1 615,00 753 413,00 741,00 271 893,00 117,95 177,10HC Ferrochrome 104 775,48 102 402 206,00 94 575,57 79 199 623,83 10,78 29,30Iridium 262,59 4 811 642,48 169,62 1 583 007,00 54,81 203,96Iron Pyrite 8 248,91 982 156,00Magnesite 169,28 29 776,00Nickel 5 086,32 103 429 673,55 4 099,22 71 672 919,00 24,08 44,31Paladium 5 457,30 120 043 260,59 4 606,16 61 753 589,00 18,48 94,39Phosphate 28 520,00 3 051 250,44 38 153,00 4 100 890,73 -25,25 -25,60Platinum 7 005,48 354 115 581,75 5 750,10 268 770 476,00 21,83 31,75Rhodium 614,95 36 605 599,80 479,17 34 347 174,00 28,34 6,58Rhuthenium 549,35 2 335 358,45 369,39 1 394 278,00 48,72 67,50
Value Total 1 234 532 016,25 853 020 543,18 44,72
PERCENTAGE CHANGE
FIRST 8 MONTHS 2011 FIRST 8 MONTHS 2010 FIRST 8 MONTHS 2011/2010