gold nanoparticles and their polymer composites: synthesis
TRANSCRIPT

University of South Florida University of South Florida
Digital Commons @ University of South Florida Digital Commons @ University of South Florida
Graduate Theses and Dissertations Graduate School
6-30-2010
Gold Nanoparticles and Their Polymer Composites: Synthesis Gold Nanoparticles and Their Polymer Composites: Synthesis
Characterization and Applications Characterization and Applications
Nidhi Joshi University of South Florida
Follow this and additional works at: https://digitalcommons.usf.edu/etd
Part of the American Studies Commons, and the Mechanical Engineering Commons
Scholar Commons Citation Scholar Commons Citation Joshi, Nidhi, "Gold Nanoparticles and Their Polymer Composites: Synthesis Characterization and Applications" (2010). Graduate Theses and Dissertations. https://digitalcommons.usf.edu/etd/3516
This Thesis is brought to you for free and open access by the Graduate School at Digital Commons @ University of South Florida. It has been accepted for inclusion in Graduate Theses and Dissertations by an authorized administrator of Digital Commons @ University of South Florida. For more information, please contact [email protected].

Gold Nanoparticles and Their Polymer Composites: Synthesis Characterization and
Applications
by
Nidhi Joshi
A thesis submitted in partial fulfillment
of the requirements for the degree of
Master of Science
Department of Mechanical Engineering
College of Engineering
University of South Florida
Major Professor: Ashok Kumar, Ph.D.
John Wolan, Ph.D.
Garrett Matthews, Ph.D.
Date of Approval:
June 30, 2010
Keywords: Nanotechnology, Surface Plasmon Resonance, Biosensors, RSV, Catalyst
Copyright © 2010, Nidhi Joshi

Dedication
My son Manas. You are my life
My husband Rakesh. For always being there for me and supporting me throughout.

Acknowledgments
I feel very fortunate to have had Professor Ashok Kumar as my thesis supervisor. He
introduced me to this fascinating area of nanoparticle research. His guidance, support and
encouragement through the course of my research have made it one of my most treasured
experiences. I would also like to thank my committee members Dr. Johan Wolan and Dr.
Garrett Mathews for their invaluable suggestions and support.
I want to thank Dr. Subbiah Alwarappan and Dr. M. K. Ram for their help in
electrochemistry related experiments. My sincere thanks are due to Dr. Yusuf for TEM
experiments. I also thank Mr. Sung for help related to SERS experiments. I want to thank
Seyhan and Dr. Shree Ram Singh for RSV related experiments.
Words fail to express my gratitude towards my Parents for teaching me that hard work is
the only key to success. I cannot forget to thank Somu and Ashu for their love and
support. I greatly acknowledge the moral support and strength I received from my
parent’s in-laws and family members. I am indebted to my father in law Dr. T. D. Joshi
for encouraging me to build my career in the field of research.
I offer my regards to all my lab mates and friends who supported me in any respect
during the completion of the project. My special thanks are due to Supriya and Makhan.
This work is financially supported by the national science foundation grant
CREST#0734232

i
Table of Contents
List of Tables ..................................................................................................................... iii
List of Figures .................................................................................................................... iv
Abstract ............................................................................................................................. vii
Chapter 1: Introduction ........................................................................................................1
1.1 Metal Nanoparticles ...........................................................................................1
1.2 Gold Nanoparticles ............................................................................................1
1.3 Optical Properties of Gold Nanoparticles ..........................................................3
1.3.1 Surface Plasmon Resonance ...............................................................3
1.4 Composites of Polymer-Gold Nanoparticles. ....................................................6
Chapter 2: Experimental Methods .......................................................................................8
2.1 Introduction .......................................................................................................8
2.2 Materials ............................................................................................................8
2.3 Synthesis of Gold Nanoparticles (GNPs) ..........................................................8
2.3.1 Citrate Reduction Method ...................................................................8
2.3.2 Bio-Compatible Gold Nanoparticles...................................................9
2.3.3 Synthesis of GNPs Stabilized with Poly Vinyl Pyrollidone ...............9
2.4 Synthesis of Composites of Polymer-Gold Nanoparticles...............................10
2.5 Characterization Techniques ............................................................................11
2.5.1 UV-vis Spectrophotometer ...............................................................11
2.5.2 Transmission Electron Microscopy ..................................................13
2.5.3 Fourier Transform Infrared Spectroscopy ........................................15
2.5.4 Atomic Force Microscopy ................................................................16
2.5.5 Surface Enhanced Raman Spectroscopy ...........................................19
2.5.6 Electrochemical Voltammetry ..........................................................19
2.5.6.1 Cyclic Voltammetry ...........................................................20
Chapter 3: Structural and Optical Properties of Gold Nanoparticles .................................25
3.1 Introduction ......................................................................................................25
3.2 Characterization of Au Nanoparticles ..............................................................25

ii
3.2.1. Absorption Spectroscopy .................................................................25
3.2.2 Morphology Analysis of GNPs (TEM).............................................30
3.2.3 SERS ................................................................................................36
3.2.4 Atomic Force Microscopy ................................................................39
3.2.5 Electrochemical Characterization of GNPs ......................................40
3.3 Characterization of Gold-Polymer Composites ...............................................41
3.4 Electrochemical Characterization of GNPs-POAS ..........................................45
Chapter 4: Applications of GNPs ......................................................................................49
4.1 Introduction ......................................................................................................49
4.2 RSV Inhibition by GNPs ................................................................................ 49
4.2.1 Cells and Virus ..................................................................................49
4.2.2 Preparation of GNPs and RSV Mixture ............................................50
4.2.3 RSV Inhibition Experiment ..............................................................50
4.3 Biosensing Applications of the GNPs..............................................................54
4.3.1 Detection of Neurotransmitters such as Dopamine, Ascorbic
Acid ...................................................................................................55
4.3.1.1 Importance of Monitoring Neurotransmitters ....................56
4.4 Analysis of GNPs-BSA Pair ............................................................................60
4.5 Catalytic Application of Chemically Synthesized GNPs .................................64
4.5.1 Au Decoration on ZnO Nanowires ...................................................64
Chapter 5: Conclusions ......................................................................................................70
Chapter 6: Future Work .....................................................................................................72
References ..........................................................................................................................73
About the Author ................................................................................................... End Page

iii
List of Tables
Table 3.1 Gold Nanoparticles: Synthetic and Characterizing Parameters .........................36
iv
List of Figures
Figure 1.1 Surface Plasmon Resonance of Metal Nanoparticles .........................................4
Figure 1.2 Schematic of the Overlapping of Energy Bands in Metal ..................................5
Figure 1.3 Schematic Representations of POAS in Emeraldine Base .................................7
Figure 2.1 Schematic of the Chemical Assembly for Nanoparticles Synthesis .................10
Figure 2.2 Schematic of the Oxidative Polymerization .....................................................11
Figure 2.3 UV-vis Spectrophotometer Set Up in USF ......................................................13
Figure 2.4 Optical Components in TEM............................................................................14
Figure 2.5 Schematic of Transmission Electron Microscopy in USF ...............................15
Figure 2.6 FTIR. ................................................................................................................16
Figure 2.7 Schematic of the Modes of Operation in AFM ................................................18
Figure 2.8 Schematic of Sample Geometry for Nanoparticle Based SERS ......................19
Figure 2.9 Typical Triangular Wave Form Applied to the Working Electrode .................21
Figure 2.10 A Typical Cyclic Voltammogram of One Electron Transfer .........................23
Figure 2.11 Typical Cyclic Voltammogram of Two Electron Transfer ............................24
Figure 3.1 Absorption Spectrum of the Gold Nanoparticles .............................................26
Figure 3.2 UV-Visible Absorption Spectrum of the Gold Nanoparticles
Synthesized by Citrate Reduction Method ......................................................27
Figure 3.3 Images of Gold Nanoparticle Solutions ...........................................................28
Figure 3.4 Absorption Spectra of Gold Nanoparticles (~527 nm, 550 nm and 574
nm.) .................................................................................................................29

v
Figure 3.5 UV-vis Spectra of Bio-Compatible Gold Nanoparticles ..................................30
Figure 3.6 TEM Images of the Gold Nanoparticles (Boot Shaped) ..................................31
Figure 3.7 TEM Images of GNPs (~5 nm-7 nm) ...............................................................32
Figure 3.8 TEM Images of GNPs (~10 nm) ..................................................................... 32
Figure 3.9 TEM Images of GNPs (~20 nm) ......................................................................33
Figure 3.10 TEM Images of GNPs (~20 nm-30 nm) .........................................................33
Figure 3.11 TEM Images of GNPs Nanocubes (~200 nm) ...............................................34
Figure 3.12 TEM Images of GNPs (Nanotriangles, Octagons~50 nm-60 nm) .................34
Figure 3.13 TEM Images of GNPs (Cubes, Pentagon ~ 100 nm) .....................................35
Figure 3.14 TEM Image GNPs (~10 nm-20 nm) ...............................................................35
Figure 3.15 SERS of 5 nm Gold Nanoparticles .................................................................37
Figure 3.16 SERS of 10 nm Gold Nanoparticles ...............................................................38
Figure 3.17 AFM Images of Gold Nanoparticles ..............................................................39
Figure 3.18 C.V of GNPs 20 nm.E|V vs. Ag|AgCl in [Ru (NH3)6]3+/2+
.............................41
Figure 3.19 C.V of GNPs 20 nm.E|V vs. Ag|AgCl in [K4Fe(CN6)]3-/4-
.............................41
Figure 3.20 UV-vis Spectra of POAS ................................................................................42
Figure 3.21 UV-vis Spectra of Composites POAS- GNPs ................................................43
Figure 3.22 TEM Images, (a) POAS, (b) POAS-GNPs .....................................................44
Figure 3.23 FTIR of (a) GNPs, (b) POAS, (c) POAS-GNPs .............................................45
Figure 3.24 CV of POAS in Three Electrode System in 0.1M HCL .................................46
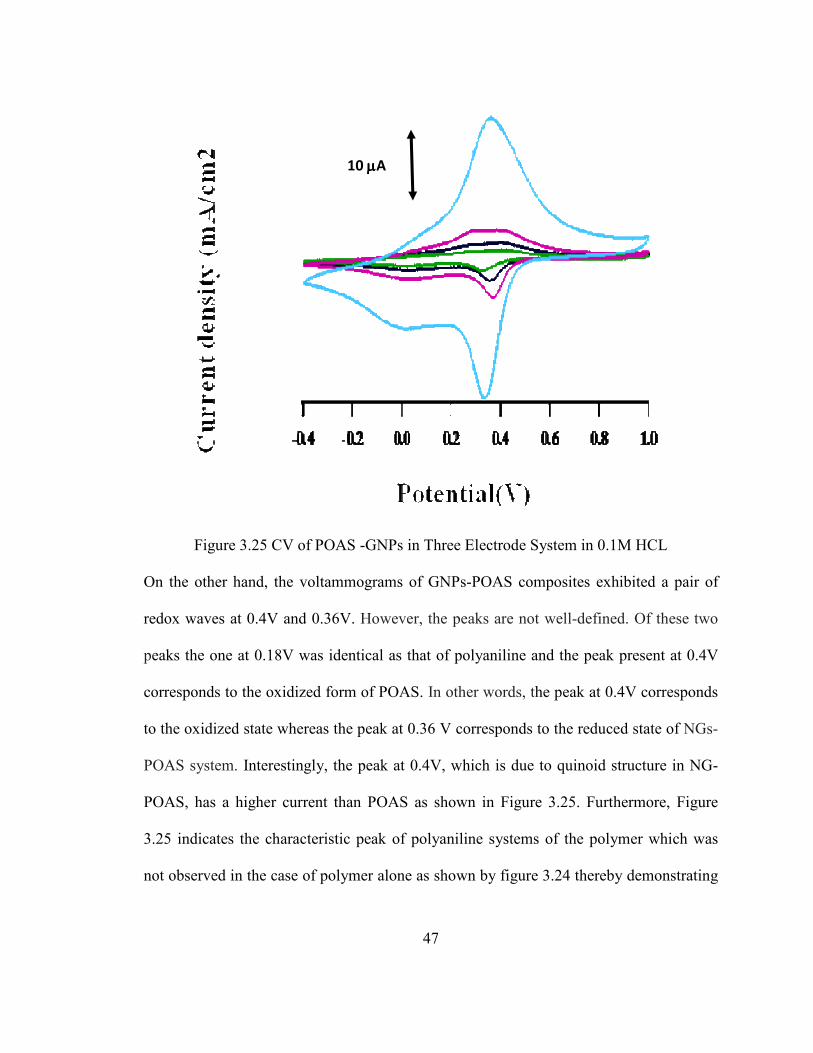
Figure 3.25 CV of POAS -GNPs in Three Electrode System in 0.1M HCL .....................47
Figure 4.1 Schematic of RSV Inhibition Experiment ........................................................51
Figure 4.2 RSV Inhibition by Immunofluorescence Cells Infected with RSV..................52
vi
Figure 4.3 Cells Infected with RSV Mixed GNPs (5µl/ml) ..............................................52
Figure 4.4 Cells Infected with RSV Mixed with GNPs (50µl/ml) ....................................53
Figure 4.5 Cells Infected with RSV Mixed with GNPs (100µl/ml) ..................................53
Figure 4.6 Cells Infected with RSV Mixed with GNPs (200µl/ml) ..................................54
Figure 4.7 Structures of Dopamine and Ascorbic Acid .....................................................55
Figure 4.8 Cyclic Voltammogram of Dopamine in PBS ...................................................58
Figure 4.9 Scan Rate/Current Density Plot of Dopamine ..................................................59
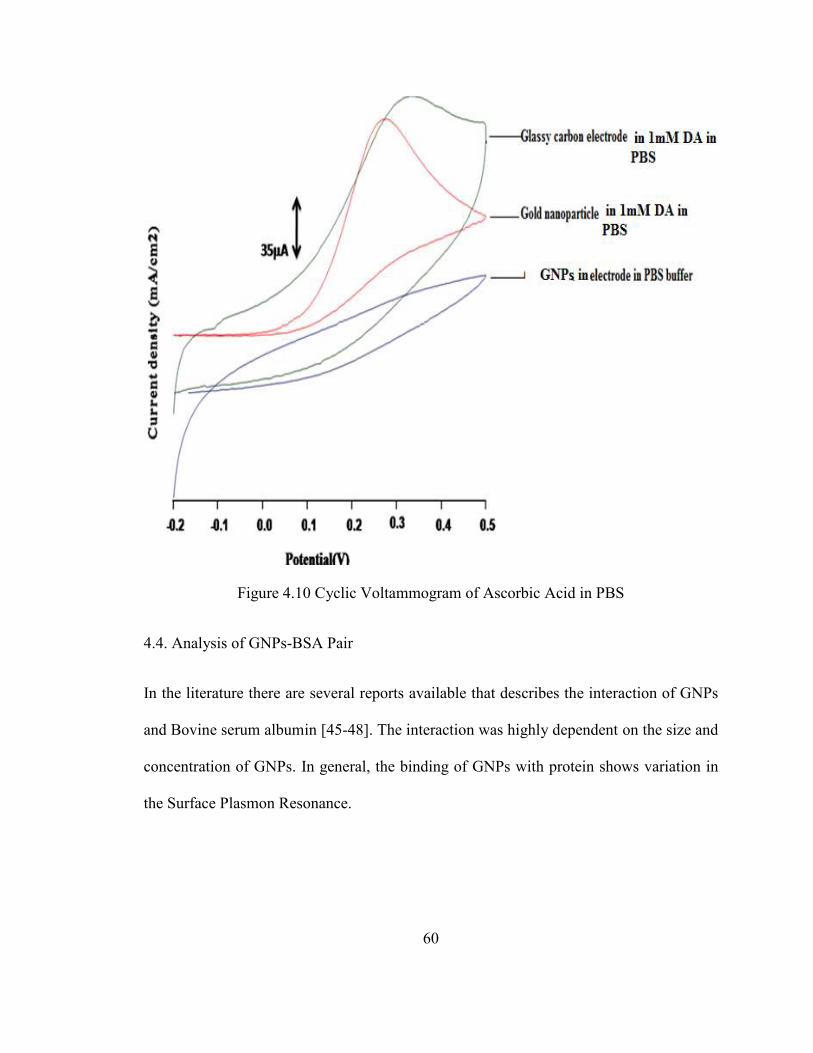
Figure 4.10 Cyclic Voltammogram of Ascorbic Acid in PBS...........................................60
Figure 4.11 UV-vis Spectra of GNPs and GNPs-BSA (1~10 nm), (2~30 nm) .................61
Figure 4.12 (a) TEM of GNPs (~10 nm) .......................................................................... 62
Figure 4.12 (b) TEM of GNPs –BSA Complex (GNPs~10 nm) .......................................62
Figure 4.13 (a) TEM of GNPs (~35-40 nm) ......................................................................63
Figure 4.13 (b) TEM of GNPs-BSA (~35- 40 nm) ............................................................63
Figure 4.14 (a) TEM Image of GNPs, (b) SEM of ZnO Nanowire-GNPs ........................65
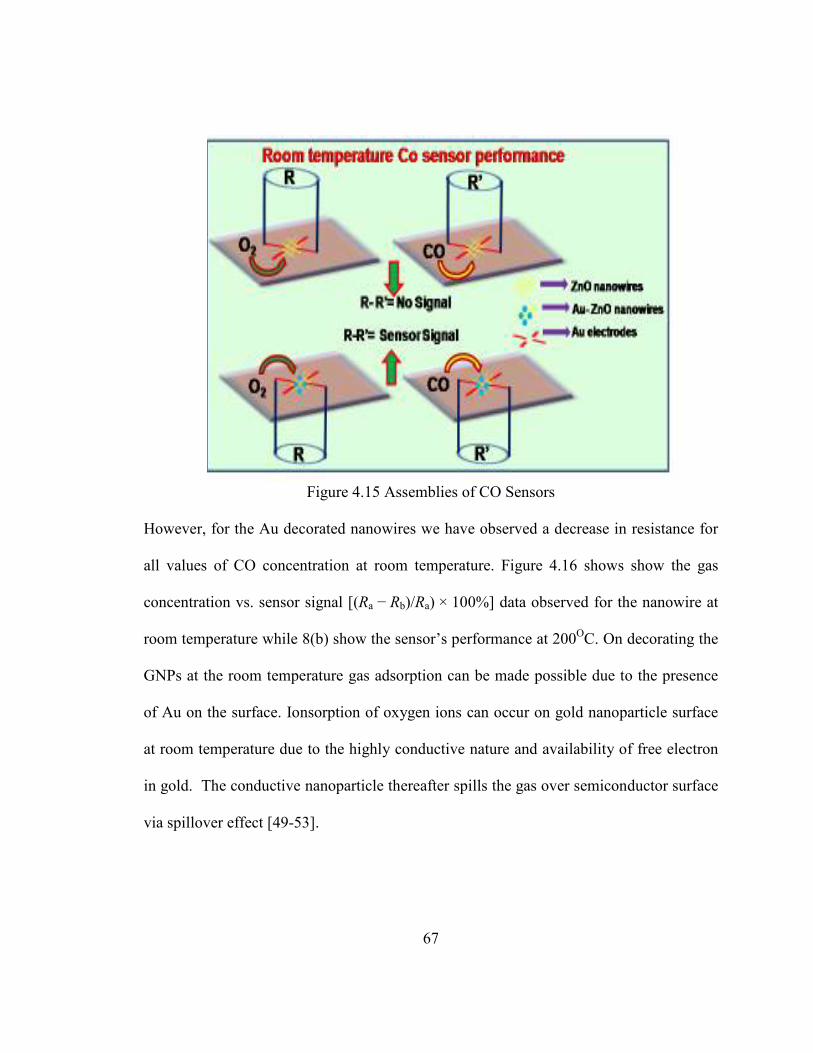
Figure 4.15 Assemblies of CO Sensors .............................................................................67
Figure 4.16 Variation of Gas Sensor Signal with CO Gas Concentration for ZnO
and Au -ZnO Nanowires at (a) Room Temperature and (b) 200 OC ...........68

vii
Gold Nanoparticles and Their Polymer Composites: Synthesis, Characterization and
Applications
Nidhi Joshi
Abstract
Gold nanoparticles are excellent candidates for all the biomedical applications due to
their size and shape dependent optical and physiological properties. In this study, gold
nanoparticles were synthesized chemically for bio-application. It was observed that the
size and shape of gold nanoparticles depend strongly on the concentration of chemical
solution, type of reducing agent used in the reaction, temperature of the solution and
stabilizing agent for reaction. Transmission electron microscopy (TEM) has been used
extensively to determine the size and shape of the gold nanoparticles. Optical properties
of the size and shape selected nanoparticles were studied using UV-vis
spectrophotometer in absorption mode. The chemically synthesized gold nanoparticles
were observed to show excellent absorption property which is reflected by the presence
of the characteristic surface plasmon resonance (SPR) band peak. The SPR peak was
found to be predominantly dependent on the size of nanoparticles. We have observed a
strong red shift with increasing the size of gold nanoparticles. The position of the SPR
peak was also observed to change with shape of gold nanostructures.
Synthesis and characterization of the composites of gold nanoparticles and Poly (O-
anisidine) (POAS) have been carried out in this thesis. Gold-POAS materials system was

viii
characterized using UV-vis spectroscopy, TEM, Fourier Transform Infrared
Spectroscopy.
The chemically synthesized gold nanoparticles were successfully utilized for the study of
Respiratory Syncycial Virus (RSV) interaction. Gold nanoparticles were found to inhibit
the RSV infection. The electrochemical behavior of gold nanoparticles was studied and
their potentials for biosensing applications were tested. Cyclic voltaammetry was
performed for the detection of dopamine and ascorbic acid using gold nanoparticles of
different sizes. Interaction of gold nanoparticles with Bovine Serum Albumin (BSA) has
been studied via absorption spectroscopy and TEM measurements. The absorption
spectra of the GNP-BSA show remarkable shift in SPR band peak towards high
wavelength. Catalytic properties of the gold nanoparticles were studied by using them as
a catalytic activator for the gas sensing applications.

1
Chapter 1: Introduction
1.1 Metal Nanoparticles
Materials such as multifunctional supermolecules, carbon nanotubes, graphene, and metal
nanoparticles have been synthesized and employed routinely as basic building block for
several electronic and optical devices. Integration of nanoscale building blocks such as
nanoparticles, nanorods and nanotubes into functional assemblies and further into
multifunctional devices can be achieved via nanotechnology for several applications.
Further, the properties of nanomaterials depend on its shape and size. In particular, metal
nanoparticles are very interesting nanoscale materials with an ease of synthesis and
modification. The advantages of metal nanoparticles over other material include its strong
optical and electronic properties [1-7]. The dimensions of the nanoparticles vary between
1 nm to 100 nm and these nanoparticles behave like a whole unit in terms of their
properties and transport phenomenon. Furthermore, the properties of nanoparticles are
very different than the bulk materials, thereby; nanoparticles are suitable candidates for
various biomedical applications.
1.2 Gold Nanoparticles
Of the various metal nanoparticles reported in the literature [1-7], gold is the promising
candidate due to its excellent surface properties that can be exploited in biotechnological,

2
optical and electrochemical applications. The advantages of the gold nanoparticles
include non-toxicity, strong scattering length, bio-conjugation and long-term stability.
These characteristics are essential for a stable and sensitive biosensing platform. Gold
nanoparticles offer excellent optical properties and exhibit a spectral shift upon varying
their size and shape. Gold nanoparticles exhibits a characteristic absorption peak at 525
nm and this peak will shift towards the higher wavelength region by tuning the size and
shape of the nanoparticles. Optical properties of the Au nanoparticles can be varied by
controlling their size and also by modifying their surface characteristics. The size and the
surface characteristics are related to the surface to volume ratio.
The electron transfer or the conductive behavior of the metal nanoparticles has been
studied recently within the context of reduced electronic device size features to the
nanoscale level. Unlike bulk materials, the conductivity is not based on the band structure
but shows single electron tunneling through discrete energy level. Gold is often
considered as a suitable material for electronic devices, because, gold nanoparticles can
be synthesized with diameters ranging between 2 nm and 100 nm. On the other hand, the
highly reactive surface of the gold can be very easily modified with polymers, silicates
and biomolecules. As a result, gold nanoparticles are widely employed as a platform to
design a stable and sensitive biosensor.
In this work, we have synthesized gold nanoparticles of various size and shape by
different techniques such as sodium citrate reduction method, anisotropic synthesis by
using PVP and biocompatible gold nanoparticles. Following this, we have then evaluated
the interaction of gold nanoparticles with biomolecules

3
1.3 Optical Properties of Gold Nanoparticles
1.3.1 Surface Plasmon Resonance
Surface Plasmon Resonance (SPR) is an optical phenomenon caused by the interaction of
the surface Plasmon with the incident electromagnetic radiation at a resonant frequency.
Metals exhibit plasmon effect because they have a high density of free electrons. The
sensitivity of the plasmon depends on particle size, shape, the refractive index of the
medium and the dielectric constants of the metal. For several metals the plasmon energy
can be correlated to the ultraviolet photon energy. The excitation of surface plasmon by
light is sometimes denoted as a localized surface plasmon resonance (LSPR) for the
nanoscale metallic systems. The SPR is responsible for the bright red color of gold
nanoparticles in the visible region of the electromegnatic pectrum. The SPR spectrum of
the gold nanoparticles comprises of absorption and scattering of photons which depends
on the size, shape and the surrounding environment. In metal nanoparticles, the surface
polarization occurs due to the local field effect around the particles which cause the
modification in their dielectric function. The response of the nanoparticles present in the
medium can be described by Maxwell-Garnett dielectric function as follows;
(1)
In equation (1), is the dielectric function of metal and represent the density of
particles. For resonance to occur the condition should be εm=-2ℜe (ε0) as shown in figure
1.1 [8].

4
Figure 1.1 Surface Plasmon Resonance of Metal Nanoparticles
The SPR is very important to study the optical properties of gold nanoparticles.The
characteristic SPR peak of gold nanoparticle occur between 525 nm and 530 nm.
However, a shift in the SPR peak towards the higher wavelength region occurs with
change in their shape from nanoparticle to nanorods. Furthermore, SPR is also widely
employed to study the interaction of gold nanoparticles with biomolecules. The mobility
of electrons in the presence of an electric field depends on the band gap of the material.
In the case of a metal, the valence band and the conduction band overlap and the excited
electron participate in the presence of an electric field as shown in Figure 1.2 [9].

5
Figure 1.2 Schematic of the Overlapping of Energy Bands in Metal.
Figure 1.2(b) represents the Fermi level. Energy bands are empty at absolute zero
temperature. The excitation of an electron from valence band to conduction band occurs
(a)
(b)
6
by the absorption of all the wavelengths of incident light by metal surface. Most of the
incident light is immediately re-emitted at the surface, creating the metallic cluster as
seen in gold, silver, and copper.
1.4 Composites of Polymer-Gold Nanoparticles
Recently, the applications of gold nanoparticles have been investigated extensively.
Studies on conducting organic polymer material are gaining much attention in the area of
sensors and molecular electronics [10-13] as described by Valter et al. [10], polyaniline,
polypyrrole and polythiophene together with fullerenes are promising candidates for
conducting organic polymers. According to Balazs et al. [14], the composites of polymers
and the nanoparticles offer new opportunities for engineering flexible materials that
display advantages in electrical, optical and mechanical properties. Of all available
conducting polymers, Poly (o-anisidine) (POAS) and Polyaninline (PANI) has numerous
applications in electronics, optical devices, biosensors and corrosion protection. The
structure of the POAS is shown in figure 1.3. The structural, optical and electrochemical
properties of this composite material of GNPs-POAS were studied by UV-Vis
spectroscopy, TEM and Cyclic voltammetry.

7
Figure 1.3 Schematic Representations of POAS in Emeraldine Base

8
Chapter 2: Experimental Methods
2.1 Introduction
The focus of this chapter is on the experimental approach and characterization techniques
employed in this study. In this work, we have employed a chemical route for the
synthesis of gold nanoparticles. In addition, we have also utilized various procedures for
the shape selective nanoparticle synthesis and GNPs-POAS synthesis.
2.2 Materials
Hydroauric acid (HAuCl4.3H2O), sodium citrate, PVP (poly vinyl pyrolidone) and L-
glutamic acid, Bovine Serum Albumin (BSA), Chitosan, N-methyl aniline, Chloroform,
and Ammonium persulphate were all purchased from Sigma Aldrich(USA).
2.3 Synthesis of Gold Nanoparticles (GNPs)
In the literature, there are several methods available for the synthesis of gold
nanoparticles [15-27]. However, in this work, we have employed only a few methods to
synthesize the gold nanoparticles and are discussed below.
2.3.1 Citrate Reduction Method
This method involves the reduction of 0.01 M hydroauric acid (HAuCl4) by citrate buffer.
Briefly, 0.01 M HAuCl4 (5mL) was mixed with DI water (100mL) and boiled.

9
Following this, 200 mg sodium citrate solution was added to the reaction mixture with
constant stirring. The formation of gold nanoparticles will be complete when the color of
the solution becomes wine red from its initial yellow color. The solution was further
heated for additional 10 minutes.
2.3.2 Bio-Compatible Gold Nanoparticles
Biocompatible GNPs were synthesized using Chitosan as follows; initially, the GNPs
were synthesized by the reduction of hydroauric acid (HAuCl4) in L-glutamic acid.
Briefly 0.01 M HAuCl4 (5mL) is dissolved DI water (50mL) and heated until it boils.
Later, 10mL of 25mM L-glutamic acid is added to the reaction mixture with constant
stirring. A color transition from yellow to red indicates the formation of gold
nanoparticles. Following this, the solution was kept at room temperature. Next, 5mL of
1.0% chitosan was added to 20 ml of the gold solution with stirring and as a result the
solution displayed a visible change in its color following chitosan addition.
2.3.3 Synthesis of GNPs Stabilized with Poly Vinyl Pyrollidone
In this method, we employ Poly-Vinyl-Pyrollidone (PVP) as a stabilizing agent for the
GNP synthesis due to its excellent adsorption properties [16]. Gold nanoparticles in
different shapes such as triangle, rectangle, pentagon and cubes can be synthesized using
PVP. To achieve this, 1.0g of PVP was dissolved in 60mL of DI water and the solution
was boiled. Later, 5mL of sodium citrate solution (prepared by mixing 647mg in 250mL
of DI water) was added to the PVP solution in a hot plate and allowed to remain in the

10
hot plate for 10 min. Following this, HAuCl4 (2.0 mL) was added to the solution with
constant stirring.
Figure 2.1 Schematic of the Chemical Assembly for Nanoparticles Synthesis
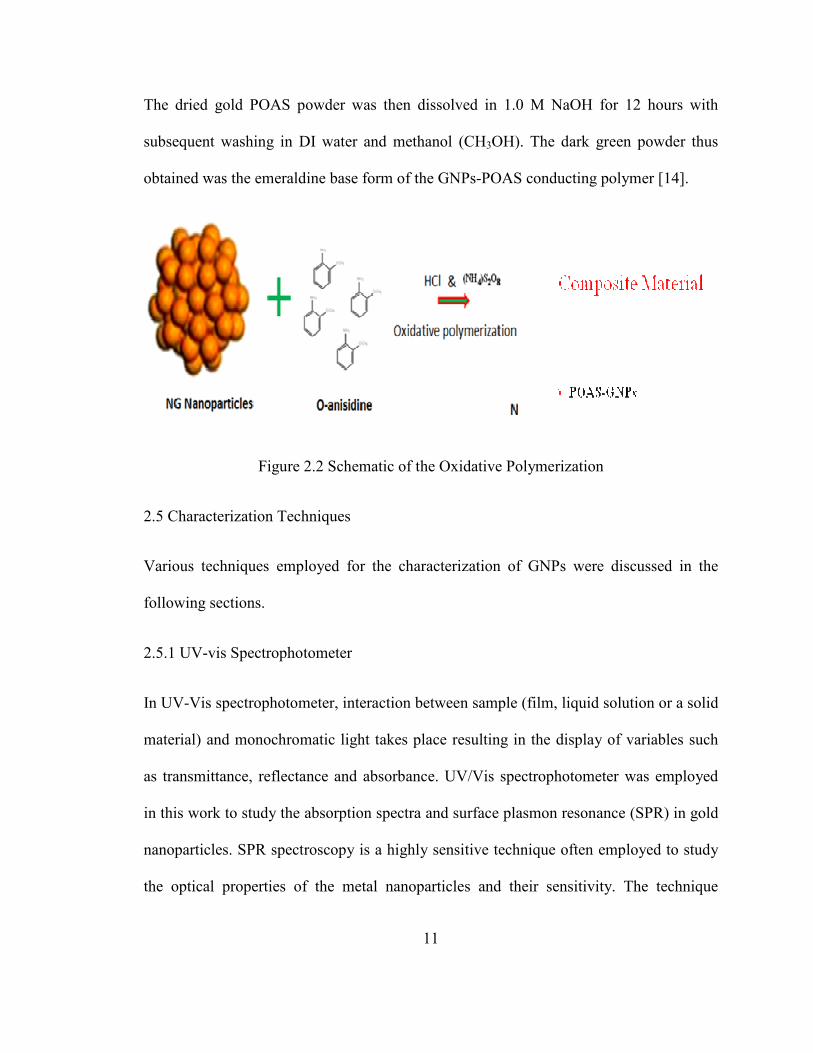
2.4. Synthesis of Composites of Polymer-Gold Nanopaticles
The synthesis of composite material was done by dissolving (0.2 M) of O-anisidine in
150 mL of 1.0 M HCl and the solution was kept aside for 1 hour. After an hour, 15 mL of
0.01 M HAuCl4 was added to the above mixture with constant stirring for 10 minutes and
kept aside (solution A) then 0.05 M ammonium persulphate solution was dissolved in 50
mL of 1.0M HCl with constant stirring for 15 min (solution B). After preparing these two
solutions, solution B was added in drops to solution A at ice-cold condition and stored at
room temperature for 24 hours. This resulted in the formation of a dark green precipitate.
Next, the precipitate was filtered off and then washed subsequently with DI water and
diethyl ether to remove all the oligomers. The resulting gold- POAS was dried at 100 oC.
11
The dried gold POAS powder was then dissolved in 1.0 M NaOH for 12 hours with
subsequent washing in DI water and methanol (CH3OH). The dark green powder thus
obtained was the emeraldine base form of the GNPs-POAS conducting polymer [14].
Figure 2.2 Schematic of the Oxidative Polymerization
2.5 Characterization Techniques
Various techniques employed for the characterization of GNPs were discussed in the
following sections.
2.5.1 UV-vis Spectrophotometer
In UV-Vis spectrophotometer, interaction between sample (film, liquid solution or a solid
material) and monochromatic light takes place resulting in the display of variables such
as transmittance, reflectance and absorbance. UV/Vis spectrophotometer was employed
in this work to study the absorption spectra and surface plasmon resonance (SPR) in gold
nanoparticles. SPR spectroscopy is a highly sensitive technique often employed to study
the optical properties of the metal nanoparticles and their sensitivity. The technique

12
requires a specialized set-up or arrangement which includes an electromagnetic radiation
source generator, a dispersion device selecting a particular wavelength, a chopper
dividing the path of light and a detector to measure the intensity of the radiation.
Interaction between electromagnetic radiation and the surface plasmon at the particle
interface and the surrounding medium results in the SPR phenomenon. Surface Plasmon
refers to a collective oscillation of the conduction electrons present in the particle [4, 5]
and as a result a strong absorption peak will be witnessed in the absorption region of
metallic nanoparticles. For example, in the case of gold nanoparticles, its characteristic
peak occurs at about 525 nm. The distinctive bright color of metal nanoparticle is
attributed to the surface plasmon absorption band. [6] The SPR is very sensitive to the
size and shape of the particles. Therefore, a small change in surface geometry affects the
electrical density on the particle surface and causes them to oscillate with different
frequency. This is due to the fact that, the optical properties of the metal nanoparticle is
an intrinsic function of its morphological features [7]. Based on this, the absorption
spectrum of the gold nanoparticles can be obtained between the 520 nm and 1000 nm
range by tuning the geometry of the particle. In addition to the particle size and shape, the
SPR peak is also sensitive to the dielectric properties of the surrounding medium [28].

13
Figure 2.3 UV-vis Spectrophotometer Set Up in USF
2.5.2 Transmission Electron Microscopy
Transmission electron microscopy (TEM) is the primary technique employed for
determining the particle size, shape and the size distribution. TEM utilizes electron beam
as light source that passes through all the lenses and apertures before reaching the
specimen to be analyzed as shown in figure 2.4 [29]. The much lower wavelength makes
it possible to get a resolution that is thousand times better than with a light microscope.
TEM operates require electrons instead of light. In TEM, the electron gun emits the
electrons and passes through the vacuum and then through a number of apertures and

14
electromagnetic lenses that focus the electrons into a very thin beam. This electron beam
is then focused on to the object to be analyzed. The electrons get absorbed and reflected
from the specimen depending on the density of the material and the transmitted electrons
gives the magnified image of the specimen on a fluorescent screen. Figure 2.5 is a typical
TEM employed in our work.
Figure 2.4 Optical Components in TEM

15
Figure 2.5 Schematic of Transmission Electron Microscopy in USF
2.5.3 Fourier Transform Infrared Spectroscopy
This technique is primarily used to identify the organic molecule or the presence of
certain functional groups in the molecule. Infrared spectroscopy works in the IR region of
the electromagnetic spectrum. When IR radiation is passed through a sample, the
molecules absorb certain frequency of this radiation that is characteristic to their
structure. The obtained spectrum then displayed the molecular absorption and
transmission, and gives the molecular fingerprint of the sample. The different
components of the IR spectroscope include an IR Source, Michelson Interferometer and a
detector.
16
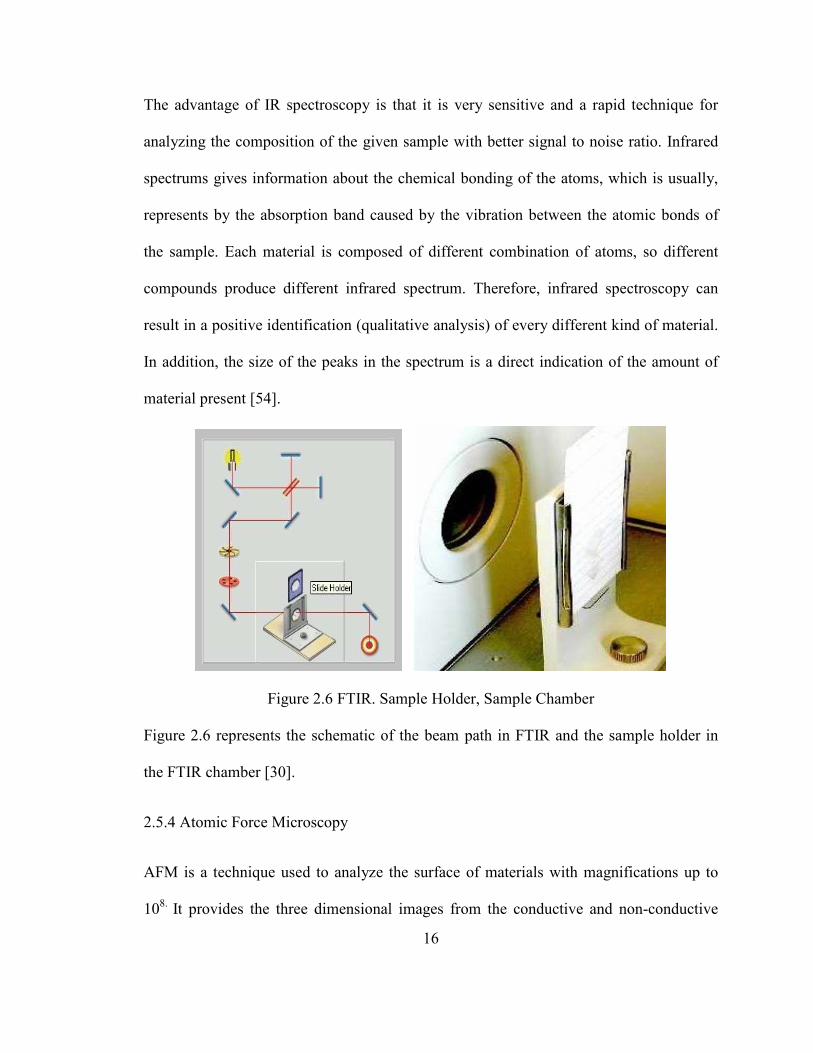
The advantage of IR spectroscopy is that it is very sensitive and a rapid technique for
analyzing the composition of the given sample with better signal to noise ratio. Infrared
spectrums gives information about the chemical bonding of the atoms, which is usually,
represents by the absorption band caused by the vibration between the atomic bonds of
the sample. Each material is composed of different combination of atoms, so different
compounds produce different infrared spectrum. Therefore, infrared spectroscopy can
result in a positive identification (qualitative analysis) of every different kind of material.
In addition, the size of the peaks in the spectrum is a direct indication of the amount of
material present [54].
Figure 2.6 FTIR. Sample Holder, Sample Chamber
Figure 2.6 represents the schematic of the beam path in FTIR and the sample holder in
the FTIR chamber [30].
2.5.4 Atomic Force Microscopy
AFM is a technique used to analyze the surface of materials with magnifications up to
108.
It provides the three dimensional images from the conductive and non-conductive

17
sample with an extraordinary topographic contrast. An atomically very sharp silicon
nitride tip connected to the end of the cantilever is used to scan the sample surface, while,
maintaining the tip at constant height or force above the surface. The modes of operation
in AFM include contact mode, non-contact mode and the tapping mode. In contact mode
(also known as repulsive mode) the AFM tip come in close contact to the sample surface.
The tip and the sample interact due to quantum mechanical exclusion principle. This
mode gives the best resolution of the sample surface but the disadvantage of this mode is
that it can deform the sample surface. In the non-contact mode, the cantilever vibrates at
a certain distance (10 to 100 A) and the topographical image is obtained by the Van-der
walls magnetic force with very poor resolution. In the tapping mode, the tip is brought
close to the sample surface so that it cannot damage or deform the sample. The surface
characteristics with resolution ranging from 100 µm to less than 1µm can be
accomplished by this technique. Figure 2.7 shows the schematic of the atomic force
microscope mechanism of operation and different modes of operations [31]. In the
present work, we employ the AFM techniques to probe the surface morphology of the
gold nanoparticles.

18
(a)
(b)
Figure 2.7. Schematic of the Modes of Operation in AFM
19
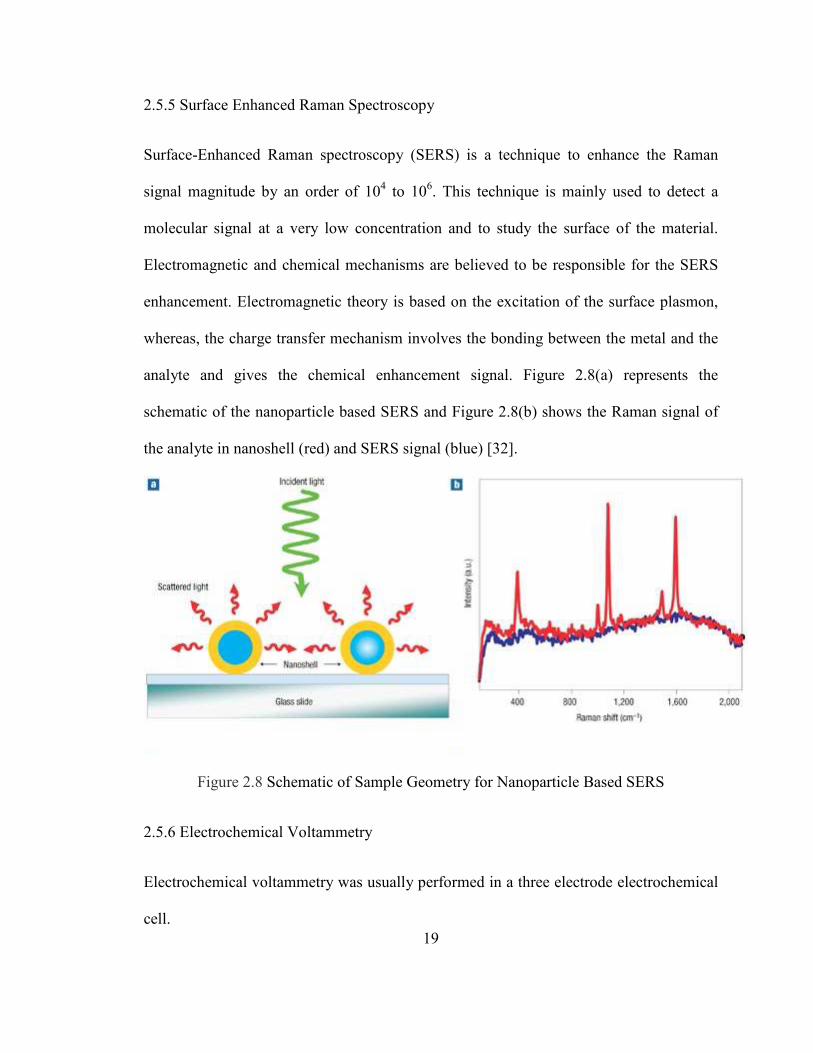
2.5.5 Surface Enhanced Raman Spectroscopy
Surface-Enhanced Raman spectroscopy (SERS) is a technique to enhance the Raman
signal magnitude by an order of 104 to 10
6. This technique is mainly used to detect a
molecular signal at a very low concentration and to study the surface of the material.
Electromagnetic and chemical mechanisms are believed to be responsible for the SERS
enhancement. Electromagnetic theory is based on the excitation of the surface plasmon,
whereas, the charge transfer mechanism involves the bonding between the metal and the
analyte and gives the chemical enhancement signal. Figure 2.8(a) represents the
schematic of the nanoparticle based SERS and Figure 2.8(b) shows the Raman signal of
the analyte in nanoshell (red) and SERS signal (blue) [32].
Figure 2.8 Schematic of Sample Geometry for Nanoparticle Based SERS
2.5.6 Electrochemical Voltammetry
Electrochemical voltammetry was usually performed in a three electrode electrochemical
cell.
20
The three electrode system includes (a) a working electrode, (b) reference electrode and
(c) an auxiliary electrode. The working electrode is the electrode at which our process of
interest takes place and the auxiliary electrode is employed to complete the circuit. The
reference electrode is used as reference against which the potential was applied or
scanned between two limits. The surface area of the counter electrode must be high in
order to achieve the impedance primarily from the working electrode. Usually, Platinum
wire will be used as the counter electrode whereas gold, glassy carbon and platinum are
used as working electrode. In the present work, we employ glassy carbon electrode
modified with the gold nanoparticles as the working electrode, an Ag|AgCl reference
electrode in all the electrochemical experiments.
2.5.6.1. Cyclic Voltammetry
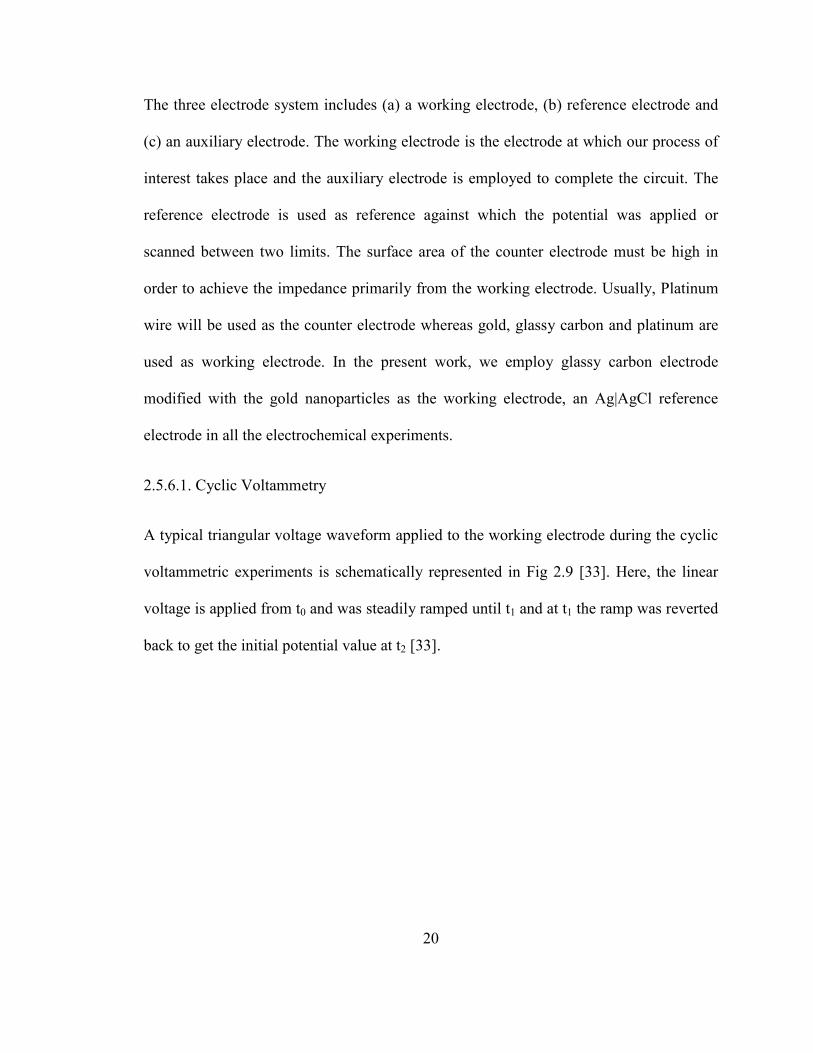
A typical triangular voltage waveform applied to the working electrode during the cyclic
voltammetric experiments is schematically represented in Fig 2.9 [33]. Here, the linear
voltage is applied from t0 and was steadily ramped until t1 and at t1 the ramp was reverted
back to get the initial potential value at t2 [33].
21
Figure 2.9 Typical Triangular Wave Form Applied to the Working Electrode.
Next, we briefly define a typical cyclic voltammogram in Figure 2.10 [33].During cyclic
voltammetry, the potential was scanned between two limits from the portion labeled A,
until D and then reversed back to A. During this scan, a redox reaction will occur and this
process will give rise to an increase in the current magnitude and this portion of the wave
is called cathodic wave. Further, the maximum flow of electrons is observed at point C
and after the point C, though the potential is applied, there will be no current observed
beyond this due to the depletion of the redox species at the electrode. Further, the
diffusion of the species toward the electrode should occur before reduction. In this case,
the diffusion is slower than reduction and therefore there will a decrease in the current
flow between the points C and D. On the other hand, the points E, F, and G describe the
reverse process Furthermore, the redox potential can be obtained from a voltammogram
by calculating the average value of the anodic and cathodic peaks. For example, for the

22
voltammogram shown in Fig.2.10, the one-electron (E1,1/2) and two-electron (E2,1/2) redox
potentials can be calculated as:
E1,1/2 = (E1c + E1
a) / 2 and E2,1/2 = (E2
c + E2
a ) / 2 (1)
In equation (1), the subscript 1/2 represents the potential obtained approximately at the
half-height of the cathodic and anodic peaks (and this is sometimes referred as half-wave
potential). At these points the concentrations of the reduced and oxidized species are
equal. However, it is to be noted that in this context concentration refers to the
concentration of a given species on the electrode but not in the bulk solution. In certain
cases, where only one-electron reduction occurs, only one maximum is observed in the
cathodic wave and one minimum in the anodic waves. When both the anodic and
cathodic waves are symmetric with respect to each other, the redox process is said to be
reversible. However, if they are not symmetric, the redox species may undergo a
chemical reaction and will not be observed during the reverse sweep [33].
Cyclic voltammetery is a commonly employed electrochemical technique, during which
the potential of the working electrode is ramped in a linear fashion verses time. After
reaching the initial potential, the potential of working electrode is reversed and is called
one cycle. Cyclic voltammetry can be performed for a single cycle or a series of cycles
depending on the sensitivity as required by the analysis. A plot of the current magnitude
at the working electrode verses the applied voltage will give rise to a cyclic
voltammogram. Furthermore, the utility of cyclic voltammetry is strongly dependent on
the analyte being employed and the analyte has to be redox active within the applied
potential range.

23
The redox reaction at the surface of the working electrode will certainly bring about a
mass transfer of the material at a definite applied voltage. The advantages of the cyclic
voltammetery include highly sensitivity to the traces of ionic species, non-destruction and
can be employed at a wide dynamic range.
In the present work, gold nanoparticles of different sizes and shapes were employed as a
substrate for all the voltammetric measurements in different redox probes such as
hexammineruthenium (III) chloride,and potassium ferricyanide. Further, these electrodes
modified using gold nanoparticles were then employed for the detection of
neurotransmitters such as dopamine and ascorbic acid.
Figure 2.10 A Typical Cyclic Voltammogram of One Electron Transfer

24
Figure 2.11 Typical Cyclic Voltammogram of Two Electron Transfer
In the present work, gold nanoparticles of different sizes and shapes were employed as a
substrate for all the voltammetric measurements Two different redox probes such as
hexammineruthenium (III) chloride and potassium ferricyanide has been utilized for the
experiment. Further, these electrodes modified using gold nanoparticles were then
employed for the detection of neurotransmitters such as dopamine and ascorbic acid.

25
Chapter 3: Structural and Optical Properties of Gold Nanoparticles
3.1 Introduction
The structural and optical properties of gold nanoparticles synthesized by the chemical
route were described in this chapter. The main focus of this chapter is to characterize the
GNPs. Synthesis of GNPs at different conditions (such as temperature, reducing agent
and concentration) results in the variation of gold nanoparticles morphology which in
turn displays a remarkable difference in the optical properties. The characterization of the
composites of gold nanoparticles-POAS was studied using UV-Vis, TEM, FTIR and
cyclic voltammetry.
3.2 Characterization of Au Nanoparticles
Gold nanoparticles were studied by different techniques discussed below.
3.2.1 Absorption Spectroscopy
The absorption spectra of gold nanoparticles were obtained using UV-vis
spectrophotometer. This measurement was performed using the gold nanoparticle
solution within the quartz cell along with the reference cell. The characteristic plasmon
resonance absorption band for GNPs occurs at 525 nm in the visible region of the
electromagnetic spectrum. Figure 3.1 shows the absorption spectra of 20nm gold
nanoparticles with surface plasmon resonance band at 529 nm. It is well known that the

26
optical properties of metal nanoparticles are strongly dependent on the morphology of the
nanoparticles [16]. The size analysis of the GNPs was performed by visually analyzing
the color of the nanoparticle solution. The color transition from deep red to bluish purple
indicates the formation of bigger particle due to SPR properties of the gold nanoparticles.
The SPR properties of the nanoparticles were displayed in the visible region of the
electromagnetic spectrum [34] When the nanoparticles are exposed to the
electromagnetic radiation, a part of the wavelength get absorbed and a portion of it were
reflected by these particles and the remaining reflected portion of the wavelength was
responsible for the intense bright color of the nanoparticles.
Figure 3.1 Absorption Spectrum of the Gold Nanoparticles
27
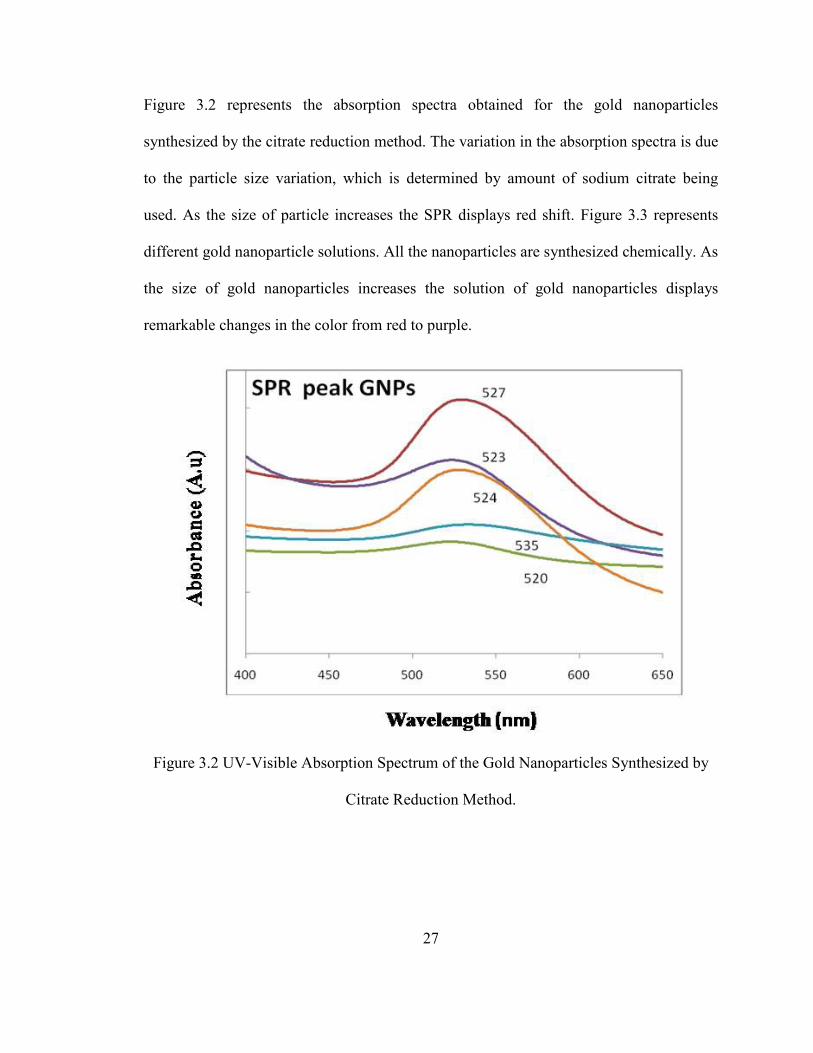
Figure 3.2 represents the absorption spectra obtained for the gold nanoparticles
synthesized by the citrate reduction method. The variation in the absorption spectra is due
to the particle size variation, which is determined by amount of sodium citrate being
used. As the size of particle increases the SPR displays red shift. Figure 3.3 represents
different gold nanoparticle solutions. All the nanoparticles are synthesized chemically. As
the size of gold nanoparticles increases the solution of gold nanoparticles displays
remarkable changes in the color from red to purple.
Figure 3.2 UV-Visible Absorption Spectrum of the Gold Nanoparticles Synthesized by
Citrate Reduction Method.

28
Figure 3.3 Images of Gold Nanoparticle Solutions
Figure 3.3 represents the images of different gold nanoparticlesSolutions which is
directly related to the size of gold nanoparticles. Figure 3.4 represents the absorption
spectrum of the gold nanoparticles synthesized by using PVP with size ranging from 10
nm to 60 nm. Further, it displays remarkable variation in the surface plasmon band, since
the optical behavior of the gold nanoparticles was based on the shape and size of GNPs
[16]. Furthermore, the surface plasmon peak shifts towards the higher wavelength as the
shape and size of the GNPs varies from nanosphere to nanoctagon.

29
Figure 3.4 Absorption Spectra of Gold Nanoparticles (~527 nm, 550 nm and 574 nm.)

30
Figure 3.5 UV-vis Spectra of Bio-Compatible Gold Nanoparticles.
As shown in the figure 3.5 the absorption spectra of gold nanoparticles synthesized by
using chitosan as a stabilizing agent act as biocompatible since chitosan is a bio-polymer
and responsible for the transportation of some biological objects including some drugs.
Since chitosan does not show any optical activity so the observed change in the SPR band
of GNPs (523 nm) after the addition of chitosan is due to the change of the dielectric
variation [35].
3.2.2 Morphology Analysis of GNPs (TEM)
Transmission Electron Microscope was used to study the morphology of gold
nanoparticles. A drop of the GNPs solution is casted on the TEM grid and allowed to dry
in air before performing the TEM measurement. Further, care must be taken in order to
(a)- Chitosan
(b)-GNPs
(c) –Chitosan-

31
avoid the excessive spill of organic surfactant on the GNPs sample; otherwise, it will be
difficult for the electron beam to pass through the sample that surrounds the
nanoparticles. The morphology of the GNPs is characterized by the transmission electron
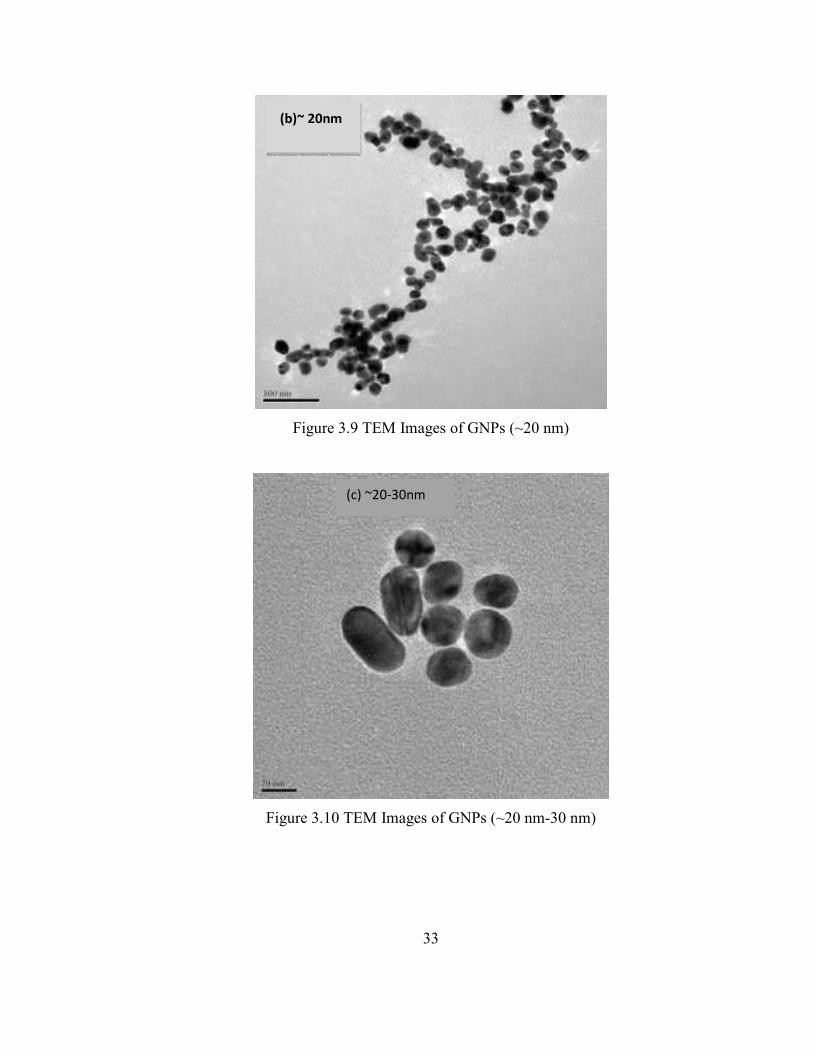
microscopy. TEM images of some samples of gold nanoparticles obtained chemically
were shown below. Figure(s) 3.6, 3.7, 3.8, 3.9 and 3.10 are the TEM images of the gold
nanoparticles synthesized by citrate reduction method and appear to be boot shaped and
spherical in shape with an average size about of 20 nm and ~500 nm. Figure 3.11, 3.12
and 3.13 represents the TEM images of the nanoparticles synthesized by using PVP and
resembles pentagon, triangle and octagon with a size range from 20 nm to 200 nm. It is
evident from the TEM study that the nanoparticles of different sizes and shape can be
obtained via the chemical synthesis.
Figure 3.6 TEM Images of the Gold Nanoparticles (Boot Shaped)

32
Figure 3.7 TEM Images of GNPs (~5 nm-7 nm)
Figure 3.8. TEM Images of GNPs (~10 nm)
(a) ~10nm
33
Figure 3.9 TEM Images of GNPs (~20 nm)
Figure 3.10 TEM Images of GNPs (~20 nm-30 nm)
(b)~ 20nm
(c) ~20-30nm

34
Figure 3.11 TEM Images of GNPs Nanocubes (~200nm)
Figure 3.12 TEM Images of GNPs (Nanotriangles, Octagons~50 nm-60 nm)
~200nm
~50-60nm

35
Figure 3.13 TEM Images of GNPs (Cubes, Pentagon ~ 100 nm).
Figure 3.14 TEM Image GNPs (~10 nm-20 nm)
~100nm
~10-20 nm

36
The following table shows the different parameters utilized during the synthesis of gold
nanoparticles and resulting nanostructure size.
Table 3.1. Gold Nanoparticles: Synthetic and Characterizing Parameters
Volume of (0.01M)
HAuCl4
Concentration of
Sodium citrate
PVP (gm) L abs max
(nm)
Size (nm)
10ml 647/250ml DI 1gm/60ml 550nm 50-100nm
10 ml 400mg/100ml DI 0 514nm ~7to 10nm
15 ml 340 mg/100ml DI 0 526nm 10nm
15 ml 320 mg/100 ml DI 0 525nm 10 ~20nm
10 ml 300 mg/ 250 ml DI 0.8gm/60ml 574nm 500nm
3.2.3 SERS
The SERS of the gold nanoparticles shows peak enhancement of the material present in a
tiny amount of sample. The SERS of different samples of gold nanoparticles was
performed in the Argon/Krypton Laser (HORIBA JOBINYVON). The wavelength
employed in this work was 647 nm, a 20x objective in 3 acc operational mode. The
experiment was performed by irradiating the solution of gold nanoparticles with the laser
light and the results were recorded by a spectrum of the scattered light. The optical
properties of the nanoparticles affect the scattering of the light which gives the
characteristic vibration fingerprint of the molecules present. As described by the Hu’s
group [17], the SERS intensity of the nanoparticles was strongly dependent on the
morphological features. As the sharp edges within the nanoparticles increases, the SERS
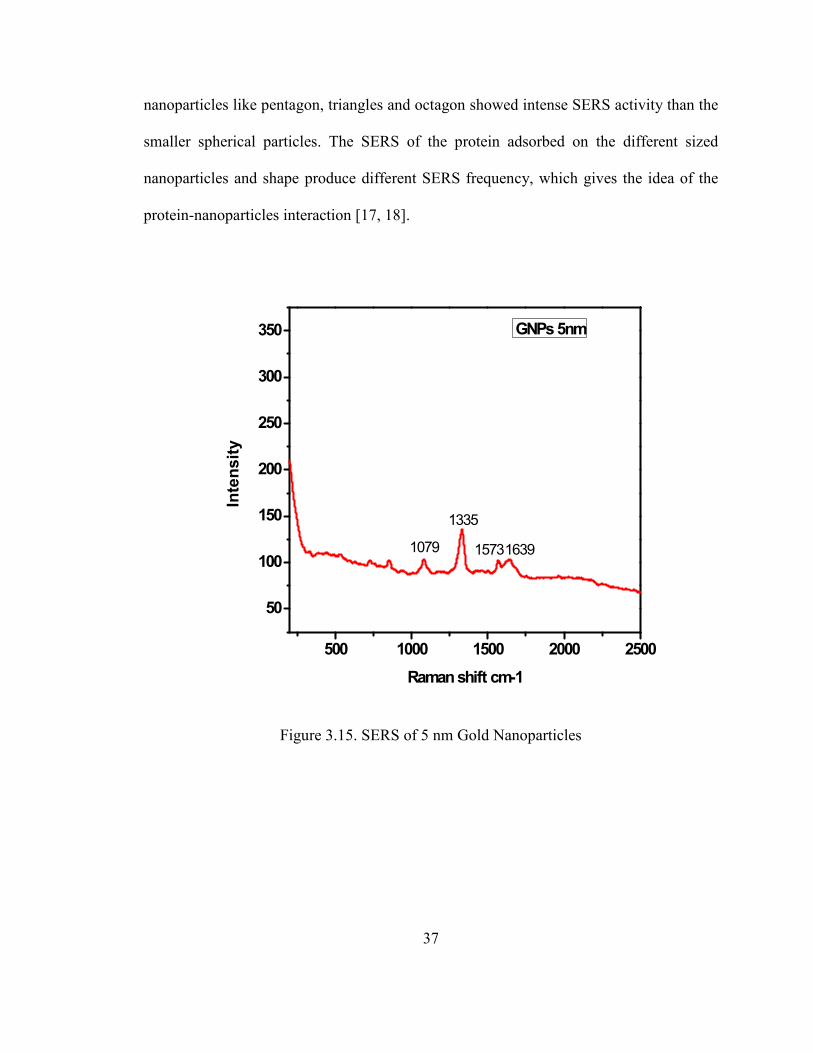
activity increases too. Our SERS characterization results indicated that the bigger
37
nanoparticles like pentagon, triangles and octagon showed intense SERS activity than the
smaller spherical particles. The SERS of the protein adsorbed on the different sized
nanoparticles and shape produce different SERS frequency, which gives the idea of the
protein-nanoparticles interaction [17, 18].
500 1000 1500 2000 2500
50
100
150
200
250
300
350
Intensity
Raman shift cm-1
GNPs 5nm
1335
1079 16391573
Figure 3.15. SERS of 5 nm Gold Nanoparticles

38
500 1000 1500 2000 25000
100
200
300
400
500
Intensity
Raman Shift cm-1
GNP 10 nm
885
1079
1335
1571
1906
Figure 3.16 SERS of 10 nm Gold Nanoparticles
SERS analysis of different sized gold nanoparticles (7nm, 10nm, 20 nm) has been
performed in this work. The SERS of these three samples of gold nanoparticles displayed
main peaks at 885 cm-1
(NH2), 1079 cm-1
(C–C and C–N stretch) , 1335 cm-1
(NH2–CH2
twist) and 1573-1599 cm-1
for -COOH asym as shown in figure 3.16. Further, the SERS
of gold nanoparticle sample displayed reproducible spectra with variations in peak
intensity (intensity varies between 7 nm and 20 nm)

39
3.2.4 Atomic Force Microscopy
Next, the surface morphology of the gold nanoparticles was studied by AFM under
tapping mode. The AFM micrograph in 2D is shown in figure 3.17.
Figure 3.17 AFM Images of Gold Nanoparticles

40
3.2.5 Electrochemical Characterization of GNPs
Cyclic voltammetric experiments were performed in an electrochemical cell containing a
three electrode assembly. Gold nanoparticles were immobilized on the glassy carbon
electrode and employed as the working electrode, platinum wire as the auxiliary
electrode, and Ag/AgCl/saturated with 3.0M KCl was employed as the reference
electrode. Initially, cyclic voltammeteric experiments were performed using
[K4Fe(CN)6]3-/4-
(a negatively charged redox probe ) and [Ru (NH3)6]3+/2+
(a positively
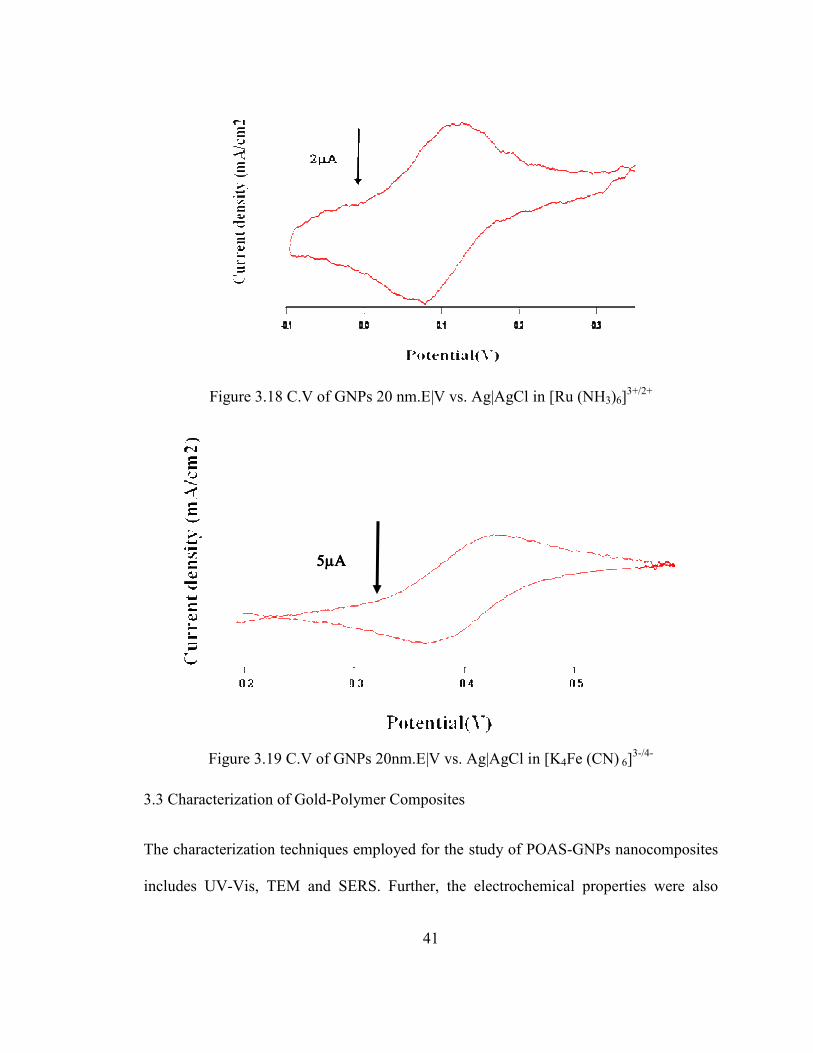
charged redox probe). Figure 3.18 and 3.19 represents the background subtracted cyclic
voltammogram obtained at a glassy carbon electrode modified with 20 nm GNPs
immobilized on to a glassy carbon electrode in 1.0mM [Ru(NH3)6]3+/2+
/ 0.5M KCl and
1.0mM K3Fe (CN) 63-/4-
/ 0.5M KCl respectively. The CV of GNPs in [Ru(NH3)6]3+/2+
exhibited a reduction and oxidation peak centered at 0.14V and 0.08V respectively with a
∆Ep value of 60mV confirming a one-electron transfer. On the other hand, the cyclic
voltammetry of GNPs in [K3Fe(CN)6]3-/4-
exhibited reduction and oxidation peaks
centered at 0.42V and 0.36V respectively with a ∆Ep value of about 60mV indicating a
one electron transfer. From these experiments, it was evident that the gold nanoparticles
(20nm) provides an effective platform for the electron transfer to occur thereby
confirming the suitability of the nanoparticles as a sensing platform for various
bioanalysis.
41
Figure 3.18 C.V of GNPs 20 nm.E|V vs. Ag|AgCl in [Ru (NH3)6]3+/2+
Figure 3.19 C.V of GNPs 20nm.E|V vs. Ag|AgCl in [K4Fe (CN) 6]3-/4-
3.3 Characterization of Gold-Polymer Composites
The characterization techniques employed for the study of POAS-GNPs nanocomposites
includes UV-Vis, TEM and SERS. Further, the electrochemical properties were also
5µΑ5µΑ5µΑ5µΑ

42
studied in detail in the next section. The UV-Visible spectra of the composite materials
deposited on the quartz substrate were recorded by a UV–Vis spectrophotometer. Figure
3.20 and 3.21 shows the optical spectrum of the GNPs and GNPs-POAS. The
characteristic peaks of POAS were positioned at 330 nm (π−π∗ transition) and at 610 nm
(n-π∗ transition). In addition, a peak was observed at ~500 to 550 for the GNPs-POAS
composite due to the presence of gold nanoparticles in the POAS matrix.
Figure 3.20 UV-vis Spectra of POAS

43
Figure 3.21 UV-vis Spectra of Composites POAS- GNPs
TEM images of the POAS and the composites of GNPs-POAS are shown in the figure
3.22 (a) and 3.22 (b). The TEM image of composites shows that the gold nanoparticles
are well dispersed in the polymer.
GNPs-POAS Absorption

44
(a) (b)
Figure 3.22 TEM Images, (a) POAS, (b) POAS-GNPs
The composite films made on silicon substrate were studied by Fourier Transform
Infrared (FTIR) spectrophotometer. The IR spectra of POAS and GNPs were shown in
figure 3.23. The gold nanoparticles exhibited a distinct peak at 1675 cm-1
. Moreover, the
other peaks assigned for both POAS and gold–POAS composite are as follows. The peak
observed in the POAS and GNPS-POAS ( Strech.quinoid ring) C=C (1578 cm-1
), C=C
stretch, benzenoid ring (1461,1412 cm-1
in GNPs –POAS) and C-N stretch (1343 cm-
1,1337cm-1
N=Q=N (Q= quinoid ring) 1198 cm-1
C-H stretching vibration, 1278 cm
-1 .
Furthermore, the FTIR analysis indicated that the composites of gold–POAS exhibited a
better peak intensity.

45
Figure 3.23 FTIR of (a) GNPs, (b) POAS, (c) POAS-GNPs
3.4 Electrochemical Characterization of GNPs-POAS
The electrochemical kinetics of composites of POAS and GNPs-POAS observed in 0.1M
HCl were shown in figure 3.24 and 3.25 respectively. Cyclic voltametry was performed
in an electrochemical cell containing a three electrode set-up. Gold nanoparticles were
immobilized on to the glassy carbon electrode and employed as the working electrode;
platinum wire was utilized as the auxiliary electrode and Ag/AgCl as reference electrode.
All the cyclic voltameteric experiments were performed in 0.1M HCl at different scan
rate (100 mVs-1
, 50 mVs-1
, 20 mVs-1
,1mVs-1
). Figure 3.24, represents the cyclic
voltammograms of POAS in 0.1M HCl at different scan rates.

46
Figure 3.24 CV of POAS in Three Electrode System in 0.1M HCL
47
Figure 3.25 CV of POAS -GNPs in Three Electrode System in 0.1M HCL
On the other hand, the voltammograms of GNPs-POAS composites exhibited a pair of
redox waves at 0.4V and 0.36V. However, the peaks are not well-defined. Of these two
peaks the one at 0.18V was identical as that of polyaniline and the peak present at 0.4V
corresponds to the oxidized form of POAS. In other words, the peak at 0.4V corresponds
to the oxidized state whereas the peak at 0.36 V corresponds to the reduced state of NGs-
POAS system. Interestingly, the peak at 0.4V, which is due to quinoid structure in NG-
POAS, has a higher current than POAS as shown in Figure 3.25. Furthermore, Figure
3.25 indicates the characteristic peak of polyaniline systems of the polymer which was
not observed in the case of polymer alone as shown by figure 3.24 thereby demonstrating
10 µµµµA

48
that the presence of Gold nanoparticles were not only useful for the redox reaction but
also provide excellent probe for the polymer composite synthesis.

49
Chapter 4: Applications of GNPs
4.1 Introduction
In this chapter, we focused on the application of the chemically synthesized gold
nanoparticles. The non-toxic nature of GNPs makes them a potential candidate for all the
biological studies including the detection of biomolecules and in cancer therapy [36-38].
The inhibition of Respiratory Syncial Virus (RSV) by GNPs was described in detail in
this chapter. RSV is the main cause of the pneumonia in children and may cause
respiratory disorders [39-40] Studies on the interaction of gold nanoparticle with the
protein Bovine Serum Albumin (BSA) were also described. Further, we have also
described about the electrochemical detection of dopamine, uric acid and ascorbic acid
using gold nanoparticle modified glassy carbon electrode. Finally, the applications of
gold nanoparticles as catalytic activator for gas sensing have been discussed.
4.2 RSV Inhibition by GNPs
4.2.1 Cells and Virus
HEp-2 (Human body Type-2 epithelial cells) cells were purchased from American Type
Culture Collection (ATCC, Manassas, VA; CCL-23) and were propagated by using
Minimum Essential Medium (MEM) supplemented with 10% Fetal Bovine Serum (FBS),

50
2 mM L-Glutamine, 75 U/ml Penicillin, 100 mg/ml Kanamycin and 75 mg/ml
Streptomycin. Human RSV Long strain was purchased from ATCC (VR# 26). Virulent
RSV stocks were prepared and propagated in HEp-2 cells. RSV with multiplicity of
infection of 4:1 was added to the flask and virus adsorption was carried out for 1h at 37oC
in a humidified atmosphere with 5% CO2. MEM supplemented with 2% FBS and 2 mM
L-Glutamine was added to the flask and infection of cells was observed for 3 days. RSV
infected cells were harvested and cell suspension was subjected to 2 freeze-thaw cycles at
-80°C followed by centrifugation at 3,000 rpm at 4°C to remove the cellular debris. The
viral stocks were aliquoted and stored at -80°C on liquid nitrogen until further use. Viral
titer of the prepared stock was determined by plaque assay and had a titer of 105 p.f.u / ml
[39-40].
4.2.2 Preparation of GNPs and RSV Mixture
The gold nanoparticles (50µL/µL) were mixed with 20µL RSV containing 100 PFU, and
incubated for 40 minutes at room temperature.
4.2.3 RSV Inhibition Experiment
RSV inhibition experiment was carried out by employing different concentrations of
GNPs samples for RSV inhibition studies. The GNPs were mixed with 20mL of RSV
containing 100 PFU and incubated for 30 minutes at room temperature. The GNPs-RSV
complex was then added to 60–70% confluent HEp-2 cells in 8-chamber slides to observe
the inhibition of RSV infection. HEp-2 cells infected with RSV without GNPs were used

51
as a positive control. The inhibition of RSV infection by each GNP sample was analyzed
visually using an inverted light microscope as well as by indirect immunofluorescence
using an Olympus IX51 immunofluorescence microscope. For indirect
immunofluorescence, HEp-2 cells were grown in 8 chambered slides (BD Biosciences)
for 24 h to 60% confluency. The cells were washed with phosphate buffered saline (PBS)
and cured using 10% trichloroacetic acid for 15 min. The cells were then successively
washed in 70%, 90%, and 100% ethanol for 5 min (in either case). Next, the cells were
washed using PBS and incubated in blocking buffer (3% dry milk in PBS) for 30 min and
washed thrice with PBS. The cured cells were incubated for 1h at room temperature with
monoclonal mouse antibody to RSV F (Biodesign International) in antibody buffer (2%
dry milk in PBS). The cells were washed three times for 5 min in PBS and then incubated
for 1 h at room temperature with FITC-conjugated goat anti-mouse IgG (H+L) secondary
antibody (Southern Biotechnology) in antibody buffer. Non-specific binding will be
eliminated by washing the cell thrice in PBS and the cells were visualized using a
fluorescent microscope [39-40]. The schematic of RSV inhibition experimen is
represented in figure 4.1.
Figure 4.1 Schematic of RSV Inhibition Experiment

52
Figure 4.2 RSV Inhibition by Immunofluorescence Cells Infected with RSV
Figure 4.3 Cells Infected with RSV Mixed GNPs (5µl/ml)
(a)
(b)

53
Figure 4.4 Cells Infected with RSV Mixed with GNPs (50µl/ml)
Figure 4.5 Cells Infected with RSV Mixed with GNPs (100µl/ml)
(c)
(d)

54
Figure 4.6 Cells Infected with RSV Mixed with GNPs (200µl/ml)
GNPs were mixed with 100 PFU of RSV and added to the cells to determine the
inhibition of infection. Reduction in cytopathic effects (syncytia) in HEp-2 cells was
observed to determine the extent of RSV infection Cell infection was monitered by
immunofluorescence. Cells infected with RSV mixed with GNPs clearly showed a
significant reduction in RSV infection compared to the cells infected with RSV alone.
The results of the present study indicated that GNPs (10 nm) can inhibit RSV infection
and in future it can be employed for the therapeutic purposes.
4.3 Biosensing Applications of the GNPs
Gold nanoparticles synthesized by the chemical methods have been utilized for the
sensing application of neurotransmitters such as dopamine and the ascorbic acid
(e)

55
4.3.1 Detection of Neurotransmitters such as Dopamine, Ascorbic Acid
For many years, the study of brain and its associated processes have been an area of
research to scientists with work focusing on issues ranging from the whole brain to single
cell. Brain is one of the most complex biological matrices and is composed of
approximately 100 billion nerve cells called neurons. Dopamine is an endogenous
chemical compound that was discovered to be a neurotransmitter by Arvid Carlson in the
1950s. Neurotransmitters are chemicals that facilitate the transport of the information
between the neurons across the gap. Dopamine participates in the important brain
functions and acts as a neurotransmitter and neuroharmone, which inhibit the secretion of
prolactin from the pituitary gland. Dopamine produces an effect on the sympathetic
nervous system when used as a medication. Broadly, neurotransmitters were classified as
indolamine, catecholamine, peptides, epinephrine, norepinephrine, amino acids, and
acetylcholine. The structure of dopamine and ascorbic acid is shown in figure 4.7.
(a) Dopamine (b) Ascorbic acid
Figure 4.7 Structures of Dopamine and Ascorbic Acid

56
4.3.1.1 Importance of Monitoring Neurotransmitters
Monitoring various neurotransmitters is vital to understand the mechanism and pathways
that leads to various behavioral changes and disorder. The neurotransmitters such as
dopamine; ascorbic acid plays an important role in the regulation of motor function and
associated with the mood swing and emotions. It is important to understand the
mechanisms and kinetics of neurotransmitters such as dopamine. The low concentration
of dopamine leads to Parkinson’s disease, whereas the higher concentration causes
Schizophrenia. Neurotransmitters including dopamine, ascorbic acid, uric acid,
epinephrine and norepinephrine can be very easily oxidized electrochemically by
applying a suitable potential. Based on this technique, in this work we employ glassy
carbon electrode modified with gold nanoparticle as an electrode material to
electrochemically detect the neurotransmitters [41-44]. Initially, glassy carbon electrodes
were modified with gold nanoparticles and employed for the analysis. The modification
of glassy carbon electrodes was performed as follows: The gold nanoparticles were
synthesized chemically as described before by the citrate reduction method. 2µL of the
GNP solution was casted to the glassy carbon electrode surface and dried at room
temperature. This resulted in a uniform thin layer of GNP’s on the electrode surface. In
order to characterize the electrochemical redox behavior as well as the charge transfer
properties of the GNPs, initially we employed different charged redox probes namely
hexamine ruthenium (III) chloride and potassium ferricyanide. Cyclic voltammetry of
these GNP’s were performed initially in 1.0 mM [Ru(NH3)6]3+/2+
, a positively charged
redox probe. Results indicated a well reversible redox peaks and confirming a one

57
electron transfer at the electrode surface. Following this, we have then performed the
cyclic voltammetry of GNP’s in 1.0 mM [Fe(CN)6]3-/4-
, a negatively charged redox probe.
From these results, it is evident that GNP’s are redox active irrespective of various
charges present on the redox analyte, thereby, confirming its charge independent redox
characteristics.
Further, we have evaluated the suitability of GNP’s for the detection of certain important
neurotransmitters such as dopamine (DA), ascorbic acid (AA). Additionally, we have
also compared the performances of different sized GNP’s (10 nm and 20 nm). Cyclic
voltammograms of 20 nm GNP’s in 1.0 mM DA, 1.0 mM AA are shown in Fig 4.8 and
4.10 respectively. On the other hand, upon comparing the signal to noise ratio and the
limit of detection there is no marked difference in their response. Following this, we have
also evaluated the effect of scan rate on the performance of GNP’s (both 10 nm and 20
(nm). In both cases, the plot of square root of scan rate against current density was found
to be linear indicating a diffusion controlled process as shown in figure 4.9. We can
conclude that GNP’s are electroactive and can be employed for the detection of redox
active biomolecules.

58
Figure 4.8 Cyclic Voltammogram of Dopamine in PBS

59
Figure 4.9 Scan Rate /Current Density Plot of Dopamine
Above mentioned analysis indicates that GNPs can expose itself completely to the
analyte and provides eficient active sites essential for the redox reaction. In summary,
we have studied the quasi-reversible and diffusion controlled electron transfer
kinetics of dopamine, ascorbic acid at GNPs electrodes. The electrode response is
stable over time with negligible electrode fouling.
60
Figure 4.10 Cyclic Voltammogram of Ascorbic Acid in PBS
4.4. Analysis of GNPs-BSA Pair
In the literature there are several reports available that describes the interaction of GNPs
and Bovine serum albumin [45-48]. The interaction was highly dependent on the size and
concentration of GNPs. In general, the binding of GNPs with protein shows variation in
the Surface Plasmon Resonance.

61
Figure 4.11 UV-vis Spectra of GNPs and GNPs-BSA (1~10 nm), (2~30nm)
Figure 4.11 shows the absorption spectra of GNPs and GNPs-Protein. As shown in the
spectra it was obvious that the binding of protein to GNPs have altered the surface
properties of the gold nanoparticles and caused the red shift in the absorption peak.
Figure 4.12 and 4.13 represents the TEM images of GNPs and GNP-BSA particles. It
was found that the GNPs with ~10 nm diameter showed dense aggregates due to the
GNP-BSA interaction. However, GNPs with particle size > 20 nm does not exhibited
much interaction with BSA. As the size of the nonmaterial decreases the efficient number
of atoms increases in the surface which provide more efficient binding of the BSA onto
NPs [45]. This observed phenomenon was further confirmed by the TEM measurements.

62
Figure 4.12 (a) TEM of GNPs (~10 nm)
Figure 4.12 (b) TEM of GNPs–BSA Complex (GNPs~10 nm)
~10nm
~10nm

63
Figure 4.13 (a) TEM of GNPs (~35-40 nm)
Figure 4.13 (b) TEM of GNPs-BSA (~35-40 nm)
Figure 4.12 Gold nanoparticles (a) GNPs 10nm, (b) 10 nm GNPs-BSA complex and 4-13
(a) and 4.13 (b) 30 nm GNPs and 30 nm GNPs-BSA respectively. This experiment shows
that there is interaction of gold nanoparticles with the BSA. The interaction study was
~35-40nm
~35-40nm

64
done by UV-vis spectroscopy and TEM. The formations of aggregates of gold
nanoparticles were observed by the TEM.
4.5 Catalytic Application of Chemically Synthesized GNPs
4.5.1 Au Decoration on ZnO Nanowires
In this work the chemically synthesized gold nanoparticles were utilized as catalyst for
ZnO based gas sensors. TEM image in figure 4.14 (a) shows the size and shape of gold
nanoparticles used for this purpose. ZnO nanowires were grown using vapor liquid solid
growth method in our laboratory for other projects. Au nanoparticles were decorated on
the body of the VLS grown ZnO nanowire using solution method to test their catalytic
behavior. For this purpose, the ZnO nanowires were removed from the silicon substrate
by sonification in methanol solution and a fixed quantity of Au nanoparticle solution was
added to the ZnO nanowire solution. The resulting solution was mixed properly to allow
the deposition of metal nanoparticle on the ZnO nanowires surface using slow stirring of
the solution. Figure 4.14 (b) show the morphology of Au decorated ZnO nanowires. The
white spots on the surface of ZnO nanowires are spherical gold nanoparticles in the size
range 5-8 nm.

65
Figure 4.14 (a) TEM Image of GNPs, (b) SEM of ZnO Nanowire-GNPs
Au decorated ZnO nanowires were deposited by using drop cast method on top of the
electrodes on the silicon substrate in order to develop the sensor.
(a)
(b)
66
The deposition of nanowires on substrate is followed by drying at 100oC in inert
atmosphere for the duration of one hr. to get good electrical ohmic contact between the
nanowire and electrodes. A proper deposition of the Au- ZnO nanowire on the electrodes
shows a resistance value in the range of 4 k Ohm to 7 kOhm. Once the contacts are
developed any two of the four electrodes were selected to measure the resistance of the
sensor. The ZnO nanowire sensors were tested for gas sensing behavior by measuring the
resistance in presence of compressed air and carbon monoxide using an electrometer
(Keithley 2400) and a gas controller (MKS 247).Carbon monoxide sensing behavior of
ZnO nanowire and Au decorated ZnO nanowires based sensors was studied in terms of
variation of resistance with time for repeatedly switching of the gas from synthetic air
(O2) to various concentration of carbon monoxide (CO). The sensor signal is defined as
percent change in resistance of the nanowire film upon CO exposure. If Ra is the
resistance in air Rb is the resistance in presence of CO then the sensor signal is defined as
[((Ra − Rb)/Ra) × 100%. Figure 4.15 shows the schematic of CO sensor assembly. There
was no change in resistance (~1MOhm) for only ZnO nanowires at room temperatures
for any concentration of CO between 100 to 1000 ppm [53].
67
Figure 4.15 Assemblies of CO Sensors
However, for the Au decorated nanowires we have observed a decrease in resistance for
all values of CO concentration at room temperature. Figure 4.16 shows show the gas
concentration vs. sensor signal [(Ra − Rb)/Ra) × 100%] data observed for the nanowire at
room temperature while 8(b) show the sensor’s performance at 200OC. On decorating the
GNPs at the room temperature gas adsorption can be made possible due to the presence
of Au on the surface. Ionsorption of oxygen ions can occur on gold nanoparticle surface
at room temperature due to the highly conductive nature and availability of free electron
in gold. The conductive nanoparticle thereafter spills the gas over semiconductor surface
via spillover effect [49-53].

68
Figure 4.16 Variation of Gas Sensor Signal with CO Gas Concentration for ZnO and Au -
ZnO Nanowires at (a) Room Temperature and (b) 200OC

69
The spillover effect via catalytic activation due to gold nanoparticle and chemical
sensitization is observed to be responsible for room temperature CO sensing by Au
decorated ZnO nanowires. Metal nanoparticles act as catalyst in chemical sensitization
and improve the sensing characteristics. This study shows the applicability of gold
nanoparticle as catalyst for gas sensor applications [53].

70
Chapter 5: Conclusions
The synthesis of gold nanoparticles with different shapes and sizes could be done by
chemical method. The shape of the gold nanoparticles varied from nanospheres,
nanocubes, triangles and nanooctaguns. Control on the temperature, dilution and
concentration of the reducing agent has been found to play an important role in
definening the structure of gold nanoparticles.
An attempt has been made to synthesize the composites of POAS-GNPs by the oxidative
polymerization technique. The composites of GNPs-POAS were studied by UV-vis
spectroscopy, FTIR and TEM techniques. It has been found that the properties of this
new material formed by the gold nanoparticles and conductive polymer POAS shows
remarkable difference than POAS alone.
The systematic electrochemical studies of the gold nanoparticles are carried out in
different solutions of electrolyte. Gold nanoparticles are casted on the electrode surface in
order to study biosensing applications. The glassy carbon electrode surface is modified
with the gold nanoparticles with different sizes for the detection of dopamine and
ascorbic acid. Gold nanoparticles immobilized on the surface of glassy carbon provides
better template for the detection.
The studies of the interaction of the gold nanoparticles with Bovine serum albumin in
aqueous is done by UV-vis spectroscopy, and TEM techniques. The interaction leads to

71
the red shift of the SPR band of the gold nanoparticles. Gold nanoparticles can also be
utilized as a catalyst.

72
Chapter 6: Future Work
Future work can be done in the following areas. Further studies on this area will
definitely enhance the utilization of gold nanoparticles for the wide range of research
studies.
(1) Gold nanorods and functionalized biocompatible gold nanoparticles are emerging as a
promising tool for cancer diagnostic applications and medicine. So the future work can be
done on their synthesis and fabrications to explore their other applications.
(2) The gold nanorods can also be utilized as biosensor applications. Biosensors are very
active and interesting field of research. Metal nanoparticles can be synthesized and
fabricated for the utilization of as template to study the various biological objects like
protein, DNA and Nucleic acid.

73
References
1. V. Halte, J. Guille, J.C. Merle, I. Perakis, J.Y. Bigot, Physical Review.B 60, 11738
(1999)
2. P.A. Hervieux, A. Benabbas, V. Halte, J.Y. Bigot, European Physical Journal D 24,
185 (2003)
3. Kawabata, R. Kubo. Journal of the Physical Society of Japan. 21, 1765-1772 (1966)
4. G. Weick, G.L. Ingold, R. A. Jalabert, D. Weinmann, Physical Review B. 74, 165421
(2006).
5. Y. Bigot, V. Halte, J.C. Merle, A. Daunois, Chemical Physics. 251, 181-203 (2000)
6. T. V. Shabazyan, I. E. Perakis, J.Y. Bigot, Physical Review Letters. 81, 3120 (1998)
7. C. Voisin, D. Christofilos, N. Del Fatti, F. Vallée, B. Prével, E. Cottancin, J. Lermé,
M. Pellarin M. Broyer. Physical Review Letter. 85, 2200 (2000)
8. http://www-ipcms.u-strasbg.fr/spip.php?article1020&lang=fr
9. http://www.webexhibits.org/causesofcolor/9.html
10. B. Valter, M.K.Ram, C.Nicolini, Langmuir. 18 (5), 1535–1541 (2002)
11. M. K. Ram, S. Carrere, S.Paddeu, E.Maccioni, C. Nicolini, Langmuir. 13 (10) 2760–
2765 (1997).
12. B.Valter, S. Carrara, M.K.Ram, C. Nicolini, Langmuir. 20 (3), 969–973 (2004)
13. S. Paddeu, M.K.Ram, S. Carrara, C. Nicolini, Nanotechnology. 9, 3 (1998)
14. A.C. Balazs, T.Emrick, T.P. Russell, Science. 314 (5802), 1107 – 1110 (2006)

74
15. J.Y.Song, H.K.Jang, B. S.Kim, Process Biochemistry. 44, (10), 1133-1138 (2009)
16. J. Zhang,
H. Liu, Z. Wang, N. Ming, Advanced Functional Materials. 17, 16, 3295–
330 (2007)
17. J. Hu, Z.Wang, J. Li. Sensors. 7, 3299-3311 (2007)
18. J.E. Park, M.Atobe, T. Fuchigami. Ultrasonics Sonochemistry. 13, (3), 237-241
(2006)
19. X. Zhou, J.M. E. Khoury, L.Qu, L.Dai, Q. Li, Journal of Colloid and Interface
Science. 308, (2), 381-384 (2007)
20. W. Wang, Q.Chen, C. Jiang, D. Yang, X. Liu, S. Xu, Colloids and Surfaces A
Physicochemical and Engineering Aspects. 301, (5), 73-7 (2007)
21. J. Kasthuri, S. Veerapandian, N. Rajendiran, Colloids and Surfaces: Biointerfaces.68,
(1), 55-60 (2009)
22. D. Philip, Spectrochimica Acta Part A: Molecular and Bimolecular Spectroscopy. 73,
4, 650-653 (2009)
23. J. Zhou, J.Ralston, R.Sedev, D.A. Beattie,Journal of Colloid and Interface Science.
331, 2, 251-262 (2009)
24. M. Nakamoto, Y.Kashiwagi, M. Yamamoto, Inorganica Chimical Acta.358,
(14), 4229-4236 (2005)
25. N. Saito, J.Hieda, O. Takai, Thin Solid Films. 518, (3), 912-917 (2009)
26. Z. Ma, H.Han, Colloids and Surfaces A: Physicochemical and Engineering
Aspects, 317, 1-3, 229-233 (2008)
27. P.Ravindra, Materials Science and Engineering: B. 163, (2), 93-98 (2009)
28. J. Jung, K. Na, J. Lee, K.-Woo Kim, J. Hyun. Analytica Chimical Acta, 651,(1),
91-97 (2009)
29. http://www.unl.edu/ncmn/cfem/microscopy/TEM.shtml
75
30. D. Kitenge, Master Thesis, University of South Florida, Tampa Florida, 2009
31. http://nano.tm.agilent.com/blog/page/3/?s
32. http://www.ntmdt.com/spm-basics/view/probe-sample-interaction-potential
33. http://www.csun.edu/~jeloranta/CHEM352L/experiment3.pdf
34. H.Yuan, W.Ma, C.Chen, J.Zhao, J.liu, H.Zhu, X. Gao, Chemistry of materials, 19
(7), 1592 –1600 (2007
35. A. Sugunan, C.Thanachayanont, J. Dutta, P. Juilland, J.G. Hilborn, Proceedings of
the International Conference on Smart/Intelligent Materials, Smart Material,(ISBN
974-656-288-8) 191-193 (2004)
36. C.R.Patra, R. Bhattacharya, D.Mukhopadhyay, P.Mukherjee, Advanced Drug
Delivery Reviews. 62, (3), 346-361 (2010)
37. X. Huang, M. A. E. Sayed, Journal of Advanced Research. 1, (1), 13-28 (2010)
38. R. Bhattacharya, C. R. Patra, A. Earl, S.Wang, A. Katarya, L. Lu, J. N.
Kizhakkedathu, M. J. Yaszemski, P.R. Greipp, D. Mukhopadhyay, P. Mukherjee
Nanomedicine: Nanotechnology, Biology and Medicine. 3, (3), 224-238 (2007)
39. K. Vig, S. Byoglu, V. Rangari, M. Miller, S. Pillai, S. R. Singh, Biophysical Journal.
655a (2010).
40. S. Boyoglu, K. Vi, A. Pfendt, S.Pillai, G. A Willing, S. R. Singh. Biophysical
Journal. 98 3, 192a-192a (2010).
41. M. Pumera, S. Sánchez, I. Ichinose, Jie, Sensors and Actuators B: Chemical. 123,
2, 1195-1205(2007)
42. L. Zhang, X. Jiang. Journal of Electroanalytical Chemistry. 583, (2), 292-299 (2005)
43. M. T. Castañeda, S. Alegret, A. Merkoci, Electroanalysis. 19 (7-8), 743 – 753 (2007)
44. G. K. Vertelov, A. Yu. Olenin, V. Lisichkin, Journal of Analytical Chemistry. 62,
9903–915 (2007).

76
45. S. Pramanik, P. Banerjee, A. Sarkar, S.C. Bhattacharya, Journal of Luminescence.
128, 1969-1974 (2008).
46. M. Iosin, F. Toderas, P.L. Baldeck, S. Astilean, Journal of Molecular Structure. 924-
926, 196-200 (2009)
47. S.Chah, M.R. Hammond, R. N. Zare, Chemistry & Biology. 12, (3), 323-328 (2005)
48. L.M. Ao, F. Gao,
B.F.Pan, D.X. Cui, H.C. Gu, Chinese Journal of Chemistry 24,
(2), 253 – 256 (2006)
49. R. K Joshi, F. E Kuris, Applied Physical Letters. 89, 153116 2007
50. A. Dieg´uez, A.Vila, A. Cabot, A. R. Romano, J. R.Morante, J. Kappler,
N.Barsan, U. Weimar, W. Goepel, Sensors and. Actuators B., 68, (94) (2000)
51. S. Shukla, S. Seal, L. Ludwig, C. Parish, Sensors and Actuators, B. 97, (256) 2004
52. N. Yamazoe, Sensors and Actuators B. 5, (7) 1991
53. R. K. Joshi, Q. Hu, F. Alvi, N. Joshi, A. Kumar, Journal of Physical Chemistry
C. 113 (36), 16199–16202 (2009)
54. http://www.prenhall.com/settle/chapters/ch15.pdf

About the Author
Nidhi Joshi has received her Bachelor of Science in 2002 and Master of Science in
Chemistry with first rank from Kumaon University Almora in 2004. In January 2009,
Nidhi was enrolled for the Master of Science in Material Science & Engineering
programm. Nidhi was a graduate research assistant for the Mechanical Engineering
department University of South Florida. After completing this program she would like to
do Ph. D. in nanomaterials technology.