gold, mines & commodities waiting for summer
TRANSCRIPT

All comments and analyses reflect CPR AM’s view of market conditions and its evolution, according to information known at the time. As a result of the simplified nature of the information contained in this document, that information is necessarily partial and incomplete and shall not be considered as having any contractual value.
Gold, mines & commodities… Waiting for summer Arnaud du Plessis - Senior Portfolio Manager, Global Thematic Equities, Natural Resources / Gold & Precious Metals In brief Gold was rather stable in May, trading within a range about $55 wide ($1214-1268/oz.), supported mainly by the weakness in the US dollar. The receding in inflation signals is not
good news for gold but is offset by a still-attractive environment of real interest rates. After its much awaited increase in US key rates in June (with a 90% probability priced in), the Fed could ease off the accelerator until December, which would provide a small boost to the gold market. In the meantime, gold often fares well in summer. With volatility at historic lows in most asset classes, the barbarous relic could get a boost in the event of disruptions… Gold prices ($/oz.) vs. Dollar Index & Dollar/Yen – 2 years
Gold prices ($/oz.) vs. US 10-year real yields & 5y 5y US Inflation Swap Fwd – 2 years
Source: Bloomberg
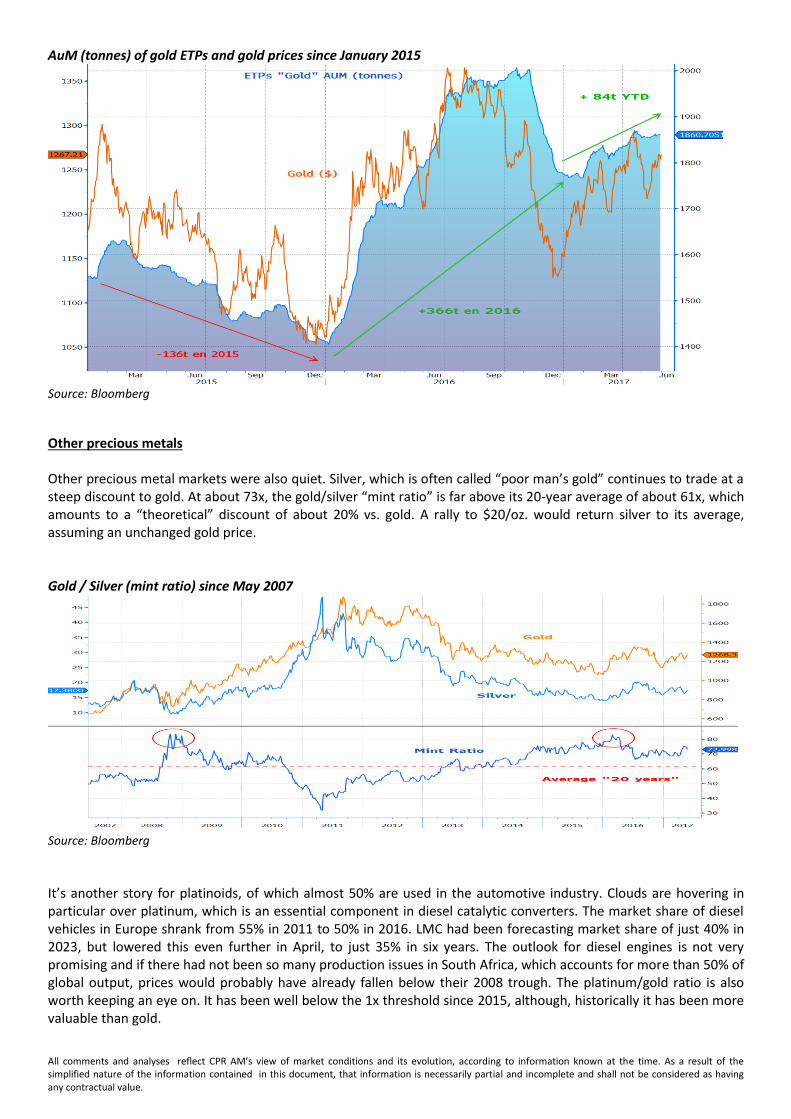
The physical market was also quiet, with the equivalent of about 5 tonnes cumulative in May, or 84 tonnes since January. In contrast, net open long futures positions fell by 3.6m oz. or about 112 tonnes.
All comments and analyses reflect CPR AM’s view of market conditions and its evolution, according to information known at the time. As a result of the simplified nature of the information contained in this document, that information is necessarily partial and incomplete and shall not be considered as having any contractual value.
AuM (tonnes) of gold ETPs and gold prices since January 2015
Source: Bloomberg
Other precious metals Other precious metal markets were also quiet. Silver, which is often called “poor man’s gold” continues to trade at a steep discount to gold. At about 73x, the gold/silver “mint ratio” is far above its 20-year average of about 61x, which amounts to a “theoretical” discount of about 20% vs. gold. A rally to $20/oz. would return silver to its average, assuming an unchanged gold price. Gold / Silver (mint ratio) since May 2007
Source: Bloomberg
It’s another story for platinoids, of which almost 50% are used in the automotive industry. Clouds are hovering in particular over platinum, which is an essential component in diesel catalytic converters. The market share of diesel vehicles in Europe shrank from 55% in 2011 to 50% in 2016. LMC had been forecasting market share of just 40% in 2023, but lowered this even further in April, to just 35% in six years. The outlook for diesel engines is not very promising and if there had not been so many production issues in South Africa, which accounts for more than 50% of global output, prices would probably have already fallen below their 2008 trough. The platinum/gold ratio is also worth keeping an eye on. It has been well below the 1x threshold since 2015, although, historically it has been more valuable than gold.

All comments and analyses reflect CPR AM’s view of market conditions and its evolution, according to information known at the time. As a result of the simplified nature of the information contained in this document, that information is necessarily partial and incomplete and shall not be considered as having any contractual value.
The situation is not as critical for palladium, which is used more in gasoline engines, especially as its much tighter market helps support prices. Be that as it may, the electric car revolution is under way. Many countries are studying and considering a real transition from thermal to electric, including the Netherlands, Norway, Germany and, more recently, India. On a European automobile market that is up 4.5% on the year to date, the pure-electric vehicle (PEV) segment has soared by 27%. Whereas, in 2015 and 2016 the European electric vehicle market was still dominated by PHEV (plug-in hybrid electric vehicle) models, the trend has reversed itself sharply since then, with a 34% surge in BEVs (battery electric vehicles), vs. +19% for PHEVs on the year to date. Platinum / Gold & Palladium / Platinum ratio – 10 years
Source: Bloomberg
What about other commodities? Other commodities fared poorly in May. Iron ore ($/-18%) and metallurgical coal ($/-40%) were hit especially hard. The trend was driven downward by the slowdown in China, as seen in the PMI Caixin survey’s falling below 50 in May, a one-year low, exacerbated by historically high Chinese inventories. Thermal coal was also weak ($/-12%), as was uranium ($/-14%), as the return to nuclear energy in Japan is unfolding more slowly than expected. Performances of the main commodities – 1 year (base 100: 31 May 2016)
Source: Bloomberg The oil market was especially volatile in May, with Brent trading in a range more than 12% wide ($47.8/53.7/bbl.). The eagerly awaited OPEC meeting did not encourage the market to hold onto its positions. Whereas the most

All comments and analyses reflect CPR AM’s view of market conditions and its evolution, according to information known at the time. As a result of the simplified nature of the information contained in this document, that information is necessarily partial and incomplete and shall not be considered as having any contractual value.
optimistic market participants had been hoping for an additional cut in output, the cartel settled for maintaining its current cuts for another nine months, until the end of March 2018. But maybe we shouldn’t be throwing the baby out with the bath water! OPEC and non-OPEC members, such as Russia, have pledged to lower global oil inventories to their average of the past five years. The Saudi energy minister, Khalid al Falih, even suggested that such a target could be met very quickly. All in all, Brent ended the month of May down 1.6% but more than 7% off its peak just before the meeting. In the US, although the trend is still tentative, inventories continue to shrink. The market continues to home in on weekly US reports, but it is important to remember that US inventories are in no way representative of the global situation, for which data are not necessarily available, particularly in emerging economies. WTI & DoE inventories (inverted scale) – 5 years
Source: Bloomberg
Equities update Momentum in commodities compared to global equities did not improve in May. Only wood and forestry shares outperformed. Materials on the whole were flat or up slightly. Energy continued to be beaten down, with a performance relative to materials at a low since 1997! 20-year performance of energy and materials (base 100: 31 December 1996)
Source: Bloomberg

All comments and analyses reflect CPR AM’s view of market conditions and its evolution, according to information known at the time. As a result of the simplified nature of the information contained in this document, that information is necessarily partial and incomplete and shall not be considered as having any contractual value.
One-year performance of the main global resources indices (base 100: 31 May 2016)
Source: Bloomberg
Goldmines ended the month of May up slightly ($/+1.8%), while remaining far more volatile that global equities. Despite their steep outperformance vs. global equities since bottoming out in January 2016 ($/85% vs $/35%), goldmines are still far off their September 2011 peak: $/-63% vs. $/+84% for the MSCI World.
Three-year performance of gold, goldmining shares and global equities – base 100: 31 May 2014
Source: Bloomberg

All comments and analyses reflect CPR AM’s view of market conditions and its evolution, according to information known at the time. As a result of the simplified nature of the information contained in this document, that information is necessarily partial and incomplete and shall not be considered as having any contractual value.
Commodities valuations are moving back to normal
Earnings forecasts momentum for commodities remained positive in May, in particular for energy, but also for goldmines, the latter turning up sharply late in the month, while still down 10% on the year to date. Earnings forecasts have been raised by 9% for energy and by 11.8% for materials since January, vs. 6.8% for global equities (MSCI World).
Energy and materials valuations continue to move back to normal. They are still relatively high by historical standards but are improving fast, particularly in energy. Goldmine valuations (EV/EBITDA) are fully in line with their three-year average.
Goldmines – MSCI Energy – MSCI Materials: EPS Momentum (1Yr) – P/E (3Yr) – EV/EBITDA – (3Yr)
Source: Bloomberg
A price/net asset value (P/NAV) approach, which is a more faithful rendering of mining asset valuations, goldmines in particular, highlights the de-rating seen since 2011 compared to 1985-2010.
Goldmining shares: P/NAV since 1985
Source: Company reports – Scotiabank GBM estimates

All comments and analyses reflect CPR AM’s view of market conditions and its evolution, according to information known at the time. As a result of the simplified nature of the information contained in this document, that information is necessarily partial and incomplete and shall not be considered as having any contractual value.
In the meantime, the commodities story is still far from moving back into investor favour, based on the monthly BofA Merrill Lynch – Signal survey, which is often contrarian…
Source: BofA Merrill Lynch Global Fund Manager Survey Completed on 2 June 2017 Information:
All comments and analyses reflect CPR AM’s view of market conditions and its evolution, according to information known at the time. As a
result of the simplified nature of the information contained in this document, that information is necessarily partial and incomplete and shall
not be considered as having any contractual value.
This document has not been drafted in compliance with the regulatory requirements aiming at promoting the independence of financial analysis or investment research. CPRAM is therefore not bound by the prohibition to conclude transactions of the financial instruments mentioned in this document. Any projections, valuations and statistical analyses herein are provided to assist the recipient in the evaluation of the matters described herein. Such projections, valuations and analyses may be based on subjective assessments and assumptions and may use one among alternative methodologies that produce different results. Accordingly, such projections, valuations and statistical analyses should not be viewed as facts and should not be relied upon as an accurate prediction of future events.
About CPR Asset Management: CPR AM is an investment management company certified by the French Financial Markets Authority, an autonomous and wholly owned subsidiary of Amundi Group. CPR AM works exclusively in third-party investment management (for institutional, corporate, insurance, private banking, fund management, and wealth management clients). CPR AM covers the main asset classes, including equities, convertibles, diversified investments, interest rates and credit). CPR AM in figures (End-March 2017) – More than €42 billion in AuM - More than 100 employees, more than one third of whom are involved in investment management.
CPR ASSET MANAGEMENT, limited company with a capital of € 53 445 705 - Portfolio management company authorized by the AMF n° GP 01-056 - 90 boulevard Pasteur, 75015 Paris - France – 399 392 141 RCS Paris.
cpr-am.com @CPR _AM cpr-asset-management