goal 1: graduation rate / bridging the gap reporting
TRANSCRIPT

PCS / Data Reporting Template / Bridging the Gap Plan Quarterly Data Template / 2020-21
Goal 1: Graduation Rate Pinellas County Schools / Bridging the Gap Reporting Template / 2020-21
Data Reporting Template Action Goal (1.a.): Eliminate the gap between the graduation rates for black and non-black students. Goal Manager: Rita Vasquez, Executive Director, High School Education
Baseline Condition (as of 2015-16) Short-Range Target: Long-Range Target: Pinellas County Schools has a graduation rate for all
students of 80.1% and a rate for black students of 65.5%. The district has seen a 10.9 percentage point increase in graduation rate among black students since 2012, with an improvement among all students of 8.1 percentage points. A gap in graduation rates still exists between black (65.5%) and non-black (83.4%) students, a gap of 17.9 percentage points.
Increase the graduation rate for black students and decrease the gap by an average of 1.8% each year.
Increase the graduation rate for black students each year with the goal of eliminating or greatly narrowing
the gap within 10 years.
Annual Outcomes: To narrow or eliminate the gap between the graduation rates for black and non-black students within 10 years, PCS will monitor incremental change for the following annual outcomes:
Annual Outcome Measures Baseline
(2015-16) Planning Year (2016-17) 2017-18 2018-19 2019-20
2020 Target
Graduation Rate: # and % of black students who graduated on time with a standard, high school diploma / 4-year senior cohort.
Black
(932) 65.5%
Actual 69.3% 76.2% 81.3% 85.5%
75.0 Target 67.3% 69.1% 70.9% 72.7%
Non-Black 83.4% Actual 85.8% 88.1% 90.0%
92.7% 10.7 GAP 17.9 Actual 16.5 11.9 8.7 7.2
Related Outcomes Measures (Data below include all high school sites) # and % of black students in high school (grades 9-11) with a 2.0 or above GPA.
(2,412) 70.0%
Actual 70.0%
69.4% (2553/36890 (255(2553/36
90
76.6%
(2553/36890 (255(2553/36
90
68.9%
# and % of black students in high school (grades 9-11) with Algebra 1 credit / passing score on state Algebra 1 EOC.
No Baseline Data
Established
Actual
60.0%
65.3%
45.8%
Data not available for
2019-20.
# and % of black students in high school (grades 9-11) with required credits earned to date.
No Baseline Actual 81.6%
81.0% 77.1% 79.7%

Data Established
# and % of black students in high school (grades 9-10) with Level 3 or above on state ELA assessment (FSA ELA).
(530) 21.8%
Actual 22.0% 24.0%
24.6%
Data not available for 2019-20. No state testing.
# and % of black students who graduated with a standard diploma via a concordant assessment score (WFT).
(242) 26.0%
Actual (371) 39.8%
(448) 42.9%
(471) 44.1%
(434) 41.0%
# and % of black students who graduated with standard diploma via an ESE assessment waiver (WFW or WRW).
(98) 10.5%
Actual (100) 10.7%
(78) 7.5%
(53) 5.0%
(58) 5.5%
Strategies & In-Process Measures
Throughout the year, PCS will monitor the following strategies and in-process indicators for incremental change to ensure the strategies are effectively narrowing or eliminating the gap between the graduation rates for black and non-black students. NOTE: Not all strategies in this plan are listed below for monitoring. Only those strategies specific to black learners and those required to support the fidelity of the plan and related research questions are listed below. The full plan with all of the district’s actions listed is available on the district’s website at pcsb.org/btg.
In-Process Reporting Frequency
Progress Tracking
Action Steps In-Process Indicators Delivery Method Quarter 1
Q1 Quarter 2
Q2 Quarter 3
Q3 Quarter 4
Q4
In-Process indicator common for all action steps
% of black students meeting graduation readiness standards per grade level expectations (Grade 5 /
Grade 8 /Grade 9) Data rules: % of students who have at least Level 2 on the FSA ELA and MATH tests and no D or F grades exiting 5th grade and a 2.0 GPA or above exiting 8th grade. For 9th grade, % of students with satisfactory credits and at least a 2.0 GPA.
Semester Report
Grade 5:
443 / 1,091
40.1%
Grade 8:
524 / 1,240
42.3%
Grade 9:
784 /1,501
52.2%

Action Steps In-Process
In-Process Indicators Reporting Frequency
Progress Tracking Delivery Method Quarter 1
Q1 Quarter 2
Q2 Quarter3
Q3 Quarter 4
Q4
1.2 Provide each high school the specific standards from district assessments in English, Mathematics, Biology, and U.S. History to support schools in identifying course concepts and standards that need to be re-taught to improve student mastery and reduce the likelihood of course failures for black learners.
% of black students performing at or near proficiency on district cycle assessments by each subject
Quarterly Informal
Report
75% / Gr. 9 Writing
(638/853)
59% / Gr. 9
Reading (512/874)
81% / Gr. 10
Writing (547/676)
45% / Gr. 10
Reading (325/725)
31%/ Alg. 1 (97/312)
46%/ Bio (451/981)
52% / US Hist
(302/581)
43% / Geo
(538/1,252)
80% / Gr. 9 Writing
(623/775)
66% / Gr. 9
Reading / Test version 1 (301/459)
38% / Gr. 9
Reading / Test version 2 (89/232)
84% / Gr. 10
Writing (555/664)
50% / Gr. 10
Reading / Test version 1 (346/686)
32% / Gr. 10
Reading / Test version 2 (56/176)
39%/ Alg. 1
(472/1,211)
54%/ Bio (570/1,056)
62% / US Hist
(378/606)
45% / Geo
(600/1,334)
Data rules: % is out of students who tested on district Cycle 1 assessments and scored at or near proficiency as represented by yellow and green color bands (most likely to succeed on state assessments).
Note: Cycle 1 is
reported in Q1.
Cycle 2 is reported
in Q2. No reporting
for second semester
as students take
state FSA and EOC
tests and not district
assessments.

1.3 Assign district instructional experts (staff developers) to identified high schools to work directly with black seniors who are in need of additional ELA-reading or math support to graduate on time.
# of schools assigned staff developers # of staff developers providing support
Semester Informal
Report
District staff developers have been working in schools covering
classroom vacancies in
response to the COVID-19 health crisis. In light of
this change, district staff have provided training
and curriculum materials for small group
pullouts for 9th and 10th grade black students who are L1/L2 and are paying school-based teachers to provide this support as in-school
interventionists.
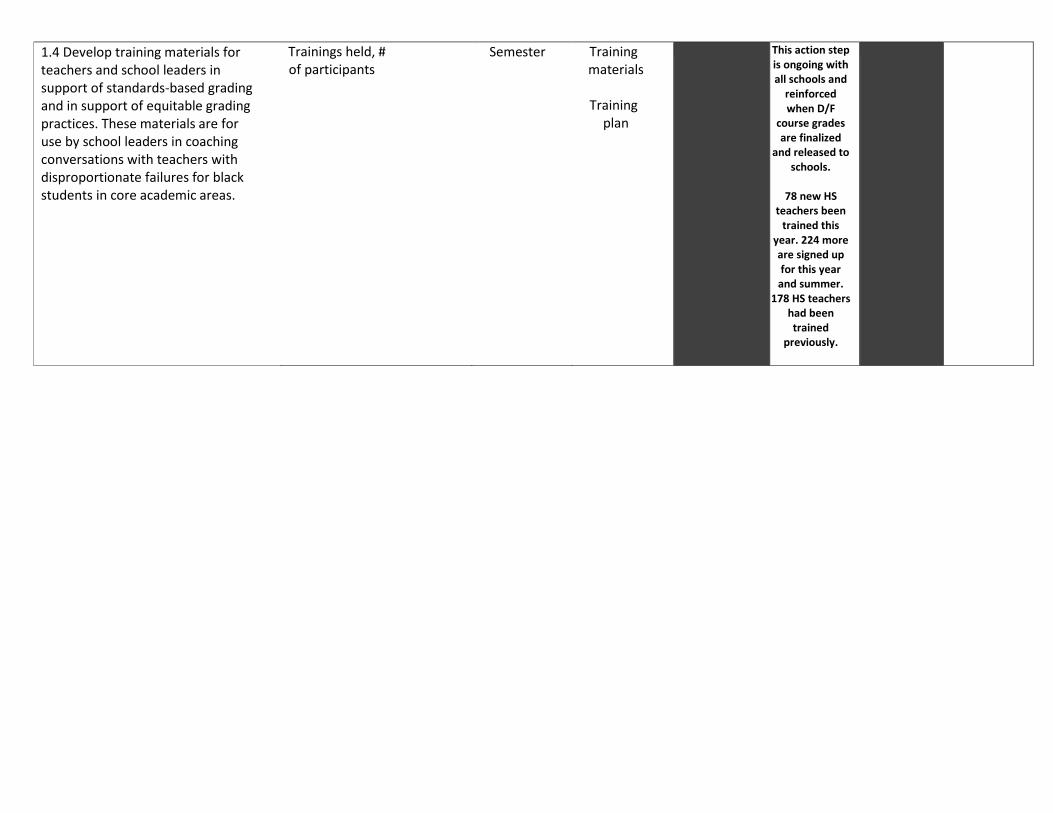
1.4 Develop training materials for teachers and school leaders in support of standards-based grading and in support of equitable grading practices. These materials are for use by school leaders in coaching conversations with teachers with disproportionate failures for black students in core academic areas.
Trainings held, # of participants
Semester Training materials
Training
plan
This action step is ongoing with all schools and
reinforced when D/F
course grades are finalized
and released to schools.
78 new HS
teachers been trained this
year. 224 more are signed up for this year
and summer. 178 HS teachers
had been trained
previously.

Action Steps In-Process In-Process Indicators Reporting
Frequency
Progress Tracking Delivery Method Quarter 1
Q1 Quarter
2 Q2 Quarter
3 Q3 Quarter 4
Q4
1.6 Develop a learner profile and personalized monitoring plans for all black students who are not on track to graduate.
#, % of black students in MS Semester Informal and HS not on track. % with Report a profile and plan in place
56% not on
track and with an active plan in
place.
1.7 Provide side-by-side coaching as needed to high school leadership teams, assistant principals, and principals on using the Graduation Status Reports to focus support for black students and review personalized learning plans for students not on track to graduate.
# of schools visited Quarterly Informal for coaching support Report
Virtual grad support
meetings have taken place at all
high schools during Q1 this school
year.
Same as Q1.
Virtual supports only in light of COVID-
19 health crisis.
Same as Q1. Virtual supports only in light of
COVID-19 safety protocols.
Additionally, virtual meetings were held in Q3
specific to seniors who were not-on-
track due to GPA and credits. PCS staff analyzed
every students’ records and
ensured they were in credit
recovery courses.
1.8 Provide school leadership teams with the following monthly data specific to black students who are not on track: 1) Mid- grading period core course failing grades; 2) Grading Period core course failures; 3) Semester 1 and 2 core course failures; 4) FSA 10th Grade ELA results 5) FSA ALG 1 EOC results.
# and % of schools provided data reports each month
Semester Informal Report
Most data reports (Items 1-
3) have been completed for
all schools during Q1 and Q2. Items 4-5
are not available due to no Spring FSA in 2019-20.

In-Process Action Steps In-Process Indicators Reporting
Frequency
Delivery Method Quarter 1
Q1 Quarter 2
Q2 Quarter 3
Q3 Quarter 4
Q4
1.10 Ensure that all black students who are not on track to graduate are participating in extended learning opportunities before and after school and in the extended school year program (Summer Bridge) as needed. Employ recruitment and targeted resources strategies, including partnering with the community, to increase attendance for black students in all extended learning programs.
# and % of black students in high school who are not on track (grades, credits) – Grades 9-11
Quarterly (except Q1)
Informal Report
9th: 784 / 1,501
52.2%
10th: 834 / 1,333
62.6%
Data rules:
All grades, <2.0
GPA, 9th <3 credits,
10th <9 credits, 11th
<15 credits
9th:
10th:
11th:
Data rules:
All grades, <2.0
GPA, 9th <3 credits,
10th <9 credits, 11th
<15 credits
# and % of black students in high school not on track who are attending HS Extended Learning Programs. (Summer Bridge enrollment reported under Goal 2).
Quarterly Informal Report
1.11 Ensure black students who are not on track to graduate are participating in "in-school" credit recovery classes to recover failed core courses and raise grade point averages to meet graduation requirements.
# and % of black students in high school not on track enrolled in in-school credit recovery programs.
Annually Informal Report
100% of black seniors not-on-
track to graduate are in scheduled into APEX credit recovery during
the school day or via ELP (Extended
Learning).
S1/ black students earned
601 out of the 1,924 semester
course completions in
APEX (31.2% of all course
completions).

1.12 Ensure all black students participate in college readiness testing, such as ACT or SAT. Ensure that these testing options are tied to personalized learning plans for students who are not on track to graduate.
% of black students participating in
college readiness testing
Annually Informal Report
100% of black
juniors and seniors not on
track to graduate are registered for
the March testing.
Action Steps In-Process
In-Process Indicators Reporting Frequency
Delivery Method
Progress Tracking
Quarter 1 Q1
Quarter 2 Q2
Quarter 3 Q3
Quarter 4 Q4
1.15 Set up parent conferences with all black students who are not on track to graduate to review personalized learning plans.
% of required conferences held for students who are not on track
Semester Informal
Report
% of black families who report that they are satisfied or highly satisfied with school communication
Annually Survey

Goal 2: Student Achievement Pinellas County Schools / Bridging the Gap Reporting Template / 2020-21
Data Reporting Template
Action Goal (1.b.): Eliminate the gap between the proficiency rates on state and national assessments for black and non-black students. Goal Manager: Kevin Hendrick, Associate Superintendent, Teaching and Learning
Baseline Condition (as of 2015-16)
Short-Range Target:
Long-Range Target: Pinellas County Schools has a proficiency rate on the Florida Standards Assessment (FSA) for ELA-Reading of 56.4% for non-black students and 24.2% for black students, a gap of 32.2. The proficiency rate on the FSA for Math is 60.9% for non-black students and
27.9% for black students, a 33-point gap. Smaller gaps are found on national norm-referenced tests such as the ACT and SAT. For purposes of this goal, the gap is
defined as the difference in performance between black and non-black students on state and national
norm-referenced assessments.
Decrease the gap in ELA-Reading and Math proficiency for black students by an average of 3.2%
each year on state assessments.
Increase the proficiency for black students and decrease the gap on state assessments by an average of 3.2% each year, with a target of equal proficiency
for black and non-black students on state assessments.

Annual Outcomes:
To narrow or eliminate the gap between proficiency rates on state-required and national assessments for black students and non-black students within 10 years, PCS will monitor incremental change for the following annual outcomes:
Annual Outcome Measures / ELA and Math Baseline
(2015-16) Planning Year (2016-17) 2017-18 2018-19 2019-20 2020 Target
# and % of black students districtwide scoring Level 3 or above on state FSA ELA-Reading.
Black (2,494) 24.2%
(2,654) 25.7%
(2,533) 24.6%
(2,831) 27.1%
No data available for
2019-20. Suspension
of state testing.
40
Target 27.4 30.6 33.8 37.0
Non-Black Actual 57.7 57.4 59.7
GAP Actual 32.0 32.8 32.6 No data
available for 2019-20.
# and % of black students districtwide scoring Level 3 or above on FSA Math.
Black (2,143) 27.9%
(2,305) 29.0%
(2,319) 29.2%
(2,336) 30.0%
No data available for
2019-20. 45
Target 31.1 34.3 37.5 40.7
Non-Black Actual 62.0 62.2 62.8 No data
available for 2019-20.
GAP Actual 33.0 33.0 32.8 No data
available for 2019-20.
Related Outcome Measures / ELA and Math
# and % of black students in Grades 3-5 scoring Level 3 or above on state FSA ELA-Reading / elementary.
(1,129) 26.5%
Actual (1,302) 29.5%
(1,191) 27.0%
(1,302) 29.6%
No data available for
2019-20.
# and % of black students in Grades 6-8 scoring Level 3 or above on state FSA ELA-Reading / middle school
(835) 23.1%
Actual (859) 23.5%
(811) 22.0%
(970) 25.6%
No data available for
2019-20.

# and % of black students in Grades 9-10 scoring proficient / Level 3 or above on FSA ELA-Reading / high school.
(530) 21.8%
Actual (493) 22.0%
(531) 24.0%
(559) 24.6%
No data available for
2019-20.
# and % of black students in Grades 3-5 scoring Level 3 or above on FSA Math / elementary.
(1,438) 33.7%
Actual (1,607) 36.2%
(1,632) 36.8%
(1,594) 36.6%
No data available for
2019-20.
# and % of black students in Grades 6-8 scoring Level 3 or above on FSA Math / middle school.
(705) 20.7%
Actual (698) 19.9%
(687) 19.6%
(742) 21.7%
No data available for
2019-20.
Other Outcome Measures
# and % of black students in Grades K-2 scoring proficient in reading / at or near grade level on norm-referenced assessments.
NA / New Assessment
Begins in 2017-18
Actual
(2,271) 55%
Proficient: 1061, 26%
Near
Proficient: 1210, 29%
(2,220) 55%
Proficient: 1039, 26%
Near
Proficient: 1181, 29%
(2,673) 58%
Proficient: 1541, 37%
Near
Proficient: 1132, 21%
# and % of black students in Grades K-2 scoring proficient in math / at or near grade level on norm-referenced assessments.
NA / New Assessment
Begins in 2017-18
Actual
(2,361) 57%
Proficient: 1215, 30%
Near
Proficient: 1146, 28%
(2,292) 57%
Proficient: 1151, 29%
Near
Proficient: 1141, 28%
(2,664) 53%
Proficient: 988, 37%
Near
Proficient: 1676, 16%
# and % of black students with A, B, C grades (no D or F grades) / elementary school / grade 5 (core courses only).
No baseline established
Actual (975) 76.2%
(990) 74.3%
(1,060) 74.9%
TBD
# and % of black students with an A, B, C average (2.0 GPA) / middle school / all grades / 6-8 (core courses only).
No baseline established Actual
(2,895) 76.4%
(3,268) 75.8%
(3,345) 85.0%
(3,492) 85.6%
# and % of black students with a college ready score on the ACT or SAT / reading / compared to state.
No baseline established Actual
108 black seniors
Combined
average 11% on either ACT
or SAT
2019 ACT
State: Reading Avg for black students / 17.9
Pinellas: Reading Avg for black students / 16.1
2019 SAT: State: Reading-Writing Avg for black students
/ 470 Pinellas: Reading-Writing Avg for black
students / 451

Strategies & In-Process Measures Throughout the year, PCS will monitor the following strategies and in-process indicators for incremental change to ensure the strategies are effectively narrowing or eliminating the gap between the proficiency rates on state and national assessments for black and non-black students. NOTE: Not all strategies in this plan are listed for monitoring. Only those strategies specific to black learners and those required to support the fidelity of the plan and related research questions are listed below. The full plan with all of the district’s actions listed is available on the district’s website at pcsb.org/btg.
Action Steps In-Process Indicators In-Process Reporting Frequency
Delivery Method
Progress Tracking
Quarter 1 Q1
Quarter 2 Q2
Quarter 3 Q3
Quarter 4 Q4
In-Process indicators common for all action steps
% of black students at or near proficiency on district cycle-progress monitoring assessments for ELA-reading and math.
Semester
Informal Report
Cycle 1 / FALL
30% / Gr. 3-5 Reading (1,090/3,718)
23% / Gr. 3-5 Math (841/3,696)
32% / Gr. 6-8 Reading (899/2,772)
46% / Gr. 6 Math (394/852)
55% / Gr. 7 Math (511/922)
50% / MS Pre-Alg. (300/598)
80% / MS Alg. 1 (192/241)
Cycle 2 / SPRING
29% / Gr. 3-5 Reading (1,090/3,899)
25% / Gr. 3-5 Math (978/3,881)
36% / Gr. 6-8 Reading (1,025/2,858)
42% / Gr. 6 Math
(441/1,034)
52% / Gr. 7 Math (655/1,265)
32% / MS Pre-Alg. (246/780)
78% / MS Alg. 1 (221/285)
# and % of black students with a college ready score on the ACT or SAT / math / compared to state.
No baseline established Actual
108 black seniors
Combined
average 11% on either ACT
or SAT
2019 ACT:
State: Math Avg for black students / 16.4
Pinellas: Math Avg for black students / 15.1
2019 SAT: State: Math Avg for black students / 432
Pinellas: Math Avg for black students / 406

Action Steps In-Process Indicators In-Process Reporting Frequency
Delivery Method
Progress Tracking
Quarter 1 Q1
Quarter 2 Q2
Quarter 3 Q3
Quarter 4 Q4
75% / Gr. 9 Writing
(638/853)
59% / Gr. 9 Reading (512/874)
81% / Gr. 10 Writing
(547/676)
45% / Gr. 10 Reading (325/725)
31% / HS Alg. 1
(97/312)
46%/ HS Bio (451/981)
52% / HS US Hist
(302/581)
43% / HS Geo
(538/1,252)
80% / Gr. 9 Writing
(623/775)
66% / Gr. 9 Reading / Test version 1 (301/459)
38% / Gr. 9 Reading / Test
version 2 (89/232)
84% / Gr. 10 Writing
(555/664)
50% / Gr. 10 Reading / Test version 1 (346/686)
32% / Gr. 10 Reading / Test
version 2 (56/176)
39%/ Alg. 1
(472/1,211)
54%/ Bio (570/1,056)
62% / US Hist
(378/606)
45% / HS Geo (600/1,334)
2.2 Provide targeted professional development and instructional coaching to teachers on culturally
Training calendar Annually Website Calendar
published. Available.

Action Steps In-Process Indicators In-Process Reporting Frequency
Delivery Method
Progress Tracking
Quarter 1 Q1
Quarter 2 Q2
Quarter 3 Q3
Quarter 4 Q4
relevant teaching strategies and teaching with an equity mindset to increase engagement of black learners and increase the percentage of proficient students.
AVID’s Culturally Relevant Teaching training
# of teachers trained / % of teachers trained to date
Semester Informal Report
2,465
Approx. 36%
of all teachers
2,756
Approx. 40%
of all teachers
Equity Champions / Mindset training
# of Equity Champions credentialed as trainers, # PD sessions held by Equity Champions
Semester Informal Report
514 Equity Champions
17 sessions
held by school- based Champions in
Q1
515 Equity Champions
19 sessions
held by school- based Champions in
Q1
Additional Coaching
# of teachers who have participated in follow-up training or coaching regarding culturally relevant teaching or equity mindset
Quarterly Informal Report
Summer:
1,230 teachers attended
equity trainings
Q1: 442 teachers attended
equity trainings
Q2: 354 teachers attended
equity trainings
District Equity
Training: 3 whole staff, 26
small group, 26 individual
teacher coaching
Q3: 304 teachers attended
equity trainings
District Equity
Training: 1 whole staff, 26
small group, 27 individual
teacher coaching
Equity
Champions: 20 school-based
sessions led by Equity
Champions

Action Steps In-Process Indicators In-Process Reporting Frequency
Delivery Method
Progress Tracking
Quarter 1 Q1
Quarter 2 Q2
Quarter 3 Q3
Quarter 4 Q4
# of teachers trained in implementing equitable grading practices
Semester Informal Report
256
% of black students earning A, B and C grades / elementary (Grade 5)
Semester Informal Report
Grade 5:
734 / 1,256
58.4%
% of black students earning A, B, and C grades (2.0 GPA) / middle (Grades 6-8)
Semester Informal Report
Grade 6-8:
3,316 / 4,020
82.5%
% of black students exiting middle school on track for high school (at least a 2.0 GPA and Level 2 or better on FSA ELA) / (Rising 9th)
Note: High school data found under Goal 1 above.
Semester Informal Report
Grade 8:
524 / 1,240
42.3%
2.3 Implement culturally relevant instructional practices in classrooms such as oral language and storytelling, cooperative and small group settings, music and movement, morning meetings, explicit vocabulary instruction, monitoring with feedback, and deliberate use of cultural references in lesson plans in order to increase
# of classrooms observed
Quarterly Informal Report
Q1 / Formal
classroom observations
not conducted in accordance with COVID-19
safety protocols.
S1 / Formal
classroom observations
not conducted in accordance with COVID-19
safety protocols.
Q3 / Formal
classroom observations
not conducted in accordance with COVID-19
safety protocols.
No visits
quarter 4.
Schools not visited in Q4.

Action Steps In-Process Indicators In-Process Reporting Frequency
Delivery Method
Progress Tracking
Quarter 1 Q1
Quarter 2 Q2
Quarter 3 Q3
Quarter 4 Q4
the percentage of proficient students.
% of classrooms observed where culturally relevant practices are evident
Quarterly Informal Report
2.5 Commission an Anti-Racist Curriculum Review Task Force to examine curriculum from an anti-racist perspective and implement recommendations from task force for the coming school year(s).
# of meetings held by committee
Annually
Informal Report
# of proposed changes to curriculum implemented by district
Annually Informal Report
2.6 Determine possible causes of disengagement and underachievement by black students and pilot possible solutions via implementation of School Climate Transformation Grant at five district middle schools.
Results from School Climate Transformation Grant annual report
Annually Formal Report
2.9 Implement effective intervention strategies based on the close monitoring of students with personalized monitoring plans.
Targeted intervention strategies provided to schools
Annually Strategies menu
Strategies and
personal tracking tool
provided

Action Steps In-Process Indicators In-Process Reporting Frequency
Delivery Method
Progress Tracking
Quarter 1 Q1
Quarter 2 Q2
Quarter 3 Q3
Quarter 4 Q4
Ensure that evidence-based interventions are in place in the primary grades (i.e., Reading Recovery in 1st Grade).
#, % of black students who are tracked via a personalized plan of support (grade K-5)
Semester Informal Report
3,068 with progress
monitoring plans
# of elementary schools implementing Reading Recovery
Annually 14
#, % students in Reading Recovery who are black
Semester 82 / 61% in 1:1 program. 246 / 69% in small
groups.
#, % of black students in Reading Recovery who are meeting grade-level proficiency / growth targets
Semester Of 82 students in 1:1, 72%
met 1st grade reading level
by end of Semester 1
2.13 Ensure that black students are participating in extended learning opportunities before and after school and in the extended school year program (and Summer Bridge) through recruitment and targeted resources.
# and % of black students who are not on track / ES, MS, HS (GPA below 2.0 and-or FSA Levels 1 or 2) (Grades 4-10)
Semester Informal Report
ES: 1,235 (44%)
MS: 3,091 (73%)
HS: 2,071 (73%)
# and % of black students not on track who are attending Extended Learning Programs. Note: Summer Bridge from previous summer is reported in Quarter 1 only.
Quarterly Informal Report
6,397 black
students are off track. 557
enrolled in ELP in Q1 (9%).
(Data reported for grades 4-
10).
SB: 3,916
black students attended
5,971 black
students are off track. 799
enrolled in ELP in Q2 (13%).
(Data reported for grades 4-
10).
5,894 black
students are off track. 695
enrolled in ELP in Q2 (11%).
(Data reported for grades 4-
10).

Action Steps In-Process Indicators In-Process Reporting Frequency
Delivery Method
Progress Tracking
Quarter 1 Q1
Quarter 2 Q2
Quarter 3 Q3
Quarter 4 Q4
Summer Bridge.
(25.9% of all participants).
2.15 Identify and monitor the number of minority students participating in enrichment opportunities, such as STEM (Science, Technology, Engineering, and Mathematics) Academies, academic competitions, arts opportunities and clubs.
# and % of black students participating in STEM or related enrichment programs / by level
Annually Informal Report
2.16 Ensure that elementary schools with high minority enrollments provide additional, strategically-focused time during and after school to support academic interventions and flexible instructional delivery (including intervention program specific to increasing 3rd grade proficiency).
# of schools with high minority enrollments (defined as at least 40% black enrollment)
Semester Informal Report
22
22
# of high minority schools offering additional instructional time (extended school day, etc.)
Semester Informal Report
11
11
# of black students in high minority schools entering 3rd grade below proficient
Annually Informal Report
179
# of black 3rd grade students in high minority schools participating in proficiency / intervention support program
Quarterly Informal Report
179
517
268
No Data for Q4 —
Intervention ended in Q3.
2.17 Partner with families to monitor usage among black students of digital resources that are provided
# and % of schools providing these programs
Annually Informal Report
100% of schools
through PCS Connects

Action Steps In-Process Indicators In-Process Reporting Frequency
Delivery Method
Progress Tracking
Quarter 1 Q1
Quarter 2 Q2
Quarter 3 Q3
Quarter 4 Q4
beyond the school day through PCS Connects, Connect for Success computer (for increased access to iReady, iStation, Dreambox and myOn), Math Nation, Reading Plus, Personalized Learning Pathway (PLP) and Khan Academy.
# and % of black students participating / users
Semester Informal Report
100% of black students via
Clever
% of black students participating in the programs who have improved their reading or math skills / assessments
Annually Research report
2.20 Design an engaging, robust outreach program for black students who are behind academically in elementary school in offering them personalized support on how to access district choice programs so as to increase black enrollment in middle and high school programs and placement into AVID courses.
Creation of program, outreach provided to families / # of families contacted
Semester Informal Report
Program created.
Phone calls made as
outreach to families.
#, % of black students enrolled in district choice programs / MS and HS
Annually Formal Report
2.21 Ensure Parent Academy events are provided in locations that make attendance convenient for black families.
# of events / locations across the district
Semester Informal Report
25 webinars
# of black families attending at each location
Semester Informal Report
87 families
2.22 Support teachers by providing professional development on building relationships and sharing student data with black families.
# of schools, teachers targeted for training
Semester Informal Report
25
% of black families who report that they are satisfied or highly satisfied with school communication
Annually Report

Action Steps In-Process Indicators In-Process Reporting Frequency
Delivery Method
Progress Tracking
Quarter 1 Q1
Quarter 2 Q2
Quarter 3 Q3
Quarter 4 Q4
2.23 Provide parent workshops in high minority schools that are "linked to student learning" in collaboration with Dr. Karen Mapp. Empower parents by providing a deeper understanding of student data, resources available and personalized learning plans.
# and % of high minority schools hosting parent workshop events linked to learning
Semester Informal Report
17 targeted
schools
# of families of black students in attendance / average
Semester Informal Report
55 families

Annual Outcomes:
To narrow or eliminate the gap between accelerated participation and performance rates for black and non-black students within 10 years, PCS will monitor incremental change for the following annual outcomes:
Annual Outcome Measures Baseline
(2015/16) Planning Year (2016-17) 2017-18 2018-19 2019-20
2020 Target
Grades 6-12 / # and % of total black students in grades 6-12 enrolled in any middle or high school advanced or accelerated course.
(3,792) 12.1%
Actual (3,775) 11.9%
(4,691) 13.7%
(5,269) 14.5%
(5,666) 15.1%
17.0
Target 13%
14%
15%
16%
Goal 3: Advanced Coursework Pinellas County Schools / Bridging the Gap Reporting Template / 2020-21
Data Reporting Template
Action Goal (1.c.): Eliminate the gap between accelerated participation and performance rates for black and non-black students.
Goal Manager: Judith Vigue, Director, Advanced Studies
Baseline Condition (as of 2015-16)
Short-Range Target:
Long-Range Target: Pinellas County Schools has a participation rate that ranges from 12.8% for black students in high school
honors classes to 9.1% in high school accelerated courses. The percentage of black students enrolled in career programs (CAPE) is about 17%. The total gap in
enrollment among all advanced and accelerated courses for 2015-16 was 5.9 percentage points.
Increase the percentage of black students enrolled in advanced and accelerated courses by an average of 1% each year, and increase the percentage of black
students earning college credit and industry certifications by .5% each year.
Increase the percentage of black students enrolled in advanced and accelerated courses by 1% each year to
meet or exceed the percentage enrollment of black students (which was 18% in 2015-16), as well as
increase the percentage of black students earning college credit and industry certifications to meet or
exceed the district or state average.

Annual Outcome Measures Baseline
(2015/16) 2016-17 2017-18 2018-19 2019-20
2020 Target
Related Outcome Measures
# and % of black middle school students enrolled in an advanced course.
(1,583) 12.6%
Actual (1,540) 12.5%
(1,859) 13.3%
(2,253) 14.2%
(2,521) 15.5%
# and % of black middle school students enrolled in an accelerated (high school) course.
(443) 8.9%
Actual (309) 8.1%
(368) 8.3%
(378) 8.2%
(451) 9.5%
# and % of black high school students enrolled in an honors course.
(2,052) 12.3%
Actual (2,225) 12.8%
(2,528) 14.9%
(2,656) 15.3%
(2,899) 15.6%
# and % of black high school students enrolled in an accelerated course (AP, IB, AICE, or Dual Enrollment).
(718) 8.6%
Actual (857) 9.1%
(996) 9.6%
(1,020) 9.6%
(1,335) 10.9%
# and % of black students in high school enrolled in a career, technical education course (high schools).
(2,503) 14.2%
Actual (2,459) 13.8%
(2,555) 13.8%
(2,507) 13.4%
(2,589) 14.0%
# and % of black students enrolled in district choice / application programs / total across the district
(1,167) 6.3%
Actual
(1,235) 6.8%
(3,830) 18.9%
(4,428) 18.3%
TBD
% black middle school students earning high school credit through accelerated coursework.
(663) 3.3%
Actual (509) 2.5%
(604) 3.0%
(608) 16.0%
(1,118) 26.0%
% of black students in high school completing an industry
certification (measured as % of black graduates).
No baseline
data established
Actual
31%
23%
16%
15%

Strategies & In-Process Measures
Throughout the year, PCS will monitor the following strategies and in-process indicators for incremental change to ensure the strategies are effectively narrowing or eliminating the gap between accelerated participation and performance rates for black and non-black students. NOTE: Not all strategies in this plan are listed for monitoring. Only those strategies specific to black learners and those required to support the fidelity of the plan and related research questions are listed below. The full plan with all of the district’s actions listed is available on the district’s website at pcsb.org/btg. Progress Tracking
Action Steps
In-Process Indicators In-Process Reporting Frequency
Delivery Method
Quarter1
Q1
Quarter2
Q2
Quarter3
Q3
Quarter4
Q4
3.5 Implement Plan B eligibility measures and related processes in support of a wider identification of students for gifted services.
# of black students screened for gifted through universal screening process
Annually Informal Report
1,261 of 5,266 total (24% of
group screened in 2021)
# and % of black students identified for further evaluation as a result of universal screening
Annually
Informal Report
# of students found eligible through Plan B measures, process
Annually
Informal Report
% of black students identified via Plan B compared to non-black students
Annually
Informal Report
3.6 Ensure equitable access for black students to on-site, college readiness testing in every high school (PSAT, ACT, SAT).
% of black seniors in high school participating in college readiness testing
Annually Informal Report
# and % of black high school students earning a college-readiness score
Annually Informal Report

3.10 Provide the accelerated component report, related talking points, and an Acceleration Plan template to principals and counselors to be used in individual meetings with black students who have not yet successfully completed an accelerated option.
% of black seniors who have successfully completed an accelerated course or industry certification
Annually Reporting Template
313/1162
(27%) have completed
an accelerated
option; 359/1162
(31%) are in process
now.
3.11 Provide side-by-side coaching as needed to assistant principals and principals on how to support their school counselors on using their SAT Suite of Assessments data and academic data disaggregated by race to identify black students who could take more rigorous classes.
# of schools targeted for coaching # of counselors supported
Semester Informal Report
Initial AP Potential Reports
sent to school Assistant
Principals & Principals in
January; Presentations to
school leaders scheduled for
February. Monthly review
of course request data to be
conducted March through May and coaching to occur
as a result.
3.12 Ensure that all black students who show potential to succeed in an AP or dual enrollment course are scheduled into a course for the appropriate subject and that appropriate support is provided (i.e. AVID).
# of black high school students showing potential
Annually Informal Report
103 seniors

% black students showing potential who are scheduled into a course for the appropriate subject
Annually Informal Report
72/103 took course matched with student’s “potential” per
AP potential report; 19 took
another AP course; 7 took no
AP course; 5 went to district
Early College Program to
pursue an AA degree.

3.13 Provide AVID elective in all schools to meet the needs of minority learners. Ensure that all black learners who are eligible and targeted for AVID elective are personally invited and encouraged to enroll.
# of AVID sections districtwide, change from previous year
Annually Informal Report
310 sections in
2020-21
% of AVID students who are black; change from previous year
Annually Informal Report
1,683/7,049
(24%)
3.14 Provide school principals with real-time academic data (ex. grades) specific to black students in accelerated courses. Provide a summary report of accelerated courses and sections that black students are struggling in so as to support teacher growth and creative solutions at the school site.
# and % of black middle school students taking an accelerated course who earned a D or F grade compared to non-black students.
Semester Informal Report
149 black students with a D or F in S1. 29.7% of all grades for
black students in accelerated
courses. Non-black
students with D or F in S1 was
16.7%
# and % of black high school students taking an accelerated course who earned a D or F grade compared to non-black students.
Semester Informal Report
569 black students with a D or F in S1. 26.8% of all grades for
black students in accelerated
courses. Non-black
students with D or F in S1 was 11.8%
3.16 Identify and invite the top 15% of black students in 7th grade students to take the SAT and participate in the PCS Talent Identification Program (TIP).
# of black students invited to participate
Annually Informal
Report
181
# and % of invited black 7th graders taking the SAT
Annually Informal
Report 66 students
(36% of invited black students)
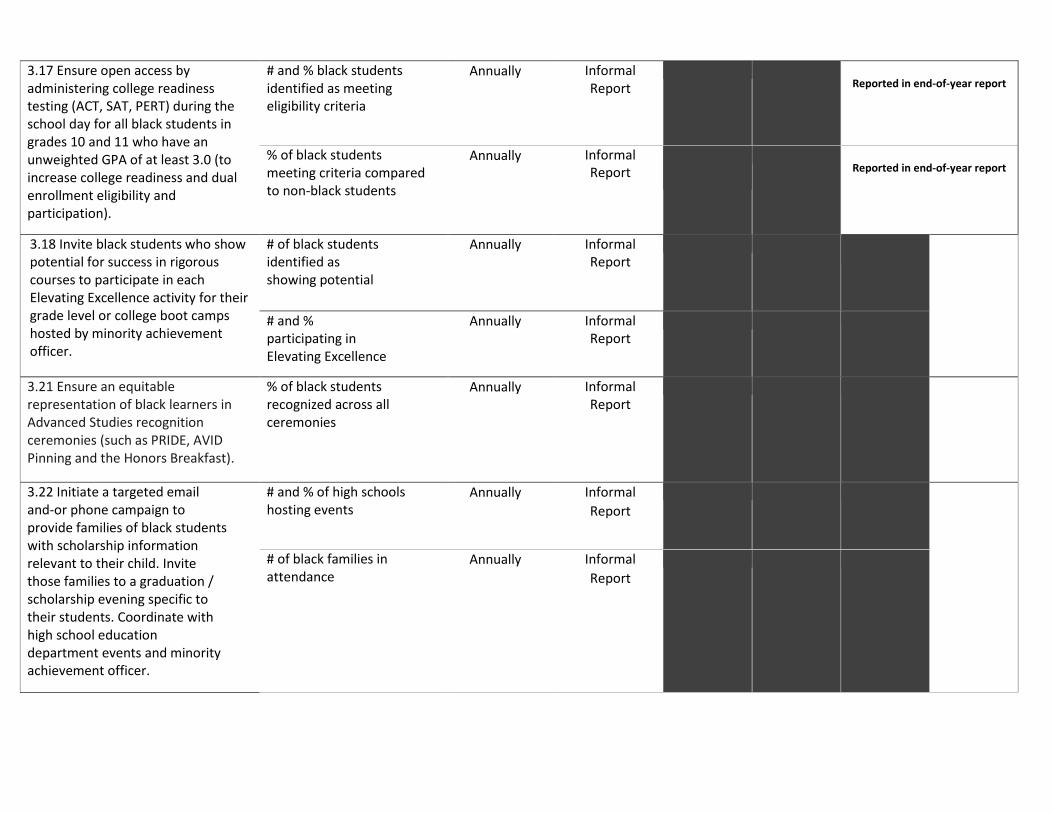
3.17 Ensure open access by administering college readiness testing (ACT, SAT, PERT) during the school day for all black students in grades 10 and 11 who have an unweighted GPA of at least 3.0 (to increase college readiness and dual enrollment eligibility and participation).
# and % black students identified as meeting eligibility criteria
Annually Informal Report
Reported in end-of-year report
% of black students meeting criteria compared to non-black students
Annually Informal Report
Reported in end-of-year report
3.18 Invite black students who show potential for success in rigorous courses to participate in each Elevating Excellence activity for their grade level or college boot camps hosted by minority achievement officer.
# of black students identified as showing potential
Annually Informal Report
# and % participating in Elevating Excellence
Annually Informal Report
3.21 Ensure an equitable representation of black learners in Advanced Studies recognition ceremonies (such as PRIDE, AVID Pinning and the Honors Breakfast).
% of black students recognized across all ceremonies
Annually Informal Report
3.22 Initiate a targeted email and-or phone campaign to provide families of black students with scholarship information relevant to their child. Invite those families to a graduation / scholarship evening specific to their students. Coordinate with high school education department events and minority achievement officer.
# and % of high schools hosting events
Annually Informal
Report
# of black families in attendance
Annually Informal
Report

Goal 4: Student Discipline Pinellas County Schools / Bridging the Gap Reporting Template / 2020-21
Data Reporting Template
Action Goal (1.d.): Reduce the disparity in the rates of disciplinary infractions between black and non-black students. Goal Manager: Area Superintendents
Baseline Condition (as of 2015-16) Short-Range Target: Long-Range Target: Pinellas County Schools has reduced its number of
referrals (a decrease of 30.3%) and out-of-school suspensions (a decrease of 56.7%) for black students significantly since 2013-14, though the district has not reduced the disparity gap, as the number and percentage of referrals and suspensions for non-black students has decreased at a similar rate. The gap has remained somewhat constant. The gap is represented by a “risk ratio” and that number is 2.38 for referrals and 4.33 for suspensions, which means that black students are two times more likely to receive a referral and four times more likely to receive a suspension.
Reduce the risk ratio for out of school suspensions by 0.33 each year.
Reduce the number of referrals and suspensions for black students and reduce the risk ratio for black
students for referrals and suspensions until it reaches the target ratio of 1.0 within 10 years.
Annual Outcomes: To reduce the disparity in the rates of disciplinary infractions between black and non-black students within 10 years, PCS will monitor incremental change for the following annual outcomes:
Annual Outcome Measures Baseline
(2015-16) Planning Year (2016-17) 2017-18 2018-19 2019-20
2020 Target
Discipline Disparity Rate / Risk Ratio (referrals) / black students
2.38 Actual 2.64 2.43 2.60 2.64
1.90 Target 2.30 2.20 2.10 2.00
Discipline Disparity Rate / Risk Ratio (OSS) / black students
4.33 Actual 4.07 3.61 3.79 4.34
2.70 Target 4.00 3.70 3.40 3.00
Related Outcomes Measures Baseline
(2015/16) 2016-17 2017-18 2018-19 2019-20
2020 Target
# and % of black students with an office disciplinary referral (also report detailed findings by gender and type of infraction)
(7,009) 35.7% of all
referrals Actual
(6,919) 38.0%
(6,867) 37.6%
(6,548) 38.3%
(5,343) 38.5%
# and % of black students with an out-of-school suspension (OSS) (also report detailed findings by gender and type of infraction)
(2,918) 49.5% of all
OSS Actual
(2,374) 48.5%
(2,625) 47.2%
(2,481) 47.6%
(1,790) 50.7%

Strategies & In-Process Measures
Throughout the year, PCS will monitor the following strategies and in-process indicators for incremental change to ensure the strategies are effectively reducing the disparity in the rates of disciplinary infractions between black and non-black students. NOTE: Not all strategies in this plan are listed for monitoring. Only those strategies specific to black learners and those required to support the fidelity of the plan and related research questions are listed below. The full plan with all of the district’s actions listed is available on the district’s website at pcsb.org/btg.
In-Process Reporting Frequency
Progress Tracking
Action Steps In-Process Indicators Delivery Method Quarter
1 Q1 Quarter
2 Q2 Quarter
3 Q3 Quarter
4 Q4
4.1 / 4.2 Develop and implement with fidelity in all schools a school- wide behavior plan that integrates all the critical components of PBIS (school-wide expectations / rules, guidelines for success, plan for teaching pro-social / appropriate student behavior, and positive reinforcement for behavior).
% of schools with behavior plans that integrate critical components of PBIS (using rubric)
Annually Informal Report
82.7%
% of schools scoring satisfactory or higher on the PBIS Implementation Checklist (PIC) or the Benchmarks of Quality (BOQ) assessment
Annually Informal Report
% of schools showing satisfactory implementation in each tier as measured by the PBIS-RP Tiered Fidelity Inventory (TFI)
Annually Informal Report

4.5 Provide school leadership teams with strategies on Social and Emotional Learning (SEL) and programs to help students develop specific SEL competencies.
% of school leadership teams trained
Annually Informal Report
100% / initial training

Action Steps
In-Process Indicators Reporting
Frequency
Progress Tracking Delivery Method Quarter 1
Q1 Quarter 2
Q2 Quarter 3
Q3 Quarter 4
Q4
4.6a Closely monitor school discipline data to eliminate Out-of-School Suspension (OSS) for non-violent infractions (such as skipping, missed detentions, excessive tardies, electronic devices, leaving school grounds w/o permission, or being in an unauthorized location).
# and % of non-violent infractions for black students that resulted in OSS.
Quarterly Informal Report
Q2 / YTD
5 / less than 1%
of suspensions
issued
Q2 / YTD
13 / approx. 1%
of suspensions
issued
4.6b Closely monitor school discipline data to review practices regarding out-of-school suspension (OSS) for the following infractions: defiance and classroom disruption
# and % of defiance and classroom disruption referrals for black students that resulted in OSS.
Quarterly Informal Report
Q2 / YTD
71 / 13% of
suspensions issued
Q3 / YTD
142 / 15% of
suspensions issued
4.7 Continue to train all School-Based Resource Officers (SROS) to ensure full implementation of the Collaborative Interagency Agreement, which is designed to decrease arrests in favor of school consequences.
% of officers trained Annually Informal Report
100%
# and % of black students arrested
Quarterly Informal Report
41 (75% of arrests)
TBD

Action Steps
Delivery
In-Process Indicators Reporting
Frequency Method
Progress Tracking
Quarter 1 Q1
Quarter 2 Q2
Quarter 3 Q3
Quarter 4 Q4
4.8 Train all school administrators in the use of restorative circles, conferences and related best practices and ensure strong implementation across schools.
% leaders trained Annually Informal Report
100%
# and % of black students receiving referrals and suspensions (OSS) compared to all other students receiving referrals and suspensions
Quarterly Informal Report
Q1 Referrals
1233 40%
OSS 182
49%
Q2 / YTD Referrals
1659 41%
OSS YTD 419
53%
Q3 / YTD Referrals
2,755 40%
OSS YTD 760 53%
Q4 Referrals
OSS
4.9 Continue collaborative discussions with the Community Discipline Committee to garner support and feedback in order to improve and/or reduce discipline disparity practices.
# of meetings held Semester Informal Report
1 / Virtual Meeting /
January 2021
4.10 Ensure that Area Superintendents, using an Office Discipline Referrals (ODR) analysis, identify those schools with high numbers of referrals and-or OSS and provide appropriate support and training.
# of schools identified as needing additional support
Quarterly Informal Report
20
21
20

Action Steps
In Process Indicators
Reporting Frequency
Progress Tracking Delivery Method Quarter 1
Q1 Quarter 2
Q2 Quarter 3
Q3 Quarter 4 Q4
4.13 Implement a re-integration process for all middle and high school students returning from an OSS for more than one school day and for any OSS for elementary school students.
#, % of black students with an OSS who receive a subsequent suspension (recidivism)
Annually Informal Report
4.14 Continue offering an Alternative Placement Program (APP) in middle and high schools as an alternative setting for students to serve a suspension, staffed by certified teachers and counselors.
# of students taking part in APP program
Quarterly Informal Report
CIS and PTC SP
locations Total = 10 Black = 2
Non-Black = 8
CIS and PTC SP
locations Total = 9 Black = 3
Non-Black = 6
CIS and PTC SP
locations Total = 34 Black = 10
Non-Black = 24

4.15 Ensure that Area Superintendents continue to participate in the Rethink Discipline Districts webinars and-or related national, professional development opportunities.
# of events attended by Area Superintendents
Annually Informal Report
4.16 Closely monitor district policy that no more than 10 days of Out-of-School Suspension (OSS) is given for one semester for regular education students and no more than 10 days is given for the entire year for ESE students.
# of black students with 10 days or more OSS / semester # of black ESE students with 10 or more days OSS / year
Annually Informal Report
4.19 Conduct a root cause analysis in high minority schools to determine causes of discipline disparity and to pilot additional interventions.
# of school identified for review. # of interventions piloted.
Semester Informal Report
12
4.20 Provide professional development to principals on the use of evidence-based interventions (such as Check-In, Check Out) as a tiered support for black students.
# of black students receiving such interventions
Annually Informal Report
TBD

Goal 5: ESE Identification Pinellas County Schools / Bridging the Gap Reporting Template / 2020-21
Data Reporting Template
Action Goal (1.e.): Reduce the disparity of black students being found eligible for Exceptional Student Education (ESE) programs.
Goal Manager: Lynne Mowatt, Executive Director, Exceptional Student Education
Baseline Condition (as of 2015-16)
Short-Range Target:
Long-Range Target: Pinellas County Schools percentage of overall
placements for Exceptional Student Education (ESE) is 14%. However, disproportionate representation of racial and ethnic groups in specific disability categories exist; specifically, the number of black students identified for placement (25%) is not representative of the black student population at PCS and remains disparate from the number of non-black students identified. The disproportionality of black and non- black students is represented by risk ratios. The disproportionate representation is largely found within the Emotional Behavioral Disability (EBD) designation. The risk ratio for overall placement in ESE in the 2015-16 school year was 1.45, which means that black students were nearly one and one half times as likely to be identified as an ESE student than non-black students. The risk ratio for EBD eligibility in the 2015- 16 school year was 4.20, which means that black students were four times more likely to be referred for EBD services than non-black students.
Reduce the risk ratio for EBD placement by one quarter (0.25) each year.
Reduce the risk ratio each year with a target disparity rate at or near 1.0 within 10 years.

Annual Outcomes:
To reduce the number of black students being found eligible for Exceptional Student Education programs within 10 years, PCS will monitor incremental change for the following annual outcomes:
Annual Outcome Measures Baseline
(2015/16)
Planning Year (2016-17)
2017-18
2018-19
2019-20 2020
Target
Risk Ratio (ESE overall) / black
1.45 Actual 1.45 1.46 1.40 1.43
1.25 Target 1.45 1.40 1.35 1.30
Risk Ratio (EBD) / black 4.20 Actual 3.94 3.84 3.34 3.50
2.95 Target 3.95 3.70 3.45 3.20
Related Outcomes Measures
# and % of black students eligible for ESE services (3,618)
25%
Actual (3,371)
25% (3,947)
23% (3,945)
25% (4,033)
25%
# and % of black students eligible for Emotional Behavioral Disability (EBD) identification / Total
(427) 49%
Actual (335) 49%
(363) 48%
(300) 46%
(255) 46%
# and % of black students found eligible for Emotional Behavioral Disability (EBD) identification / Identified in Pinellas
(20) 47%
Actual (14) 50%
(14) 52%
(19) 29%
(5) 29%
# and % of black students found eligible for Emotional Behavioral Disability (EBD) identification / Transfers Into County
(24) 42%
Actual (17) 30%
(13) 39%
(9) 35%
(7) 23%

Strategies & In-Process Measures
Throughout the year, PCS will monitor the following strategies and in-process indicators for incremental change to ensure the strategies are effectively reducing the number of black students being found eligible for Exceptional Student Education programs. NOTE: Not all strategies in this plan are listed for monitoring. Only those strategies specific to black learners and those required to support the fidelity of the plan and related research questions are listed below. The full plan with all of the district’s actions listed is available on the district’s website at pcsb.org/btg.
Action Steps
In-Process Indicators In-Process Reporting Frequency
Delivery Method
Progress Tracking
Quarter 1 Q1
Quarter 2 Q2
Quarter 3 Q3
Quarter 4 Q4
5.2 Initiate a records review by the district ESE Department for transfer students who arrive as new students to PCS with an EBD eligibility. Students will receive current IEP services during the time they are being re-evaluated.
# of black transfer students into Pinellas County identified as EBD
Quarterly Informal Report
8
4
0
# of record reviews completed for black transfer students into Pinellas County
Semester Informal Report
2
# of black transfer students
identified for EBD re-evaluation
process
Quarterly Informal Report
3
1
0
# of re-evaluations completed
for EBD transfer students / black
Semester Informal Report
0
# of black transfer students
identified for EBD after re-
evaluation process
Semester Informal
Report
0
5.3 Provide intensive and intentional early intervening services, using direct resources, to students prior to being identified as having an Emotional Behavioral Disability (EBD).
# of school support requests for early intervening services for students under consideration for EBD / all students
Quarterly Informal Report
3
3
1
# of such requests for services / black students
Quarterly Informal Report
1
1
0

In-Process Delivery
Action Steps In-Process Indicators Reporting Method
Frequency
Progress Tracking
Quarter 1 Q1
Quarter 2 Q2
Quarter 3 Q3
Quarter 4 Q4
# of black students receiving Informal early intervening support Quarterly Report
10
12
14
# of new EBD eligibilities / Quarterly Informal identified by PCS / all students Report
10
6
6
# of new EBD eligibilities / Quarterly Informal identified by PCS / black students Report
4
1
3
5.4 Initiate a records review through the Exceptional Student Education (ESE) department and re-evaluation if needed for all black students who are designated as EBD; additionally, the ESE department will identify students with multiple eligibilities (including EBD) and initiate a records review when applicable.
# of black students identified as Annually Informal EBD Report
172
# of record reviews completed Semester Informal after identification for black Report EBD students
70
# of re-evaluations completed for black EBD students
Annually Informal Report
# of transfers of EBD to a secondary disability for black students
Annually Informal Report
# of dismissals from EBD for Annually Informal black students Report

In-Process Delivery
Action Steps In-Process Indicators Reporting Method
Frequency
Progress Tracking
Quarter 1 Q1
Quarter 2 Q2
Quarter 3 Q3
Quarter 4 Q4
5.6 Continue to provide targeted and sustainable professional development to school-based behavior specialists that includes the utilization of student specific data and interventions, (including cultural components) in student's behavior intervention plan (PBIP), along with side-by-side coaching from district behavior specialists.
# of behavior specialists. % trained. Semester Informal
Report
93 total
5.7 Provide four district Coordinated Early Intervening Services (CEIS) Behavior Specialists to provide intensive support to students with a focus in high minority schools.
# of high minority schools Quarterly Informal
receiving services Report
13
17
13
# of black students served by Quarterly Informal CEIS specialists Report
8
12
14
5.8 Provide four district ESE
Behavior Specialists to provide
intensive support to ESE students
in all schools.
# of schools receiving services Quarterly Informal Report
75
77
68
# of black students served by district ESE Behavior Specialist Quarterly Informal
30
52
50

Goal 6: Minority Hiring Pinellas County Schools / Bridging the Gap Reporting Template / 2020-21
Data Reporting Template
Action Goal (4.17) Increase the number of black teachers and administrators to closely mirror the student enrollment by ethnicity.
Goal Manager: Paula Texel, Assistant Superintendent, Human Resources
Baseline Condition (as of 2015-16)
Short-Range Target:
Long-Range Target: Pinellas County Schools employs nearly 7,500
teachers, of which approximately 8% are black. The percentage breakdown of administrators in the district is about 22% black. The district enrollment of black students in 2015-16 was 18%.
Increase the number of black teachers hired by an average of 1% each year.
Increase the number of black teachers by 1% each year, with a target of meeting or exceeding the
enrollment of the black student population.
Annual Outcomes:
To increase teacher recruitment and retention efforts to ensure that faculty diversity mirrors the student population, PCS will monitor incremental change for the following annual outcomes:
Annual Outcome Measures Baseline
(2015/16) Planning Year (2016-17) 2017-18 2018-19 2019-20
2020 Target
# and % of total instructional positions / black
(622) 8.3%
Actual (647) 8.8%
(671) 9.2%
(651) 9.1%
(665) 9.2%
13.0
Target 9% 10% 11% 12%
Related Outcomes Measures
# and % of new instructional hires / black No
baseline Actual
11.7%
(110 / 737) 14.9%
(88/664) 13.3%
(43/450) 9.6%
# and % of total administrative positions (combined district-based and school-based) / black
(83) 21.2%
Actual (86)
21.5% (87)
22.0% (91) 20.6%
(85) 20.3%

Strategies & In-Process Measures
Throughout the year, PCS will monitor the following strategies and in-process indicators for incremental change to ensure the strategies are effectively increasing teacher recruitment and retention efforts to ensure faculty diversity mirrors the student population. NOTE: Not all strategies in this plan are listed for monitoring. Only those strategies specific to black learners and those required to support the fidelity of the plan and related research questions are listed below. The full plan with all of the district’s actions listed is available on the district’s website at pcsb.org/btg.
In-Process Reporting Frequency
Progress Tracking
Action Steps In-Process Indicators Delivery Method Quarter 1
Q1 Quarter 2
Q2 Quarter 3
Q3 Quarter 4
Q4
In-Process indicator common for all action steps
# of active instructional applicants / total
Semester Report
610
# of active instructional applicants, self-identified as black / total
Semester Report 90
# of active instructional applicants, black, certified / eligible for hire
Semester Report 30
# and % of instructional applicants, black / hired during current school year
Semester Report
23
6.8 Continue strong relationships with colleges and universities, including historically black colleges and universities (HBCUs), black student organizations within other colleges and universities, and Urban Education programs.
# of HBCU visits, events, or specific contacts made
Semester Informal Report
4
# of visits, events, or contacts made with black student organizations or Urban Education programs
Semester Informal Report
4

Action Steps In-Process
Delivery In-Process Indicators Reporting
Method
Frequency
Progress Tracking
Quarter 1 Q1
Quarter 2 Q2
Quarter 3 Q3
Quarter 4 Q4
6.10 Review traffic and usage patterns from the platforms used as part of the district’s marketing campaign designed to attract black applicants via publications and social media (e.g. Diversity in Ed, YouTube, Instagram, Facebook, Indeed, and LinkedIn).
# social media and digital instructional recruitment posts, by medium type
Quarterly Informal Report
28
19
41
# of new / unique print instructional recruitment posts distributed (Job Fair & PCS School Recruitment Flyers; Tampa Bay Times; FL Courier)
Quarterly Informal Report
78
105
568
# Diversity in ED instructional recruitment posts
Quarterly Informal Report
578
198
187
# applicants recruited by medium as reported on application for employment
Quarterly Informal Report
118
62
82

6.11 Collaborate with the Pinellas Alliance of Black School Educators (PABSE) and community stakeholder groups.
# of events held with each stakeholder group
Semester Informal Report
5
PABSE COQEBS DMAC
6.12 Attend state and national conferences to gather current strategies for the recruitment of black educators.
# and types conferences attended
• *Webinars (national) on
Diversity and Inclusion,
Minority Hiring.
Annually Informal Report
7*

Action Steps In-Process
In-Process Indicators Reporting Frequency
Progress Tracking Delivery Method Quarter 1
Q1 Quarter 2
Q2 Quarter 3
Q3 Quarter 4
Q4
6.14 Research and partner with USF to implement a Call Me MISTER program to identify and increase black male teacher candidates and placements within Title 1 elementary schools.
Programs established / # of black males enrolled or interested in initial program
Annually Informal Report
6.15 Develop and implement a training program for all hiring managers that focuses on shifting mindset and implementing strategies for hiring related to recognizing unconscious bias, equity and excellence and cultural responsiveness.
# and % of hiring managers (e.g., principals) identified and trained
Semester Informal Report
Ongoing
6.20 Conduct ongoing feedback sessions with our current black teachers to discuss their current work / school conditions for success, as well as their onboarding and training (ex. Focus groups, school visits).
# of focus group meetings, feedback sessions or surveys offered
Semester Informal Report
1
# minority teachers participating in focus groups, feedback sessions or surveys
Semester Informal Report
41
# of black teachers total and % retained from the end of the previous school year to the next (June to August)
Annually Informal
Report
713 (93.8%)

Action Steps In-Process
In-Process Indicators Reporting Frequency
Progress Tracking Delivery Method Quarter 1
Q1 Quarter 2
Q2 Quarter 3
Q3 Quarter 4
Q4
6.21 Provide substantial recruitment and retention bonuses in the five original Scale Up schools to attract and retain highly effective teachers in the neediest schools.
# of teachers (all races) in Scale Up elementary schools / % receiving bonus
Annually Informal Report
% of teachers in Scale Up schools who returned for the following school year (June to August)
Annually Informal Report
70%
6.22 Establish a summer, cultural awareness training for teachers who are hired into high minority schools, with a robust onboarding program for teachers working in the district’s Scale Up and Transformation Zone.
Training developed / scheduled for roll-out
Annually Training Calendar
# of teachers attending / % of all teachers attending from targeted schools
Annually Informal Report
Ignite: 38 total
teachers (18 from TZ)
TZ Boot
Camp: 141
6.23 Establish an ongoing onboarding and support system for new black teachers hired into the district to ensure a smooth transition and successful school year.
Formal support system established
Annually Informal Report
6.27-6.28 Establish positive relationships with current and aspiring black leaders to enhance the leadership pipeline and maintain or increase the percent of minority administrators.
# focus group meetings or feedback sessions with minority administrators
Semester Informal Report
Not yet
scheduled
# minority administrators participating in focus groups or feedback sessions
Semester Informal Report
0
# and % of black teachers in AP (Asst. Principal) Pool and # of black APs in Principal Pool
Annually Informal Report