go l d d e m a n d t r e n d s f u l l y e a r 2 0 1 7go l d d e m a n d t r e n d s f u l l y e a r...
TRANSCRIPT

Gold Demand Trends Full Year 2017Published 6th February 2018
2017: Q4 recovery fails to mitigate full-year decline
Gold demand rallied in the closing months of 2017, gaining 6% year-on-year (y-o-y) to 1,095.8 tonnes (t) in Q4. But it wastoo little, too late: full year demand fell by 7% to 4,071.7t. ETF inflows, although positive, lagged behind 2016’s stellargrowth. Central banks added 371.4t to global official gold reserves, 5% down on 2016’s net purchases. Bar and coindemand fell 2% on a sharp drop in US retail investment. India and China led a 4% recovery in jewellery, although demandremains below historical averages. Increased use of gold in smartphones and vehicles sparked the first year of growth intechnology demand since 2010.
7% decline in annual gold demand was largely investment-related
Source: Metals Focus; World Gold Council
Highlights
Annual ETF inflows added 202.8t to demand, around one-third of 2016’s inflows. European-listed ETFs accounted for73% of net inflows, with investors keenly attuned to geopolitics and negative interest rates.
Bar investment was broadly stable, while coin investment slid 10%. Weakness in the sector was largely explained by asharp drop in US demand to a 10-year low of 39.4t, which exceeded strong gains in both China and Turkey.
First annual increase in jewellery demand since 2013 (+4%), but the sector remains weak in a historical context.Relatively stable prices and improving economic conditions paved the way for growth in 2017.
Official gold reserves swelled by 371.4t, 5% down on 2016. Turkey and Russia were the most prominent of the centralbank buyers.
Technology sector recovered, ending 6-year downtrend. Gold used in electronics and industrial applications grewsteadily, thanks to the increasing prevalence of new-generation features in smartphones and vehicles.
Mine production inched to a record high of 3,268.7t, while recycling fell 10%: total supply dipped 4% to 4,398.4t. Theintroduction of stringent environmental controls in China led to a 9% fall in national mine production.
Tonnes
Central banks & other inst. ETFs & similar products Total bar & coin demand TechnologyJewellery
2016 20170
5001,0001,5002,0002,5003,0003,5004,0004,5005,000
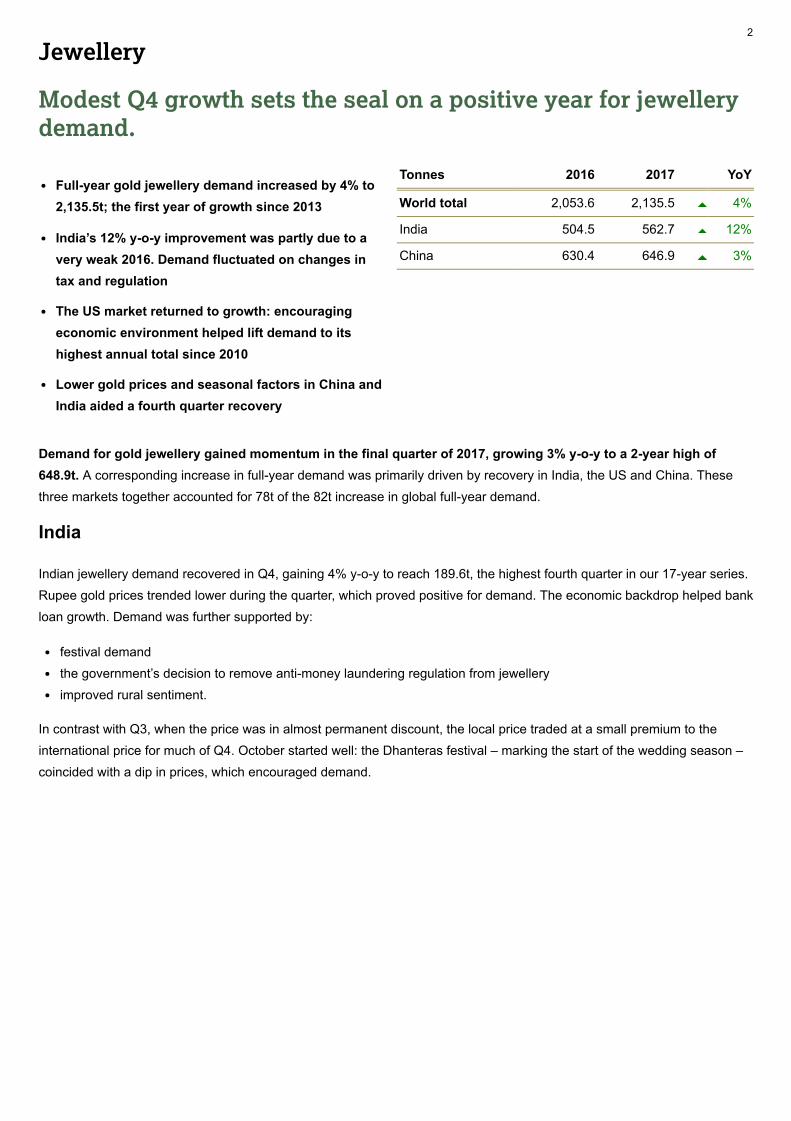
Full-year gold jewellery demand increased by 4% to2,135.5t; the first year of growth since 2013
India’s 12% y-o-y improvement was partly due to avery weak 2016. Demand fluctuated on changes intax and regulation
The US market returned to growth: encouragingeconomic environment helped lift demand to itshighest annual total since 2010
Lower gold prices and seasonal factors in China andIndia aided a fourth quarter recovery
Jewellery
Modest Q4 growth sets the seal on a positive year for jewellerydemand.
Demand for gold jewellery gained momentum in the final quarter of 2017, growing 3% y-o-y to a 2-year high of648.9t. A corresponding increase in full-year demand was primarily driven by recovery in India, the US and China. Thesethree markets together accounted for 78t of the 82t increase in global full-year demand.
India
Indian jewellery demand recovered in Q4, gaining 4% y-o-y to reach 189.6t, the highest fourth quarter in our 17-year series.Rupee gold prices trended lower during the quarter, which proved positive for demand. The economic backdrop helped bankloan growth. Demand was further supported by:
festival demandthe government’s decision to remove anti-money laundering regulation from jewelleryimproved rural sentiment.
In contrast with Q3, when the price was in almost permanent discount, the local price traded at a small premium to theinternational price for much of Q4. October started well: the Dhanteras festival – marking the start of the wedding season –coincided with a dip in prices, which encouraged demand.
Tonnes 2016 2017 YoY
World total 2,053.6 2,135.5 4%
India 504.5 562.7 12%
China 630.4 646.9 3%
2

Gold traded at a small premium in India for much of Q4
Source: NCDEX; World Gold Council
An added boost came when the government granted the gold market an exemption from onerous anti-moneylaundering measures. The Prevention of Money Laundering Act (PMLA), which was extended to the gems and jewellerysector in August, had negatively affected jewellery demand as consumers and retailers were faced with a heavyadministrative burden to prove the veracity of cash transactions. The effect was most pronounced in rural areas, where cashis widely used. The removal of the PMLA from the sector therefore had a positive impact on demand.
Rural sentiment picked up in the fourth quarter, supporting a key element of the market. Consumers in rural areas are
Update: GST’s impact on India’s gold market, organised retailers were best equipped to transition to the GST system and this worked to their benefit as they increased their share of the jewellery market.
Looking forward, we expect a continued recovery in demand as the market increasingly accepts, and adapts to, GST. And the relative outperformance of chain stores and organised retailers is, in our view, likely to be a key feature of this recovery.
US$/oz
Aug 2017 Sep 2017 Oct 2017 Nov 2017 Dec 2017-8
-6
-4
-2
0
2
4
the driving force behind Indian gold jewellery demand.1 Positive sentiment among this demographic is quickly felt in certain areas of the economy, the gold jewellery market being one of them. Sentiment was vastly improved compared with Q4 2016, when these consumers were struggling with the drastic and unexpected demonetisation of the economy. A 6% increase in the minimum support price for kharif crops also helped. Strong growth in tractor sales bears out this improvement: Mahindra & Mahindra Ltd.’s Farm Equipment Sector (the world’s largest tractor manufacturer) announced 32% y-o-y growth in tractor sales during November and are upbeat in their outlook. 2
The market is becoming increasingly accustomed to the Goods and Services Tax (GST). As foreseen in our Market3
3

China
China’s 6% growth in Q4 contributed to a 3% rise in annual jewellery demand – the first yearly increase since 2013.Demand for the full year increased to 646.9t thanks to a strong H2, which was buoyed by holiday purchases and a retailtrade more effectively targeting consumer needs.
The trend for lower-weight, better designed, higher-margin ‘premium’ gold jewellery products continues to gathermomentum. Retailers are increasingly tapping into this segment of the market, shifting their product offering to incorporatemore 18-carat, 22-carat and 3D hard products. Although 24-carat gold still dominates the market, it is fast losing marketshare - notably in tier 1 and 2 cities. Major retailer Chow Tai Fook reported that it sold more than 300,000 pieces of 22-caratjewellery under its 17916 product series and that demand for gold drove sales growth in the six months to end-September.
Retailers are also appealing to customers by offering an enhanced shopping experience – and online retailing is akey part of that strategy. Chow Tai Seng, which partners with Tmall – Alibaba’s ecommerce platform – saw its sales up70% year-on-year on ‘Singles Day’, to more than 80 million yuan (US$12 million). The jeweller’s self-operated stores aremostly located in tier 1-2 cities, but by piggy-backing on the online reach of Tmall, it can easily reach consumers in morethan 300 cities throughout China. In a bid to appeal to younger consumers, the company has also embraced the latesttechnology – augmented reality (AR). Visitors to its ‘smart store’ can see how each piece of jewellery looks on them using a‘magic mirror’.
The outlook for Chinese jewellery demand is, we believe, quite positive. Retailers continue to better meet consumers’changing needs and sentiment is lifted by the supportive economic environment. There is also a view that demand isimproving at a more sustainable rate than in the bargain-hunting frenzy of 2010-13.
Other Asia
Smaller Asian markets were predominantly weaker in both Q4 and full-year 2017; only Indonesia and Vietnambucked the trend. Demand across much of the region was stagnant at best in Q4, translating to losses in annual demand.Japan had a disappointing result: Q4 demand was marginally weaker at 5.1t (-1%). This added to weakness earlier in theyear, with the result that 2017 annual demand slipped 2% to 16.6t. Improving conditions in the wider retail sector may,however, extend to jewellery over the coming year.
Vietnam was the strongest market in the region: 11% y-o-y growth in Q4 lifted annual demand by 7% to 16.5t. Thiswas the strongest year for Vietnamese jewellery demand since 2008. Demand benefited from robust economic growth andcontinued stock market gains. Expansion of the jewellery retail network, and the tentative signs that the government willbegin to liberalise the gold market, also boosted the market.
Middle East & Turkey
In Turkey, record-high local prices weakened Q4 jewellery demand and put the brakes on annual growth. The goldprice in Turkish lira terms jumped to record highs in late November, discouraging consumers from buying jewellery.Meanwhile, the government’s Credit Guarantee Fund, which had injected the economy with a short-term liquidityboost, dried up. Economic uncertainty and political instability were further deterrents. But recycling activity was similarlysubdued – in the uncertain environment, consumers preferred to stay on the sidelines.
Middle Eastern demand recovered in Q4, but H1 losses dominated: annual demand was down 1% y-o-y. Iran was thestrongest performer in 2017: Q4 was its tenth consecutive quarter of y-o-y growth. Annual demand gained 12% to 45.4t, thehighest since 2013. But the market lost momentum in the fourth quarter as worsening US-Iranian relations underminedconsumer sentiment.
4
5
4
In Egypt, demand was dented again by the weak local currency, which kept prices elevated. But in value terms,demand increased in 2017 (by 56% to reach E£15.8mn), suggesting that consumers consider a certain value of spendrather than focusing on the weight of gold they purchase.
Demand in the UAE received a small boost in December as consumers rushed to make their purchases before a 5%Value-Added-Tax (VAT) was imposed in January. But the 16% y-o-y gain in Q4 demand failed to rescue the market from afourth consecutive annual decline: 2017 demand was down 2% to a 20-year low of 42.8t.
The West
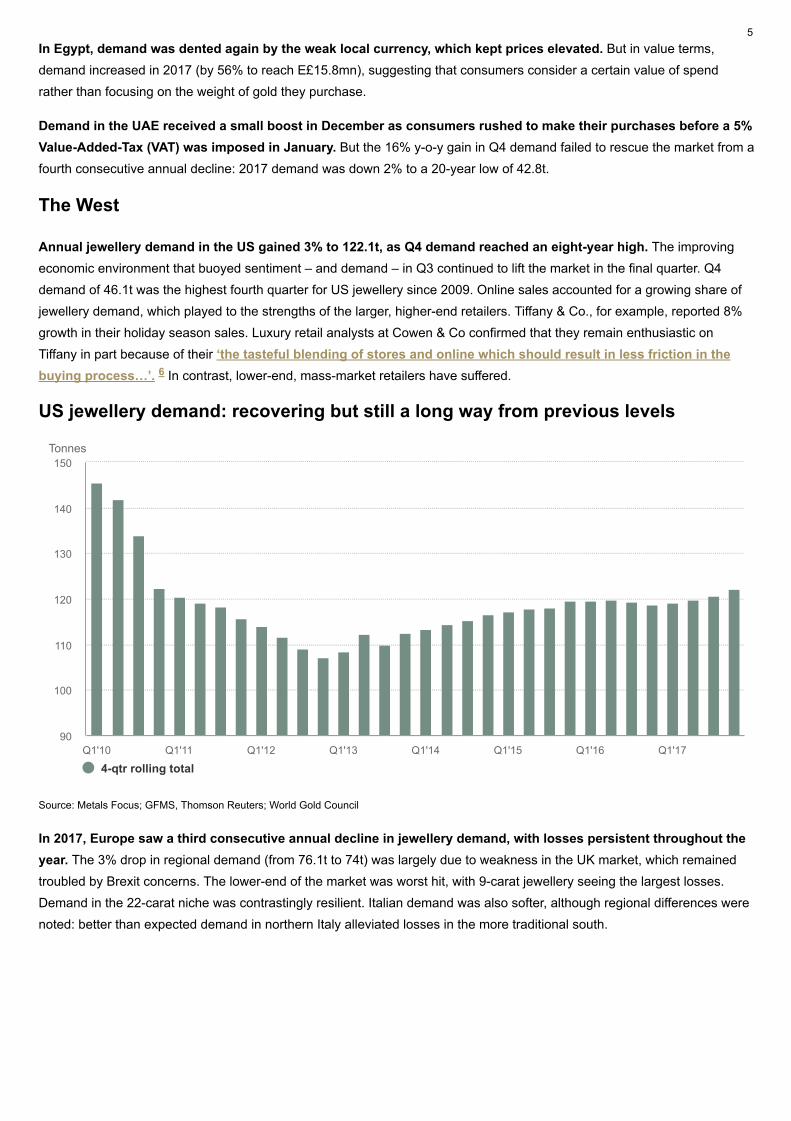
Annual jewellery demand in the US gained 3% to 122.1t, as Q4 demand reached an eight-year high. The improvingeconomic environment that buoyed sentiment – and demand – in Q3 continued to lift the market in the final quarter. Q4demand of 46.1t was the highest fourth quarter for US jewellery since 2009. Online sales accounted for a growing share ofjewellery demand, which played to the strengths of the larger, higher-end retailers. Tiffany & Co., for example, reported 8%growth in their holiday season sales. Luxury retail analysts at Cowen & Co confirmed that they remain enthusiastic onTiffany in part because of their ‘the tasteful blending of stores and online which should result in less friction in thebuying process…’. In contrast, lower-end, mass-market retailers have suffered.
US jewellery demand: recovering but still a long way from previous levels
Source: Metals Focus; GFMS, Thomson Reuters; World Gold Council
In 2017, Europe saw a third consecutive annual decline in jewellery demand, with losses persistent throughout theyear. The 3% drop in regional demand (from 76.1t to 74t) was largely due to weakness in the UK market, which remainedtroubled by Brexit concerns. The lower-end of the market was worst hit, with 9-carat jewellery seeing the largest losses.Demand in the 22-carat niche was contrastingly resilient. Italian demand was also softer, although regional differences werenoted: better than expected demand in northern Italy alleviated losses in the more traditional south.
6
Tonnes
4-qtr rolling totalQ1'10 Q1'11 Q1'12 Q1'13 Q1'14 Q1'15 Q1'16 Q1'17
90
100
110
120
130
140
150
5

Annual ETF inflows of 202.8t were concentrated inthe first half of the year before slowing to a far moremodest pace in H2
Bar and coin demand fell, driven by a 10% drop incoin demand
China remains the world’s largest bar and coinmarket, recording its second-best year on record
Investment
Annual inflows into gold-backed ETFs in 2017 fell short of2016’s stellar growth while bar and coin demand fell 1.9%:overall investment demand was down 23% y-o-y
ETFs
European-listed funds captured 73% (148.9t) of global gold-backed ETF inflows in 2017. US-listed ETFs captured63.0t, while Asia and other regions reduced their holdings by a collective 9.2t. Total holdings in the sector grew by 9%,reaching 2,368.2t by year-end, up from 2,165.4t at end-2016. In value terms, assets under management (AUM) grew by24% to US$98.7bn. Global inflows were unsurprisingly lower in comparison with 2016, a year in which annual inflows of546.8t were the second highest on record.
European ETFs absorbed 73% of global inflows in 2017
Source: Company Filings; Bloomberg; ICE Benchmark Administration; World Gold Council
The pace of growth in the sector slowed sharply in the second half of the year. Inflows of 42.1t in H2 were around one-quarter of the 160.7t seen during H1 2017. In some ways, this was not unexpected: the gold price had already gained 14%
Tonnes 2016 2017 YoY
Investment 1,595.5 1,231.9 -23%
Bar & coin 1,048.7 1,029.2 -2%
India 161.6 164.2 2%
China 284.6 306.4 8%
Gold-backed ETFs 546.8 202.8 -63%
Tonnes US$/oz
LBMA Gold Price (US$/oz, Mthly Avg, rhs) North America Europe Asia Other
Jan May Sep-80
-60
-40
-20
0
20
40
60
80
100
1,120
1,140
1,160
1,180
1,200
1,220
1,240
1,260
1,280
1,300
1,320
1,340
6

returns. Such an environment therefore benefited European gold-backed ETFs.
Bar and coin
Bar and coin demand dropped 19.5t to 1,029.2t in 2017. Weak coin demand accounted for most of the fall, with lossesconcentrated in the US. Bar demand was 770.9t and has been relatively stable in recent years, averaging 773t since 2014.
The US recorded the biggest drop in demand of any country in 2017: it fell from 93t to 39.4t, its lowest level since2007. Data from the US Mint reveals that its sales of bullion coins dropped 21.2t, accounting for the lion’s share of thedecline in global coin demand in 2017. The sharp fall was partly because 2016 was a strong year, and partly becauseinvestors’ attention was drawn to US equity markets reaching new record highs. US bullion dealers also reported that therelatively range-bound US dollar gold price over the course of the year failed to elicit any excitement amongst investors. Q4US bar and coin demand was 9.6t, down 65% on the previous year.
China was the world’s largest bar and coin market in 2017, with 306.4t of investment - its second highest year of barand coin demand. Annual demand was 8% higher compared to 2016 and comfortably above its five-year average of284.8t.
China started the year strongly: Q1 investment hit 105.9t, the fourth highest quarterly figure on record. This was largely dueto investors’ concerns over the weakness of the yuan in 2016, when it fell almost 6%, and worries that it would slide further
by end-August, which encouraged a degree of profit-taking rather than fresh buying. Meanwhile, stock markets continued to climb to new highs, and the opportunity cost of investing in gold increased as ultra-loose monetary policy came to an end in some markets - most notably in the US, where the Fed delivered three rate hikes in 2017.
But investors maintained a benign attitude towards gold-backed ETFs in Q4, adding 28.9t. Europe dominated the Q4 picture with inflows of 32.3t. In contrast, US ETFs saw 12.4t of outflows as investors focused on rising equity markets and the changing monetary policy environment. Inflows into Asian funds jumped towards the end of the year as Chinese investors responded to December’s sharp price fall: the region saw inflows of 11.8t in Q4.7
Demand in the sector has firm foundations: anecdotal evidence from ETF providers suggests that investors continue to favour a strategic position in gold as an ‘insurance policy’ to mitigate risk. And, in our view, risks are plentiful.
Simmering geopolitical turmoil continued to underpin investment inflows, particularly in Europe. Persistent uncertainty over the economic and political implications of Brexit, fragile US-North Korea relations, and continued tension in the Middle East combined to create a positive backdrop for gold-backed ETF investment.
Major stock indices made new highs. As valuations became increasingly frothy, we believe many investors grew nervous of a potential pullback, adding gold to their portfolios to manage risk exposure.
While central banks are starting to unwind their quantitative easing and asset purchase programmes, the implications of those policies are likely to have repercussions for years to come. Ultra-low – in some cases negative –interest rates have propelled many asset prices higher; as rates normalise, bond returns will come under pressure. In our view, these shifts may spur financial market volatility. For a discussion of the possible repercussions of expansionary monetary policy refer to our Outlook 2018: Global economic trends and their impact on gold. 8
While Western investors are often grouped together and expected to display a similar mindset, European investors faced a handful of factors that differentiated them from their US counterparts. Among these is, we believe (and as we reported when our Q4 ETF data was released in January) a greater level of concern regarding global instability. 9 And despite the changing US interest rate environment, real rates in Europe remain negative: German government bonds with maturities of five years or less are still yielding negative returns. As we uncovered in our consumer research, a key motive for buying gold among German investors is the belief that it will protect wealth and, to a lesser extent, provide good long-run
10
7
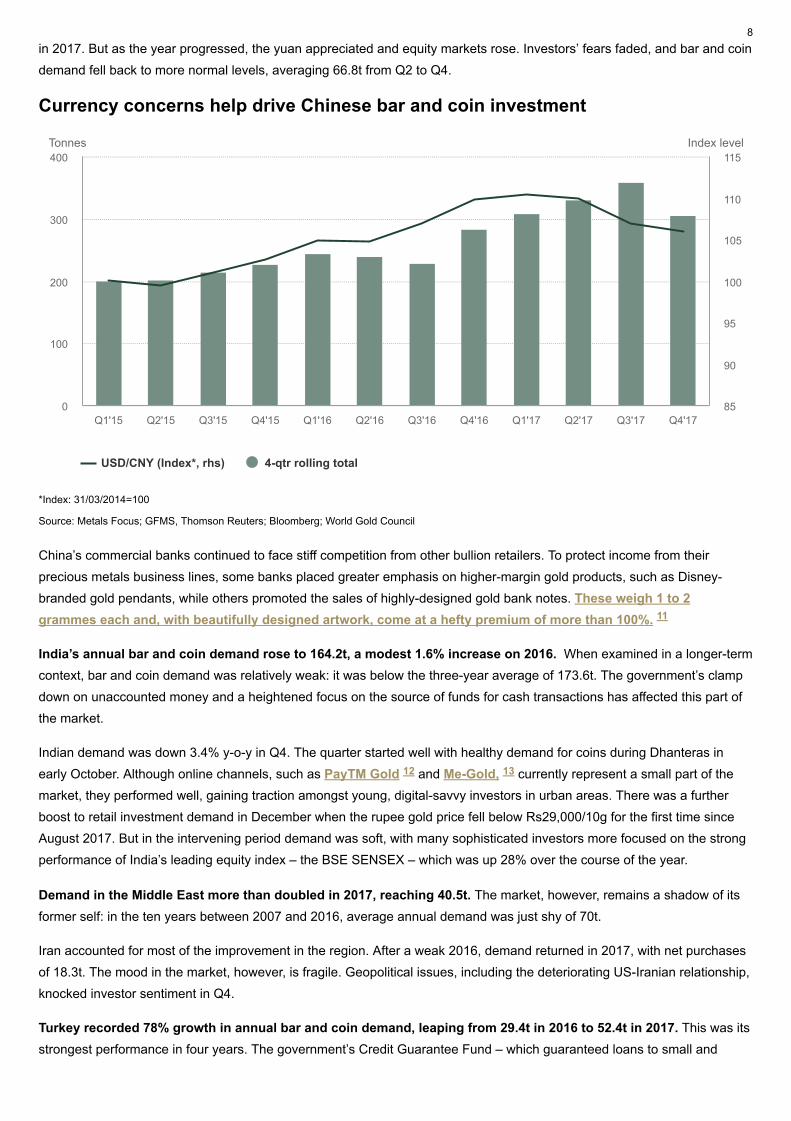
in 2017. But as the year progressed, the yuan appreciated and equity markets rose. Investors’ fears faded, and bar and coindemand fell back to more normal levels, averaging 66.8t from Q2 to Q4.
Currency concerns help drive Chinese bar and coin investment
*Index: 31/03/2014=100
Source: Metals Focus; GFMS, Thomson Reuters; Bloomberg; World Gold Council
China’s commercial banks continued to face stiff competition from other bullion retailers. To protect income from theirprecious metals business lines, some banks placed greater emphasis on higher-margin gold products, such as Disney-branded gold pendants, while others promoted the sales of highly-designed gold bank notes. These weigh 1 to 2grammes each and, with beautifully designed artwork, come at a hefty premium of more than 100%.
India’s annual bar and coin demand rose to 164.2t, a modest 1.6% increase on 2016. When examined in a longer-termcontext, bar and coin demand was relatively weak: it was below the three-year average of 173.6t. The government’s clampdown on unaccounted money and a heightened focus on the source of funds for cash transactions has affected this part ofthe market.
Indian demand was down 3.4% y-o-y in Q4. The quarter started well with healthy demand for coins during Dhanteras inearly October. Although online channels, such as PayTM Gold and Me-Gold, currently represent a small part of themarket, they performed well, gaining traction amongst young, digital-savvy investors in urban areas. There was a furtherboost to retail investment demand in December when the rupee gold price fell below Rs29,000/10g for the first time sinceAugust 2017. But in the intervening period demand was soft, with many sophisticated investors more focused on the strongperformance of India’s leading equity index – the BSE SENSEX – which was up 28% over the course of the year.
Demand in the Middle East more than doubled in 2017, reaching 40.5t. The market, however, remains a shadow of itsformer self: in the ten years between 2007 and 2016, average annual demand was just shy of 70t.
Iran accounted for most of the improvement in the region. After a weak 2016, demand returned in 2017, with net purchasesof 18.3t. The mood in the market, however, is fragile. Geopolitical issues, including the deteriorating US-Iranian relationship,knocked investor sentiment in Q4.
Turkey recorded 78% growth in annual bar and coin demand, leaping from 29.4t in 2016 to 52.4t in 2017. This was itsstrongest performance in four years. The government’s Credit Guarantee Fund – which guaranteed loans to small and
Tonnes Index level
USD/CNY (Index*, rhs) 4-qtr rolling total
Q1'15 Q2'15 Q3'15 Q4'15 Q1'16 Q2'16 Q3'16 Q4'16 Q1'17 Q2'17 Q3'17 Q4'170
100
200
300
400
85
90
95
100
105
110
115
11
12 13
8

medium-sized enterprises that could not otherwise get credit – boosted the economy and supported gold demand. The effect, however, was short-lived. In Q4, demand fell by around two-thirds (both y-o-y and q-o-q) as loans from the Credit Guarantee Fund dried up, and the Turkish lira tumbled, pushing up the local gold price. 14
Annual European demand fell 7%, with declines across all markets. Germany – Europe’s largest market – saw demand drop 4.5t to 106.3t. Its economy is performing well and its main equity index – the DAX – hit record highs in 2017. In addition, drawn-out coalition talks appear to be giving investors little cause for concern. Despite the benign backdrop, German gold demand is still several multiples of what it was in 2007, before the global financial crisis struck. For more information about the evolution of Germany’s gold market, please see Market Update: Germany’s golden decade. 15
9
Central bank net purchases totalled 371t in 2017, 5%lower than 2016 demand
Q4’s 38% y-o-y decline was entirely driven by thelapse of sizeable Venezuelan swap
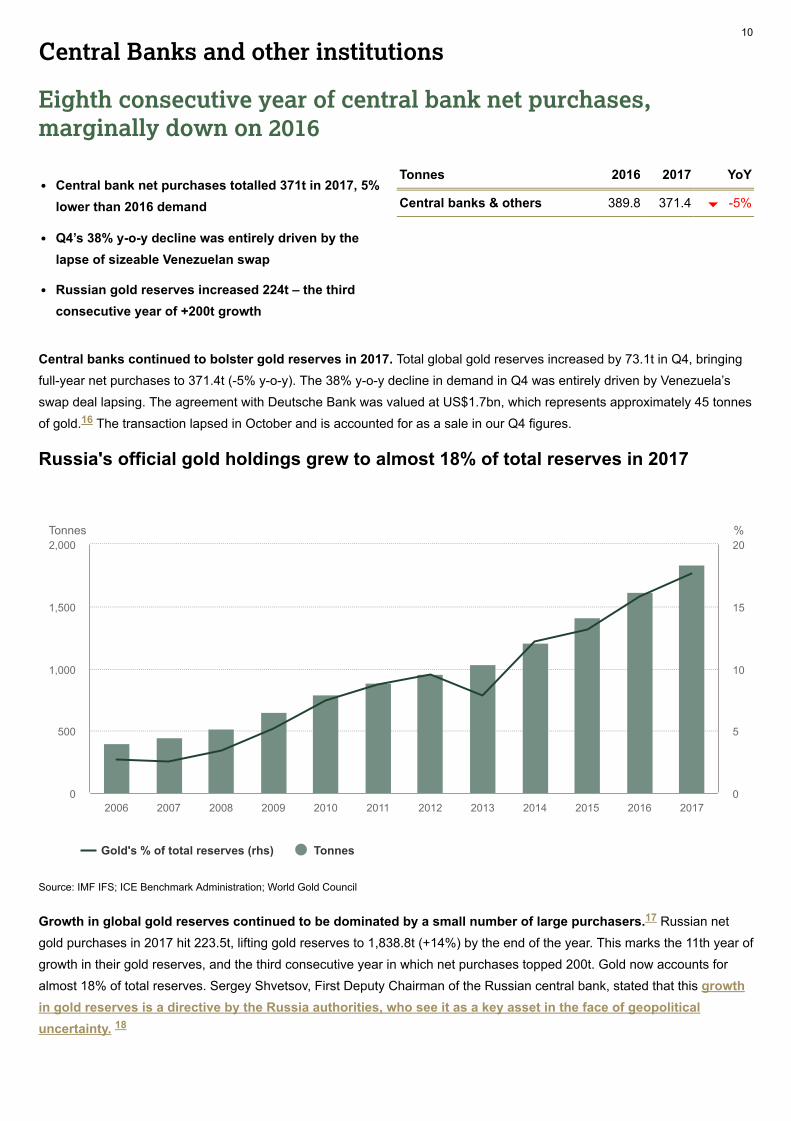
Russian gold reserves increased 224t – the thirdconsecutive year of +200t growth
Central Banks and other institutions
Eighth consecutive year of central bank net purchases,marginally down on 2016
Central banks continued to bolster gold reserves in 2017. Total global gold reserves increased by 73.1t in Q4, bringingfull-year net purchases to 371.4t (-5% y-o-y). The 38% y-o-y decline in demand in Q4 was entirely driven by Venezuela’sswap deal lapsing. The agreement with Deutsche Bank was valued at US$1.7bn, which represents approximately 45 tonnesof gold. The transaction lapsed in October and is accounted for as a sale in our Q4 figures.
Russia's official gold holdings grew to almost 18% of total reserves in 2017
Source: IMF IFS; ICE Benchmark Administration; World Gold Council
Growth in global gold reserves continued to be dominated by a small number of large purchasers. Russian netgold purchases in 2017 hit 223.5t, lifting gold reserves to 1,838.8t (+14%) by the end of the year. This marks the 11th year ofgrowth in their gold reserves, and the third consecutive year in which net purchases topped 200t. Gold now accounts foralmost 18% of total reserves. Sergey Shvetsov, First Deputy Chairman of the Russian central bank, stated that this growthin gold reserves is a directive by the Russia authorities, who see it as a key asset in the face of geopoliticaluncertainty.
Tonnes 2016 2017 YoY
Central banks & others 389.8 371.4 -5%
16
Tonnes %
Gold's % of total reserves (rhs) Tonnes
2006 2007 2008 2009 2010 2011 2012 2013 2014 2015 2016 20170
500
1,000
1,500
2,000
0
5
10
15
20
17
18
10

The most notable purchaser of the year was Turkey. The central bank began buying with gusto: reserves increased byan average of 11t per month from May. By the end of 2017, gold reserves had increased by 86t to over 200t. As we notedin our Q2 report, the decision to make regular purchases of gold was strategic and in line with Turkey’s view that gold is akey reserve asset.
Kazakhstan remained committed to increasing their gold reserves. The central bank bought a net 11.6t in Q4, takingtotal net purchases for the year to 42.9t. This brings Kazakhstan’s gold reserves to just over 300t, 40% of total reserves, atthe end of 2017. Other noteworthy purchasers during the year were: Colombia (4.6t), Venezuela (4.4t), Indonesia (2.5t),Jordan (2.2t), Kyrgyz Republic (1.8t), Thailand (1.6t) and Mongolia (1.3t).
Notwithstanding Venezuela’s lapsed swap, significant net sales were limited in 2017. Most countries left their goldreserves relatively untouched during the year. Germany was the only significant seller throughout the year, using 4.3t of goldreserves for its coin-minting programme.
19
20
11

Electronics demand was 4% higher in 2017, withrecovery persistent across all four quarters
Three key components of electronics – wirelesschips, Printed Circuit Boards (PCBs) and goldbolding wire – drove growth
Only the dental sector registered lower demand,continuing the trend of recent years
Technology
Demand for gold in the technology sector saw an overall gain of3% to 332.8t in 2017, the first y-o-y increase since 2010. Q4 wasa particularly strong quarter at 88.2t, the highest level ofdemand since Q4 2014
Gold used in electronics gained 6% y-o-y to 71.3t in Q4. Despite some seasonal pressure on the LED sector, theother three key sub-sectors achieved decent growth. The wireless sector was the indisputable outperformer thanks toincreasing numbers of sensors embedded in smartphones, and the high level of wafer output among wireless chipmanufacturers. Record levels of memory chip demand underpinned growth in gold bonding wire, while gold coatings used inPCBs also experienced high demand.
The wireless sector benefited from a surge in demand for 3D sensors; most notably those powering new-generationsmartphone features such as 3D video, virtual reality (VR), augmented reality (AR) and iris- and gesture-recognition. Theemerging 5G network infrastructure market generated additional demand. Taiwan-based Win Semiconductors, for example,saw its 2017 wafer output increase 70%. Overall, gold demand in wireless applications was estimated to have grown by asmuch as 20 to 30% y-o-y in Q4.
Gold bonding wire demand continued to be supported by the combination of a severe supply shortage of, and anunprecedented demand for, memory chips in 2017. Looking forward, DRAM and NAND price windfalls will encourage majorchip companies, such as Samsung, Hynix and Micron, to increase production. This may translate to additional demand forgold if overcapacity in the market is avoided.
Demand from the LED sector lagged due to its traditional seasonal dip. Q4 was 1-3% lower y-o-y. The outlook, though, isbroadly positive with LED manufacturers planning to increase production capacity of high margin units. Many of these LEDswill be used in the automotive sector, a key growth industry for electronic components. We expect this will be supportive forgold demand.
Taiwan and South Korea topped the league table of gold demand in the electronics sector, with y-o-y growth of 17% and16% respectively in Q4.
Tonnes 2016 2017 YoY
Technology 323.4 332.8 3%
Electronics 255.6 265.3 4%
Other Industrial 49.8 50.6 2%
Dentistry 18.0 16.8 -6%
12
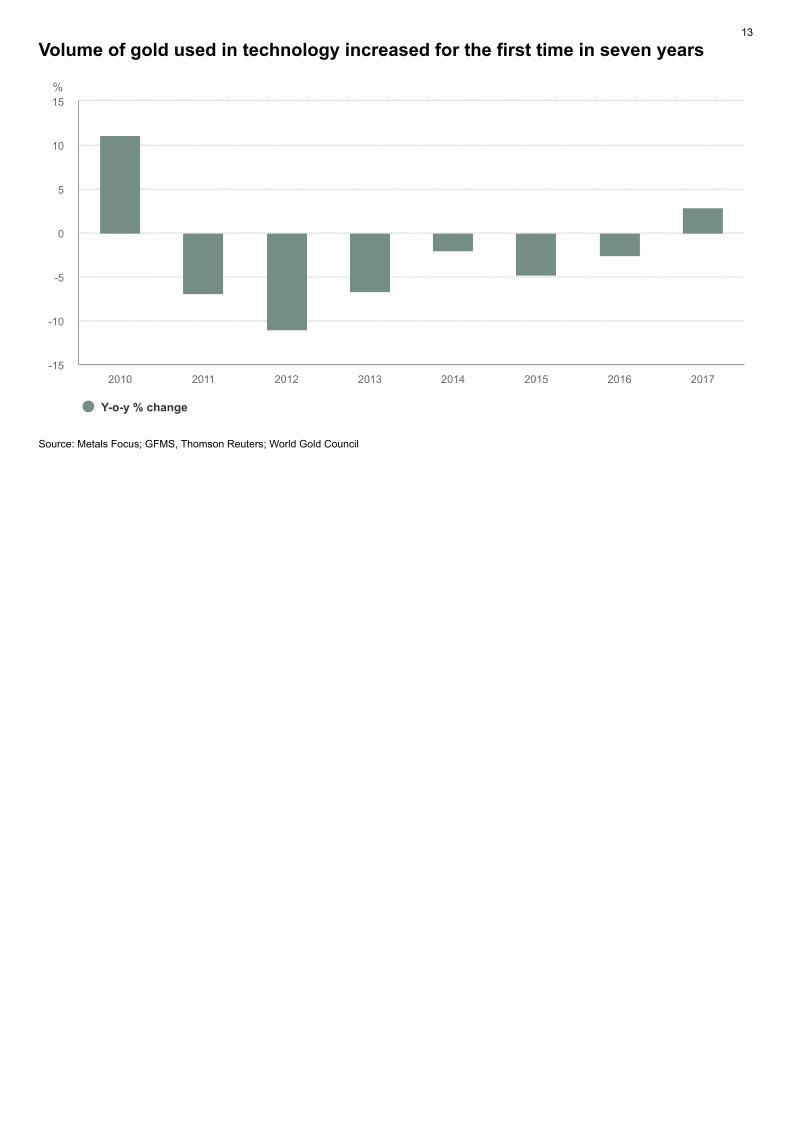
Volume of gold used in technology increased for the first time in seven years
Source: Metals Focus; GFMS, Thomson Reuters; World Gold Council
%
Y-o-y % change
2010 2011 2012 2013 2014 2015 2016 2017-15
-10
-5
0
5
10
15
13

Mine production rose fractionally to 3,268.7t in 2017,the highest annual total in our series
2017 saw net de-hedging of 30.4t, the first year ofnet de-hedging since 2013
Unusually high recycling levels in 2016 were themain cause of a 10% y-o-y decline in 2017, asrecycling activity normalised
Supply
Decline in recycling drove total supply 4% lower to 4,398t, asmine production crept to new high in 2017
Mine production
Mine production finished 2017 by falling 2% y-o-y to 833.1t in Q4. This resulted in overall annual mine production of 3,268.7t– fractionally higher compared to 2016 – and the highest annual total in our records. New mine starts in recent years havemostly served to fill the gap left by production losses elsewhere, which has led to a relative plateauing in global output.
Familiar issues in China and Tanzania continued to impact production in Q4. In China – the world’s largest producer –Q4 saw another y-o-y decline; national production dropped 10%. Provisionally, 2017 output is expected to be 9% lower than2016, only the second annual drop in production since 1980. Stricter environmental regulations – relating to cyanide intailings – imposed earlier this year resulted in the closing of some marginal operations in 2017, negatively impacting overalloutput. One of the key messages in President Xi’s report at China’s 19th Communist Party Congress was theimplementation of the strictest possible environmental protections. Tanzanian mine production fell 15% y-o-y in Q4. Theongoing concentrate exports ban – introduced in March – continues to impact output from Acacia Mining’s Buzwagi project,while the company is also in the process of reducing operations at its primary Bulyanhulu project to help manage losses.
Several other jurisdictions also saw declines. The y-o-y change in Q4 production in the United States, Brazil and Mali wereall affected by comparison with a high base period in 2016.
Output from Russia saw a y-o-y increase in Q4. The quarter also saw the start-up of the significant Natalka project located inthe Magadan region. The project began commissioning in September and announced in December that it had poured its firstdoré. While the project is still in the early stages of production, Polyus expect this will significantly boost thecompany’s, and Russia’s, production in coming years.
In Indonesia, the mining of higher grade ore at Grasberg – the country’s largest mine – helped boost Q4 mine production by11%. The mining of higher grades is likely to persist into 2018. In Canada, the Hope Bay (Q1 start) and Brucejack (Q2 start)projects, as well as Q4 start-ups Rainy River and Moose River, contributed to a 5% increase in Q4. Several West Africanstart-ups – Fekola and Yanfolila (Mali), and Houndé (Burkino Faso) – also entered production towards the end of 2017.
Tonnes 2016 2017 YoY
Total supply 4,590.9 4,398.4 -4%
Mine production 3,263.0 3,268.7 0%
Net producer hedging 32.8 -30.4 -
Recycled gold 1,295.1 1,160.0 -10%
21
14

Mine production growth continued to slow
Source: Metals Focus; GFMS, Thomson Reuters; World Gold Council
Net producer hedging
Total net de-hedging in 2017 reached 30.4t, bringing an end to three consecutive years of modest net hedging. InQ4, gold miners completed 15t of net de-hedging; the overall global hedgebook now stands at around 222t. As withprevious quarters, fresh gold hedges were tactical in nature, mainly established to secure project cashflow, project financing,or high local gold prices.
In October, Westgold Resources announced an increase in its short-term hedgebook of 40,000oz to lock in higher localprices. In November, Gold Road – which is developing the Gruyere gold mine in Australia – announced that it had enteredinto forward agreements which hedged 200,000oz to secure a portion of the mine’s future production. And in the samemonth, Resolute Mining announced it had agreed to hedge 72,000oz of output, to fund the expansion project at itsRavenswood gold mine. This follows forward sales of 84,000oz in September to help fund development of the Syama minein Mali.
Recycling
Gold recycling activity spent much of 2017 normalising after an impressive 2016. Despite the gold price performingrelatively well in many currencies throughout 2017, the annual supply of recycled gold fell 10% to 1,160t, from 1,295.1t in2016. After recycling responded with vigour to the stellar price increase in the first three months of 2016, it was believed that2017 would likely struggle to compare favourably.
Q4 was the only quarter which saw a y-o-y increase in recycling during 2017: the 276.6t sold back by consumers was 8%higher than the same period in 2016 – which was negatively impacted by a significant price drop and the shockdemonetisation in India.
East Asian and Middle Eastern markets drove declines in recycling during 2017. Recycling activity in 2016 – boostedby higher local prices on the back of currency weakness – was particularly high in Indonesia, Turkey and Egypt. This alsomade subsequent price levels in 2017 appear less attractive to consumers open to selling, contributing to the relativeweakness in the y-o-y comparison. Political tensions across the Middle East also spurred consumers to hold onto goldrather than cash in.
%
Y-o-y % change
2008 2009 2010 2011 2012 2013 2014 2015 2016 2017-4
-2
0
2
4
6
8
10
22
15

In Western markets, the relatively strong performance of gold in US$ terms supported recycling levels in the United States.But gold’s weaker price performance in euro terms meant that European recycling fared less well. In the UK, recyclingactivity continued to re-adjust in 2017, after jumping in response to the Brexit referendum in 2016.
16
Footnotes
1. World Gold Council, ‘India’s gold market: evolution and innovation’, January 2017. www.gold.org/research/india-gold-market
2. Read more: www.mahindra.com/news-room/press-release/mahindra-farm-equipment-sector-sells-21046-units-in-india-during-november
3. Read more: www.gold.org/research/market-update/gst-impact-on-indias-gold-market
4. Read more: www.businessoffashion.com/articles/news-analysis/demand-for-gold-in-china-lifts-profit-at-worlds-largest-jeweller
5. Read more: www.gold.org/research/gold-demand-trends/gold-demand-trends-full-year-2017/investment
6. Read more: www.cnbc.com/2018/01/17/tiffanys-2017-holiday-sales-jump-8-percent.html
7. Our ETF data series has been slightly amended to incorporate lagged data for China’s Bosera I fund.
8. Read more: www.gold.org/research/gold-market-2018
9. Read more: www.gold.org/data/gold-etf-holdings
10. Read more: www.gold.org/research/market-update/market-update-german-investment-market
11. Read more: www.ccb.com/cn/html1/office/grb/17/1030ysj/index.html
12. Read more: paytm.com/digitalgold
13. Read more: mmtcpamp.com/services/me-gold
14. Read more: www.bloomberg.com/news/articles/2017-08-24/turkey-sees-no-need-to-expand-credit-scheme-that-spurred-growth
15. Read more: www.gold.org/research/market-update/market-update-german-investment-market
16. For the compilation of our central bank demand statistics, we have assumed the swap represents 45t.
17. All country-level data is taken from the IMF's International Financial Statistics (IFS), February 2018 edition.
18. Read more: www.rt.com/business/411700-russia-gold-reserves-putin/
19. Excluding commercial bank gold holdings held at the central bank as part of the reserve option mechanism.
20. World Gold Council 'Gold Demand Trends Q2 2017 : Central banks and other institutions' August 2017. www.gold.org/research/gold-demand-trends/gold-demand-trends-q2-2017/central-banks
21. Read more: www.polyus.com/en/media/press-releases/polyus-starts-commissioning-of-natalka/
22. Q3’17 has been revised from -10t to 8.3t, owing to the incorrect omission of hedges by Yamana Gold (285,000oz) andTeranga gold (131,000oz).
17
Disclaimer
© 2018 World Gold Council. All rights reserved. World Gold Council and the Circle device are trademarks of World Gold Council or its affiliates.
All references to LBMA Gold Price are used with the permission of ICE Benchmark Administration Limited and have been provided for informational
purposes only. ICE Benchmark Administration Limited accepts no liability or responsibility for the accuracy of the prices or the underlying product to which
the prices may be referenced. Other third party content is the intellectual property of the respective third party and all rights are reserved to them.
Reproduction or redistribution of any of this information is expressly prohibited without the prior written consent of World Gold Council or the appropriate
copyright owners, except as specifically provided below.
The use of the statistics in this information is permitted for the purposes of review and commentary (including media commentary) in line with fair industry
practice, subject to the following two pre-conditions: (i) only limited extracts of data or analysis be used; and (ii) any and all use of these statistics is
accompanied by a citation to World Gold Council and, where appropriate, to Metals Focus and Thomson Reuters, as their source.
World Gold Council does not guarantee the accuracy or completeness of any information. World Gold Council does not accept responsibility for any losses
or damages arising directly or indirectly from the use of this information.
This information is not a recommendation or an offer for the purchase or sale of gold, any gold-related products or services or any other products, services,
securities or financial instruments (collectively, “Services”). Investors should discuss their individual circumstances with their appropriate investment
professionals before making any decision regarding any Services or investments.
This information contains forward-looking statements, such as statements which use the words “believes,” “expects,” “may,” or “suggests,” or similar
terminology, which are based on current expectations and are subject to change. Forward-looking statements involve a number of risks and uncertainties.
There can be no assurance that any forward-looking statements will be achieved. We assume no responsibility for updating any forward-looking
statements.
18