go beyond - cigna...of individuals around the world. and we offer customers support around the...
TRANSCRIPT

BEYONDGO
2016 ANNUAL REPORT

INVESTING AND INNOVATING FOR THE FUTURE
Cigna is investing and innovating to meet
the evolving needs of customers, clients and
communities – and remaining true to our mission
to help improve the health, well-being and sense
of security of those we serve.
In the spirit of a global health service company,
we’re progressing steadily beyond insuring sick
care to helping people live well, prevent sickness,
obtain access to health care, recover from
illness or injury, return to work and provide for
themselves and their families.
We develop innovative programs to help people
manage their health and health care costs. We
provide the global workforce with access to a
worldwide network of local health care providers
as well as programs that
meet the diverse needs
of individuals around
the world. And we offer
customers support around
the clock, around the world.
We’re a driving force in
the imperative to create a sustainable
health care system, with greater access to
affordable, quality health care and a more
personalized experience. We’re going
beyond, and helping our customers and
clients do the same.

BEYOND
EXPECTATIONS
TABLE OF CONTENTS
Letter to our shareholders 2
Creating a sustainable health care system 10
Inspiring change 14
Growing internationally 16
Innovating for our customers 18
Imagining health and wellness for all 19
Cigna in perspective 22
Corporate and Board of Directors 24

22 L E T T E R TO O U R S H A R E H O L D E R S
As we enter 2017, we look forward to your continued
partnership as, together, we go beyond for our customers,
our clients, our partners, our communities and our
shareholders in a shared future of success.”
“
3
TO OUR SHAREHOLDERS
In 2016, we continued to build on our numerous
successes of the past seven years, growing our number
of customer relationships to more than 94 million, and
delivering differentiated value with innovative solutions
– including some new offerings – that drive even greater
levels of quality, affordability and personalization.
At the same time, our focused and time-tested
“Go Deep, Go Global, Go Individual” strategy continues
to drive growth and strong financial results for the benefit
of our customers, clients, partners, communities and
shareholders around the world. As a result, I am confident
we are well-positioned to continue driving innovation,
further strengthen our global capabilities, and deliver
sustained value as we look to the future.
Our journey toward a more sustainable health care
system is what originally motivated our proposed
combination with Anthem, as we sought to further
expand choice, improve affordability and quality, and
accelerate value-based care programs. In the second half
of 2016, the Department of Justice sued to prevent our
3
merger with Anthem and, as I write this in early 2017, the
federal district court has enjoined the proposed Cigna-
Anthem merger and litigation continues.
Throughout the merger process, we continued to invest
in our businesses, and continued contingency planning
for other potential paths, if necessary – including a
sovereign path.
Cigna’s attractive, ongoing free cash flow generation
and exceptionally strong capital position – coupled with
the strength of our diversified businesses, differentiated
capabilities and culture of innovation – give us confidence
that we have a clear path ahead to continue creating
value in the marketplace for customers, clients
and shareholders.
We now eagerly and optimistically look to Cigna’s future,
and to leading the health care industry in consumer
engagement, supporting our customers through their
diverse life and health stages, and contributing to a more
sustainable health care system.
David M. Cordani
President and
Chief Executive Officer
Cigna Corporation

4
Cigna concluded 2016 with strong momentum, and remains
in a solid position to drive attractive earnings and customer
growth, both in 2017 and over the long-term.”
2016 PERFORMANCE
In the face of considerable market disruptions, as
well as uncharacteristic challenges in the first half of
the year for two of our historically well-performing
businesses that pressured this year’s earnings,
Cigna concluded 2016 with strong momentum, and
remains in a solid position to drive attractive earnings
and customer growth, both in 2017 and over the
long-term.
Cigna’s 2016 full-year consolidated revenues
increased by 5 percent to $39.7 billion. We
delivered shareholders’ net income for 2016 of
$1.9 billion or $7.19 per share and adjusted income
from operations* of $2.1 billion or $8.10 per share.
These results reflect continued, effective execution
of our strategic framework implemented seven years
ago. Over this period, we have achieved compound
annual growth of 12 percent for revenues, as well
as 10 percent for adjusted income from operations
per share.* Our ability to create ongoing value has
driven Cigna’s stock performance to deliver a total
shareholder return of 280 percent from 2009 to 2016.
4 L E T T E R TO O U R S H A R E H O L D E R S
Looking ahead, we remain committed to achieving
average annual adjusted income from operations* per
share growth of 10 percent to 13 percent over the long-term.
Following are details on the performance of our business
segments in 2016.
G l o b a l H e a l t h C a r e
Cigna’s Global Health Care business segment delivers
health care, wellness and preventive products and
services through medical and specialty solutions for
individual customers and employer clients on a global
basis. 2016 premiums and fees grew 3 percent to $27.7
billion over full-year 2015, with adjusted income from
operations* of $1.85 billion reflecting strong performance
in our Commercial Employer business as well as
customer growth.
This strong performance is evident in the growth of our
medical customer base of approximately 200,000 during
the year to a total of 15.2 million customers. Together
with our provider partners, we are better anticipating and
addressing the needs of our customers resulting in high
levels of retention and acquisition.
“

55
We also continued to deliver medical costs that reflect
better health outcomes and strong clinical excellence for
our customers and clients. Key to this achievement are
the deep collaborative relationships we foster and grow
with our incented physician partners, supported by our
continued focus on the personalization of care.
Our deep portfolio of solutions is highly localized,
designed for affordability, and well-complemented by
physician engagement models that emphasize value over
volume of services.
Within our Seniors business, we made progress with our
Centers for Medicare and Medicaid Services remediation
efforts, and are in the latter stages of audit response
work relative to our Medicare Advantage offerings. We
are highly focused on emerging with an even stronger
Seniors business and portfolio of solutions that is
well-positioned for sustained growth.
G l o b a l S u p p l e m e n t a l B e n e f i t s
Cigna’s Global Supplemental Benefits segment continues
to deliver strong value in supplemental health, life and
accident solutions to a growing number of customers in
markets around the world.
Customer insights, marketing capabilities and direct-
to-consumer distribution help fuel the expansion of
our product offerings, and drive their reach in key
geographies and growth markets in Asia, Europe and
the United States. Illustrative examples of this in 2016
included Cigna’s HealthFirst Elite Medical Plan, named
“Most Innovative Product” finalist at the Hong Kong
Insurance Awards, transformative technology capabilities
in our global markets, and launch of Cigna Virtual Health
in the United Kingdom – a new health and well-being app
which allows employers to help their employees navigate
to better health through personalized tools and coaching.
Attractive growth and profitability last year was
reflected in 2016 premiums and fees growth of 10
percent – excluding the impact of foreign currency
movements – to $3.2 billion, and adjusted income
from operations* of $294 million.
G r o u p D i s a b i l i t y a n d L i f e
Cigna’s Group Disability, Life and Accident insurance
operations deliver leading sense-of-security offerings
and innovative programs to optimize productivity for
employers and individuals.
Our 2016 results, with premiums and fees increasing
4 percent over 2015, to $4.1 billion and full-year
adjusted income from operations* of $125 million,
reflect business growth across our disability and
life products, ongoing stabilization of life claims,
and improved disability results as the claim process
modifications made in early 2016 continued to mature.
Our disability absence management model reduces
overall costs to employers, while our integration
of disability products with medical and specialty
offerings promotes health and wellness and optimizes
employee productivity. As a leader in helping
employees return to work quickly, we also are
delivering a better quality of life to the individuals
we serve.
ADDRESSING CUSTOMER NEEDS
Importantly, our focus continues to be squarely on
delivering value for our customers and clients as a
very dynamic marketplace continues to evolve both
in the United States and around the globe.
The core issues that are pressuring health care
markets broadly are arising from the same market
forces pressuring the status quo of all health care
systems in the world.
Aging populations, eroding health status and the rise
of chronic conditions pose challenges for health care
consumers individually, as well as society at-large.

6
And these forces are contributing to increasing
demand for greater access to health care and sense
of security offerings that are both affordable and of
high quality.
Our proven strategy is delivering value as we help
the people we serve maintain and improve their
health as well as meet accelerated demand for
programs that are more personalized and designed
for the local marketplace with high quality,
affordable care.
We are achieving this through a combination
of solutions and partnerships to better connect
individuals and health care professionals, resulting in
improved health and well-being – and better value.
We are incentivizing, engaging and supporting the
individuals we serve to drive healthy actions and
behaviors. At the same time, we are deepening
collaboration with health care professionals and
supply-chain partners with leading-edge strategic
alliances, incentive programs and value-based
arrangements, as well as effective information
sharing and targeted point-of-care resource support.
Our efforts, supported by innovative tools and
capabilities, are resulting in greater rewards for health
care partners and further value for our customers as we
better anticipate and meet these emerging needs.
Our powerful set of solutions demonstrates that the best
value comes from engaging, incentivizing and supporting
individuals and enabling health care professionals with
shared resources and value-based rewards, all delivered
through highly-localized, integrated solutions.
BUILDING COLLABORATIVE RELATIONSHIPS, DRIVING INNOVATION
At Cigna, we are continuing to enhance affordability and
quality through ongoing investments in value-based care
and partnering with health care professionals to be able
to deliver better value.
While we have delivered substantial innovation to date,
we recognize that we are still on a journey to continuing
to evolve our capabilities and Collaborative Accountable
Care (CAC) relationships.
Our approach reflects a consultative capacity to make
sure that the right tools, processes and capabilities are in
place to foster greater collaboration between individuals
and health care professional partners.
All of this is with the objective of improving quality for the
benefit of the individual by finding the proper alignment.
We also continue to grow capabilities to share the right
actionable information with our health care professional
partners to be able to effectuate decisions.
And in order to empower health care professionals and
assist with point-of-care decision making, we broaden
support through care extension resources – nurses,
case managers, health coaches, behaviorists and
pharmacists – to allow more comprehensive population
health and care coordination.
6 L E T T E R TO O U R S H A R E H O L D E R S
Cigna President and CEO David M. Cordani speaks at the Washington Post’s “Addiction in America” forum in Washington D.C. last year.

7
Our more mature CACs are especially high-performing.
These better-than-market results include a 30 percent
reduction in emergency room utilization and an over
60 percent reduction in hospital readmission rates,
illustrating better continuity and coordination of services
and programs for the benefit of their patients, and
our customers.
Today, we have nearly 250 collaborative arrangements
across large physician, and specialty practices, spanning
31 states, and partner in incented-payment models with a
growing number of hospital systems.
To enable greater emphasis on preventive care and
improve quality and value, we are forming partnerships
in the form of delivery system alliances to closely align
clinical teams including nurse care coordinators, case
managers and health coaches.
We then further integrate them within the health care
delivery process to create a more seamless experience
for our customers, and a more coordinated health
care system.
I n n ova t i ve s o l u t i o n s
Cigna also emphasizes the delivery of new, innovative
solutions to the marketplace, with two recent examples
being Cigna One Guide® and Cigna SureFitTM.
Cigna One Guide is a multi-modal service experience,
powered by analytics, that proactively engages
customers to stay healthy, eliminate surprises and save
money. Combining the convenience of a smart, integrated
digital app with the expertise and empathy of human
touch, this differentiating solution provides access to
guided consultations via phone, web, a mobile app or chat.
Our Cigna SureFit solution heightens collaboration
between local physician networks and hospital groups
to help drive efficiency and create a more personalized
experience. This product creates an optimized network
configuration and benefit design to best meet the
personalized needs of the customer. Clients receive
substantial savings thanks to a lower total cost of care, as
well as embedded behavioral, pharmacy and population
health solutions that are fully integrated into our offerings.
All of this is coupled with a higher level of personalization
and customer support, and is enabling an easier, more
efficient administrative experience for our clients.
CONCLUSION: WE GO BEYOND TO DELIVER ON OUR MISSION
We are proud of what we have accomplished at Cigna,
with a strong track record of top-line and bottom-
line growth, industry-leading medical cost trend and
competitively attractive shareholder returns.
Our mission – to improve the health, well-being,
and sense of security of the individuals we serve – is
unchanged, and it will continue to guide our overall
strategy and how we deliver value for our customers,
clients, partners and communities – including
our shareholders.
Additionally, as a global health service company, our
success depends on earning trust through responsible
business practices, corporate citizenship and providing
superior services that meet our customers’ individual
needs. Inspired by our mission, the philanthropic work of
the Cigna Foundation creates partnerships to positively
impact the health of people where they live and work.
Our World of Difference grant partners are working
to address complex health and social needs for those
experiencing health disparities. Recognizing that health
outcomes are driven by multiple factors, including age,
race, ethnicity, economic status and other factors, this
important work strives to create systems that address
the needs of individuals and gives everyone an equal
opportunity to achieve their best health.
7

88
The organization also remains committed to
heightening awareness around health and wellness
challenges affecting our communities.
For example, in 2016, Cigna and the Cigna
Foundation launched a multi-city cross-country
Health Improvement Tour to bring free health
screenings to communities nationwide so people can
learn their blood pressure, blood sugar, cholesterol
and body mass index (BMI), the four key numbers
for managing and taking control of their health.
Cigna also staked a leadership role in the effort to
reduce America’s dependence on opioids, starting
with a commitment to cut the use of those drugs
among Cigna customers by 25 percent. To date,
60 physician groups, representing more than
40,000 physicians, have signed on to join Cigna
in this pledge.
I would like to thank you for your ongoing interest in our
Company. Together, along with my more than 40,000
Cigna colleagues who embody our mission and execute
on our strategy every day, we are delivering value with a
clear path forward to create sustainable value over the
years ahead. As we enter 2017, we look forward to your
continued partnership as, together, we go beyond for our
customers, our clients, our partners, our communities and
our shareholders in a shared future of success.
8 L E T T E R TO O U R S H A R E H O L D E R S
David M. Cordani
President and Chief Executive Officer
Cigna Corporation
BEYOND
STANDARD

999
The organization also remains committed to heightening
awareness around health and wellness challenges affecting
our communities.”
* Adjusted Income from Operations and Adjusted Income from Operations per share are non-GAAP measures used to describe the Company’s financial results. Definitions of Adjusted Income from Operations on a consolidated and segment basis are contained in Management’s Discussion and Analysis of Financial Condition and Results of Operations (MD&A) on page 36 of the Form 10-K included in this annual report. The MD&A also includes reconciliations of Adjusted Income from Operations to the most directly comparable GAAP measures.
“

10
CREATING A SUSTAINABLE HEALTH CARE SYSTEMWORKING TOGETHER FOR AFFORDABILITY AND QUALITY IN HEALTH CARE
Cigna is working to create a more sustainable health
care system, one that offers greater affordability and
better quality. To achieve this goal, we’re collaborating
with providers to reward them for the quality of care
they deliver, and the health outcomes they achieve for
patients, as we shift from the traditional fee-for-service
reimbursement models to value-based partnerships.
We believe the true value of care should be based on
how well patients are treated, not how often.
We continue to implement our Cigna Collaborative
Care arrangements with primary care physicians, and
we’re building on that momentum as we extend these
arrangements to specialty care, such as orthopedics,
cardiology, maternity care, cancer care, colonoscopy,
and kidney dialysis. We’re also developing innovative
arrangements with hospital systems that require even
deeper collaboration as we jointly offer health plans
tailored to meet local market needs.
In 2015, Cigna was the first payer to commit to the
U.S. Department of Health & Human Services’ 50/90
goals to have 50 percent of payments in alternative
payment models and 90 percent in value-based
arrangements by 2018. We’re making significant
progress toward reaching these goals. This benefits not
only our customers and clients, but also our contracted
providers. We’re reducing waste by rewarding high-
performing providers – and we remain focused on
supporting them with actionable information, robust
reporting and consultative support.
Just one example of our Collaborative Care
arrangements is HeartWell LLP in South Florida, where
we launched a program to improve quality and cost
of care for people diagnosed with chronic coronary
artery disease. Under the new initiative, HeartWell
will continue to be paid for the medical services it
provides to its Cigna customers. It will also be eligible
for additional reimbursement if it meets certain quality
targets, and if the actual cost for an entire episode of
care is below a risk-adjusted expected cost. An episode
of care includes pre-care, cardiovascular procedures
(such as cardiac catheterizations and coronary
angioplasty), medications, recovery and follow-up care
through 12 months following the procedure.
After the episode of care has ended, Cigna will
evaluate all of the claims for that episode, adjust for
risk and determine if the total actual cost is below the
expected cost. If it is, HeartWell will receive a portion
of those savings – but only if it also meets specific
quality targets.
C R E AT I N G A S U S TA I N A B L E H E A LT H C A R E S Y S T E M
BEYOND
VOLUME OF

11
Our value-based incentive model also extends to our
pharmacy business. We recently entered into value-
based contracts with pharmaceutical companies Amgen
and Sanofi/Regeneron for two of their cholesterol-
lowering drugs. Value-based contracts tie the cost of
drugs to how well customers respond to the medications,
aligning financial terms with our pharmaceutical
partners to how well their medications improve our
customers’ health. Cigna is a leader in this area, as we
have value-based contracts for medications that treat
cholesterol, heart failure, diabetes, multiple sclerosis
and hepatitis C.
We also launched a new company, CareAllies, Inc., in
2016. CareAllies works side-by-side with health care
providers, physicians, health systems and hospitals
to help improve the quality, value and experience of
care for their patients, making health care better for
everyone to create a more sustainable value-based
health care delivery system.
HEALTH SERVICES

1212 C R E AT I N G A S U S TA I N A B L E H E A LT H C A R E S Y S T E M
HEALTH IMPROVEMENT TOUR
Cigna launched its cross-country Health Improvement
Tour in partnership with the Cigna Foundation and
the Cordani Family Foundation. Through this multi-
city tour, Cigna is bringing free health screenings
to communities nationwide so people can learn
their blood pressure, cholesterol, blood sugar and
body mass index (BMI) and take control of their
health. Cigna’s HIT Tour is an expansion of Cigna’s
corporate responsibility and philanthropic efforts, and
promotes the value of health and wellness programs in
communities throughout the country.
To help provide access to care for those in need and
extend the reach of the tour, the Cordani Family
Foundation – begun by Cigna CEO and President
David M. Cordani – is donating funds to pay for the
costs associated with bringing these screenings to
underserved communities.

GO.KNOW.TAKE CONTROL.SM
Cigna launched its largest prevention campaign to date,
with an ensemble of familiar TV doctors to promote
check-ups as an important step in preventive care.
Actors Alan Alda, Patrick Dempsey, Lisa Edelstein,
Donald Faison and Noah Wyle donned scrubs and white
coats to take on a new role with Cigna, letting America
know, “We’ve saved hundreds of lives on TV. Now we’re
helping to save lives for real.”
* CDC Prevention Checklist, Centers for Disease Control and Prevention, 2015; http://www.cdc.gov/prevention/ ** CDC Preventive Health Care Tip Sheet, 2015, http://www.cdc.gov/healthcommunication/toolstemplates/entertainmented/tips/preventivehealth.html *** Plans may vary. Includes eligible in-network preventive care services. Some preventive care services may not be covered, including most immunizations for travel.
Reference plan documents for a list of covered and non-covered preventive care services. 13
According to the CDC, Americans use preventive
services at only about half the recommended rate.**
The campaign encourages all consumers to get their
annual check-up – which most health plans cover at 100
percent – as part of a suite of preventive services.***
BEYOND
SICK CARE VISITS
The TV doctors appeared in a multi-media platform,
including television, digital and social channels, using
their star power to help influence consumers to get their
preventive check-up, know their four health numbers for
blood pressure, cholesterol, blood sugar and BMI – the
main numbers for managing health care costs – and take
control of their health.
Cigna’s goal is to help save 100,000 lives a year, the
number of lives the Centers for Disease Control and
Prevention (CDC) estimates would be saved if everyone
received his or her recommended preventive care.*

14
INSPIRING CHANGE
I N S P I R I N G C H A N G E
THE STIGMABEYOND
REVERSING THE NATION’S OPIOID EPIDEMIC
Cigna is leading the effort to reduce America’s dependence on opioids,
starting with a commitment to cut the use of those drugs among Cigna
customers by 25 percent, ending prior authorization for commercial health
plan customers receiving medication-assisted treatment for opioid use
disorder, and creating an opioid pledge for providers with whom we work.

15
Cigna last year sponsored the Washington Post forum, “Addiction in America”
in Washington, D.C. and NPR’s “Generation Listen” events in Atlanta and
Chicago to discuss opioids and the millennial generation. We also announced
our collaboration with the American Society of Addiction Medicine (ASAM),
in which Cigna furnished customer claims data to ASAM to test and validate
performance measures related to addiction treatment. The goal was to verify
what works in the treatment of patients with addiction, create awareness
among the medical community of proven strategies, and hasten the adoption
of these successful methods.
Last year, the Cigna Foundation provided a $100,000 World of Difference
grant to Shatterproof, a non-profit organization committed to ending
substance use disorders, and Cigna employees nationwide rappelled off
buildings to raise awareness for Shatterproof’s work. The Cigna Foundation
also gave $50,000 to make naloxone – a life-saving drug that reverses
the effects of a drug overdose – available for use by first responders
in Pennsylvania.
Cigna works with Stamp Out Stigma, an initiative spearheaded by the
Association for Behavioral Health and Wellness, to change perceptions and
reduce the stigma of mental illness and substance use.
Cigna employees nationwide rappelled off buildings to raise awareness for Shatterproof’s work to help end substance use disorders.

1616
GROWING INTERNATIONALLYSERVING CUSTOMERS THE WORLD OVER
Cigna’s international markets made strides in 2016 through new partnerships, acquisitions,
awards recognition, product launches and marketing campaigns.
In Korea, ongoing innovation has enabled us to grow this key market to approximately 50 percent of our total Global Supplemental Benefits business revenue. We also received three awards for our customer service, innovation and CSR activities. The Financial Supervisory Service named LINA Korea the Best Company in the country at their 5th Financial Consumer Protection Awards; the Korea Chamber of Commerce & Industry named us the Most Innovative Company at their 23rd Company Innovation Awards; and the Minister of Health and Welfare awarded the LINA Foundation for its continued CSR efforts for the elderly.
In Africa, Cigna Global Health Benefits® expanded its relationship with an African-based insurer, the Hollard Insurance Group, to meet the need for a fully compliant health insurance option in sub-Saharan Africa. We created a new product called Hollard Cigna Health, which enables us to bring high quality and affordable health care to our clients, customers and partners in Africa.
In China, our longstanding joint venture with China Merchants Bank is experiencing success through ongoing direct-to-consumer business marketing innovation.
In Hong Kong, our flagship medical reimbursement plan, Cigna HealthFirst Elite Medical Plan, was named one of the top three finalists in the “Most Innovative Product Award” category at the Hong Kong Insurance Awards 2016.
In Singapore, we ranked top in the health insurance industry, and we’re outpacing the growth of the industry, according to the General Insurance Association of Singapore. Cigna Singapore was awarded an Employer of Choice Gold Medal. Growth was attributed to our long-term objective of diversifying our distribution channels and our strong customer retention.
BORDERSBEYOND

17
wwBEYOND
Cigna Thailand introduced the new Enhanced Health Plus Insurance Plan, a new product that covers both critical illnesses and lifestyle-induced illnesses, such as cancer, office syndrome, diabetes, and hypertension. The new plan is revolutionizing the health insurance industry by empowering the customers with the power of choice to choose the coverage of their concern and giving them the value of affordable care.
In Turkey, we launched our new content platform, iyihisset.com. Our aim for the platform is to engage with existing and potential customers and to endorse our brand attitude focusing on well-being. We will use the content as a sales funnel to generate organic leads.
Cigna UK HealthCare Benefits (UKHB) delivered a UK market first with its pilot and subsequent launch of an integrated health and well-being app. By bringing together the best of Cigna’s capabilities, including Coach by Cigna and Global Well-being Solutions, with best-in-class partner capabilities, including telehealth, Cigna has delivered an end-to-end digital customer health experience for its business partners. The pilot launch of this app enabled the UKHB business to further develop it for Cigna Virtual Health’s wider UK market launch in September 2016.
EXPECTATIONS
Cigna TTK created Get ProActiv India, part of the ProActiv Living Program, designed to encourage and reward customers for being physically active. Get ProActiv is integrated with Cigna TTK’s innovative Healthy Rewards Program, allowing customers to earn rewards by logging their physical activity or linking the program with a wearable device to track their activities. Cigna TTK is the first health insurance company in India to create awareness about living a healthy lifestyle through reward-based health risk assessment and condition management programs.
In Indonesia, we launched our newly revamped mobile-enabled website to provide easy access for our existing and potential customers to interact with us. In addition, we also revamped our policy pack and partnered with a new claims provider, AdMedika, allowing us to provide our customers with a wide network of more than 700 hospitals and clinics in Indonesia.
The launch of Cigna New Zealand’s partnership with Southern Cross in 2016 was a significant milestone. Through the partnership, Cigna’s Life Insurance is sold under the Southern Cross brand to its established health insurance member base, with one in five New Zealanders being a member of Southern Cross.
Cigna Spain started the Superhero Program, which sends a Cigna superhero pack to hospitalized children and helps families through this difficult time. Cigna provides information to the parents on how best to explain why they are in the hospital; maintains daily routines where possible; reduces stress and ultimately shows that Cigna is there every step of the way to support customers.
In February 2016, following the earthquake that hit Southern Taiwan, Cigna team members worked around the clock, immediately dispatching claims officers to areas hardest-hit, and responding to texts and telephone hotline requests for assistance, along with updating victims through Facebook and media about Cigna Taiwan’s emergency support services. The team demonstrated that they live Cigna Taiwan’s vision to be the most trusted insurance company in Taiwan.

18
Additionally, we’ve included one-touch fingerprint access
for both the iOS and AndroidTM* versions of its myCigna
App for customers, allowing them to manage their health
by accessing health account information, searching for
in-network doctors and health services and managing
dental claims.
On the cutting edge of innovation and technology
in gamifying health screenings, we introduced Cigna
BioBallTM, a new interactive game that helps players
unlock two of their four biometric numbers – blood
pressure and BMI – using Microsoft HoloLens technology.
Cigna BioBall is being brought to Cigna-sponsored
events nationwide.
18
ENGAGING WITH CUSTOMERS IN A MEANINGFUL WAY
We know consumers’ needs are evolving. Cigna’s
personalization strategy presents opportunity for
Cigna to engage individuals in more meaningful
and transparent ways and reward healthy behavior
change. For example, in 2016 Cigna distributed more
than $154 million in rewards to group health plan
customers who completed nearly 2.8 million health
goals. This compares to $80 million in rewards for
customers who completed 1.5 million health goals
in 2014.
We’re continually looking for how to encourage
customers to take advantage of preventive care
while helping to guide customers through critical
decision points such as selecting a health plan or
choosing a primary care physician. One example is
our Cigna One Guide solution, which will give more
than one million of our Commercial health plan
customers access to guided consultations to help
them choose their benefits, find a personal team of
doctors, clinicians and coaches, help them improve
their health, and reduce their health care expenses
through reward programs.
Another example is our Cigna SureFit health plan,
which creates flexible benefits, innovative network
options and tools to help customers make informed
decisions about their coverage, and personalized
support through each customer’s health journey.
Online dental tools allow customers to take
advantage of detailed dentist profiles and price
comparison tools, which will help them get the most
value from their dental plan.
18 I N N OVAT I N G F O R O U R C U S TO M E R S
INNOVATING FOR OUR CUSTOMERS
* IOS is a trademark or registered trademark of Cisco in the U.S. and other countries and is used under license. Android is a trademark of Google Inc.
BUSINESS AS USUAL
BEYOND

19
Cigna’s vision for an empowered health care system is
one that supports and engages stakeholders such as
customers, employees, physicians, client employers,
government, community groups and others to maximize
health and well-being. We aim to foster continual,
interactive and transparent communication with our key
stakeholders to help us to better understand what’s most
important to them, and how to work together toward the
goal of bringing positive changes to health care systems.
In 2016, Cigna published our third annual Cigna Connects
Corporate Responsibility Report, communicating
our progress toward our environmental, social and
governance objectives. The report includes an index
to the Global Reporting Initiative (GRI) G4 disclosure
framework to assist our stakeholders in locating
corporate responsibility topics of interest. And, as a
signatory of the United Nations Global Compact (UNGC),
we communicate our progress and activities with respect
to the Compact’s ten principles on human rights, labor,
environment and anti-corruption within our report and
provide a UNGC Index for ease of locating our reporting
on these topics.
We invite you to read the report, found on Cigna.com,
to learn more and connect with our company in our
efforts to make the innovative, personal connections
that help improve the health of people, communities and
the environment.
1919
DEMONSTRATING CORPORATE RESPONSIBILITY
Several years ago, Cigna began its journey to develop
a comprehensive corporate responsibility platform,
which we call Cigna Connects. Cigna Connects aligns
our mission of health with our unique expertise and
resources to make powerful connections that positively
impact the health of people, communities and the
environment, and to work more closely with our
stakeholders on these topics.
We recognize social and sustainability issues not only
as problems to be solved, but as opportunities to create
meaningful improvements for our stakeholders and
for society. By applying our expertise and innovative
thinking to social issues, we can fully realize the potential
of understanding how interconnectedness creates value.
IMAGINING HEALTH AND WELLNESS FOR ALL
I M AG I N I N G H E A LT H A N D W E L L N E S S F O R A L L

20
A PROUD HISTORY OF SUPPORTING ACHILLES INTERNATIONAL AND VETERANS
For years, the Cigna Foundation
has partnered with Achilles
International (Achilles) and its
Freedom Team, a non-profit
helping veterans and others with
all types of disabilities participate
in mainstream running events. For
example, we worked closely with
the Achilles Kids Running Program
and New York Medical College to
announce the findings of a study
that highlighted the benefits of
running for children with autism,
including significant improvements
in key areas such as fitness
markers and communication
behaviors. This school-based
study was funded by the Cigna
Foundation’s World of Difference
grants given to Achilles in 2014
and 2015.
Cigna President and CEO David
Cordani is personally committed
to supporting veterans and has
maintained a long-standing
relationship with multiple Achilles
runners – including Master
I M AG I N I N G H E A LT H A N D W E L L N E S S F O R A L L
Cigna’s CR efforts
were recognized in
the Corporate Responsibility
Magazine’s 100 Best Corporate
Citizens List for 2016. This list
recognizes public companies
that had outstanding corporate-
responsibility performances in
2016. The 100 Best List documents
303 data points and performance
measures in seven categories:
environment, climate change,
employee relations, human
rights, governance, finance,
and philanthropy and
community support.
We also were
recognized by CR
magazine, which
annually ranks the nation’s top
100 companies for demonstrated
corporate responsibility (CR) best
practices and a commitment to
publicly reporting their socially
responsible initiatives. The new
Ladder Award recognizes the
25 companies on the 100 Best
list that have shown the most
advancement in their commitment
to responsible business practices.
Cigna was one of six
companies honored
by the National Business Group
on Health with an Innovation in
Advancing Health Equity Award,
which recognizes commitment
to promoting health equity and
reducing health care disparities in
the workplace.
Cigna scored highly on the
first annual Disability Equality
IndexSM (DEISM). The inaugural
survey measures a broad range
of workplace, supply chain and
marketplace activities, and
was created by the American
Association of People with
Disabilities (AAPD) and the US
Business Leadership Network®
(USBLN®).
Cigna was named in the
sixth annual Best for Vets
list, focused on culture and policies
that provide military veterans
with an environment for success.
Army Times, Navy Times, Air Force
Times and Marine Corps Times
contributed to the list.
Reflecting our sustained focus on
improving the health care provider
experience, Cigna earned the
top spot in athenahealth’s 2016
PayerView® Report™. The annual
report provides insight into the
payer-provider relationship and
helps Cigna understand where
its efforts are succeeding and
where further improvement may
be needed. Cigna was ranked
first among all 214 payers that
athenahealth assessed, and it
was the only national payer to
be ranked in the top 10.
In 2016, for the
fifth year in a
row, Cigna was recognized as
one of the best companies for
promoting workplace equality for
transgender employees through
the Human Rights Campaign
Foundation’s Corporate Equality
Index (CEI), which annually
rates almost 4,500 American
companies and organizations
on their policies, benefits, and
practices pertinent to lesbian,
gay, bisexual, and transgender
employees.

21
Sergeant Cedric King, a double-
amputee veteran who he guided
through the 2016 Walt Disney
World® Marathon, and Army
Specialist Stefan LeRoy, a
double-amputee veteran who
he guided through last year’s
Boston Marathon.
Cigna is proud of its history of
supporting American veterans.
We partner with many veterans-
related organizations including
100,000 Jobs Mission, Hero Health
Hire, Employer Partnership of the
Armed Forces, Employer Support
of the Guard and Reserve, and
Military Spouse Employment
Partnership. Cigna is committed
to being a military-friendly
employer by establishing local
ambassador teams in markets
where the company has a high
employee population. Currently
our ambassador teams are in
Bloomfield, Minneapolis, Nashville,
North Texas, Phoenix and
Pittsburgh. These teams partner
with local military installations,
colleges and community programs
to promote Cigna as a premier
employer for veterans and
military spouses.
CIGNA FOUNDATION PROMOTES COMMUNITY HEALTH
Since its creation in 1962, the Cigna
Foundation has contributed $235
million to charities worldwide
and supported the volunteerism
of Cigna employees, who have
devoted more than one million
total hours in volunteer service to
their communities.
As a result of Cigna Foundation’s
commitment last year to non-profits
who help guide the underserved
through the health and social
service systems, 20 communities
across the county now have access
to community health workers. In
Washington, D.C., for example,
a grant to La Clinica del Pueblo
provides obesity, diabetes, and
cardiovascular disease prevention
programs for low-income Latinos
in the Metro D.C. area. In Dallas,
the Los Barrios Promotora de
Salud program focuses on patients
with persistent asthma, and in
Houston, El Centro de Corazon
provides pregnancy education
to underserved Hispanic women.
Mount Sinai Hospital, New York
City, is developing and piloting
a peer-led diabetes prevention
intervention for at-risk ethnic
minority youth in East Harlem. Rush
University Medical Center, Chicago,
is helping African-American women
with their “Take Charge of Your
Diabetes” education curriculum.
And at Emory University’s Rollins
School of Public Health, Atlanta, a
program for Mexican Americans
and Latinos is providing outreach
workers to help this metropolitan
community improve its health.
These are just a few of the programs
supported by the Cigna Foundation
to help overcome health disparities
throughout the country with
the support of community
health workers.
Outside the U.S., the Cigna
Foundation embraced global
workplace wellness as a major
initiative last year, and sponsored
the Global Workplace Wellness
Summit in Dubai. This first-of-its-
kind event attracted approximately
75 employers, business leaders,
public health experts, government
officials, and media with high-
profile speakers and panelists
who presented best practices on
workplace health in the Middle East.
Additionally, through Cigna’s
largest volunteer effort, Feeding
Children Everywhere, employees
nationwide packed 700,000
meals for distribution across
several continents.

2222 C I G N A I N P E R S P E C T I V E
CIGNA IN PERSPECTIVEGLOBAL HEALTH CARE by product
GLOBAL HEALTH CARE
PREMIUMS AND FEES AND OTHER REVENUES IN MILLIONS
$27,918
GLOBAL SUPPLEMENTAL BENEFITS by country
GLOBAL SUPPLEMENTAL BENEFITS
PREMIUMS AND FEES AND OTHER REVENUES IN MILLIONS
$3,275
GROUP DISABILITY AND LIFE by product
GROUP DISABILITY AND LIFE
PREMIUMS AND FEES AND OTHER REVENUES IN MILLIONS
$4,100

2323
Dental
6%Government
33%Medical
61%
Global Health Care includes a commercial line of
business encompassing the United States and certain
international operations. Commercial offers a broad
line of insured and self-insured medical, dental,
behavioral health, vision, prescription drug benefit
plans, health coaching programs and other products
and services that may be integrated to provide
comprehensive global health care benefit programs
to employers and their employees, and individuals,
including globally mobile individuals.
Global Health Care also includes a government line of
business that offers Medicare Advantage, Medicare
Part D and Medicaid plans for Medicare- or Medicaid-
eligible individuals, primarily seniors. A significant
portion of our Medicare Advantage customers are
served by physicians in innovative plan models
designed to improve health outcomes and lower
medical costs. Cigna offers Medicare Advantage plans
in 17 states and the District of Columbia, Medicare Part
D plans in all 50 states and the District of Columbia,
and Medicaid plans in select markets in Texas and Illinois.
South Korea
51%U.K.
5%Taiwan 8%
Other 17%
United States 19%
Global Supplemental Benefits offers supplemental
health, life and accident insurance products in select
international markets and the United States. With
licenses and partnerships across Asia-Pacific, Europe
and North America, Cigna offers products and services
to local citizens and globally mobile individuals.
Global Supplemental Benefits also offers Medicare
Supplement coverage.
Other
7%Life
43%Disability
50%
Group Disability and Life provides insurance products
and related services for group long- and short-term
disability insurance, group life insurance, and accident
and specialty insurance. Cigna markets products
in all 50 states, the District of Columbia, Puerto
Rico, the United States Virgin Islands and Canada.
Group Disability programs are designed to help
improve employee productivity and lower employers’
overall absence costs. Products are coupled with
comprehensive tools and services for easy benefit
management.

2424 C O R P O R AT E A N D B OA R D O F D I R E C TO R S
CORPORATE AND BOARD OF DIRECTORS
EXECUTIVE COMMITTEE
Isaiah Harris, Jr.
Chair
David M. Cordani
Jane E. Henney, MD
Roman Martinez IV
John M. Partridge
William D. Zollars
AUDIT COMMITTEE
Roman Martinez IV
Chair
James E. Rogers
Donna F. Zarcone
CORPORATE GOVERNANCE
COMMITTEE
Jane E. Henney, MD
Chair
Eric J. Foss
William D. Zollars
FINANCE COMMITTEE
John M. Partridge
Chair
Roman Martinez IV
James E. Rogers
Eric C. Wiseman
Donna F. Zarcone
BOARD OF DIRECTORS
Isaiah Harris, Jr.
Independent Chairman of the Board,
Former President and Chief
Executive Officer
AT&T Advertising and Publishing –
East, a communications
services company
David M. Cordani
President and
Chief Executive Officer
Cigna Corporation
Eric J. Foss
Chairman, President and
Chief Executive Officer
ARAMARK Corporation,
a provider of food services, facilities
management and uniform services
Jane E. Henney, MD
Former Senior Vice President
Provost and Professor of Medicine,
University of Cincinnati College of
Medicine, an educational institution
Roman Martinez IV
Private Investor
John M. Partridge
Former President
Visa Inc., a consumer
credit company
James E. Rogers
Former Chairman, President and
Chief Executive Officer
Duke Energy Corporation,
an electric power company
Eric C. Wiseman
Executive Chairman
VF Corporation, an apparel and
footwear company
Donna F. Zarcone
President and Chief Executive Officer
The Economic Club of Chicago,
a civic and business leadership
organization
William D. Zollars
Former Chairman, President and
Chief Executive Officer
YRC Worldwide Inc.,
a transportation and
related services holding company

2525
PEOPLE RESOURCES COMMITTEE
William D. Zollars
Chair
Eric J. Foss
Jane E. Henney, MD
John M. Partridge
Eric C. Wiseman
EXECUTIVE OFFICERS
David M. Cordani
President and
Chief Executive Officer
Lisa R. Bacus
Executive Vice President
and Chief Marketing and
Customer Officer
Mark L. Boxer
Executive Vice President and
Chief Information Officer
Christopher Hocevar
President, Strategy,
Segments and Solutions
Nicole S. Jones
Executive Vice President
and General Counsel
Matthew G. Manders
President, Government and
Individual Programs and
Group Insurance
Thomas A. McCarthy
Executive Vice President
and Chief Financial Officer
Alan M. Muney, MD, MHA
Executive Vice President
Total Health & Network and
Chief Medical Officer
John M. Murabito
Executive Vice President
Human Resources and Services
Jason D. Sadler
President,
International Markets
Michael Triplett
President, U.S. Markets
OTHER OFFICERS
Neil Boyden Tanner
Vice President, Chief Counsel
and Corporate Secretary
Timothy D. Buckley
Vice President and Treasurer
Mary T. Hoeltzel
Vice President and
Chief Accounting Officer

26
2017 ANNUAL MEETING
Wednesday, April 26 at 8:00 am
Sheraton Hartford Hotel
Windsor Locks Ballroom
1 Bradley International Airport
Windsor Locks, CT 06096
Proxies and proxy statements
have been made available to
shareholders of record as of
February 27, 2017. On December
31, 2016, there were 6,029 common
shareholders of record.
FINANCIAL INFORMATION
Cigna’s Form 10-K is available online
at Cigna.com. For a copy of Cigna’s
quarterly earnings news releases,
visit our website at Cigna.com and
click on “News.”
OFFICES AND PRINCIPAL
SUBSIDIARIES
Cigna Corporation
900 Cottage Grove Road
Bloomfield, CT 06002
860.226.6000
and
Two Liberty Place
1601 Chestnut Street
Philadelphia, PA 19192-1550
215.761.1000
CONNECTICUT GENERAL
LIFE INSURANCE COMPANY
900 Cottage Grove Road
Bloomfield, CT 06002
860.226.6000
CIGNA HEALTH AND LIFE
INSURANCE COMPANY
900 Cottage Grove Road
Bloomfield, CT 06002
860.226.6000
LIFE INSURANCE COMPANY
OF NORTH AMERICA
Two Liberty Place
1601 Chestnut Street
Philadelphia, PA 19192-1550
215.761.1000
DIRECT STOCK PURCHASE PLAN
Shareholders can automatically
reinvest their annual dividends and
make optional cash purchases of
common shares. For information
on these services, please contact:
Computershare
PO Box 30170
College Station, TX 77842-3170
Toll-free: 800.760.8864.
Outside U.S., U.S. territories
and Canada: 201.680.6578
Website:
Computershare.com/investor.
SHAREHOLDER ACCOUNT
ACCESS
You can access your Cigna
shareholder account online through
the Computershare website:
Computershare.com/investor.
Or, call 800.760.8864.
DIRECT DEPOSIT OF DIVIDENDS
Direct deposit of dividends provides
a prompt, efficient way to have your
dividends electronically deposited
into your checking or savings
account. It avoids the possibility of
lost or delayed dividend checks.
The deposit is made electronically
on the payment date. For more
information and an enrollment
authorization form, contact
Computershare at 800.760.8864, or
outside the U.S., U.S. territories and
Canada at 201.680.6578. You can
access your account online through
the Computershare website:
Computershare.com/investor.
STOCK LISTING
Cigna’s common shares are listed
on the New York Stock Exchange.
The ticker symbol is CI.
TRANSFER AGENT
Computershare
PO Box 30170
College Station, TX 77842-3170
Toll-free: 800.760.8864.
Outside U.S., U.S. territories
and Canada: 201.680.6578.
Hearing impaired, TDD:
800.231.5469. Website:
Computershare.com/investor.
CIGNA ONLINE
To access online information about
Cigna, our products and services,
visit Cigna.com.
26 C O R P O R AT E A N D B OA R D O F D I R E C TO R S

29OCT201118203261
UNITED STATESSECURITIES AND EXCHANGE COMMISSION
Washington, D.C. 20549
FORM 10-K(Mark One)
� ANNUAL REPORT PURSUANT TO SECTION 13 OR 15(d) OF THE SECURITIES EXCHANGE ACT OF 1934For the fiscal year ended December 31, 2016
OR� TRANSITION REPORT PURSUANT TO SECTION 13 OR 15(d) OF THE SECURITIES EXCHANGE ACT OF 1934
For the transition period from to
Commission file number 1-8323
(Exact name of registrant as specified in its charter)
Delaware 06-1059331(State or other jurisdiction of incorporation or organization) (I.R.S. Employer Identification No.)
900 Cottage Grove Road, Bloomfield, Connecticut 06002(Address of principal executive offices) (Zip Code)
(860) 226-6000Registrant’s telephone number, including area code
(860) 226-6741Registrant’s facsimile number, including area code
SECURITIES REGISTERED PURSUANT TO SECTION 12(B) OF THE ACT:Title of each class Name of each exchange on which registered
Common Stock, Par Value $0.25 New York Stock Exchange, Inc.
SECURITIES REGISTERED PURSUANT TO SECTION 12(G) OF THE ACT:NONE
Indicate by check mark Yes No
�if the registrant is a well-known seasoned issuer, as defined in Rule 405 of the Securities Act. �
�if the registrant is not required to file reports pursuant to Section 13 or Section 15(d) of the Act. �whether the registrant (1) has filed all reports required to be filed by Section 13 or 15(d) of the SecuritiesExchange Act of 1934 during the preceding 12 months (or for such shorter period that the registrant was
�required to file such reports), and (2) has been subject to such filing requirements for the past 90 days. �whether the registrant has submitted electronically and posted on its corporate Web site, if any, everyInteractive Data File required to be submitted and posted pursuant to Rule 405 of Regulation S-T during thepreceding 12 months (or for such shorter period that the registrant was required to submit and post such
�files). �if disclosure of delinquent filers pursuant to Item 405 of Regulation S-K is not contained herein, and will notbe contained, to the best of registrant’s knowledge, in definitive proxy or information statements
�incorporated by reference in Part III of this Form 10-K or any amendment to this Form 10-K. �whether the registrant is a large accelerated filer, an accelerated filer, a non-accelerated filer, or a smaller reporting company. See definitionsof ‘‘large accelerated filer’’, ‘‘accelerated filer’’, and ‘‘smaller reporting company’’ in Rule 12b-2 of the Exchange Act.
Large accelerated filer � Accelerated filer � Non-accelerated filer � Smaller Reporting Company �
�whether the registrant is a shell company (as defined in Rule 12b-2 of the Exchange Act). �
The aggregate market value of the voting stock held by non-affiliates of the registrant as of June 30, 2016 was approximately $32.7 billion.
As of January 31, 2017, 257,052,404 shares of the registrant’s Common Stock were outstanding.
Part III of this Form 10-K incorporates by reference information from the registrant’s definitive proxy statement related to the 2017 annualmeeting of shareholders.
CIGNA CORPORATION
•
•
•
•
•
•
•

Table of ContentsFREQUENTLY REQUESTED 10-K INFORMATION
Page
Risk Factors ................................................................................................................................................. 21Executive Overview of Results .............................................................................................................. 36Health Care Industry Developments.................................................................................................... 39Liquidity & Capital Resources................................................................................................................ 43Critical Accounting Estimates................................................................................................................ 46Segment Reporting................................................................................................................................... 49Revenues by Product Type..................................................................................................................... 113
Page
CAUTIONARY STATEMENT
Item 1. Business. ............................................................................................................................. ................................................................................................................. ................................................................................................... ......................................................................................................... .................................................................................................................. ........................................................................................... .......................................................................................................................... ....................................................................................................................
Item 1A. Risk Factors..................................................................................................................................................................21Item 1B. Unresolved Staff Comments ...................................................................................................................................31Item 2. Properties......................................................................................................................................................................31Item 3. Legal Proceedings......................................................................................................................................................31Item 4. Mine Safety Disclosures............................................................................................................................................31EXECUTIVE OFFICERS OF THE REGISTRANT...................................................................................................................32
Item 5. Market for Registrant’s Common Equity, Related Stockholder Matters and Issuer Purchasesof Equity Securities...................................................................................................................................................33
Item 6. Selected Financial Data...........................................................................................................................................35Item 7. Management’s Discussion and Analysis of Financial Condition and Results of Operations.................. 36Item 7A. Quantitative and Qualitative Disclosures about Market Risk......................................................................57Item 8. Financial Statements and Supplementary Data............................................................................................. 58Item 9. Changes in and Disagreements with Accountants on Accounting and Financial Disclosure ......... 115Item 9A. Controls and Procedures ....................................................................................................................................... 115Item 9B. Other Information..................................................................................................................................................... 115
PART I
Overview 1
Global Health Care 3
Global Supplemental Benefits 11
Group Disability and Life 12
Other Operations 14
Investments and Investment Income 15
Regulation 15
Miscellaneous 20
PART II

Page
Item 10. Directors, Executive Officers and Corporate Governance ......................................................... 116....................................................................................................
....................................................................................................................................................
..............................................................Item 11. Executive Compensation.......................................................................................................... 116Item 12. Security Ownership of Certain Beneficial Owners and Management and Related
Stockholder Matters................................................................................................................. 117Item 13. Certain Relationships, Related Transactions and Director Independence .................................. 117Item 14. Principal Accountant Fees and Services ................................................................................... 117
Item 15. Exhibits and Financial Statement Schedules ............................................................................ 118Item 16. 10-K Summary ......................................................................................................................... 118SIGNATURES ................................................................................................................................................................................. 119INDEX TO FINANCIAL STATEMENT SCHEDULES......................................................................................................... FS-1INDEX TO EXHIBITS ...................................................................................................................................................................E-1
PART III
A. Directors of the Registrant 116
B. Executive Officers of the Registrant 116
C. Code of Ethics and Other Corporate Governance Disclosures 116
D. Section 16(a) Beneficial Ownership Reporting Compliance 116
PART IV

This Annual Report on Form 10-K contains forward-looking statements within the meaning of the Private Securities Litigation Reform Act of1995. Forward-looking statements are based on Cigna’s current expectations and projections about future trends, events and uncertainties.These statements are not historical facts. Forward-looking statements may include, among others, statements concerning our businessstrategy and strategic or operational initiatives including our ability to deliver personalized and innovative solutions for customers and clients;future growth and expansion; future financial or operating performance; economic, regulatory or competitive environments; our projectedcash position, future pension funding and financing or capital deployment plans; the proposed merger between Cigna and Anthem, Inc.(‘‘Anthem’’) and litigation related thereto; statements regarding the timing of resolution of the issues raised by the Centers for Medicare andMedicaid Services (‘‘CMS’’); and other statements regarding Cigna’s future beliefs, expectations, plans, intentions, financial condition orperformance. You may identify forward-looking statements by the use of words such as ‘‘believe,’’ ‘‘expect,’’ ‘‘plan,’’ ‘‘intend,’’ ‘‘anticipate,’’‘‘estimate,’’ ‘‘predict,’’ ‘‘potential,’’ ‘‘may,’’ ‘‘should,’’ ‘‘will’’ or other words or expressions of similar meaning, although not all forward-lookingstatements contain such terms.
Forward-looking statements are subject to risks and uncertainties, both known and unknown, that could cause actual results to differmaterially from those expressed or implied in forward-looking statements. Such risks and uncertainties include, but are not limited to: ourability to achieve our financial, strategic and operational plans or initiatives; our ability to predict and manage medical costs and priceeffectively and develop and maintain good relationships with physicians, hospitals and other health care providers; our ability to identifypotential strategic acquisitions or transactions and realize the expected benefits of such strategic transactions; the substantial level ofgovernment regulation over our business and the potential effects of new laws or regulations or changes in existing laws or regulations; theoutcome of litigation, regulatory audits including the CMS review and sanctions, investigations, actions and guaranty fund assessments;uncertainties surrounding participation in government-sponsored programs such as Medicare; the effectiveness and security of ourinformation technology and other business systems; unfavorable industry, economic or political conditions including foreign currencymovements; ongoing litigation with respect to the ruling of the District Court enjoining the merger, including the appeal of that ruling; potentialadverse reactions or changes to business or employee relationships, including those resulting from the announcement of the ruling enjoiningthe merger; uncertainty as to litigation with respect to the termination of the merger agreement, the reverse termination fee, declaratoryjudgments with respect to the foregoing and/or contract and non-contract damages for claims filed against Anthem; the risk that agovernment entity or court of competent jurisdiction, in any litigation, arbitration or other forum, finds in any binding or non-binding decisionthat Cigna has not complied, in full or in part, with its obligations under the merger agreement or that Cigna is liable for any breach, willful orotherwise, of the merger agreement; uncertainty as to whether and, if so, when Anthem will pay the reverse termination fee; uncertainty as tolitigation with respect to the suit initiated by Anthem against Cigna, including for contract and non-contract damages with respect to thetransactions contemplated in the merger agreement; competitive responses to the ruling; the inability to retain key personnel; the timing andlikelihood of completion of the proposed merger, including the timing, receipt and terms and conditions of any required governmental andregulatory approvals for the proposed merger that could reduce anticipated benefits or cause the parties to abandon the transaction; if themerger is consummated, the possibility that the expected synergies and value creation from the proposed merger will not be realized or willnot be realized within the expected time period; if the merger is consummated, the risk that the businesses of Cigna and Anthem will not beintegrated successfully; disruption from the proposed merger making it more difficult to maintain business and operational relationships; therisk that unexpected costs will be incurred; the possibility that the proposed merger does not close, including a failure to satisfy the closingconditions; the risk that financing for the proposed merger may not be available on favorable terms, as well as more specific risks anduncertainties discussed in Part I, Item 1A – Risk Factors and Part II, Item 7 – Management’s Discussion and Analysis of Financial Condition andResults of Operations of this Form 10-K and as described from time to time in our future reports filed with the Securities and ExchangeCommission (the ‘‘SEC’’) as well as the risks and uncertainties described in Anthem’s most recent report on Form 10-K and subsequent reportsfiled with the SEC.
You should not place undue reliance on forward-looking statements that speak only as of the date they are made, are not guarantees of futureperformance or results, and are subject to risks, uncertainties and assumptions that are difficult to predict or quantify. Cigna undertakes noobligation to update or revise any forward-looking statement, whether as a result of new information, future events or otherwise, except as maybe required by law.
CAUTIONARY NOTE REGARDING FORWARD-LOOKINGSTATEMENTS

PART IITEM 1. Business
Business
Overview
Cigna Corporation, together with its subsidiaries (either individually or collectively referred to as ‘‘Cigna,’’ the ‘‘Company,’’ ‘‘we,’’ ‘‘our’’ or ‘‘us’’)is a global health services organization dedicated to a mission of helping individuals improve their health, well-being and sense of security. Toexecute on our mission, Cigna’s strategy is to ‘‘Go Deep’’, ‘‘Go Global’’ and ‘‘Go Individual’’ with a differentiated set of medical, dental, disability,life and accident insurance and related products and services offered by our subsidiaries.
In an increasingly retail-oriented marketplace, we focus on delivering affordable and personalized products and services to customersthrough employer-based, government sponsored and individual coverage arrangements. We increasingly collaborate with health careproviders to continue the transition from volume-based fee for service arrangements toward a more value-based system designed to increasequality of care, lower costs and improve health outcomes. We operate a customer-centric organization enabled by keen insights regardingcustomer needs, localized decision-making and talented professionals committed to bringing our ‘‘Together All the Way’’ brand promise tolife.
In particular, over the past several years, to achieve the goals of better health, affordability, localization and an improved experience for thecustomer, we have continued expanding our participation in collaborative care and other delivery arrangements with health care professionalsacross the care delivery spectrum, including large and small physician groups, specialist groups and hospitals. More recently, we havedeveloped innovative tools and flexible provider arrangements that provide a truly personalized customer experience. These arrangementsand tools are discussed in more detail in the ‘‘Global Health Care’’ section of this Annual Report on Form 10-K (‘‘Form 10-K’’) beginning onpage 3.
We present the financial results of our businesses in the following three reportable segments:
Global Health Care aggregates the Commercial and Government operating segments.
The Commercial operating segment encompasses both the U.S. commercial and certain international health care businesses servingemployers and their employees, other groups, and individuals. In this segment, we refer to employer or other groups as the ‘‘client’’ and theindividual as the ‘‘customer.’’ Products and services include medical, dental, behavioral health, vision, and prescription drug benefit plans,health advocacy programs and other products and services to insured and self-insured customers.
CIGNA CORPORATION - 2016 Form 10-K 1
ITEM 1.
•
PART I
15FEB201710011018Value-based solutions with aligned incentives
Affordability PersonalizationStrategicimperatives
Our Mission
Our Strategy
How we will winCustomer Centricity
To improve the health, well-being and sense of security of the people we serve
Go Deep within existing geographies and products, Go Global to offer solutions inadjacent and new markets and Go Individual to serve the holistic needs of an individual
Enablers
Insights Brand
Localization Talent
Focus
Execution

PART IITEM 1. Business
The Government operating segment offers Medicare Advantage and Medicare Part D plans to seniors and Medicaid plans.
Global Supplemental Benefits offers supplemental health, life and accident insurance products in selected international markets and in theU.S.
Group Disability and Life provides group long-term and short-term disability, group life, accident and specialty insurance products and relatedservices.
Financial Results for the year ended and as of December 31, 2016 (in billions)
Consolidated basis: Consolidated basis:Total revenues $ 39.7 Shareholders’ net income $ 1.9Operating revenues (1) $ 39.5 Adjusted income from operations (1) $ 2.1Total assets $ 59.4 Total shareholders’ equity $ 13.7
Reportable segments results (2): Reportable segments results (2):Operating revenues (1) $ 39.0 Adjusted income from operations (1) $ 2.3
(1) See page 36 for the definition of these metrics.
(2) Global Health Care, Global Supplemental Benefits and Group Disability and Life segments
We present the remainder of our segment results in Other Operations, consisting of the corporate-owned life insurance business (‘‘COLI’’),run-off reinsurance and settlement annuity businesses and deferred gains associated with the sales of the individual life insurance and annuityand retirement benefits businesses.
Our revenues are derived principally from premiums on insured products, fees from self-insured products and services, mail-order pharmacysales and investment income.
On July 23, 2015, we entered into a definitive agreement to engage in a series of transactions to merge Cigna with Anthem, subject to certainterms, conditions and customary operating covenants, with Anthem continuing as the surviving company. At special shareholders’ meetings inDecember 2015, Cigna shareholders approved the merger with Anthem and Anthem shareholders voted to approve the issuance of shares ofAnthem common stock according to the merger agreement. Upon closing, our shareholders would receive $103.40 in cash and 0.5152 of ashare of Anthem common stock for each common share of the Company.
Consummation of the merger is subject to certain customary conditions, including the receipt of certain necessary governmental andregulatory approvals, and the absence of a legal restraint prohibiting the consummation of the merger. On July 21, 2016, the U.S. Department ofJustice (‘‘DOJ’’) and certain state attorneys general filed a civil antitrust lawsuit in the U.S. District Court for the District of Columbia (the‘‘District Court’’) seeking to block the merger and, on January 4, 2017, the parties concluded the District Court trial. On February 8, 2017, theDistrict Court issued an order enjoining the proposed merger. Anthem appealed this ruling to the U.S. Court of Appeals for the District ofColumbia Circuit (the ‘‘Appeals Court’’). Cigna appealed following the Chancery Court decision described below, and oral arguments for theappeal are scheduled for March 24, 2017.
On February 14, 2017, Cigna delivered a notice to Anthem terminating the merger agreement and filed suit in the Delaware Court of Chancery(the ‘‘Chancery Court’’) seeking, among other things, declaratory judgment that Cigna’s termination of the merger agreement is lawful and thatAnthem does not have the right to extend the merger agreement termination date. Later that day, Anthem filed a lawsuit in the Chancery Courtagainst us seeking, among other things, a temporary restraining order to enjoin Cigna from terminating the merger agreement, specificperformance and damages, and, on February 15, 2017, the Chancery Court issued an order temporarily enjoining the Company fromterminating the merger agreement. This order will be subject to further review at a preliminary injunction hearing.
See Notes 3 and 21 to the Consolidated Financial Statements in this Form 10-K for additional information about the proposed merger. SeeItem 1A. - Risk Factors in this Form 10-K for risks to our business due to the proposed merger.
2 CIGNA CORPORATION - 2016 Form 10-K
•
Proposed Merger with Anthem, Inc. (‘‘Anthem’’)
15FEB201710510350
5%
82%
13%
Global Health Care
Global Supplemental Benefits
Group Disability and Life
Adjusted Income from Operations by Reportable Segment %
Global Supplemental Benefits
Group Disability and Life
11%
80%
9%
Global Health Care
Operating Revenue by Reportable Segment %

PART IITEM 1. Business
The Patient Protection and Affordable Care Act and the Health Care and Education Reconciliation Act (collectively referred to throughout thisForm 10-K as the ‘‘Health Care Reform Act,’’ ‘‘ACA’’ or ‘‘PPACA’’) continues to have a significant impact on our business operations. With theoutcome of the U.S. elections in 2016, and the advent of the Trump Administration in January 2017, the future of the Health Care Reform Act isuncertain. The effects of the Health Care Reform Act are discussed throughout this Form 10-K where appropriate, including in the Global HealthCare business description, Regulation, Risk Factors, Management’s Discussion and Analysis of Financial Condition and Results of Operations(‘‘MD&A’’), and the Notes to the Consolidated Financial Statements.
The financial information included in this Form 10-K for the fiscal year ended December 31, 2016 is in conformity with accounting principlesgenerally accepted in the United States of America (‘‘GAAP’’) unless otherwise indicated. Industry rankings and percentages set forth hereinare for the year ended December 31, 2016 unless otherwise indicated. In addition, statements set forth in this document concerning our rank orposition in an industry or particular line of business have been developed internally based on publicly available information unless otherwisenoted.
Cigna Corporation was incorporated in Delaware in 1981. Our annual, quarterly and current reports, proxy statements and other filings, and anyamendments to these filings, are made available free of charge on our website (http://www.cigna.com, under the ‘‘Investors – QuarterlyReports and SEC Filings’’ captions) as soon as reasonably practicable after we electronically file these materials with, or furnish them to, theSecurities and Exchange Commission (the ‘‘SEC’’). We use our website as a channel of distribution for material company information.Important information, including news releases, analyst presentations and financial information regarding Cigna is routinely posted on andaccessible at www.cigna.com. See ‘‘Code of Ethics and Other Corporate Governance Disclosures’’ in Part III, Item 10 beginning on page 115 ofthis Form 10-K for additional available information.
Global Health Care
We seek to differentiate ourselves in this business by providing innovative personalized and affordable health care solutions to our clients andcustomers. As a leader in the drive to transition the health care delivery system from volume-based reimbursements to a value orientation, ourstrategy is to accelerate our engagement with employers and individuals in order to: 1) increase our customers’ involvement in their health careand 2) develop deep insights into customer needs. Our differentiated approach also targets selected geographies and market segments and,within those local markets, stronger relationships with health care providers that promote quality and affordability of care for our customersand clients.
Innovation is core to the way we do business. We seek new and innovative solutions through technology and physician engagement to driveefficiencies, as well as bring differentiated value to our customers. Product development in the following areas reflects our innovativeapproach: our industry-leading CDHP (consumer-directed health plan) offerings; the recently introduced Cigna One Guide� program thatcombines a state-of-the-art digital experience with a human concierge service; and the Cigna SureFit� network that allows individual familymembers to choose their personal care networks, consistent with their health needs and provider preferences.
CIGNA CORPORATION - 2016 Form 10-K 3
The Health Care Reform Act
Other Information
Broad and deep portfolio of solutions across Commercial and Government operating segments
Committed to highest quality health outcomes and customer experiences
Differentiated physician engagement models emphasizing value over volume of services
Innovative solutions that deliver value for our customers, clients and partners
Technology powering actionable insights and affordable, personalized solutions
Talented and caring people embracing change and putting customers at the center of all we do
Medical Pharmacy Medicare Advantage Administrative ServicesStop Loss Behavioral Medicare Part D Only (ASO)Dental Health Advocacy and Medicaid Guaranteed CostVision Coaching Experience Rated
Collaborative Accountable National Insurance brokers andCare Organizations Middle Market consultantsIndependent Practice Select Sales representativesAssociations Individual Cigna private exchangeCareAllies Government 3rd party private exchangesDelivery System Alliances International Public exchangesCustomer Engagement
•
•
•
•
•
•
• • • •• • •• • • •• •
• • ••
• • •• •
• • •• • ••
How We Win
Products and Services Funding Types
Physician Engagement Customer Segments Distribution Channels

PART IITEM 1. Business
Our Commercial operating segment encompasses both our U.S. commercial and certain international health care businesses servingemployers and their employees, including globally-mobile individuals, and other groups (e.g., governmental and non-governmentalorganizations, unions and associations). In addition, our U.S. commercial health care business also serves individuals through our productofferings both on and off the public health insurance exchanges.
The Commercial operating segment, either directly or through its partners, offers some or all of its products in all 50 states, the District ofColumbia, the U.S. Virgin Islands, Canada, Europe, the Middle East, Asia, Africa and Australia. We offer a variety of medical plans including:
Managed Care Plans including HMO, Network, Network Open Access and Open Access Plus. We offer health care services through insuredand self-insured indemnity managed care benefit plans and Health Maintenance Organizations (‘‘HMOs’’) that use meaningful cost-sharingincentives to encourage the use of ‘‘in-network’’ versus ‘‘out-of-network’’ health care providers and provide the option to select a primarycare physician. The national provider network for Managed Care Plans is somewhat smaller than the national network used with the preferredprovider (‘‘PPO’’) plan product line. If a particular plan covers non-emergency services received from a non-participating health care provider,the customer’s cost-sharing obligation is usually greater for the out-of-network care.
PPO Plans. Our PPO product line features a network with broader provider access than the Managed Care Plans. The preferred providerproduct line may be at a higher cost than our Managed Care Plans.
Choice Fund� Suite of Consumer-Driven Products. Our medical plans are often integrated with the Cigna Choice Fund suite of products:Health Reimbursement Accounts (‘‘HRA’’), Health Savings Accounts (‘‘HSA’’) and Flexible Spending Accounts (‘‘FSA’’). These Choice Fundproducts are designed to encourage customers to play an active role in understanding and managing their health and associated expenses.Customers can use these tax-advantaged accounts to finance eligible health care expenses and other approved services. In most cases, theseproducts are combined with a high deductible medical plan. Over three million customers have chosen Choice Fund product solutions.
Cigna Connect is an individual plan offered in markets within eight states. The product is comprised of a network of health care providers inlocal areas who have been selected with cost and quality in mind. Customers who participate in the Connect network will receive care atCigna’s lower negotiated rates to help keep out-of-pocket costs down. Out-of-network coverage is not available except for urgent andemergent care.
Cigna Focus is an individual plan offered in one market. The product is comprised of a network of health care providers in the local area wheremembers have direct access to providers, where no referrals or PCP selection is required. Out-of-network coverage is not available except forurgent and emergent care.
Approximately 90% of our commercial medical customers are enrolled in medical plans with either Administrative Services Only orExperience-Rated funding arrangements that allow the corporate client to directly benefit from lower medical costs.
4 CIGNA CORPORATION - 2016 Form 10-K
Principal Products and ServicesCommercial Medical Health Plans – U.S. and International
•
•
•
•
•

PART IITEM 1. Business
The funding arrangements available for our commercial medical and dental health plans are as follows:
Funding Arrangements and Descriptions: Commercial
Plan sponsors self-fund all claims, but may purchase stoploss insurance to limit exposure.
We collect fees from plan sponsors for providing access toour participating provider network and for other servicesand programs including: claims administration; behavioralhealth; disease management; utilization management; costcontainment; dental; and pharmacy benefit management.
In some cases, we provide performance guarantees thatprovide potential fee refunds if certain service standards,clinical outcomes or financial metrics are not met.
Premium charged during a policy period (‘‘initial premium’’) may be adjusted following the policy period for actual claim and, insome cases, administrative cost experience of the policyholder:
When claims and expenses are less than the initial premium charged (an ‘‘experience surplus’’), the policyholder may becredited for a portion of this premium.
However, if claims and expenses exceed the initial premium (an ‘‘experience deficit’’), we bear these costs. In certain cases,experience deficits may be recovered through experience surpluses in a future year if the policyholder renews.
We establish the cost to the policyholder at the beginning of a policy period and generally cannot subsequently adjust premiumsto reflect actual claim experience until the next annual renewal.
Employers and other groups with guaranteed cost policies are generally smaller than those with experience-rated group policies.Accordingly, our claim and expense assumptions may be based in whole or in part on prior experience of the policyholder or on apool of similar policyholders.
HMO and individual plans (medical and dental) are offered on a guaranteed cost basis only. Individual and ‘‘small employer’’(employers with 50 or fewer employees) plans are required to be community-rated under federal law.
In most states, individual and group insurance premium rates must be approved by the applicable state regulatory agency (typicallydepartment of insurance) and state or federal laws may restrict or limit the use of rating methods. Premium rates for groups and individuals aresubject to state review for reasonableness. In addition, the Health Care Reform Act subjects individual and small group policy rate increasesabove an identified threshold to review by the United States Department of Health and Human Services (‘‘HHS’’) and requires payment ofpremium refunds on individual and group medical insurance products if minimum medical loss ratio (‘‘MLR’’) requirements are not met. In ourindividual business, premiums may also be adjusted as a result of the government risk mitigation programs. The MLR represents thepercentage of premiums used to pay medical claims and expenses for activities that improve the quality of care. See the ‘‘Regulation’’ sectionof this Form 10-K for additional information on the commercial MLR requirements and the risk mitigation programs of the Health CareReform Act.
Medicare AdvantageWe offer Medicare Advantage plans in 17 states and the District of Columbia through our Cigna-HealthSpring brand. Under such a plan,Medicare-eligible beneficiaries may receive health care benefits, including prescription drugs, through a managed care health plan such as ourcoordinated care plans. A significant portion of our Medicare Advantage customers receive medical care from our innovative plan models thatfocus on developing highly engaged physician networks, aligning payment incentives to improved health outcomes, and using timely andtransparent data sharing. We are focused on continuing to expand these models in the future.
We receive revenue from the Centers for Medicare and Medicaid Services (‘‘CMS’’) for each plan customer based on customer demographicdata and actual customer health risk factors compared to the broader Medicare population. We also may earn additional revenue from CMSrelated to quality performance measures (known as ‘‘Star Ratings’’). The Medicare Stars payment equals 5% per member risk-adjusted revenueadded to the CMS payment for each contract that achieves four stars or higher. See the ‘‘Executive Overview’’ section of our MD&A beginningon page 36 of this Form 10-K for additional discussion of our Star ratings. Additional premiums may be received from customers, representingthe difference between CMS subsidy payments and the revenue determined as part of our annual Medicare Advantage bid submissions. TheHealth Care Reform Act requires Medicare Advantage and Medicare Part D plans to meet a minimum MLR of 85%. If the MLR for a CMS contract
CIGNA CORPORATION - 2016 Form 10-K 5
Administrative Services Only•
•
•
Insured – Experience Rated (‘‘Shared Returns’’)•
–
–
Insured – Guaranteed Cost•
•
•
Government Health Plans
15FEB201710044439
6%
82%
12%
ASO Shared Returns Guaranteed Cost

PART IITEM 1. Business
is less than 85%, we are required to pay a rebate to CMS and could be required to make additional payments if the MLR continues to be less than85% for successive years.
Medicare Part DOur Medicare Part D prescription drug program provides a number of plan options, as well as service and information support, to Medicare andMedicaid eligible customers. Our plans are available in all 50 states and the District of Columbia and offer the savings of Medicare combinedwith the flexibility to provide enhanced benefits and a drug list tailored to individuals’ specific needs. Eligible beneficiaries benefit from broadnetwork access and value-added services intended to help keep them well and save them money.
MedicaidWe offer Medicaid coverage to low income individuals in selected markets in Texas and Illinois. Our Medicaid customers benefit from many ofthe coordinated care aspects of our Medicare Advantage programs.
We receive revenue from the states of Texas and Illinois for our Medicaid only customers. For customers eligible for both Medicare andMedicaid (‘‘dual eligibles’’) we receive revenue from both the state and CMS. All revenue is based on customer demographic data and actualcustomer health risk factors. Similar to Medicare Advantage, there are minimum MLR requirements in Illinois (85% for the dual product and 88%for the Medicaid only product). However, Texas utilizes an experience rebate in an effort to provide better value to consumers and increasetransparency. The Texas experience rebate takes into account operating expenses and requires a rebate of dollars to the state as differentprofitability thresholds are met.
Our specialty products and services described below are designed to improve the quality of care, lower the cost and help customers achievebetter health outcomes. Many of these products can be sold on a standalone basis, but we believe they are most effective when integrated witha Cigna-administered health plan. Our specialty products are focused in the areas of medical, behavioral, pharmacy management, dental andvision.
Medical SpecialtyStop Loss. We offer stop loss insurance coverage for self-insured plans that provides reimbursement for claims in excess of a predeterminedamount for individuals (‘‘specific’’), the entire group (‘‘aggregate’’), or both.
Cost-Containment Service. We administer cost-containment programs on behalf of our clients and customers for health care services andsupplies that are covered under health benefit plans. These programs may involve vendors who perform activities designed to control healthcosts by reducing out-of-network utilization and costs, including educating customers regarding the availability of lower cost, in-networkservices, negotiating discounts, reviewing provider bills, and recovering overpayments from other payers or health care providers. We chargefees for providing or arranging for these services.
Consumer Health Engagement. We offer a wide array of medical management, disease management, and wellness services to employersand other plan sponsors to help individuals improve their health, well-being and sense of security. These services are offered to customerscovered under plans that we administer, as well as plans insured or administered by competing insurers or third-party administrators. OurMedical Management programs include case management, specialty case management and utilization management including a 24-hournurse information line. Our Health Advocacy programs and services include early intervention in the treatment of chronic conditions (such asAsthma, Diabetes, etc.). We also offer a combination of online tools and education programs to help customers manage their health and anarray of health and wellness coaching to address lifestyle management issues (such as stress, weight, and tobacco cessation) and otherconditions (such as Hypertension, Hyperlipidemia, Pre-Diabetes, etc.). We also administer incentives to motivate customers to engage in andimprove their health.
Pharmacy ManagementWe offer prescription drug plans to our commercial and government customers both in conjunction with our medical products and on a stand-alone basis. With a network of over 68,000 pharmacies, Cigna Pharmacy Management is a comprehensive pharmacy benefits manager(‘‘PBM’’) offering clinical programs and specialty pharmacy solutions. We also offer high quality, efficient, and cost-effective mail order,telephone and on-line pharmaceutical fulfillment services through our home delivery operation.
Our medical and pharmacy coverage can meet the needs of customers with complex medical conditions requiring specialty pharmaceuticals.These types of medications are covered under both pharmacy and medical benefits and can be expensive, often requiring associated lab workand administration by a health care professional. Therefore, coordination is critical in improving affordability and outcomes. Clients with Cigna-administered medical and pharmacy coverage may benefit from continuity of care, integrated reporting, and meaningful unit cost discounts onspecialty drugs.
Behavioral HealthWe arrange for behavioral health care services for customers through our network of approximately 108,700 participating behavioral healthcare professionals and 13,900 facilities and clinics. We offer behavioral health care case management services, employee assistance programs(‘‘EAP’’), and work/life programs to employers, government entities and other groups sponsoring health benefit plans. We focus on integratingour programs and services with medical, pharmacy and disability programs to facilitate customized, holistic care.
6 CIGNA CORPORATION - 2016 Form 10-K
Specialty Products and Services
•
•
•

PART IITEM 1. Business
DentalWe offer a variety of insured and self-insured dental care products including dental health maintenance organization plans (‘‘Dental HMO’’) in36 states, dental preferred provider organization (‘‘Dental PPO’’) plans in 49 states and the District of Columbia, exclusive dental providerorganization plans, traditional dental indemnity plans and a dental discount program. Employers and other groups can purchase our productsas stand-alone products or integrated with medical products. Additionally, individual customers can purchase Dental PPO plans in conjunctionwith individual medical policies.
Cigna has partnered with a healthcare technology company, to launch an online consumer engagement tool for Dental PPO customers in 2016.This enhancement allows Cigna Dental PPO customers to schedule appointments online, compare out-of-pocket costs across multipledentists, and access information that evaluates the dentist’s professional history, affordability, and service quality.
As of December 31, 2016, our dental customers totaled 15 million worldwide and approximately 65% are enrolled in plans with fundingarrangements that allow the corporate client to directly benefit from lower dental costs. Our U.S. customers access care from one of the largestDental PPO networks and Dental HMO networks, with approximately 142,700 Dental PPO and 19,800 Dental HMO health care professionals.
VisionCigna Vision offers flexible, cost-effective PPO coverage that includes a range of both in and out-of-network benefits for routine vision servicesoffered in conjunction with our medical and dental product offerings. Our national vision care network, consisting of approximately 84,000health care providers in over 26,200 locations, includes private practice ophthalmologist and optometrist offices, as well as retail eye carecenters.
For U.S.-based customers, we operate 17 service centers that together in 2016 processed approximately 163 million medical claims and handled32.5 million calls providing our customers service 24 hours a day, 365 days a year.
In our international health care business, we have a service model dedicated to the unique needs of our 1.5 million customers around the world.We service them from nine globally deployed service centers that are also available 24 hours a day, 365 days a year.
Cigna Technology supports the Go Deep, Go Global, Go Individual strategy by focusing on strong foundational services, executing on analigned business portfolio and targeting innovation and digital enhancements in key differentiating areas. Paramount to our global informationtechnology strategy is supporting the imperatives of affordability, personalization and localization. Our goal is a continued focus on targetedtechnology investments to enable our strategic business objectives. This is accomplished by delivering innovative technology that enablesmore efficient operations, improves process integrity, builds stronger relationships with our key stakeholders; optimizes our economies ofscale; and maximizes delivery of flexible payment arrangements, innovative products and services and intelligent analytics to supportevidence-based medicine. Through continued execution of these capabilities, we are able to better and more rapidly deliver market-differentiating and innovative solutions.
Our approach to innovation is based on three major pillars: 1) organic development that creates new capabilities through internal research anddevelopment; 2) venture partnerships/early-stage investments where we are working with other external stakeholders; and 3) client-centricprototyping that develops solutions directly with clients to address specific needs. This approach to innovation has fueled our ability to rapidlyinnovate and bring to market solutions that differentiate us from competitors. This has resulted in an increased number of solutions thatimprove affordability, increase patient access and optimize the consumer experience. Examples include capabilities such as Cigna VirtualHealth, first launched in the United Kingdom as the first totally digital virtual care team to Cigna One Guide� that simplifies and streamlines theentire customer experience in a highly personalized manner. Cigna has launched a growing portfolio that leverages emerging technologiessuch as artificial intelligence based predictive analytics, augmented reality and virtual reality, social experiences and gamification. Innovation iscore to the way we do business and we continuously seek opportunities to drive efficiencies and create a superior customer experiencethrough technology.
Cigna has transformed substantial investments in analytics talent, data infrastructure, and machine learning capabilities over the past severalyears into a closed loop, self-learning insights system that guides our decision making and executing on our strategy. Our Insights That Matteranalytics process helps our business leaders identify the questions that matter most to our customers and partners. We focus our data scienceexperts on answering those questions with innovative methodologies and transform our insights into targeted business actions.
Cigna is using advanced analytic capabilities throughout all facets of the business to:
Identify and quantify the financial and clinical cost of discrete health opportunities and insights into how to best engage individual customers(e.g., digitally, phone, physician based). We convert these insights into a Health Matters Score that is used to connect each customer to theright clinical services and drive better clinical, financial, and quality outcomes.
Enable customized service experiences. In our pharmacy business we are proactively offering our customers value added pharmacy andmedical services during inbound customer calls, realizing the value of an integrated medical and pharmacy offering. To maximize impact, weapply our proprietary Customer Segmentation models to tailor customer communications to make interactions more meaningful.
CIGNA CORPORATION - 2016 Form 10-K 7
Service and QualityCustomer Service
Technology
Data Analytics
•
•

PART IITEM 1. Business
Build a deep understanding of risk adjusted total cost and quality performance metrics at the individual physician level and aggregate marketlevel to develop relative benchmarks. This data is being used to fuel our drive to fee for value physician reimbursements and flexible providernetworks.
Leverage advanced analytic models and tools to better identify prospects that best align with Cigna’s mission and value proposition for ourclient engagement team.
Going forward, we view insights as a strategic imperative and will continue to heavily invest in expanding and strengthening our capabilities tomeet and exceed our customer and partner expectations.
Our commitment to promoting quality health care to the people we serve is reflected in a variety of activities.
Health Improvement through Engaging Providers and CustomersCigna improves health outcomes and reduces health care costs by engaging our customers in their health, connecting them with value-oriented providers, and improving how care is delivered and reimbursed. We are focused on executing our Connected Care strategy thatengages both providers and customers, optimizing their interactions to drive better health, affordability, and experience. Cigna is committedto developing innovative solutions that span the health care delivery system and can be applied to different types of providers. Currently wehave numerous collaborative arrangements with our participating health care providers and are actively developing new arrangements tosupport our Connected Care strategy. The key principles that guide our innovative solutions include:
Improving access to care at the local market level,
Collaborating with and supporting providers in their evolution to value-based care,
Leveraging actionable patient information, enhancing the patient experience,
Improving affordability and
Shifting reimbursement mechanisms to those that reward quality medical outcomes.
We continue to increase our engagement with physicians and hospitals by rapidly developing the types of arrangements discussed below.Over two million medical customers are currently serviced by more than 95,000 health care providers in these types of arrangements.
Cigna Collaborative Care.
Collaborative Accountable Care (‘‘CAC’’) – currently we have approximately 170 collaborative care arrangements with large primarycare groups built on the patient-centered medical home and accountable care organization (‘‘ACO’’) models. Our CAC arrangementsspan 30 states and reach 1.9 million customers and we are committed to increasing the number of CACs over the next several years.Our goal is to reach approximately 190 of these programs in 2017.
Hospital Quality Incentive Program – compensation paid to approximately 390 hospitals is tied to quality metrics and we expect toreach approximately 450 hospitals by the end of 2017.
Specialty Care Collaboration Program – we continue to develop arrangements with specialists including programs such as NationalObstetrics/Gynecology and our program to reimburse providers for individual ‘‘episodes of care’’ (services performed to treat aspecific medical condition).
Independent Practice Associations are innovative physician engagement models in our Cigna-HealthSpring business that allow thephysician groups to share financial outcomes with us. The Cigna-HealthSpring clinical model also includes outreach to new and at-riskpatients to ensure they are accessing their primary care physician.
CareAllies. On June 9, 2016, we announced the formation of CareAllies, the new U.S. based population health company focused on helpingphysicians manage the health of their patients and improve their health outcomes. CareAllies will partner with physicians, provider groupsand health systems to develop customized solutions that help them meet their goals across all patients and all payers.
Delivery System Alliances. Cigna is collaborating with select health care delivery systems to develop compelling and unique strategicrelationships focused on addressing the local market’s unique health care needs. This includes jointly developed products designed toimprove the experience of Cigna customers by offering integrated health care and providing access to quality, value-based care in localcommunities.
Customer Engagement Products – Cigna One Guide�. Cigna is also delivering a personalized experience to help our customers navigate thecomplex health care system and make important health care choices. Starting January 1, 2017, 1.2 million Cigna commercial health plancustomers will receive Cigna One Guide� access to guided consultations via phone, mobile app and ‘‘Click-to-Chat’’ for choosing theirbenefits, building a personal health team of doctors, clinicians and coaches and reducing their health expenses through reward programs.
In the international healthcare business we use the Net Promoter Score (NPS) approach to continually gather insights from customers andhealthcare professionals around the world and to guide how we proactively enhance product and service offerings.
Participating Provider NetworkWe provide our customers with an extensive network of participating health care professionals, hospitals, and other facilities, pharmacies andproviders of health care services and supplies. In most instances, we contract with them directly; however, in some instances, we contract withthird parties for access to their provider networks and care management services. In addition, we have entered into strategic alliances with
8 CIGNA CORPORATION - 2016 Form 10-K
•
•
Quality Health Care
•
•
•
•
•
•
•
•
•
•
•
•
•

PART IITEM 1. Business
several regional managed care organizations (e.g., Tufts Health Plan, HealthPartners, Inc., Health Alliance Plan, and MVP Health Plan) to gainaccess to their provider networks and discounts.
We credential physicians, hospitals and other health care professionals in our participating provider networks using quality criteria that meetor exceed the standards of external accreditation or state regulatory agencies, or both. Typically, most health care professionals arere-credentialed every three years.
The Cigna Care Network�, a benefit design option available in 74 markets across the U.S., is a subset of participating specialist physiciansdesignated based on specific clinical quality and cost-efficiency criteria. Customers in Cigna Care Network� plans pay reduced co-payments orco-insurance when they receive care from a specialist designated as a Cigna Care Network� physician. Participating specialists are evaluatedregularly for the Cigna Care Network� designation.
LocalPlus� is a locally-tailored network of select health care providers and facilities designed to provide cost-effective and quality care. It linksmultiple local networks across geographic markets to provide consistency for both employers and the customers. LocalPlus is available in 18markets as of the end of 2016 and will be available in 21 markets by the end of 2017.
Cigna SureFit� is a local network built around particular health care delivery systems with a focus on the dynamics of local market care delivery.It is designed to deliver maximum value in a particular market. Cigna SureFit� is available in three U.S. Commercial markets in 2017, and will beavailable in 11 markets in 2018.
Medical Care and Onsite ServicesCigna Medical Group is a multi-specialty medical group practice that delivers primary care and certain specialty care services through 20medical facilities and 156 clinicians in Phoenix, Arizona. These health care centers have received the highest accreditation (level 3) from theNational Committee for Quality Assurance (‘‘NCQA’’).
LivingWell Health Centers by HealthSpring�. Medicare Advantage customers may receive care from one of our four free-standing clinicsand eight ‘‘embedded’’ clinics that incorporate the principles and resources of stand-alone clinics while allowing the customer access to theirprimary care physician.
Cigna Onsite Health provides employer-based onsite or nearby health centers and health and wellness coaches with nearly 52 health centersand 142 health coaches. Care delivery services include acute, episodic care, primary care, health and wellness coaching programs andbiometric screenings. Virtual Health care services are also available to help extend access to care for both coaching and treatment services.
External ValidationWe continue to demonstrate our commitment to quality and have a broad scope of quality programs validated through nationally recognizedexternal accreditation organizations. We maintained Health Plan accreditation from the NCQA in 37 of our markets. Additional NCQArecognitions include Full Accreditation for Managed Behavioral Healthcare Organization for Cigna Behavioral Health, Accreditation withPerformance Reporting for Wellness & Health Promotion, Accreditation for our wellness programs and Physician & Hospital QualityCertification for our provider transparency program. We have Full Accreditation for Health Utilization Management, Case Management,Pharmacy Benefit Management and Specialty Pharmacy from URAC, an independent, nonprofit health care accrediting organizationdedicated to promoting health care quality through accreditation, certification and commendation.
We participate in the NCQA’s Health Plan Employer Data and Information Set (‘‘HEDIS�’’) Quality Compass Report, whose Effectiveness ofCare measures are a standard set of metrics to evaluate the effectiveness of managed care clinical programs.
We offer health care and related products and services in the following customer segments or markets:
% of MedicalCustomers
National Multi-state employers with 5,000 or more U.S.-based, full-time employees. We offer primarily ASO funding solutions in 23%this market segment.
Middle Market Employers generally with 250 to 4,999 U.S.-based, full-time employees. This segment also includes single-site employers 53%with more than 5,000 employees and Taft-Hartley plans and other groups. We offer ASO, experience-rated andguaranteed cost insured funding solutions in this market segment.
Select Employers generally with 51-249 eligible employees. We offer ASO (often with stop-loss insurance coverage) and 9%guaranteed cost insured funding solutions in this market segment.
Individual Individuals in thirteen states for 2016: Arizona, California, Colorado, Connecticut, Florida, Georgia, North Carolina, 1%Maryland, Missouri, New Jersey, South Carolina, Tennessee and Texas. In 2016, we offered coverage on seven publichealth insurance exchanges (Arizona, Colorado, Georgia, Maryland, Missouri, Tennessee and Texas). In 2017, we offerplans in fifteen states. We have plans on public health insurance exchanges in seven states (Colorado, Illinois, Maryland,Missouri, North Carolina, Tennessee, and Virginia) and off-exchange in eight states (Arizona, California, Connecticut,Florida, Georgia, New Jersey, South Carolina, and Texas). Consistent with the regulations for Individual PPACA compliantplans, we offer plans only on a guaranteed cost basis in this market segment.
Government Individuals who are post-65 retirees, as well as employer group sponsored pre- and post-65 retirees. We offer Medicare 4%Advantage, Prescription Drug programs, and Medicaid products in this market segment including dual-eligible memberswho receive both Medicare and Medicaid benefits.
International Local and multinational companies and inter-governmental organizations and their local and globally-mobile employees 10%and dependents working or travelling in more than 190 countries and jurisdictions. We offer guaranteed cost,experience-rated insured and ASO funding solutions in this market segment.
CIGNA CORPORATION - 2016 Form 10-K 9
•
•
•
Markets and Distribution

PART IITEM 1. Business
Cigna Guided Solutions� is Cigna’s benefit administration and private exchange solution that targets clients who value fully integratedsolutions and focus on engaging employees in their benefit offering. It leverages Cigna’s ability to provide a fully integrated solution with ourbroad spectrum of products, benefit plans, services, and full suite of funding options focused on improving total cost, health, and productivity.Through Cigna Guided Solutions�, employers enjoy simplified administration and the convenience of single source purchasing whileemployees receive more choice via an easy-to-use shopping experience and year round engagement. Together with integrated robustdecision-support tools, employees are able to make personalized decisions to select the right benefit offering and get the most value fromtheir plans.
In addition, Cigna participates on many third party private exchanges. We actively evaluate private exchange participation opportunities asthey emerge in the market, and target our participation to those models that best align with our mission and value proposition.
We employ sales representatives to distribute our products and services through insurance brokers and insurance consultants or directly toemployers, unions and other groups or individuals. We also employ representatives to sell access to our national participating providernetwork, utilization review services, behavioral health care and pharmacy management services, and employee assistance services directly toinsurance companies, HMOs and third party administrators. As of December 31, 2016, our field sales force consisted of over 1,300 salesrepresentatives in 124 field locations. In our Government business, Medicare Advantage enrollment is generally a decision made individually bythe customer, and accordingly, sales agents and representatives focus their efforts on in-person contacts with potential enrollees, as well astelephonic and group selling venues.
CompetitionOur business is subject to intense competition and continuing industry consolidation that has created an even more competitive businessenvironment. In certain geographic locations, some health care companies may have significant market share positions, but no one competitordominates the health care market nationally. We expect a continuing trend of consolidation in the overall health care industry (includinghospitals, pharmaceutical companies, and providers of medical technology and devices) given the current economic and politicalenvironment. We also expect continued vertical integration with the lines blurring between clinicians, hospitals and traditional insurers.
Competition in the health care market exists both for employers and other groups sponsoring plans and for employees in those instanceswhere the employer offers a choice of products from more than one health care company. Most group policies are subject to annual review bythe plan sponsor, who may seek competitive quotations prior to renewal. In 2017, product offerings are decreasing in certain individual marketsdue to volatility in the industry as some carriers have exited markets. With the results of the 2016 U.S. elections, it is likely that changes willoccur in the future to the Health Care Reform Act. Given that the relatively immature individual market has not yet reached profitability formost carriers, we expect some uncertainty and competitive volatility to continue.
The primary competitive factors affecting our business are quality and cost-effectiveness of service and provider networks; effectiveness ofmedical care management; products that meet the needs of employers and their employees; total cost management; technology; andeffectiveness of marketing and sales. Financial strength of the insurer, as indicated by ratings issued by nationally recognized rating agencies, isalso a competitive factor. We believe that our health advocacy capabilities, holistic approach to consumer engagement, breadth of productofferings, clinical care and medical management capabilities and array of product funding options are competitive advantages in meeting thediverse needs of our customer base. We also believe that our focus on helping to improve the health, well-being and sense of security of thecustomers we serve will allow us to differentiate ourselves from our competitors.
Our primary competitors in our U.S.-based health care businesses include:
Other national insurance and health services companies that provide group health and life insurance products, including Aetna, Anthem,Humana, Kaiser Permanente and UnitedHealth Group;
Not for profit managed care organizations;
Other regional stand-alone managed care and specialty companies;
Managed care organizations affiliated with major insurance companies and hospitals; and
National managed pharmacy, behavioral health and utilization review services companies.
Our primary competitors in the international health care business include U.S.-based insurers such as Aetna, UnitedHealth Group and MetLife;global competitors such as BUPA and Allianz; and local insurers in a range of countries.
In addition to our traditional competitors, new competitors are emerging. Some of these newer competitors, such as hospitals and companiesthat offer web-based tools for employers and employees, are focused on delivering employee benefits and services through internet-enabledtechnology that allows consumers to take a more active role in the management of their health. This can be accomplished through financialincentives, access to enhanced quality medical data and other information sharing. The effective use of our health advocacy, customer insightand physician engagement capabilities, along with decision support tools (some of which are web-based) and enabling technology are criticalto success in the health care industry, and we believe our capabilities in these areas will be competitive differentiators.
Industry DevelopmentsThe health insurance marketplace will continue to be shaped by the Health Care Reform Act over the near term; however, its future remainsuncertain given the outcome of the 2016 U.S. elections. Although we anticipate changes in the regulation of the health insurance markets overthe next several years as Congress and the Trump administration consider repeal and replacement of the Health Care Reform Act, the nature ofthose changes remains largely unknown at this time. See the ‘‘Regulation’’ and ‘‘Risk Factors’’ sections of the Form 10-K for additionaldiscussion about these developments.
10 CIGNA CORPORATION - 2016 Form 10-K
•
•
•
•
•
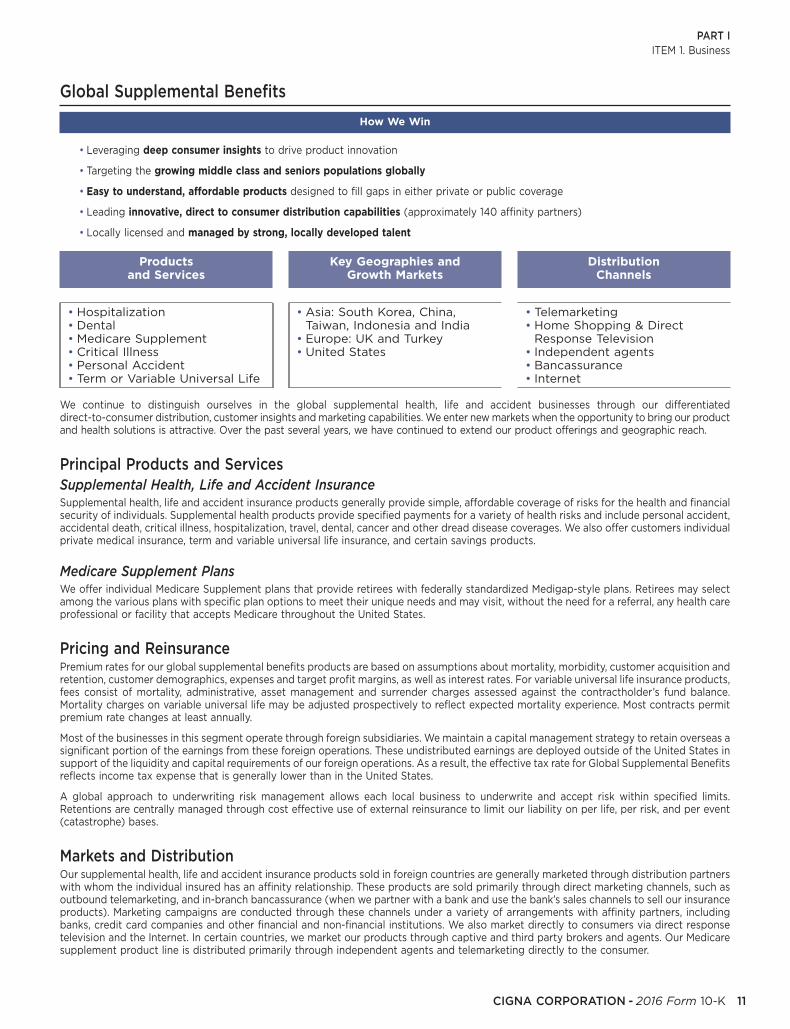
PART IITEM 1. Business
Global Supplemental Benefits
We continue to distinguish ourselves in the global supplemental health, life and accident businesses through our differentiateddirect-to-consumer distribution, customer insights and marketing capabilities. We enter new markets when the opportunity to bring our productand health solutions is attractive. Over the past several years, we have continued to extend our product offerings and geographic reach.
Supplemental health, life and accident insurance products generally provide simple, affordable coverage of risks for the health and financialsecurity of individuals. Supplemental health products provide specified payments for a variety of health risks and include personal accident,accidental death, critical illness, hospitalization, travel, dental, cancer and other dread disease coverages. We also offer customers individualprivate medical insurance, term and variable universal life insurance, and certain savings products.
We offer individual Medicare Supplement plans that provide retirees with federally standardized Medigap-style plans. Retirees may selectamong the various plans with specific plan options to meet their unique needs and may visit, without the need for a referral, any health careprofessional or facility that accepts Medicare throughout the United States.
Premium rates for our global supplemental benefits products are based on assumptions about mortality, morbidity, customer acquisition andretention, customer demographics, expenses and target profit margins, as well as interest rates. For variable universal life insurance products,fees consist of mortality, administrative, asset management and surrender charges assessed against the contractholder’s fund balance.Mortality charges on variable universal life may be adjusted prospectively to reflect expected mortality experience. Most contracts permitpremium rate changes at least annually.
Most of the businesses in this segment operate through foreign subsidiaries. We maintain a capital management strategy to retain overseas asignificant portion of the earnings from these foreign operations. These undistributed earnings are deployed outside of the United States insupport of the liquidity and capital requirements of our foreign operations. As a result, the effective tax rate for Global Supplemental Benefitsreflects income tax expense that is generally lower than in the United States.
A global approach to underwriting risk management allows each local business to underwrite and accept risk within specified limits.Retentions are centrally managed through cost effective use of external reinsurance to limit our liability on per life, per risk, and per event(catastrophe) bases.
Our supplemental health, life and accident insurance products sold in foreign countries are generally marketed through distribution partnerswith whom the individual insured has an affinity relationship. These products are sold primarily through direct marketing channels, such asoutbound telemarketing, and in-branch bancassurance (when we partner with a bank and use the bank’s sales channels to sell our insuranceproducts). Marketing campaigns are conducted through these channels under a variety of arrangements with affinity partners, includingbanks, credit card companies and other financial and non-financial institutions. We also market directly to consumers via direct responsetelevision and the Internet. In certain countries, we market our products through captive and third party brokers and agents. Our Medicaresupplement product line is distributed primarily through independent agents and telemarketing directly to the consumer.
CIGNA CORPORATION - 2016 Form 10-K 11
Principal Products and ServicesSupplemental Health, Life and Accident Insurance
Medicare Supplement Plans
Pricing and Reinsurance
Markets and Distribution
Leveraging deep consumer insights to drive product innovation
Targeting the growing middle class and seniors populations globally
Easy to understand, affordable products designed to fill gaps in either private or public coverage
Leading innovative, direct to consumer distribution capabilities (approximately 140 affinity partners)
Locally licensed and managed by strong, locally developed talent
Hospitalization Asia: South Korea, China, TelemarketingDental Taiwan, Indonesia and India Home Shopping & DirectMedicare Supplement Europe: UK and Turkey Response TelevisionCritical Illness United States Independent agentsPersonal Accident BancassuranceTerm or Variable Universal Life Internet
•
•
•
•
•
• • •• •• •• • •• •• •
How We Win
Products Key Geographies and Distributionand Services Growth Markets Channels

PART IITEM 1. Business
South Korea represents our single largest geographic market for Global Supplemental Benefits. For information on this concentration of riskfor the Global Supplemental Benefits segment’s business in South Korea, see ‘‘Other Items Affecting Results of Global Supplemental Benefits’’in the Global Supplemental Benefits section of the MD&A beginning on page 51 of this Form 10-K.
For our supplemental health, life and accident insurance products sold in foreign markets we are increasingly exposed to geopolitical, currencyand other risks inherent in foreign operations. Also, given that we bill and collect a significant portion of premiums through credit cards, asubstantial contraction in consumer credit could impact our ability to retain existing policies and sell new policies. A decline in customerretention would result in both a reduction of revenue and an acceleration of the amortization of acquisition-related costs. Changes in regulationfor permitted distribution channels also may impact our business or results.
We expect that the competitive environment for global supplemental benefits will continue to intensify as U.S., Europe and other regionally-based insurance and financial services providers more aggressively pursue expansion opportunities across geographies, especially in Asia. Webelieve competitive factors will include branding, product and distribution innovation and differentiation, efficient management of marketingprocesses and costs, commission levels paid to distribution partners, the quality of claims, local network coverage, customer services andtalent acquisition and retention. Additionally, in most overseas markets, perception of financial strength also will likely continue to be animportant competitive factor.
Our competitors are primarily locally-based insurance companies, including insurance subsidiaries of banks primarily in Asia and Europe andmulti-national companies. Insurance company competitors in this segment primarily focus on traditional product distribution through captiveagents, with direct marketing being secondary channels. We estimate that we have less than 3% market share of the total insurance premiumsin any given market in which we operate.
In the Medicare supplement business, the principal competitive factors are underwriting and pricing, relative operating efficiency, brokerrelations, and the quality of claims and customer service. Our primary competitors in this business include U.S.-based health insurancecompanies.
Pressure on social health care systems, a rapidly aging population and increased wealth and education in developing insurance markets areleading to higher demand for products providing health insurance and financial security. In the supplemental health, life and accident business,direct marketing channels continue to grow and attract new competitors with industry consolidation among financial institutions and otheraffinity partners.
Data privacy regulation has tightened in all markets in the wake of data privacy news scandals, impacting affinity partner and customerattitudes toward direct marketing of insurance and other financial services.
Group Disability and Life
Our Group Disability and Life business markets its products and services in all 50 states, the District of Columbia, Puerto Rico, the U.S. VirginIslands and Canada.
12 CIGNA CORPORATION - 2016 Form 10-K
Competition
Industry Developments
Disability absence management model that reduces overall costs to employers
Integration of disability products with medical and specialty offerings, promoting health and wellness and optimizing employeeproductivity
Complementary portfolio of group disability, life and accident offerings
Disciplined underwriting, pricing and investment strategies supporting profitable long-term growth
Short-term disability Group universal life Insurance brokers and consultantsLong-term disability Personal and voluntary accident Sales representativesLeave administration Business travel accidentBasic-term life Critical illness, Accidental injury and Hospital careVoluntary term life
NationalMiddle MarketSelect
•
•
•
•
• • •• • •• •• ••
•••
How We Win
Products and Services Distribution Channels
Customer Segments

PART IITEM 1. Business
Group DisabilityLong-term and short-term group disability insurance products generally provide a fixed level of income to replace a portion of wages lostbecause of disability. Group disability coverage is typically employer-paid or a combination of employer and employee-paid, but also mayinclude coverage paid for entirely by employees. As part of our group disability insurance products, we also provide assistance to employees inreturning to work and assistance to their employers in managing the cost of employee disability. We are an industry leader in helpingemployees return to work quickly, resulting in higher productivity and lower cost for employers and a better quality of life for their employees.
We seek to integrate the administration of our disability insurance products with other disability benefit programs, behavioral programs,medical programs, social security advocacy, and administration of federal and state Family and Medical Leave Act (‘‘FMLA’’) laws and otherleave of absence programs. We believe this integration provides our customers with increased efficiency and effectiveness in disability claimsmanagement, enhances productivity and reduces overall costs to employers. This integration also provides early insight into employees at riskfor future disability claims. Coordinating the administration of these disability programs with medical programs offered by our health carebusiness provides enhanced opportunities to influence outcomes, reduce the cost of both medical and disability events and improve the returnto work rate. The benefits of this integrated approach also include:
using information from the health care and disability databases to help identify, treat and manage disabilities before they become longer induration or chronic and more costly; and
proactively reaching out to assist employees suffering from a mental health or chronic condition, either as a primary condition or as a result ofanother condition.
Our disability products and services are offered on a fully insured, experience-rated and ASO basis, although most are fully insured. Asmeasured by 2016 premiums and fees, disability constituted 50% of this segment’s business. Approximately 15,300 insured disability policiescovering approximately 8.5 million lives were in force as of December 31, 2016.
Group Life InsuranceGroup life insurance products offered include term life and universal life. Group term life insurance may be employer-paid basic life insurance,employee-paid supplemental life insurance or a combination thereof. Group universal life insurance is an employee-paid, voluntary lifeinsurance product in which the owner may accumulate a cash value. The cash value earns interest at rates declared from time to time, subject toa minimum guaranteed contracted rate, and may be borrowed, withdrawn, or, within certain limits, used to fund future life insurance coverage.
As measured by 2016 premiums and fees, group life insurance constituted approximately 44% of this segment’s business. Approximately10,800 group life insurance policies covering over 7 million lives were in force as of December 31, 2016.
Other Products and ServicesWe also offer personal accident insurance coverage, consisting primarily of accidental death and dismemberment and travel accidentinsurance to employers. Group accident insurance may be employer-paid or employee-paid. In addition, we offer specialty insurance servicesthat consist primarily of disability and life, accident, and hospital indemnity products to professional or trade associations and financialinstitutions.
We also provide a number of voluntary products and services that are typically paid by the employee and offered at the employer’s worksite.Our plans provide employers with administrative solutions designed to provide employers with a complete and simple way to manage theirbenefits program. In recent years, we have brought to market three additional voluntary offerings – accidental injury insurance, critical illnesscoverage and hospital care. These products provide additional dollar payouts to employees for unexpected accidents or more serious illnesses.
Premiums charged for disability and term life insurance products are usually established in advance of the policy period and are generallyguaranteed for one to three years and selectively guaranteed for up to five years; policies are generally subject to termination by thepolicyholder or by the insurance company annually. Premium rates reflect assumptions about future claims, expenses, credit risk, investmentreturns and profit margins. These assumptions may be based in whole or in part on prior experience of the account or on a pool of accounts,depending on the group size and the statistical credibility of the experience that varies by product.
Premiums for group universal life insurance products consist of mortality and administrative charges assessed against the policyholder’s fundbalance. Interest credited and mortality charges for group universal life may be adjusted prospectively to reflect expected interest andmortality experience. Mortality charges are subject to maximum guaranteed rates and interest credited on cash values is subject to minimumguaranteed rates as stated in the policy.
The premiums for these products are typically collected within the coverage year and then invested in assets that match the duration of theexpected benefit payments that occur over many future years (primarily for disability benefits). With significant investments in longer-duration securities, net investment income is a critical element of profitability for this segment.
The effectiveness of return to work programs and morbidity levels will impact the profitability of disability insurance products. Our previousclaim experience and industry data indicate a correlation between disability claim incidence levels and economic conditions, with submittedclaims rising under adverse economic conditions, although this impact is not clear. For life insurance products, the degree to which futureexperience deviates from mortality and expense assumptions also affects profitability.
To reduce our exposure to large individual and catastrophic losses under group life, disability and accidental death policies, as well as ournewer accidental injury and critical illness policies, we purchase reinsurance from a diverse group of unaffiliated reinsurers. Our comprehensive
CIGNA CORPORATION - 2016 Form 10-K 13
Products and Services
•
•
Pricing and Reinsurance

PART IITEM 1. Business
reinsurance program consists of excess of loss treaties and catastrophe coverage designed to mitigate earnings volatility and provide surplusprotection.
We market our group disability and life insurance products and services to employers, employees, professional and other associations andgroups in the National, Middle Market and Select segments. In marketing these products, we primarily sell through insurance brokers andconsultants and employ a direct sales force consisting of approximately 260 sales professionals in 27 office locations as of December 31, 2016.
The principal competitive factors that affect the Group Disability and Life segment are underwriting and pricing, the quality and effectivenessof claims management, relative operating efficiency, investment and risk management, distribution methodologies and producer relations, thebreadth and variety of products and services offered, and the quality of customer service. For certain products with longer-term liabilities, suchas group long-term disability insurance, the financial strength of the insurer, as indicated by ratings issued by nationally recognized ratingagencies, is also a competitive factor.
The principal competitors of our group disability, life and accident businesses are other large and regional insurance companies that marketand distribute these or similar types of products and include Aetna, Unum, The Hartford, Prudential and MetLife. As of December 31, 2016, weare one of the top five providers of group disability, life and accident insurance in the United States, based on premiums.
Employers are expressing a growing interest in employee wellness, absence management and productivity and likewise are recognizing astrong link between employee health, productivity and their profitability. As this interest grows, we believe our healthy lifestyle andreturn-to-work programs and integrated family medical leave, disability and health care programs position us to deliver integrated solutions foremployers and employees. We also believe that our strong disability management portfolio and fully integrated programs provide tools foremployers and employees to improve health status. This focus on managing the employee’s total absence enables us to increase the numberand effectiveness of interventions and minimize disabling events.
The group insurance market remains highly competitive as the rising cost of providing medical coverage to employees has forced companies tore-evaluate their overall employee benefit spending, resulting in lower volumes of group disability and life insurance business and morecompetitive pricing. Demographic shifts have further driven demand for products and services that are sufficiently flexible to meet theevolving needs of employers and employees who want innovative, cost-effective solutions to their insurance needs. Employers continue toshift towards greater employee participatory coverage and voluntary purchases. With our broad suite of voluntary offerings and continuedfocus on developing additional voluntary products and service capabilities, we believe we are well positioned to meet the needs of bothemployers and employees as the market shifts to become more retail-focused.
Over the past few years, there has been heightened review by state regulators of the claims handling practices within the disability and lifeinsurance industry. This has resulted in an increase in coordinated, multi-state examinations that target specific market practices in addition toregularly recurring examinations of an insurer’s overall operations conducted by an individual state’s regulators. We have recently been subjectto such an examination. See Note 21 to the Consolidated Financial Statements for additional information.
The depressed level of interest rates in the United States over the last several years has constrained earnings growth in this segment due tolower yields on our fixed-income investments, and higher benefit expenses resulting from the discounting of future claim payments at lowerinterest rates.
Other OperationsOther Operations includes the following four businesses:
The principal products of the COLI business are permanent insurance contracts sold to corporations to provide coverage on the lives of certainemployees for the purpose of financing employer-paid future benefit obligations. Permanent life insurance provides coverage that, whenadequately funded, does not expire after a term of years. The contracts are primarily non-participating universal life policies. Fees for universallife insurance products consist primarily of mortality and administrative charges assessed against the policyholder’s fund balance. Interestcredited and mortality charges for universal life and mortality charges on variable universal life may be adjusted prospectively to reflectexpected interest and mortality experience. To reduce our exposure to large individual and catastrophe losses, we purchase reinsurance fromunaffiliated reinsurers.
Our settlement annuity business is a closed, run-off block of single premium annuity contracts. These contracts are primarily liabilitysettlements with approximately 20% of the liabilities associated with payments that are guaranteed and not contingent on survivorship. Forcontracts that involve non-guaranteed payments, such payments are contingent on the survival of one or more parties involved in thesettlement.
14 CIGNA CORPORATION - 2016 Form 10-K
Markets and Distribution
Competition
Industry Developments
Corporate-owned Life Insurance
Run-off Settlement Annuity Business

PART IITEM 1. Business
Our reinsurance operations are an inactive business in run-off mode.
In February 2013, we effectively exited the guaranteed minimum death benefit (‘‘GMDB’’) and guaranteed minimum income benefit (‘‘GMIB’’)business by reinsuring 100% of our future exposures, net of retrocessional arrangements in place at that time, up to a specified limit. Foradditional information regarding this reinsurance transaction and the arrangements that secure our reinsurance recoverables, see Note 9 to theConsolidated Financial Statements.
This business includes deferred gains recognized from the 1998 sale of the individual life insurance and annuity business and the 2004 sale ofthe retirement benefits business. For more information regarding the arrangements that secure our reinsurance recoverables for the retirementbenefits business, see Note 9 to the Consolidated Financial Statements.
Investments and Investment Income
Our investment operations provide investment management and related services for our corporate invested assets and the insurance-relatedinvested assets in our General Account (‘‘General Account Invested Assets’’). We acquire or originate, directly or through intermediaries, abroad range of investments including private placement and public securities, commercial mortgage loans, real estate, mezzanine, privateequity partnerships and short-term investments. Invested assets also include policy loans that are fully collateralized by insurance policy cashvalues. Invested assets are managed primarily by our subsidiaries and, to a lesser extent, external managers with whom our subsidiariescontract. Net investment income is included as a component of adjusted income from operations for each of our reporting segments andCorporate. Realized investment gains (losses) are reported by segment but excluded from adjusted income from operations. For additionalinformation about invested assets, see the ‘‘Investment Assets’’ section of the MD&A beginning on page 53 and Notes 10 to 12 of ourConsolidated Financial Statements.
We manage our investment portfolios to reflect the underlying characteristics of related insurance and contractholder liabilities and capitalrequirements, as well as regulatory and tax considerations pertaining to those liabilities and state investment laws. Insurance andcontractholder liabilities range from short duration health care products to longer term obligations associated with disability and life insuranceproducts and the run-off settlement annuity business. Assets supporting these liabilities are managed in segregated investment portfolios tofacilitate matching of asset durations and cash flows to those of corresponding liabilities. Investment strategy and results are affected by theamount and timing of cash available for investment, competition for investments, economic conditions, interest rates and asset allocationdecisions. We routinely monitor and evaluate the status of our investments, obtaining and analyzing relevant investment-specific informationand assessing current economic conditions, trends in capital markets and other factors such as industry sector, geographic and property-specific information.
Our subsidiaries or external advisors manage Separate Account invested assets on behalf of contractholders; including the Cigna Pension Plan,variable universal life products sold through our corporate-owned life insurance business, and other disability and life products. These assetsare legally segregated from our other businesses and are not included in General Account Invested Assets. Income, gains and losses generallyaccrue directly to the contractholders.
RegulationThe laws and regulations governing our business continue to increase each year and are subject to frequent change. We are regulated by state,federal and international regulatory agencies that generally have discretion to issue regulations and interpret and enforce laws and rules. Theseregulations can vary significantly from jurisdiction to jurisdiction, and the interpretation of existing laws and rules also may change periodically.Domestic and international governments continue to enact and consider various legislative and regulatory proposals that could materiallyimpact the health care system.
Our insurance and HMO subsidiaries must be licensed by the jurisdictions in which they conduct business. These subsidiaries are subject tonumerous state, federal and international regulations related to their business operations, including, but not limited to:
the form and content of customer contracts including benefit mandates (including special requirements for small groups);
premium rates and medical loss ratios;
the content of agreements with participating providers of covered services;
producer appointment and compensation;
claims processing, payment and appeals;
underwriting practices;
reinsurance arrangements;
solvency and financial reporting;
unfair trade and claim practices;
market conduct;
protecting the privacy and confidentiality of the information received from customers;
CIGNA CORPORATION - 2016 Form 10-K 15
Run-off Reinsurance
Individual Life Insurance and Annuity and Retirement Benefits Businesses
General Accounts
Separate Accounts
•
•
•
•
•
•
•
•
•
•
•

PART IITEM 1. Business
risk sharing arrangements with providers;
reimbursement or payment levels for Medicare services;
advertising; and
the operation of consumer-directed plans (including health savings accounts, health reimbursement accounts, flexible spending accountsand debit cards).
The business of administering and insuring employee benefit programs in the United States, particularly health care programs, is heavilyregulated by state and federal laws and administrative agencies, such as state departments of insurance, and federal agencies including HHS,CMS, the Internal Revenue Service (‘‘IRS’’) and the Departments of Labor, Treasury and Justice, as well as the courts. Health savings accounts,health reimbursement accounts and flexible spending accounts also are regulated by the Department of the Treasury and the IRS.
Our operations, accounts and other books and records are subject to examination at regular intervals by regulatory agencies, including stateinsurance and health and welfare departments, state boards of pharmacy, CMS and comparable international regulators to assess compliancewith applicable laws and regulations. In addition, our current and past business practices are subject to review by, and from time to time wereceive subpoenas and other requests of information from various state insurance and health care regulatory authorities, attorneys general, theOffice of Inspector General (‘‘OIG’’), the Department of Labor and other state, federal and international authorities, including inquiries by, andtestimony before committees and subcommittees of the U.S. Congress regarding certain of our business practices. These examinations,reviews, subpoenas and requests may result in changes to or clarifications of our business practices, as well as fines, penalties or othersanctions.
Our international subsidiaries are subject to regulations in international jurisdictions where foreign insurers may be faced with more onerousregulations than their domestic competitors. In addition, the expansion of our operations into foreign countries increases our exposure tocertain U.S. laws, such as the Foreign Corrupt Practices Act of 1977 (‘‘FCPA’’). See page 19 for further discussion of international regulations.
The Health Care Reform ActThe Health Care Reform Act mandated broad changes affecting insured and self-insured health benefit plans that impact our current businessmodel, including our relationship with current and future customers, producers and health care providers, products, services, processes andtechnology. As a result of the 2016 U.S. elections, the future of the Health Care Reform Act is uncertain. Certain provisions of the Health CareReform Act are likely to be retained, while others are likely to be repealed or replaced.
Key Provisions of the Health Care Reform ActVarious fees, including the health insurance industry tax and the reinsurance fee, were assessed beginning in 2014. The health insuranceindustry assessment, totaling $11.3 billion for the industry in 2016 and increasing to $14.3 billion by 2018, is not tax deductible. In December2015, the federal appropriations legislation imposed a one-year moratorium on the industry tax for 2017, with reinstatement expected in 2018.Our share of this industry tax is determined based on our proportion of premiums for both our commercial and government risk businesses tothe industry total. The reinsurance fee is a temporary (2014-2016) fixed dollar per customer levy on all insurers, HMOs and self-insured grouphealth plans and is tax deductible.
The health insurance exchange enrollment process began on October 1, 2013 with coverage first effective in 2014. Each state has a state-based,a state and federal partnership, or a federally-facilitated health insurance exchange for individuals and small employer groups to purchaseinsurance coverage. Because individuals seeking to purchase health insurance coverage either on or off the exchanges are guaranteed to beissued a policy, the Health Care Reform Act provided programs designed to reduce the risk for participating health insurance companiesincluding: (1) a temporary (2014-2016) reinsurance program; and (2) a premium stabilization program comprised of two components: atemporary program (2014-2016) limiting insurer gains and losses (‘‘risk corridor’’), and a permanent program that adjusts premiums based onthe relative health status of the customer base (‘‘risk adjustment’’). See Note 2 to the Consolidated Financial Statements and the Introductionto the MD&A contained in this Form 10-K for additional information on these programs.
MLR requirements, as prescribed by HHS, require payment of premium rebates to group and individual policyholders if certain annual MLRs arenot met in our commercial business. In December 2014, the federal government enacted legislation that provides permanent relief from certainHealth Care Reform Act requirements for expatriate health coverage (including the MLR requirements).
Other provisions of the Health Care Reform Act in effect include reduced Medicare Advantage premium rates, the requirement to coverpreventive services with no enrollee cost-sharing, banning the use of lifetime and annual limits on the dollar amount of essential healthbenefits, increasing restrictions on rescinding coverage and extending coverage of dependents to the age of 26. The employer mandate, thephase in of which was complete in 2016, requires employers with 50 or more full-time employees to offer affordable health insurance thatprovides minimum value (each as defined under the Health Care Reform Act) to full-time employees and dependent children up to age 26 or besubject to penalties based on employer size. The Health Care Reform Act also changed certain tax laws that effectively limit tax deductions forcertain employee compensation paid by health insurers.
Our Medicare Advantage and Medicare Part D prescription drug plan businesses also have been impacted by the Health Care Reform Act in avariety of additional ways, including mandated minimum reductions to risk scores, transition of Medicare Advantage ‘‘benchmark’’ rates toMedicare fee-for-service parity, reduced enrollment periods and limitations on disenrollment, providing ‘‘quality bonuses’’ for MedicareAdvantage plans with a rating of four or five stars from CMS and mandated consumer discounts on brand name and generic prescription drugsfor Medicare Part D plan participants in the coverage gap. The Health Care Reform Act requires Medicare Advantage and Medicare Part D plansto meet a minimum MLR of 85%. Under the finalized regulations promulgated by HHS, if the MLR for a CMS contract is less than 85%, we arerequired to pay a penalty to CMS and could be required to make additional payments if the MLR continues to be less than 85% for successiveyears. Through the Health Care Reform Act and other federal legislation, funding for Medicare Advantage plans has been and may continue tobe altered.
We have implemented the provisions of the Health Care Reform Act currently in effect. Management continues to be actively engaged withregulators and policymakers with respect to rule-making. However, ongoing legislative and regulatory challenges to the Health Care Reform
16 CIGNA CORPORATION - 2016 Form 10-K
•
•
•
•

PART IITEM 1. Business
Act, pending litigation challenging aspects of the law, the change in administration and the Congress following the 2016 U.S. elections willcontinue to create uncertainty about the ultimate impact of the Health Care Reform Act. Additionally, the executive order signed by PresidentTrump in January 2017, which instructs agencies to waive, defer, grant exemptions from, or delay the implementation of any provision orrequirement of the Health Care Reform Act that would impose a fiscal burden on any state or a cost, fee, tax, penalty, or regulatory burden onindividuals, providers, insurers, recipients of healthcare services, purchasers of health insurers or makers of medical devices, products ormedications, will create additional uncertainty.
For the financial effects of certain Health Care Reform Act provisions, see the ‘‘Executive Overview’’ section of our MD&A beginning on page 36of this Form 10-K. In addition, accounting policies around the government’s risk mitigation programs are further disclosed in Note 2 to theConsolidated Financial Statements.
Financial Reporting, Internal Control and Corporate GovernanceRegulators closely monitor the financial condition of licensed insurance companies and HMOs. States regulate the form and content ofstatutory financial statements, the type and concentration of permitted investments, and corporate governance over financial reporting. Ourinsurance and HMO subsidiaries are required to file periodic financial reports and schedules with regulators in most of the jurisdictions in whichthey do business as well as annual financial statements audited by independent registered public accounting firms. Certain insurance and HMOsubsidiaries are required to file an annual report of internal control over financial reporting with most jurisdictions in which they do business.Insurance and HMO subsidiaries’ operations and accounts are subject to examination by such agencies. Many states have expanded regulationsrelating to corporate governance and internal control activities of insurance and HMO subsidiaries as a result of model regulations adopted bythe National Association of Insurance Commissioners (‘‘NAIC’’) with elements similar to corporate governance and risk oversight disclosurerequirements under federal securities laws.
Guaranty Associations, Indemnity Funds, Risk Pools and Administrative FundsMost states and certain non-U.S. jurisdictions require insurance companies to support guaranty associations or indemnity funds that areestablished to pay claims on behalf of insolvent insurance companies. In the United States, these associations levy assessments on memberinsurers licensed in a particular state to pay such claims. Certain states require HMOs to participate in guaranty funds, special risk pools andadministrative funds. For additional information about guaranty fund and other assessments, see Note 21 to our Consolidated FinancialStatements.
Certain states continue to require health insurers and HMOs to participate in assigned risk plans, joint underwriting authorities, pools or otherresidual market mechanisms to cover risks not acceptable under normal underwriting standards, although some states have eliminated theserequirements as a result of the Health Care Reform Act.
Solvency and Capital RequirementsMany states have adopted some form of the NAIC model solvency-related laws and risk-based capital rules (‘‘RBC rules’’) for life and healthinsurance companies. The RBC rules recommend a minimum level of capital depending on the types and quality of investments held, the typesof business written and the types of liabilities incurred. If the ratio of the insurer’s adjusted surplus to its risk-based capital falls below statutoryrequired minimums, the insurer could be subject to regulatory actions ranging from increased scrutiny to conservatorship.
In addition, various non-U.S. jurisdictions prescribe minimum surplus requirements that are based upon solvency, liquidity and reservecoverage measures. Our HMOs and life and health insurance subsidiaries, as well as non-U.S. insurance subsidiaries, are compliant withapplicable RBC and non-U.S. surplus rules.
The Risk Management and Own Risk and Solvency Assessment Model Act (‘‘ORSA’’), adopted by the NAIC, provides requirements andprinciples for maintaining a group solvency assessment and a risk management framework and reflects a broader approach to U.S. insuranceregulation. ORSA includes a requirement to file an annual ORSA Summary Report in the lead state of domicile. To date, an overwhelmingmajority of the states have adopted the same or similar versions of ORSA.
Holding Company LawsOur domestic insurance companies and certain of our HMOs are subject to state laws regulating subsidiaries of insurance holding companies.Under such laws, certain dividends, distributions and other transactions between an insurance company or an HMO subsidiary and its affiliatesmay require notification to, or approval by, one or more state insurance commissioners. In addition, the holding company acts of states in whichour subsidiaries are domiciled restrict the ability of any person to obtain control of an insurance company or HMO subsidiary without priorregulatory approval.
Marketing, Advertising and ProductsIn most states, our insurance companies and HMO subsidiaries are required to certify compliance with applicable advertising regulations on anannual basis. Our insurance companies and HMO subsidiaries are also required by most states to file and secure regulatory approval ofproducts prior to the marketing, advertising, and sale of such products.
Licensing RequirementsCertain of our subsidiaries are pharmacies that dispense prescription drugs to participants of benefit plans administered or insured by ourHMO and insurance company subsidiaries. These pharmacy-subsidiaries are subject to state licensing requirements and regulation as well asU.S. Drug Enforcement Agency registration requirements, U.S. Food and Drug Administration requirements and third party accreditation
CIGNA CORPORATION - 2016 Form 10-K 17
Regulation of Insurance Companies

PART IITEM 1. Business
requirements. Other laws and regulations affecting our pharmacy-subsidiaries include federal and state laws concerning labeling, packaging,advertising, handling and adulteration of prescription drugs and dispensing of controlled substances.
Certain subsidiaries contract to provide claim administration, utilization management and other related services for the administration ofself-insured benefit plans. These subsidiaries may be subject to state third-party administration and other licensing requirements andregulation, as well as third party accreditation requirements.
Our international subsidiaries are often required to be licensed when entering new markets or starting new operations in certain jurisdictions.The licensure requirements for these subsidiaries vary by country and are subject to change.
Employee Retirement Income Security Act and the Public Health Service ActOur domestic subsidiaries sell most of their products and services to sponsors of employee benefit plans that are governed by the EmployeeRetirement Income Security Act of 1974, as amended (‘‘ERISA’’). ERISA is a complex set of federal laws and regulations enforced by the IRS andthe Department of Labor, as well as the courts. Our domestic subsidiaries are subject to requirements imposed by ERISA affecting claimpayment and appeals procedures for individual health insurance and insured and self-insured group health plans and for the insured dental,disability, life and accident plans we administer. Our domestic subsidiaries also may contractually agree to comply with these requirements onbehalf of the self-insured dental, disability, life and accident plans they administer.
Many provisions of the Health Care Reform Act impacting insured and self-insured group health plans were incorporated into ERISA. The healthinsurance reform provisions under ERISA were also incorporated into the Public Health Service Act and are directly applicable to healthinsurance issuers (i.e., health insurers and HMOs).
Plans subject to ERISA also can be subject to state laws and the legal question of whether and to what extent ERISA preempts a state law willcontinue to be subject to court interpretation.
Medicare and Medicaid RegulationsSeveral of our subsidiaries engage in businesses that are subject to federal Medicare regulations, such as:
those offering individual and group Medicare Advantage coverage; and
those offering Medicare Pharmacy (Part D) products.
In our Medicare Advantage and Medicare Part D business, we contract with CMS to provide services to Medicare beneficiaries. As a result, ourability to obtain payment (and the determination of the amount of such payments), enroll and retain members and expand into new serviceareas is subject to compliance with CMS’ numerous and complex regulations and requirements that are frequently modified and subject toadministrative discretion. Marketing and sales activities (including those of third-party brokers and agents) are also heavily regulated by CMSand other governmental agencies, including applicable state departments of insurance. We will continue to allocate significant resources to ourcompliance, ethics and fraud and waste and abuse programs to comply with the laws and regulations governing Medicare Advantage andMedicare Part D programs.
The Health Care Reform Act ties a portion of each Medicare Advantage plan’s and Medicare Part D plan’s reimbursement to the plan’s ‘‘StarRating’’ by CMS, with those plans receiving a rating of four or more stars eligible for quality-based bonus payments. The Star Rating systemconsiders various measures adopted by CMS, including, for example, quality of care, preventative services, chronic illness management,coverage appeals and customer satisfaction.
Our Medicaid and dual eligible products are also regulated by CMS and state Medicaid agencies that audit our performance to determinecompliance with contracts and regulations. We continue to work in collaboration with applicable state agencies regarding our Medicaid plansin Texas and Illinois to ensure ongoing compliance and sustainability.
Several of our subsidiaries are also subject to reporting requirements pursuant to Section 111 of the Medicare, Medicaid and SCHIP ExtensionAct of 2007, that requires us to report specific information regarding claimants and claim settlements involving Medicare participants so CMScan recover Medicare funds expended to provide healthcare treatment to the claimant. Strict sanctions, including fines and penalties, exclusionfrom the Medicare and Medicaid programs and criminal penalties may be imposed for non-compliance with these reporting obligations.
Federal and State Audits of Government Sponsored Health Care ProgramsParticipation in government sponsored health care programs subjects us to a variety of federal and state laws and regulations and risksassociated with audits conducted under these programs. These audits may occur in years subsequent to our providing the relevant services.These risks may include reimbursement claims as well as potential fines and penalties, such as restrictions on our ability to participate orexpand our presence in certain programs. For example, with respect to our Medicare Advantage business, CMS and the OIG perform audits todetermine a health plan’s compliance with federal regulations and contractual obligations, including compliance with proper coding practices(sometimes referred to as ‘‘Risk Adjustment Data Validation Audits’’ or ‘‘RADV audits’’) and compliance with fraud and abuse enforcementpractices through Recovery Audit Contractor (‘‘RAC’’) audits in which third-party contractors conduct post-payment reviews on a contingencyfee basis to detect and correct improper payments. In addition, negative performance points may be accumulated if we do not performsatisfactorily during an audit that could restrict our ability to expand our Medicare Advantage business geographically.
In January 2016, following an audit, CMS issued a Notice of Imposition of Immediate Intermediate Sanctions (the ‘‘Notice’’) to the Company.The Notice required us to suspend certain enrollment and marketing activities for Medicare Advantage-Prescription Drug and Medicare Part DPlans. The sanctions do not impact the right of current enrollees to remain covered by our Medicare Advantage-Prescription Drug or MedicarePart D Plans. We are working with CMS to address the audit findings as quickly as possible. See ‘‘Business – Global Health Care’’ beginning onpage 3 of this Form 10-K for additional information about our participation in government health-related programs.
18 CIGNA CORPORATION - 2016 Form 10-K
Other Federal and State Regulations
•
•
PART IITEM 1. Business
The federal government has made investigating and prosecuting health care fraud, waste and abuse a priority. Fraud, waste and abuseprohibitions encompass a wide range of activities, including kickbacks for inducement to refer customers, billing for unnecessary medicalservices, coding, network adequacy, improper marketing, and violation of patient privacy rights. The regulations and contractual requirementsin this area are complex, are frequently modified, and are subject to administrative discretion and judicial interpretation. We expect to continueto allocate significant resources to comply with these regulations and requirements and to maintain audit readiness.
Privacy, Security and Data Standards RegulationsThe federal Health Insurance Portability and Accountability Act of 1996 and its implementing regulations (‘‘HIPAA’’) imposes minimumstandards on health insurers, HMOs, health plans, health care providers and clearinghouses for the privacy and security of protected healthinformation. HIPAA also established rules that standardize the format and content of certain electronic transactions, including, but not limitedto, eligibility and claims.
HIPAA’s privacy and security requirements were expanded by the Health Information Technology for Economic and Clinical Health Act(‘‘HITECH’’) through additional contracting requirements for covered entities, the extension of privacy and security provisions to businessassociates, the requirement to provide notification to various parties in the event of a data breach of protected health information, andenhanced financial penalties for HIPAA violations, including potential criminal penalties for individuals.
The federal Gramm-Leach-Bliley Act generally places restrictions on the disclosure of non-public information to non-affiliated third parties,and requires financial institutions, including insurers, to provide customers with notice regarding how their non-public personal information isused, including an opportunity to ‘‘opt out’’ of certain disclosures. State departments of insurance and certain federal agencies adoptedimplementing regulations as required by federal law.
A number of states have adopted data security laws and regulations regulating data security and requiring security breach notification thatmay apply to us in certain circumstances. Neither HIPAA nor the Gramm-Leach-Bliley privacy regulations preempt more stringent state lawsand regulations. In addition, international laws, rules and regulations governing the use and disclosure of personal information are generallymore stringent than in the United States, and they vary from jurisdiction to jurisdiction.
Consumer Protection LawsWe engage in direct-to-consumer activities and are increasingly offering mobile and web-based solutions to our customers. We are thereforesubject to federal and state regulations applicable to electronic communications and other consumer protection laws and regulations, such asthe Telephone Consumer Protection Act and the CAN-SPAM Act. In particular, the Federal Trade Commission is increasingly exercising itsenforcement authority in the areas of consumer privacy and data security, with a focus on web-based, mobile data and ‘‘big data.’’
Dodd-Frank Act and Investment-Related RegulationsThe Dodd-Frank Wall Street Reform and Consumer Protection Act (the ‘‘Dodd-Frank Act’’) provides for a number of reforms and regulations inthe corporate governance, financial reporting and disclosure, investments, tax and enforcement areas. The Dodd-Frank Act established aFederal Insurance Office (the ‘‘FIO’’) to develop federal policy on insurance matters. While the FIO does not have authority over healthinsurance, it may have authority over other parts of our business, such as life insurance. Additional rulemaking by the SEC and other regulatoryauthorities continues. In February 2017, President Trump signed an executive order directing the Secretary of the Treasury to conduct a reviewof the Dodd-Frank Act. We continue to monitor how these regulations might impact us.
Depending upon their nature, our investment management activities are subject to U.S. federal securities laws, ERISA and other federal andstate laws governing investment related activities. In many cases, the investment management activities and investments of individualinsurance companies are subject to regulation by multiple jurisdictions.
Office of Foreign Assets Control Sanctions and Anti-Money LaunderingWe also are subject to regulation by the Office of Foreign Assets Control of the Department of the Treasury that administers and enforceseconomic and trade sanctions based on U.S. foreign policy and national security goals against targeted foreign countries and regimes.
Certain of our products are subject to Department of the Treasury anti-money laundering regulations under the Bank Secrecy Act.
In addition, we may be subject to similar regulations in non-U.S. jurisdictions in which we operate.
Antitrust RegulationsFederal and state antitrust regulators, such as the Department of Justice and certain state attorneys general, have opposed the proposedmerger with Anthem. See Notes 3 and 21 to the Consolidated Financial Statements in this Form 10-K for additional information about theproposed merger. In addition, our subsidiaries also engage in activities that may be scrutinized under federal and state antitrust laws andregulations. These activities include the administration of strategic alliances with competitors, information sharing with competitors andprovider contracting.
Our operations outside the United States expose us to laws of multiple jurisdictions and the rules and regulations of various governing bodiesand regulators, including those related to financial and other disclosures, corporate governance, privacy, data protection, data mining, datatransfer, intellectual property, labor and employment, consumer protection, direct-to-consumer communications activities, anti-corruptionand anti-money laundering. Foreign laws and rules may include requirements that are different from or more stringent than similarrequirements in the United States.
CIGNA CORPORATION - 2016 Form 10-K 19
International Regulations

PART IITEM 1. Business
Our operations in countries outside the United States:
are subject to local regulations of the jurisdictions where customers reside,
in some cases, are subject to regulations in the locations of customers, and
in all cases, are subject to the FCPA.
The FCPA prohibits offering, promising, providing or authorizing others to give anything of value to a foreign government official or employeeto obtain or retain business or otherwise secure a business advantage. Outside of the United States, we may interact with government officialsin several different capacities: as regulators of our insurance business; as clients or partners who are state-owned or partially state-owned; ashealth care professionals who are employed by the government; and as hospitals that are state-owned. Violations of the FCPA and otheranti-corruption laws may result in severe criminal and civil sanctions as well as other penalties, and the SEC and Department of Justice haveincreased their enforcement activities with respect to FCPA. The UK Bribery Act of 2010 applies to all companies with a nexus to the UnitedKingdom. Under this act, any voluntary disclosures of FCPA violations may be shared with United Kingdom authorities, thus potentiallyexposing companies to liability and potential penalties in multiple jurisdictions.
If our employees or agents fail to comply with applicable laws governing our international operations, we may face investigations, prosecutionsand other legal proceedings and actions that could result in civil penalties, administrative remedies and criminal sanctions. See the Risk Factorssection beginning on page 21 for a discussion of risks related to our global operations.
MiscellaneousPremiums and fees from CMS represented 20% of our total consolidated revenues for the year ended December 31, 2016 under a number ofcontracts. We are not dependent on business from one or a few customers. Other than CMS, no one customer accounted for 10% or more of ourconsolidated revenues in 2016. We are not dependent on business from one or a few brokers or agents. In addition, our insurance businessesare generally not committed to accept a fixed portion of the business submitted by independent brokers and agents, and generally all suchbusiness is subject to approval and acceptance.
We had approximately 41,000 employees as of December 31, 2016; 39,300 employees as of December 31, 2015; and 37,200 employees as ofDecember 31, 2014.
20 CIGNA CORPORATION - 2016 Form 10-K
•
•
•

PART IITEM 1A. Risk Factors
Risk FactorsAs a large company operating in a complex industry, we encounter a variety of risks and uncertainties that could have a material adverse effecton our business, liquidity, results of operations, financial condition or the trading price of our securities. You should carefully consider each ofthe risks and uncertainties discussed below, together with other information contained in this Annual Report on Form 10-K, includingManagement’s Discussion and Analysis of Results of Operations and Financial Condition and information. These risks and uncertainties are notthe only ones we face. Additional risks and uncertainties not presently known to us or that we currently believe to be immaterial may alsoadversely affect us. The following risk factors have been organized by category for ease of use; however many of the risks may have impacts inmore than one category. These categories, therefore, should be viewed as a starting point for understanding the significant risks facing us andnot as a limitation on the potential impact of the matters discussed. Risk factors are not necessarily listed in order of importance.
The future performance of our business will depend in large part on our ability to effectively implement and execute our strategic andoperational initiatives including: (1) driving growth in targeted geographies, product lines, customer buying segments and distributionchannels; (2) improving our strategic and financial flexibility; and (3) pursuing additional opportunities in high-growth markets. Successfullyexecuting on these initiatives depends on a number of factors, including our ability to:
differentiate our products and services from those of our competitors;
develop and introduce new products or programs, particularly in response to government regulation and the increased focus on consumer-directed products;
grow our commercial product portfolio, including managing the uncertainties associated with mix and volume of business on public healthinsurance exchanges;
identify and introduce the proper mix or integration of products that will be accepted by the marketplace;
attract and retain sufficient numbers of qualified employees;
attract, develop and maintain collaborative relationships with a sufficient number of qualified partners, including physicians and other healthcare providers in an environment of growing shortages of primary care professionals and consolidation within the provider industry;
attract new and maintain existing customer relationships;
transition health care providers from volume-based fee-for-service arrangements to a value-based system;
improve medical cost competitiveness in targeted markets;
manage our medical and administrative costs effectively;
manage our balance sheet exposures effectively, including our pension funding obligations; and
manage our Global Health Care operating expense ratio effectively.
If these initiatives fail or are not executed on effectively, our consolidated financial position and results of operations could be negativelyaffected. For example, efforts to reduce operating expenses while maintaining the necessary resources and talent pool are important and, ifnot managed effectively, could have long-term effects on our business by negatively impacting our ability to drive improvements in the qualityof our products and/or services. For our strategic initiatives to succeed, we must effectively integrate our operations, including our acquiredbusinesses, actively work to ensure consistency throughout the organization, and promote a global mind-set along with a focus on individualcustomers. If we fail to do so, our business may be unable to grow as planned, or the result of expansion may be unsatisfactory. In addition, thecurrent competitive, economic and regulatory environment requires our organization to adapt rapidly and nimbly to new opportunities andchallenges. We will be unable to do so if we do not make important decisions quickly, define our appetite for risk specifically, implement newgovernance, managerial and organizational processes smoothly and communicate roles and responsibilities clearly.
While health plans compete on the basis of many service and quality-related factors, we expect that price will continue to be a significant basisof competition. Our client and customer contracts are subject to negotiation as clients and customers seek to contain their costs, including byreducing benefits offered or elected. Increasingly, our clients seek to negotiate performance guarantees that require us to pay penalties if theguaranteed performance standard is not met. As brokers and benefit consultants seek to enhance their revenue streams, they look to take onservices that we typically provide. Alternatively, our clients and customers may purchase different types of products that are less profitable, ormove to a competitor to obtain more favorable pricing. Each of these events would likely negatively impact our financial results.
Further, federal and state regulatory agencies may restrict our ability to implement changes in premium rates. For example, the Health CareReform Act includes an annual rate review requirement to prohibit unreasonable rate increases in the individual and small group healthinsurance markets and established minimum medical loss ratios for certain plans. Fiscal concerns regarding the continued viability of programssuch as Medicare may cause decreasing reimbursement rates, delays in premium payments or insufficient increases in reimbursement rates forgovernment sponsored programs in which we participate. Any limitation on our ability to maintain or increase our premium or reimbursement
CIGNA CORPORATION - 2016 Form 10-K 21
ITEM 1A.
Strategic and Operational RisksFuture performance of our business will depend on our ability to execute our strategic and operationalinitiatives effectively.
•
•
•
•
•
•
•
•
•
•
•
•
We face price competition and other pressures that could result in premiums that are insufficient tocover the cost of the health care services delivered to our customers.

PART IITEM 1A. Risk Factors
levels, or a significant loss of customers resulting from our need to increase or maintain premium or reimbursement levels, could adverselyaffect our business, cash flows, financial condition and results of operations.
In addition, factors such as business consolidations, strategic alliances, legislation and marketing practices will likely continue to createpressure to contain or otherwise restrict premium price increases, despite increasing medical costs. For example, the Gramm-Leach-Bliley Actgives banks and other financial institutions the ability to be affiliated with insurance companies. This may lead to new competitors withsignificant financial resources. Our product margins and growth depend, in part, on our ability to compete effectively in our markets, set ratesappropriately in highly competitive markets to keep or increase our market share, increase customers as planned, and avoid losing accountswith favorable medical cost experience while retaining or increasing our customer base in accounts with unfavorable medical cost experience.
Premiums in the health care business are generally set for one-year periods and are priced well in advance of the date on which the contractcommences. Our revenue on Medicare policies is based on bids submitted mid-year in the year before the contract year. Although we base thepremiums we charge and our Medicare bids on our estimate of future health care costs over the contract period, actual costs may exceed whatwe estimate and charge in premiums due to factors such as medical cost inflation, higher than expected utilization of medical services, new orcostly drugs, treatments and technology, and customer mix. Our health care costs also are affected by external events that we cannot forecastor project and over which we have little or no control, such as influenza-related health care costs, epidemics, pandemics, terrorist attacks orother man-made disasters, natural disasters or other events that materially increase utilization of medical and/or other covered services, aswell as changes in customers’ health care utilization patterns and provider billing practices. Our profitability depends, in part, on our ability toaccurately predict, price for and effectively manage future health care costs through disciplined underwriting, provider contracting, utilizationmanagement and product design.
We maintain and record medical claims reserves on our balance sheet for estimated future payments. Our estimates of health care costspayable are based on a number of factors, including historical claim experience, but this estimation process requires extensive judgment.Considerable variability is inherent in such estimates, and the accuracy of the estimates is highly sensitive to changes in medical claimssubmission and processing patterns and/or procedures, changes in customer base and product mix, changes in the utilization of medicaland/or other covered services, changes in medical cost trends, changes in our medical management practices and the introduction of newbenefits and products. Furthermore, if we are not able to accurately and promptly anticipate and detect medical cost trends, our ability to taketimely corrective actions to limit future costs and reflect our current benefit cost experience in our pricing process may be limited. In addition,while we continually review estimates of future payments relating to medical claims costs for services incurred in the current and prior periodsand make adjustments to our reserves, the actual health care costs may exceed the reserves we have recorded.
We directly and indirectly contract with physicians, hospitals and other health care professionals and facilities to provide health care servicesto our customers. Our results of operations are substantially dependent on our ability to contract for these services at competitive prices. Inany particular market, physicians, hospitals and health care providers could refuse to contract, demand higher payments or take other actionsthat could result in higher medical costs or less desirable products for our customers. In some markets, certain providers, particularly hospitals,physician/hospital organizations and multi-specialty physician groups, may have significant or controlling market positions that could result ina diminished bargaining position for us. If providers refuse to contract with us, use their market position to negotiate favorable contracts orplace us at a competitive disadvantage, our ability to market products or to be profitable in those areas could be materially and adverselyaffected. The formation and success of collaborative arrangements with physician groups, specialist groups, hospital arrangements anddelivery system joint ventures are key to our strategic focus to transition from volume-based fee-for-service arrangements to a value-basedhealth care system. If such arrangements do not result in the lower medical costs that we project or if we fail to attract health care providers tosuch arrangements, or are less successful at implementing such arrangements than our competitors, our medical costs may not be competitiveand may be higher than we project, our attractiveness to customers may be reduced, we may lose or be unable to grow our customer base, andour ability to profitably grow our business and/or our operating results may be adversely affected.
Our ability to develop and maintain satisfactory relationships with health care providers also may be negatively impacted by other factors notassociated with us, such as changes in Medicare and/or Medicaid reimbursement levels, increasing revenue and other pressures on health careproviders and consolidation activity among hospitals, physician groups and health care providers. For example, ongoing reductions by CMSand state governments in amounts payable to providers, particularly hospitals, for services provided to Medicare and Medicaid enrollees mayexacerbate the cost shift to private payors, thereby adversely impacting our ability to maintain or develop new cost-effective health careprovider contracts or result in a loss of revenues or customers.
Recent and continuing consolidation among physicians, hospitals and other health care providers, emergence of accountable careorganizations and other changes in the organizational structures chosen by physicians, hospitals and health care providers may change theway these providers interact with us and may change the competitive landscape in which we operate. In some instances, these organizationsmay compete directly with us, potentially affecting the way that we price our products or causing us to incur increased costs if we change ouroperations to be more competitive. Our focus on developing collaborative accountable care organizations and independent practiceassociations or similar business arrangements with physicians and other health care providers may not achieve intended benefits andadversely affect our strategy or prospects.
Out-of-network providers are not limited in the amount they bill by any agreement with us. While benefit plans place limits on the amount ofcharges that will be considered for reimbursement, out-of-network providers have become increasingly sophisticated and aggressive and such
22 CIGNA CORPORATION - 2016 Form 10-K
The reserves we hold for expected medical claims are based on estimates that involve an extensivedegree of judgment and are inherently variable. If actual claims exceed our estimates, our operatingresults could be materially adversely affected, and our ability to take timely corrective actions to limitfuture costs may be limited.
If we fail to develop and maintain satisfactory relationships with physicians, hospitals and other healthcare providers, our business and results of operations may be adversely affected.

PART IITEM 1A. Risk Factors
limitations can be difficult to enforce. As a result, the outcome of disputes where we do not have a provider contract may cause us to pay highermedical or other benefit costs than we projected.
As a global company, our business is increasingly exposed to risks inherent in foreign operations. These risks can vary substantially by market,and include political, legal, operational, regulatory, economic and other risks, including government intervention that we do not face in our U.S.operations. The global nature of our business and operations may present challenges including, but not limited to, those arising from:
varying regional and geopolitical business conditions and demands;
regulation that may discriminate against U.S. companies, favor nationalization or expropriate assets;
price controls or other pricing issues and exchange controls or other restrictions that prevent us from transferring funds from theseoperations out of the countries in which we operate or converting local currencies that our foreign operations hold into U.S. dollars or othercurrencies;
foreign currency exchange rates and fluctuations that may have an impact on the future costs or on future sales and cash flows from ourinternational operations, and any measures that we may implement may not be effective in reducing the effect of volatile currencies andother risks of our international operations;
our reliance on local sales forces for some operations in countries that may have labor problems and/or less flexible employee relationshipsthat can be difficult and expensive to terminate, or where changes in local regulation or law may disrupt business operations;
effectively managing our partner relationships in countries outside of the United States;
managing more geographically diverse operations and projects;
operating in new foreign markets that may require considerable management time before operations generate any significant revenues andearnings;
providing data protection on a global basis and sufficient levels of technical support in different locations;
the global trend for companies to enact local data residency requirements;
political change, including the June 2016 referendum in the United Kingdom to leave the European Union and the results of the November2016 U.S. elections;
acts of war, terrorism, natural disasters or pandemics in locations where we operate; and
general economic and political conditions.
These factors may increase in significance as we continue to expand globally, and any one of these challenges could negatively affect ouroperations or long-term growth. For example, due to the concentration of our international business in South Korea, the Global SupplementalBenefits segment is exposed to potential losses resulting from economic, regulatory and geopolitical developments in that country, as well asforeign currency movements affecting the South Korean currency, that could have a significant impact on the segment’s results and ourconsolidated financial results.
International operations also require us to devote significant resources to implement controls and systems in new markets to comply, and toensure that our vendors and partners comply, with U.S. and foreign laws prohibiting bribery, corruption and money laundering, in addition toother regulations regarding, among other things, our products, direct-to-consumer communications, customer privacy, data protection anddata residency. Violations of these laws and regulations could result in fines, criminal sanctions against us, our officers or employees,restrictions or outright prohibitions on the conduct of our business, and significant reputational harm. We must regularly reassess the size,capability and location of our global infrastructure and make appropriate changes, and must have effective change management processesand internal controls in place to address changes in our business and operations. Our success depends, in part, on our ability to anticipate theserisks and manage these challenges. Our failure to comply with laws and regulations governing our conduct outside the United States or toestablish constructive relations with non-U.S. regulators could have a material adverse effect on our business, results of operations, financialcondition, liquidity and long-term growth.
To improve operating costs, productivity and efficiencies, we contract with third parties for the provision of specific services, such as certainpharmacy benefit management services, information technology, medical management services, call center and claim services. Our operationsmay be adversely affected if these third parties fail to satisfy their obligations to us or if the arrangement is terminated in whole or in part or ifthere is a contractual dispute between us and these third parties. Even though contracts are intended to provide certain protections, we havelimited control over the actions of third parties. For example, noncompliance with any privacy or security laws and regulations or any securitybreach involving one of our third-party vendors or a dispute between us and a third party vendor related to our arrangement could have amaterial adverse effect on our business, results of operations, financial condition, liquidity and reputation. In addition, with respect to servicesor functions outsourced to third parties in foreign jurisdictions, we also are exposed to risks inherent in conducting business outside of theUnited States.
Outsourcing also may require us to change our existing operations, adopt new processes for managing these service providers and/orredistribute responsibilities to realize the potential productivity and operational efficiencies. If there are delays or difficulties in changing
CIGNA CORPORATION - 2016 Form 10-K 23
As a global company, we face political, legal, operational, regulatory, economic and other risks thatpresent challenges and could negatively affect our multinational operations and/or our long-term growth.
•
•
•
•
•
•
•
•
•
•
•
•
•
We are dependent on the success of our relationships with third parties for various services andfunctions, including, but not limited to, certain pharmacy benefit management services.

PART IITEM 1A. Risk Factors
business processes or our third party vendors do not perform as expected, we may not realize, or not realize on a timely basis, the anticipatedeconomic and other benefits of these relationships. This could result in substantial costs or regulatory compliance issues, divert management’sattention from other strategic activities, negatively affect employee morale or create other operational or financial problems for us.Terminating or transitioning in whole or in part arrangements with key vendors could result in additional costs or penalties, risks of operationaldelays or potential errors and control issues during the termination or transition phase. We may not be able to find an alternative vendor in atimely manner or on acceptable terms. If there is an interruption in business or loss of access to data resulting from a termination or transition inservices, we may not be able to meet the demands of our customers and, in turn, our business and results of operations could be adverselyimpacted.
As part of our growth strategy, we regularly consider and enter into strategic transactions, including mergers, acquisitions, joint ventures,licensing arrangements and other relationships (collectively referred to as ‘‘transactions’’), with the expectation that these transactions willresult in various benefits. Our ability to achieve the anticipated benefits of these transactions is subject to numerous uncertainties and risks,including our ability to integrate operations, resources and systems in an efficient and effective manner. We could also face challenges inimplementing business plans; changes in laws and regulations or conditions imposed by regulations applicable to the business; retaining keyemployees; and general competitive factors in the marketplace. These events could result in increased costs, decreases in expected revenues,earnings or cash flow, and goodwill or other intangible asset impairment charges. Further, we may finance transactions by issuing commonstock for some or all of the purchase price that could dilute the ownership interests of our shareholders, or by incurring additional debt thatcould impact our ability to access capital in the future.
In addition, effective internal controls are necessary to provide reliable and accurate financial reports and to mitigate the risk of fraud. Theintegration of businesses is likely to cause increasing complexity in our systems and internal controls and make them more difficult to manage.Any difficulties in assimilating businesses into our control system could cause us to fail to meet our financial reporting obligations. Ineffectiveinternal controls also could cause investors to lose confidence in our reported financial information that could negatively impact the tradingprice of our stock and our access to capital.
Our business is highly dependent on maintaining both effective information systems and the integrity and timeliness of the data we use toserve our customers and health care professionals and to operate our business. If our data were found to be inaccurate or unreliable due tofraud or other error, or if we or our third-party service providers were to fail to maintain information systems and data integrity effectively, wecould experience operational disruptions that may impact our customers and health care professionals and hinder our ability to establishappropriate pricing for products and services, retain and attract customers, establish reserves and report financial results timely and accuratelyand maintain regulatory compliance, among other things.
Our information technology strategy and execution are critical to our continued success. Increasing regulatory and legislative mandatedchanges will place additional demands on our information technology infrastructure that could have a direct impact on available resources forprojects more directly tied to strategic initiatives. In addition, recent trends toward greater consumer engagement in health care require newand enhanced technologies including more sophisticated applications for mobile devices. We must continue to invest in long-term solutionsthat will enable us to anticipate customer needs and expectations, enhance the customer experience, act as a differentiator in the market andprotect against cybersecurity risks and threats. Our success is dependent, in large part, on maintaining the effectiveness of existing technologysystems and continuing to deliver and enhance technology systems that support our business processes in a cost-efficient and resource-efficient manner. Connectivity among technologies is becoming increasingly important. The failure of our health care technologies to operateseamlessly with other products could adversely affect our results of operations, financial position and cash flows. We must also develop newsystems to meet current market standards and keep pace with continuing changes in information processing technology, evolving industry andregulatory standards and customer needs. Failure to do so may present compliance challenges and impede our ability to deliver services at acompetitive cost. Further, because system development projects are long-term in nature, they may be more costly than expected to completeand may not deliver the expected benefits upon completion.
In addition, our business is highly dependent upon our ability to perform, in an efficient and uninterrupted fashion, necessary businessfunctions, such as claims processing and payment, internet support and customer call centers, and processing new and renewal business.Unavailability, cyber-attack or other failure of one or more of our information technology or other systems could cause slower response times,resulting in claims not being processed as quickly as clients or customers desire, decreased levels of client or customer service and satisfaction,and harm to our reputation. Because our information technology and other systems interface with and depend on third-party systems, wecould experience service denials if demand for such service exceeds capacity or a third-party system fails or experiences an interruption. Ifsustained or repeated, such business interruptions, systems failures or service denials could have material adverse effects on our business,results of operations, financial condition and liquidity.
Our business depends on our clients’ and customers’ willingness to entrust us with their health-related and other sensitive personalinformation. Computer systems may be vulnerable to physical break-ins, computer viruses or malware, programming errors, attacks by third
24 CIGNA CORPORATION - 2016 Form 10-K
Acquisitions, joint ventures and other transactions involve risks and we may not realize the expectedbenefits because of integration difficulties, underperformance relative to our expectations and otherchallenges.
Our business depends on our ability to effectively invest in, implement improvements to and properlymaintain the uninterrupted operation and data integrity of our information technology and other businesssystems.
As a large health services company, we are subject to cyber-attacks. If we are unable to prevent orcontain the effects of any such attacks, we may suffer exposure to substantial liability, reputational harm,loss of revenue or other damages.

PART IITEM 1A. Risk Factors
parties or similar disruptive problems. We have been, and will likely continue to be, the target of computer viruses or other malicious codes,unauthorized access, cyber-attacks or other computer-related penetrations. As we increase the amount of personal information that we storeand share digitally, our exposure to data security and related cybersecurity risks increases including the risk of undetected attacks, damage,loss or unauthorized access or misappropriation of proprietary or personal information, and the cost of attempting to protect against theserisks also increases. We have implemented security technologies, processes and procedures to protect consumer identity; however, there areno assurances that such measures will be effective against all types of breaches. The techniques used change frequently or are often notrecognized until launched, because cyber-attacks can originate from a wide variety of sources including third parties such as external serviceproviders. Those parties may also attempt to fraudulently induce employees, customers or other users of our systems to disclose sensitiveinformation in order to gain access to our data or that of our customers. In addition, while we have certain standards for all vendors that provideus services, our vendors, and in turn, their own service providers, may become subject to a security breach as a result of their failure to performin accordance with contractual arrangements.
The costs to eliminate or address security threats and vulnerabilities before or after a cyber-incident could be significant. Our remediationefforts may not be successful and could result in interruptions, delays, or cessation of service and loss of existing or potential customers.
In addition, breaches of our security measures and the unauthorized dissemination of sensitive personal information or proprietary informationor confidential information about us, our customers or other third-parties could expose our customers’ private information and our customersto the risk of financial or medical identity theft. Unauthorized dissemination of confidential and proprietary information about our business andstrategy also could negatively affect the achievement of our strategic initiatives. Such events would also negatively affect our ability tocompete, others’ trust in us, our reputation, customer base and revenues and expose us to mandatory disclosure to the media, litigation andother enforcement proceedings, material fines, penalties and/or remediation costs, and compensatory, special, punitive and statutorydamages, consent orders and other adverse actions, any of which could adversely affect our business, results of operations, financial conditionor liquidity.
Notwithstanding our arrangement with a third-party vendor for certain pharmacy benefit management services, we remain responsible toregulators and our clients and customers for the delivery of those pharmacy benefit management services that we contract to provide. Thisbusiness is subject to federal and state regulation, including without limitation, federal and state anti-remuneration laws, ERISA, HIPAA andlaws related to the operation of Internet and mail-service pharmacies. In addition, certain of our subsidiaries are pharmacies subject to statelicensing and U.S. Drug Enforcement Agency registration requirements and state and federal laws concerning labeling, packaging, advertising,handling and adulteration of prescription drugs and dispensing of controlled substances. Noncompliance with applicable regulations by us orour third-party vendor(s) could have material adverse effects on our business, results of operations, financial condition, liquidity andreputation.
Our pharmacy benefit management business also would be adversely affected by an inability to contract on favorable terms withpharmaceutical manufacturers and we could suffer liability exposure and reputational harm in connection with purported errors by mail orderor retail pharmacy businesses.
In addition to contracting with physicians and other health care providers for services, we employ physicians and other health careprofessionals at onsite low acuity and primary care clinics that we operate for our customers, as well as certain clinics for our employees. Inaddition, our Government business operates LivingWell health centers and we own and operate multispecialty health care centers, low acuityclinics and other types of centers in the Phoenix, Arizona metropolitan area that employ physicians and other health care professionals. As adirect employer of health care professionals and as an owner or operator of medical facilities, we are subject to liability for negligent acts,omissions, or injuries occurring at one of these clinics or caused by one of our employees. Even if any claims brought against us areunsuccessful or without merit, we still have to defend against such claims. The defense of any actions may result in significant expenses thatcould have a material adverse effect on our business, results of operations, financial condition, liquidity and reputation.
Our business is regulated at the federal, state, local and international levels. The laws and rules governing our business and relatedinterpretations, including, among others, those associated with the Health Care Reform Act, are increasing in number and complexity, aresubject to frequent change and can be inconsistent or in conflict with each other. As a public company with global operations, we are subject tothe laws of multiple jurisdictions and the rules and regulations of various governing bodies, such as those related to financial and otherdisclosures, corporate governance, privacy, data protection, labor and employment, consumer protection, tax and anti-corruption.
We must identify, assess and respond to new trends in the legislative and regulatory environment, as well as comply with the various existingregulations applicable to our business. Existing or future laws, rules, regulatory interpretations or judgments could force us to change how weconduct our business, restrict revenue and enrollment growth, increase health care, technology and administrative costs including capitalrequirements, and require enhancements to our compliance infrastructure and internal controls environment. Existing or future laws and rulesalso could require us to take other actions such as changing our business practices, thereby increasing our liability in federal and state courtsfor coverage determinations, contract interpretation and other actions.
CIGNA CORPORATION - 2016 Form 10-K 25
Our pharmacy benefit management business and related operations are subject to a number of risks anduncertainties that are in addition to those we face in our health care business.
In operating onsite clinics and other types of medical facilities, we may be subject to additional liabilitythat could result in significant time and expense.
Legal and Compliance RisksOur business is subject to substantial government regulation, as well as new laws or regulations orchanges in existing laws or regulations that could have a material adverse effect on our business, resultsof operations, financial condition and liquidity.

PART IITEM 1A. Risk Factors
In the foreseeable future, the impact of existing regulations and future regulatory and legislative changes could materially adversely affect ourbusiness, results of operations, financial condition and cash flows by, among other things:
reducing the potential for growth in revenues and clients by disrupting the employer-based market (currently the primary market for ourCommercial operating segment) if employers cease to offer health care coverage for their employees;
restricting revenue, premium and customer growth in certain products and markets or expansion into new markets;
increasing health care or other benefit costs through enhanced or guaranteed coverage requirements;
increasing operating costs through the imposition of reporting or administrative requirements;
increasing operating costs through the imposition of new regulatory requirements, increased taxes and other financial assessments;
restricting our ability to increase premium rates to meet costs (including denial or delays in approval and implementation of those rates);
limiting the level of margin we can earn on premiums through mandated minimum medical loss ratios and required rebates in the event we donot meet mandated minimum ratios;
restricting our ability to participate in and derive revenue from government sponsored programs; and
significantly reducing the level of Medicare program payments.
Specifically, in the United States, significant changes have occurred in the health care system as a result of the Health Care Reform Act.Substantially all of the key provisions of the Health Care Reform Act are now effective. While federal agencies have published interim and finalregulations with respect to certain requirements, many issues remain uncertain.
The new Trump Administration and the U.S. Congress may seek to modify, repeal or replace all or part of this health care reform legislation.These efforts began when President Trump signed an executive order in January 2017 that instructs agencies to waive, defer, grant exemptionsfrom, or delay the implementation of any provision of the Health Care Reform Act that poses a financial burden. As a result, it is difficult topredict the continuing impact of the Health Care Reform Act on our business. In addition, the continuing development of implementingregulations and interpretive guidance and legal challenges has contributed to this uncertainty. We are unable to predict how these events willdevelop and what impact they will have on the Health Care Reform Act, and in turn, on our business including, but not limited to, our products,services, processes and technology and on our relationships with current and future customers, producers and health care providers.
Further, if we fail to effectively implement or adjust our strategic and operational initiatives, such as by reducing operating costs, adjustingpremium pricing or benefit design or transforming our business model in response to the Health Care Reform Act and any other futurelegislative or regulatory changes, this failure may have a material adverse effect on our results of operations, financial condition and cash flows,including, but not limited to, our ability to maintain the value of our goodwill and other intangible assets.
Our insurance and HMO subsidiaries must be licensed by and are subject to the regulations of the jurisdictions in which they conduct business.For example, health maintenance organizations and insurance companies are regulated under specific state laws and regulations and indirectlyaffected by other health care-related laws and regulations. State regulations mandate minimum capital or restricted cash reserverequirements. In addition, state guaranty fund laws and related regulations subject us to assessments for certain obligations to policyholdersand claimants of impaired or insolvent insurance companies (including state insurance cooperatives). Any such assessment could expose ourinsurance entities and other insurers to the risk of paying a portion of an impaired or insolvent insurance company’s claims through stateguaranty association assessments. We also participate in the private exchange marketplace. Whether and the extent to which states may issueregulations that apply to private exchanges remains uncertain.
In addition to the regulations discussed above, we are required to obtain and maintain insurance and other regulatory approvals to marketmany of our products, increase prices for certain regulated products and consummate some of our acquisitions and dispositions. Delays inobtaining or failure to obtain or maintain these approvals could reduce our revenue or increase our costs.
The health care industry is also regularly subject to negative media attention, including as a result of the political environment and the ongoingdebate concerning the Health Care Reform Act. Such publicity may adversely affect our stock price and reputation in certain markets.
For more information on regulation, see ‘‘Business — Regulation’’ in Part I, Item 1 of this Form 10-K. See also the description of the Health CareReform Act’s minimum medical loss ratio and customer rebate requirements in the ‘‘Business — Global Health Care’’ section beginning onpage 3 of this Form 10-K.
Through our Government business, we contract with CMS and various state governmental agencies to provide managed health care servicesincluding Medicare Advantage plans and Medicare-approved prescription drug plans. Revenues from Medicare programs are dependent, inwhole or in part, upon annual funding from the federal government through CMS and/or applicable state or local governments. Funding forthese programs is dependent on many factors outside our control including general economic conditions, continuing government efforts tocontain health care costs and budgetary constraints at the federal or applicable state or local level and general political issues and priorities.These entities generally have the right to not renew or cancel their contracts with us on short notice without cause or if funds are not available.Unanticipated changes in funding, such as the application of sequestration by the federal or state governments, could substantially reduce ourrevenues and profitability.
The Medicare program has been the subject of regulatory reform initiatives, including the Health Care Reform Act. The premium rates paid toMedicare Advantage plans and Medicare Part D plans are established by contract, although the rates differ depending on a combination of
26 CIGNA CORPORATION - 2016 Form 10-K
•
•
•
•
•
•
•
•
•
There are various risks associated with participating in government sponsored programs, such asMedicare, including dependence upon government funding, changes occurring as a result of the HealthCare Reform Act, compliance with government contracts and increased regulatory oversight.

PART IITEM 1A. Risk Factors
factors, many of which are outside our control. The Health Care Reform Act ties a portion of each Medicare Advantage plan’s and MedicarePart D plan’s reimbursement to the plan’s ‘‘Star Rating’’ by CMS, with those plans receiving a rating of four or more stars eligible for quality-based bonus payments. The Star Rating system considers various measures adopted by CMS, including, for example, quality of care,preventative services, chronic illness management, coverage appeals and customer satisfaction. Our Medicare Advantage plans’ and MedicarePart D plans’ operating results, premium revenue and benefit offerings are likely to continue to be significantly determined by their StarRatings. In October 2016, CMS announced 2017 Star Ratings and the projected Star Ratings for plans offered by certain subsidiaries of theCompany included certain reductions that are primarily attributable to our CMS audit. There is no financial impact in 2017 because theseratings apply to plans for the 2018 payment year. However, if we are unsuccessful in restoring at least some of our downgraded Star Ratingsmeasures, the effect in 2018 could be material to shareholders’ net income. See Part II, Item 7 — Management’s Discussion and Analysis ofFinancial Condition and Results of Information — Health Care Industry Developments and Other Matters Affecting our Global Health CareSegment for additional information on the impact of the downgraded 2018 Star Rating measures.
Contracts with CMS and the various state governmental agencies contain certain provisions regarding data submission, provider networkmaintenance, quality measures, claims payment, continuity of care, call center performance and other requirements. If we fail to comply withthese requirements, we may be subject to administrative actions, fines or other penalties that could impact our profitability.
The Health Care Reform Act required establishing health insurance exchanges for individuals and small employers. Insurers participating on thehealth insurance exchanges are required to offer a minimum level of benefits and comply with requirements with respect to premium rates andcoverage limitations. Our participation in these exchanges involves uncertainties associated with mix and volume of business and couldadversely affect our results of operations, financial position and cash flows.
In addition, any failure to comply with various state and federal health care laws and regulations, including those directed at preventing fraudand abuse in government funded programs, could result in investigations or litigation, such as actions under the federal False Claims Act andsimilar whistleblower statutes under state laws. This could subject us to fines, limits on expansion, restrictions or exclusions from programs orother agreements with federal or state governmental agencies that could adversely impact our business, cash flows, financial condition andresults of operations.
In addition, our Medicare Advantage and Medicare Part D businesses face a number of other risks including potential uncollectible receivablesresulting from processing and/or verifying enrollment, inadequate underwriting assumptions, inability to receive and process correctinformation or increased medical or pharmaceutical costs. Actual results may be materially different than our assumptions and estimatesregarding these complex and wide-ranging programs that could have a material adverse effect on our business, financial condition and resultsof operations.
We are routinely involved in numerous claims, lawsuits, regulatory audits, investigations and other legal matters arising in the ordinary courseof business, including that of administering and insuring employee benefit programs. These legal matters could include benefit claims, breachof contract actions, tort claims, claims arising from consumer protection laws, claims disputes under federal or state laws and disputesregarding reinsurance arrangements, employment and employment discrimination-related suits, antitrust claims, employee benefit claims,wage and hour claims, tax, privacy, intellectual property and whistle blower claims and real estate disputes. In addition, we have incurred andlikely will continue to incur liability for practices and claims related to our health care business, such as marketing misconduct, failure to timelyor appropriately pay for or provide health care, provider network structure, poor outcomes for care delivered or arranged, provider disputesincluding disputes over compensation or contractual provisions, and claims related to our administration of self-funded business. There arecurrently, and may be in the future, attempts to bring class action lawsuits against the industry; or individual plaintiffs also may bring multipleclaims regarding the same subject matter against us and other companies in our industry.
With respect to our global operations, contractual rights, laws and regulations may be subject to interpretation or uncertainty to a greaterdegree than in the U.S., and therefore subject us to disputes by customers, governmental authorities or others.
Court decisions and legislative activity may increase our exposure for any of these types of claims. In some cases, substantial non-economic orpunitive damages may be sought. We seek to procure insurance coverage to cover some of these potential liabilities. However, certain potentialliabilities may not be covered by insurance, insurers may dispute coverage or the amount of insurance may be insufficient to cover the entiredamages awarded. In addition, certain types of damages, such as punitive damages, may not be covered by insurance, and insurance coveragefor all or certain forms of liability may become unavailable or prohibitively expensive in the future. It is possible that the resolution of current orfuture legal matters and claims could result in losses material to our results of operations, financial condition and liquidity.
We are frequently the subject of regulatory market conduct and other reviews, audits and investigations by state insurance and health andwelfare departments, attorneys general, CMS and the OIG and comparable authorities in foreign jurisdictions. With respect to our MedicareAdvantage business, CMS and OIG perform audits to determine a health plan’s compliance with federal regulations and contractualobligations, including compliance with proper coding practices and fraud and abuse enforcement practices through audits designed to detectand correct improper payments, and the DOJ has requested information regarding these practices. There also continues to be heightenedreview by federal and state regulators of business and reporting practices within the health care and disability insurance industry and increasedscrutiny by other state and federal governmental agencies (such as state attorneys general) empowered to bring criminal actions incircumstances that could have previously given rise only to civil or administrative proceedings. These regulatory audits or reviews or actions byother governmental agencies could result in changes to our business practices, retroactive adjustments to certain premiums, significant fines,penalties, civil liabilities, criminal liabilities or other sanctions, including restrictions on our ability to market certain products or engage inbusiness-related activities, that could have a material adverse effect on our business, results of operation, financial condition and liquidity. Inaddition, disclosure of an adverse investigation or audit or the imposition of fines or other sanctions in addition to the CMS sanctions discussedbelow could negatively affect our reputation in certain markets and make it more difficult for us to sell our products and services.
In January 2016, CMS issued to the Company a Notice of Imposition of Immediate Intermediate Sanctions (the ‘‘Notice’’). The Notice requiresthe Company to suspend certain enrollment and marketing activities for its Medicare Advantage-Prescription Drug and Medicare Part D Plans.
CIGNA CORPORATION - 2016 Form 10-K 27
We face risks related to litigation, regulatory audits and investigations.

PART IITEM 1A. Risk Factors
The Company is working to resolve these matters as quickly as possible. However, these matters were not resolved in time to participate in the2017 Medicare Advantage and Part D annual enrollment period for 2017. See Part II, Item 7 — Management’s Discussion and Analysis ofFinancial Condition and Results of Information — Health Care Industry Developments and Other Matters Affecting our Global Health CareSegment for additional information on the impact of the downgraded 2018 Star Rating measures.
A description of material pending legal actions and other legal and regulatory matters is included in Note 21 to our Consolidated FinancialStatements included in this Form 10-K. The outcome of litigation and other legal or regulatory matters is always uncertain, and outcomes thatare not justified by the evidence or existing law can occur.
The collection, maintenance, protection, use, transmission, disclosure and disposal of sensitive personal information are regulated at thefederal, state, international and industry levels and requirements are imposed on us by contracts with clients. In some cases, such laws, rules,regulations and contractual requirements also apply to our vendors and require us to obtain written assurances of their compliance with suchrequirements or may hold us liable for any violations by our vendors. International laws, rules and regulations governing the use and disclosureof such information are generally more stringent than in the United States, and they vary from jurisdiction to jurisdiction. We also are subject tovarious other consumer protection laws that regulate our communications with customers.
These laws, rules, and contractual requirements are subject to change. Compliance with new privacy, security and data laws, regulations andrequirements may result in increased operating costs, and may constrain or require us to alter our business model or operations. For example,the HITECH amendments to HIPAA may further restrict our ability to collect, disclose and use sensitive personal information and may imposeadditional compliance requirements on our business.
HIPAA requires covered entities to comply with the HIPAA privacy, security and breach rules. In addition, business associates must comply withthe HIPPA security and breach requirements. While we provide for appropriate protections through our contracts with our third-party serviceproviders and in certain cases assess their security controls, we have limited oversight or control over their actions and practices. Several of ourbusinesses act as business associates to their covered entity customers and, as a result, collect, use, disclose and maintain sensitive personalinformation in order to provide services to these customers. HHS has continued its audit program to assess HIPAA compliance efforts bycovered entities and has expanded it to include business associates. In addition, HHS has increased its enforcement efforts. These efforts resultin enforcement actions that are the result of investigations brought on by the notification to HHS of a breach. An audit resulting in findings orallegations of noncompliance or the implementation of an enforcement action could have an adverse effect on our results of operations,financial position and cash flows.
Federal and state governments have made investigating and prosecuting health care and other insurance fraud and abuse a priority. Fraud andabuse prohibitions encompass a wide range of activities including kickbacks for referral of customers, billing for unnecessary medical services,improper marketing, and violations of patient privacy rights. The regulations and contractual requirements applicable to us are complex andsubject to change. In addition, ongoing vigorous law enforcement, a highly technical regulatory scheme and the Dodd-Frank Act legislationand related regulations enhance regulators’ enforcement powers and whistleblower incentives and protections. Our compliance efforts in thisarea will continue to require significant resources. Failure of our prevention, detection or control systems related to regulatory compliance orthe failure of employees to comply with our internal policies including data systems security or unethical conduct by managers and employees,could adversely affect our reputation and also expose us to litigation and other proceedings, fines and penalties.
In addition, provider or customer fraud that is not prevented or detected could impact our medical costs or those of our self-insured clients.Further, during an economic downturn, we may experience increased fraudulent claims volume that may lead to additional costs due to anincrease in disputed claims and litigation.
We currently have unfunded obligations in our frozen pension plans. A significant decline in the value of the plans’ equity and fixed incomeinvestments or unfavorable changes in applicable laws or regulations could materially increase our expenses and change the timing andamount of required plan funding. This could reduce the cash available to us, including our subsidiaries. We also are exposed to interest rate andequity risk associated with our pension and other post-retirement obligations. Sustained declines in interest rates could have an adverseimpact on the funded status of our pension plans and our reinvestment yield on new investments. See Note 15 to our Consolidated FinancialStatements for more information on our obligations under the pension plan.
As an insurer, we have substantial investment assets that support insurance and contractholder deposit liabilities. Generally low levels ofinterest rates on investments, such as those experienced in U.S. and foreign financial markets during recent years, have negatively impactedour level of investment income earned in recent periods.
A substantial portion of our investment assets are in fixed interest-yielding debt securities of varying maturities, fixed redeemable preferredsecurities and commercial mortgage loans. The value of these investment assets can fluctuate significantly with changes in market conditions.
28 CIGNA CORPORATION - 2016 Form 10-K
If we fail to comply with applicable privacy, security, and data laws, regulations and standards, ourbusiness and reputation could be materially and adversely affected.
Effective prevention, detection and control systems are critical to maintain regulatory compliance andprevent fraud and failure of these systems could adversely affect us.
Economic RisksSignificant stock market or interest rate declines could result in additional unfunded pension obligationsresulting in the need for additional plan funding by us and increased pension expenses.
Significant changes in market interest rates affect the value of our financial instruments that promise afixed return or benefit and the value of particular assets and liabilities.
PART IITEM 1A. Risk Factors
A rise in interest rates would likely reduce the value of our investment portfolio and increase interest expense if we were to access our availablelines of credit.
Financial strength, claims paying ability and debt ratings by recognized rating organizations are each important factors in establishing thecompetitive position of insurance and health benefits companies. Ratings information by nationally recognized ratings agencies is broadlydisseminated and generally used throughout the industry. We believe that the claims paying ability and financial strength ratings of ourprincipal insurance subsidiaries are important factors in marketing our products to certain customers. Our debt ratings impact both the costand availability of future borrowings, and accordingly, our cost of capital. Each of the rating agencies reviews ratings periodically and there canbe no assurance that current ratings will be maintained in the future. A downgrade of these ratings in the future could make it more difficult toeither market our products successfully or raise capital to support business growth within our insurance subsidiaries.
If the equity and credit markets experience extreme volatility and disruption, there could be downward pressure on stock prices and creditcapacity for certain issuers without regard to those issuers’ underlying financial strength. Extreme disruption in the credit markets couldadversely impact our availability and cost of credit in the future. In addition, unpredictable or unstable market conditions or continued pressurein the global or U.S. economy could result in reduced opportunities to find suitable opportunities to raise capital.
As of December 31, 2016, our outstanding long-term debt totaled $4.8 billion. In the event of adverse economic and industry conditions, wemay be required to dedicate a greater percentage of our cash flow from operations to the payment of principal and interest on our debt,thereby reducing the funds we have available for other purposes, such as investments in ongoing businesses, acquisitions, dividends and stockrepurchases. In these circumstances, our ability to execute our strategy may be limited, our flexibility in planning for or reacting to changes inbusiness and market conditions may be reduced, or our access to capital markets may be limited such that additional capital may not beavailable or may be available only on unfavorable terms.
Global economic conditions continue to be challenging. Many factors, including geopolitical issues, confidence in any economic recoveries andany future economic downturns, availability and cost of credit and other capital and consumer spending can negatively impact expectationsfor the U.S. and global economies. Our results of operations could be materially and adversely affected by the impact of unfavorable economicconditions on our customers (both employers and individuals), health care providers and third-party vendors. For example:
Employers may take action to reduce their operating costs by modifying, delaying or canceling plans to purchase our products or makingchanges in the mix of products purchased that are unfavorable to us.
Higher unemployment rates and workforce reductions could result in lower enrollment in our employer-based plans (including an increase inthe number of employees who opt out of employer-based plans) or our individual plans.
Because of unfavorable economic conditions or the Health Care Reform Act, employers may stop offering health care coverage to employeesor elect to offer this coverage on a voluntary, employee-funded basis as a means to reduce their operating costs.
Our historical disability claim experience and industry data indicate that submitted disability claims rise under adverse economic conditions.
If customers are not successful in generating sufficient funds or are precluded from securing financing, they may not be able to pay, or maydelay payment of, accounts receivable that are owed to us.
Our customers or potential customers may force us to compete more vigorously on factors such as price and service to retain or obtain theirbusiness.
A prolonged unfavorable economic environment could adversely impact the financial position of hospitals and other health care providers,potentially increasing our medical costs as these providers attempt to maintain revenue levels in their efforts to adjust to their own economicchallenges.
Our third-party vendors could significantly and quickly increase their prices or reduce their output to reduce their operating costs. Ourbusiness depends on our ability to perform necessary business functions in an efficient and uninterrupted fashion.
These factors could lead to a decrease in our customer base, revenues or margins and/or an increase in our operating costs.
In addition, during a prolonged unfavorable economic environment, state and federal budgets could be materially and adversely affected,resulting in reduced reimbursements or payments in state and federal government programs such as Medicare and Social Security. These stateand federal budgetary pressures also could cause the government to impose new or a higher level of taxes or assessments on us, such aspremium taxes on insurance companies and HMOs and surcharges or fees on select fee-for-service and capitated medical claims. Although wecould attempt to mitigate or cover our exposure from such increased costs through, among other things, increases in premiums, there can beno assurance that we will be able to mitigate or cover all of such costs, which may have a material adverse effect on our business, results ofoperations, financial condition and liquidity.
CIGNA CORPORATION - 2016 Form 10-K 29
A downgrade in the financial strength ratings of our insurance subsidiaries could adversely affect newsales and retention of current business, and a downgrade in our debt ratings would increase the cost ofborrowed funds and negatively affect our ability to access capital.
Global market, economic and geopolitical conditions may cause fluctuations in equity market prices,interest rates and credit spreads that could impact our ability to raise or deploy capital and affect ouroverall liquidity.
Unfavorable developments in economic conditions may adversely affect our business, results ofoperations and financial condition.
•
•
•
•
•
•
•
•

PART IITEM 1A. Risk Factors
We enter into reinsurance arrangements with other insurance companies, primarily to limit losses from large exposures or to permit recovery ofa portion of direct losses. We also may enter into reinsurance arrangements in connection with acquisition or divestiture transactions when theunderwriting company is not being acquired or sold.
Under all reinsurance arrangements, reinsurers assume insured losses, subject to certain limitations or exceptions that may include a loss limit.These arrangements also subject us to various obligations, representations and warranties with the reinsurers. Reinsurance does not relieve usof liability as the originating insurer. We remain liable to the underlying policyholders if a reinsurer defaults on obligations under thereinsurance arrangement. Although we regularly evaluate the financial condition of reinsurers to minimize exposure to significant losses fromreinsurer insolvencies, reinsurers may become financially unsound. If a reinsurer fails to meet its obligations under the reinsurance contract or ifthe liabilities exceed any applicable loss limit, we will be forced to cover the claims on the reinsured policies.
The collectability of amounts due from reinsurers is subject to uncertainty arising from a number of factors, including whether the insuredlosses meet the qualifying conditions of the reinsurance contract, whether reinsurers or their affiliates have the financial capacity andwillingness to make payments under the terms of the reinsurance contract, and the magnitude and type of collateral supporting ourreinsurance recoverable, such as holding sufficient qualifying assets in trusts or letters of credit issued. Although a portion of our reinsuranceexposures are secured, the inability to collect a material recovery from a reinsurer could have a material adverse effect on our results ofoperations, financial condition and liquidity.
On February 8, 2017, the U.S. District Court for the District of Columbia (the ‘‘District Court’’) issued an order enjoining the proposed mergerwith Anthem. An appeal of the District Court’s order is now pending before the Appeals Court. Cigna entered into the merger agreement inorder to create a combined company that would expand choice, improve affordability and quality, and further accelerate value-based care. Ifthe merger is not consummated as originally proposed, we will not realize any potential benefits of the merger. In addition, as discussed belowunder ‘‘– The ongoing litigation related to the merger agreement could adversely affect our business, financial results and operations,’’ we andAnthem are involved in pending litigation against each other. Cigna believes that, after the ruling by the District Court to enjoin the merger,terminating the merger agreement is in the best interest of our shareholders. Our inability to terminate the merger agreement could createuncertainty and disruptions to our business, delay or prevent us from pursuing other strategic opportunities or otherwise adversely affect ourbusiness, financial results and operations. It is uncertain whether the merger will be consummated or when or if we will be able to terminate themerger agreement, as further discussed below under ‘‘– The ongoing litigation related to the merger agreement could adversely affect ourbusiness, financial results and operations’’.
The pendency of the merger, and the uncertainty surrounding whether the merger will be consummated or terminated, may cause disruptions toour business, which could adversely affect our relationships with our clients, customers, providers, lenders, vendors and/or employees. As a resultof this uncertainty, we could also potentially lose or fail to attract new key employees, clients, vendors and our provider arrangements could bedisrupted. In addition, we have diverted, and will continue to divert, management resources towards the proposed merger. The proposed mergerwill continue to divert management’s attention and our resources from ongoing business and operations and other business opportunities. Anydisruption to our workforce, business relationships or leadership could adversely affect our business, financial results and operations.
The merger agreement provides for ongoing restrictions on the conduct of our business including, among other things, certain restrictions onour ability to acquire other businesses, sell, transfer or license our assets, repurchase outstanding common stock, make capital expenditures,amend our organizational documents and incur indebtedness. We remain subject to these restrictions pursuant to the temporary restrainingorder from the Chancery Court, as further discussed below under ‘‘– The ongoing litigation related to the merger agreement could adverselyaffect our business, financial results and operations’’. These restrictions could result in our inability to respond effectively to competitivepressures, industry developments and future opportunities.
Furthermore, we have incurred and will continue to incur significant transaction costs with respect to the proposed merger, including legal andother costs. The incurrence of these costs could adversely affect our business, financial results and operations.
On February 14, 2017, we notified Anthem that we had terminated the merger agreement and filed suit in the Delaware Court of Chancery (the‘‘Chancery Court’’) seeking, among other things, declaratory judgments that the Company’s termination of the merger agreement is lawful andthat Anthem is not permitted to extend the termination date to April 30, 2017. In the filed suit, we are also seeking payment by Anthem of the$1.85 billion reverse termination fee contemplated in the merger agreement, as well as additional damages. Later that day, Anthem filed suitagainst us seeking a temporary restraining order preventing the termination of the merger agreement, specific performance and damages. OnFebruary 15, 2017, the Chancery Court issued an order temporarily enjoining Cigna from terminating the merger agreement. Such litigation couldbe costly, create uncertainty with respect to the future of our business or otherwise adversely affect our business, financial results and operations.
While we believe in the merits of our claims and dispute Anthem’s claims, the outcomes of lawsuits are inherently unpredictable, and we may beunsuccessful in the ongoing litigation or any future claims or litigation. The Chancery Court may find that we have not complied, in full or in part,with our obligations under the merger agreement, that we are liable for a breach, willful or otherwise, of the merger agreement, that we do nothave a right to terminate the merger agreement, that we are not entitled to the reverse termination fee or other adverse findings. Failure tocollect all or some of the reverse termination fee would adversely affect our business, financial results and operations. Anthem has claimedmoney damages in an amount to be proven at trial, including for actual damages, incidental damages, consequential damages, lost profits, lostgoodwill, and other costs and damages incurred by Anthem by reason of Cigna’s alleged breaches of the merger agreement. If Anthem prevailson any of these claims for damages, Cigna’s liability could be substantial, and any such ruling could adversely affect our business, financialresults and operations. Finally, any binding or non-binding decision that delays or eliminates our ability to terminate the merger agreementcould create uncertainty and disruptions to our business, delay or prevent us from pursuing other strategic opportunities or otherwiseadversely affect our business, financial results and operations.
30 CIGNA CORPORATION - 2016 Form 10-K
We are subject to the credit risk of our reinsurers.
Other RisksThe pendency of and uncertainty surrounding the proposed merger with Anthem, Inc. could adverselyaffect our business.
The ongoing litigation related to the merger agreement could adversely affect our business, financialresults and operations.

PART IITEM 1B. Unresolved Staff Comments
Unresolved Staff CommentsNone.
PropertiesOur global real estate portfolio consists of approximately 7.8 million square feet of owned and leased properties. Our domestic portfolio hasapproximately 5.8 million square feet in 38 states, the District of Columbia, Puerto Rico and the U.S. Virgin Islands. Our International propertiescontain approximately 2.0 million square feet located throughout the following countries: Australia, Bahrain, Belgium, Canada, China, HongKong, India, Indonesia, Kenya, Malaysia, New Zealand, Singapore, South Korea, Spain, Switzerland, Taiwan, Thailand, Turkey, United ArabEmirates, and the United Kingdom.
Our principal, domestic office locations, including various support operations, along with Group Disability and Life Insurance, Health Services,Core Medical and Service Operations and the domestic office of our Global Supplemental Benefits business are the Wilde Building located at900 Cottage Grove Road in Bloomfield, Connecticut (our corporate headquarters) and Two Liberty Place located at 1601 Chestnut Street inPhiladelphia, Pennsylvania. The Wilde Building measures approximately 893,000 square feet and is owned, while Two Liberty Place measuresapproximately 322,000 square feet and is leased office space.
We believe our properties are adequate and suitable for our business as presently conducted. The foregoing does not include information oninvestment properties.
Legal ProceedingsThe information contained under ‘‘Litigation Matters’’, ‘‘Regulatory Matters’’ and ‘‘Other Legal Matters’’ in Note 21 to our Financial Statementsbeginning on page 106 of this Form 10-K, is incorporated herein by reference.
Mine Safety DisclosuresNot applicable.
CIGNA CORPORATION - 2016 Form 10-K 31
ITEM 1B.
ITEM 2.
ITEM 3.
ITEM 4.

PART IEXECUTIVE OFFICERS OF THE REGISTRANT
All officers are elected to serve for a one-year term or until their successors are elected. Principal occupations and employment during the pastfive years are listed below.
LISA R. BACUS, 52, Executive Vice President and Global Chief Marketing Officer of Cigna beginning May 2013 and Chief Customer Officerbeginning February 2017; Executive Vice President and Chief Marketer at American Family Insurance from February 2008 until May 2013.
MARK L. BOXER, 57, Executive Vice President and Global Chief Information Officer of Cigna beginning April 2011; Deputy Chief InformationOfficer, Xerox Corporation; and Group President, Government Health Care, for Xerox Corporation/Affiliated Computer Services from March2009 until April 2011.
DAVID M. CORDANI, 51, Chief Executive Officer of Cigna beginning December 2009; Director since October 2009; President beginning June2008; and Chief Operating Officer from June 2008 until December 2009.
CHRISTOPHER HOCEVAR, 43, President, Strategy, Segments and Solutions beginning February 2017; President, Pharmacy and SelectBusiness from June 2013 to February 2017; President, Select Business beginning February 2011.
NICOLE S. JONES, 46, Executive Vice President and General Counsel of Cigna beginning June 2011; Senior Vice President and General Counselof Lincoln Financial Group from May 2010 until June 2011; Vice President and Deputy General Counsel of Cigna from April 2008 until May 2010;and Corporate Secretary of Cigna from September 2006 until April 2010.
MATTHEW G. MANDERS, 55, President, Government & Individual Programs and Group Insurance beginning February 2017; President, U.S.Markets from June 2014 until February 2017; President, Regional and Operations from November 2011 until June 2014; President, U.S. Service,Clinical and Specialty from January 2010 until November 2011; and President of Cigna HealthCare, Total Health, Productivity, Network & MiddleMarket from June 2009 until January 2010.
THOMAS A. McCARTHY, 60, Executive Vice President and Chief Financial Officer of Cigna beginning July 2013; Vice President of Finance withresponsibility for treasury, tax, strategy and corporate development, and management of run-off reinsurance from February 2003 until July2013; Acting Chief Financial Officer from September 2010 until June 2011, and Treasurer from July 2008 until June 2011.
ALAN M. MUNEY, MD, MHA, 63, Executive Vice President, Total Health & Network and Chief Medical Officer beginning February 2017; joinedCigna as Senior Vice President, Total Health & Network in 2010 and named Chief Medical Officer in 2011.
JOHN M. MURABITO, 58, Executive Vice President, Human Resources and Services of Cigna beginning August 2003.
JASON D. SADLER, 48, President, International Markets beginning June 2014; President, Global Individual Health, Life and Accident from July2010 until June 2014, and Managing Director Insurance Business Hong Kong, HSBC Insurance Asia Limited from January 2007 until July 2010.
MICHAEL TRIPLETT, 55, President, U.S. Markets beginning February 2017; Regional Segment Lead from June 2009 to February 2017.
32 CIGNA CORPORATION - 2016 Form 10-K
EXECUTIVE OFFICERS OF THE REGISTRANT

PART IIITEM 5. Market for Registrant’s Common Equity, Related Stockholder Matters and Issuer Purchases of Equity Securities
Market for Registrant’s Common Equity, RelatedStockholder Matters and Issuer Purchases ofEquity Securities
The information under the caption ‘‘Quarterly Financial Data – Stock and Dividend Data’’ appears on page 113 of this Form 10-K. As ofDecember 31, 2016, the number of shareholders of record was 6,029. Cigna’s common stock is listed with, and trades on, the New York StockExchange under the symbol ‘‘CI’’.
Issuer Purchases of Equity SecuritiesThe following table provides information about Cigna’s share repurchase activity for the quarter ended December 31, 2016:
Total # of shares Approximate dollar valuepurchased as of shares that may yet
Total # of Average part of publicly be purchased as part ofshares price paid announced publicly announced
Period purchased (1) per share program (2) program (3)
October 1-31, 2016 235 $ 123.45 – $ 725,000,122November 1-30, 2016 21,463 $ 132.60 – $ 725,000,122December 1-31, 2016 1,952 $ 136.21 – $ 725,000,122
Total 23,650 $ 132.81 – N/A
(1) Represents shares tendered by employees as payment of taxes withheld on vesting of restricted stock and strategic performance shares granted under the Company’s equitycompensation plans.
(2) Additionally, the Company maintains a share repurchase program, authorized by the Board of Directors. Under this program, the Company may repurchase shares from time to time,depending on market conditions and alternate uses of capital. The timing and actual number of shares repurchased will depend on a variety of factors, including price, general businessand market conditions and alternate uses of capital. The share repurchase program may be effected through open market purchases or privately negotiated transactions in compliancewith Rule 10b-18 under the Securities Exchange Act of 1934, as amended, including through Rule 10b5-1 trading plans. The program may be suspended or discontinued at any time. In2016, the Company repurchased approximately 0.8 million shares for $110 million. Remaining authorization under the program was approximately $725 million as of December 31, 2016. InFebruary 2017, the Board increased repurchase authority to $3.7 billion, however management has determined that it is prudent to cap the amount of repurchase to $250 million perquarter until there is more clarity with respect to the litigation with Anthem. From January 1, 2017 through February 22, 2017, the Company repurchased 0.7 million shares for $106 million.Remaining authorization under the program was $3.7 billion as of February 22, 2017.
(3) Approximate dollar value of shares is as of the last date of the applicable month.
CIGNA CORPORATION - 2016 Form 10-K 33
ITEM 5.
PART II

15FEB201710011153
PART IIITEM 5. Market for Registrant’s Common Equity, Related Stockholder Matters and Issuer Purchases of Equity Securities
Five Year Cumulative Total Shareholder Return*December 31, 2011 – December 31, 2016
$0
$50
$100
$150
$200
$250
$300
$350
$400
12/31/11 12/31/12 12/31/13 12/31/14 12/31/1612/31/15
Cigna
S&P 500
S&P Managed Health Care, Life & Health Ins. Indexes**
12/31/2011 12/31/2012 12/31/2013 12/31/2014 12/31/2015 12/31/2016
Cigna $ 100 $ 127 $ 209 $ 245 $ 349 $ 318
S&P 500 $ 100 $ 116 $ 154 $ 175 $ 177 $ 198
S&P Managed Health Care, Life & Health Ins. Indexes** $ 100 $ 108 $ 164 $ 205 $ 236 $ 285
* Assumes that the value of the investment in Cigna common stock and each index was $100 on December 31, 2011 and that all dividends were reinvested.
** Weighted average of S&P Managed Health Care (75%) and Life and Health Insurance (25%) Indexes.
34 CIGNA CORPORATION - 2016 Form 10-K

PART IIITEM 6. Selected Financial Data
Selected Financial DataThe selected financial data should be read in conjunction with Management’s Discussion and Analysis of Financial Condition and Results ofOperations and the Consolidated Financial Statements and accompanying notes included elsewhere herein.
Highlights
(Dollars in millions, except per share amounts) 2016 2015 2014 2013 2012Total revenues $ 39,668 $ 37,876 $ 34,914 $ 32,380 $ 29,119
Shareholders’ net income $ 1,867 $ 2,094 $ 2,102 $ 1,476 $ 1,623
Net income $ 1,843 $ 2,077 $ 2,094 $ 1,478 $ 1,624
Shareholders’ net income per share:
Basic $ 7.31 $ 8.17 $ 7.97 $ 5.28 $ 5.70
Diluted $ 7.19 $ 8.04 $ 7.83 $ 5.18 $ 5.61
Common dividends declared per share $ 0.04 $ 0.04 $ 0.04 $ 0.04 $ 0.04
Cash and investments $ 30,000 $ 26,681 $ 25,762 $ 25,160 $ 26,638
Total assets $ 59,360 $ 57,088 $ 55,870 $ 54,306 $ 53,700
Long-term debt $ 4,756 $ 5,020 $ 4,979 $ 4,984 $ 4,952
Total liabilities $ 45,575 $ 44,975 $ 44,991 $ 43,629 $ 43,817
Shareholders’ equity $ 13,723 $ 12,035 $ 10,774 $ 10,567 $ 9,769
Employees 41,000 39,300 37,200 36,500 35,800
CIGNA CORPORATION - 2016 Form 10-K 35
ITEM 6.
PART IIITEM 7. Management’s Discussion and Analysis of Financial Condition and Results of Operations
Management’s Discussion and Analysis ofFinancial Condition and Results of Operations
Index
............................................................................................................................................................................................................................36...........................................................................................................................................................................41
..................................................................................................................................................................................43.......................................................................................................................................................................................46
............................................................................................................................................................................................................................49...................................................................................................................................................................................................49
...............................................................................................................................................................................50........................................................................................................................................................................................51
........................................................................................................................................................................................................................52........................................................................................................................................................................................................................................53
...............................................................................................................................................................................................................................53
Management’s Discussion and Analysis of Financial Condition and Results of Operations (‘‘MD&A’’) is intended to provide information to assistyou in better understanding and evaluating our financial condition and results of operations. We encourage you to read this MD&A inconjunction with our Consolidated Financial Statements included in Part II, Item 8 of this Annual Report on Form 10-K (‘‘Form 10-K’’) and the‘‘Risk Factors’’ contained in Part I, Item 1A of this Form 10-K.
Unless otherwise indicated, financial information in the MD&A is presented in accordance with accounting principles generally accepted in theUnited States of America (‘‘GAAP’’). See Note 2 to the Consolidated Financial Statements for additional information regarding the Company’ssignificant accounting policies. In some of our financial tables in this MD&A, we present either percentage changes or ‘‘N/M’’ when thosechanges are so large as to become not meaningful. Changes in percentages are expressed in basis points (‘‘bps’’).
In this MD&A, our consolidated measures ‘‘operating revenues’’ and ‘‘adjusted income from operations’’ are not determined in accordance withGAAP and should not be viewed as substitutes for the most directly comparable GAAP measures ‘‘total revenues’’ and ‘‘shareholders’ netincome.’’
We define operating revenues as total revenues excluding realized investment results. We exclude realized investment results from thismeasure because our portfolio managers may sell investments based on factors largely unrelated to the underlying business purposes of eachsegment. As a result, gains or losses created in this process may not be indicative of past or future underlying performance of our businesses.
We use adjusted income (loss) from operations as our principal financial measure of operating performance because management believes itbest reflects the underlying results of our business operations and permits analysis of trends in underlying revenue, expenses and profitability.We define adjusted income from operations as shareholders’ net income (loss) excluding after-tax realized investment gains and losses, netamortization of other acquired intangible assets and special items. Income or expense amounts are excluded from adjusted income fromoperations for the following reasons:
Realized investment results are excluded because, as noted above, our portfolio managers may sell investments based on factors largelyunrelated to the underlying business purposes of each segment.
Net amortization of other intangible assets is excluded because it relates to costs incurred for acquisitions and, as a result, it does not relate tothe core performance of the Company’s business operations. In 2015, the amortization amount was net of a bargain purchase gain on anacquisition.
Special items are excluded because management believes they are not representative of the underlying results of operations. See Note 22 tothe Consolidated Financial Statements for descriptions of special items.
Cigna Corporation, together with its subsidiaries (either individually or collectively referred to as ‘‘Cigna,’’ the ‘‘Company,’’ ‘‘we,’’ ‘‘our’’ or ‘‘us’’)is a global health services organization dedicated to a mission of helping individuals improve their health, well-being and sense of security. Toexecute on our mission, Cigna’s strategy is to ‘‘Go Deep’’, ‘‘Go Global’’ and ‘‘Go Individual’’ with a differentiated set of medical, dental, disability,life and accident insurance and related products and services offered by our subsidiaries. In addition to these ongoing operations, we also havecertain run-off operations.
For further information on our business and strategy, please see Item 1, ‘‘Business’’ in this Form 10-K.
36 CIGNA CORPORATION - 2016 Form 10-K
ITEM 7.
Executive OverviewConsolidated Results of OperationsLiquidity and Capital ResourcesCritical Accounting EstimatesSegment Reporting
Global Health CareGlobal Supplemental BenefitsGroup Disability and LifeOther OperationsCorporate
Investment Assets
•
•
•
Executive Overview

21FEB201717353548
21FEB201717354322
21FEB201717353404
21FEB201717354143
21FEB201717353727
21FEB201717353136
PART IIITEM 7. Management’s Discussion and Analysis of Financial Condition and Results of Operations
Financial SummarySummarized below are certain key measures of our performance for the years ended December 31:
For the Years Ended Increase IncreaseDecember 31, (Decrease) (Decrease)
(Dollars in millions, except per share amounts) 2016 2015 2014 2016 vs. 2015 2015 vs. 2014
Total revenues (1) $ 39,668 $ 37,876 $ 34,914 5% 8%
Operating revenues (1)
Global Health Care $ 31,199 $ 29,929 $ 27,290 4% 10%Global Supplemental Benefits 3,385 3,149 3,005 7 5Group Disability and Life 4,443 4,271 3,970 4 8Other Operations 472 485 510 (3) (5)Corporate – (15) (15) 100 –
Total operating revenues (1) $ 39,499 $ 37,819 $ 34,760 4% 9%
Shareholders’ net income (1) $ 1,867 $ 2,094 $ 2,102 (11)% –%
Adjusted Income (Loss) From Operations (1)
Global Health Care $ 1,852 $ 1,848 $ 1,752 –% 5%Global Supplemental Benefits 294 262 243 12 8Group Disability and Life 125 324 317 (61) 2Other Operations 70 75 68 (7) 10Corporate (237) (253) (265) 6 5
Total adjusted income from operations (1) $ 2,104 $ 2,256 $ 2,115 (7)% 7%
Earnings per share (diluted):Shareholders’ net income (1) $ 7.19 $ 8.04 $ 7.83 (11)% 3%Adjusted income from operations (1) $ 8.10 $ 8.66 $ 7.87 (6)% 10%
Global medical customers (in thousands) 15,197 14,999 14,456 1% 4%
(1) See Consolidated Results of Operations beginning on page 41 for reconciliations of operating revenues to total revenues and adjusted income from operationsto shareholders’ net income on a dollar and per share basis.
Total revenues in billions (GAAP) (1)
2016 and 2015 both increased, primarily reflecting higher operatingrevenues driven by business growth across the Company as discussedfurther below.
$34.9
$37.9 $39.7
$30.0
$35.0
$40.0
2014 2015 2016
Total operating revenues in billions (non-GAAP) (1)
2016 and 2015 both reflected business growth in each of our ongoingreportable segments. Rate actions for certain products within ourCommercial segment to recover medical cost trend also contributed tothese increases.
$34.8
$37.8 $39.5
$30.0
$35.0
$40.0
2014 2015 2016
Shareholders' net incomeper share (GAAP) (1)
2016 vs. 2015 – Decrease was due to lower adjusted income fromoperations, primarily in the Group Disability and Life segment. Increasedspecial item charges in 2016 (primarily higher merger costs and the 2016risk corridor allowance) also contributed to the decline.
2015 vs. 2014 – The slight increase primarily reflected higher adjustedincome from operations and, to a lesser extent, the impact of sharerepurchase. These favorable effects were partially offset by lower realizedinvestment results and 2015 charges for merger and debt extinguishmentcosts reported as special items.
$7.83 $8.04
$7.19
$6.00
$6.50
$7.00
$7.50
$8.00
$8.50
$9.00
2014 2015 2016
(1) See Consolidated results of operations starting on page 41 for reconciliations of operating revenues to total revenues and adjusted income from operations toshareholders’ net income on a dollar and per share basis.
CIGNA CORPORATION - 2016 Form 10-K 37

21FEB201717353268
21FEB201717353969
21FEB201717352847
21FEB201717352997
PART IIITEM 7. Management’s Discussion and Analysis of Financial Condition and Results of Operations
Total adjusted income from operationsper share (non-GAAP) (1)
2016 vs. 2015 – Decrease was driven by significantly lower earnings inGroup Disability and Life and costs related to the Government segment’sCMS audit response. Increased earnings contributions in GlobalSupplemental Benefits and the Commercial segment partially offset thoseunfavorable impacts.
2015 vs. 2014 – Increase was due to higher earnings in each of our ongoingreportable segments, reflecting continued customer growth in all of ourreportable segments, including improved contributions from our specialtyhealth care businesses. Share repurchase also contributed to the increase.
$7.87
$8.66
$8.10
$6.00
$6.50
$7.00
$7.50
$8.00
$8.50
$9.00
2014 2015 2016
(1) See Consolidated results of operations starting on page 41 for reconciliations of operating revenues to total revenues and adjusted income from operations toshareholders’ net income on a dollar and per share basis.
Global medical customers in thousands
2016 and 2015 both increased, including growth in the middle market,select and international market segments. The 2015 increase also reflectedthe acquisition of QualCare Alliance Networks, Inc. as well as growth in thegovernment market segment.
14,456
14,999
15,197
14,000
14,200
14,400
14,600
14,800
15,000
15,200
15,400
2014 2015 2016
Further discussion of detailed components of revenues and expenses can be found in the ‘‘Consolidated Results of Operations’’ section of thisMD&A beginning on page 41. For further analysis and explanation of individual segment results, see the ‘‘Segment Reporting’’ section of thisMD&A beginning on page 49.
Proposed Merger with Anthem, Inc. (‘‘Anthem’’)On July 23, 2015, we entered into a definitive agreement to merge with Anthem, subject to certain terms, conditions and customary operatingcovenants, with Anthem continuing as the surviving company. At special shareholders’ meetings in December 2015, Cigna shareholdersapproved the merger with Anthem and Anthem shareholders voted to approve the issuance of shares of Anthem common stock according tothe merger agreement. Upon closing, our shareholders would receive $103.40 in cash and 0.5152 of a share of Anthem common stock for eachcommon share of the Company. The closing price of Anthem stock on February 22, 2017 was $163.27.
Consummation of the merger is subject to certain customary conditions, including the receipt of certain necessary governmental andregulatory approvals, and the absence of a legal restraint prohibiting the consummation of the merger. On July 21, 2016, the U.S. Department ofJustice (‘‘DOJ’’) and certain state attorneys general filed a civil antitrust lawsuit in the U.S. District Court for the District of Columbia (the‘‘District Court’’) seeking to block the merger and, on January 4, 2017, the parties concluded the District Court trial. On February 8, 2017, theDistrict Court issued an order enjoining the proposed merger. Anthem appealed this ruling to the U.S. Court of Appeals for the District ofColumbia Circuit (the ‘‘Appeals Court’’). Additionally, Cigna appealed the District Court ruling following the Chancery Court ruling describedbelow.
On February 14, 2017, Cigna delivered a notice to Anthem terminating the merger agreement and filed suit in the Delaware Court of Chancery(the ‘‘Chancery Court’’) seeking, among other things, declaratory judgment that Cigna’s termination of the merger agreement is lawful and thatAnthem does not have the right to extend the merger agreement termination date. Later that day, Anthem filed a lawsuit in the Chancery Courtagainst us seeking, among other things, a temporary restraining order to enjoin Cigna from terminating the merger agreement, specificperformance and damages, and, on February 15, 2017, the Chancery Court issued an order temporarily enjoining us from terminating themerger agreement. This order will be subject to further review at a preliminary injunction hearing.
See Notes 3 and 21 to the Consolidated Financial Statements in this Form 10-K for additional information about the proposed merger. SeeItem 1A. – Risk Factors in this Form 10-K for risks to our business due to the proposed merger.
38 CIGNA CORPORATION - 2016 Form 10-K
Key Transactions
PART IIITEM 7. Management’s Discussion and Analysis of Financial Condition and Results of Operations
The ‘‘Regulation’’ section of this Form 10-K provides a detailed description of The Patient Protection and Affordable Care Act (the ‘‘Health CareReform Act’’ or ‘‘ACA’’) provisions and other legislative initiatives that impact our health care business, including regulations issued by theCenters for Medicare and Medicaid Services (‘‘CMS’’) and the Departments of the Treasury and Health and Human Services (‘‘HHS’’). The tablepresented below provides further details related to the impact of key ACA-related items and certain other regulatory matters affecting ourGlobal Health Care segment.
Item Description
Medicare Advantage (‘‘MA’’) CMS actions: In January 2016, CMS issued a Notice of Imposition of Immediate Intermediate Sanctions (the‘‘Notice’’) to the Company. The Notice required us to suspend certain enrollment and marketing activities forMedicare Advantage-Prescription Drug and Medicare Part D Plans. The sanctions do not impact the right ofcurrent enrollees to remain covered by our Medicare Advantage-Prescription Drug or Medicare Part D Plans.Although we continue to devote resources to our remediation efforts, we expect remediation costs in 2017 tobe significantly lower than 2016. For 2016, costs related to our CMS audit response were approximately$100 million after-tax. See Note 21 to the Consolidated Financial Statements for additional information.
While these matters were not resolved in time to participate in the 2017 Medicare Advantage and Part D annualenrollment period, we continue to work with CMS to address the audit findings and have the sanctions lifted asquickly as possible. We expect to have these sanctions lifted in time to participate in the 2018 annualenrollment period. The impact of disenrollment was not material to 2016 consolidated revenues and earnings. In2017, Medicare enrollment and consolidated revenues will be materially impacted due to our inability toparticipate in 2017 annual enrollment. However, management does not anticipate that 2017 shareholders’ netincome will be materially affected because we expect to offset the margin impact of the revenue loss withseveral factors including significantly lower costs to remediate the sanctions and other operational efficiencies.
On October 12, 2016, CMS announced Medicare Star Quality Ratings (‘‘Star Ratings’’) for 2017 (see Item 1 —Business and Item 1A. — Risk Factors in this Form 10-K for additional discussion of Star Ratings programs).While Star Ratings are based on a number of plan performance measures that are evaluated each year, theprojected Star Ratings for our plans included certain reductions that are primarily attributable to our CMS auditdiscussed above. Under these revised Star Ratings, approximately 20% of our Medicare Advantage customersare expected to be in a 4 Stars or greater plan. We do not believe that these Star Ratings reflect the qualityofferings Cigna-HealthSpring provides to beneficiaries.
We filed a Reconsideration request with CMS, which was denied, and will work fully with CMS through theirprocess as well as consider additional alternatives with the objective that the final Star Ratings more accuratelyreflect our performance under the Star Ratings measures. We remain committed to our partnership with CMSand to delivering quality products and services to seniors, while working to mitigate the impact these StarRatings could have on our offerings in 2018. There is no financial impact in 2016 or 2017 because these ratingsapply to plans for the 2018 payment year. However, if we are unsuccessful in restoring at least some of the StarRatings, the effect in 2018 could be material to shareholders’ net income. The actual impact on earnings in 2018could potentially be offset in part by our ability to restore some or all of our downgraded 2018 Star Ratingmeasures, modify our product offerings and implement operational efficiencies in the government business.
2017 and 2018 MA Rates: Final MA reimbursement rates for 2017 were published by CMS in April 2016.Preliminary MA reimbursement rates for 2018 were published by CMS in February 2017. We do not expect thenew rates to have a material impact on our consolidated results of operations in 2017 and 2018.
Health Care Reform Act Health Insurance Industry Tax: This non-deductible tax is being levied based on a ratio of an insurer’s netTaxes and Fees health insurance premiums written for the previous calendar year compared to the U.S. health insurance
Industry Tax industry total. The industry assessment was $11.3 billion in both 2016 and 2015 and $8 billion in 2014. Werecognized approximately $310 million in operating expenses for both 2016 and 2015 and $240 million in 2014.Because this tax is not deductible for federal income tax purposes, it negatively impacts our effective tax rate.Of the full year 2016 tax, $170 million relates to our Commercial business and $140 million to our Governmentbusiness.
For our Commercial business, we incorporated the industry tax into target pricing actions. For our Medicarebusiness, although we have partially mitigated the effect of the tax through benefit changes and customerpremium increases, the combination of the tax and lower MA rates reduced margins in the Governmentoperating segment in both 2016 and 2015.
In December 2015, federal appropriations legislation imposed a one-year moratorium on the industry tax for2017, with reinstatement expected in 2018. Our target pricing actions related to 2017 and 2018 plan years willconsider the impacts of this legislation. The moratorium in 2017 is expected to lower our effective tax rate.
Reinsurance Fee Reinsurance Fee: This fee, applicable only for 2014-2016, was a fixed dollar per customer levy that applied toboth insured and self-insured major medical plans excluding certain products such as Medicare Advantage andMedicare Part D. Proceeds from the fee were used to fund the reinsurance program for non-grandfatheredindividual business sold either on or off the public exchanges. For our insured business, the amount of thetax-deductible fee was approximately $45 million in 2016, $70 million in 2015 and $110 million in 2014. Thedeclines from 2014 to 2016 reflect annual per-customer levies of $27 in 2016, $44 in 2015 and $63 in 2014.
Public Health Exchanges Public Health Exchanges: For 2016, we offered individual coverage on seven public health insurance exchangesin the following states: Arizona, Colorado, Georgia, Maryland, Missouri, Tennessee and Texas. For 2017, we areoffering individual coverage on seven public health insurance exchanges in the following states: Colorado,Illinois, Maryland, Missouri, North Carolina, Tennessee and Virginia.
CIGNA CORPORATION - 2016 Form 10-K 39
Health Care Industry Developments And Other Matters Affecting Our Global HealthCare Segment
•
•

PART IIITEM 7. Management’s Discussion and Analysis of Financial Condition and Results of Operations
See Note 2 (K) to the Consolidated Financial Statements for a description of and our accounting policy for these programs that commenced in2014.
The following table presents the after-tax benefits to shareholders’ net income from these programs for the years ended December 31, 2016,2015 and 2014 and our net receivable balances as of December 31, 2016 and 2015.
Net Receivable Balance (2) After-tax Impact on Shareholders’ Net IncomeAs of December 31, For the Years Ended December 31,
(In millions) 2016 2015 2016 2015 2014
Risk Corridor (1)
Risk corridor (gross) $ 124 $ 134 $ (6) $ 49 $ 40Risk corridor allowance (124) – (80) – –
Net risk corridor – 134 (86) 49 40Reinsurance 63 158 30 125 109Risk adjustment 1 118 25 92 49
Total $ 64 $ 410 $ (31) $ 266 $ 198
(1) Starting in fourth quarter 2016, we did not record amounts due to us under the risk corridor program and recorded an allowance for previously due amounts. See discussion below.
(2) For the reinsurance program, receivables are reported in reinsurance recoverables. Receivables, net of allowances, for the risk adjustment and risk corridor programs are reported inpremiums, accounts and notes receivable. Payables for the risk adjustment program as of December 31, 2016 of $51 million are netted in the receivable balance presented above, but arereported in accounts payable, accrued expenses and other liabilities in the Consolidated Balance Sheets.
As of September 30, 2016, the Company’s risk corridor receivable was $124 million pre-tax. An unfavorable court decision was issued duringthe fourth quarter rejecting another insurer’s statutory, contractual and constitutional claims for payment of risk corridor receivables (Land ofLincoln Mutual Health Insurance Company v. United States). Based on this decision, as well as the large risk corridor program deficit, underapplicable accounting rules, the Company determined it was required to establish an allowance for all of the $124 million of receivablesassociated with the risk corridor program. In addition, the Company was unable to recognize $25 million pre-tax income for incremental fourthquarter risk corridor receivables. This court case is under appeal and notwithstanding the accounting reflected, management continues tobelieve that the government has a binding obligation to satisfy the risk corridor receivable. We expect full payment of the remainingreinsurance and risk adjustment receivables.
40 CIGNA CORPORATION - 2016 Form 10-K
Risk Mitigation Programs

PART IIITEM 7. Management’s Discussion and Analysis of Financial Condition and Results of Operations
Financial SummarySummarized below are our results of operations on a GAAP basis.
For the Years Ended Increase IncreaseDecember 31, (Decrease) (Decrease)
(In millions) 2016 2015 2014 2016 vs. 2015 2015 vs. 2014
Premiums $ 30,626 $ 29,642 $ 27,214 $ 984 3% $ 2,428 9%Fees and other revenues 4,760 4,488 4,141 272 6 347 8Net investment income 1,147 1,153 1,166 (6) (1) (13) (1)Mail order pharmacy revenues 2,966 2,536 2,239 430 17 297 13
Operating revenues 39,499 37,819 34,760 1,680 4 3,059 9Net realized investment gains 169 57 154 112 196 (97) (63)
Total revenues 39,668 37,876 34,914 1,792 5 2,962 8
Global Health Care medical costs 19,009 18,354 16,694 655 4 1,660 10Other benefit expenses 5,477 4,936 4,640 541 11 296 6Mail order pharmacy costs 2,468 2,134 1,907 334 16 227 12Other operating expenses 9,584 8,982 8,174 602 7 808 10Amortization of other acquired intangible assets, net 151 143 195 8 6 (52) (27)
Benefits and expenses 36,689 34,549 31,610 2,140 6 2,939 9
Income before income taxes 2,979 3,327 3,304 (348) (10) 23 1Income taxes 1,136 1,250 1,210 (114) (9) 40 3
Net income 1,843 2,077 2,094 (234) (11) (17) (1)Less: net (loss) attributable to noncontrolling interests (24) (17) (8) (7) (41) (9) (113)
Shareholders’ net income $ 1,867 $ 2,094 $ 2,102 $ (227) (11)% $ (8) –%
A reconciliation of shareholders’ net income to adjusted income from operations follows:
For the Years Ended Increase IncreaseDecember 31, (Decrease) (Decrease)
(In millions) 2016 2015 2014 2016 vs. 2015 2015 vs. 2014
Shareholders’ net income $ 1,867 $ 2,094 $ 2,102 $ (227) (11)% $ (8) –%After-tax adjustments required to reconcile to adjusted income from operations:
– Net realized investment (gains) (109) (40) (106) (69) 66– Amortization of other acquired intangible assets, net 94 80 119 14 (39)
Special items:– Risk corridor allowance (See Note 22 to the Consolidated Financial Statements) 80 – – 80 –– Merger-related transaction costs (See Note 3 to the Consolidated Financial
Statements) 147 57 – 90 57– Charges associated with litigation matters discussed in Note 21 to the
Consolidated Financial Statements 25 – – 25 –– Debt extinguishment costs (See Note 5 to the Consolidated Financial
Statements) – 65 – (65) 65
Adjusted income from operations $ 2,104 $ 2,256 $ 2,115 $ (152) (7)% $ 141 7%
Change ChangeFor the Years Ended Favorable Favorable
December 31, (Unfavorable) (Unfavorable)Other Key Consolidated Financial Data 2016 2015 2014 2016 vs. 2015 2015 vs. 2014
Earnings per share (diluted):Shareholders’ net income $ 7.19 $ 8.04 $ 7.83 $ (0.85) (11)% $ 0.21 3%Per share impact of after-tax adjustments to shareholders’ net incomeNet realized investment (gains) (0.42) (0.15) (0.40) (0.27) 0.25Amortization of other acquired intangible assets, net 0.36 0.30 0.44 0.06 (0.14)Special items – see Note 22 for details 0.97 0.47 – 0.50 0.47
Adjusted income from operations $ 8.10 $ 8.66 $ 7.87 $ (0.56) (6)% $ 0.79 10%
Effective tax rate 38.1% 37.6% 36.6% (50) bps (100) bps
CIGNA CORPORATION - 2016 Form 10-K 41
Consolidated Results of Operations

PART IIITEM 7. Management’s Discussion and Analysis of Financial Condition and Results of Operations
Revenues. The components of revenue changes are discussed further below:
Premiums. The increases in both 2016 and 2015, compared with each prior year, reflected premium growth in each of our ongoingreporting segments: Global Health Care, Global Supplemental Benefits and Group Disability and Life. These results were primarilyattributable to customer growth in our targeted market segments within Global Health Care, as well as growth in GlobalSupplemental Benefits and Group Disability and Life. Rate actions in our commercial health care businesses consistent with medicalcost trend also contributed to these increases.
Fees and other revenues. The increases in both 2016 and 2015, compared with each prior year, largely reflected growth fromspecialty products offered through our Global Health Care segment and an increased customer base for our administrative servicesonly business.
Net investment income decreased slightly in both 2016 and 2015, compared with each prior year, as lower investment yields in thecontinued low interest rate environment were partially offset by higher average invested assets. Unfavorable foreign currency effectsalso contributed to these declines.
Mail order pharmacy revenues increased in both 2016 and 2015, compared with each prior year, driven by greater volume, primarilyfor specialty medications (e.g., certain injectables) due to our higher customer base and increased utilization.
Realized investment results increased in 2016 compared with 2015 due to significantly lower impairment losses. In 2015, realizedinvestment results decreased compared with 2014, primarily due to higher impairment losses on certain externally managed fixedmaturities, particularly within the energy sector. These impairments were driven by increased market yields. See Note 11 to theConsolidated Financial Statements for additional information.
Global Health Care medical costs. The increase in 2016 compared with 2015 resulted primarily from medical cost trend and customer growthin our commercial health care businesses. The 2015 increase compared with 2014 was primarily due to customer growth in our governmentbusiness and, to a lesser extent, medical cost trend.
Other benefit expenses. The increase in 2016 compared with 2015 was driven by unfavorable disability and life claim experience dueprimarily to changes in the disability claims management process in 2016 and elevated life claims during the second quarter of 2016. Businessgrowth in our Group Disability and Life and Global Supplemental Benefits segments also contributed to the increase. In 2015, the increasecompared with 2014 primarily reflected business growth in our Group Disability and Life and Global Supplemental Benefits segments.
Mail order pharmacy costs. The increases in both 2016 and 2015 compared with each prior year were primarily due to increased volume,primarily for specialty medications (e.g., certain injectables) due to our higher customer base and increased utilization. In 2015, higher unitcosts also contributed to the increase.
Other operating expenses. The increases in both 2016 and 2015 compared with each prior year were due to business growth, strategicinvestment across our segments and special items described in Note 22 to the Consolidated Financial Statements. In 2016, the increase alsoreflected costs associated with our CMS audit response as discussed in the Executive Overview section of this MD&A beginning on page 36.
Amortization of other acquired intangible assets, net. The increase in 2016 compared with 2015 was driven by the absence of the $23 millionbargain purchase gain recorded in 2015 for an acquisition. This factor was partially offset by the expected continuing decline in amortizationfrom our 2012 acquisition of HealthSpring, Inc. The decrease in 2015 compared with 2014 reflects the impact of both the $23 million bargainpurchase gain and the decline in HealthSpring amortization.
Special items. Special item charges were higher in 2016 compared with 2015 primarily due to higher merger costs and the 2016 risk corridorallowance. Special items charges were higher in 2015 compared with 2014 due to merger costs and losses on the early extinguishment of debtin 2015 and the absence of special items in 2014. See Note 22 to the Consolidated Financial Statements for additional details about specialitems.
Consolidated effective tax rate. The increase in our effective tax rate in 2016 compared with 2015 was largely driven by an increase in certainmerger-related transaction costs reported in 2016 that are not tax deductible, partially offset by the tax benefits associated with adoptingAccounting Standard Update (‘‘ASU’’) 2016-09 as discussed in Note 2 to the Consolidated Financial Statements. The increase in theconsolidated effective tax rate in 2015 was primarily driven by merger-related transaction costs in 2015 and the non-deductible healthinsurance industry tax assessed under the Health Care Reform Act. This tax was first assessed in 2014 and increased in 2015. See Note 20 tothe Consolidated Financial Statements for additional information about income taxes.
We expect our effective tax rate to decline in 2017 as a result of the moratorium on the health insurance industry tax.
42 CIGNA CORPORATION - 2016 Form 10-K
Consolidated Results of Operations: 2016 Compared to 2015 and 2015 Comparedto 2014•
•
•
•
•
•
•
•
•
•
•
•
•

PART IIITEM 7. Management’s Discussion and Analysis of Financial Condition and Results of Operations
Liquidity And Capital Resources
Financial Summary(In millions) 2016 2015 2014
Short-term investments $ 691 $ 381 $ 163Cash and cash equivalents $ 3,185 $ 1,968 $ 1,420Short-term debt $ 276 $ 149 $ 147Long-term debt $ 4,756 $ 5,020 $ 4,979Shareholders’ equity $ 13,723 $ 12,035 $ 10,774
Consolidated short-term investments increased in both 2016 and 2015 as a result of investing excess cash balances at the parent company level.
We maintain liquidity at two levels: the subsidiary level and the parent company level.
Liquidity requirements at the subsidiary level generally consist of:• medical costs and benefit payments to policyholders;• expense requirements, primarily for employee compensation and benefits, information technology and facilities costs; and• income taxes.
Our subsidiaries normally meet their operating requirements by:• maintaining appropriate levels of cash, cash equivalents and short-term investments;• using cash flows from operating activities;• matching investment durations to those estimated for the related insurance and contractholder liabilities;• selling investments; and• borrowing from affiliates, subject to applicable regulatory limits.
Liquidity requirements at the parent company level generally consist of:• debt service and dividend payments to shareholders;• pension plan funding; and• repurchases of common stock.
The parent company normally meets its liquidity requirements by:• maintaining appropriate levels of cash and various types of marketable investments;• collecting dividends from its subsidiaries;• using proceeds from issuance of debt and equity securities; and• borrowing from its subsidiaries.
Cash flows for the years ended December 31, were as follows:
(In millions) 2016 2015 2014
Net cash provided by operating activities (1)(2) $ 4,026 $ 2,933 $ 2,158Net cash (used in) investing activities (2) $ (2,574) $ (1,736) $ (1,866)Net cash (used in) financing activities (1) $ (225) $ (609) $ (1,635)
(1) As required in adopting ASU 2016-09, we retrospectively reclassified $79 million in 2015 and $53 million in 2014 of cash payments from operating to financing activities. These paymentswere related to employee tax obligations associated with stock compensation. The comparable amount reported in financing activities in 2016 was $72 million. See Note 2 to theConsolidated Financial Statements for further discussion.
(2) As required in adopting ASU 2016-15, the Company retrospectively reclassified from investing to operating activities $137 million in 2015 and $111 million in 2014 of cash distributions frompartnership earnings. The comparable amount reported in operating activities in 2016 was $144 million. See Note 2 to the Consolidated Financial Statements for further discussion.
Cash flows from operating activities consist of cash receipts and disbursements for premiums and fees, mail order pharmacy, other revenues,investment income, taxes, benefits and expenses. Because certain income and expense transactions do not generate cash, and because cashtransactions related to revenues and expenses may occur in periods different from when those revenues and expenses are recognized inshareholders’ net income, cash flows from operating activities can be significantly different from shareholders’ net income.
Cash flows from investing activities generally consist of net investment purchases or sales and net purchases of property and equipmentincluding capitalized software, as well as cash used to acquire businesses.
Cash flows from financing activities are generally comprised of issuances and re-payment of debt at the parent company level, proceeds on theissuance of common stock resulting from stock option exercises, and stock repurchases. In addition, the subsidiaries report deposits to andwithdrawals from investment contract liabilities (including universal life insurance liabilities) because such liabilities are considered financingactivities with policyholders.
Cash flows from operating activities increased in 2016 compared with 2015 due to higher receipts from Medicare Part D and MedicareAdvantage programs.
Cash flows from operating activities increased in 2015 compared with 2014 primarily driven by the volume and timing of governmentreimbursements and pharmacy considerations.
CIGNA CORPORATION - 2016 Form 10-K 43
Liquidity
Operating activities
PART IIITEM 7. Management’s Discussion and Analysis of Financial Condition and Results of Operations
Cash used in investing activities increased in 2016 compared with 2015, due to higher purchases of fixed maturity investments. Net cash used ininvesting activities decreased in 2015 compared with 2014 due to lower net purchases of fixed maturities.
Cash used in financing activities decreased in 2016 compared with 2015, primarily due to lower share repurchases offset by lower proceedsfrom employees’ exercise of stock options. Cash used in financing activities decreased in 2015 compared with the same period in 2014,primarily reflecting lower share repurchases.
We maintain a share repurchase program, authorized by our Board of Directors. Under this program, we may repurchase shares from time totime, depending on market conditions and alternate uses of capital. The timing and actual number of shares repurchased will depend on avariety of factors, including price, general business and market conditions, and alternate uses of capital. The share repurchase program may beeffected through open market purchases or privately negotiated transactions in compliance with Rule 10b-18 under the Securities ExchangeAct of 1934, as amended, including through Rule 10b5-1 trading plans. The program may be suspended or discontinued at any time.
In 2016, we repurchased 0.8 million shares for $110 million. In February 2017, the Board of Directors increased repurchase authority to$3.7 billion, however management has determined that it is prudent to cap the amount of repurchase to $250 million per quarter until there ismore clarity with respect to the litigation with Anthem. From January 1, 2017 through February 22, 2017 we repurchased 0.7 million shares for$106 million. The total remaining share repurchase authorization as of February 22, 2017 was $3.7 billion. We repurchased 5.5 million shares for$683 million in 2015 and 18.5 million shares for $1.6 billion in 2014.
Interest expense on long-term debt, short-term debt and capital leases was as follows:
(In millions) 2016 2015 2014
Interest expense $ 251 $ 252 $ 265
Interest expense reported above for the year ended 2015 excluded losses on the early extinguishment of debt.
The weighted average interest rate for outstanding short-term debt (primarily commercial paper) was 0.69% at December 31, 2015. There wasno commercial paper outstanding as of December 31, 2016.
Our capital resources (primarily retained earnings and proceeds from the issuance of debt and equity securities) provide protection forpolicyholders, furnish the financial strength to underwrite insurance risks and facilitate continued business growth.
Management, guided by regulatory requirements and rating agency capital guidelines, determines the amount of capital resources that wemaintain. Management allocates resources to new long-term business commitments when returns, considering the risks, look promising andwhen the resources available to support existing business are adequate.
We prioritize our use of capital resources to:
provide the capital necessary to support growth and maintain or improve the financial strength ratings of subsidiaries and to fund pensionobligations;
consider acquisitions that are strategically and economically advantageous; and
return capital to investors through share repurchase.
See Note 3 to the Consolidated Financial Statements for information regarding capital restrictions imposed by our merger agreement withAnthem. The availability of capital resources will be impacted by equity and credit market conditions. Extreme volatility in credit or equitymarket conditions may reduce our ability to issue debt or equity securities.
At December 31, 2016, there was approximately $2.8 billion in cash and marketable investments available at the parent company level. In 2017,the parent company’s combined cash obligations are expected to approximate $660 million for repayment of debt, interest, pensioncontributions and dividends.
We expect, based on the parent company’s current cash position and current projections for subsidiary dividends, to have sufficient liquidity tomeet the obligations discussed above.
Our cash projections may not be realized and the demand for funds could exceed available cash if our ongoing businesses experienceunexpected shortfalls in earnings, or we experience material adverse effects from one or more risks or uncertainties described more fully in theRisk Factors section of this Form 10-K. In those cases, we expect to have the flexibility to satisfy liquidity needs through a variety of measures,including intercompany borrowings and sales of liquid investments. The parent company may borrow up to $1.3 billion from its insurancesubsidiaries without additional state approval. As of December 31, 2016, the parent company had $277 million of net intercompany loans
44 CIGNA CORPORATION - 2016 Form 10-K
Investing activities
Financing activities
Share repurchase
Interest Expense
Capital Resources
•
•
•
Liquidity and Capital Resources Outlook

PART IIITEM 7. Management’s Discussion and Analysis of Financial Condition and Results of Operations
payable to its insurance subsidiaries. Alternatively, to satisfy parent company liquidity requirements we may use short-term borrowings, suchas the commercial paper program, the committed revolving credit and letter of credit agreement of up to $1.5 billion subject to the maximumdebt leverage covenant in its line of credit agreement. As of December 31, 2016, $1.5 billion of short-term borrowing capacity under the creditagreement was available to us. Within the maximum debt leverage covenant in the line of credit agreement as described in Note 5 to theConsolidated Financial Statements, we have $9.7 billion of borrowing capacity in addition to the $5 billion of debt outstanding. This additionalborrowing capacity includes the $1.5 billion available under the credit agreement.
Though we believe we have adequate sources of liquidity, significant disruption or volatility in the capital and credit markets could affect ourability to access those markets for additional borrowings or increase costs associated with borrowing funds.
We maintain a capital management strategy to retain overseas a significant portion of the earnings from our foreign operations. As ofDecember 31, 2016, undistributed earnings were approximately $2.5 billion. These undistributed earnings are deployed outside of the U.S.predominantly in support of the liquidity and regulatory capital requirements of our foreign operations. Approximately $305 million of cashand cash equivalents held overseas would be subject to additional tax expense representing the difference between the U.S. and foreign taxrates, if repatriated. We continue to expect most of the undistributed earnings and future earnings to be reinvested to support growthinitiatives overseas. This strategy does not materially limit our ability to meet our liquidity and capital needs in the U.S.
Unfunded Pension Plan Liability. As of December 31, 2016, our unfunded pension liability was $911 million, reflecting a decrease of $42 millionfrom December 31, 2015. The decrease in the unfunded liability reflected strong asset returns in line with our expectations and changes to ourmortality assumptions based on an updated pension mortality improvement scale published in the fourth quarter of 2016. These factors werepartially offset by a decrease of approximately 20 basis points in the weighted average assumed discount rate. In February 2017, we made avoluntary pension contribution of $150 million. We do not expect to make any additional pension contributions for the remainder of 2017, asthere are no contributions required under the Pension Protection Act of 2006. See Note 15 to the Consolidated Financial Statements foradditional information regarding our pension plans.
Solvency II. Beginning in 2016, our businesses in the European Union became subject to the directive on insurance regulation, solvency andgovernance requirements known as Solvency II. This directive imposes economic risk-based solvency and governance requirements andsupervisory rules. Our European insurance companies are capitalized at levels consistent with projected Solvency II requirements and incompliance with anticipated governance and technical capability requirements.
We are contingently liable for various contractual obligations entered into in the ordinary course of business. The maturities of our primarycontractual cash obligations, as of December 31, 2016, are estimated to be as follows:
Less than After(In millions, on an undiscounted basis) Total 1 year 1-3 years 4-5 years 5 years
On-Balance Sheet:Insurance liabilities:
Contractholder deposit funds $ 6,680 $ 786 $ 1,006 $ 807 $ 4,081Future policy benefits 11,319 553 1,390 1,163 8,213Global Health Care medical costs payable 2,554 2,458 39 12 45Unpaid claims and claim expenses 5,354 1,678 1,035 695 1,946
Short-term debt 276 276 – – –Long-term debt 7,886 247 617 1,350 5,672Other long-term liabilities 879 306 116 88 369Off-Balance Sheet:Purchase obligations 1,443 542 573 230 98Operating leases 661 135 215 147 164
Total $ 37,052 $ 6,981 $ 4,991 $ 4,492 $ 20,588
Insurance liabilities. Contractual cash obligations for insurance liabilities, excluding unearned premiums, represent estimated net benefitpayments for health, life and disability insurance policies and annuity contracts. Recorded contractholder deposit funds reflect current fundbalances primarily from universal life insurance customers. Contractual cash obligations for these universal life contracts are estimated byprojecting future payments using assumptions for lapse, withdrawal and mortality. These projected future payments include estimated futureinterest crediting on current fund balances based on current investment yields less the estimated cost of insurance charges and mortality andadministrative fees. Actual obligations in any single year will vary based on actual morbidity, mortality, lapse, withdrawal, investment andpremium experience. The sum of the obligations presented above exceeds the corresponding insurance and contractholder liabilities of$21 billion recorded on the balance sheet because the recorded insurance liabilities reflect discounting for interest and the recordedcontractholder liabilities exclude future interest crediting, charges and fees. We manage our investment portfolios to generate cash flowsneeded to satisfy contractual obligations. Any shortfall from expected investment yields could result in increases to recorded reserves andadversely impact results of operations. The amounts associated with the sold retirement benefits and individual life insurance and annuitybusinesses, as well as the reinsured workers’ compensation, personal accident and supplemental benefits businesses, are excluded from thetable above as their related net cash flows associated with them are not expected to impact our cash flows. The total amount of thesereinsured reserves excluded is approximately $5 billion. The expected future cash flows for guaranteed minimum death benefit (‘‘GMDB’’) andguaranteed minimum income benefit (‘‘GMIB’’) contracts included in the table above (within future policy benefits and other long-termliabilities) do not consider any of the related reinsurance arrangements.
Short-term debt represents current maturities of long-term debt, and current obligations under capital leases.
CIGNA CORPORATION - 2016 Form 10-K 45
Guarantees and Contractual Obligations
On balance sheet:•
•

PART IIITEM 7. Management’s Discussion and Analysis of Financial Condition and Results of Operations
Long-term debt includes scheduled interest payments. Capital leases are included in long-term debt and primarily represent obligations forIT network storage, servers and equipment.
Other long-term liabilities. This table includes estimated payments for GMIB contracts, pension and other postretirement andpostemployment benefit obligations, supplemental and deferred compensation plans, interest rate and foreign currency swap contracts, andreinsurance liabilities. These items are presented in accounts payable, accrued expenses and other liabilities in our Consolidated BalanceSheets.
Estimated payments of $75 million for deferred compensation, qualified, non-qualified and international pension plans and otherpostretirement and postemployment benefit plans are expected to be paid in less than one year, including a voluntary contribution to thequalified pension plan of $150 million made in February 2017. We do not expect to make any additional contributions to the qualified domesticpension plans during 2017. We expect to make payments subsequent to 2017 for these obligations, however subsequent payments have beenexcluded from the table as their timing is based on plan assumptions that may materially differ from actual activities. See Note 15 to theConsolidated Financial Statements for further information on pension and other postretirement benefit obligations.
Purchase obligations. As of December 31, 2016, purchase obligations consisted of estimated payments required under contractualarrangements for future services and investment commitments as follows:
(In millions)
Fixed maturities $ 26Commercial mortgage loans 69Limited liability entities (other long-term investments) 1,073
Total investment commitments 1,168Future service commitments 275
Total purchase obligations $ 1,443
See Note 11 to the Consolidated Financial Statements for additional information.
Our estimated future service commitments primarily represent contracts for certain outsourced business processes and IT maintenance andsupport. We generally have the ability to terminate these agreements, but do not anticipate doing so at this time. Purchase obligations excludecontracts that are cancelable without penalty and those that do not contractually require minimum levels of goods or services to be purchased.
Operating leases. For additional information, see Note 18 to the Consolidated Financial Statements.
We are contingently liable for various financial and other guarantees provided in the ordinary course of business. See Note 21 to theConsolidated Financial Statements for additional information on guarantees.
Critical Accounting EstimatesThe preparation of Consolidated Financial Statements in accordance with GAAP requires management to make estimates and assumptionsthat affect reported amounts and related disclosures in the Consolidated Financial Statements. Management considers an accounting estimateto be critical if:
it requires assumptions to be made that were uncertain at the time the estimate was made; and
changes in the estimate or different estimates that could have been selected could have a material effect on our consolidated results ofoperations or financial condition.
Management has discussed the development and selection of its critical accounting estimates with the Audit Committee of our Board ofDirectors and the Audit Committee has reviewed the disclosures presented below.
In addition to the estimates presented in the following table, there are other accounting estimates used in the preparation of our ConsolidatedFinancial Statements, including estimates of liabilities for future policy benefits, as well as estimates with respect to postemployment andpostretirement benefits other than pensions, certain compensation accruals, and income taxes.
Management believes the current assumptions used to estimate amounts reflected in our Consolidated Financial Statements are appropriate.However, if actual experience differs from the assumptions used in estimating amounts reflected in our Consolidated Financial Statements, theresulting changes could have a material adverse effect on our consolidated results of operations and, in certain situations, could have a materialadverse effect on our liquidity and financial condition. The table below presents the adverse impacts of certain changes in assumptions. Exceptas noted, the effect of an assumption change in the opposite direction would be a positive impact to our consolidated results of operations,liquidity or financial condition.
46 CIGNA CORPORATION - 2016 Form 10-K
•
•
Off-Balance Sheet:
Guarantees
•
•

PART IIITEM 7. Management’s Discussion and Analysis of Financial Condition and Results of Operations
See Note 2 to the Consolidated Financial Statements for further information on significant accounting policies.
Balance Sheet Caption / Nature of Critical Accounting Estimate Effect if Different Assumptions Used
Goodwill
At the acquisition date, goodwill represents the excess of the cost of businesses If we do not achieve our earnings objectives or the cost of capital risesacquired over the fair value of their net assets. significantly, the assumptions and estimates underlying these impairment
evaluations could be adversely affected and result in future impairmentWe completed our annual evaluations of goodwill for impairment during the charges that would negatively impact our operating results.third quarter of 2016. These evaluations were performed at the reporting unitlevel, based on discounted cash flow analyses and market data. The evaluations Based on our most recent evaluations, the fair value estimates of our reportingindicated that no impairment was required. During the fourth quarter, we units exceed their carrying values by adequate margins.updated our analysis of the Government reporting unit, reflecting an increase in
Changes in the funding for our Medicare programs by the federal government,market interest rates. The updated analysis for the Government reporting unitor our inability to resolve the matters arising from the CMS Notice in a timelycontinued to indicate that no impairment was required.and satisfactory manner, could materially reduce revenues and profitability in
Fair value of a reporting unit was estimated using models and assumptions that our Government reporting unit and have a significant impact on its fair value.we believe a hypothetical market participant would use to determine a currenttransaction price. The significant assumptions and estimates used indetermining fair value include the discount rate and future cash flows. A rangeof discount rates was used, corresponding with the reporting unit’s weightedaverage cost of capital, consistent with that used for investment decisionsconsidering the specific and detailed operating plans and strategies within thereporting unit. Projections of future cash flows were consistent with our annualplanning process for revenues, claims, operating expenses, taxes, capital levelsand long-term growth rates. In addition to these assumptions, we consideredmarket data to evaluate the fair value of each reporting unit.
In our Government operating segment (which is a reporting unit) we contractwith CMS and various state governmental agencies to provide managed healthcare services, including Medicare Advantage plans and Medicare-approvedprescription drug plans. Estimated future cash flows for this businessincorporated the potential effects of Medicare Advantage reimbursement ratesfor 2017 and beyond as discussed in the ‘‘Executive Overview’’ section of thisMD&A. Revenues from the Medicare programs are dependent, in whole or inpart, upon annual funding from the federal government through CMS. Thisevaluation also considered management’s assessment of the impact of theCMS sanctions and updated Star Ratings discussed in Note 21 to theConsolidated Financial Statements. Funding for these programs is dependenton many factors including general economic conditions, continuinggovernment efforts to contain health care costs and budgetary constraints atthe federal level and general political issues and priorities.
Goodwill as of December 31 was as follows (in millions):
2016 – $5,980
2015 – $6,019
See Note 17 to the Consolidated Financial Statements for additional discussionof our goodwill.
Accounts payable, accrued expenses and other liabilities – pension liabilities
These liabilities are estimates of the present value of the qualified and The discount rate is typically the most significant assumption in measuring thenonqualified pension benefits to be paid (attributed to employee service to pension liability. We develop the discount rate by applying actual annualizeddate) net of the fair value of plan assets. The accrued pension benefit liability as yields at various durations from a discount rate curve constructed from highof December 31 was as follows (in millions): quality corporate bonds.
2016 – $911If discount rates for the qualified and nonqualified pension plans decreased by
2015 – $953 50 basis points, the accrued pension benefit liability would increase byapproximately $195 million as of December 31, 2016 resulting in an after-tax
See Note 15 to the Consolidated Financial Statements for assumptions and decrease to shareholders’ equity of approximately $125 million.methods used to estimate pension liabilities.
If the December 31, 2016 fair values of domestic qualified plan assets decreasedby 10%, the accrued pension benefit liability would increase by approximately$395 million as of December 31, 2016 resulting in an after-tax decrease toshareholders’ equity of approximately $255 million.
CIGNA CORPORATION - 2016 Form 10-K 47
•
•
•
•

PART IIITEM 7. Management’s Discussion and Analysis of Financial Condition and Results of Operations
Balance Sheet Caption / Nature of Critical Accounting Estimate Effect if Different Assumptions Used
Global Health Care medical costs payable
Medical costs payable for the Global Health Care segment include both As described in Note 7, Global Health Care medical costs payable are primarilyreported claims and estimates for losses incurred but not yet reported. impacted by assumptions related to completion factors and medical cost trend.
Changes in either assumption from actual results could impact the GlobalLiabilities for medical costs payable as of December 31 were as follows (in Health Care medical costs payable balance as noted below. A large number ofmillions): factors may cause the medical cost trend to vary from the Company’s
estimates, including: changes in medical management practices, changes in the2016 – gross $2,532; net $2,257level and mix of benefits offered and services utilized, and changes in medicalpractices. Completion factors may be affected if actual claims submission rates2015 – gross $2,355; net $2,112from providers differ from estimates (that can be influenced by a number of
These liabilities are presented above both gross and net of reinsurance and factors, including provider mix, and electronic versus manual submissions), or ifother recoverables and generally exclude amounts for administrative services changes to the Company’s internal claims processing patterns occur. Based ononly business. studies of our claim experience, it is reasonably possible that a 100 basis point
change in the medical cost trend and a 50 basis point change in completionSee Note 7 to the Consolidated Financial Statements for additional information factors could occur in the near term.regarding assumptions and methods used to estimate this liability.
A 100 basis point increase in the medical cost trend rate would increase thisliability by approximately $30 million, resulting in a decrease in net income ofapproximately $20 million after-tax, and a 50 basis point decrease incompletion factors would increase this liability by approximately $70 million,resulting in a decrease in net income of approximately $45 million after-tax.
Unpaid claims and claim expenses – long-term disability reserves
The liability for long-term disability reserves is the present value of estimated As described in Note 8, key assumptions in the calculation of long-termfuture benefits payments over the expected disability period and includes disability reserves include the discount rate and claim resolution rates, both ofestimates for both reported claims and for claims incurred but not yet reported. which are reviewed annually and updated when experience or future
expectations would indicate a necessary change. Based on recent andLong-term disability reserves as of December 31 were as follows (in millions): historical resolution rate patterns and changes in investment portfolio yields, it
is reasonably possible that a 5 percent change in claim resolution rates and a 252016 – gross $3,708; net $3,622basis point change in the discount rate could occur.
2015 – gross $3,481; net $3,403The discount rate is the interest rate used to discount the projected futurebenefit payments to their present value. The discount rate assumption is basedSee Note 8 to the Consolidated Financial Statements for additional informationon the projected investment yield of the assets supporting the reserves. A 25regarding assumptions and methods used to estimate this liability.basis point decrease in the discount rate would increase long-term disabilityreserves by approximately $45 million and decrease net income byapproximately $30 million after-tax.
Claim resolution rate assumptions involve many factors including claimantdemographics, the type of contractual benefit provided and the time sinceinitially becoming disabled. The Company uses its own historical experience todevelop its claim resolution rates. A 5 percent decrease in the claim resolutionrate would increase long-term disability reserves by approximately $90 millionand decrease net income by approximately $60 million after-tax.
Valuation of fixed maturity investments
Most fixed maturities are classified as available for sale and are carried at fair Typically, the most significant input in the measurement of fair value is thevalue with changes in fair value recorded in accumulated other comprehensive market interest rate used to discount the estimated future cash flows of theincome (loss) within shareholders’ equity. instrument. Such market rates are derived by calculating the appropriate
spreads over comparable U.S. Treasury securities, based on the credit quality,Fair value is defined as the price at which an asset could be exchanged in an industry and structure of the asset.orderly transaction between market participants at the balance sheet date.
If the interest rates used to calculate fair value increased by 100 basis points,Determining fair value for a financial instrument requires management the fair value of the total fixed maturity portfolio of $21 billion would decreasejudgment. The degree of judgment involved generally correlates to the level of by approximately $1.2 billion, resulting in an after-tax decrease to shareholders’pricing readily observable in the markets. Financial instruments with quoted equity of approximately $0.8 billion.prices in active markets or with market observable inputs to determine fairvalue, such as public securities, generally require less judgment. Conversely,private placements including more complex securities that are tradedinfrequently are typically measured using pricing models that require morejudgment as to the inputs and assumptions used to estimate fair value. Theremay be a number of alternative inputs to select based on an understanding ofthe issuer, the structure of the security and overall market conditions. Inaddition, these factors are inherently variable in nature as they changefrequently in response to market conditions. Approximately two-thirds of ourfixed maturities are public securities, and one-third are private placementsecurities.
See Note 10 to the Consolidated Financial Statements for a discussion of ourfair value measurements and the procedures performed by management todetermine that the amounts represent appropriate estimates.
48 CIGNA CORPORATION - 2016 Form 10-K
•
•
•
•

PART IIITEM 7. Management’s Discussion and Analysis of Financial Condition and Results of Operations
Balance Sheet Caption / Nature of Critical Accounting Estimate Effect if Different Assumptions Used
Assessment of ‘‘other-than-temporary’’ impairments on fixed maturities
To determine whether a fixed maturity’s decline in fair value below its For all fixed maturities with cost in excess of their fair value, if this excess wasamortized cost is other than temporary, we must evaluate the expected determined to be other-than-temporary, shareholders’ net income for the yearrecovery in value and our intent to sell or the likelihood of a required sale of the ended December 31, 2016 would have decreased by approximately $115 millionfixed maturity prior to an expected recovery. To make this determination, we after-tax.consider a number of general and specific factors including the regulatory,
Unlike impairments, there is no impact to shareholders’ net income for holdingeconomic and market environments, length of time and severity of the decline,fixed maturities with a fair value in excess of cost because we classify our fixedand the financial health and specific near term prospects of the issuer.maturities as available for sale.
See Note 11 to the Consolidated Financial Statements for additional discussionof our review of declines in fair value, including information regarding ouraccounting policies for fixed maturities.
The following section of this MD&A discusses the results of each of our reporting segments. In these segment discussions, we present‘‘operating revenues,’’ defined as total revenues excluding realized investment results and ‘‘adjusted income from operations,’’ defined asshareholders’ net income (loss) excluding after-tax realized investment results, net amortization of other acquired intangible assets and specialitems. Ratios presented in this segment discussion exclude the same items as adjusted income from operations. See Note 22 to theConsolidated Financial Statements for additional discussion of these metrics.
In these segment discussions, we also present ‘‘adjusted margin,’’ defined as adjusted income from operations divided by operating revenues.
See the MD&A Executive Overview beginning on page 36 for summarized financial results of each of our reporting segments.
Global Health Care SegmentAs described in the Segment Reporting introduction above, the performance of the Global Health Care segment is measured using adjustedincome from operations. The key factors affecting adjusted income from operations for this segment are:
customer growth;
sales of specialty products;
operating expense as a percentage of operating revenues (operating expense ratio); and
medical costs as a percentage of premiums (medical care ratio or ‘‘MCR’’) for our commercial and government businesses.
Financial Summary
Change ChangeFor the Years Favorable Favorable
Ended December 31, (Unfavorable) (Unfavorable)(In millions) 2016 2015 2014 2016 vs. 2015 2015 vs. 2014
Operating revenues $ 31,199 $ 29,929 $ 27,290 $ 1,270 4% $ 2,639 10%
Adjusted income from operations $ 1,852 $ 1,848 $ 1,752 $ 4 –% $ 96 5%
Adjusted margin 5.9% 6.2% 6.4% (30)bps (20)bpsMedical Care Ratios:
Commercial 79.3% 78.1% 78.5% (120)bps 40bpsGovernment 85.3% 85.2% 84.3% (10)bps (90)bpsConsolidated Global Health Care 81.6% 80.9% 80.6% (70)bps (30)bps
Operating expense ratio 21.5% 21.4% 21.4% (10)bps –bps
Increase IncreaseAs of December 31, (Decrease) (Decrease)
(Dollars in millions, customers in thousands) 2016 2015 2014 2016 vs. 2015 2015 vs. 2014
Global Health Care medical costs payable $ 2,532 $ 2,355 $ 2,180 $ 177 8% $ 175 8%Customers:
Total commercial risk 2,576 2,502 2,534 74 3% (32) (1)%Total government 566 567 518 (1) – 49 9
Total risk 3,142 3,069 3,052 73 2 17 1Service 12,055 11,930 11,404 125 1 526 5
Total medical customers 15,197 14,999 14,456 198 1% 543 4%
CIGNA CORPORATION - 2016 Form 10-K 49
SEGMENT REPORTING
•
•
•
•
Results of Operations

PART IIITEM 7. Management’s Discussion and Analysis of Financial Condition and Results of Operations
Adjusted income from operations was essentially flat in 2016 compared with 2015, reflecting earnings growth in our Commercial segment,primarily due to increased contributions from specialty products partially offset by lower margins in our U.S. Individual business. This increasewas offset by lower earnings in our Government segment primarily driven by costs related to our CMS audit response.
Adjusted income from operations increased in 2015 compared with 2014, reflecting U.S. Commercial business growth, including increasedcontributions from pharmacy, stop loss and other specialty products. Results in 2015 also reflect the impact of increased investments inbusiness initiatives.
Operating revenues. The increase in operating revenues in 2016 compared with 2015 was due to growth in our Commercial segment primarilyfrom increased specialty revenues. Growth in Medicare Advantage customer volumes and higher premium rates for most products in our U.S.health care businesses primarily to recover underlying medical cost trend also contributed to the increase. These increases were partially offsetby lower customer volumes in our Medicare Part D and U.S. Individual businesses. Operating revenues include amounts related to the RiskMitigation Programs under the Health Care Reform Act. See the Risk Mitigation section on page 40 for further discussion of the Risk Corridorprogram.
The increase in operating revenues in 2015, compared with 2014 was primarily due to a higher customer base in our Government segment, aswell as revenue growth in specialty businesses and higher premiums in the U.S. Commercial segment reflecting rate actions on most riskproducts primarily to recover underlying medical cost trends.
Medical care ratios. The Commercial medical care ratio increased in 2016 compared with 2015 reflecting a less favorable medical care ratio inour stop loss business as expected, lower premium due to the anticipated reduction of the Health Care Reform Act mandated fees in 2017, andless favorable prior year reserve development. The Commercial medical care ratio decreased slightly in 2015 compared with 2014 primarily dueto a lower medical care ratio in our stop loss business.
The Government medical care ratio increased slightly in 2016 compared with 2015 reflecting higher medical costs in our Medicaid business andless favorable prior year development, mostly offset by improvements in the Medicare Part D business. The Government medical care ratioincreased in 2015 compared with 2014 due to an increase in Medicare Part D utilization.
As discussed in the Regulation section of this Form 10-K, both the Commercial and Government segments are subject to minimum medical lossratio requirements under the Health Care Reform Act. As of December 31, 2016 and 2015, liabilities under these requirements were not material.
Operating expense ratio. The operating expense ratio increased slightly in 2016 compared with 2015, reflecting costs related to our CMSaudit response. Excluding those costs, the operating expense ratio decreased, reflecting higher revenue and operating efficiencies, partiallyoffset by business initiative investments to enhance our capabilities. The operating expense ratio was flat in 2015 compared with 2014,reflecting business-initiative investments offset by higher revenue and disciplined expense management.
Global Health Care Medical Costs PayableMedical costs payable was higher as of December 31, 2016 compared with 2015, primarily due to medical cost trend across all businesses andcustomer growth in our Commercial group business. Medical costs payable increased in 2015 compared with 2014, primarily driven by growthin the stop loss book of business and the Government segment. See Note 7 to the Consolidated Financial Statements for additionalinformation.
Medical CustomersA medical customer is defined as a person meeting any one of the following criteria:
is covered under an insurance policy or service agreement issued by us;
has access to the Company’s provider network for covered services under their medical plan; or
has medical claims that are administered by us.
Our medical customer base as of December 31, 2016 was higher than 2015, primarily driven by growth in our middle market, select, andinternational market segments. Our medical customer base as of December 31, 2015 was higher than 2014, driven by strong overall retentionand sales in our targeted market segments, as well as the acquisition of QualCare Alliance Networks, Inc. on February 28, 2015.
Global Supplemental Benefits SegmentAs described in the Segment Reporting introduction on page 49, the performance of the Global Supplemental Benefits segment is measuredusing adjusted income from operations. The key factors affecting adjusted income from operations for this segment are:
premium growth, including new business and customer retention;
benefit expenses as a percentage of premiums (loss ratio);
operating expense and acquisition expense as a percentage of operating revenues (expense ratio and acquisition cost ratio); and
the impact of foreign currency movements.
Throughout this discussion and the table presented below, prior period currency adjusted income from operations and operating revenues arecalculated by applying the current period’s exchange rates to reported results in the prior period. A strengthening U.S. Dollar against foreigncurrencies decreases these measures, while a weakening U.S. Dollar produces the opposite effect.
50 CIGNA CORPORATION - 2016 Form 10-K
Other Items Affecting Health Care Results
•
•
•
•
•
•
•

PART IIITEM 7. Management’s Discussion and Analysis of Financial Condition and Results of Operations
Financial Summary
Change ChangeFor the Years Favorable Favorable
Ended December 31, (Unfavorable) (Unfavorable)(In millions) 2016 2015 2014 2016 vs. 2015 2015 vs. 2014
Operating revenues $ 3,385 $ 3,149 $ 3,005 $ 236 7% $ 144 5%
Adjusted income from operations $ 294 $ 262 $ 243 $ 32 12% $ 19 8%
Operating revenues, using actual 2016 currency exchangerates $ 3,385 $ 3,069 $ 2,738 $ 316 10% $ 331 12%Adjusted income from operations, using actual 2016currency exchange rates $ 294 $ 255 $ 219 $ 39 15% $ 36 16%
Adjusted margin 8.7% 8.3% 8.1% 40bps 20bpsLoss ratio 55.3% 55.3% 54.3% –bps (100)bpsAcquisition cost ratio 18.6% 19.3% 21.0% 70bps 170bpsExpense ratio (excluding acquisition costs) 17.9% 18.3% 17.7% 40bps (60)bps
Adjusted income from operations increased in 2016 compared with 2015 primarily due to business growth, largely in South Korea, and loweracquisition and operating cost ratios. These factors were partially offset by higher income taxes and the unfavorable impact of foreign currencymovements, primarily in South Korea. The increase in adjusted income from operations in 2015 compared with 2014 was primarily due tobusiness growth and lower acquisition costs, partially offset by the unfavorable impact of foreign currency movements and higher expenseratios as discussed below.
Operating revenues were higher in 2016 compared with 2015 primarily due to new sales, particularly in South Korea and the U.S., reflectingboth customer growth and sales of higher premium products. These higher premiums were partially offset by lower persistency in the U.K. andthe unfavorable impact of foreign currency movements, primarily in South Korea and the U.K.
Operating revenues were higher in 2015 compared with 2014, primarily attributable to new sales, particularly in South Korea and the U.S.,reflecting both customer growth and sales of higher premium products, partially offset by the unfavorable impact of foreign currencymovements.
Loss ratios were flat in 2016 compared with 2015 reflecting favorable claims in South Korea, largely offset by higher claims in the U.S. Loss ratiosincreased in 2015 compared with 2014, primarily due to a business mix shift toward products with higher expected loss ratios in South Koreaand the U.S.
Acquisition cost ratios decreased in both 2016 and 2015 compared with each prior year. The decline in each year’s ratio largely represents ashift toward higher premium products with lower acquisition costs primarily in South Korea and the U.S.
The expense ratio (excluding acquisition costs) decreased in 2016 compared with 2015 primarily driven by operating efficiencies. The expenseratio (excluding acquisition costs) increased in 2015 compared with 2014 reflecting strategic business investments partially offset by operatingefficiencies.
South Korea is the single largest geographic market for our Global Supplemental Benefits segment. South Korea generated 51% of thesegment’s operating revenues and 85% of the segment’s adjusted income from operations in 2016. In 2016, our Global Supplemental Benefitssegment operations in South Korea represented 4% of our consolidated operating revenues and 12% of consolidated adjusted income fromoperations.
As a global company, our business is exposed to risks inherent in foreign operations. While we continue to monitor and evaluate the impacts ofthe U.K. vote to exit the European Union and the political unrest in Turkey, we do not expect these events to materially impact the results of theGlobal Supplemental Benefits segment in 2017.
Significant movements in foreign currency exchange rates could materially affect the reported results of the Global Supplemental Benefitssegment.
Group Disability and Life SegmentAs described in the Segment Reporting introduction on page 49, the performance of the Group Disability and Life segment is measured usingadjusted income from operations. The key factors affecting adjusted income from operations for this segment are:
premium growth, including new business and customer retention;
net investment income;
benefit expenses as a percentage of premiums (loss ratio); and
operating expense as a percentage of operating revenues excluding net investment income (expense ratio).
CIGNA CORPORATION - 2016 Form 10-K 51
Results of Operations
Other Items Affecting Global Supplemental Benefits Results
•
•
•
•
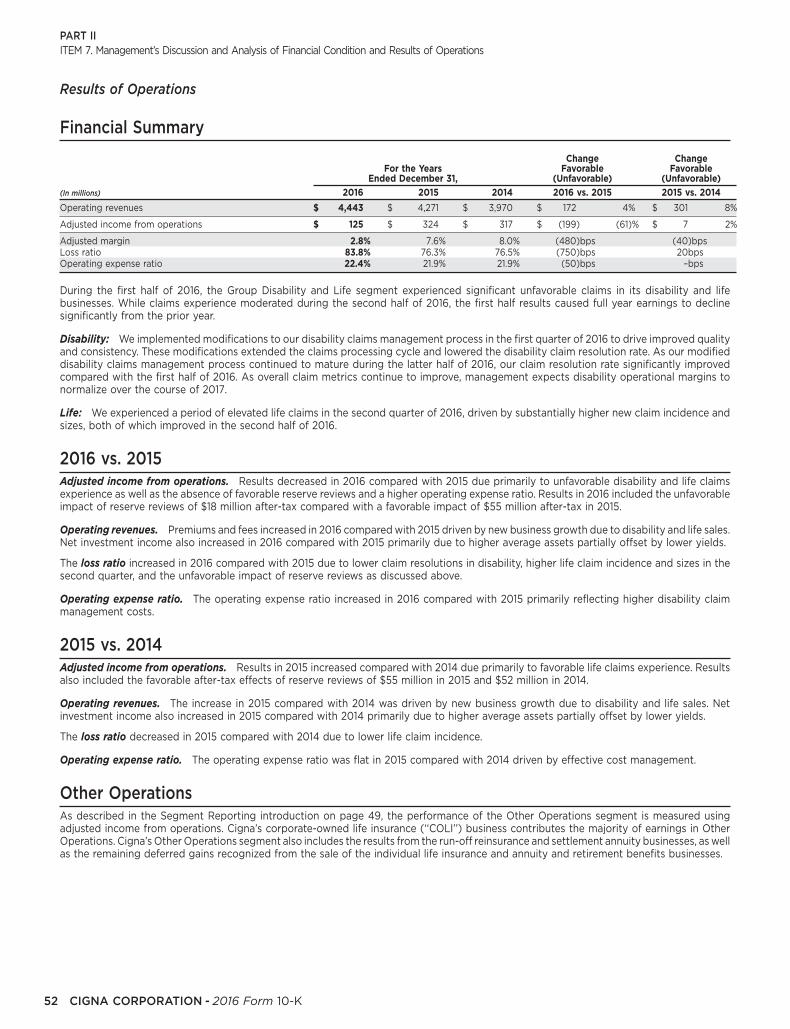
PART IIITEM 7. Management’s Discussion and Analysis of Financial Condition and Results of Operations
Financial Summary
Change ChangeFor the Years Favorable Favorable
Ended December 31, (Unfavorable) (Unfavorable)(In millions) 2016 2015 2014 2016 vs. 2015 2015 vs. 2014
Operating revenues $ 4,443 $ 4,271 $ 3,970 $ 172 4% $ 301 8%
Adjusted income from operations $ 125 $ 324 $ 317 $ (199) (61)% $ 7 2%
Adjusted margin 2.8% 7.6% 8.0% (480)bps (40)bpsLoss ratio 83.8% 76.3% 76.5% (750)bps 20bpsOperating expense ratio 22.4% 21.9% 21.9% (50)bps –bps
During the first half of 2016, the Group Disability and Life segment experienced significant unfavorable claims in its disability and lifebusinesses. While claims experience moderated during the second half of 2016, the first half results caused full year earnings to declinesignificantly from the prior year.
Disability: We implemented modifications to our disability claims management process in the first quarter of 2016 to drive improved qualityand consistency. These modifications extended the claims processing cycle and lowered the disability claim resolution rate. As our modifieddisability claims management process continued to mature during the latter half of 2016, our claim resolution rate significantly improvedcompared with the first half of 2016. As overall claim metrics continue to improve, management expects disability operational margins tonormalize over the course of 2017.
Life: We experienced a period of elevated life claims in the second quarter of 2016, driven by substantially higher new claim incidence andsizes, both of which improved in the second half of 2016.
2016 vs. 2015Adjusted income from operations. Results decreased in 2016 compared with 2015 due primarily to unfavorable disability and life claimsexperience as well as the absence of favorable reserve reviews and a higher operating expense ratio. Results in 2016 included the unfavorableimpact of reserve reviews of $18 million after-tax compared with a favorable impact of $55 million after-tax in 2015.
Operating revenues. Premiums and fees increased in 2016 compared with 2015 driven by new business growth due to disability and life sales.Net investment income also increased in 2016 compared with 2015 primarily due to higher average assets partially offset by lower yields.
The loss ratio increased in 2016 compared with 2015 due to lower claim resolutions in disability, higher life claim incidence and sizes in thesecond quarter, and the unfavorable impact of reserve reviews as discussed above.
Operating expense ratio. The operating expense ratio increased in 2016 compared with 2015 primarily reflecting higher disability claimmanagement costs.
2015 vs. 2014Adjusted income from operations. Results in 2015 increased compared with 2014 due primarily to favorable life claims experience. Resultsalso included the favorable after-tax effects of reserve reviews of $55 million in 2015 and $52 million in 2014.
Operating revenues. The increase in 2015 compared with 2014 was driven by new business growth due to disability and life sales. Netinvestment income also increased in 2015 compared with 2014 primarily due to higher average assets partially offset by lower yields.
The loss ratio decreased in 2015 compared with 2014 due to lower life claim incidence.
Operating expense ratio. The operating expense ratio was flat in 2015 compared with 2014 driven by effective cost management.
Other OperationsAs described in the Segment Reporting introduction on page 49, the performance of the Other Operations segment is measured usingadjusted income from operations. Cigna’s corporate-owned life insurance (‘‘COLI’’) business contributes the majority of earnings in OtherOperations. Cigna’s Other Operations segment also includes the results from the run-off reinsurance and settlement annuity businesses, as wellas the remaining deferred gains recognized from the sale of the individual life insurance and annuity and retirement benefits businesses.
52 CIGNA CORPORATION - 2016 Form 10-K
Results of Operations

PART IIITEM 7. Management’s Discussion and Analysis of Financial Condition and Results of Operations
Financial SummaryChange Change
For the Years Favorable FavorableEnded December 31, (Unfavorable) (Unfavorable)
(In millions) 2016 2015 2014 2016 vs. 2015 2015 vs. 2014
Operating revenues $ 472 $ 485 $ 510 $ (13) (3)% $ (25) (5)%Adjusted income from operations $ 70 $ 75 $ 68 $ (5) (7)% $ 7 10%
Adjusted margin 14.8% 15.5% 13.3% (70)bps 220bps
Adjusted income from operations decreased in 2016 compared with 2015, reflecting less favorable mortality experience and lower interestmargins in COLI. Adjusted income from operations increased in 2015 compared with 2014, reflecting favorable mortality experience in COLI.
Operating revenues decreased in 2016 compared with 2015 due to lower net investment income driven by lower investment yields. Thedecrease in operating revenues in 2015 compared with 2014 is largely due to lower net investment income driven by lower investment yieldsand, to a lesser extent, lower premiums in COLI driven by favorable experience-rating results.
CorporateCorporate reflects amounts not allocated to operating segments, including net interest expense (defined as interest on corporate debt less netinvestment income on investments not supporting segment operations), interest on uncertain tax positions, certain litigation matters,intersegment eliminations, compensation cost for stock options, expense associated with our frozen pension plans and certain overhead andproject costs.
Financial SummaryChange Change
For the Years Favorable FavorableEnded December 31, (Unfavorable) (Unfavorable)
(In millions) 2016 2015 2014 2016 vs. 2015 2015 vs. 2014
Adjusted loss from operations $ (237) $ (253) $ (265) $ 16 6% $ 12 5%
Corporate’s adjusted loss from operations decreased in 2016 compared with 2015, primarily due to adopting ASU 2016-09 effective January 1,2016, as further discussed in Note 2 to the Consolidated Financial Statements, and higher net investment income partially offset by higherpension and project expenses.
Corporate’s adjusted loss from operations decreased in 2015 compared with 2014, primarily due to lower pension and interest expenses.
The following table presents our invested asset portfolio, excluding separate account assets, as of December 31, 2016 and 2015. An increase ininvestable funds has led to an increase across all asset types, except for commercial mortgages, that have continued to decline due to acompetitive investment environment and our assessment of relative value versus other fixed income opportunities.
Additional information regarding our investment assets and related accounting policies is included in Notes 2, 10, 11, 12, 13, and 14 to theConsolidated Financial Statements.
(In millions) 2016 2015
Fixed maturities $ 20,961 $ 19,455Equity securities 583 190Commercial mortgage loans 1,666 1,864Policy loans 1,452 1,419Other long-term investments 1,462 1,404Short-term investments 691 381
Total $ 26,815 $ 24,713
Investments in fixed maturities include publicly traded and privately placed debt securities, mortgage and other asset-backed securities, andpreferred stocks redeemable by the investor. These investments are classified as available for sale and are carried at fair value on our balancesheet. Additional information regarding valuation methodologies, key inputs and controls is included in Note 10 of the Consolidated FinancialStatements.
The following table reflects our fixed maturity portfolio by type of issuer as of December 31, 2016 and 2015.
(In millions) 2016 2015
Federal government and agency $ 877 $ 779State and local government 1,435 1,641Foreign government 2,113 2,014Corporate 16,050 14,448Mortgage and other asset-backed 486 573
Total $ 20,961 $ 19,455
CIGNA CORPORATION - 2016 Form 10-K 53
Results of Operations
Investment Assets
Fixed Maturities

PART IIITEM 7. Management’s Discussion and Analysis of Financial Condition and Results of Operations
As of December 31, 2016, $18.6 billion, or 89%, of the fixed maturities in our investment portfolio were investment grade (Baa and above, orequivalent), and the remaining $2.4 billion were below investment grade. The majority of the bonds that are below investment grade are ratedat the higher end of the non-investment grade spectrum. These quality characteristics have not materially changed from the prior year and areconsistent with our investment strategy.
State and local government. Our investment in state and local government securities, with an average quality rating of Aa2, is diversified byissuer and geography with no single exposure greater than $30 million as of December 31, 2016. We assess each issuer’s credit quality based ona fundamental analysis of underlying financial information and do not rely solely on statistical rating organizations or monoline insurerguarantees.
Foreign government. We invest in high quality foreign government obligations with an average quality rating of Aa3 as of December 31, 2016.These investments are concentrated in Asia, primarily South Korea, consistent with the geographic locations of our international businessoperations. Foreign government obligations also include $221 million of investments in European sovereign debt, none of which are incountries with significant political or economic concerns such as Portugal, Italy, Ireland, Greece, Spain and Turkey.
Corporate. As of December 31, 2016, corporate fixed maturities included the following.
Private placement investments were $5.3 billion. These investments are generally less marketable than publicly-traded bonds, however yieldson these investments tend to be higher than yields on publicly-traded bonds with comparable credit risk. We perform a credit analysis of eachissuer, diversify investments by industry and issuer and require financial and other covenants that allow us to monitor issuers for deterioratingfinancial strength and pursue remedial actions, if warranted.
Investments in companies that are domiciled or have significant business interests in Italy, Ireland, Spain and Turkey were $354 million. Theseinvestments have an average quality rating of Baa3 and are diversified by industry sector, including approximately 1% invested in financialinstitutions.
Investments in the energy and natural gas sector were $1.7 billion with gross unrealized losses of $18 million. These investments have anaverage quality rating of Baa2 and are diversified by issuer with no single exposure greater than $40 million.
In addition to amounts classified in fixed maturities on our Consolidated Balance Sheets, we operate a joint venture in China in which we have a50% ownership interest. We account for this joint venture on the equity basis of accounting and report it in other assets, including otherintangibles. This entity has an investment portfolio of approximately $3.3 billion that is primarily invested in local Chinese corporate andgovernment fixed maturities and has no investments with a material unrealized loss as of December 31, 2016.
Equity securities increased approximately $400 million during 2016 to $583 million as of December 31, 2016, largely due to investing in anexchange traded fund (‘‘ETF’’) as part of a temporary program to invest available funds in high quality and liquid assets. The underlying assetsof the ETF are primarily U.S. investment grade corporate bonds and there is a gross unrealized loss of $5 million as of December 31, 2016 due toan increase in market yields since purchase.
Our commercial mortgage loans are fixed rate loans, diversified by property type, location and borrower. Loans are secured by high qualitycommercial properties and are generally made at less than 70% of the property’s value at origination of the loan. Property value, debt servicecoverage, quality, building tenancy and stability of cash flows are all important financial underwriting considerations. We hold no directresidential mortgage loans and do not securitize or service mortgage loans. We completed an annual in-depth review of our commercialmortgage loan portfolio during the second quarter of 2016. For further information on the property type, location and credit quality of ourcommercial mortgage loans, as well as a discussion of the results of the annual portfolio review, see Note 11 to the Consolidated FinancialStatements.
Commercial real estate capital markets remain very active for well-leased, quality commercial real estate located in strong institutionalinvestment markets. The vast majority of properties securing the mortgages in our mortgage portfolio possess these characteristics.
The $1.7 billion commercial mortgage loan portfolio consists of approximately 60 loans, including one impaired loan with a carrying value of$21 million, net of a $5 million reserve, that is classified as a problem loan. We have $92 million of loans maturing in the next twelve months.Given the quality and diversity of the underlying real estate, positive debt service coverage and significant borrower investment generallyranging between 30 and 40%, we remain confident that borrowers will continue to perform as expected under their contract terms.
Other long-term investments of $1.5 billion primarily include investments in security partnership and real estate funds as well as directinvestments in real estate joint ventures. The funds typically invest in mezzanine debt or equity of privately held companies (securitiespartnerships) and equity real estate. Given our subordinate position in the capital structure of these underlying entities, we assume a higherlevel of risk in return for higher expected returns. To mitigate risk, investments are diversified across approximately 120 separate partnerships,and approximately 70 general partners who manage one or more of these partnerships. Also, the funds’ underlying investments are diversifiedby industry sector or property type, and geographic region. No single partnership investment exceeds 4% of our securities and real estatepartnership portfolio.
54 CIGNA CORPORATION - 2016 Form 10-K
•
•
•
Equity Securities
Commercial Mortgage Loans
Other Long-term Investments

PART IIITEM 7. Management’s Discussion and Analysis of Financial Condition and Results of Operations
‘‘Problem’’ bonds and commercial mortgage loans are either delinquent by 60 days or more or have been restructured as to terms, includingconcessions by us for modification of interest rate, principal payment or maturity date. ‘‘Potential problem’’ bonds and commercial mortgageloans are considered current (no payment is more than 59 days past due), but management believes they have certain characteristics thatincrease the likelihood that they may become problems. The characteristics management considers include, but are not limited to, thefollowing:
request from the borrower for restructuring;
principal or interest payments past due by more than 30 but fewer than 60 days;
downgrade in credit rating;
collateral losses on asset-backed securities; and
for commercial mortgages, deterioration of debt service coverage below 1.0 or value declines resulting in estimated loan-to-value ratiosincreasing to 100% or more.
We recognize interest income on problem bonds and commercial mortgage loans only when payment is actually received because of the riskprofile of the underlying investment. The amount that would have been reflected in net income if interest on non-accrual investments had beenrecognized in accordance with their original terms was not significant for 2016 or 2015.
The following table shows problem and potential problem investments at amortized cost, net of valuation reserves and write-downs:
December 31, 2016 December 31, 2015(In millions) Gross Reserve Net Gross Reserve Net
Problem bonds $ 70 $ (9) $ 61 $ 3 $ (1) $ 2Problem commercial mortgage loans 26 (5) 21 90 (11) 79Foreclosed real estate 49 – 49 – – –
Total problem investments $ 145 $ (14) $ 131 $ 93 $ (12) $ 81
Potential problem bonds $ 12 $ (7) $ 5 $ 55 $ (23) $ 32Potential problem commercial mortgage loans – – – 64 (4) 60
Total potential problem investments $ 12 $ (7) $ 5 $ 119 $ (27) $ 92
The increase in problem bonds was primarily due to three additional problem bonds in the energy sector. The increase in foreclosed real estateduring 2016 reflects the foreclosure of a commercial mortgage loan classified as a problem loan as of December 31, 2015. The decrease inpotential problem commercial mortgage loans in 2016 was due to a full payoff of one loan and partial payoff, and subsequent reclassification togood standing, of another loan.
Global financial markets exhibited volatility throughout 2016 resulting from global economic and political uncertainty. The volatility beganearly in the year led by concerns related to slowing economic global growth, with particular concerns regarding China, potentially destabilizingimpacts from cyclically low energy prices, followed in mid-year by concerns regarding the United Kingdom’s decision to exit the EuropeanUnion, and then finished the year with strong market reactions anticipating growth-oriented policy changes in the United States following ourrecent elections. The near-term impact of these events has not materially impacted our financial condition or liquidity; however, we continue toclosely monitor global macroeconomic trends and the potential impact to our investment portfolio. Future realized and unrealized investmentresults will be driven largely by market conditions that exist when a transaction occurs or at the reporting date. These future conditions are notreasonably predictable; however, we believe that the vast majority of our investments will continue to perform under their contractual terms.Based on our strategy to match the duration of invested assets to the duration of insurance and contractholder liabilities, we expect to hold asignificant portion of these assets for the long term. Although future impairment losses resulting from interest rate movements and creditdeterioration due to both company-specific and the global economic uncertainties discussed above remain possible, we do not expect theselosses to have a material adverse effect on our financial condition or liquidity.
Market Risk
Our assets and liabilities include financial instruments subject to the risk of potential losses from adverse changes in market rates and prices.Our primary market risk exposures are:
Interest-rate risk on fixed-rate, medium-term instruments. Changes in market interest rates affect the value of instruments that promise afixed return and our employee pension liabilities.
Foreign currency exchange rate risk of the U.S. dollar primarily to the South Korean won, Euro, Chinese yuan renminbi, Taiwan dollar andBritish pound. An unfavorable change in exchange rates reduces the carrying value of net assets denominated in foreign currencies.
CIGNA CORPORATION - 2016 Form 10-K 55
Problem and Potential Problem Investments
•
•
•
•
•
Investment Outlook
Financial Instruments
•
•

PART IIITEM 7. Management’s Discussion and Analysis of Financial Condition and Results of Operations
We predominantly rely on three techniques to manage our exposure to market risk:
Investment/liability matching. We generally select investment assets with characteristics (such as duration, yield, currency and liquidity)that correspond to the underlying characteristics of our related insurance and contractholder liabilities so that we can match the investmentsto our obligations. Shorter-term investments generally support shorter-term life and health liabilities. Medium-term, fixed-rate investmentssupport interest-sensitive and health liabilities. Longer-term investments generally support products with longer pay out periods such asannuities and long-term disability liabilities.
Use of local currencies for foreign operations. We generally conduct our international business through foreign operating entities thatmaintain assets and liabilities in local currencies. While this technique does not reduce foreign currency exposure on our net assets, itsubstantially limits exchange rate risk to those net assets.
Use of derivatives. We use derivative financial instruments to minimize certain market risks.
See Note 12 to the Consolidated Financial Statements for additional information about financial instruments, including derivative financialinstruments.
The examples that follow illustrate the adverse effect of hypothetical changes in market rates or prices on the fair value of certain financialinstruments including:
a hypothetical increase in market interest rates, primarily for fixed maturities and commercial mortgage loans, partially offset by liabilities forlong-term, largely fixed-rate debt; and
a hypothetical strengthening of the U.S. dollar to foreign currencies, primarily for the net assets of foreign subsidiaries denominated in aforeign currency.
Management believes that actual results could differ materially from these examples because:
these examples were developed using estimates and assumptions;
changes in the fair values of all insurance-related assets and liabilities have been excluded because their primary risks are insurance ratherthan market risk;
changes in the fair values of investments recorded using the equity method of accounting and liabilities for pension and other postretirementand postemployment benefit plans (and related assets) have been excluded, consistent with the disclosure guidance; and
changes in the fair values of other significant assets and liabilities such as goodwill, deferred policy acquisition costs, taxes, and variousaccrued liabilities have been excluded; because they are not financial instruments, their primary risks are other than market risk.
The effects of hypothetical changes in market rates or prices on the fair values of certain of our financial instruments, subject to the exclusionsnoted above (particularly insurance liabilities), would have been as follows as of December 31:
Loss in fair valueMarket scenario for certain non-insurance financial instruments (in billions) 2016 2015
100 basis point increase in interest rates $ 1.0 $ 0.910% strengthening in U.S. dollar to foreign currencies $ 0.4 $ 0.3
The effect of a hypothetical increase in interest rates was determined by estimating the present value of future cash flows using various models,primarily duration modeling. The impact of a hypothetical increase to interest rates at December 31, 2016 was greater than that at December 31,2015 reflecting increased purchases of fixed maturities, in addition to valuation decreases of our long-term debt resulting from higher marketyields during 2016.
The effect of a hypothetical strengthening of the U.S. dollar relative to the foreign currencies held by us was estimated to be 10% of the U.S.dollar equivalent fair value. Our foreign operations hold investment assets, such as fixed maturities, cash, and cash equivalents, that aregenerally invested in the currency of the related liabilities. The effect of a hypothetical 10% strengthening in the U.S. dollar to foreign currenciesat December 31, 2016 was greater than that effect at December 31, 2015 due to increased amounts of investments that are primarilydenominated in the South Korean won.
56 CIGNA CORPORATION - 2016 Form 10-K
Our Management of Market Risks
•
•
•
Effect of Market Fluctuations
•
•
•
•
•
•

PART IIITEM 7A. Quantitative and Qualitative Disclosures about Market Risk
Quantitative and Qualitative Disclosures aboutMarket Risk
The information contained under the caption ‘‘Market Risk’’ in the MD&A section of this Form 10-K is incorporated by reference.
CIGNA CORPORATION - 2016 Form 10-K 57
ITEM 7A.

PART IIITEM 8. Financial Statements and Supplementary Data
Financial Statements and Supplementary Data
Report of Independent Registered Public Accounting FirmTo the Board of Directorsand Shareholders of Cigna Corporation
In our opinion, the accompanying consolidated balance sheets and the related consolidated statements of income, comprehensive income, changes in total equityand cash flows present fairly, in all material respects, the financial position of Cigna Corporation and its subsidiaries at December 31, 2016 and 2015, and the resultsof their operations and their cash flows for each of the three years in the period ended December 31, 2016 in conformity with accounting principles generallyaccepted in the United States of America. Also in our opinion, the Company maintained, in all material respects, effective internal control over financial reporting asof December 31, 2016, based on criteria established in Internal Control – Integrated Framework 2013 issued by the Committee of Sponsoring Organizations of theTreadway Commission (COSO). The Company’s management is responsible for these financial statements, for maintaining effective internal control over financialreporting and for its assessment of the effectiveness of internal control over financial reporting, included in Management’s Annual Report on Internal Control overFinancial Reporting appearing under Item 9A. Our responsibility is to express opinions on these financial statements and on the Company’s internal control overfinancial reporting based on our integrated audits. We conducted our audits in accordance with the standards of the Public Company Accounting Oversight Board(United States). Those standards require that we plan and perform the audits to obtain reasonable assurance about whether the financial statements are free ofmaterial misstatement and whether effective internal control over financial reporting was maintained in all material respects. Our audits of the financial statementsincluded examining, on a test basis, evidence supporting the amounts and disclosures in the financial statements, assessing the accounting principles used andsignificant estimates made by management and evaluating the overall financial statement presentation. Our audit of internal control over financial reportingincluded obtaining an understanding of internal control over financial reporting, assessing the risk that a material weakness exists, and testing and evaluating thedesign and operating effectiveness of internal control based on the assessed risk. Our audits also included performing such other procedures as we considerednecessary in the circumstances. We believe that our audits provide a reasonable basis for our opinions.
A company’s internal control over financial reporting is a process designed to provide reasonable assurance regarding the reliability of financial reporting and thepreparation of financial statements for external purposes in accordance with generally accepted accounting principles. A company’s internal control over financialreporting includes those policies and procedures that (i) pertain to the maintenance of records that, in reasonable detail, accurately and fairly reflect thetransactions and dispositions of the assets of the company; (ii) provide reasonable assurance that transactions are recorded as necessary to permit preparation offinancial statements in accordance with generally accepted accounting principles, and that receipts and expenditures of the company are being made only inaccordance with authorizations of management and directors of the company; and (iii) provide reasonable assurance regarding prevention or timely detection ofunauthorized acquisition, use, or disposition of the company’s assets that could have a material effect on the financial statements.
Because of its inherent limitations, internal control over financial reporting may not prevent or detect misstatements. Also, projections of any evaluation ofeffectiveness to future periods are subject to the risk that controls may become inadequate because of changes in conditions, or that the degree of compliancewith the policies or procedures may deteriorate.
/s/ PricewaterhouseCoopers LLP
PricewaterhouseCoopers LLPHartford, ConnecticutFebruary 23, 2017
58 CIGNA CORPORATION - 2016 Form 10-K
ITEM 8.
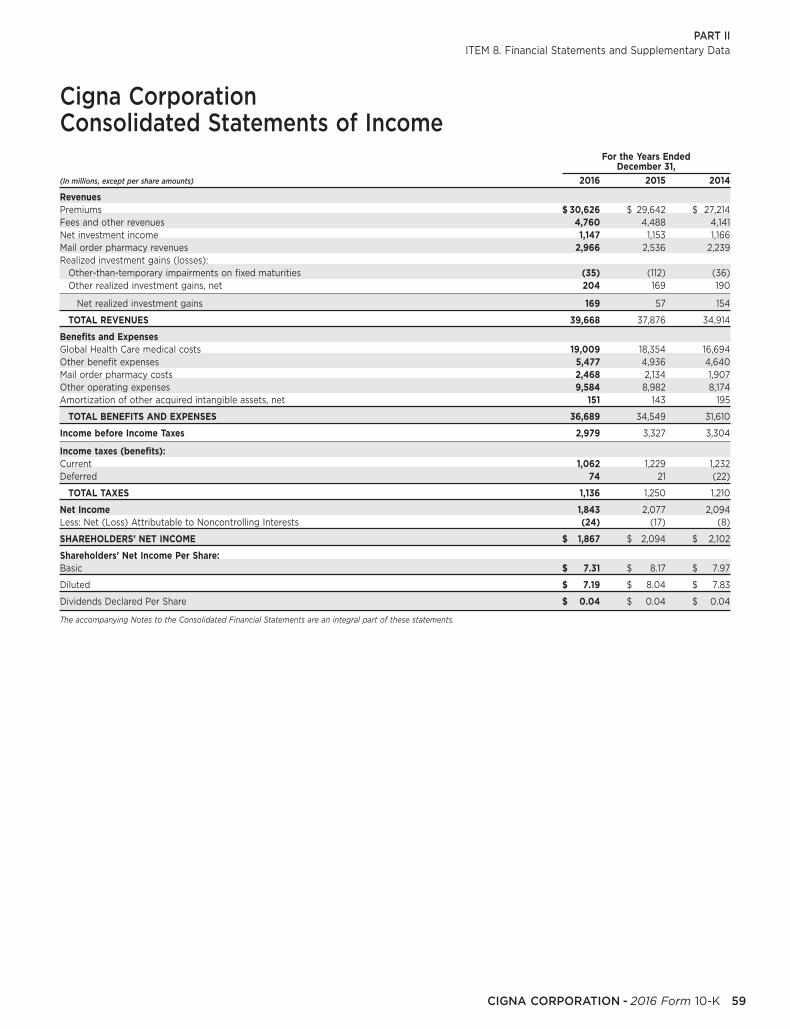
PART IIITEM 8. Financial Statements and Supplementary Data
Cigna CorporationConsolidated Statements of Income
For the Years EndedDecember 31,
(In millions, except per share amounts) 2016 2015 2014
RevenuesPremiums $ 30,626 $ 29,642 $ 27,214Fees and other revenues 4,760 4,488 4,141Net investment income 1,147 1,153 1,166Mail order pharmacy revenues 2,966 2,536 2,239Realized investment gains (losses):
Other-than-temporary impairments on fixed maturities (35) (112) (36)Other realized investment gains, net 204 169 190
Net realized investment gains 169 57 154
TOTAL REVENUES 39,668 37,876 34,914
Benefits and ExpensesGlobal Health Care medical costs 19,009 18,354 16,694Other benefit expenses 5,477 4,936 4,640Mail order pharmacy costs 2,468 2,134 1,907Other operating expenses 9,584 8,982 8,174Amortization of other acquired intangible assets, net 151 143 195
TOTAL BENEFITS AND EXPENSES 36,689 34,549 31,610
Income before Income Taxes 2,979 3,327 3,304
Income taxes (benefits):Current 1,062 1,229 1,232Deferred 74 21 (22)
TOTAL TAXES 1,136 1,250 1,210
Net Income 1,843 2,077 2,094Less: Net (Loss) Attributable to Noncontrolling Interests (24) (17) (8)
SHAREHOLDERS’ NET INCOME $ 1,867 $ 2,094 $ 2,102
Shareholders’ Net Income Per Share:Basic $ 7.31 $ 8.17 $ 7.97
Diluted $ 7.19 $ 8.04 $ 7.83
Dividends Declared Per Share $ 0.04 $ 0.04 $ 0.04
The accompanying Notes to the Consolidated Financial Statements are an integral part of these statements.
CIGNA CORPORATION - 2016 Form 10-K 59

PART IIITEM 8. Financial Statements and Supplementary Data
Cigna CorporationConsolidated Statements of Comprehensive Income
For the Years EndedDecember 31,
(In millions) 2016 2015 2014
Shareholders’ net income $ 1,867 $ 2,094 $ 2,102
Shareholders’ other comprehensive income (loss), net of tax:
Net unrealized appreciation (depreciation) on securities (56) (202) 143
Net unrealized appreciation (depreciation) on derivatives (4) 15 11
Net translation of foreign currencies (95) (212) (144)
Postretirement benefits liability adjustment 23 85 (426)
Shareholders’ other comprehensive (loss), net of tax (132) (314) (416)
Shareholders’ comprehensive income 1,735 1,780 1,686
Comprehensive income attributable to noncontrolling interests:
Net income (loss) attributable to redeemable noncontrolling interests (7) (6) 1
Net (loss) attributable to other noncontrolling interests (17) (11) (9)
Other comprehensive (loss) attributable to redeemable noncontrolling interests (10) (17) (7)
Other comprehensive income (loss) attributable to other noncontrolling interests – (1) 1
Total comprehensive (loss) attributable to noncontrolling interests (34) (35) (14)
TOTAL COMPREHENSIVE INCOME $ 1,701 $ 1,745 $ 1,672
The accompanying Notes to the Consolidated Financial Statements are an integral part of these statements.
60 CIGNA CORPORATION - 2016 Form 10-K

PART IIITEM 8. Financial Statements and Supplementary Data
Cigna CorporationConsolidated Balance Sheets
As of December 31,(In millions, except per share amounts) 2016 2015
AssetsInvestments:
Fixed maturities, at fair value (amortized cost, $19,942; $18,456) $ 20,961 $ 19,455Equity securities, at fair value (cost, $583; $190) 583 190Commercial mortgage loans 1,666 1,864Policy loans 1,452 1,419Other long-term investments 1,462 1,404Short-term investments 691 381
Total investments 26,815 24,713Cash and cash equivalents 3,185 1,968Premiums, accounts and notes receivable, net 3,077 3,694Reinsurance recoverables 6,478 6,813Deferred policy acquisition costs 1,818 1,659Property and equipment 1,536 1,534Deferred tax assets, net 304 379Goodwill 5,980 6,019Other assets, including other intangibles 2,227 2,476Separate account assets 7,940 7,833
TOTAL ASSETS $ 59,360 $ 57,088
LiabilitiesContractholder deposit funds $ 8,458 $ 8,443Future policy benefits 9,648 9,479Unpaid claims and claim expenses 4,917 4,574Global Health Care medical costs payable 2,532 2,355Unearned premiums 634 629
Total insurance and contractholder liabilities 26,189 25,480Accounts payable, accrued expenses and other liabilities 6,414 6,493Short-term debt 276 149Long-term debt 4,756 5,020Separate account liabilities 7,940 7,833
TOTAL LIABILITIES 45,575 44,975
Contingencies – Note 21Redeemable noncontrolling interests 58 69Shareholders’ equityCommon stock (par value per share, $0.25; shares issued, 296; authorized, 600) 74 74Additional paid-in capital 2,892 2,859Accumulated other comprehensive loss (1,382) (1,250)Retained earnings 13,855 12,121Less: treasury stock, at cost (1,716) (1,769)
TOTAL SHAREHOLDERS’ EQUITY 13,723 12,035Noncontrolling interests 4 9
Total equity 13,727 12,044
Total liabilities and equity $ 59,360 $ 57,088
SHAREHOLDERS’ EQUITY PER SHARE $ 53.42 $ 46.91
The accompanying Notes to the Consolidated Financial Statements are an integral part of these statements.
CIGNA CORPORATION - 2016 Form 10-K 61

PART IIITEM 8. Financial Statements and Supplementary Data
Cigna CorporationConsolidated Statements of Changes in Total Equity
AccumulatedAdditional Other Redeemable
Common Paid-in Comprehensive Retained Treasury Shareholders’ Noncontrolling Total Noncontrolling(In millions, except per share amounts) Stock Capital Loss Earnings Stock Equity Interests Equity Interests
Balance at January 1, 2014 $ 92 $ 3,356 $ (520) $ 13,676 $(6,037) $ 10,567 $ 14 $ 10,581 $ 962014 Activity:Effect of issuing stock for employee benefit plans 69 (124) 220 165 165Other comprehensive income (loss) (416) (416) 1 (415) (7)Net income (loss) 2,102 2,102 (9) 2,093 1Common dividends declared (per share: $0.04) (11) (11) (11)Repurchase of common stock (1,629) (1,629) (1,629)Retirement of treasury stock (18) (652) (5,354) 6,024 – –Other transactions impacting noncontrolling interests (4) (4) 9 5
BALANCE AT DECEMBER 31, 2014 74 2,769 (936) 10,289 (1,422) 10,774 15 10,789 90
2015 Activity:Effect of issuing stock for employee benefit plans 99 (252) 336 183 183Other comprehensive income (loss) (314) (314) (1) (315) (17)Net income (loss) 2,094 2,094 (11) 2,083 (6)Common dividends declared (per share: $0.04) (10) (10) (10)Repurchase of common stock (683) (683) (683)Other transactions impacting noncontrolling interests (9) (9) 6 (3) 2
BALANCE AT DECEMBER 31, 2015 74 2,859 (1,250) 12,121 (1,769) 12,035 9 12,044 69
2016 Activity:Effect of issuing stock for employee benefit plans 51 (123) 163 91 91Other comprehensive (loss) (132) (132) – (132) (10)Net income (loss) 1,867 1,867 (17) 1,850 (7)Common dividends declared (per share: $0.04) (10) (10) (10)Repurchase of common stock (110) (110) (110)Other transactions impacting noncontrolling interests (18) (18) 12 (6) 6
BALANCE AT DECEMBER 31, 2016 $ 74 $ 2,892 $ (1,382) $ 13,855 $ (1,716) $ 13,723 $ 4 $ 13,727 $ 58
The accompanying Notes to the Consolidated Financial Statements are an integral part of these statements.
62 CIGNA CORPORATION - 2016 Form 10-K

PART IIITEM 8. Financial Statements and Supplementary Data
Cigna CorporationConsolidated Statements of Cash Flows
For the years ended December 31,
(In millions) 2016 2015 2014
Cash Flows from Operating ActivitiesNet income $ 1,843 $ 2,077 $ 2,094Adjustments to reconcile net income to net cash provided by operating activities:
Depreciation and amortization 610 585 588Realized investment gains, net (169) (57) (154)Deferred income taxes 74 21 (22)
Net changes in assets and liabilities, net of non-operating effects:Premiums, accounts and notes receivable 663 (945) (780)Reinsurance recoverables 142 55 22Deferred policy acquisition costs (213) (182) (176)Other assets 134 16 (265)Insurance liabilities 683 657 457Accounts payable, accrued expenses and other liabilities 124 423 202Current income taxes 1 (25) 111Loss on extinguishment of debt – 100 –Distributions from partnership investments(2) 144 137 111Other, net(1) (10) 71 (30)
NET CASH PROVIDED BY OPERATING ACTIVITIES(1)(2) 4,026 2,933 2,158
Cash Flows from Investing ActivitiesProceeds from investments sold:
Fixed maturities and equity securities 1,544 1,555 1,769Investment maturities and repayments:
Fixed maturities and equity securities 1,755 1,435 1,640Commercial mortgage loans 316 640 453
Other sales, maturities and repayments (primarily short-term and other long-terminvestments)(2) 1,431 1,160 2,595Investments purchased or originated:
Fixed maturities and equity securities (5,191) (4,234) (5,424)Commercial mortgage loans (165) (500) (287)Other (primarily short-term and other long-term investments) (1,698) (1,183) (2,115)
Property and equipment purchases, net (461) (510) (473)Acquisitions, net of cash acquired (4) (99) –Other, net (101) – (24)
NET CASH (USED IN) INVESTING ACTIVITIES(2) (2,574) (1,736) (1,866)
Cash Flows from Financing ActivitiesDeposits and interest credited to contractholder deposit funds 1,460 1,429 1,482Withdrawals and benefit payments from contractholder deposit funds (1,362) (1,359) (1,456)Net change in short-term debt (148) (21) (112)Net proceeds on issuance of long-term debt – 894 –Repayment of long-term debt – (938) –Repurchase of common stock (139) (671) (1,612)Issuance of common stock 36 154 110Other, net(1) (72) (97) (47)
NET CASH (USED IN) FINANCING ACTIVITIES(1) (225) (609) (1,635)
Effect of foreign currency rate changes on cash and cash equivalents (10) (40) (32)
Net increase / (decrease) in cash and cash equivalents 1,217 548 (1,375)Cash and cash equivalents, January 1, 1,968 1,420 2,795
Cash and cash equivalents, December 31, $ 3,185 $ 1,968 $ 1,420
Supplemental Disclosure of Cash Information:Income taxes paid, net of refunds $ 1,064 $ 1,194 $ 1,085Interest paid $ 244 $ 245 $ 259
(1) As required in adopting Accounting Standard Update (‘‘ASU’’) 2016-09, the Company retrospectively reclassified $79 million in 2015 and $53 million in2014 of cash payments from operating to financing activities. These payments were related to employee tax obligations associated with stockcompensation. The comparable amount reported in financing activities in 2016 was $72 million. See Note 2 for further discussion.
(2) As required in adopting ASU 2016-15, the Company retrospectively reclassified from investing to operating activities $137 million in 2015 and $111 millionin 2014 of cash distributions from partnership earnings . The comparable amount reported in operating activities in 2016 was $144 million. See Note 2 forfurther discussion.
The accompanying Notes to the Consolidated Financial Statements are an integral part of these statements.
CIGNA CORPORATION - 2016 Form 10-K 63

PART IIITEM 8. Financial Statements and Supplementary Data
Table of Contents
NoteNumber Footnote Page
BUSINESS AND CAPITAL STRUCTURE
1 Description of Business ....................................................................................................................................................................................... 65
2 Summary of Significant Accounting Policies................................................................................................................................................ 65
3 Mergers and Acquisitions ................................................................................................................................................................................... 72
4 Earnings Per Share................................................................................................................................................................................................ 73
5 Debt........................................................................................................................................................................................................................... 73
6 Common and Preferred Stock........................................................................................................................................................................... 74
INSURANCE INFORMATION
7 Global Health Care Medical Costs Payable ................................................................................................................................................... 75
8 Liabilities for Unpaid Claims and Claim Expenses ...................................................................................................................................... 76
9 Reinsurance ............................................................................................................................................................................................................. 78
INVESTMENTS
10 Fair Value Measurements .................................................................................................................................................................................... 82
11 Investments ............................................................................................................................................................................................................. 87
12 Derivatives ............................................................................................................................................................................................................... 93
13 Variable Interest Entities ..................................................................................................................................................................................... 94
14 Accumulated Other Comprehensive Income (Loss)................................................................................................................................... 95
WORKFORCE MANAGEMENT AND COMPENSATION
15 Pension and Other Postretirement Benefit Plans........................................................................................................................................ 96
16 Employee Incentive Plans ................................................................................................................................................................................... 100
PROPERTY, LEASES AND OTHER ASSET BALANCES
17 Goodwill, Other Intangibles and Property and Equipment...................................................................................................................... 102
18 Leases and Rentals ............................................................................................................................................................................................... 104
COMPLIANCE, REGULATION AND CONTINGENCIES
19 Shareholders’ Equity and Dividend Restrictions ......................................................................................................................................... 104
20 Income Taxes .......................................................................................................................................................................................................... 105
21 Contingencies and Other Matters .................................................................................................................................................................... 106
RESULTS DETAILS
22 Segment Information ........................................................................................................................................................................................... 110
Quarterly Financial Data ..................................................................................................................................................................................... 114
64 CIGNA CORPORATION - 2016 Form 10-K
Notes to the Consolidated Financial Statements

PART IIITEM 8. Financial Statements and Supplementary Data
Description of BusinessCigna Corporation, together with its subsidiaries (either individually or collectively referred to as ‘‘Cigna,’’ the ‘‘Company,’’ ‘‘we,’’ ‘‘our’’ or ‘‘us’’)is a global health services organization dedicated to a mission of helping individuals improve their health, well-being and sense of security. Toexecute on our mission, Cigna’s strategy is to ‘‘Go Deep’’, ‘‘Go Global’’ and ‘‘Go Individual’’ with a differentiated set of medical, dental, disability,life and accident insurance and related products and services offered by our subsidiaries. The majority of these products are offered throughemployers and other groups such as governmental and non-governmental organizations, unions and associations. Cigna also offerscommercial health and dental insurance, Medicare and Medicaid products and health, life and accident insurance coverages to individuals inthe U.S. and selected international markets. In addition to these ongoing operations, Cigna also has certain run-off operations.
The financial results of the Company’s businesses are reported in the following segments:
Global Health Care aggregates the Commercial and Government operating segments due to their similar economic characteristics, productsand services and regulatory environment:
The Commercial operating segment encompasses both the U.S. commercial and certain international health care businesses servingemployers and their employees, other groups, and individuals. Products and services include medical, dental, behavioral health, vision, andprescription drug benefit plans, health advocacy programs and other products and services to insured and self-insured customers.
The Government operating segment offers Medicare Advantage and Medicare Part D plans to seniors and Medicaid plans.
Global Supplemental Benefits includes supplemental health, life and accident insurance products offered in selected international marketsand in the U.S.
Group Disability and Life provides group long-term and short-term disability, group life, accident and specialty insurance products and relatedservices.
Other Operations consist of:
corporate-owned life insurance (‘‘COLI’’);
run-off reinsurance business that is predominantly comprised of guaranteed minimum death benefit (‘‘GMDB’’) and guaranteed minimumincome benefit (‘‘GMIB’’) business effectively exited through reinsurance with Berkshire Hathaway Life Insurance Company of Nebraska(‘‘Berkshire’’) in 2013;
deferred gains recognized from the 1998 sale of the individual life insurance and annuity business and the 2004 sale of the retirement benefitsbusiness; and
run-off settlement annuity business.
Corporate reflects amounts not allocated to operating segments, such as net interest expense (defined as interest on corporate debt less netinvestment income on investments not supporting segment operations), interest on uncertain tax positions, certain litigation matters,intersegment eliminations, compensation cost for stock options, expense associated with frozen pension plans and certain costs for corporateprojects, including overhead.
Summary of Significant Accounting PoliciesBasis of PresentationThe Consolidated Financial Statements include the accounts of Cigna Corporation and its subsidiaries. Intercompany transactions andaccounts have been eliminated in consolidation. These Consolidated Financial Statements were prepared in conformity with accountingprinciples generally accepted in the United States of America (‘‘GAAP’’). Amounts recorded in the Consolidated Financial Statementsnecessarily reflect management’s estimates and assumptions about medical costs, investment valuation, interest rates and other factors.Significant estimates are discussed throughout these Notes; however, actual results could differ from those estimates. The impact of a changein estimate is generally included in earnings in the period of adjustment. Certain reclassifications have been made to prior year amounts toconform to the current presentation.
Variable interest entities. See Note 13 for a discussion of consolidated variable interest entities.
CIGNA CORPORATION - 2016 Form 10-K 65
NOTE 1
•
•
•
•
•
•
NOTE 2

PART IIITEM 8. Financial Statements and Supplementary Data
Recent Accounting ChangesThe following tables provide information about recently adopted and recently issued accounting guidance applicable to Cigna.
Recently Adopted Accounting Guidance
Accounting Standard and Adoption Date Requirements and Effects of Adopting New Guidance
Specifies how certain transactions should be classified in the statementof cash flows. While the standard addresses multiple types oftransactions, only a change in the treatment of distributions from equity
Classification of Certain Cash Receipts and Cash Payments (a consensusmethod investments will impact the Company.
of the Emerging Issues Task Force) (Accounting Standards Update(‘‘ASU’’) 2016-15)
Effects of adoption: using the nature of distribution approach, theCompany reported $144 million of cash receipts related to distributions
Early adopted as of December 31, 2016from partnership earnings in operating activities in 2016. The Companyreclassified $137 million for 2015 and $111 million for 2014 from investingto operating activities in the Consolidated Statements of Cash Flows.
Requires:Excess tax benefits or deficiencies to be recorded prospectively inthe income statement when awards vest or are settled; previouslythese effects were reported in additional paid-in capitalCash flows related to excess tax benefits to be classifiedprospectively as an operating activity in the statement of cash flows(previously financing)All cash payments made on an employee’s behalf for withheldshares to be presented retrospectively as a financing activity in thestatement of cash flowsProspective changes to the calculation of common stockequivalents for earnings per share
Permits:Repurchasing more of an employee’s shares for tax withholdingImprovements to Employee Share-Based Payment Accounting (ASUpurposes than previously allowed without triggering liability2016-09)accountingAn accounting policy election to record forfeitures as they occurEarly adopted on January 1, 2016instead of estimating
Effects of adoption:$29 million of excess tax benefits recorded in net income during2016 (in Corporate)$72 million of tax withholding cash flows reported in financingactivities in 2016; reclassified $79 million for 2015 and $53 millionfor 2014 of tax withholding from operating to financing activities inthe Consolidated Statements of Cash FlowsApproximately one million additional weighted average shares in2016 for the diluted earnings per share calculationsNo changes in our employee tax withholding practices for stockcompensationThe amount of compensation cost recognized in each periodcontinues to be determined based on estimated forfeitures
Requires additional information about an insurance entity’s initial claimestimates and subsequent adjustments to those estimates;methodologies and judgments in estimating claims; and the timing,
Disclosures about Short-Duration Insurance Contracts (ASU 2015-09) frequency and severity of claims.Effects of adoption:
Adopted December 31, 2016 See Note 7 for these disclosures about our Global Health Caremedical cost payable liabilitiesSee Note 8 for these disclosures about our unpaid claims and claimexpense liabilities
Removes fair value disclosure requirement for all investments measuredusing the practical expedient of net asset value (‘‘NAV’’) per share.Disclosures for Investments in Certain Entities That Calculate Net AssetCertain additional disclosures are now required for such investments.Value per Share (or Its Equivalent) (ASU 2015-07)
Effects of adoption: see Note 10 for these disclosures about separateAdopted January 1, 2016 account investments that use NAV as a practical expedient; comparable
prior year amounts are also disclosed.
Defines limited partnerships as variable interest entities unlesssubstantive kick-out rights or participating rights exist.
Amendments to the Consolidation Analysis (ASU 2015-02) Effects of adoption:No material effect on the Company’s financial statements
Adopted January 1, 2016 See Note 13 for disclosures about various limited partnerships newlyidentified as variable interest entities for which the Company is notthe primary beneficiary
66 CIGNA CORPORATION - 2016 Form 10-K
•
•
•
•
•
•
•
•
•
•
•
•
•
••

PART IIITEM 8. Financial Statements and Supplementary Data
Recently Issued Accounting Guidance Not Yet Adopted
Accounting Standard and Effective Date Applicable for Cigna Requirements and Expected Effects of New Guidance Not Yet Adopted
Simplifies the accounting for goodwill impairment by eliminating theSimplifying the Test for Goodwill Impairment (ASU 2017-04) need to determine the fair value of individual assets and liabilities of a
reporting unit to measure a goodwill impairment.Required as of January 1, 2020, with early adoption permitted as of
Expected effects: the Company is evaluating this new standard and itsJanuary 1, 2017expected timing of adoption.
Revises the definition of a business and provides a more robustframework for entities to use in determining when a set of assets andactivities is a business.Clarifying the Definition of a Business (ASU 2017-01)
Expected effects: if a group of assets acquired after adoption is notRequired as of January 1, 2018, with early adoption permitted as of considered a business, no goodwill will be recorded and most intangibleJanuary 1, 2017 assets recorded from the acquisition will be amortized to shareholders’
net income over their useful lives. The Company is evaluating this newstandard and its expected timing of adoption.
Requires:Entities to recognize the tax impacts of all intra-entity sales of
Intra-Entity Asset Transfers of Assets Other than Inventory (ASU assets other than inventory even though the pre-tax effects of2016-16) those transactions are eliminated in consolidation
Modified retrospective approach for adoption, with a cumulative-Required as of January 1, 2018, with early adoption permitted as of effect adjustment recorded in retained earningsJanuary 1, 2017 Expected effects: the Company is evaluating this new standard, its
expected timing of adoption and effects on its financial statements anddisclosures.
Requires:A new approach (based on expected credit losses) to estimate andrecognize credit losses for certain financial instruments such asmortgage loans, reinsurance recoverables and other receivablesChanges in the criteria for impairment of available-for-sale debtMeasurement of Credit Losses on Financial Instruments (ASU 2016-13)securitiesModified retrospective approach for adoption, with a cumulative-Required as of January 1, 2020, with early adoption permitted as ofeffect adjustment recorded in retained earningsJanuary 1, 2019
Expected effects: the Company is evaluating this new standard, itsexpected timing of adoption and effects on its financial statements anddisclosures. It is possible that an additional allowance for future expectedcredit losses for certain financial instruments may be required atadoption.
Requires:Balance sheet recognition of assets and liabilities arising fromleases, including from leases embedded in other contractsAdditional disclosures of the amount, timing and uncertainty ofcash flows from leases will be requiredModified retrospective approach for leases in effect as of and after
Leases (ASU 2016-02) the date of adoption, with a cumulative-effect adjustment recordedin retained earnings
Required as of January 1, 2019 Expected effects: the Company is still evaluating the impact the standardcould have on the Consolidated Financial Statements; however, while theCompany has not yet quantified the amount, we do expect the standardwill have a material impact on our Consolidated Balance Sheets due tothe recognition of additional assets and liabilities for operating leases.The actual increase in assets and liabilities will depend on the volumeand terms of leases in place at adoption.
Requires:Entities to measure equity investments at fair value in net income ifthey are neither consolidated nor accounted for under the equitymethodCumulative effect adjustment to the beginning balance of retainedRecognition and Measurement of Financial Assets and Financialearnings at adoptionLiabilities (ASU 2016-01)
Expected effects:Certain limited partnership interests carried at cost of $260 millionRequired as of January 1, 2018as of December 31, 2016 will be reported at fair value at adoptionAn increase to retained earnings of approximately $60 million,after-tax, if implemented as of December 31, 2016. Actualcumulative effect adjustment will depend on investments held andmarket conditions at adoption.
CIGNA CORPORATION - 2016 Form 10-K 67
•
•
•
•
•
•
•
•
•
•
•
•

PART IIITEM 8. Financial Statements and Supplementary Data
Accounting Standard and Effective Date Applicable for Cigna Requirements and Expected Effects of New Guidance Not Yet Adopted
Requires:Companies to estimate and allocate the expected customercontract revenues among distinct goods or services based onrelative standalone selling pricesRevenues to be recognized as goods or services are deliveredExtensive new disclosures including the presentation of additionalcategories of revenues and information about related contractassets and liabilitiesAdoption through retrospective restatement with or without usingcertain practical expedients or adoption with a cumulative effectadjustment
Revenue from Contracts with Customers (ASU 2014-09 and related Expected effects:amendments) Applies to the Company’s non-insurance, administrative service
contracts but does not apply to certain contracts within the scopeRequired as of January 1, 2018, with early adoption permitted as of of other GAAP, such as insurance contractsJanuary 1, 2017 The Company will adopt the new guidance as of January 1, 2018 but
has not yet selected a method of adoptionThe Company does not currently expect the adoption of the newguidance to have a material impact to its pattern of revenuerecognitionThe Company is continuing to evaluate the new requirements.Specifically, the Company is evaluating the combination of contractguidance for certain customers where the Company provides bothinsurance and non-insurance products, the deferral of revenue forservices provided after the termination of certain administrativecontracts and the Company’s status as principal or agent for certainperformance obligations.
68 CIGNA CORPORATION - 2016 Form 10-K
•
••
•
•
•
•
•

PART IIITEM 8. Financial Statements and Supplementary Data
Significant Accounting PoliciesThe Company’s accounting policies are either described in this Note or are described in the applicable Notes to the Consolidated FinancialStatements as indicated in the table below.
NoteNumber Footnote and policy Page
4 Earnings per share ................................................................................................................................................................................................ 73
7 Global Health Care medical costs payable.................................................................................................................................................... 75
8 Unpaid claims and claim expenses.................................................................................................................................................................. 76
9 Reinsurance ............................................................................................................................................................................................................. 78
GMDB ..................................................................................................................................................................................................................... 80
GMIB ....................................................................................................................................................................................................................... 81
10 Fair value measurements .................................................................................................................................................................................... 82
Fixed maturities, equity securities, short-term investments and derivatives .................................................................................. 83
Separate accounts.............................................................................................................................................................................................. 86
Commercial mortgage loans........................................................................................................................................................................... 87
Contractholder deposit funds ........................................................................................................................................................................ 87
Long-term debt................................................................................................................................................................................................... 87
11 Investments ............................................................................................................................................................................................................. 87
Fixed maturities and equity securities......................................................................................................................................................... 88
Commercial mortgage loans........................................................................................................................................................................... 89
Other long-term investments ......................................................................................................................................................................... 91
Short-term investments and cash equivalents .......................................................................................................................................... 91
Net investment income..................................................................................................................................................................................... 92
Realized investment gains and losses.......................................................................................................................................................... 92
12 Derivative financial instruments........................................................................................................................................................................ 93
13 Variable interest entities...................................................................................................................................................................................... 94
15 Pension and other postretirement benefit plans......................................................................................................................................... 96
16 Employee incentive plans ................................................................................................................................................................................... 100
17 Goodwill, other intangibles and property and equipment ....................................................................................................................... 102
20 Income taxes........................................................................................................................................................................................................... 105
21 Contingencies and other matters..................................................................................................................................................................... 106
A. Investments – Policy LoansPolicy loans are carried at unpaid principal balances plus accumulated interest, the total of which approximates fair value. These loans arecollateralized by life insurance policy cash values and therefore have minimal exposure to credit loss. Interest rates are reset annually based onan index.
B. Cash and Cash EquivalentsCash and cash equivalents are carried at cost that approximates fair value. Cash equivalents consist of short-term investments with maturitiesof three months or less from the time of purchase. The Company reclassifies cash overdraft positions to accounts payable, accrued expensesand other liabilities when the legal right of offset does not exist.
C. Premiums, Accounts and Notes Receivable and Reinsurance RecoverablesPremiums, accounts and notes receivable and reinsurance recoverables are reported net of allowances for doubtful accounts andunrecoverable reinsurance of $203 million as of December 31, 2016 and $78 million as of December 31, 2015. The Company estimates theseallowances for doubtful accounts and unrecoverable reinsurance using management’s best estimates of collectability, taking into considerationthe age of the outstanding amounts, historical collection patterns and other economic factors. See Note 22 for additional discussion of theallowance established in 2016 for the risk corridor receivable.
D. Deferred Policy Acquisition CostsCosts eligible for deferral include incremental, direct costs of acquiring new or renewal insurance and investment contracts and other costsdirectly related to successful contract acquisition. Examples of deferrable costs include commissions, sales compensation and benefits, policy
CIGNA CORPORATION - 2016 Form 10-K 69
•
•
•
•
•
•
•
•
•
•
•
•
•
PART IIITEM 8. Financial Statements and Supplementary Data
issuance and underwriting costs and premium taxes. The Company records acquisition costs differently depending on the product line.Acquisition costs for:
Universal life products are deferred and amortized in proportion to the present value of total estimated gross profits over the expected livesof the contracts.
Supplemental health, life and accident insurance (primarily individual products) and group health and accident insurance products aredeferred and amortized, generally in proportion to the ratio of periodic revenue to the estimated total revenues over the contract periods.
Other products are expensed as incurred.
Deferred policy acquisition costs also include the value of business acquired with certain acquisitions.
Each year, deferred policy acquisition costs are tested for recoverability. For universal life and other individual products, managementestimates the present value of future revenues less expected payments. For group health and accident insurance products, managementestimates the sum of unearned premiums and anticipated net investment income less future expected claims and related costs. Ifmanagement’s estimates of these sums are less than the deferred costs, the Company reduces deferred policy acquisition costs and records anexpense. The Company recorded amortization for policy acquisition costs of $292 million in 2016, $286 million in 2015 and $289 million in 2014primarily in other operating expenses.
E. Other Assets, including Other IntangiblesOther assets, including other intangibles consist primarily of GMIB assets, accrued net investment income, other intangible assets and variousother insurance-related assets. See Note 17 for the Company’s accounting policy for other intangibles. Additionally, these other assets includethe carrying value of our equity-method investments in joint ventures in China and other foreign jurisdictions.
F. Contractholder Deposit FundsLiabilities for contractholder deposit funds primarily include deposits received from customers for investment-related and universal lifeproducts and investment earnings on their fund balances. These liabilities are adjusted to reflect administrative charges and, for universal lifefund balances, mortality charges. In addition, this caption includes: 1) premium stabilization reserves under group insurance contractsrepresenting experience refunds left with the Company to pay future premiums; 2) deposit administration funds used to fund non-pensionretiree insurance programs; 3) retained asset accounts; and 4) annuities or supplementary contracts without significant life contingencies.Interest credited on these funds is accrued ratably over the contract period.
G. Future Policy BenefitsFuture policy benefits represent the present value of estimated future obligations under long-term life and supplemental health insurancepolicies and annuity products currently in force. These obligations are estimated using actuarial methods and consist primarily of reserves forannuity contracts, life insurance benefits, GMDB contracts (see Note 9 for additional information) and certain health, life and accidentinsurance products of our Global Supplemental Benefits segment.
Obligations for annuities represent specified periodic benefits to be paid to an individual or groups of individuals over their remaining lives.Obligations for life insurance policies and GMDB contracts represent benefits to be paid to policyholders, net of future premiums to bereceived. Management estimates these obligations based on assumptions as to premiums, interest rates, mortality or morbidity, future claimadjudication expenses and surrenders, allowing for adverse deviation as appropriate. Mortality, morbidity and surrender assumptions arebased on the Company’s own experience and published actuarial tables. Interest rate assumptions are based on management’s judgmentconsidering the Company’s experience and future expectations, and range from 0.1% to 9%. Obligations for the run-off settlement annuitybusiness include adjustments for realized and unrealized investment returns consistent with GAAP when a premium deficiency exists.
H. Redeemable Noncontrolling InterestsProducts and services are offered in Turkey and India through joint venture entities for which the Company is the principal equity holder orprimary beneficiary. Accordingly, these entities are consolidated. The redeemable noncontrolling interests on our Consolidated Balance Sheetsrepresent our joint venture partners’ preferred and common stock interests in these entities. Our joint venture partners may, at their election,require the Company to purchase their redeemable noncontrolling interests. We also have the right to require our joint venture partners to selltheir redeemable noncontrolling interests to us. The redeemable noncontrolling interests were recorded at fair value as of the dates ofpurchase. When the estimated redemption value for a redeemable noncontrolling interest exceeds its carrying value, an adjustment to increasethe redeemable noncontrolling interest is recorded with an offsetting reduction to additional paid-in capital. When an adjustment is made tothe carrying value of the redeemable noncontrolling interest, the calculation of shareholders’ net income per share will be adjusted if theredemption value exceeds the greater of the carrying value or fair value.
I. Accounts Payable, Accrued Expenses and Other LiabilitiesAccounts payable, accrued expenses and other liabilities include liabilities for pension, other postretirement and postemployment benefits(see Note 15), GMIB contract liabilities (see Note 9), self-insured exposures, management compensation, cash overdraft positions and variousinsurance-related liabilities, including experience-rated refunds, reinsurance contracts and the minimum medical loss ratio rebate accrualunder The Patient Protection and Affordable Care Act (the ‘‘Health Care Reform Act’’ or ‘‘ACA’’). Legal costs to defend the Company’s litigationand arbitration matters are expensed when incurred in cases where the Company cannot reasonably estimate the ultimate cost to defend. Incases where the Company can reasonably estimate the cost to defend, a liability for these costs is accrued when the claim is reported.
70 CIGNA CORPORATION - 2016 Form 10-K
•
•
•
PART IIITEM 8. Financial Statements and Supplementary Data
J. Translation of Foreign CurrenciesThe Company generally conducts its international business through foreign operating entities that maintain assets and liabilities in localcurrencies that are generally their functional currencies. The Company uses exchange rates as of the balance sheet date to translate assets andliabilities into U.S. dollars. Translation gains or losses on functional currencies, net of applicable taxes, are recorded in accumulated othercomprehensive income (loss). The Company uses average monthly exchange rates during the year to translate revenues and expenses into U.S.dollars.
K. Premiums and Related ExpensesPremiums for group life, accident and health insurance and managed care coverages are recognized as revenue on a pro rata basis over thecontract period. Benefits and expenses are recognized when incurred and, for our Global Health Care insured business, medical costs arepresented net of pharmaceutical manufacturer rebates. For experience-rated contracts, premium revenue includes an adjustment forexperience-rated refunds based on contract terms and calculated using the customer’s experience (including estimates of incurred but notreported claims).
Premium revenue also includes an adjustment to reflect the estimated effect of rebates due to customers under the commercial minimummedical loss ratio provisions of the Health Care Reform Act. These rebates are settled in the year following the policy year.
Premiums received for the Company’s Medicare Advantage Plans and Medicare Part D products from the Centers for Medicare and MedicaidServices (‘‘CMS’’) and customers are recognized as revenue ratably over the contract period. CMS provides risk-adjusted premium paymentsfor Medicare Advantage Plans and Medicare Part D products based on the demographics and wellness of enrollees. The Company recognizesperiodic changes to risk-adjusted premiums as revenue when the amounts are determinable and collection is reasonably assured. Additionally,Medicare Part D premiums include payments from CMS for risk sharing adjustments. The risk sharing adjustments that are estimated quarterlybased on claim experience, compare actual incurred drug benefit costs to estimated costs submitted in original contracts and may result inmore or less revenue from CMS. Final revenue adjustments are determined and settled with CMS in the year following the contract year.Premium revenue also includes an adjustment to reflect the estimated effect of rebates due to CMS under the Medicare Advantage andMedicare Part D minimum medical loss ratio provisions of the Health Care Reform Act.
Accounting for the Health Care Reform Act’s Risk Mitigation Programs. Beginning in 2014, as prescribed by the Health Care Reform Act,programs went into effect to reduce the risk for participating health insurance companies selling coverage on the public exchanges.
A three-year (2014-2016) reinsurance program is designed to provide reimbursement to insurers for high cost individual business sold on oroff the public exchanges. The reinsurance entity established by the U.S. Department of Health and Human Services (‘‘HHS’’) is funded by aper-customer reinsurance fee assessed on all insurers, Health Maintenance Organizations (‘‘HMOs’’) and self-insured group health plans,excluding certain products such as Medicare Advantage and Medicare Part D. Only non-grandfathered individual plans are eligible forrecoveries if claims exceed a specified threshold, up to a reinsurance cap.
A permanent risk adjustment program reallocates funds from insurers with lower risk populations to insurers with higher risk populationsbased on the relative risk scores of participants in non-grandfathered plans in the individual and small group markets, both on and off theexchanges. We estimate our receivable or payable based on the risk of our members compared to the risk of other members in the same stateand market, considering data obtained from industry studies and HHS.
A three-year (2014-2016) risk corridor program is designed to limit insurer gains and losses by comparing allowable medical costs to a targetamount as defined by HHS. This program applies to individual and small group qualified health plans, operating on and off the exchanges.Variances from the target amount exceeding certain thresholds may result in amounts due to or due from HHS.
Reinsurance contributions associated with non-grandfathered individual plans are reported as reductions in premium revenues, and estimatedreinsurance recoveries are established with offsetting reductions in Global Health Care medical costs. Reinsurance fee contributions for otherinsured business are reported in other operating expenses. Final recoverable amounts are determined and settled with HHS in the yearfollowing the policy year. For the risk adjustment and risk corridor programs, the Company records receivables or payables as adjustments topremium revenue based on our year-to-date experience when the amounts are reasonably estimable and collection is reasonably assured.Final revenue adjustments are determined by HHS in the year following the policy year. For additional discussion on our revenue recognitionconsiderations for the risk corridor program in 2016, see Note 22.
Premiums for individual life, accident and supplemental health insurance and annuity products, excluding universal life and investment-relatedproducts, are recognized as revenue when due. Benefits and expenses are matched with premiums.
Revenue for universal life products is recognized as follows:
Investment income on assets supporting universal life products is recognized in net investment income as earned.
Charges for mortality, administration and policy surrender are recognized in premiums as earned. Administrative fees are considered earnedwhen services are provided.
Benefits and expenses for universal life products consist of benefit claims in excess of policyholder account balances and income earned bypolicyholders. Expenses are recognized when claims are incurred, and income is credited to policyholders in accordance with contractprovisions.
The unrecognized portion of premiums received is recorded as unearned premiums.
CIGNA CORPORATION - 2016 Form 10-K 71
•
•
•
•
•

PART IIITEM 8. Financial Statements and Supplementary Data
L. Fees, Related Expenses and Mail Order Pharmacy Revenues and CostsContract fees for administrative services only (‘‘ASO’’) programs and pharmacy programs and services are recognized in fees and otherrevenues as services are provided, net of estimated pharmaceutical manufacturer rebates payable to ASO clients using our network of retailpharmacies and estimated refunds under performance guarantees. Expenses associated with these programs and services are recognized inother operating expenses as incurred, net of estimated pharmaceutical rebates from manufacturers for prescriptions filled through ournetwork of retail pharmacies.
In some cases, the Company provides performance guarantees associated with meeting certain service standards, clinical outcomes orfinancial metrics. If these service standards, clinical outcomes or financial metrics are not met, the Company may be financially at risk up to astated percentage of the contracted fee or a stated dollar amount. The Company defers revenues for estimated payouts associated with theseperformance guarantees. Approximately 10% of ASO fees reported for the year ended December 31, 2016 were at risk under performanceguarantees, with reimbursements estimated to be less than 1% of revenues.
Revenues for investment-related products are recognized as follows:
Investment income on assets supporting investment-related products is recognized in net investment income as earned.
Contract fees based upon related administrative expenses are recognized in fees and other revenues as they are earned ratably over thecontract period.
Benefits and expenses for investment-related products consist primarily of income credited to policyholders in accordance with contractprovisions.
Mail order pharmacy revenues and the cost of prescriptions are recognized as each prescription is shipped. Mail order pharmacy revenues arepresented net of estimated pharmaceutical manufacturer rebates payable to ASO clients using our mail order business. Mail order pharmacycosts include the cost of prescriptions sold and other costs to operate this business including supplies, shipping and handling, net of estimatedpharmaceutical rebates from manufacturers for prescriptions filled through our mail order business.
Mergers and AcquisitionsProposed MergerOn July 23, 2015, the Company entered into a merger agreement with Anthem, Inc. (‘‘Anthem’’) and Anthem Merger Sub Corp. (‘‘Merger Sub’’),a direct wholly-owned subsidiary of Anthem.
The merger agreement provides (a) for the merger of the Company and Merger Sub, with the Company continuing as the surviving corporationand (b) if certain tax opinions are delivered, immediately following the completion of the initial merger, for the surviving corporation to bemerged with and into Anthem, with Anthem continuing as the surviving corporation (collectively, the ‘‘merger’’). Subject to certain terms,conditions, and customary operating covenants, each share of Cigna common stock issued and outstanding immediately prior to the effectivetime of the merger would be converted into the right to receive (a) $103.40 in cash, without interest, and (b) 0.5152 of a share of Anthemcommon stock. The closing price of Anthem common stock on February 22, 2017 was $163.27.
At special shareholders’ meetings held in December 2015, Cigna shareholders approved the merger and Anthem shareholders approved theissuance of shares of Anthem common stock in connection with the merger. Completing the merger remains subject to certain customaryconditions, including the receipt of certain necessary governmental and regulatory approvals and the absence of a legal restraint prohibitingthe merger. Completing the merger is not subject to a financing condition.
On July 21, 2016, the U.S. Department of Justice (‘‘DOJ’’) and certain state attorneys general filed a civil antitrust lawsuit in the U.S. District Court for theDistrict of Columbia (the ‘‘District Court’’) seeking to block the merger and, on January 4, 2017, the parties concluded the District Court trial.
On January 18, 2017, the Company received a written notice from Anthem seeking to extend the termination date of the merger agreementfrom January 31, 2017 to April 30, 2017.
On February 8, 2017, the District Court issued an order enjoining the proposed merger. Anthem filed a notice of appeal of the District Court’s order withthe U.S. Court of Appeals for the District of Columbia Circuit (the ‘‘Appeals Court’’) and requested an expedited appeal.
On February 14, 2017, the Company delivered a notice to Anthem terminating the merger agreement and filed suit in the Delaware Court ofChancery (the ‘‘Chancery Court’’) seeking, among other things, declaratory judgment that Cigna’s termination of the merger agreement islawful and that Anthem does not have the right to extend the merger agreement termination date. Later that day, Anthem filed a lawsuit in theChancery Court against the Company seeking, among other things, a temporary restraining order to enjoin Cigna from terminating the mergeragreement, specific performance and damages, and, on February 15, 2017, the Chancery Court issued an order temporarily enjoining theCompany from terminating the merger agreement. This order will be subject to further review at a preliminary injunction hearing.
On February 17, 2017, the Appeals Court granted Anthem’s motion for an expedited appeal and set oral arguments for March 24, 2017. Thatsame day, the Company filed its notice of appeal of the District Court’s order enjoining the merger with the Appeals Court.
The merger agreement contains customary covenants, including covenants that Cigna conduct its business in the ordinary course during theperiod between entering into the merger agreement and closing. In addition, Cigna’s ability to take certain actions prior to closing withoutAnthem’s consent is subject to certain limitations. These limitations relate to, among other matters, the payment of dividends, capitalexpenditures, the payment or retirement of indebtedness or the incurrence of new indebtedness, settlement of material claims or proceedings,mergers or acquisitions, and certain employment-related matters.
The Company incurred pre-tax costs of $166 million ($147 million after-tax) for the year ended December 31, 2016, and $66 million ($57 millionafter-tax) for the year ended December 31, 2015 directly related to the proposed merger. These costs consisted primarily of fees for financialadvisory, legal and other professional services. If the merger is consummated, most of the merger-related costs are not deductible for federalincome tax purposes. If the merger is not consummated, most of these costs would become deductible for federal income tax purposes,resulting in a tax benefit of approximately $50 million.
72 CIGNA CORPORATION - 2016 Form 10-K
•
•
NOTE 3

PART IIITEM 8. Financial Statements and Supplementary Data
AcquisitionsThe Company completed certain acquisitions during the three years ended December 31, 2016 that were not material to the Company’s resultsof operations, liquidity or financial condition. In accordance with GAAP, the purchase price for each acquisition was allocated to the tangibleand intangible net assets acquired based on management’s estimates of their fair values.
Earnings Per ShareAccounting policy. The Company computes basic earnings per share using the weighted-average number of unrestricted common anddeferred shares outstanding. Diluted earnings per share also includes the dilutive effect of outstanding employee stock options and restrictedstock using the treasury stock method and the effect of strategic performance shares.
Basic and diluted earnings per share were computed as follows:
2016 2015 2014
Effect of Effect of Effect of(Shares in thousands,dollars in millions, except per share amounts) Basic Dilution Diluted Basic Dilution Diluted Basic Dilution Diluted
Shareholders’ net income $ 1,867 $ – $ 1,867 $ 2,094 $ – $ 2,094 $ 2,102 $ – $ 2,102
Shares:Weighted average 255,360 – 255,360 256,149 – 256,149 263,889 – 263,889Common stock equivalents 4,287 4,287 4,443 4,443 4,714 4,714
Total shares 255,360 4,287 259,647 256,149 4,443 260,592 263,889 4,714 268,603
EPS $ 7.31 $ (0.12) $ 7.19 $ 8.17 $ (0.13) $ 8.04 $ 7.97 $ (0.14) $ 7.83
The following outstanding employee stock options were not included in the computation of diluted earnings per share because their effect wasanti-dilutive.
(In millions) 2016 2015 2014
Anti-dilutive options 2.3 0.4 1.0
DebtThe outstanding amounts of debt and capital leases for the years ended December 31 were as follows:
(In millions) 2016 2015
Short-term:Commercial paper $ – $ 100Current maturities of long-term debt 250 –Other, including capital leases 26 49
Total short-term debt $ 276 $ 149
Long-term:Uncollateralized debt:$250 million, 5.375% Notes due 2017 $ – $ 249$131 million, 6.35% Notes due 2018 131 131$250 million, 4.375% Notes due 2020 (1) 252 254$300 million, 5.125% Notes due 2020 (1) 301 303$78 million, 6.37% Notes due 2021 78 78$300 million, 4.5% Notes due 2021 (1) 302 304$750 million, 4% Notes due 2022 744 743$100 million, 7.65% Notes due 2023 100 100$17 million, 8.3% Notes due 2023 17 17$900 million, 3.25% Notes due 2025 893 892$300 million, 7.875% Debentures due 2027 299 299$83 million, 8.3% Step Down Notes due 2033 82 82$500 million, 6.15% Notes due 2036 498 498$300 million, 5.875% Notes due 2041 296 295$750 million, 5.375% Notes due 2042 743 743Other, including capital leases 20 32
Total long-term debt $ 4,756 $ 5,020
(1) The Company has entered into interest rate swap contracts hedging a portion of these fixed-rate debt instruments. See Note 12 for further information about the Company’s interest raterisk management and these derivative instruments.
The Company has a five-year revolving credit and letter of credit agreement for $1.5 billion that permits up to $500 million to be used for lettersof credit. This agreement extends through December 2019 and is diversified among 16 banks with three banks each having 12% of thecommitment and the remainder spread among 13 banks. The credit agreement includes options to increase the commitment amount to$2 billion and to extend the term past December 2019, subject to consent by the administrative agent and the committing banks. The creditagreement is available for general corporate purposes including for the issuance of letters of credit. The credit agreement contains customarycovenants and restrictions, including a financial covenant that the Company may not permit its leverage ratio – that is total consolidated debt
CIGNA CORPORATION - 2016 Form 10-K 73
NOTE 4
NOTE 5

PART IIITEM 8. Financial Statements and Supplementary Data
to total consolidated capitalization (each as defined in the credit agreement) – to exceed 0.50. The leverage ratio excludes the following itemsthat are included in accumulated other comprehensive loss on the Company’s Consolidated Balance Sheets: net unrealized appreciation infixed maturities and the portion of the post-retirement benefits liability adjustment attributable to pension. The Company was in compliancewith its debt covenants as of December 31, 2016.
The Company had $9.7 billion of borrowing capacity within the maximum debt coverage covenant in the letter of credit agreement, in additionto the $5 billion of debt outstanding as of December 31, 2016. This additional borrowing capacity includes the $1.5 billion available under thecredit agreement. Letters of credit outstanding as of December 31, 2016 totaled $14 million.
On March 11, 2015, the Company issued $900 million of 10-Year Notes due April 15, 2025 at a stated interest rate of 3.25% ($892 million, net ofdiscount and issuance costs, with an effective annual interest rate of 3.36%). Interest is payable on April 15 and October 15 of each yearbeginning October 15, 2015. The proceeds of this debt were used to repay debt maturing in 2016 and in 2019 as described below.
The Company may redeem these Notes, at any time, in whole or in part, at a redemption price equal to the greater of:
100% of the principal amount of the Notes to be redeemed; or
the present value of the remaining principal and interest payments on the Notes being redeemed discounted at the applicable Treasury rateplus 17.5 basis points.
The following debt transactions occurred in April 2015:
The Company redeemed its 2.75% Notes due 2016, including accrued interest from November 15, 2014 through the settlement date of April 13,2015. The redemption price equaled the present value of the remaining principal and interest payments on the Notes being redeemed,discounted at a rate equal to the 10-year Treasury Rate plus a fixed spread of 30 basis points. The Company paid $626 million includingaccrued interest and expenses, resulting in a pre-tax loss on early debt extinguishment of $21 million ($14 million after-tax) that wasrecognized in the second quarter of 2015.
The Company redeemed its 8.50% Notes due 2019, including accrued interest from November 1, 2014 through the settlement date of April 13,2015. The redemption price equaled the present value of the remaining principal and interest payments on the Notes being redeemed,discounted at a rate equal to the 10-year Treasury Rate plus a fixed spread of 50 basis points. The Company paid $329 million includingaccrued interest and expenses, resulting in a pre-tax loss on early debt extinguishment of $79 million ($51 million after-tax) that wasrecognized in the second quarter of 2015.
Maturities of long-term debt and capital leases are as follows:
Scheduled MaturitiesLong-term Capital
(In millions) Debt (1) Leases
2017 $ 255 $ 212018 $ 131 $ 102019 $ – $ 102020 $ 549 $ –2021 $ 378 $ –Maturities after 2021 $ 3,694 $ –
(1) Long-term debt maturity amounts exclude capital leases.
Interest expense on long-term and short-term debt was $251 million in 2016, $252 million in 2015, and $265 million in 2014. The 2015 expenseexcludes losses on the early extinguishment of debt.
Common and Preferred StockAs of December 31, the Company had issued the following shares:
(Shares in thousands) 2016 2015 2014
Common: Par value $0.25; 600,000 shares authorizedOutstanding – January 1, 256,544 259,276 275,526Issued for stock option and other benefit plans 1,110 2,751 2,284Repurchased common stock (785) (5,483) (18,534)
Outstanding – December 31, 256,869 256,544 259,276Treasury stock 39,276 39,601 36,869
Issued – December 31, 296,145 296,145 296,145
The Company maintains a share repurchase program authorized by its Board of Directors. Under this program, the Company may repurchaseshares from time to time. The timing and actual number of shares repurchased will depend on a variety of factors, including price, generalbusiness and market conditions, and alternate uses of capital. The share repurchase program may be effected through open market purchasesor privately negotiated transactions in compliance with Rule 10b-18 under the Securities Exchange Act of 1934, as amended, including throughRule 10b5-1 trading plans. The program may be suspended or discontinued at any time.
In 2014, the Company retired 70 million shares of treasury stock. This transaction had no effect on total shareholders’ equity.
The Company has authorized a total of 25 million shares of $1 par value preferred stock. No shares of preferred stock were outstanding atDecember 31, 2016, 2015 or 2014.
74 CIGNA CORPORATION - 2016 Form 10-K
•
•
•
•
NOTE 6

PART IIITEM 8. Financial Statements and Supplementary Data
Global Health Care Medical Costs PayableAccounting policy. The Company uses actuarial principles and assumptions that are consistently applied each reporting period andrecognizes the actuarial best estimate of the ultimate liability along with a margin for adverse deviation. This approach is consistent withactuarial standards of practice that the liabilities be adequate under moderately adverse conditions.
This liability is primarily calculated using ‘‘completion factors’’ developed by comparing the claim incurral date to the date claims were paid.Completion factors are impacted by several key items including changes in: 1) electronic (auto-adjudication) versus manual claim processing,2) provider claims submission rates, 3) membership and 4) the mix of products. The Company uses historical completion factors combinedwith an analysis of current trends and operational factors to develop current estimates of completion factors. The Company estimates theliability for claims incurred in each month by applying the current estimates of completion factors to the current paid claims data. Thisapproach implicitly assumes that historical completion rates will be a useful indicator for the current period.
For more recent months, the Company relies more heavily on medical cost trend analysis that reflects expected claim payment patterns andother relevant operational considerations. Medical cost trend is primarily impacted by medical service utilization and unit costs that areaffected by changes in the level and mix of medical benefits offered, including inpatient, outpatient and pharmacy, the impact of copays anddeductibles, changes in provider practices and changes in consumer demographics and consumption behavior.
For each reporting period, the Company compares key assumptions used to establish the medical costs payable to actual experience. Whenactual experience differs from these assumptions, medical costs payable are adjusted through current period shareholders’ net income.Additionally, the Company evaluates expected future developments and emerging trends that may impact key assumptions. The process usedto determine this liability requires the Company to make critical accounting estimates that involve considerable judgment, reflecting thevariability inherent in forecasting future claim payments. These estimates are highly sensitive to changes in the Company’s key assumptions,specifically completion factors and medical cost trends.
Liability balance details. The liability for Global Health Care medical costs payable as of December 31 is comprised of the following:
(In millions) 2016 2015
Incurred but not reported $ 1,858 $ 1,757Reported claims in process 556 470Physician incentives and other medical care expense and services payable 118 128
Medical costs payable $ 2,532 $ 2,355
Activity in medical costs payable was as follows:
(In millions) 2016 2015 2014
Balance at January 1, $ 2,355 $ 2,180 $ 2,050Less: Reinsurance and other amounts recoverable 243 252 194
Balance at January 1, net 2,112 1,928 1,856Incurred costs related to:
Current year 19,087 18,564 16,853Prior years (78) (210) (159)
Total incurred 19,009 18,354 16,694Paid costs related to:
Current year 17,052 16,588 14,966Prior years 1,812 1,582 1,656
Total paid 18,864 18,170 16,622Balance at December 31, net 2,257 2,112 1,928Add: Reinsurance and other amounts recoverable 275 243 252
Balance at December 31, $ 2,532 $ 2,355 $ 2,180
Reinsurance and other amounts recoverable reflect amounts due from reinsurers and policyholders to cover incurred but not reported andpending claims for certain business where the Company administers the plan benefits but the right of offset does not exist. See Note 9 foradditional information on reinsurance.
For the years ended December 31, variances in incurred costs related to prior years’ medical costs payable that resulted from the differencesbetween actual experience and the Company’s key assumptions were as follows:
2016 2015
($ in millions) $ % (1) $ % (2)
Actual completion factors $ 59 0.3% $ 62 0.4%Medical cost trend 27 0.1% 115 0.7%Other (3) (8) 0.0% 33 0.2%
Total favorable (unfavorable) variance $ 78 0.4% $ 210 1.3%
(1) Percentage of current year incurred costs as reported for 2015.
(2) Percentage of current year incurred costs as reported for 2014.
(3) In 2015, the other balance primarily relates to an increase in the 2014 reinsurance reimbursement rate from CMS under the Health Care Reform Act.
CIGNA CORPORATION - 2016 Form 10-K 75
NOTE 7

PART IIITEM 8. Financial Statements and Supplementary Data
Incurred costs related to prior years in the table above, although adjusted through shareholders’ net income, do not directly correspond to anincrease or decrease to shareholders’ net income. The primary reason for this difference is that decreases to prior year incurred costspertaining to the portion of the liability established for moderately adverse conditions are not considered as impacting shareholders’ netincome if they are offset by increases in the current year provision for moderately adverse conditions.
The net impact of prior year development on shareholders’ net income was not significant for the year ended December 31, 2016 comparedwith a $60 million increase for the year ended December 31, 2015. Favorable prior year development implies primarily lower than expectedutilization of medical services and vice versa while amounts close to zero imply utilization of medical services that are consistent withexpectations.
The table below depicts the incurred and paid claims development as of December 31, 2016 (net of reinsurance), claims frequency metrics andincurred but not reported liabilities for Cigna’s Global Health Care medical costs payable. The information about incurred and paid claimsdevelopment for the year ended December 31, 2015 is presented as supplementary information and is unaudited.
Incurred Costs
2015 Medical Costs($ in millions, except for claims frequency)Incurral Year (Unaudited) 2016 Payable Claims Frequency
2015 $ 18,564 $ 18,487 $ 182 2.5 million2016 19,087 $ 2,035 2.9 million
Cumulative incurred costs for the periods presented $ 37,574
Cumulative Paid Costs2015
Incurral Year (Unaudited) 2016
2015 $ 16,588 $ 18,3052016 17,052
Cumulative paid costs for the periods presented $ 35,357Outstanding liabilities prior to 2015 40
Net outstanding liabilities for Global Health Care medical costspayable 2,257Reinsurance and other amounts recoverable 275
Total liability for Global Health Care medical costs payable $ 2,532
More than 95% of health claims for an accident year are paid within one year of their incurred date.
There is no single or common claim frequency metric used in the health care industry. The Company believes a relevant metric for the GlobalHealth Care segment is the number of customers for whom an insured medical claim was paid. This metric will generally be consistent andcomparable over time.
Liabilities for Unpaid Claims and Claim ExpensesAs discussed in Note 2, the Company is newly required by ASU 2015-09 to present additional information about its claim estimates related toshort-duration insurance contracts. The following information relates to the Company’s unpaid claims and claim expense liabilities.
Accounting policy. Liabilities for unpaid claims and claim expenses are established by book of business within the Company’s GroupDisability and Life, Global Supplemental Benefits and Other Operations segments. The Group Disability and Life segment’s liability for unpaidclaims and claim expenses consists of the following primary products: long-term and short-term disability, life insurance, and accidentcoverages. Unpaid claims and claim expenses consist of (1) case or claims reserves for known claims that are unpaid as of the balance sheetdate; (2) incurred but not reported reserves for claims when the insured event has occurred but has not been reported to the Company; and(3) loss adjustment expense reserves for the expected costs of settling these claims. The Company consistently estimates incurred but not yetreported losses using actuarial principles and assumptions based on historical and projected claim incidence patterns, claim size and theexpected payment period. The Company recognizes the actuarial best estimate of the ultimate liability within a level of confidence, consistentwith actuarial standards of practice that the liabilities be adequate under moderately adverse conditions. When estimates of these liabilitieschange, the Company immediately records the adjustment in benefits and expenses.
The Company’s liability for disability claims reported but not yet paid is the present value of estimated future benefit payments over theexpected disability period. The Company projects the expected disability period by using historical resolution rates combined with an analysisof current trends and operational factors to develop current estimates of resolution rates. Using the Company’s experience, expected claimresolution rates may vary based upon the anticipated disability period, the covered benefit period, the cause of disability, the benefit designand the claimant’s age, gender and income level. The gross monthly benefit is reduced (offset) by disability income received under otherbenefit programs, most commonly Social Security Disability Income, workers’ compensation, statutory disability or other group benefit plans.For certain offsets not yet finalized, the Company estimates the probability and amount of future offset awards and lapses based on theCompany’s experience.
76 CIGNA CORPORATION - 2016 Form 10-K
NOTE 8

PART IIITEM 8. Financial Statements and Supplementary Data
Liability balance details. The liability for unpaid claims and claim expenses by segment as of December 31 is as follows:
(In millions) 2016 2015
Group Disability and Life $ 4,342 $ 4,006Global Supplemental Benefits 384 353Other Operations 191 215
Unpaid claims and claim expenses $ 4,917 $ 4,574
The Company discounts certain liabilities, predominantly long-term disability, because benefits payments are made over extended periods.Discount rate assumptions for these liabilities are based on projected investment returns for the supporting asset portfolios. Details of theCompany’s unpaid claim discounted liability balances as of December 31 were as follows:
(In billions) 2016 2015
Discounted liabilities $ 3.9 $ 3.7Aggregate amount of discount $ 1.1 $ 1.0Range of discount rates 3.3% - 5.8% 3.5% - 5.7%
Interest is accreted and recognized in other benefit expenses in the Consolidated Statements of Income.
Activity in the Company’s Group Disability and Life and the Global Supplemental Benefits segments’ liabilities for unpaid claims and claimexpenses are presented in the following table. Liabilities associated with the Company’s Other Operations segment are excluded because theypertain to obligations for long-duration insurance contracts or, if short-duration, the liabilities have been fully reinsured.
(In millions) 2016 2015 2014
Balance at January 1, $ 4,359 $ 4,178 $ 4,038Less: Reinsurance 115 104 99
Balance at January 1, net 4,244 4,074 3,939Incurred claims related to:
Current year 4,258 3,813 3,512Prior years:
Interest accretion 161 163 149All other incurred 93 (91) (165)
Total incurred 4,512 3,885 3,496Paid claims related to:
Current year 2,575 2,325 2,078Prior years 1,560 1,382 1,271
Total paid 4,135 3,707 3,349Acquisitions – 11 –Foreign currency (16) (19) (12)Balance at December 31, net 4,605 4,244 4,074Add: Reinsurance 121 115 104
Balance at December 31, $ 4,726 $ 4,359 $ 4,178
Reinsurance in the table above reflect amounts due from reinsurers related to unpaid claims liabilities. The Company’s insurance subsidiariesenter into agreements with other companies primarily to limit losses from large exposures and to permit recovery of a portion of incurredlosses. See Note 9 for additional information on reinsurance.
The majority of the liability for unpaid claims and claim expenses is related to disability claims with long-tailed payouts. Interest earned onassets backing these liabilities is an integral part of pricing and reserving. Therefore, interest accreted on prior year balances is shown as aseparate component of prior year incurred claims. This interest is calculated by applying the average discount rate used in determining theliability balance to the average liability balance over the period. The remaining prior year incurred claims amount primarily reflects updates tothe Company’s liability estimates and variances between actual experience during the period relative to the assumptions and expectationsreflected in determining the liability. Assumptions reflect the Company’s expectations over the life of the book of business and will vary fromactual experience in any period, both favorably and unfavorably, with variation in resolution rates being the most significant driver for thelong-term disability business. Prior year incurred claims reported in 2016 included the impact of modifications made to our disability claimsmanagement process and a period of elevated life claims.
Long-Term Disability Development Tables. The table below presents information about incurred and paid claims development as ofDecember 31, 2016 (net of reinsurance) cumulative claim frequency and total incurred but not reported liabilities for the Company’s long-termdisability book of business. The information about incurred and paid claims development for the years ended December 31, 2012 through 2015,is presented as supplementary information and is unaudited. As permitted under the standard in the initial year of adoption, the Company
CIGNA CORPORATION - 2016 Form 10-K 77

PART IIITEM 8. Financial Statements and Supplementary Data
presented development table information for five years because obtaining information beyond this period was impracticable as historical datawas not maintained in such detail at this level.
(In millions, except for claims frequency)
IncurredIncurred Claims (undiscounted) But Not
2012 2013 2014 2015 Reported ClaimsAccident Year (Unaudited) (Unaudited) (Unaudited) (Unaudited) 2016 Liabilities Frequency
2012 $ 995 $ 951 $ 889 $ 876 $ 883 $ – 21,1702013 1,063 1,037 1,062 1,072 – 23,4932014 1,158 1,129 1,167 3 25,1752015 1,184 1,154 17 25,1332016 1,246 524 13,734
Cumulative incurred claims for the periods presented $ 5,522
Cumulative Paid Claims
2012 2013 2014 2015Accident Year (Unaudited) (Unaudited) (Unaudited) (Unaudited) 2016
2012 $ 81 $ 288 $ 429 $ 504 $ 5712013 92 342 503 6002014 111 379 5752015 114 4172016 122
Cumulative paid claims for the periods presented 2,285All outstanding liabilities prior to 2012, net of reinsurance 1,361Impact of discounting (976)
Liability for long-term disability unpaid claims and claim expenses, net of reinsurance $ 3,622
The claims frequency metric used for the Company’s long-term disability line of business represents the number of unique claim events forwhich benefits have been approved and payments made. Claim events are identified using a unique claimant identifier and incurral date. Thus,if an individual has multiple claims for different disabling events (and therefore different incurral dates), each will be determined to be a uniqueclaim event. However, if an individual receives multiple benefits under more than one policy (for example for supplemental disability benefitssuch as pension contribution benefits or survivor benefits), the Company treats this as a single claim occurrence because they related to thesame claim event. Claims frequency metrics for the most recent year are expected to be low, reflecting the long-term disability productfeatures including waiting and elimination periods that result in delayed eligibility for contract benefits.
The following is supplementary and unaudited information about average historical claims payout patterns for the long-term disabilitybusiness for the years presented in the development table as of December 31, 2016. The average annual percentage payout of incurred claims,net of reinsurance, is approximately 9% in year one, 24% in year two, 16% in year three, 9% in year four and 8% in year five.
The following reconciles the long-term disability net incurred and paid claims development table to the liability for unpaid claims and claimexpenses in the Company’s Consolidated Balance Sheets as of December 31, 2016.
(In millions)
Net outstanding liabilities — Group Disability and Life segmentLong-term disability liabilities, net of reinsurance $ 3,622Other short-duration insurance books of business, net of reinsurance 620
Liabilities for unpaid claims and claim expenses, net of reinsurance 4,242
Reinsurance recoverable on unpaid claims — Group Disability and Life segmentLong-term disability 86Other short-duration insurance books of business 14
Total reinsurance recoverable on unpaid claims 100
Total liability for unpaid claims and claim expenses — Group Disability and Life segment 4,342Global Supplemental Benefits segment 384Other Operations segment 191
Total liability for unpaid claims and claim expenses $ 4,917
The other short-duration insurance books of business, net of reinsurance, primarily include liabilities for life, accident and short-term disabilityinsurance products. Liabilities for these products are typically complete within one year. Claim development on these liabilities is largely drivenby completion factors and loss ratio assumptions. In 2016, development on these liabilities was driven by a period of elevated life claims.
ReinsuranceThe Company’s insurance subsidiaries enter into agreements with other insurance companies to assume and cede reinsurance. Reinsurance isceded primarily to limit losses from large exposures and to permit recovery of a portion of direct or assumed losses. Reinsurance is also used inacquisition and disposition transactions when the underwriting company is not being acquired. Reinsurance does not relieve the originating
78 CIGNA CORPORATION - 2016 Form 10-K
NOTE 9

PART IIITEM 8. Financial Statements and Supplementary Data
insurer of liability. Therefore, reinsured liabilities must continue to be reported along with the related reinsurance recoverables. The Companyregularly evaluates the financial condition of its reinsurers and monitors concentrations of its credit risk.
The majority of the Company’s reinsurance recoverables resulted from acquisition and disposition transactions in which the underwritingcompany was not acquired. Components of the Company’s reinsurance recoverables are presented below:
(In millions) December 31, December 31,Line of Business Reinsurer(s) 2016 2015 Collateral and Other Terms at December 31, 2016
Ongoing operations:Global Health Care, Global Various $ 478 $ 553 Recoverables from approximately 80 reinsurers,Supplemental Benefits, including the U.S. Government, used in the ordinaryGroup Disability and Life course of business. Current balances range from
less than $1 million up to $96 million. Excluding therecoverable from the U.S. Government of$63 million, 13% is secured by assets in trusts orletters of credit.
Total recoverables related to 478 553ongoing operationsAcquisition, disposition or runoff activities:Individual Life and Annuity Lincoln National Life and Lincoln 3,586 3,705 Both companies’ ratings were sufficient to avoid(sold in 1998) Life & Annuity of New York triggering a contractual obligation to fully secure
the outstanding balance.GMDB (effectively exited Berkshire 1,085 1,123 100% secured by assets in a trust.in 2013) Other 44 41 100% secured by assets in a trust or letters of
credit.Retirement Benefits Prudential Retirement Insurance 921 995 100% secured by assets in a trust.Business (sold in 2004) and AnnuitySupplemental Benefits Great American Life 297 315 99% secured by assets in a trust.Business (2012 acquisition)Other run-off reinsurance Various 67 81 99% secured by assets in a trust or other deposits.
Total recoverables related to 6,000 6,260acquisition, disposition orrunoff activities
Total reinsurance recoverables $ 6,478 $ 6,813
The Company bears the risk of loss if its reinsurers and retrocessionaires do not meet or are unable to meet their reinsurance obligations to theCompany. Over 90% of the Company’s reinsurance recoverables were from companies rated A or higher by Standard & Poors at December 31,2016. The Company reviews its reinsurance arrangements and establishes reserves against the recoverables if recovery is not consideredprobable. As of December 31, 2016 and December 31, 2015, the Company’s recoverables were net of a reserve of $3 million.
The following table presents direct, assumed and ceded premiums for both short-duration and long-duration insurance contracts. It alsopresents reinsurance recoveries that have been netted against benefits and expenses in the Company’s Consolidated Statements of Income.
(In millions) 2016 2015 2014
PremiumsShort-duration contracts:
Direct $ 27,496 $ 26,751 $ 24,294Assumed 247 289 429Ceded (229) (254) (226)
Total short-duration contract premiums 27,514 26,786 24,497
Long-duration contracts:Direct 3,259 3,061 2,921Assumed 137 111 173
Ceded:Individual life insurance and annuity business sold (153) (158) (254)Other (131) (158) (123)
Total long-duration contract premiums 3,112 2,856 2,717
Total premiums $ 30,626 $ 29,642 $ 27,214
Reinsurance recoveriesIndividual life insurance and annuity business sold $ 279 $ 301 $ 366Other 261 436 292
Total reinsurance recoveries $ 540 $ 737 $ 658
The effects of reinsurance on written premiums for short-duration contracts were not materially different from the recognized premiumamounts shown in the table above.
CIGNA CORPORATION - 2016 Form 10-K 79
Reinsurance Recoverables
Effects of Reinsurance

PART IIITEM 8. Financial Statements and Supplementary Data
In 2013, the Company entered into an agreement with Berkshire to effectively exit the GMDB and GMIB business via a reinsurance transactionfor a payment of $2.2 billion. Berkshire reinsured 100% of the Company’s future claim payments in this business, net of retrocessionalarrangements existing at that time. The reinsurance agreement is subject to an overall limit with approximately $3.5 billion remaining atDecember 31, 2016.
A discussion of each of these businesses follows. While GMDB is accounted for as reinsurance, GMIB assets and liabilities are reported asderivatives at fair value as discussed below. Accordingly, GMIB assets are reported in other assets, including intangibles, and GMIB liabilities arereported in accounts payable, accrued expenses and other liabilities.
The majority of the GMDB exposure arises under annuities written by ceding companies that guarantee the benefit received at death will be noless than the highest historical account value of the related mutual fund investments on a contractholder’s anniversary date. Under this type ofdeath benefit, the Company’s exposure arises when the highest anniversary account value exceeds the fair value of the related mutual fundinvestments at the time of a contractholder’s death.
Accounting policy. The Company estimates the gross liability and reinsurance recoverable with an internal model based on the Company’sexperience and future expectations over an extended period, consistent with the long-term nature of this product. As a result of thereinsurance transaction, reserve increases have a corresponding increase in the recorded reinsurance recoverable, provided the increasedrecoverable remains within the overall Berkshire limit (including the GMIB asset presented below). The ending net retained reserve coversongoing administrative expenses, as well as minor claim exposure retained by the Company.
Because the product is premium deficient, the Company records an increase to the net retained reserve if it is inadequate based on the model.
Activity in future policy benefit reserves for the GMDB business was as follows:
(In millions) 2016 2015 2014
Balance at January 1, $ 1,252 $ 1,270 $ 1,396Add: Unpaid claims 18 16 18Less: Reinsurance and other amounts recoverable 1,164 1,186 1,317
Balance at January 1, net 106 100 97Add: Incurred benefits 4 3 3Less: Paid benefits / (recoveries) (1) (3) –
Ending balance, net 111 106 100Less: Unpaid claims 16 18 16Add: Reinsurance and other amounts recoverable 1,129 1,164 1,186
Balance at December 31, $ 1,224 $ 1,252 $ 1,270
Benefits paid and incurred are net of ceded amounts.
80 CIGNA CORPORATION - 2016 Form 10-K
Effective Exit of GMDB and GMIB Business
GMDB

PART IIITEM 8. Financial Statements and Supplementary Data
The table below presents the account value, net amount at risk and average attained age of underlying contractholders for guaranteesassumed by the Company in the event of death. The net amount at risk is the amount that the Company would have to pay if all contractholdersdied as of the specified date. Unless the Berkshire reinsurance limit is exceeded, the Company should be reimbursed in full for these payments.
(Dollars in millions, excludes impact of reinsurance ceded) 2016 2015
Account value $ 10,650 $ 11,355Net amount at risk $ 2,458 $ 2,870Average attained age of contractholders (weighted by exposure) 75 74Number of contractholders 285,000 324,000
In this business, the Company reinsured contracts with issuers of GMIB products. The Company’s exposure represents the excess of acontractually guaranteed amount over the level of variable annuity account values. Payment by the Company depends on the actual accountvalue in the underlying mutual funds and the level of interest rates when the contractholders elect to receive minimum income payments thatmust occur within 30 days of a policy anniversary after the appropriate waiting period. The Company has purchased retrocessional coverage(‘‘GMIB assets’’) for these contracts.
Accounting policy. The Company reports GMIB liabilities and assets as derivatives at fair value because cash flows of these liabilities andassets are affected by equity markets and interest rates, but are without significant life insurance risk and are settled in lump sum payments.Periodically, the Company receives and pays fees based on either contractholders’ account values or deposits increased at a contractual rate.The Company will also pay and receive cash depending on changes in account values and interest rates when contractholders first elect toreceive minimum income payments. Cash flows on these contracts are reported in operating activities.
As of December 31, 2016, there were three reinsurers for GMIB as follows:
(In millions) December 31, December 31,Line of Business Reinsurer(s) 2016 2015 Collateral and Other Terms at December 31, 2016
GMIB Berkshire $ 370 $ 420 100% were secured by assets in a trust.Sun Life Assurance Company of Canada 227 257Liberty Re (Bermuda) Ltd. 202 230 100% were secured by assets in a trust.
Total GMIB recoverables reported in other assets $ 799 $ 907
Assumptions used in fair value measurement. The Company estimates the fair value of the assets and liabilities for GMIB contracts bycalculating the results for many scenarios run through a model utilizing various assumptions. The only assumption expected to impact futureshareholders’ net income is non-performance risk. The non-performance risk adjustment reflects a market participant’s view of nonpaymentrisk by adding an additional spread to the discount rate in the calculation of both (a) the GMIB liabilities to be paid by the Company, and (b) theGMIB assets to be paid by the reinsurers, after considering collateral.
Other assumptions that affect GMIB assets and liabilities include capital market assumptions (including market returns, interest rates andmarket volatilities of the underlying equity and bond mutual fund investments) and future annuitant behavior (including mortality, lapse, andannuity election rates). As certain assumptions used to estimate fair values for these contracts are largely unobservable (primarily related tofuture annuitant behavior), the Company classifies GMIB assets and liabilities in Level 3 in the fair value hierarchy presented in Note 10.
The Company regularly evaluates each of the assumptions used in establishing these assets and liabilities. Significant decreases in assumedlapse rates or spreads used to calculate non-performance risk of the Company, or significant increases in assumed annuity election rates orspreads used to calculate the non-performance risk of the reinsurers, would result in higher fair value measurements. A change in one of theseassumptions is not necessarily accompanied by a change in another assumption.
GMIB guarantees. Future payments are not fixed and determinable under the terms of these contracts. Accordingly, the Company calculatedexposure, without considering any reinsurance coverage, using the following hypothetical assumptions:
no annuitants surrendered their accounts;
all annuitants lived to elect their benefit;
all annuitants elected to receive their benefit on the next available date (2017 through 2021); and
all underlying mutual fund investment values remained at the December 31, 2016 value of $810 million with no future returns.
The Company has reinsurance coverage in place that covers the exposures on these contracts. Using these hypothetical assumptions, GMIBexposure is $703 million, which is lower than the recorded liability for GMIB calculated using fair value assumptions.
CIGNA CORPORATION - 2016 Form 10-K 81
GMIB
•
•
•
•

PART IIITEM 8. Financial Statements and Supplementary Data
Fair Value MeasurementsThe Company carries certain financial instruments at fair value in the financial statements including fixed maturities, equity securities,short-term investments and derivatives. Other financial instruments are measured at fair value only under certain conditions, such as whenimpaired.
Fair value is defined as the price at which an asset could be exchanged in an orderly transaction between market participants at the balancesheet date. A liability’s fair value is defined as the amount that would be paid to transfer the liability to a market participant, not the amount thatwould be paid to settle the liability with the creditor.
The Company’s financial assets and liabilities carried at fair value have been classified based upon a hierarchy defined by GAAP. The hierarchygives the highest ranking to fair values determined using unadjusted quoted prices in active markets for identical assets and liabilities (Level 1)and the lowest ranking to fair values determined using methodologies and models with unobservable inputs (Level 3). An asset’s or a liability’sclassification is based on the lowest level of input that is significant to its measurement. For example, a financial asset or liability carried at fairvalue would be classified in Level 3 if unobservable inputs were significant to the instrument’s fair value, even though the measurement may bederived using inputs that are both observable (Levels 1 and 2) and unobservable (Level 3).
The Company estimates fair values using prices from third parties or internal pricing methods. Fair value estimates received from third-partypricing services are based on reported trade activity and quoted market prices when available, and other market information that a marketparticipant may use to estimate fair value. The internal pricing methods are performed by the Company’s investment professionals andgenerally involve using discounted cash flow analyses, incorporating current market inputs for similar financial instruments with comparableterms and credit quality, as well as other qualitative factors. In instances where there is little or no market activity for the same or similarinstruments, fair value is estimated using methods, models and assumptions that the Company believes a hypothetical market participantwould use to determine a current transaction price. These valuation techniques involve some level of estimation and judgment that becomessignificant with increasingly complex instruments or pricing models.
The Company is responsible for determining fair value, as well as for assigning the appropriate level within the fair value hierarchy, based on thesignificance of unobservable inputs. The Company reviews methodologies, processes and controls of third-party pricing services andcompares prices on a test basis to those obtained from other external pricing sources or internal estimates. The Company performs ongoinganalyses of both prices received from third-party pricing services and those developed internally to determine that they represent appropriateestimates of fair value. The controls executed by the Company include evaluating changes in prices and monitoring for potentially stalevaluations. The Company also performs sample testing of sales values to confirm the accuracy of prior fair value estimates. The minimalexceptions identified during these processes indicate that adjustments to prices are infrequent and do not significantly impact valuations.Annually, we conduct an on-site visit of the most significant pricing service to review their processes, methodologies and controls. This on-sitereview includes a walk-through of inputs of a sample of securities held across various asset types to validate the documented pricing process.
A. Financial Assets and Financial Liabilities Carried at Fair ValueThe following tables provide information as of December 31, 2016 and 2015 about the Company’s financial assets and liabilities carried at fairvalue. Separate account assets that are also recorded at fair value on the Company’s Consolidated Balance Sheets are reported separatelyunder the heading separate account assets as gains and losses related to these assets generally accrue directly to policyholders.
December 31, 2016
Quoted Prices in Significant Other SignificantActive Markets for Observable Unobservable
Identical Assets Inputs Inputs(In millions) (Level 1) (Level 2) (Level 3) Total
Financial assets at fair value:Fixed maturities:
Federal government and agency $ 374 $ 503 $ – $ 877State and local government – 1,435 – 1,435Foreign government – 2,066 47 2,113Corporate – 15,552 498 16,050Mortgage and other asset-backed – 329 157 486
Total fixed maturities (1) 374 19,885 702 20,961Equity securities 396 113 74 583
Subtotal 770 19,998 776 21,544Short-term investments – 691 – 691GMIB assets – – 799 799Other derivative assets – 10 – 10
Total financial assets at fair value, excluding separate accounts $ 770 $ 20,699 $ 1,575 $ 23,044
GMIB liabilities $ – $ – $ 780 $ 780Other derivative liabilities – 5 – 5
Total financial liabilities at fair value $ – $ 5 $ 780 $ 785
(1) Fixed maturities included $524 million of net appreciation required to adjust future policy benefits for the run-off settlement annuity business including $14 million of appreciation forsecurities classified in Level 3. See Note 11A for additional information.
82 CIGNA CORPORATION - 2016 Form 10-K
NOTE 10

PART IIITEM 8. Financial Statements and Supplementary Data
December 31, 2015
Quoted Prices in Significant Other SignificantActive Markets for Observable Unobservable
Identical Assets Inputs Inputs(In millions) (Level 1) (Level 2) (Level 3) Total
Financial assets at fair value:Fixed maturities:
Federal government and agency $ 251 $ 528 $ – $ 779State and local government – 1,641 – 1,641Foreign government – 2,010 4 2,014Corporate – 14,122 326 14,448Mortgage and other asset-backed – 246 327 573
Total fixed maturities (1) 251 18,547 657 19,455Equity securities 32 89 69 190
Subtotal 283 18,636 726 19,645Short-term investments – 381 – 381GMIB assets – – 907 907Other derivative assets – 16 – 16
Total financial assets at fair value, excluding separate accounts $ 283 $ 19,033 $ 1,633 $ 20,949
GMIB liabilities $ – $ – $ 885 $ 885
Total financial liabilities at fair value $ – $ – $ 885 $ 885
(1) Fixed maturities included $483 million of net appreciation required to adjust future policy benefits for the run-off settlement annuity business including $30 million of appreciation forsecurities classified in Level 3. See Note 11A for additional information.
Level 1 Financial AssetsInputs for instruments classified in Level 1 include unadjusted quoted prices for identical assets in active markets accessible at themeasurement date. Active markets provide pricing data for trades occurring at least weekly and include exchanges and dealer markets.
Assets in Level 1 include actively-traded U.S. government bonds and exchange-listed equity securities. Given the narrow definition of Level 1and the Company’s investment asset strategy to maximize investment returns, a relatively small portion of the Company’s investment assetsare classified in this category.
Level 2 Financial Assets and Financial LiabilitiesInputs for instruments classified in Level 2 include quoted prices for similar assets or liabilities in active markets, quoted prices from thosewilling to trade in markets that are not active, or other inputs that are market observable or can be corroborated by market data for the term ofthe instrument. Such other inputs include market interest rates and volatilities, spreads and yield curves. An instrument is classified in Level 2 ifthe Company determines that unobservable inputs are insignificant.
Fixed maturities and equity securities. Approximately 93% of the Company’s investments in fixed maturities and equity securities areclassified in Level 2 including most public and private corporate debt and equity securities, federal agency and municipal bonds,non-government mortgage-backed securities and preferred stocks. Because many fixed maturities do not trade daily, third-party pricingservices and internal methods often use recent trades of securities with similar features and characteristics. When recent trades are notavailable, pricing models are used to determine these prices. These models calculate fair values by discounting future cash flows at estimatedmarket interest rates. Such market rates are derived by calculating the appropriate spreads over comparable U.S. Treasury securities, based onthe credit quality, industry and structure of the asset. Typical inputs and assumptions to pricing models include, but are not limited to, acombination of benchmark yields, reported trades, issuer spreads, liquidity, benchmark securities, bids, offers, reference data, and industry andeconomic events. For mortgage-backed securities, inputs and assumptions may also include characteristics of the issuer, collateral attributes,prepayment speeds and credit rating.
Nearly all of these instruments are valued using recent trades or pricing models. Less than 1% of the fair value of investments classified in Level 2represents foreign bonds that are valued using a single unadjusted market-observable input derived by averaging multiple broker-dealerquotes, consistent with local market practice.
Short-term investments are carried at fair value that approximates cost. On a regular basis, the Company compares market prices for thesesecurities to recorded amounts to validate that current carrying amounts approximate exit prices. The short-term nature of the investmentsand corroboration of the reported amounts over the holding period support their classification in Level 2.
Other derivatives classified in Level 2 represent over-the-counter instruments such as interest rate and foreign currency swap contracts. Fairvalues for these instruments are determined using market observable inputs including forward currency and interest rate curves and widelypublished market observable indices. Credit risk related to the counterparty and the Company is considered when estimating the fair values ofthese derivatives. However, the Company is largely protected by collateral arrangements with counterparties and determined that noadjustment for credit risk was required as of December 31, 2016 or 2015. Level 2 also includes exchange-traded interest rate swap contracts.Credit risk related to the clearinghouse counterparty and the Company is considered minimal when estimating the fair values of thesederivatives because of upfront margin deposits and daily settlement requirements. The nature and use of these other derivatives are describedin Note 12.
CIGNA CORPORATION - 2016 Form 10-K 83

PART IIITEM 8. Financial Statements and Supplementary Data
Level 3 Financial Assets and Financial LiabilitiesCertain inputs for instruments classified in Level 3 are unobservable (supported by little or no market activity) and significant to their resultingfair value measurement. Unobservable inputs reflect the Company’s best estimate of what hypothetical market participants would use todetermine a transaction price for the asset or liability at the reporting date.
The Company classifies certain newly issued, privately-placed, complex or illiquid securities, as well as assets and liabilities relating to GMIB, inLevel 3. Approximately 4% of fixed maturities and equity securities are priced using significant unobservable inputs and classified in thiscategory.
Fair values of mortgage and other asset-backed securities, corporate and government fixed maturities are primarily determined using pricingmodels that incorporate the specific characteristics of each asset and related assumptions including the investment type and structure, creditquality, industry and maturity date in comparison to current market indices, spreads and liquidity of assets with similar characteristics. Formortgage and other-backed securities, inputs and assumptions for pricing may also include collateral attributes and prepayment speeds.Recent trades in the subject security or similar securities are assessed when available, and the Company may also review published research inits evaluation, as well as the issuer’s financial statements.
The following tables summarize the fair value and significant unobservable inputs used in pricing the following securities that were developeddirectly by the Company as of December 31, 2016 and 2015. The range and weighted average basis point amounts (‘‘bps’’) for fixed maturityspreads (adjustment to discount rates) and price-to-earnings multiples for equity investments reflect the Company’s best estimates of theunobservable adjustments a market participant would make to calculate these fair values.
Mortgage and other asset-backed securities. The significant unobservable inputs used to value the following mortgage and other asset-backed securities are liquidity and weighting of credit spreads. When there is limited trading activity for the security, an adjustment for liquidityis made as of the measurement date that considers current market conditions, issuer circumstances and complexity of the security structure.An adjustment to weight credit spreads is needed to value a more complex bond structure with multiple underlying collateral and no standardmarket valuation technique. The weighting of credit spreads is primarily based on the underlying collateral’s characteristics and theirproportional cash flows supporting the bond obligations. The resulting wide range of unobservable adjustments in the table below is due to thevarying liquidity and quality of the underlying collateral, ranging from high credit quality to below investment grade.
Corporate and government fixed maturities. The significant unobservable input used to value the following corporate and government fixedmaturities is an adjustment for liquidity. When there is limited trading activity for the security, an adjustment is needed to reflect current marketconditions and issuer circumstances.
Equity securities. The significant unobservable input used to value the following equity securities is a multiple of earnings before interest,taxes, depreciation and amortization (‘‘EBITDA’’). These securities are comprised of private equity investments with limited trading activityand therefore a ratio of price to EBITDA is used to estimate value based on company circumstances and relative risk characteristics.
As of December 31, 2016
Unobservable Unobservable Adjustment(Fair value in millions) Fair Value Input Range (Weighted Average)
Fixed maturities:Mortgage and other asset-backed securities $ 157 Liquidity 60 – 330 (90) bps
Weighting of credit spreads 160 – 470 (230) bpsCorporate and government fixed maturities 490 Liquidity 80 – 1,300 (340) bps
Total fixed maturities 647Equity securities 74 Price-to-EBITDA multiples 4.2 – 11.6 (8.5)
Subtotal 721Securities not priced by the Company (1) 55
Total Level 3 securities $ 776
(1) The fair values for these securities use single, unadjusted non-binding broker quotes not developed directly by the Company.
As of December 31, 2015
Fixed maturities:Mortgage and other asset-backed securities $ 327 Liquidity 60 – 440 (200) bps
Weighting of credit spreads 170 – 630 (220) bpsCorporate and government fixed maturities 285 Liquidity 70 – 930 (280) bps
Total fixed maturities 612Equity securities 69 Price-to-EBITDA multiples 4.2 – 11.6 (8.3)
Subtotal 681Securities not priced by the Company (1) 45
Total Level 3 securities $ 726
(1) The fair values for these securities use single, unadjusted non-binding broker quotes not developed directly by the Company.
Significant increases in fixed maturity spreads would result in lower fair value measurements while decreases in these inputs would result inhigher fair value measurements. Significant decreases in equity price-to-EBITDA multiples would result in lower fair value measurements whileincreases in these inputs would result in higher fair value measurements. Generally, the unobservable inputs are not interrelated and a change inthe assumption used for one unobservable input is not accompanied by a change in the other unobservable input.
84 CIGNA CORPORATION - 2016 Form 10-K
Quantitative Information about Unobservable Inputs

PART IIITEM 8. Financial Statements and Supplementary Data
GMIB contracts. See discussion in Note 9.
Changes in Level 3 Financial Assets and Financial Liabilities Carried at Fair ValueThe following tables summarize the changes in financial assets and financial liabilities classified in Level 3 for the years ended December 31,2016 and 2015. Separate account asset changes are reported separately under the heading ‘‘separate account assets’’ as the changes in fairvalues of these assets generally accrue directly to the policyholders. Gains and losses reported in these tables may include net changes in fairvalue that are attributable to both observable and unobservable inputs.
FixedMaturities &
Equity GMIB GMIB GMIB(In millions) Securities Assets Liabilities Net
Balance at January 1, 2016 $ 726 $ 907 $ (885) $ 22
Gains (losses) included in shareholders’ net income:GMIB fair value gain/(loss) – (47) 47 –Other (18) – (3) (3)
Total gains (losses) included in shareholders’ net income (18) (47) 44 (3)
Losses included in other comprehensive income (1) – – –Gains required to adjust future policy benefits for settlement annuities (1) 29 – – –Purchases, sales, settlements:
Purchases 96 – – –Sales (140) – – –Settlements (74) (61) 61 –
Total purchases, sales and settlements (118) (61) 61 –
Transfers into/(out of) Level 3:Transfers into Level 3 338 – – –Transfers out of Level 3 (180) – – –
Total transfers into/(out of) Level 3 158 – – –
Balance at December 31, 2016 $ 776 $ 799 $ (780) $ 19
Total gains (losses) included in shareholders’ net income attributable to instruments held at the reportingdate $ (18) $ (47) $ 44 $ (3)
Balance at January 1, 2015 $ 857 $ 953 $ (929) $ 24
Gains (losses) included in shareholders’ net income:GMIB fair value gain/(loss) – (5) 2 (3)Other 24 1 – 1
Total gains (losses) included in shareholders’ net income 24 (4) 2 (2)
Losses included in other comprehensive income (11) – – –Losses required to adjust future policy benefits for settlement annuities (1) (1) – – –Purchases, sales, settlements:
Purchases 153 – – –Sales (230) – – –Settlements (21) (42) 42 –
Total purchases, sales and settlements (98) (42) 42 –
Transfers into/(out of) Level 3:Transfers into Level 3 49 – – –Transfers out of Level 3 (94) – – –
Total transfers into/(out of) Level 3 (45) – – –
Balance at December 31, 2015 $ 726 $ 907 $ (885) $ 22
Total gains (losses) included in shareholders’ net income attributable to instruments held at the reportingdate $ (6) $ (4) $ 2 $ (2)
(1) Amounts do not accrue to shareholders.
As noted in the preceding tables, total gains and losses included in shareholders’ net income are reflected in the following captions in theConsolidated Statements of Income:
Realized investment gains (losses) and net investment income for amounts related to fixed maturities and equity securities and realizedinvestment gains (losses) for the impact of changes in non-performance risk related to GMIB assets and liabilities, similar to hedgeineffectiveness; and
Other operating expenses for amounts related to GMIB assets and liabilities (GMIB fair value gain/loss), except for the impact of changes innon-performance risk.
In the tables above, gains and losses included in other comprehensive income are reflected in net unrealized appreciation (depreciation) onsecurities in the Consolidated Statements of Comprehensive Income.
CIGNA CORPORATION - 2016 Form 10-K 85
•
•

PART IIITEM 8. Financial Statements and Supplementary Data
Reclassifications impacting Level 3 financial instruments are reported as transfers into or out of the Level 3 category as of the beginning of thequarter in which the transfer occurs. Therefore gains and losses in income only reflect activity for the period the instrument was classified inLevel 3.
Transfers into or out of the Level 3 category occur when unobservable inputs, such as the Company’s best estimate of what a marketparticipant would use to determine a current transaction price, become more or less significant to the fair value measurement. For the yearended 2016, transfers between Level 2 and Level 3 primarily reflect changes in liquidity and credit risk estimates for certain private placementissuers in the metals, mining, energy, electric and consumer sectors. For the year ended 2015, transfers out of Level 3 primarily reflect a changein the significance of the unobservable inputs related to liquidity and credit estimates used to value several private corporate bonds.
Separate AccountsAccounting policy. Separate account assets and liabilities are contractholder funds maintained in accounts with specific investmentobjectives. The assets of these accounts are legally segregated and are not subject to claims that arise out of any of the Company’s otherbusinesses. These separate account assets are carried at fair value with equal amounts recorded for related separate account liabilities. Theinvestment income and fair value gains and losses of these accounts generally accrue directly to the contractholders and, together with theirdeposits and withdrawals, are excluded from the Company’s Consolidated Statements of Income and Cash Flows. Fees and charges earned formortality risks, asset management or administrative services are reported in either premiums or fees and other revenues. Beginning in 2016,investments that are measured using the practical expedient of NAV (see Note 2 for additional information) are excluded from the fair valuehierarchy. Prior periods have been reclassified to conform to the current presentation.
At December 31, fair values of separate account assets were as follows:
Quoted Prices in SignificantActive Markets for Significant Other Unobservable
Identical Assets Observable Inputs Inputs(In millions) (Level 1) (Level 2) (Level 3) Total
2016Guaranteed separate accounts (See Note 21) $ 238 $ 262 $ – $ 500Non-guaranteed separate accounts (1) 1,368 4,885 331 6,584
Subtotal $ 1,606 $ 5,147 $ 331 $ 7,084
Non-guaranteed separate accounts priced at NAV as a practical expedient (1) 856
Total separate account assets $ 7,940
2015Guaranteed separate accounts (See Note 21) $ 235 $ 274 $ – $ 509Non-guaranteed separate accounts (1) 1,401 4,698 297 6,396
Subtotal $ 1,636 $ 4,972 $ 297 $ 6,905
Non-guaranteed separate accounts priced at NAV as a practical expedient (1) 928
Total separate account assets $ 7,833
(1) Non-guaranteed separate accounts included $3.7 billion as of December 31, 2016 and $3.6 billion as of December 31, 2015 in assets supporting the Company’s pension plans, including$0.3 billion classified in Level 3 and $0.9 billion priced at NAV as a practical expedient for both periods.
Separate account assets in Level 1 primarily include exchange-listed equity securities. Level 2 assets primarily include:
corporate and structured bonds valued using recent trades of similar securities or pricing models that discount future cash flows at estimatedmarket interest rates as described above; and
actively-traded institutional and retail mutual fund investments and separate accounts priced using the daily net asset value that is the exitprice.
Separate account assets classified in Level 3 primarily support Cigna’s pension plans, and include certain newly issued, privately-placed,complex, or illiquid securities that are priced using methods discussed above, as well as commercial mortgage loans that are valued accordingto the methodologies discussed below. The following tables summarize the changes in separate account assets reported in Level 3 for theyears ended December 31, 2016 and 2015.
(In millions) 2016 2015
Balance at January 1 $ 297 $ 255Policyholder gains (losses) 2 (6)Purchases, issuances, settlements:
Purchases 22 59Sales (11) –Settlements (18) (16)
Total purchases, sales and settlements (7) 43
Transfers into/(out of) Level 3:Transfers into Level 3 65 17Transfers out of Level 3 (26) (12)
Total transfers into/(out of) Level 3: 39 5
Balance at December 31 $ 331 $ 297
86 CIGNA CORPORATION - 2016 Form 10-K
•
•

PART IIITEM 8. Financial Statements and Supplementary Data
Separate account investments in securities partnerships, real estate, and hedge funds are generally valued based on the separate account’sownership share of the equity of the investee (NAV as a practical expedient), including changes in the fair values of its underlying investments.Substantially all of these assets support the Cigna Pension Plans. The table below provides additional information on these investments.
Fair Value as of
December 31, December 31, Unfunded Redemption Frequency Redemption Notice(In millions) 2016 2015 Commitments (if currently eligible) (1) Period (1)
Security Partnerships $ 424 $ 406 $ 286 Not applicable Not applicableReal Estate Funds 231 261 – Quarterly 45-90 daysHedge Funds 201 261 – Up to Annually, varying by fund 30-90 days
Total $ 856 $ 928 $ 286
(1) The attributes noted are effective as of December 31, 2016 and 2015.
B. Assets and Liabilities Measured at Fair Value under Certain ConditionsSome financial assets and liabilities are not carried at fair value each reporting period, but may be measured using fair value only under certainconditions, such as investments in real estate, partnership entities and commercial mortgage loans when they become impaired. Impairedvalues for these asset types classified as Level 3 representing less than 1% of total investments, were written down to their fair values, resultingin realized investment losses of $4 million after-tax in 2016 and $16 million after-tax in 2015.
C. Fair Value Disclosures for Financial Instruments Not Carried at Fair ValueThe following table includes the Company’s financial instruments not recorded at fair value that are subject to fair value disclosurerequirements at December 31, 2016 and 2015. In addition to universal life products and capital leases, financial instruments that are carried inthe Company’s Consolidated Financial Statements at amounts that approximate fair value are excluded from the following table.
December 31, 2016 December 31, 2015Classification inFair Value Carrying Carrying
(In millions) Hierarchy Fair Value Value Fair Value Value
Commercial mortgage loans Level 3 $ 1,682 $ 1,666 $ 1,911 $ 1,864Contractholder deposit funds, excluding universal life products Level 3 $ 1,215 $ 1,212 $ 1,151 $ 1,148Long-term debt, including current maturities, excluding capital leases Level 2 $ 5,460 $ 4,991 $ 5,515 $ 5,020
The fair values for all financial instruments presented in the table above have been estimated using market information when available. Thefollowing valuation methodologies and inputs are used by the Company to determine fair value.
Commercial mortgage loans. The Company estimates the fair value of commercial mortgage loans generally by discounting the contractualcash flows at estimated market interest rates that reflect the Company’s assessment of the credit quality of the loans. Market interest rates arederived by calculating the appropriate spread over comparable U.S. Treasury rates based on the property type, quality rating and average lifeof the loan. The quality ratings reflect the relative risk of the loan considering debt service coverage, the loan-to-value ratio and other factors.Fair values of impaired mortgage loans are based on the estimated fair value of the underlying collateral generally determined using an internaldiscounted cash flow model. The fair value measurements were classified in Level 3 because the cash flow models incorporate significantunobservable inputs.
Contractholder deposit funds, excluding universal life products. Generally, these funds do not have stated maturities. Approximately 70% ofthese balances can be withdrawn by the customer at any time without prior notice or penalty. The fair value for these contracts is the amountestimated to be payable to the customer as of the reporting date, which is generally the carrying value. Most of the remaining contractholderdeposit funds are reinsured by the buyers of the individual life and annuity and retirement benefits businesses. The fair value for thesecontracts is determined using the fair value of these buyers’ assets supporting these reinsured contracts. The Company had reinsurancerecoverables equal to the carrying value of these reinsured contracts. These instruments were classified in Level 3 because certain inputs areunobservable (supported by little or no market activity) and significant to their resulting fair value measurement.
Long-term debt, including current maturities, excluding capital leases. The fair value of long-term debt is based on quoted market prices forrecent trades. When quoted market prices are not available, fair value is estimated using a discounted cash flow analysis and the Company’sestimated current borrowing rate for debt of similar terms and remaining maturities. These measurements were classified in Level 2 becausethe fair values are based on quoted market prices or other inputs that are market observable or can be corroborated by market data.
Fair values of off-balance sheet financial instruments were not material as of December 31, 2016 and 2015.
Investments, Investment Income and Gains and LossesCigna’s investment portfolio consists of a broad range of investments including fixed maturities and equity securities, commercial mortgageloans, other long-term investments and short-term investments. The sections below provide more detail regarding our accounting policies,investment balances, net investment income and realized investment gains and losses. See Note 10 for information about the valuation of theCompany’s investment portfolio.
CIGNA CORPORATION - 2016 Form 10-K 87
NOTE 11

PART IIITEM 8. Financial Statements and Supplementary Data
A. Investment Portfolio
Accounting policy. Fixed maturities (including bonds, mortgage and other asset-backed securities and preferred stocks redeemable by theinvestor) and most equity securities are classified as available for sale and are carried at fair value with changes in fair value recorded inaccumulated other comprehensive income (loss) within shareholders’ equity. Net unrealized appreciation on investments supporting theCompany’s run-off settlement annuity business is reported in future policy benefit liabilities rather than accumulated other comprehensiveincome (loss).
Equity securities include hybrid investments consisting of preferred stock with call features that are carried at fair value with changes in fairvalue reported in other realized investment gains (losses) and dividends reported in net investment income. As of December 31, 2016, fairvalues of these securities were $36 million and amortized cost was $49 million. As of December 31, 2015, fair values of these securities were$52 million and amortized cost was $66 million.
The Company records impairment losses in net income for fixed maturities with fair value below amortized cost that meet either of thefollowing conditions:
If the Company intends to sell or determines that it is more likely than not to be required to sell these fixed maturities before their fair valuesrecover, an impairment loss is recognized for the excess of the amortized cost over fair value.
If the net present value of projected future cash flows of a fixed maturity (based on qualitative and quantitative factors, including theprobability of default, and the estimated timing and amount of recovery) is below the amortized cost basis, that difference is recognized as animpairment loss. For mortgage and asset-backed securities, estimated future cash flows are also based on assumptions about the collateralattributes including prepayment speeds, default rates and changes in value.
The amortized cost and fair value by contractual maturity periods for fixed maturities were as follows at December 31, 2016:
Amortized(In millions) Cost Fair Value
Due in one year or less $ 1,570 $ 1,574Due after one year through five years 6,481 6,731Due after five years through ten years 8,036 8,189Due after ten years 3,394 3,981Mortgage and other asset-backed securities 461 486
Total $ 19,942 $ 20,961
Actual maturities of these securities could differ from their contractual maturities used in the table above. This could occur because issuersmay have the right to call or prepay obligations, with or without penalties.
Gross unrealized appreciation (depreciation) on fixed maturities by type of issuer is shown below.
December 31, 2016
Amortized Unrealized Unrealized Fair(In millions) Cost Appreciation Depreciation Value
Federal government and agency $ 658 $ 223 $ (4) $ 877State and local government 1,342 99 (6) 1,435Foreign government 1,998 129 (14) 2,113Corporate 15,483 716 (149) 16,050Mortgage and other asset-backed 461 29 (4) 486
Total $ 19,942 $ 1,196 $ (177) $ 20,961
(In millions) December 31, 2015
Federal government and agency $ 528 $ 251 $ – $ 779State and local government 1,496 147 (2) 1,641Foreign government 1,870 147 (3) 2,014Corporate 14,022 632 (206) 14,448Mortgage and other asset-backed 540 41 (8) 573
Total $ 18,456 $ 1,218 $ (219) $ 19,455
The above table includes investments with a fair value of $2.7 billion at December 31, 2016 and 2015 supporting liabilities of the Company’srun-off settlement annuity business. These investments had gross unrealized appreciation of $539 million and gross unrealized depreciation of$15 million at December 31, 2016, compared with gross unrealized appreciation of $521 million and gross unrealized depreciation of $38 millionat December 31, 2015.
As of December 31, 2016, the Company had commitments to purchase $26 million of fixed maturities, all of which bear interest at a fixed marketrate.
88 CIGNA CORPORATION - 2016 Form 10-K
Fixed Maturities and Equity Securities
•
•

PART IIITEM 8. Financial Statements and Supplementary Data
Review of declines in fair value. Management reviews fixed maturities with a decline in fair value from cost for impairment based on criteriathat include:
length of time and severity of decline;
financial health and specific near term prospects of the issuer;
changes in the regulatory, economic or general market environment of the issuer’s industry or geographic region; and
the Company’s intent to sell or the likelihood of a required sale prior to recovery.
The table below summarizes fixed maturities with a decline in fair value from amortized cost at December 31, 2016 by the length of time thesesecurities have been in an unrealized loss position. These fixed maturities are primarily corporate securities with a decline in fair value thatreflects an increase in market yields since purchase.
Fair Amortized Unrealized Number of(Dollars in millions) Value Cost Depreciation Issues
Fixed maturities:One year or less:
Investment grade $ 4,346 $ 4,475 $ (129) 992Below investment grade $ 724 $ 736 $ (12) 591
More than one year:Investment grade $ 308 $ 327 $ (19) 53Below investment grade $ 186 $ 203 $ (17) 28
Equity securities include an investment of approximately $400 million in an exchange traded fund (‘‘ETF’’) with a gross unrealized loss of$5 million at December 31, 2016. The underlying assets of the ETF are primarily U.S. investment grade corporate bonds and the gross unrealizedloss is due to an increase in market yields since purchase. There were no other available for sale equity securities with a significant unrealizedloss reflected in accumulated other comprehensive income at December 31, 2016.
Commercial Mortgage LoansMortgage loans held by the Company are made exclusively to commercial borrowers and are diversified by property type, location andborrower. Loans are generally issued at a fixed rate of interest and are secured by high quality, primarily completed and substantially leasedoperating properties.
Accounting policy. Commercial mortgage loans are carried at unpaid principal balances or, if impaired, the lower of unpaid principal or fairvalue of the underlying real estate. See the ‘‘Impaired commercial mortgage loans’’ section below for the Company’s accounting policy forimpaired commercial mortgage loans.
At December 31, commercial mortgage loans were distributed among the following property types and geographic regions:
(In millions) 2016 2015
Property typeOffice buildings $ 592 $ 697Apartment buildings 428 366Industrial 302 322Hotels 205 259Retail facilities 139 213Other – 7
Total $ 1,666 $ 1,864
U.S. geographic regionPacific $ 714 $ 738South Atlantic 268 366New England 227 276Central 239 205Middle Atlantic 186 227Mountain 32 52
Total $ 1,666 $ 1,864
At December 31, 2016, scheduled commercial mortgage loan maturities were as follows:
Scheduled(In millions) Maturities
2017 $ 922018 1382019 2512020 972021 and thereafter 1,088
Total $ 1,666
CIGNA CORPORATION - 2016 Form 10-K 89
•
•
•
•

PART IIITEM 8. Financial Statements and Supplementary Data
Actual maturities could differ from contractual maturities for several reasons: borrowers may have the right to prepay obligations with orwithout prepayment penalties; the maturity date may be extended; and loans may be refinanced.
As of December 31, 2016, the Company had commitments to extend credit under commercial mortgage loan agreements of $69 million.
Credit quality. The Company regularly evaluates and monitors credit risk, beginning with the initial underwriting of a mortgage loan andcontinuing throughout the investment holding period. Mortgage origination professionals employ an internal credit quality rating systemdesigned to evaluate the relative risk of the transaction at origination that is then updated each year as part of the annual portfolio loan review.The Company evaluates and monitors credit quality on a consistent and ongoing basis, classifying each loan as a loan in good standing,potential problem loan or problem loan.
Quality ratings are based on our evaluation of a number of key inputs related to the loan, including real estate market-related factors such asrental rates and vacancies, and property-specific inputs such as growth rate assumptions and lease rollover statistics. However, the two mostsignificant contributors to the credit quality rating are the debt service coverage and loan-to-value ratios. The debt service coverage ratiomeasures the amount of property cash flow available to meet annual interest and principal payments on debt, with a ratio below 1.0 indicatingthat there is not enough cash flow to cover the required loan payments. The loan-to-value ratio, commonly expressed as a percentage,compares the amount of the loan to the fair value of the underlying property collateralizing the loan.
The following tables summarize the credit risk profile of the Company’s commercial mortgage loan portfolio based on loan-to-value and debtservice coverage ratios, as of December 31, 2016 and 2015:
Debt Service Coverage Ratio
December 31, 2016(In millions)
Loan-to-Value Ratio 1.30x or Greater 1.20x to 1.29x 1.10x to 1.19x 1.00x to 1.09x Less than 1.00x Total
Below 50% $ 335 $ 15 $ – $ – $ – $ 35050% to 59% 517 46 – 30 – 59360% to 69% 624 14 – – – 63870% to 79% – – 29 – 35 6480% to 89% – – – – – –90% to 100% – – – – 21 21
Total $ 1,476 $ 75 $ 29 $ 30 $ 56 $ 1,666
December 31, 2015
Below 50% $ 261 $ 2 $ – $ 67 $ – $ 33050% to 59% 683 – – 24 – 70760% to 69% 590 14 – 19 – 62370% to 79% – – – 30 36 6680% to 89% 40 – – – – 4090% to 100% – – – – 98 98
Total $ 1,574 $ 16 $ – $ 140 $ 134 $ 1,864
The Company’s annual in-depth review of its commercial mortgage loan investments is the primary mechanism for identifying emerging risksin the portfolio. The most recent review was completed by the Company’s investment professionals in the second quarter of 2016 and includedan analysis of each underlying property’s most recent annual financial statements, rent rolls, operating plans, budgets, a physical inspection ofthe property and other pertinent factors. Based on historical results, current leases, lease expirations and rental conditions in each market, theCompany estimates the current year and future stabilized property income and fair value and categorizes the investments as loans in goodstanding, potential problem loans or problem loans. The results of the 2016 review showed improvement from the prior review in each of thekey metrics and confirmed the overall strength of the portfolio. Based on property values and cash flows estimated as part of this review, andconsidering updates for loans where material changes were subsequently identified, the portfolio’s average loan-to-value ratio improved to57% at December 31, 2016 from 58% at December 31, 2015. The portfolio’s average debt service coverage ratio improved to 1.95 at December 31,2016 from 1.78 at December 31, 2015. These improvements are primarily attributable to improvements in property operations and the relativestability of these metrics is primarily due to low portfolio turnover.
The Company will reevaluate a loan’s credit quality between annual reviews if new property information is received or an event such asdelinquency or a borrower’s request for restructure causes management to believe that the Company’s estimate of financial performance, fairvalue or the risk profile of the underlying property has been impacted.
Potential problem mortgage loans are considered current (no payment is more than 59 days past due), but they exhibit certain characteristicsthat increase the likelihood of future default. The characteristics management considers include, but are not limited to, the deterioration ofdebt service coverage below 1.0, estimated loan-to-value ratios increasing to 100% or more, downgrade in quality rating and requests from theborrower for restructuring. In addition, loans are considered potential problems if principal or interest payments are past due by more than 30but less than 60 days. Problem mortgage loans are either in default by 60 days or more or have been restructured as to terms that could includeconcessions on interest rate, principal payment or maturity date. The Company monitors each problem and potential problem mortgage loanon an ongoing basis, and updates the loan categorization and quality rating when warranted.
Problem and potential problem mortgage loans, net of valuation reserves, totaled $21 million at December 31, 2016 and $139 million atDecember 31, 2015.
Impaired commercial mortgage loans. A commercial mortgage loan is considered impaired when it is probable that the Company will notcollect all amounts due according to the terms of the original loan agreement. These loans are included in either problem or potential problem
90 CIGNA CORPORATION - 2016 Form 10-K

PART IIITEM 8. Financial Statements and Supplementary Data
loans. The Company monitors credit risk and assesses the impairment of loans individually and on a consistent basis for all loans in theportfolio. Impaired loans are carried at the lower of unpaid principal balance or the fair value of the underlying real estate. The Companyestimates the fair value of the underlying real estate using internal valuations generally based on discounted cash flow analyses. Certaincommercial mortgage loans without valuation reserves are considered impaired because the Company will not collect all interest dueaccording to the terms of the original agreements; however, the Company expects to recover the unpaid principal because it is less than the fairvalue of the underlying real estate. Because of the risk profile of the underlying investment, the Company recognizes interest income onimpaired mortgage loans only when payment is actually received.
The carrying value of the Company’s impaired commercial mortgage loans and related valuation reserves were as follows:
2016 2015
(In millions) Gross Reserves Net Gross Reserves Net
Impaired commercial mortgage loans with valuation reserves $ 26 $ (5) $ 21 $ 113 $ (15) $ 98Impaired commercial mortgage loans with no valuation reserves – – – – – –
Total $ 26 $ (5) $ 21 $ 113 $ (15) $ 98
The average recorded investment in impaired loans was $72 million during 2016 and $126 million during 2015. The decrease in the averagerecorded investment was partially due to the foreclosure of one impaired loan. Interest income on impaired commercial mortgage loans wasnot significant for 2016 or 2015.
Changes in valuation reserves for commercial mortgage loans were not material for the years ended December 31, 2016 and 2015.
Other Long-Term InvestmentsAccounting policy. Other long-term investments include investments in unconsolidated entities. These entities include certain limitedpartnerships and limited liability companies holding real estate, securities or loans. These investments are carried at cost plus the Company’sownership percentage of reported income or loss in cases where the Company has significant influence; otherwise the investment is carried atcost. Income from certain entities is reported on a one quarter lag depending on when their financial information is received. Other long-terminvestments are considered impaired, and written down to their fair value, when cash flows indicate that the carrying value may not berecoverable. Fair value is generally determined based on a discounted cash flow analysis.
Other long-term investments also include investment real estate carried at depreciated cost less any impairment write downs to fair valuewhen cash flows indicate that the carrying value may not be recoverable. Depreciation is generally recorded using the straight-line methodbased on the estimated useful life of each asset. Investment real estate as of December 31, 2016 and 2015 is expected to be held longer than oneyear and includes real estate acquired through the foreclosure of commercial mortgage loans.
Additionally, other long-term investments include interest rate and foreign currency swaps carried at fair value. See Note 12 for information onthe Company’s accounting policies for these derivative financial instruments.
As of December 31, other long-term investments consisted of the following:
(In millions) 2016 2015
Real estate investments $ 738 $ 814Securities partnerships 650 501Other 74 89
Total $ 1,462 $ 1,404
As of December 31, 2016, the Company had commitments to contribute:
$263 million to limited liability entities that hold either real estate or loans to real estate entities that are diversified by property type andgeographic region; and
$810 million to entities that hold securities diversified by issuer and maturity date.
The Company expects to disburse approximately 26% of the committed amounts in 2017.
Short-Term Investments and Cash EquivalentsAccounting policy. Security investments with maturities of greater than three months to one year from time of purchase are classified asshort-term, available for sale and carried at fair value that approximates cost. Cash equivalents consist of short-term investments withmaturities of three months or less from the time of purchase and are carried at cost that approximates fair value.
Short-term investments and cash equivalents included corporate securities of $2.2 billion, federal government securities of $378 million andmoney market funds of $11 million as of December 31, 2016. The Company’s short-term investments and cash equivalents as of December 31,2015 included corporate securities of $925 million, federal government securities of $220 million and money market funds of $55 million.
Concentration of RiskAs of December 31, 2016 and 2015, the Company did not have a concentration of investments in a single issuer or borrower exceeding 10% ofshareholders’ equity.
CIGNA CORPORATION - 2016 Form 10-K 91
•
•

PART IIITEM 8. Financial Statements and Supplementary Data
B. Net Investment IncomeAccounting policy. When interest and principal payments on investments are current, the Company recognizes interest income when it isearned. The Company recognizes interest income on a cash basis when interest payments are delinquent based on contractual terms or whencertain terms (interest rate or maturity date) of the investment have been restructured.
The components of pre-tax net investment income for the years ended December 31 were as follows:
(In millions) 2016 2015 2014
Fixed maturities $ 899 $ 879 $ 876Equity securities 4 3 3Commercial mortgage loans 91 112 133Policy loans 72 72 72Other long-term investments 98 116 105Short-term investments and cash 26 14 17
Total investment income 1,190 1,196 1,206Less investment expenses 43 43 40
Net investment income $ 1,147 $ 1,153 $ 1,166
Real estate investments and securities partnerships with a carrying value of $220 million at December 31, 2016 and $277 million atDecember 31, 2015 were non-income producing during the preceding twelve months.
Net investment income for separate accounts that is excluded from the Company’s revenues was $236 million for 2016, $262 million for 2015,and $225 million for 2014.
C. Realized Investment Gains And LossesAccounting policy. Realized investment gains and losses are based on specifically identified assets and result from sales, investment assetwrite-downs, changes in the fair values of certain derivatives and changes in valuation reserves on commercial mortgage loans.
The following realized gains and losses on investments for the years ended December 31 exclude amounts required to adjust future policybenefits for the run-off settlement annuity business.
(In millions) 2016 2015 2014
Fixed maturities $ 23 $ (82) $ 14Equity securities (1) 36 13Commercial mortgage loans 4 (2) (6)Other investments, including derivatives 143 105 133
Net realized investment gains, before income taxes 169 57 154Less income taxes 60 17 48
Net realized investment gains $ 109 $ 40 $ 106
Included in these realized investment gains (losses) were pre-tax asset write-downs as follows:
(In millions) 2016 2015 2014
Other-than-temporary impairments on fixed maturities:Credit-related $ (19) $ (11) $ –Non credit-related (1) (16) (101) (36)
Total other-than-temporary impairments on fixed maturities (35) (112) (36)Other asset write-downs (2) (23) (28) (16)
TOTAL $ (58) $ (140) $ (52)
(1) These write-downs pertain to other-than-temporary declines in fair values due to increases in market yields (widening of credit spreads), particularly within the energy sector, for certainbelow investment grade fixed maturities with an increased probability of sales activity prior to recovery of amortized cost basis.
(2) Other asset write-downs include other-than-temporary declines in the fair values of equity securities, increases in valuation reserves on commercial mortgage loans, and asset write-downs related to security partnerships and real estate investments.
Realized investment gains in other investments, including derivatives, represent primarily gains on sale of real estate properties held in jointventures.
Realized investment gains that are excluded from the Company’s revenues for the years ended December 31 were as follows:
(In millions) 2016 2015 2014
Separate accounts $ 16 $ 117 $ 376Investment gains required to adjust future policy benefits for the run-off settlement annuity business $ 63 $ 114 $ 86
92 CIGNA CORPORATION - 2016 Form 10-K

PART IIITEM 8. Financial Statements and Supplementary Data
The following table presents sales information for available-for-sale fixed maturities and equity securities for the years ended December 31.Gross gains on sales and gross losses on sales exclude amounts required to adjust future policy benefits for the run-off settlement annuitybusiness.
(In millions) 2016 2015 2014
Proceeds from sales $ 1,544 $ 1,555 $ 1,769Gross gains on sales $ 83 $ 85 $ 62Gross losses on sales $ 7 $ 13 $ 6
Derivative Financial Instruments
The Company uses derivative financial instruments to manage the characteristics of investment assets (such as duration, yield, currency andliquidity) to meet the varying demands of the related insurance and contractholder liabilities (such as paying claims, investment returns andwithdrawals) and to hedge interest rate risk of its long-term debt. The Company has written and purchased GMIB reinsurance contracts in itsrun-off reinsurance business that are accounted for as freestanding derivatives and discussed in Note 9. Derivatives in the Company’s separateaccounts are excluded from the following discussion because associated gains and losses generally accrue directly to separate accountpolicyholders.
Accounting policy. The Company applies hedge accounting when derivatives are designated, qualified and highly effective as hedges.Effectiveness is formally assessed and documented at inception and each period throughout the life of a hedge using various quantitativemethods appropriate for each hedge, including regression analysis and dollar offset. Under hedge accounting, the changes in fair value of thederivative and the hedged risk are generally recognized together and offset each other when reported in shareholders’ net income. Changes inthe fair value of a derivative instrument may not always equal changes in the fair value of the hedged item. This is referred to as ‘‘hedgeineffectiveness’’ and is generally recorded in realized investment gains and losses. In the event of an early hedge termination, the changes in fairvalue of derivatives that qualified for hedge accounting are reported in shareholders’ net income, generally as a part of realized investmentgains and losses. Derivative cash flows are generally reported in operating activities.
The following tables provide information on the Company’s specific applications of derivative financial instruments during the years endedDecember 31.
Fair Value Hedge of Long-Term Corporate Debt Notional Value (in millions)
Type of instrument. Interest rate swap contracts2016 2015
$ 750 $ 750
Purpose. To convert a portion of the interest rate exposure on the Company’s long-term debt from fixed to variable rates. This moreclosely aligns the Company’s interest expense with the interest income received on its cash equivalent and short-term investment balances.The variable rates are benchmarked to LIBOR.
Terms of derivative instruments. The Company provides upfront margin and settles fair value changes and net interest between variableand fixed rates daily with a central clearinghouse.
Accounting. Using fair value hedge accounting, the fair values of the swap contracts are reported in other assets, including otherintangibles, or accounts payable, accrued expenses, and other liabilities. The critical terms of these swaps match those of the long-termdebt being hedged. As a result, the carrying value of the hedged debt is adjusted to reflect changes in its fair value driven by LIBOR. Theeffects of those adjustments on other operating expenses are offset by the effects of corresponding changes in the swaps’ fair value. Thenet impact from the hedge reported in other operating expenses reflects interest expense on the hedged debt at the variable interest rate.
Cash Flow Hedges of Fixed Maturity Bonds Notional Value (in millions)
Type of instrument. Foreign currency and combination (interest rate and 2016 2015foreign currency) swap contracts $ 55 $ 131
Purpose. To hedge the interest and foreign currency cash flows of its fixed maturity bonds to match associated insurance liabilities.
Terms of derivative instruments. The Company periodically exchanges cash flows between variable and fixed interest rates or betweentwo currencies for both principal and interest. Foreign currency swaps are Euros, Canadian dollars, and Japanese yen and have terms forperiods of up to five years.
Accounting. Using cash flow hedge accounting, fair values are reported in other long-term investments or accounts payable, accruedexpenses, and other liabilities. Changes in fair values are reported in accumulated other comprehensive income and amortized into netinvestment income or other realized investment gains and losses as interest or principal payments are received.
CIGNA CORPORATION - 2016 Form 10-K 93
NOTE 12

PART IIITEM 8. Financial Statements and Supplementary Data
Fair Value Hedges of Fixed Maturity Bonds Notional Value (in millions)
Type of instrument. Foreign currency swap contracts2016 2015
$ 78 $ –
Purpose. To hedge the foreign exchange related changes in fair values of the Company’s fixed maturity bonds.
Terms of derivative instruments. The Company periodically exchanges cash flows between U.S. dollars and Euros for both principal andinterest for periods of up to ten years.
Accounting. Using fair value hedge accounting, fair values are reported in other long-term investments or accounts payable, accruedexpenses, and other liabilities. Changes in fair values of the swap contracts, as well as changes in the fair values of the hedged bondsattributable to the hedged risk are reported in other realized investment gains and losses.
Economic Hedges of a Fixed Maturity Bond Portfolio Notional Value (in millions)
Type of instrument. Foreign currency forward contracts2016 2015
$ 149 $ –
Purpose. To hedge the foreign exchange related changes in fair values of a U.S. dollar-denominated fixed maturity bond portfolio toreflect the local currency for one of the Company’s foreign subsidiaries.
Terms of derivative instruments. The Company agrees to purchase South Korean won in exchange for U.S. dollars at a future date,generally within three months from the contracts’ trade dates.
Accounting. As these arrangements were not designated as accounting hedges, fair values are reported in short-term investments oraccounts payable, accrued expenses, and other liabilities, and changes in fair values are reported in other realized investment gains andlosses.
As of and for the years ended December 31, 2016 and 2015, the effects of these derivative instruments on the Consolidated FinancialStatements were not material. No material amounts were excluded from the assessment of hedge effectiveness and no significant gains orlosses were recognized due to hedge ineffectiveness.
Collateral and termination features. The Company routinely monitors exposure to credit risk associated with derivatives and diversifies theportfolio among approved dealers of high credit quality to minimize this risk. As of December 31, 2016, the Company had $18 million in cash ondeposit representing the upfront margin required for the Company’s centrally-cleared derivative instruments. Certain of the Company’sover-the-counter derivative instruments contain provisions requiring either the Company or the counterparty to post collateral or demandimmediate payment depending on the amount of the net liability position and predefined financial strength or credit rating thresholds.Collateral posting requirements vary by counterparty. The net asset or liability positions of these derivatives were not material as ofDecember 31, 2016 or 2015.
Variable Interest Entities
When the Company becomes involved with a variable interest entity, as well as when there is a change in the Company’s involvement with anentity, the Company evaluates the following to determine if it is the primary beneficiary and must consolidate the entity:
the structure and purpose of the entity;
the risks and rewards created by and shared through the entity; and
the Company’s ability to direct its activities, receive its benefits and absorb its losses relative to the other parties involved with the entityincluding its sponsors, equity holders, guarantors, creditors and servicers.
As of December 31, 2016 and 2015, the Company determined it was not a primary beneficiary in any material variable interest entities.
The Company owns interests in security and real estate limited partnerships that are now defined as variable interest entities under GAAP (seediscussion of ASU 2015-02 in Note 2). These partnerships invest in the equity or mezzanine debt of privately held companies and real estateproperties. General partners unaffiliated with the Company control decisions that most significantly impact the partnership’s operations andthe limited partners do not have substantive kick-out or participating rights. The Company’s maximum exposure to these entities of $2.1 billionacross approximately 100 limited partnerships as of December 31, 2016 includes $1 billion reported in other long-term investments andcommitments to contribute an additional $1.1 billion. The Company’s non-controlling interest in each of these limited partnerships is generallyless than 10% of the partnership ownership interests.
In the normal course of its investing activities, the Company also makes passive investments in certain asset-backed and corporate securitiesthat are issued by variable interest entities whose sponsors or issuers are unaffiliated with the Company. The Company receives fixed-rate cashflows from these investments and the maximum potential exposure to loss is limited to the carrying amount of $0.6 billion as of December 31,2016, that is reported in fixed maturities. The Company’s combined ownership interests are insignificant relative to the total principal amountsissued by these entities.
The Company is also involved in real estate joint ventures with carrying values of $0.2 billion where all decisions significantly affecting theentities’ economic performance are subject to unanimous approval by the equity holders. As a result, the Company determined that the power
94 CIGNA CORPORATION - 2016 Form 10-K
NOTE 13
•
•
•

PART IIITEM 8. Financial Statements and Supplementary Data
over these entities is shared equally, and there is no primary beneficiary. The Company’s maximum exposure to loss was approximately equal toits carrying value that is reported in other long-term investments.
To provide certain services to its Medicare Advantage customers, the Company contracts with independent physician associations (‘‘IPAs’’)that are variable interest entities. Physicians provide health care services to Medicare Advantage customers and the Company providesmedical management and administrative services to the IPAs. The Company’s maximum exposure to loss related to the IPA arrangements islimited to their liability for incurred but not reported medical costs for the Company’s Medicare Advantage customers. These liabilities are notmaterial and are generally secured by deposits maintained by the IPAs.
The Company is not the primary beneficiary of any of the variable interest entities described above and does not consolidate these entitiesbecause either:
it has no power to direct the activities that most significantly impact the entities’ economic performance; or
it has neither the right to receive benefits nor the obligation to absorb losses that could be significant to these variable interest entities.
The Company has not provided, and does not intend to provide, financial support to these entities that it is not contractually required toprovide. The Company performs ongoing qualitative analyses of its involvement with these variable interest entities to determine ifconsolidation is required.
Accumulated Other Comprehensive Income (Loss)
Accumulated other comprehensive income (loss) excludes amounts required to adjust future policy benefits for the run-off settlement annuitybusiness. Changes in the components of accumulated other comprehensive income (loss) were as follows:
Tax(Expense)
(In millions) Pre-Tax Benefit After-Tax
2016Net unrealized appreciation on securities, January 1, $ 612 $ (194) $ 418
Net unrealized (depreciation) on securities arising during the year, before reclassification adjustment (48) 6 (42)Reclassification adjustment for (gains) included in shareholders’ net income (net realized investment gains) (22) 8 (14)
Net unrealized (depreciation) on securities arising during the year (70) 14 (56)
Net unrealized appreciation on securities, December 31, $ 542 $ (180) $ 362
Net unrealized appreciation on derivatives, January 1, $ 10 $ (3) $ 7
Reclassification adjustment for losses included in shareholders’ net income (other operating expenses) 1 – 1Reclassification adjustment for (gains) included in shareholders’ net income (net realized investment gains) (7) 2 (5)
Net unrealized (depreciation) on derivatives arising during the year (6) 2 (4)
Net unrealized appreciation on derivatives, December 31, $ 4 $ (1) $ 3
Net translation of foreign currencies, January 1, $ (295) $ 21 $ (274)Net translation of foreign currencies arising during the year (95) – (95)
Net translation of foreign currencies, December 31, $ (390) $ 21 $ (369)
Postretirement benefits liability adjustment, January 1, $ (2,155) $ 754 $ (1,401)
Reclassification adjustment for amortization of net losses from past experience and prior service costs(other operating expenses) 64 (22) 42Net change due to valuation update (29) 10 (19)
Net postretirement benefits liability adjustment arising during the year 35 (12) 23
Postretirement benefits liability adjustment, December 31, $ (2,120) $ 742 $ (1,378)
CIGNA CORPORATION - 2016 Form 10-K 95
•
•
NOTE 14

PART IIITEM 8. Financial Statements and Supplementary Data
Tax(Expense)
(In millions) Pre-Tax Benefit After-Tax
2015Net unrealized appreciation on securities, January 1, $ 955 $ (335) $ 620
Net unrealized (depreciation) on securities arising during the year, before reclassification adjustment (389) 157 (232)Reclassification adjustment for losses included in shareholders’ net income (net realized investment gains) 46 (16) 30
Net unrealized (depreciation) on securities arising during the year (343) 141 (202)
Net unrealized appreciation on securities, December 31, $ 612 $ (194) $ 418
Net unrealized (depreciation) on derivatives, January 1, $ (12) $ 4 $ (8)
Net unrealized appreciation on derivatives arising during the year, before reclassification adjustment 10 (3) 7Reclassification adjustment for losses included in shareholders’ net income (other operating expenses) 12 (4) 8
Net unrealized appreciation on derivatives, arising during the year 22 (7) 15
Net unrealized appreciation on derivatives, December 31, $ 10 $ (3) $ 7
Net translation of foreign currencies, January 1, $ (71) $ 9 $ (62)Net translation of foreign currencies, arising during the year (224) 12 (212)
Net translation of foreign currencies, December 31, $ (295) $ 21 $ (274)
Postretirement benefits liability adjustment, January 1, $ (2,286) $ 800 $ (1,486)
Reclassification adjustment for amortization of net losses from past experience and prior service costs(other operating expenses) 68 (23) 45Net change due to valuation update 63 (23) 40
Net postretirement benefits liability adjustment arising during the year 131 (46) 85
Postretirement benefits liability adjustment, December 31, $ (2,155) $ 754 $ (1,401)
Tax(Expense)
(In millions) Pre-Tax Benefit After-Tax
2014Net unrealized appreciation on securities, January 1, $ 733 $ (256) $ 477
Net unrealized appreciation on securities arising during the year, before reclassification adjustment 249 (89) 160Reclassification adjustment for (gains) included in net income (net realized investment gains) (27) 10 (17)
Net unrealized appreciation on securities arising during the year 222 (79) 143
Net unrealized appreciation on securities, December 31, $ 955 $ (335) $ 620
Net unrealized depreciation on derivatives, January 1, $ (29) $ 10 $ (19)Net unrealized appreciation on derivatives arising during the year 17 (6) 11
Net unrealized depreciation on derivatives, December 31, $ (12) $ 4 $ (8)
Net translation of foreign currencies, January 1, $ 91 $ (9) $ 82Net translation of foreign currencies arising during the year (162) 18 (144)
Net translation of foreign currencies, December 31, $ (71) $ 9 $ (62)
Postretirement benefits liability adjustment, January 1, $ (1,630) $ 570 $ (1,060)
Reclassification adjustment for amortization of net losses from past experience and prior service costs(other operating expenses) 54 (18) 36Reclassification adjustment for settlement loss (other operating expenses) 6 (2) 4
Total reclassification adjustment to shareholders’ net income (other operating expenses) 60 (20) 40Net change due to valuation update and plan amendments (716) 250 (466)
Net postretirement benefits liability adjustment arising during the year (656) 230 (426)
Postretirement benefits liability adjustment, December 31, $ (2,286) $ 800 $ (1,486)
Pension and Other Postretirement Benefit Plans
A. About our PlansPension plans. The Company’s principal qualified defined benefit pension plans, the Cigna Pension Plan and the Cigna Pension Plan forCertain Former Employees, cover approximately 21,700 retirees, 15,700 vested former employees and 14,800 active employees. Currentretirees, certain vested former employees and longer-service active employees are entitled to an annuity benefit based on pay and length ofservice. Most pension-eligible active employees and certain vested former employees are entitled to a cash balance defined benefit. The CignaSupplemental Pension Plan, a non-qualified and unfunded plan, covers only certain employees. We froze future benefit accruals for all of thesedomestic pension plans in 2009. Additionally the Company has foreign pension and other postretirement benefit plans that are immaterial toour results of operations, liquidity and financial position.
96 CIGNA CORPORATION - 2016 Form 10-K
NOTE 15

PART IIITEM 8. Financial Statements and Supplementary Data
As further discussed in Note 21, Cigna Corporation and the Cigna Pension Plan are defendants in a class action lawsuit related to the Plan’sconversion of certain employees from an annuity to a cash balance benefit in 1997. When the required plan amendment related to this litigationis adopted, the pension benefit obligation will be updated to reflect benefits resulting from this litigation.
Other postretirement benefit plans. The Company’s postretirement benefit medical plan covers approximately 19,400 retirees and 19,900active employees. Post-1988 retirees contribute to the cost of this coverage, whereas pre-1989 retirees do not. For post-1988 retirees, theCompany’s cost is capped at 200% of the per capita cost in 2000. Pharmacy coverage for Medicare-eligible retirees is delivered using anEmployer Group Waiver Plan. Under that plan, the Company receives subsidies from CMS. The postretirement medical plan is unfunded andfuture benefit accruals were frozen in 2013. The Company also offers certain postretirement life insurance benefits through various plans.Retirees do not contribute to the cost of life insurance benefits.
Accounting policy. The Company measures the assets and liabilities of its domestic pension and other postretirement benefit plans as ofDecember 31. Benefit obligations are measured at the present value of estimated future payments based on actuarial assumptions. TheCompany uses the ‘‘corridor’’ method to account for changes in the benefit obligation when actual results differ from those assumed, or whenassumptions change. These changes are called net unrecognized actuarial gains (losses). Under the corridor method, net unrecognizedactuarial gains (losses) are initially recorded in accumulated other comprehensive income. When the unrecognized gain (loss) exceeds 10% ofthe benefit obligation, that excess is amortized to other operating expense over the expected remaining lives of plan participants.
For balance sheet purposes, we measure plan assets at fair value. When the actual return differs from the expected return, those differences arereflected in the net unrealized actuarial gain (loss) discussed above. However, to measure pension benefit costs, we use a ‘‘market-related’’asset valuation for domestic pension plan assets invested in non-fixed income investments that is different than the actual fair value. The‘‘market-related’’ value recognizes the difference between actual and expected long-term returns in the portfolio over five years, a method thatreduces the short-term impact of market fluctuations on pension costs. At December 31, 2016, the market-related asset value wasapproximately $3.9 billion compared with a fair value of approximately $4.0 billion.
B. Funded Status and Amounts Included in Accumulated Other ComprehensiveIncome
The following table summarizes the projected benefit obligations and assets related to our domestic and international pension and otherpostretirement benefit plans as of, and for the years ended, December 31:
OtherPostretirement
Pension Benefits Benefits(In millions) 2016 2015 2016 2015
Change in benefit obligationBenefit obligation, January 1 $ 4,934 $ 5,269 $ 295 $ 335Service cost 2 2 – –Interest cost 199 194 11 11(Gain) loss from past experience 57 (1) (239) (2) 2 (19)Benefits paid from plan assets (284) (270) (3) (3)Benefits paid – other (20) (22) (28) (29)
Benefit obligation, December 31 4,888 4,934 277 295
Change in plan assetsFair value of plan assets, January 1 3,981 4,170 8 12Actual return on plan assets 279 75 – (1)Benefits paid (284) (270) (3) (3)Contributions 1 6 – –
Fair value of plan assets, December 31 3,977 3,981 5 8
Funded Status $ (911) $ (953) $ (272) $ (287)
(1) Positive amount reflects a decrease in the discount rate, partially offset by a favorable change in the mortality assumption.
(2) Negative amount reflects an increase in the discount rate and a favorable change in the mortality assumption.
We fund our qualified pension plans at least at the minimum amount required by the Employee Retirement Income Security Act of 1974 and thePension Protection Act of 2006. In February 2017, we made a voluntary contribution of $150 million. For the remainder of 2017, we do notexpect to make any additional contributions to the qualified pension plans because none are required. Future years’ contributions willultimately be based on a wide range of factors including but not limited to asset returns, discount rates and funding targets. Non-qualifiedpension and other postretirement benefit plans are generally funded on a pay-as-you-go basis as there are no plan assets for these plans.
CIGNA CORPORATION - 2016 Form 10-K 97

PART IIITEM 8. Financial Statements and Supplementary Data
Benefit payments. The following benefit payments are expected to be paid in:
OtherPension Postretirement
(In millions) Benefits Benefits
2017 $ 381 $ 292018 $ 325 $ 282019 $ 330 $ 272020 $ 324 $ 252021 $ 323 $ 242022-2026 $ 1,587 $ 97
Amounts reflected in the pension and other postretirement benefit liabilities shown above that have not yet been reported in net income andtherefore are included in accumulated other comprehensive loss consisted of the following as of December 31:
OtherPostretirement
Pension Benefits Benefits(In millions) 2016 2015 2016 2015
Unrecognized net gain (loss) $ (2,163) $ (2,201) $ – $ 1Unrecognized prior service cost (6) (7) 49 52
Postretirement benefits liability adjustment $ (2,169) $ (2,208) $ 49 $ 53
We expect to recognize pre-tax losses of $66 million in 2017 from amortization of the net actuarial loss in our pension plans and pre-tax gains of$2 million in 2017 from amortization of prior service cost in the other postretirement benefit plans. These estimates are based on a weightedaverage amortization period for the frozen and inactive plans that is based on the average expected remaining life of plan participants ofapproximately 27 years.
C. Cost of our PlansComponents of net pension and other postretirement benefits cost for the years ended December 31 were as follows:
OtherPension Benefits Postretirement Benefits
(In millions) 2016 2015 2014 2016 2015 2014
Service cost $ 2 $ 2 $ 2 $ – $ – $ –Interest cost 199 194 206 11 11 12Expected long-term return on plan assets (249) (267) (264) – – –Amortization of:
Net loss from past experience 65 70 57 1 – –Prior service cost 1 – – (3) (3) (3)
Settlement loss – – 6 – – –
Net pension cost $ 18 $ (1) $ 7 $ 9 $ 8 $ 9
D. Assumptions Used for Pension and other Postretirement Benefit PlansManagement determined the present value of the projected benefit obligation and the accumulated other postretirement benefit obligationand related benefit costs based on the following weighted average assumptions as of and for the years ended December 31:
2016 2015
Discount rate:Pension benefit obligation 3.95% 4.17%Other postretirement benefit obligation 3.70% 3.89%Pension benefit cost 4.17% 3.75%Other postretirement benefit cost 3.89% 3.50%
Expected long-term return on plan assets:Pension benefit cost 7.25% 7.25%Other postretirement benefit cost 5.00% 5.00%
RP 2014 with MP 2016 RP 2014 with MP 2015Mortality table for pension and postretirement benefit obligations projection scale projection scale
The Company used the Society of Actuaries mortality table RP2014 and the updated improvement scales published in 2015 and 2016 to valueits benefit obligations because the Company’s mortality experience closely matched these tables based on internal studies. The updatedimprovement scales published in 2015 and 2016 both indicated that mortality improvement is expected to be lower than was originallyprojected when the study was first published in 2014, resulting in decreases to the benefit obligations in both years.
The Company sets discount rates by applying actual annualized yields for high quality bonds at various durations to the expected cash flows ofthe pension and other postretirement benefits liabilities. The discount rate curve is constructed using an array of bonds in various industries
98 CIGNA CORPORATION - 2016 Form 10-K
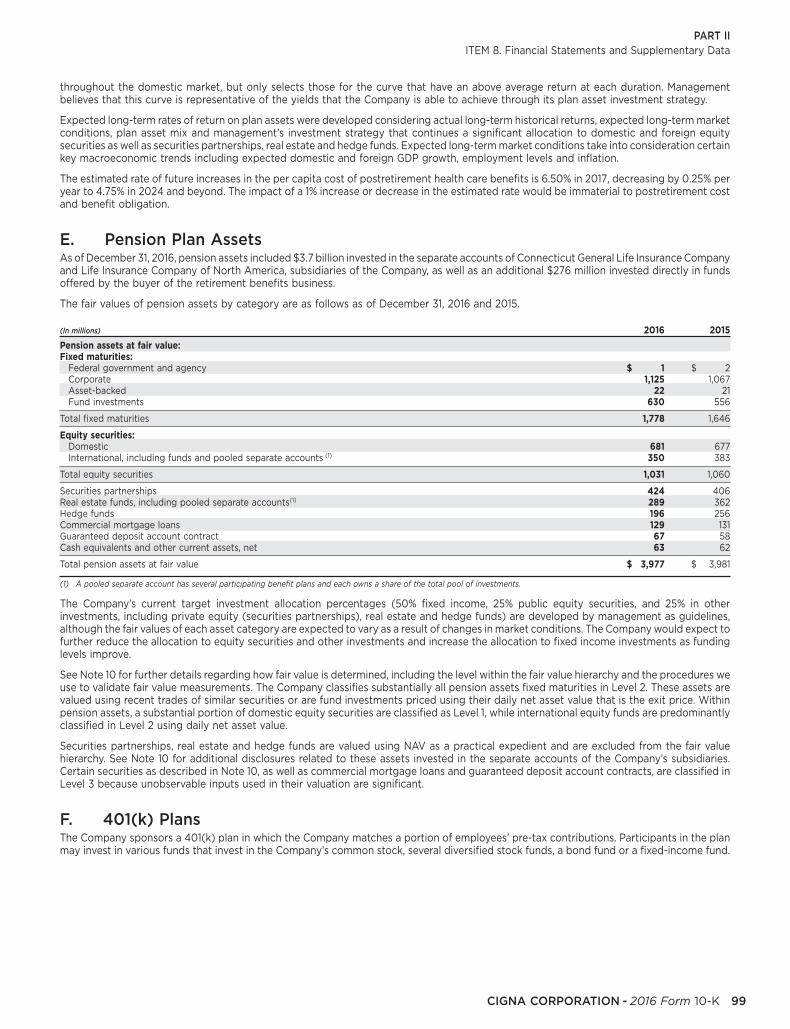
PART IIITEM 8. Financial Statements and Supplementary Data
throughout the domestic market, but only selects those for the curve that have an above average return at each duration. Managementbelieves that this curve is representative of the yields that the Company is able to achieve through its plan asset investment strategy.
Expected long-term rates of return on plan assets were developed considering actual long-term historical returns, expected long-term marketconditions, plan asset mix and management’s investment strategy that continues a significant allocation to domestic and foreign equitysecurities as well as securities partnerships, real estate and hedge funds. Expected long-term market conditions take into consideration certainkey macroeconomic trends including expected domestic and foreign GDP growth, employment levels and inflation.
The estimated rate of future increases in the per capita cost of postretirement health care benefits is 6.50% in 2017, decreasing by 0.25% peryear to 4.75% in 2024 and beyond. The impact of a 1% increase or decrease in the estimated rate would be immaterial to postretirement costand benefit obligation.
E. Pension Plan AssetsAs of December 31, 2016, pension assets included $3.7 billion invested in the separate accounts of Connecticut General Life Insurance Companyand Life Insurance Company of North America, subsidiaries of the Company, as well as an additional $276 million invested directly in fundsoffered by the buyer of the retirement benefits business.
The fair values of pension assets by category are as follows as of December 31, 2016 and 2015.
(In millions) 2016 2015
Pension assets at fair value:Fixed maturities:
Federal government and agency $ 1 $ 2Corporate 1,125 1,067Asset-backed 22 21Fund investments 630 556
Total fixed maturities 1,778 1,646
Equity securities:Domestic 681 677International, including funds and pooled separate accounts (1) 350 383
Total equity securities 1,031 1,060
Securities partnerships 424 406Real estate funds, including pooled separate accounts(1) 289 362Hedge funds 196 256Commercial mortgage loans 129 131Guaranteed deposit account contract 67 58Cash equivalents and other current assets, net 63 62
Total pension assets at fair value $ 3,977 $ 3,981
(1) A pooled separate account has several participating benefit plans and each owns a share of the total pool of investments.
The Company’s current target investment allocation percentages (50% fixed income, 25% public equity securities, and 25% in otherinvestments, including private equity (securities partnerships), real estate and hedge funds) are developed by management as guidelines,although the fair values of each asset category are expected to vary as a result of changes in market conditions. The Company would expect tofurther reduce the allocation to equity securities and other investments and increase the allocation to fixed income investments as fundinglevels improve.
See Note 10 for further details regarding how fair value is determined, including the level within the fair value hierarchy and the procedures weuse to validate fair value measurements. The Company classifies substantially all pension assets fixed maturities in Level 2. These assets arevalued using recent trades of similar securities or are fund investments priced using their daily net asset value that is the exit price. Withinpension assets, a substantial portion of domestic equity securities are classified as Level 1, while international equity funds are predominantlyclassified in Level 2 using daily net asset value.
Securities partnerships, real estate and hedge funds are valued using NAV as a practical expedient and are excluded from the fair valuehierarchy. See Note 10 for additional disclosures related to these assets invested in the separate accounts of the Company’s subsidiaries.Certain securities as described in Note 10, as well as commercial mortgage loans and guaranteed deposit account contracts, are classified inLevel 3 because unobservable inputs used in their valuation are significant.
F. 401(k) PlansThe Company sponsors a 401(k) plan in which the Company matches a portion of employees’ pre-tax contributions. Participants in the planmay invest in various funds that invest in the Company’s common stock, several diversified stock funds, a bond fund or a fixed-income fund.
CIGNA CORPORATION - 2016 Form 10-K 99

PART IIITEM 8. Financial Statements and Supplementary Data
The Company may elect to increase its matching contributions if the Company’s annual performance meets certain targets. The Company’sannual expense for these plans was as follows:
(In millions) 2016 2015 2014
Expense $ 113 $ 106 $ 98
Employee Incentive Plans
The People Resources Committee (‘‘the Committee’’) of the Board of Directors awards stock options, restricted stock, deferred stock andstrategic performance shares (‘‘SPS’’) to certain employees. The Committee has issued common stock instead of cash compensation anddividend equivalent rights to a very limited extent, as part of restricted and deferred stock units. The Company issues shares from Treasurystock for option exercises, awards of restricted stock grants and payment of strategic performance shares, deferred stock units and restrictedstock units.
The Company records compensation expense for stock and option awards over their vesting periods primarily based on the estimated fairvalue at the grant date. Fair value is determined differently for each type of award as discussed under each award type below.
Shares of common stock available for award at December 31 were as follows:
(In millions) 2016 2015 2014
Common shares available for award 6.8 8.6 10.3
Accounting policy. The Company awards options to purchase Cigna common stock at the market price of the stock on the grant date.Options vest over periods ranging from one to five years and expire no later than 10 years from grant date. Fair value is estimated using theBlack-Scholes option-pricing model by applying the assumptions presented below. That fair value is reduced by options expected to beforfeited during the vesting period. The Company estimates forfeitures at the grant date based on our experience and adjust the expense toreflect actual forfeitures over the vesting period. The fair value of options, net of forfeitures, is recognized in operating expenses on a straightline basis over the vesting period.
Compensation cost for stock options recorded in operating expenses was as follows for the years ended December 31:
(In millions) 2016 2015 2014
Compensation cost $ 53 $ 42 $ 36
Black-Scholes option-pricing model assumptions and the resulting fair value of options are presented in the following table.
2016 2015 2014
Dividend yield 0.0% 0.0% 0.1%Expected volatility 35.0% 35.0% 35.0%Risk-free interest rate 1.2% 1.3% 1.3%Expected option life 4.3 years 4.3 years 4.3 yearsWeighted average fair value of options $ 42.01 $ 36.40 $ 23.56
The expected volatility reflects the past daily stock price volatility of Cigna stock. The Company does not consider volatility implied in themarket prices of traded options to be a good indicator of future volatility because remaining traded options will expire within one year. Therisk-free interest rate is derived using the four-year U.S. Treasury bond yield rate as of the award date for the primary annual grant. Expectedoption life reflects the Company’s historical experience.
The following table shows the status of, and changes in, common stock options during the last three years.
2016 2015 2014Weighted Weighted Weighted
Average Average Average(Options in thousands) Options Exercise Price Options Exercise Price Options Exercise Price
Outstanding – January 1 6,433 $ 68.86 7,331 $ 51.84 7,350 $ 42.24Granted 1,336 $ 139.20 1,410 $ 120.94 2,012 $ 78.11Exercised (577) $ 62.09 (2,146) $ 43.63 (1,869) $ 41.29Expired or canceled (95) $ 117.18 (162) $ 86.04 (162) $ 64.27
Outstanding – December 31 7,097 $ 82.01 6,433 $ 68.86 7,331 $ 51.84
Options exercisable at year-end 4,409 $ 58.36 3,414 $ 46.55 3,919 $ 38.11
Compensation expense of $37 million related to unvested stock options at December 31, 2016 will be recognized over the next two years(weighted average period).
100 CIGNA CORPORATION - 2016 Form 10-K
NOTE 16
About Our Plans
Stock Options

PART IIITEM 8. Financial Statements and Supplementary Data
The table below summarizes information for stock options exercised during the last three years:
(In millions) 2016 2015 2014
Intrinsic value of options exercised $ 41 $ 179 $ 84Cash received for options exercised $ 36 $ 94 $ 76
The following table summarizes information for outstanding common stock options at December 31, 2016:
Options OptionsOutstanding Exercisable
Number (in thousands) 7,097 4,409Total intrinsic value (in millions) $ 372 $ 331Weighted average exercise price $ 82.01 $ 58.36Weighted average remaining contractual life 6.5 5.3
The Company awards restricted stock to the Company’s employees or directors with vesting periods ranging from two to five years. Theseawards are generally in one of two forms: restricted stock grants or restricted stock units. Restricted stock grants are the most widely usedform and are used for substantially all U.S.-based employees receiving such awards. Recipients of restricted stock grants accumulate dividendsand can vote during the vesting period, but forfeit their awards and accumulated dividends if their employment terminates before the vestingdate. Awards of restricted stock units are generally limited to overseas employees. A restricted stock unit represents a right to receive acommon share of stock when the unit vests. Recipients of restricted stock units are entitled to accumulate hypothetical dividends, but cannotvote during the vesting period. They forfeit their units and accumulated dividends if their employment terminates before the vesting date.
Accounting policy. Fair value of restricted stock awards is equal to the market price of Cigna’s common stock on the date of grant. This fairvalue is reduced by awards that are expected to forfeit. At the grant date, the Company estimates forfeitures based on experience and adjuststhe expense to reflect actual forfeitures over the vesting period. This fair value, net of forfeitures, is recognized in other operating expensesover the vesting period on a straight line basis.
Compensation cost for restricted stock grants and units was as follows for the years ended December 31:
(In millions) 2016 2015 2014
Compensation cost $ 40 $ 33 $ 31
The table below shows the status of, and changes in, restricted stock grants and units during the last three years.
2016 2015 2014Weighted Weighted Weighted
Average Fair Average Fair Average FairValue at Value at Value at
(Awards in thousands) Grants/Units Award Date Grants/Units Award Date Grants/Units Award Date
Outstanding – January 1 1,642 $ 72.58 2,121 $ 53.59 2,844 $ 41.56Awarded 315 $ 138.61 352 $ 121.93 454 $ 78.99Vested (591) $ 50.01 (736) $ 41.99 (1,065) $ 32.34Forfeited (57) $ 92.51 (95) $ 68.31 (112) $ 52.95
Outstanding – December 31 1,309 $ 97.78 1,642 $ 72.58 2,121 $ 53.59
As of December 31, the fair value of vested restricted stock was:
(In millions) 2016 2015 2014
Fair value of vested restricted stock $ 82 $ 92 $ 85
At the end of 2016, approximately 4,400 employees held 1.3 million restricted stock grants and units with $55 million of related compensationexpense to be recognized over the next two years (weighted average period).
The Company awards strategic performance shares to executives and certain other key employees generally with a performance period ofthree years. Strategic performance shares are divided into two broad groups: 50% are subject to a market condition (total shareholder returnrelative to industry peer companies) and 50% are subject to performance conditions (2014 awards: revenue growth and cumulative adjustednet income; 2015 and 2016 awards, cumulative adjusted net income). These targets are set by the Committee. At the end of the performanceperiod, holders of strategic performance shares will be awarded anywhere from 0 to 200% of the original grant of strategic performance sharesin Cigna common stock.
Accounting policy. Compensation expense for strategic performance shares is recorded over the performance period. For strategicperformance shares with payment dependent on a market condition, fair value is determined at the grant date using a Monte Carlo simulationmodel and not subsequently adjusted regardless of the final outcome. For strategic performance shares with payment dependent on
CIGNA CORPORATION - 2016 Form 10-K 101
Restricted Stock
Strategic Performance Shares

PART IIITEM 8. Financial Statements and Supplementary Data
performance conditions, expense is initially accrued based on the most likely outcome, but evaluated for adjustment each period for updates inthe expected outcome. At the end of the performance period, expense is adjusted to the actual outcome (number of shares awarded times theshare price at the grant date). At the grant date, the Company estimates forfeitures based on experience and adjusts the expense to reflectactual forfeitures over the vesting period.
Compensation expense for strategic performance shares was as follows for the years ended December 31:
(In millions) 2016 2015 2014
Compensation cost $ 35 $ 36 $ 34
The table below shows the status of, and changes in, strategic performance shares during the last three years:
2016 2015 2014Weighted Weighted Weighted
Average Fair Average Fair Average FairValue at Value at Value at
(Awards in thousands) Shares Award Date Shares Award Date Shares Award Date
Outstanding – January 1 1,188 $ 81.68 1,547 $ 59.20 1,572 $ 49.67Awarded 286 $ 139.05 311 $ 121.78 450 $ 78.50Vested (494) $ 60.15 (608) $ 45.51 (397) $ 43.53Forfeited (38) $ 112.70 (62) $ 76.33 (78) $ 58.41
Outstanding – December 31 942 $ 109.14 1,188 $ 81.68 1,547 $ 59.20
As of December 31, the fair value of vested strategic performance shares was:
2016 2015 2014(Shares in thousands; $ in millions) Shares Fair Value Shares Fair Value Shares Fair Value
Shares of Cigna common stock distributed upon SPS vesting 768 $ 109 972 $ 119 719 $ 57
At the end of 2016, approximately 1,400 employees held 942,000 strategic performance shares and $37 million of related compensationexpense is expected to be recognized over the next two years. For strategic performance shares subject to a performance condition, theamount of expense may vary based on actual performance in 2017 and 2018.
During the vesting period, the Company records tax benefits in shareholders’ net income based on the amount of expense being recognized.Beginning in 2016, in connection with the early adoption of ASU 2016-09 discussed in Note 2, when stock options are exercised, or whenrestricted stock and strategic performance share awards vest, the difference between tax benefits based on the expense and the actual taxbenefit realized are also recorded in net income. Prior to 2016, such excess tax benefits were recorded as an adjustment to additional paid-incapital. The table below provides information about the cost and tax benefits related to all of our share-based compensation arrangements.
(In millions) 2016 2015 2014
Total compensation cost for shared-based awards $ 128 $ 111 $ 101Tax benefits recognized in earnings based on expense $ 28 $ 24 $ 12Excess tax benefits realized from options exercised and awards vested $ 29 $ 60 $ 35
Goodwill, Other Intangibles, and Property and Equipment
Accounting policy. Goodwill represents the excess of the cost of businesses acquired over the fair value of their net assets. The resultinggoodwill is assigned to those reporting units expected to realize cash flows from the acquisition, allocated to reporting units based on relativefair values, primarily reported in the Global Health Care segment ($5.7 billion) and, to a lesser extent, the Global Supplemental Benefitssegment ($0.3 billion).
The Company evaluates goodwill for impairment at least annually during the third quarter at the reporting unit level and writes it down throughshareholders’ net income if impaired. Fair value of a reporting unit is generally estimated based on either market data or a discounted cash flowanalysis using assumptions that the Company believes a hypothetical market participant would use to determine a current transaction price.The significant assumptions and estimates used in determining fair value include the discount rate and future cash flows. A range of discountrates is used that corresponds with the reporting unit’s weighted average cost of capital, consistent with that used for investment decisionsconsidering the specific and detailed operating plans and strategies within the reporting unit. Projections of future cash flows for the reportingunit are consistent with our annual planning process for revenues, claims, operating expenses, taxes, capital levels and long-term growth rates.
102 CIGNA CORPORATION - 2016 Form 10-K
Compensation Cost and Tax Effects of Share-based Compensation
NOTE 17
Goodwill

PART IIITEM 8. Financial Statements and Supplementary Data
Goodwill activity. Goodwill activity during 2016 and 2015 was as follows:
(In millions) 2016 2015
Balance at January 1, $ 6,019 $ 5,989Goodwill acquired:
QualCare Alliance Networks, Inc. – 74Other 1 –
Impact of foreign currency translation (40) (44)
Balance at December 31, $ 5,980 $ 6,019
Accounting policy. The Company’s other intangible assets include purchased customer and producer relationships, provider networks andtrademarks. The fair value of purchased customer relationships and the amortization method were determined as of the dates of purchaseusing an income approach that relies on projected future net cash flows including key assumptions for the customer attrition rate and discountrate. The Company amortizes other intangibles on an accelerated or straight-line basis over periods from five to 30 years. Management revisesamortization periods if it believes there has been a change in the length of time that an intangible asset will continue to have value. Costsincurred to renew or extend the terms of these intangible assets are generally expensed as incurred.
Components of other assets, including other intangibles. Other intangible assets were comprised of the following at December 31:
Accumulated Net Carrying(In millions) Cost Amortization Value
2016Customer relationships $ 1,256 $ 965 $ 291Other 284 151 133
Total reported in other assets, including other intangibles 1,540 1,116 424Value of business acquired (reported in deferred policy acquisition costs) 232 68 164Internal-use software (reported in property and equipment) 2,766 1,997 769
Total other intangible assets $ 4,538 $ 3,181 $ 1,357
2015Customer relationships $ 1,264 $ 867 $ 397Other 302 131 171
Total reported in other assets, including other intangibles 1,566 998 568Value of business acquired (reported in deferred policy acquisition costs) 232 48 184Internal-use software (reported in property and equipment) 2,442 1,708 734
Total other intangible assets $ 4,240 $ 2,754 $ 1,486
Accounting policy. Property and equipment is carried at cost less accumulated depreciation. When applicable, cost includes interest, realestate taxes and other costs incurred during construction. Also included in this category is internal-use software that is acquired, developed ormodified solely to meet the Company’s internal needs, with no plan to market externally. Costs directly related to acquiring, developing ormodifying internal-use software are capitalized.
The Company calculates depreciation and amortization principally using the straight-line method generally based on the estimated useful lifeof each asset as follows: buildings and improvements, 10 to 40 years; purchased software, one to five years; internally developed software,three to seven years; and furniture and equipment (including computer equipment), three to 10 years. Improvements to leased facilities aredepreciated over the lesser of the remaining lease term or the estimated life of the improvement. The Company considers events andcircumstances that would indicate the carrying value of property, equipment or capitalized software might not be recoverable. If the Companydetermines the carrying value of any of these assets is not recoverable, an impairment charge is recorded.
Components of property and equipment. Property and equipment was comprised of the following as of December 31:
Accumulated Net Carrying(In millions) Cost Amortization Value
2016Internal-use software $ 2,766 $ 1,997 $ 769Other property and equipment
Assets recorded under capital leases (1) 87 49 38Other property and equipment not recorded under capital leases 1,511 782 729
Total other property and equipment 1,598 831 767
Total property and equipment $ 4,364 $ 2,828 $ 1,536
2015Internal-use software $ 2,442 $ 1,708 $ 734Other property and equipment
Assets recorded under capital leases (1) 90 44 46Other property and equipment not recorded under capital leases 1,484 730 754
Total other property and equipment 1,574 774 800
Total property and equipment $ 4,016 $ 2,482 $ 1,534
(1) Current capital lease agreements are for equipment and generally have a term of 48 months with the equipment expected to be returned to the lessor at termination.
CIGNA CORPORATION - 2016 Form 10-K 103
Other Intangibles
Property and Equipment

PART IIITEM 8. Financial Statements and Supplementary Data
Components of depreciation and amortization. Depreciation and amortization was comprised of the following for the years endedDecember 31:
(In millions) 2016 2015 2014
Internal-use software $ 303 $ 288 $ 260Other property and equipment (1) 158 160 153Value of business acquired (reported in deferred policy acquisition costs) 20 18 12Other intangibles (2) 129 119 163
Total depreciation and amortization $ 610 $ 585 $ 588
(1) Other property and equipment includes amortization on assets recorded under capital leases of $20 million in 2016, $22 million in 2015 and $20 million in 2014.
(2) Includes the one-time $23 million bargain purchase gain on an acquisition in 2015.
The Company estimates annual pre-tax amortization for intangible assets, including internal-use software, over the next five calendar years tobe as follows:
(In millions) Pre-tax Amortization
2017 $ 3892018 $ 3052019 $ 2152020 $ 1042021 $ 89
Leases and Rentals
Description of operating leases. The Company’s operating leases are primarily for office space. Some of these leases include renewal optionsand other incentives that are amortized over the life of the lease. Office space leases active in 2016 had terms ranging from one month to18 years.
Rental expense and payments. For the years ended December 31, net rental expenses for operating leases were approximately:
(In millions) 2016 2015 2014
Net rental expense for operating leases $ 151 $ 165 $ 150
As of December 31, 2016, future net minimum rental payments under non-cancelable operating leases were approximately $650 million,payable as follows:
(In millions) Operating Lease Payments
2017 $ 1352018 $ 1192019 $ 962020 $ 812021 $ 662022 and thereafter $ 164
The Company also has capital lease arrangements. See Note 17 and Note 5 for further information on assets recorded under capital leases andthe related obligations.
Shareholders’ Equity and Dividend Restrictions
State insurance departments and foreign jurisdictions that regulate certain of the Company’s subsidiaries prescribe accounting practices(differing in some respects from GAAP) to determine statutory net income and surplus. The Company’s life insurance and HMO subsidiaries areregulated by such statutory requirements. The statutory net income of the Company’s life insurance and HMO subsidiaries for the years ended,and their statutory surplus as of December 31, were as follows:
(In billions) 2016 2015 2014
Net income $ 2.0 $ 2.1 $ 2.0Surplus $ 8.5 $ 8.0 $ 7.5
104 CIGNA CORPORATION - 2016 Form 10-K
NOTE 18
NOTE 19

PART IIITEM 8. Financial Statements and Supplementary Data
The Company’s HMO and life subsidiaries are subject to minimum statutory surplus requirements and may be required to maintain investmentson deposit with state departments of insurance or other regulatory bodies. Additionally, these subsidiaries may be subject to regulatoryrestrictions on the amount of annual dividends or other distributions (such as loans or cash advances) that insurance companies may extend tothe parent company without prior approval. As of December 31, 2016, these amounts, including restricted net assets of the Company, were asfollows:
(In billions) 2016
Minimum statutory surplus required by regulators $ 2.7Investments on deposit with regulatory bodies $ 0.5Maximum dividend distributions permitted in 2017 without state approval $ 1.6Maximum loans to the parent company permitted without state approval $ 1.3Restricted net assets of Cigna Corporation $ 8.8
There were no permitted practices for the Company’s insurance subsidiaries that significantly differed from prescribed regulatory accountingpractices.
Income Taxes
Accounting policy. Deferred income tax assets and liabilities are recognized for differences between the financial and income tax reportingbases of the underlying assets and liabilities and established based upon enacted tax rates and laws. Deferred income tax assets arerecognized when available evidence indicates that realization is more likely than not. The deferred income tax provision generally representsthe net change in deferred income tax assets and liabilities during the year, excluding amounts reported as adjustments to accumulated othercomprehensive income or amounts initially recorded due to business combinations. The current income tax provision generally representsestimated amounts due on various income tax returns for the year reported plus the effect of any uncertain tax positions. Uncertain taxpositions are evaluated in accordance with GAAP.
As part of its global capital management strategy, the Company’s foreign operations retain a significant portion of their earnings overseas.These undistributed earnings are deployed outside of the U.S. in support of the liquidity and capital needs of our foreign operations. TheCompany does not intend to repatriate these earnings to the U.S. and as a result, income taxes are provided using the respective foreignjurisdictions’ tax rate.
Income tax provisions related to the Company’s foreign operations are generally determined based upon the local country income tax rate.
A. Income Tax Expense
The components of income taxes for the years ended December 31 were as follows:
(In millions) 2016 2015 2014
Current taxesU.S. income taxes $ 935 $ 1,076 $ 1,068Foreign income taxes 95 93 115State income taxes 32 60 49
Total current taxes 1,062 1,229 1,232
Deferred taxes (benefits)U.S. income taxes 69 22 10Foreign income taxes (benefits) 9 (6) (22)State income taxes (benefits) (4) 5 (10)
Total deferred taxes 74 21 (22)
Total income taxes $ 1,136 $ 1,250 $ 1,210
Total income taxes for the years ended December 31 were different from the amount computed using the nominal federal income tax rate of35% for the following reasons:
(In millions) 2016 2015 2014
Tax expense at nominal rate $ 1,043 $ 1,164 $ 1,156Effect of undistributed foreign earnings (57) (67) (74)Health insurance industry tax 108 109 83State income tax (net of federal income tax benefit) 18 42 25Other 24 2 20
Total income taxes $ 1,136 $ 1,250 $ 1,210
Consolidated pre-tax income from the Company’s foreign operations was approximately 11% of the Company’s pre-tax income in 2016 and2015, compared with 10% in 2014.
The consolidated effective tax rates of 38.1% in 2016 and 37.6% in 2015 have increased from historical levels due to the health insurance industrytax that took effect in 2014 and that is not deductible for federal income tax purposes. Undistributed foreign earnings also may affect theeffective tax rates. The Company has accumulated undistributed foreign earnings of $2.5 billion as of December 31, 2016. If the Company
CIGNA CORPORATION - 2016 Form 10-K 105
NOTE 20

PART IIITEM 8. Financial Statements and Supplementary Data
intended to repatriate these foreign earnings to the U.S., the Company’s Consolidated Balance Sheets would have included an additional$325 million of deferred tax liabilities as of December 31, 2016.
B. Deferred Income Taxes
Deferred income tax assets and liabilities as of December 31 were as follows:
(In millions) 2016 2015
Deferred tax assetsEmployee and retiree benefit plans $ 481 $ 535Other insurance and contractholder liabilities 460 465Net operating losses 128 101Other accrued liabilities 166 177Other 140 99
Deferred tax assets before valuation allowance 1,375 1,377Valuation allowance for deferred tax assets (87) (71)
Deferred tax assets, net of valuation allowance 1,288 1,306
Deferred tax liabilitiesDepreciation and amortization 781 765Unrealized appreciation on investments and foreign currency translation 149 152Other 54 10
Total deferred tax liabilities 984 927
Net deferred income tax assets $ 304 $ 379
Included in the consolidated net deferred tax asset of $304 million is approximately $140 million of deferred tax liabilities attributable toforeign jurisdictions, most notably Korea and Taiwan.
Management believes that future results will be sufficient to realize the Company’s deferred tax assets. With the exception of certain netoperating loss related tax benefits, the Company’s deferred tax benefits may be carried forward indefinitely. Net operating loss benefits areprimarily attributable to foreign jurisdictions. The Company establishes a valuation allowance when it determines that realization of a deferredtax asset does not meet the more likely than not standard. Valuation allowances have been established against certain federal, foreign andstate deferred tax assets, generally when there is a requirement to assess them on a separate entity basis. The increased valuation allowance in2016 is primarily attributable to net operating losses of certain foreign operations.
C. Uncertain Tax Positions
A reconciliation of unrecognized tax benefits for the years ended December 31 was as follows:
(In millions) 2016 2015 2014
Balance at January 1, $ 31 $ 26 $ 17Increase due to current year positions 10 7 12Reduction related to settlements with taxing authorities (2) – –Reduction related to lapse of applicable statute of limitations (8) (2) (3)
Balance at December 31, $ 31 $ 31 $ 26
D. Other Tax Matters
The Company conducts business in a number of state and foreign jurisdictions, and may be engaged in multiple audit proceedings at any giventime. Generally, no further state audit activity is expected for tax years prior to 2009, and prior to 2010 for foreign audit activity.
In 2016, the Internal Revenue Service (‘‘IRS’’) completed its examination of the Company’s 2011 and 2012 tax years, resulting in an immaterialeffect on shareholders’ net income.
Contingencies and Other Matters
The Company, through its subsidiaries, is contingently liable for various guarantees provided in the ordinary course of business.
A. Financial Guarantees: Retiree and Life Insurance Benefits
Separate account assets are contractholder funds maintained in accounts with specific investment objectives. The Company records separateaccount liabilities equal to separate account assets. In certain cases, the Company guarantees a minimum level of benefits for retirement andinsurance contracts written in separate accounts. The Company establishes an additional liability if management believes that the Companywill be required to make a payment under these guarantees.
106 CIGNA CORPORATION - 2016 Form 10-K
NOTE 21

PART IIITEM 8. Financial Statements and Supplementary Data
The Company guarantees that separate account assets will be sufficient to pay certain life insurance or retiree benefits. The sponsoringemployers are primarily responsible for ensuring that assets are sufficient to pay these benefits and are required to maintain assets that exceeda certain percentage of benefit obligations. This percentage varies depending on the asset class within a sponsoring employer’s portfolio (forexample, a bond fund would require a lower percentage than a riskier equity fund) and thus will vary as the composition of the portfoliochanges. If employers do not maintain the required levels of separate account assets, the Company or an affiliate of the buyer of the retirementbenefits business (Prudential Retirement Insurance and Annuity Company) has the right to redirect the management of the related assets toprovide for benefit payments. As of December 31, 2016, employers maintained assets that exceeded the benefit obligations. Benefit obligationsunder these arrangements were $490 million as of December 31, 2016 and approximately 13% of these are reinsured by an affiliate of the buyerof the retirement benefits business. The remaining guarantees are provided by the Company with minimal reinsurance from third parties. Therewere no additional liabilities required for these guarantees as of December 31, 2016. Separate account assets supporting these guarantees areclassified in Levels 1 and 2 of the GAAP fair value hierarchy. See Note 10 for further information about the fair value hierarchy.
The Company does not expect that these financial guarantees will have a material effect on the Company’s consolidated results of operations,liquidity or financial condition.
B. Guaranteed Minimum Income Benefit Contracts
See Note 9 for discussion.
C. Certain Other Guarantees
The Company had financial guarantees and indemnification obligations to lenders of approximately $152 million as of December 31, 2016,related to borrowings by certain real estate joint ventures that the Company either records as an investment or consolidates. These borrowings,that are primarily nonrecourse obligations of the Company, are secured by the joint ventures’ real estate properties with fair values in excess ofthe loan amounts and mature at various dates beginning in 2018 through 2021. The Company’s indemnification obligations would requirepayment to lenders for any actual damages resulting from certain acts such as unauthorized ownership transfers, misappropriation of rentalpayments by others or environmental damages. Based on initial and ongoing reviews of property management and operations, the Companydoes not expect that payments will be required under these financial guarantees or indemnification obligations. Any payments that might berequired could be recovered through a refinancing or sale of the assets. In some cases, the Company also has recourse to partners for theirproportionate share of amounts paid. There were no liabilities required for these guarantees and indemnification obligations as ofDecember 31, 2016.
As of December 31, 2016, the Company guaranteed that it would compensate the lessors for a shortfall of up to $42 million in the market valueof certain leased equipment at the end of the lease. Guarantees of $10 million expire in 2017, $25 million expire in 2022 and $7 million expire in2026. The Company recorded liabilities for these guarantees of $5 million as of December 31, 2016.
The Company does not expect that these guarantees will have a material adverse effect on the Company’s consolidated results of operations,financial condition or liquidity.
The Company had indemnification obligations as of December 31, 2016 in connection with acquisition, disposition and reinsurancetransactions. These indemnification obligations are triggered by the breach of representations or covenants provided by the Company, such asrepresentations for the presentation of financial statements, the filing of tax returns, compliance with law or the identification of outstandinglitigation. These obligations are typically subject to various time limitations, defined by the contract or by operation of law, such as statutes oflimitation. In some cases, the maximum potential amount due is subject to contractual limitations based on a percentage of the transactionpurchase price, while in other cases limitations are not specified or applicable. The Company does not believe that it is possible to determinethe maximum potential amount due under these obligations because not all amounts due under these indemnification obligations are subjectto limitation. There were no liabilities for these indemnification obligations as of December 31, 2016.
D. Guaranty Fund Assessments
The Company operates in a regulatory environment that may require the Company to participate in assessments under state insuranceguaranty association laws. The Company’s exposure to assessments for certain obligations of insolvent insurance companies to policyholdersand claimants is based on its share of business written in the relevant jurisdictions. For the year ended December 31, 2016 and 2015, chargesrelated to guaranty fund assessments were immaterial to the Company’s results of operations.
The Company is aware that Penn Treaty Network America Insurance Company, together with its subsidiary American Network InsuranceCompany (collectively ‘‘Penn Treaty’’) is in rehabilitation. In 2012, the state court denied the regulator’s amended petitions for liquidation andset forth specific requirements and a deadline for the regulator to develop a plan of rehabilitation without liquidating Penn Treaty. Theregulator has appealed the court’s decision. More recently, the state court has been holding settlement conferences to attempt to resolveoutstanding issues with the rehabilitation plan. In July 2016, the regulator, who is the rehabilitator, filed another amended petition forliquidation with the court. Based on the developments in this matter, it is reasonably likely that a guaranty fund assessment related to PennTreaty will be finalized in 2017. Due to the uncertainties surrounding this matter, the Company’s share of this guaranty fund assessment relatedto Penn Treaty is uncertain, but based on current information it is estimated to approximate $85 million after-tax. The majority of thisassessment is expected to be offset in the future by premium tax credits that will be recognized in the period received. The Company continuesto monitor this situation.
CIGNA CORPORATION - 2016 Form 10-K 107

PART IIITEM 8. Financial Statements and Supplementary Data
E. Legal and Regulatory Matters
The Company is routinely involved in numerous claims, lawsuits, regulatory audits, investigations and other legal matters arising, for the mostpart, in the ordinary course of managing a global health services business. These actions may include benefit disputes, breach of contractclaims, tort claims, provider disputes, disputes regarding reinsurance arrangements, employment and employment discrimination-relatedsuits, employee benefit claims, wage and hour claims, privacy, claims arising from consumer protection laws, intellectual property claims andreal estate-related disputes. There are currently, and may be in the future, attempts to bring class action lawsuits against the industry. TheCompany also is regularly engaged in IRS audits and may be subject to examinations by various state and foreign taxing authorities. Disputedincome tax matters arising from these examinations, including those resulting in litigation, are accounted for under GAAP guidance foruncertain tax positions. Further information on income tax matters can be found in Note 20.
The business of administering and insuring health services programs, particularly health care and group insurance programs, is heavilyregulated by federal and state laws and administrative agencies, such as state departments of insurance and the U.S. Departments of Healthand Human Services, Treasury, Labor and Justice, as well as the courts. Health care regulation and legislation in its various forms, including theHealth Care Reform Act, other regulatory reform initiatives, such as those relating to Medicare programs, or additional changes in existing lawsor regulations or their interpretations, could have a material adverse effect on the Company’s business, results of operations and financialcondition.
In addition, there is heightened review by federal and state regulators of the health care, disability and life insurance industry business andrelated reporting practices. Cigna is frequently the subject of regulatory market conduct reviews and other examinations of its business andreporting practices, audits and investigations by state insurance and health and welfare departments, state attorneys general, CMS and theOffice of Inspector General (‘‘OIG’’). With respect to Cigna’s Medicare Advantage business, CMS and OIG perform audits to determine a healthplan’s compliance with federal regulations and contractual obligations, including compliance with proper coding practices (sometimesreferred to as Risk Adjustment Data Validation audits or RADV audits), that may result in retrospective adjustments to payments made tohealth plans. Regulatory actions can result in assessments, civil or criminal fines or penalties or other sanctions, including loss of licensing orexclusion from participating in government programs.
In December 2016, the Company received a Civil Investigative Demand from the Civil Division of the U.S. Department of Justice relating to ourMedicare Part C and D risk adjustment compliance activities and business processes, particularly as they relate to our review of medical recordsconducted as part of our data and payment accuracy compliance efforts. We believe that this request for information is in connection with abroader review of Medicare Risk Adjustment generally that includes a number of Medicare Advantage plans, providers and vendors. We intendto cooperate with and voluntarily respond to the information request.
As a global company, Cigna is also subject to the laws, regulations and rules of the foreign jurisdictions in which it conducts business. Foreignlaws and rules, and regulatory audit and investigation practices, may differ from or be more stringent than, similar requirements in the U.S.
Regulation, legislation and judicial decisions have resulted in changes to industry and the Company’s business practices, financial liability orother sanctions and will continue to do so in the future.
When the Company (in the course of its regular review of pending litigation and legal or regulatory matters) has determined that a material lossis reasonably possible, the matter is disclosed. Such matters are described below. In accordance with GAAP, when litigation and regulatorymatters present loss contingencies that are both probable and estimable, the Company accrues the estimated loss by a charge to shareholders’net income. The amount accrued represents the Company’s best estimate of the probable loss at the time. If only a range of estimated lossescan be determined, the Company accrues an amount within the range that, in the Company’s judgment, reflects the most likely outcome; ifnone of the estimates within that range is a better estimate than any other amount, the Company accrues the minimum amount of the range. Incases when the Company has accrued an estimated loss, the accrued amount may differ materially from the ultimate amount of the loss. Inmany proceedings, it is inherently difficult to determine whether any loss is probable or even possible or to estimate the amount or range of anyloss. The Company provides disclosure in the aggregate for material pending litigation and legal or regulatory matters, including accruals,range of loss, or a statement that such information cannot be estimated. As a litigation or regulatory matter develops, the Company monitorsthe matter for further developments that could affect the amount previously accrued, if any, and updates such amount accrued or disclosurespreviously provided as appropriate.
The outcome of litigation and other legal or regulatory matters is always uncertain, and unfavorable outcomes that are not justified by theevidence or existing law can occur. The Company believes that it has valid defenses to the matters pending against it and is defending itselfvigorously. Except as otherwise noted, the Company believes that the legal actions, regulatory matters, proceedings and investigationscurrently pending against it should not have a material adverse effect on the Company’s results of operations, financial condition or liquiditybased upon our current knowledge and taking into consideration current accruals. Litigation related to the Company’s claim processingpractices for a commercial client, for which the Company held a reserve at September 30, 2016, was settled during the fourth quarter of 2016.The Company had pre-tax reserves as of December 31, 2016 of $190 million ($125 million after-tax) for the matters discussed below under‘‘Litigation Matters.’’ Due to numerous uncertain factors presented in these cases, it is not possible to estimate an aggregate range of loss (ifany) for these matters at this time. In light of the uncertainties involved in these matters, there is no assurance that their ultimate resolution willnot exceed the amounts currently accrued by the Company. An adverse outcome in one or more of these matters could be material to theCompany’s results of operations, financial condition or liquidity for any particular period.
Litigation MattersAmara cash balance pension plan litigation. In December 2001, Janice Amara filed a class action lawsuit in the U.S. District Court for theDistrict of Connecticut against Cigna Corporation and the Cigna Pension Plan (the ‘‘Plan’’) on behalf of herself and other similarly situated Planparticipants affected by the 1998 conversion to a cash balance formula. The plaintiffs allege various violations of the Employee RetirementIncome Security Act of 1974 (‘‘ERISA’’), including that the Plan’s cash balance formula discriminates against older employees; that theconversion resulted in a wear-away period (when the pre-conversion accrued benefit exceeded the post-conversion benefit); and that the Plancommunications contained inaccurate or inadequate disclosures about these conditions.
108 CIGNA CORPORATION - 2016 Form 10-K

PART IIITEM 8. Financial Statements and Supplementary Data
In 2008, the District Court (1) affirmed the Company’s right to convert to a cash balance plan prospectively beginning in 1998; (2) found forplaintiffs on the disclosure claim only; and (3) required the Company to pay pre-1998 benefits under the pre-conversion traditional annuityformula and post-1997 benefits under the post-conversion cash balance formula. The Second Circuit upheld this decision. From 2008 throughthe present, this case has undergone a series of court proceedings that resulted in the original District Court order being largely upheld. In 2015,the Company submitted to the District Court its proposed method for calculating the additional pension benefits due to class members andplaintiffs responded in August 2015.
In January 2016, the District Court ordered the method of calculating the additional pension benefits due to class members. The court order leftseveral aspects of the calculation of additional plan benefits open to interpretation. During 2016, the Company submitted its interpretation ofthe Court Order and the plaintiffs filed various objections. On January 10, 2017, the District Court issued an additional ruling regarding certainaspects of the calculation of additional plan benefits. The Company’s reserve for this litigation remains reasonable at December 31, 2016 basedon calculations consistent with the Company’s interpretation of the updated guidance from the Court. However, certain aspects of the rulingwill need further clarification from the Court before final plan benefits can be determined. As a result, the timing of the resolution of this matterremains uncertain. Once resolved, the Plan will be amended to comply with the final interpretation of the District Court’s order and the benefitswill begin to be paid.
Ingenix. In April 2004, the Company was sued in a number of putative nationwide class actions alleging that the Company improperlyunderpaid claims for out-of-network providers through the use of data provided by Ingenix, Inc., a subsidiary of one of the Company’scompetitors. These actions were consolidated into Franco v. Connecticut General Life Insurance Company, et al., pending in the U.S. DistrictCourt for the District of New Jersey. The consolidated amended complaint, filed in 2009 on behalf of subscribers, health care providers andvarious medical associations, asserted claims related to benefits and disclosure under ERISA, the Racketeer Influenced and CorruptOrganizations (‘‘RICO’’) Act, the Sherman Antitrust Act and New Jersey state law and seeks recovery for alleged underpayments from 1998through the present. Other major health insurers have been the subject of, or have settled, similar litigation.
In September 2011, the District Court (1) dismissed all claims by the health care provider and medical association plaintiffs for lack of standing;and (2) dismissed the antitrust claims, the New Jersey state law claims and the ERISA disclosure claim. In January 2013 and again in April 2014,the District Court denied separate motions by the plaintiffs to certify a nationwide class of subscriber plaintiffs. The Third Circuit deniedplaintiffs’ request for an immediate appeal of the January 2013 ruling. As a result, the case is proceeding on behalf of the named plaintiffs only.In June 2014, the District Court granted the Company’s motion for summary judgment to terminate all claims, and denied the plaintiffs’ partialmotion for summary judgment. In July 2014, the plaintiffs appealed all of the District Court’s decisions in favor of the Company, including theclass certification decision, to the Third Circuit. On May 2, 2016, the Third Circuit affirmed the District Court’s decisions denying classcertification for the claims asserted by members, the granting of summary judgment on the individual plaintiffs’ claims, as well as the dismissalof the antitrust claims. However, the Third Circuit also reversed the earlier dismissal of the providers’ ERISA claims. The Company will continueto vigorously defend its position.
Regulatory MattersCMS actions. In January 2016, CMS issued a Notice of Imposition of Immediate Intermediate Sanctions (the ‘‘Notice’’) to the Company. TheNotice required us to suspend certain enrollment and marketing activities for Medicare Advantage-Prescription Drug and Medicare Part DPlans. The sanctions do not impact the right of current enrollees to remain covered by our Medicare Advantage-Prescription Drug or MedicarePart D Plans. The Company continues to devote significant resources to our remediation efforts. For the year ended December 31, 2016, costsrelated to our CMS audit response were approximately $100 million after-tax.
CMS imposed sanctions based on its findings of deficiencies with the Company’s operations of its Parts C and D appeals and grievances, Part Dformulary and benefit administration and compliance program. While these matters were not resolved in time to participate in the 2017Medicare Advantage and Part D annual enrollment period, we continue to work with CMS to address the audit findings and have the sanctionslifted as quickly as possible. We expect to have these sanctions lifted in time to participate in the 2018 annual enrollment period. The impact ofdisenrollment was not material to 2016 consolidated revenues and earnings. In 2017, Medicare enrollment and consolidated revenues will bematerially impacted due to our inability to participate in 2017 annual enrollment. However, management does not anticipate that 2017shareholders’ net income will be materially affected because we expect to offset the margin impact of the revenue loss with several factorsincluding significantly lower costs to remediate the sanctions and other operational efficiencies.
On October 12, 2016, CMS announced Medicare Star Quality Ratings (‘‘Star Ratings’’) for 2017. While Star Ratings are based on a number of planperformance measures that are evaluated each year, the projected Star Ratings for our plans included certain reductions that are primarilyattributable to our CMS audit discussed above. Under these revised Star Ratings, approximately 20% of our Medicare Advantage customers areexpected to be in a 4 Stars or greater plan. The Company does not believe that these Star Ratings reflect the quality offerings Cigna-HealthSpring provides to beneficiaries.
The Company filed a Reconsideration request with CMS, which was denied, and will work fully with CMS through their process as well asconsider additional alternatives with the objective that the final Star Ratings more accurately reflect our performance under the Star Ratingsmeasures. The Company remains committed to our partnership with CMS and to delivering quality products and services to seniors, whileworking to mitigate the impact these Star Ratings could have on our offerings in 2018. There is no financial impact in 2016 or 2017 becausethese ratings apply to plans for the 2018 payment year. However, if we are unsuccessful in restoring at least some of the Star Ratings, the effectin 2018 could be material to shareholders’ net income. The actual impact on earnings in 2018 could potentially be offset in part by theCompany’s ability to restore some or all of our downgraded 2018 Star Ratings, modify our product offerings and implement operationalefficiencies in the Government business.
CIGNA CORPORATION - 2016 Form 10-K 109

PART IIITEM 8. Financial Statements and Supplementary Data
Disability claims regulatory matter. During the second quarter of 2013, the Company finalized an agreement with the Departments ofInsurance for Maine, Massachusetts, Pennsylvania, Connecticut and California (together, the ‘‘monitoring states’’) related to the Company’slong-term disability claims handling practices. The agreement requires primarily: (1) enhanced procedures related to documentation anddisposition and (2) a two-year monitoring period followed by a re-examination that began in the second quarter of 2016. Management believesthe Company has addressed the requirements of the agreement. If the monitoring states find material non-compliance with the agreementupon re-examination, the Company may be subject to additional costs and penalties or requests to change its business practices that couldnegatively impact future earnings for this business.
Other Legal MattersAntitrust Litigation. On July 21, 2016, the U.S. Department of Justice (‘‘DOJ’’) and certain state attorneys general filed a civil antitrust lawsuitin the U.S. District Court for the District of Columbia (the ‘‘District Court’’) seeking to block the merger and, on January 4, 2017, the partiesconcluded the District Court trial. On February 8, 2017, the District Court issued an order enjoining the proposed merger. Anthem filed a noticeof appeal of the District Court’s order with the U.S. Court of Appeals for the District of Columbia Circuit (the ‘‘Appeals Court’’) and requested anexpedited appeal. On February 17, 2017, the Appeals Court granted Anthem’s motion for an expedited appeal and set oral arguments forMarch 24, 2017. That same day, the Company filed its notice of appeal of the District Court’s order with the Appeals Court.
Litigation with Anthem. On February 14, 2017, the Company delivered a notice to Anthem terminating the merger agreement, and notifyingAnthem that it must pay the Company the $1.85 billion reverse termination fee pursuant to the terms of the merger agreement. Also onFebruary 14, 2017, the Company filed suit against Anthem in the Delaware Court of Chancery (the ‘‘Chancery Court’’). The complaint soughtdeclaratory judgments that the Company’s termination of the merger agreement was valid and that Anthem was not permitted to extend thetermination date. The complaint also sought payment of the reverse termination fee and additional damages in an amount exceeding$13 billion, which includes the lost premium value to the Company’s shareholders caused by Anthem’s willful breaches of the mergeragreement.
Also on February 14, 2017, Anthem filed a lawsuit in the Chancery Court against the Company seeking (i) a temporary restraining order toenjoin Cigna from terminating and taking any action contrary to the terms of the merger agreement, (ii) specific performance compellingCigna to comply with the merger agreement and (iii) damages. On February 15, 2017, the Chancery Court granted Anthem’s motion for atemporary restraining order and issued an order temporarily enjoining the Company from terminating the Merger Agreement. This is not adecision on the merits of the case, but rather an order to ensure irrevocable actions do not take place before the Chancery Court’s substantivereview of the issues. The Company will continue to abide by terms of the merger agreement until the expiration or lifting of the ChanceryCourt’s order and any further review of the case by the Chancery Court. This order will be subject to review by the Chancery Court at apreliminary injunction hearing.
We believe in the merits of our claims and dispute Anthem’s claims, and we intend to vigorously defend ourselves and pursue our claims. Theoutcomes of lawsuits are inherently unpredictable, and we may be unsuccessful in the ongoing litigation or any future claims or litigation.
Shareholder Litigation. Following announcement of the Company’s merger agreement with Anthem as discussed in Note 3, putative classaction complaints (collectively the ‘‘complaints’’ or ‘‘Cigna Merger Litigation’’) were filed by purported Cigna shareholders on behalf of apurported class of Cigna shareholders. Additional lawsuits arising out of or relating to the merger agreement or the merger may be filed in thefuture.
Cigna, members of the Cigna board of directors, Anthem and Anthem Merger Sub Corp (‘‘Merger Sub’’) have been named as defendants. Theplaintiffs generally assert that the members of the Cigna board of directors breached their fiduciary duties to the Cigna shareholders duringmerger negotiations and by entering into the merger agreement and approving the merger, and that Cigna, Anthem and Merger Sub aided andabetted such breaches of fiduciary duties. The allegations include, among other things, that (1) the merger consideration undervalues Cigna,(2) the sales process leading up to the merger was flawed due to purported conflicts of interest of members of the Cigna board of directors and(3) certain provisions of the merger agreement inappropriately favor Anthem and inhibit competing bids. Plaintiffs seek, among other things,injunctive relief enjoining the merger, rescission of the merger agreement to the extent already implemented, and costs and damages.
Effective November 24, 2015, solely to avoid the costs, risks and uncertainties inherent in litigation, and without admitting any liability orwrongdoing, the Company, the Company’s directors, Anthem and Merger Sub entered into a Memorandum of Understanding (‘‘MOU’’) to settlethe Cigna Merger Litigation. Subject to approval by the Connecticut Superior Court, Judicial District of Hartford and further definitivedocumentation in a settlement agreement that will be subject to customary conditions, the MOU resolved the Cigna Merger Litigation andprovided that the Company would make certain additional disclosures related to the merger. If the Court approves the settlement, the CignaMerger Litigation will be dismissed with prejudice and all claims that were or could have been brought in any actions challenging any aspect ofthe merger, the merger agreement and any related disclosures will be released. In connection with the settlement, subject to the ultimatedetermination of the Court, plaintiffs’ counsel may receive an award of reasonable fees. There can be no assurance that the parties willultimately enter into a settlement agreement, or that the Court will approve the settlement even if the parties were to enter into suchagreement. The MOU may terminate, if, among other reasons, the Court does not approve the settlement or the merger is not consummated forany reason.
Segment InformationSee Note 1 for a description of our reporting segments.
In the Company’s segment disclosures, we present ‘‘operating revenues,’’ defined as total revenues excluding realized investment results. TheCompany excludes realized investment results from this measure because its portfolio managers may sell investments based on factors largelyunrelated to the underlying business purposes of each segment. As a result, gains or losses created in this process may not be indicative of pastor future underlying performance of the business.
110 CIGNA CORPORATION - 2016 Form 10-K
NOTE 22

PART IIITEM 8. Financial Statements and Supplementary Data
The Company uses ‘‘adjusted income (loss) from operations’’ as its principal financial measure of segment operating performance becausemanagement believes it best reflects the underlying results of business operations and permits analysis of trends in underlying revenue,expenses and profitability. Adjusted income from operations is defined as shareholders’ net income (loss) excluding after-tax realizedinvestment gains and losses, net amortization of other acquired intangible assets and special items. Income or expense amounts are excludedfrom adjusted income from operations for the following reasons:
Realized investment results are excluded because, as noted above, our portfolio managers may sell investments based on factors largelyunrelated to the underlying business purposes of each segment.
Net amortization of other intangible assets is excluded because it relates to costs incurred for acquisitions and, as a result, it does not relate tothe core performance of the Company’s business operations. In 2015, the amortization amount was net of a bargain purchase gain on anacquisition.
Special items, if any, are excluded because management believes they are not representative of the underlying results of operations. This isgenerally because the nature and size of these matters are not indicative of our ongoing business operations. Additional details about theseitems that provide further context as to why they are not considered indicative of ongoing business operations may be found in the footnotesreferenced in the table below.
The table below presents the special items recorded by the Company for the years ended December 31, 2016 and 2015. There were no specialitems recorded for the year ended 2014.
(In millions)Year (1) Description and Financial Statement Line Item(s) After-tax Before-tax
2016 Risk corridor allowance (Other operating expenses, see page 113 in this Note for details) $ 80 $ 1242016 Merger related transaction costs (Other operating expenses, see Note 3 for details) $ 147 $ 1662016 Charges associated with litigation matters (Other operating expenses, see Note 21 for a description of litigation
charges) $ 25 $ 402015 Debt extinguishment costs (Other operating expenses, see Note 5 for details) $ 65 $ 1002015 Merger related transaction costs (Other operating expenses, see Note 3 for details) $ 57 $ 66
CIGNA CORPORATION - 2016 Form 10-K 111
•
•
•

PART IIITEM 8. Financial Statements and Supplementary Data
Summarized segment financial information for the years ended December 31, was as follows:
Global GroupGlobal Health Supplemental Disability Other
(In millions) Care Benefits and Life Operations Corporate Total
2016Premiums $ 23,295 $ 3,226 $ 4,002 $ 103 $ – $ 30,626Fees and other revenues 4,623 49 98 11 (21) 4,760Net investment income 315 110 343 358 21 1,147Mail order pharmacy revenues 2,966 – – – – 2,966
Total operating revenues 31,199 3,385 4,443 472 – 39,499Net realized investment gains (losses) 119 (5) 59 (5) 1 169
Total revenues 31,318 3,380 4,502 467 1 39,668
Depreciation and amortization 526 54 28 1 1 610
Total benefits and expenses 28,467 3,052 4,273 369 528 36,689
Income before taxes 2,851 328 229 98 (527) 2,979Income taxes and net loss attributable to noncontrolling interests 1,100 60 65 30 (143) 1,112
Shareholders’ net income by segment 1,751 268 164 68 (384) 1,867
After-tax adjustments to reconcile to adjusted income fromoperations:
Net realized investment (gains) losses (78) 6 (39) 2 – (109)Amortization of other acquired intangible assets, net 74 20 – – – 94Special items:
Risk corridor allowance 80 – – – – 80Merger-related transaction costs – – – – 147 147Charges associated with litigation matters 25 – – – – 25
Adjusted income from operations $ 1,852 $ 294 $ 125 $ 70 $ (237) $ 2,104
2015Premiums $ 22,696 $ 3,000 $ 3,843 $ 103 $ – $ 29,642Fees and other revenues 4,357 46 91 13 (19) 4,488Net investment income 340 103 337 369 4 1,153Mail order pharmacy revenues 2,536 – – – – 2,536
Total operating revenues 29,929 3,149 4,271 485 (15) 37,819Net realized investment gains 43 – 5 9 – 57
Total revenues 29,972 3,149 4,276 494 (15) 37,876
Depreciation and amortization 526 31 26 1 1 585
Total benefits and expenses 27,028 2,849 3,796 374 502 34,549
Income before taxes 2,944 300 480 120 (517) 3,327Income taxes and net loss attributable to noncontrolling interests 1,150 33 152 40 (142) 1,233
Shareholders’ net income by segment 1,794 267 328 80 (375) 2,094
After-tax adjustments to reconcile to adjusted income fromoperations:
Net realized investment (gains) (30) (1) (4) (5) – (40)Amortization of other acquired intangible assets, net (1) 84 (4) – – – 80Special items:
Debt extinguishment costs – – – – 65 65Merger-related transaction costs – – – – 57 57
Adjusted income from operations $ 1,848 $ 262 $ 324 $ 75 $ (253) $ 2,256
(1) Includes a $23 million bargain purchase gain for a 2015 acquisition.
112 CIGNA CORPORATION - 2016 Form 10-K

PART IIITEM 8. Financial Statements and Supplementary Data
Global GroupGlobal Health Supplemental Disability Other
(In millions) Care Benefits and Life Operations Corporate Total
2014Premiums $ 20,709 $ 2,844 $ 3,549 $ 112 $ – $ 27,214Fees and other revenues 4,005 52 86 14 (16) 4,141Net investment income 337 109 335 384 1 1,166Mail order pharmacy revenues 2,239 – – – – 2,239
Total operating revenues 27,290 3,005 3,970 510 (15) 34,760Net realized investment gains 79 3 22 15 35 154
Total revenues 27,369 3,008 3,992 525 20 34,914
Depreciation and amortization 513 50 22 2 1 588
Total benefits and expenses 24,610 2,734 3,513 413 340 31,610
Income before taxes 2,759 274 479 112 (320) 3,304Income taxes and net income attributable to noncontrolling interests 1,059 41 148 33 (79) 1,202
Shareholders’ net income by segment 1,700 233 331 79 (241) 2,102
After-tax adjustments to reconcile to adjusted income fromoperations:
Net realized investment (gains) (54) (3) (14) (11) (24) (106)Amortization of other acquired intangible assets, net 106 13 – – – 119
Adjusted income from operations $ 1,752 $ 243 $ 317 $ 68 $ (265) $ 2,115
Revenue from external customers includes premiums, fees and other revenues and mail order pharmacy revenues. The following table presentsthese revenues by product type for the years ended December 31:
(In millions) 2016 2015 2014
Global Health Care premiums by product:Guaranteed cost $ 4,610 $ 4,761 $ 4,600Experience-rated 2,383 2,329 2,322Stop loss 3,082 2,701 2,318International health care 1,859 1,834 1,827Dental 1,586 1,392 1,257Medicare 6,621 6,142 5,660Medicaid 1,146 1,102 515Medicare Part D 1,122 1,589 1,405Other 886 846 805
Total premiums 23,295 22,696 20,709Fees 4,368 4,107 3,767
Total Global Health Care premiums and fees 27,663 26,803 24,476Disability 2,045 1,899 1,767Life, Accident and Supplemental Health 5,300 5,054 4,739Mail order pharmacy 2,966 2,536 2,239Other 378 374 373
Total $ 38,352 $ 36,666 $ 33,594
Foreign and U.S. revenues from external customers for the three years ended December 31 are shown below. In the periods shown, no foreigncountry contributed more than 5% of consolidated revenues from external customers.
(In millions) 2016 2015 2014
U.S. $ 34,672 $ 33,185 $ 30,070Foreign 3,680 3,481 3,524
Total $ 38,352 $ 36,666 $ 33,594
The Company had net receivables from CMS of $0.6 billion as of December 31, 2016 and $1.5 billion as of December 31, 2015. These amountswere included in premiums, accounts and notes receivable and reinsurance recoverables. As a percentage of consolidated revenues, premiumsand fees from CMS were 20% in 2016 and 21% in 2015 and 2014. These amounts were reported in the Global Health Care segment.
As of September 30, 2016, the Company’s risk corridor receivable was $124 million pre-tax. An unfavorable court decision was issued duringthe fourth quarter rejecting another insurer’s statutory, contractual and constitutional claims for payment of risk corridor receivables (Land ofLincoln Mutual Health Insurance Company v. United States). Based on this decision, as well as the large risk corridor program deficit, underapplicable accounting rules, the Company determined it was required to establish an allowance for all of the $124 million of receivablesassociated with the risk corridor program. In addition, the Company was unable to recognize $25 million pre-tax income for incremental fourthquarter risk corridor receivables. This court case is under appeal and notwithstanding the accounting reflected, management continues tobelieve that the government has a binding obligation to satisfy the risk corridor receivable. We expect full payment of the remainingreinsurance and risk adjustment receivables.
CIGNA CORPORATION - 2016 Form 10-K 113
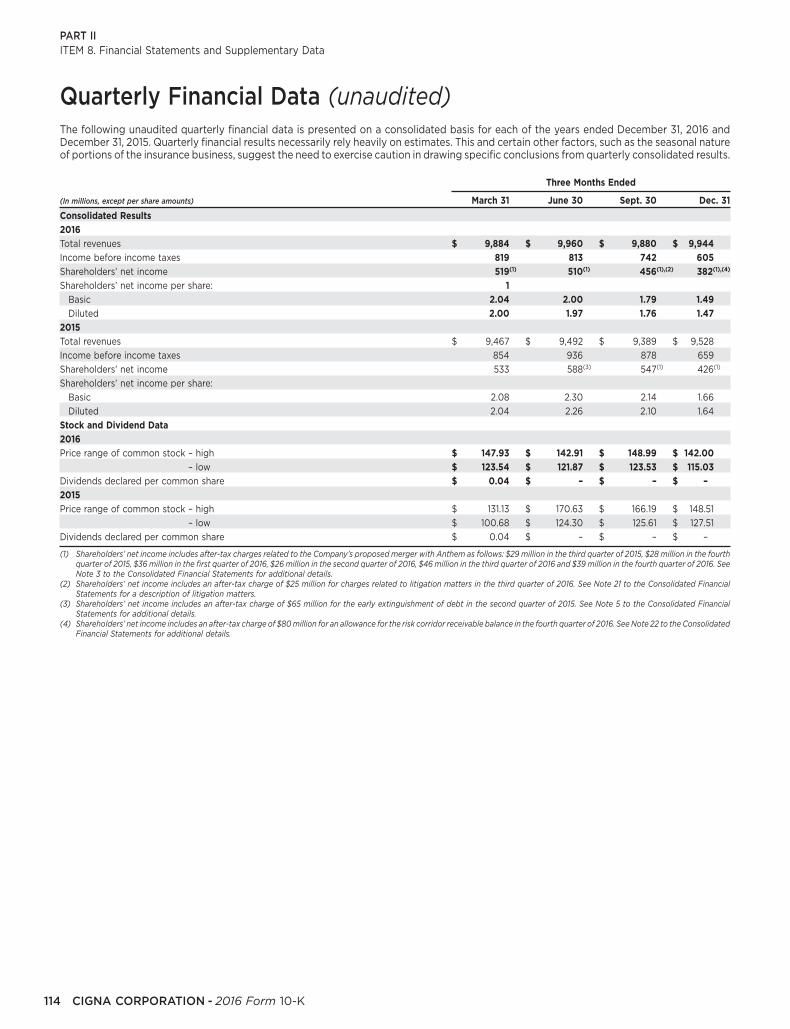
PART IIITEM 8. Financial Statements and Supplementary Data
Quarterly Financial Data (unaudited)The following unaudited quarterly financial data is presented on a consolidated basis for each of the years ended December 31, 2016 andDecember 31, 2015. Quarterly financial results necessarily rely heavily on estimates. This and certain other factors, such as the seasonal natureof portions of the insurance business, suggest the need to exercise caution in drawing specific conclusions from quarterly consolidated results.
Three Months Ended
(In millions, except per share amounts) March 31 June 30 Sept. 30 Dec. 31
Consolidated Results2016Total revenues $ 9,884 $ 9,960 $ 9,880 $ 9,944Income before income taxes 819 813 742 605Shareholders’ net income 519(1) 510(1) 456(1),(2) 382(1),(4)
Shareholders’ net income per share: 1Basic 2.04 2.00 1.79 1.49Diluted 2.00 1.97 1.76 1.47
2015Total revenues $ 9,467 $ 9,492 $ 9,389 $ 9,528
Income before income taxes 854 936 878 659
Shareholders’ net income 533 588(3) 547(1) 426(1)
Shareholders’ net income per share:
Basic 2.08 2.30 2.14 1.66
Diluted 2.04 2.26 2.10 1.64
Stock and Dividend Data2016Price range of common stock – high $ 147.93 $ 142.91 $ 148.99 $ 142.00
– low $ 123.54 $ 121.87 $ 123.53 $ 115.03Dividends declared per common share $ 0.04 $ – $ – $ –2015Price range of common stock – high $ 131.13 $ 170.63 $ 166.19 $ 148.51
– low $ 100.68 $ 124.30 $ 125.61 $ 127.51
Dividends declared per common share $ 0.04 $ – $ – $ –
(1) Shareholders’ net income includes after-tax charges related to the Company’s proposed merger with Anthem as follows: $29 million in the third quarter of 2015, $28 million in the fourthquarter of 2015, $36 million in the first quarter of 2016, $26 million in the second quarter of 2016, $46 million in the third quarter of 2016 and $39 million in the fourth quarter of 2016. SeeNote 3 to the Consolidated Financial Statements for additional details.
(2) Shareholders’ net income includes an after-tax charge of $25 million for charges related to litigation matters in the third quarter of 2016. See Note 21 to the Consolidated FinancialStatements for a description of litigation matters.
(3) Shareholders’ net income includes an after-tax charge of $65 million for the early extinguishment of debt in the second quarter of 2015. See Note 5 to the Consolidated FinancialStatements for additional details.
(4) Shareholders’ net income includes an after-tax charge of $80 million for an allowance for the risk corridor receivable balance in the fourth quarter of 2016. See Note 22 to the ConsolidatedFinancial Statements for additional details.
114 CIGNA CORPORATION - 2016 Form 10-K

PART IIITEM 9. Changes in and Disagreements with Accountants on Accounting and Financial Disclosure
Changes in and Disagreements with Accountants onAccounting and Financial Disclosure
None.
Controls and Procedures
Disclosure Controls and ProceduresBased on an evaluation of the effectiveness of Cigna’s disclosure controls and procedures conducted under the supervision and with theparticipation of Cigna’s management, Cigna’s Chief Executive Officer and Chief Financial Officer concluded that, as of the end of the periodcovered by this report, Cigna’s disclosure controls and procedures are effective to ensure that information required to be disclosed by Cigna inthe reports that it files or submits under the Exchange Act is recorded, processed, summarized and reported, within the time periods specifiedin the SEC’s rules and forms.
Internal Control Over Financial Reporting
Management of Cigna Corporation is responsible for establishing and maintaining adequate internal controls over financial reporting. TheCompany’s internal controls were designed to provide reasonable assurance to the Company’s management and Board of Directors that theCompany’s consolidated published financial statements for external purposes were prepared in accordance with accounting principlesgenerally accepted in the United States. The Company’s internal control over financial reporting includes those policies and procedures that:
pertain to the maintenance of records that, in reasonable detail, accurately and fairly reflect the transactions and dispositions of the assetsand liabilities of the Company;
provide reasonable assurance that transactions are recorded as necessary to permit preparation of financial statements in accordance withaccounting principles generally accepted in the United States, and that receipts and expenditures of the Company are being made only inaccordance with authorization of management and directors of the Company; and
provide reasonable assurance regarding prevention or timely detection of unauthorized acquisitions, use or disposition of the Company’sassets that could have a material effect on the financial statements.
Because of its inherent limitations, internal control over financial reporting may not prevent or detect misstatements.
Management assessed the effectiveness of the Company’s internal controls over financial reporting as of December 31, 2016. In making thisassessment, management used the criteria set forth by the Committee of Sponsoring Organizations of the Treadway Commission (‘‘COSO’’) inInternal Control-Integrated Framework (2013). Based on management’s assessment and the criteria set forth by COSO, it was determined thatthe Company’s internal controls over financial reporting are effective as of December 31, 2016.
The Company’s independent registered public accounting firm, PricewaterhouseCoopers LLP, has audited the effectiveness of the Company’sinternal control over financial reporting, as stated in their report located on page 58 in this Form 10-K.
Other InformationNone.
CIGNA CORPORATION - 2016 Form 10-K 115
ITEM 9.
ITEM 9A.
A.
B.
Management’s Annual Report on Internal Control over Financial Reporting
(i)
(ii)
(iii)
ITEM 9B.
PART IIIITEM 10. Directors and Executive Officers of the Registrant
Directors and Executive Officers of the Registrant
Directors of the RegistrantThe information under the captions ‘‘Corporate Governance Matters – Process for Director Elections,’’ ‘‘ – Board of Directors’ Nominees,’’‘‘ – Directors Who Will Continue in Office’’ and ‘‘ – Board Meetings and Committees’’ (as it relates to Audit Committee disclosure) in Cigna’sdefinitive proxy statement related to the 2017 annual meeting of shareholders is incorporated by reference.
Executive Officers of the RegistrantSee PART I – ‘‘Executive Officers of the Registrant’’ on page 32 in this Form 10-K.
Code of Ethics and Other Corporate Governance DisclosuresThe information under the caption ‘‘Corporate Governance Matters – Codes of Ethics’’ in Cigna’s definitive proxy statement related to the 2017annual meeting of shareholders is incorporated by reference.
The information under the caption ‘‘Ownership of Cigna Common Stock-Section 16(a) Beneficial Ownership Reporting Compliance’’ in Cigna’sdefinitive proxy statement related to the 2017 annual meeting of shareholders is incorporated by reference.
Executive CompensationThe information under the captions ‘‘Corporate Governance Matters – Non-Employee Director Compensation,’’ ‘‘Compensation Matters –Report of the People Resources Committee,’’ ‘‘ – Compensation Discussion and Analysis’’ and ‘‘ – Executive Compensation Tables’’ in Cigna’sdefinitive proxy statement related to the 2017 annual meeting of shareholders is incorporated by reference.
116 CIGNA CORPORATION - 2016 Form 10-K
ITEM 10.
A.
B.
C.
D. Section 16(a) Beneficial Ownership Reporting Compliance
ITEM 11.
PART III

PART IIIITEM 12. Security Ownership of Certain Beneficial Owners and Management and Related Stockholder Matters
Security Ownership of Certain Beneficial Ownersand Management and Related Stockholder Matters
The following table presents information regarding Cigna’s equity compensation plans as of December 31, 2016:
(c) (3)
(b) (2) Securities Remaining(a) (1) Weighted Average Available For Future
Securities To Be Issued Exercise Price Per Issuance Under EquityUpon Exercise Of Share Of Compensation Plans
Outstanding Options, Outstanding Options, (Excluding SecuritiesPlan Category Warrants And Rights Warrants And Rights Reflected In Column (a))
Equity Compensation Plans Approved by Security Holders 9,237,445 $ 82.01 7,050,981Equity Compensation Plans Not Approved by Security Holders – – –
Total 9,237,445 $ 82.01 7,050,981
(1) Includes, in addition to outstanding stock options, 151,361 restricted stock units, 104,682 deferred shares and 1,884,546 strategic performance shares, which are reported at the maximum200% payout rate. Also includes 283,686 shares of common stock underlying stock option awards granted under the HealthSpring, Inc. Amended and Restated 2006 Equity IncentivePlan which was approved by HealthSpring’s shareholders before Cigna’s acquisition of HealthSpring in January 2012.
(2) The weighted-average exercise price is based only on outstanding stock options. The outstanding stock options assumed due to Cigna’s acquisition of HealthSpring, Inc. have a weighted-average exercise price of $17.96. Excluding these assumed options results in a weighted-average exercise price of $84.67.
(3) Includes 257,847 shares of common stock available as of the close of business December 31, 2016 for future issuance under the Cigna Directors Equity Plan and 6,793,134 shares ofcommon stock available as of the close of business on December 31, 2016 for future issuance under the Cigna Long-Term Incentive Plan.
The information under the captions ‘‘Ownership of Cigna Common Stock – Stock Held by Directors, Nominees and Executive Officers’’ and‘‘Ownership of Cigna Common Stock – Stock Held by Certain Beneficial Owners’’ in Cigna’s definitive proxy statement related to the 2017annual meeting of shareholders is incorporated by reference.
Certain Relationships and Related TransactionsThe information under the captions ‘‘Corporate Governance Matters – Director Independence’’ and ‘‘– Certain Transactions’’ in Cigna’sdefinitive proxy statement related to the 2017 annual meeting of shareholders is incorporated by reference.
Principal Accountant Fees and ServicesThe information under the captions ‘‘Audit Matters – Policy for the Pre-Approval of Audit and Non-Audit Services’’ and ‘‘ – Fees to IndependentRegistered Public Accounting Firm’’ in Cigna’s definitive proxy statement related to the 2017 annual meeting of shareholders is incorporated byreference.
CIGNA CORPORATION - 2016 Form 10-K 117
ITEM 12.
ITEM 13.
ITEM 14.

PART IVITEM 15. Exhibits and Financial Statement Schedules
Exhibits and Financial Statement Schedules
(1) The following Financial Statements appear on pages 58 through 113:
Report of Independent Registered Public Accounting Firm.
Consolidated Statements of Income for the years ended December 31, 2016, 2015 and 2014.
Consolidated Statements of Comprehensive Income for the years ended December 31, 2016, 2015 and 2014.
Consolidated Balance Sheets as of December 31, 2016 and 2015.
Consolidated Statements of Changes in Total Equity for the years ended December 31, 2016, 2015 and 2014.
Consolidated Statements of Cash Flows for the years ended December 31, 2016, 2015 and 2014.
Notes to the Consolidated Financial Statements.
(2) The financial statement schedules are listed in the Index to Financial Statement Schedules on page FS-1.
10-K SummaryNone.
118 CIGNA CORPORATION - 2016 Form 10-K
ITEM 15.
(a)
ITEM 16.
PART IV

PART IVITEM 15. Signatures
SignaturesPursuant to the requirements of Section 13 or 15(d) of the Securities Exchange Act of 1934, the registrant has duly caused this report to besigned on its behalf by the undersigned, thereunto duly authorized.
CIGNA CORPORATION
Date: February 23, 2017By: /s/ THOMAS A. MCCARTHY
Thomas A. McCarthyExecutive Vice President and Chief Financial Officer (Principal Financial Officer)
Pursuant to the requirements of the Securities Exchange Act of 1934, this report has been signed below by the following persons on behalf ofthe registrant and in the capacities indicated as of February 23, 2017.
Signature Title
/s/ DAVID M. CORDANI Chief Executive Officer and Director (Principal Executive Officer)
David M. Cordani/s/ THOMAS A. MCCARTHY Executive Vice President and Chief Financial Officer (Principal Financial Officer)
Thomas A. McCarthy/s/ MARY T. HOELTZEL Vice President and Chief Accounting Officer (Principal Accounting Officer)
Mary T. Hoeltzel/s/ ERIC J. FOSS Director
Eric J. Foss/s/ ISAIAH HARRIS, JR. Chairman of the Board
Isaiah Harris, Jr./s/ JANE E. HENNEY, M.D. Director
Jane E. Henney, M.D./s/ ROMAN MARTINEZ IV Director
Roman Martinez IV/s/ JOHN M. PARTRIDGE Director
John M. Partridge/s/ JAMES E. ROGERS Director
James E. Rogers/s/ ERIC C. WISEMAN Director
Eric C. Wiseman/s/ DONNA F. ZARCONE Director
Donna F. Zarcone/s/ WILLIAM D. ZOLLARS Director
William D. Zollars
CIGNA CORPORATION - 2016 Form 10-K 119

(This page has been left blank intentionally.)

PART IVITEM 15. Exhibits and Financial Statement Schedules
Cigna Corporation and Subsidiaries
PAGE
Report of Independent Registered Public Accounting Firm on Financial Statement Schedules .........FS-2
Schedules
I – Summary of Investments – Other Than Investments in Related Parties as of December 31,2016 .......................................................................................................................................................................................FS-3
II – Condensed Financial Information of Cigna Corporation (Registrant) .....................................................FS-4III – Supplementary Insurance Information ...............................................................................................................FS-9IV – Reinsurance ................................................................................................................................................................. FS-11V – Valuation and Qualifying Accounts and Reserves......................................................................................... FS-12
Schedules other than those listed above are omitted because they are not required or are not applicable, or the required information is shownin the financial statements or notes thereto.
CIGNA CORPORATION - 2016 Form 10-K FS-1
INDEX TO FINANCIAL STATEMENTSCHEDULES

PART IVITEM 15. Report of Independent Registered Public Accounting Firm on Financial Statement Schedules
Report of Independent Registered Public Accounting Firm onFinancial Statement Schedules
To the Board of Directors and Shareholders of Cigna CorporationOur audits of the consolidated financial statements and of the effectiveness of internal control over financial reporting referred to in our reportdated February 23, 2017 (which report and consolidated financial statements are included under Item 8 in this Annual Report on Form 10-K)also included an audit of the financial statement schedules listed in Item 15(a)(2) of this Form 10-K. In our opinion, these financial statementschedules present fairly, in all material respects, the information set forth therein when read in conjunction with the related consolidatedfinancial statements.
/s/ PricewaterhouseCoopers LLP
PricewaterhouseCoopers LLPHartford, ConnecticutFebruary 23, 2017
FS-2 CIGNA CORPORATION - 2016 Form 10-K

PART IVITEM 15. Exhibits and Financial Statement Schedules
Cigna Corporation and SubsidiariesSchedule I – Summary of Investments – Other Than Investments in Related PartiesDecember 31, 2016
Amount atwhich shown in
Fair the ConsolidatedType of Investment(in millions) Cost Value Balance Sheet
Fixed maturities:Bonds:
United States government and government agencies and authorities $ 658 $ 877 $ 877States, municipalities and political subdivisions 1,342 1,435 1,435Foreign governments 1,998 2,113 2,113Public utilities 1,919 2,024 2,024All other corporate bonds 13,556 14,018 14,018Mortgage and other asset-backed 461 486 486
Redeemable preferred stocks 8 8 8
TOTAL FIXED MATURITIES 19,942 20,961 20,961
Equity securities:Common stocks:
Industrial, miscellaneous and all other 500 503 503Non-redeemable preferred stocks 83 80 80
TOTAL EQUITY SECURITIES 583 583 583
Commercial mortgage loans on real estate 1,666 1,666Policy loans 1,452 1,452Other long-term investments 1,462 1,462Short-term investments 691 691
TOTAL INVESTMENTS $ 25,796 $ 26,815
CIGNA CORPORATION - 2016 Form 10-K FS-3

PART IVITEM 15. Exhibits and Financial Statement Schedules
Cigna Corporation and SubsidiariesSchedule II – Condensed Financial Information of Cigna Corporation (Registrant)
For the years ended December 31,
(in millions) 2016 2015 2014
Operating expenses:Interest $ 244 $ 246 $ 258Intercompany interest 3 2 5Loss on early extinguishment of debt – 100 –Other 281 147 82
TOTAL OPERATING EXPENSES 528 495 345
Loss before income taxes (528) (495) (345)Income tax benefit(1) (146) (135) (89)
Loss of parent company(1) (382) (360) (256)Equity in income of subsidiaries 2,249 2,454 2,358
SHAREHOLDERS’ NET INCOME(1) 1,867 2,094 2,102
Shareholders’ other comprehensive income (loss):Net unrealized appreciation (depreciation) on securities (56) (202) 143Net unrealized appreciation (depreciation) on derivatives (4) 15 11Net translation of foreign currencies (95) (212) (144)Postretirement benefits liability adjustment 23 85 (426)
Shareholders’ other comprehensive loss (132) (314) (416)
SHAREHOLDERS’ COMPREHENSIVE INCOME(1) $ 1,735 $ 1,780 $ 1,686
(1) As required in adopting Accounting Standards Update (‘‘ASU’’) 2016-09, the Company recorded $29 million of income tax benefits for the year ended December 31, 2016 that previouslywould have been reported in additional paid-in capital. No retrospective adjustments were made to income tax benefits for the years ended 2015 and 2014. See Note 1 for furtherdiscussion.
See Notes to Financial Statements on the following pages.
FS-4 CIGNA CORPORATION - 2016 Form 10-K
Statements of Income
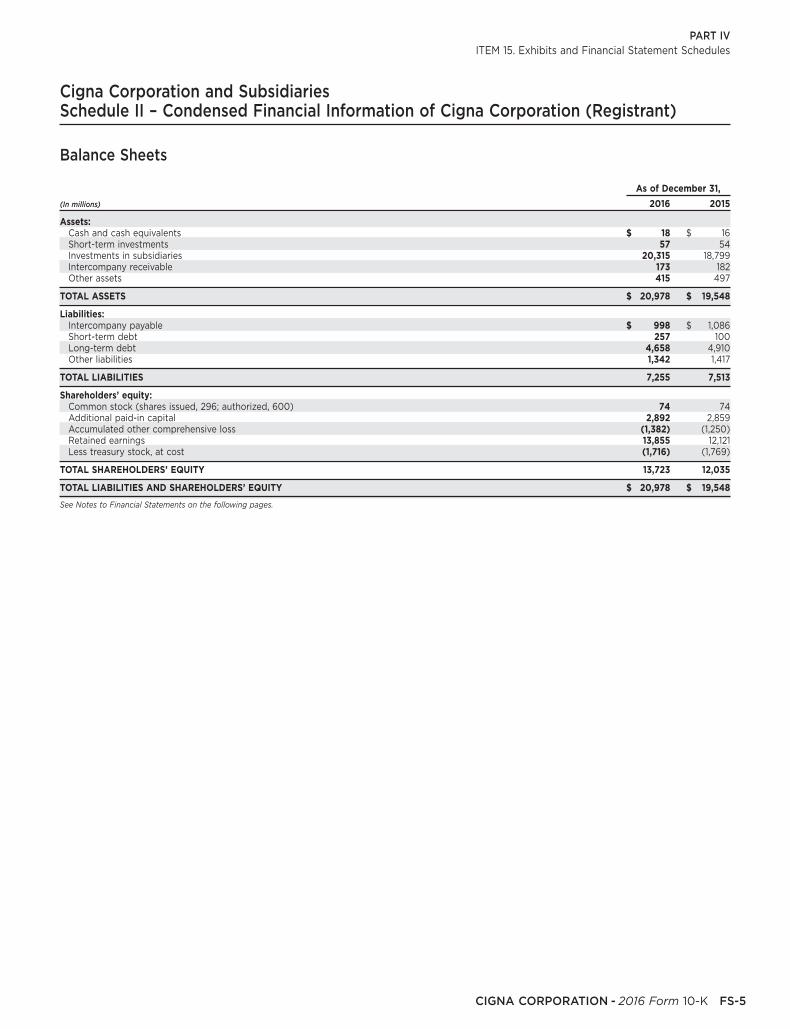
PART IVITEM 15. Exhibits and Financial Statement Schedules
Cigna Corporation and SubsidiariesSchedule II – Condensed Financial Information of Cigna Corporation (Registrant)
As of December 31,
(In millions) 2016 2015
Assets:Cash and cash equivalents $ 18 $ 16Short-term investments 57 54Investments in subsidiaries 20,315 18,799Intercompany receivable 173 182Other assets 415 497
TOTAL ASSETS $ 20,978 $ 19,548
Liabilities:Intercompany payable $ 998 $ 1,086Short-term debt 257 100Long-term debt 4,658 4,910Other liabilities 1,342 1,417
TOTAL LIABILITIES 7,255 7,513
Shareholders’ equity:Common stock (shares issued, 296; authorized, 600) 74 74Additional paid-in capital 2,892 2,859Accumulated other comprehensive loss (1,382) (1,250)Retained earnings 13,855 12,121Less treasury stock, at cost (1,716) (1,769)
TOTAL SHAREHOLDERS’ EQUITY 13,723 12,035
TOTAL LIABILITIES AND SHAREHOLDERS’ EQUITY $ 20,978 $ 19,548
See Notes to Financial Statements on the following pages.
CIGNA CORPORATION - 2016 Form 10-K FS-5
Balance Sheets
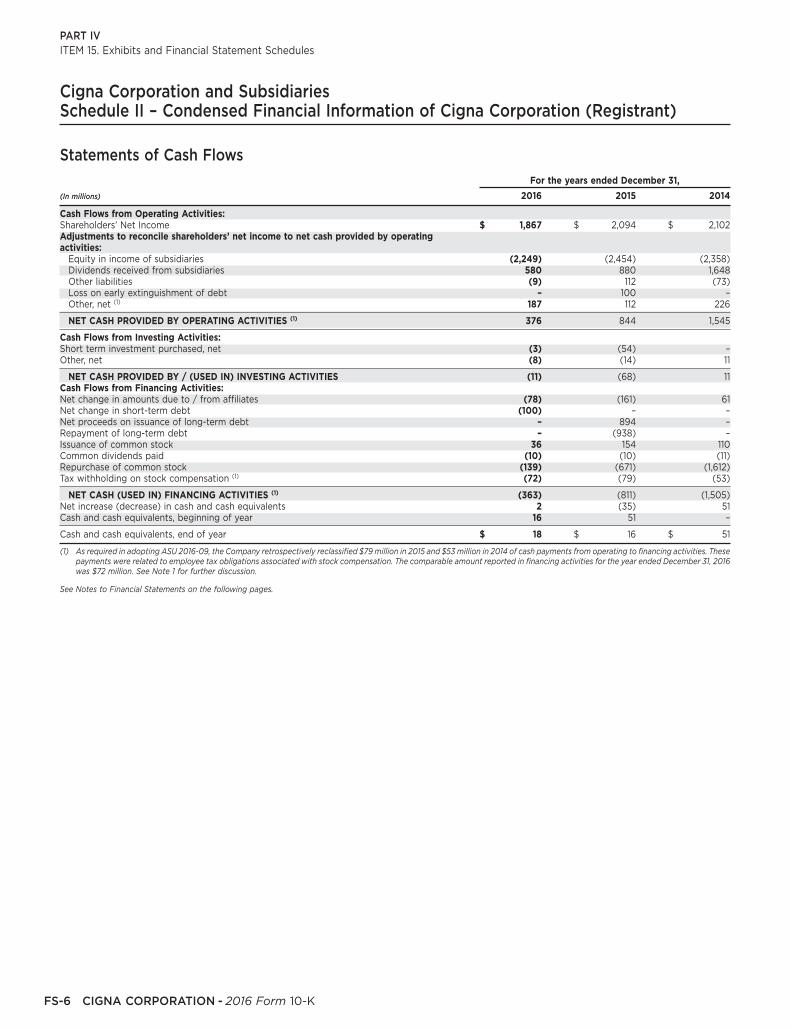
PART IVITEM 15. Exhibits and Financial Statement Schedules
Cigna Corporation and SubsidiariesSchedule II – Condensed Financial Information of Cigna Corporation (Registrant)
For the years ended December 31,
(In millions) 2016 2015 2014
Cash Flows from Operating Activities:Shareholders’ Net Income $ 1,867 $ 2,094 $ 2,102Adjustments to reconcile shareholders’ net income to net cash provided by operatingactivities:
Equity in income of subsidiaries (2,249) (2,454) (2,358)Dividends received from subsidiaries 580 880 1,648Other liabilities (9) 112 (73)Loss on early extinguishment of debt – 100 –Other, net (1) 187 112 226
NET CASH PROVIDED BY OPERATING ACTIVITIES (1) 376 844 1,545
Cash Flows from Investing Activities:Short term investment purchased, net (3) (54) –Other, net (8) (14) 11
NET CASH PROVIDED BY / (USED IN) INVESTING ACTIVITIES (11) (68) 11Cash Flows from Financing Activities:Net change in amounts due to / from affiliates (78) (161) 61Net change in short-term debt (100) – –Net proceeds on issuance of long-term debt – 894 –Repayment of long-term debt – (938) –Issuance of common stock 36 154 110Common dividends paid (10) (10) (11)Repurchase of common stock (139) (671) (1,612)Tax withholding on stock compensation (1) (72) (79) (53)
NET CASH (USED IN) FINANCING ACTIVITIES (1) (363) (811) (1,505)Net increase (decrease) in cash and cash equivalents 2 (35) 51Cash and cash equivalents, beginning of year 16 51 –
Cash and cash equivalents, end of year $ 18 $ 16 $ 51
(1) As required in adopting ASU 2016-09, the Company retrospectively reclassified $79 million in 2015 and $53 million in 2014 of cash payments from operating to financing activities. Thesepayments were related to employee tax obligations associated with stock compensation. The comparable amount reported in financing activities for the year ended December 31, 2016was $72 million. See Note 1 for further discussion.
See Notes to Financial Statements on the following pages.
FS-6 CIGNA CORPORATION - 2016 Form 10-K
Statements of Cash Flows

PART IVITEM 15. Exhibits and Financial Statement Schedules
Cigna Corporation and SubsidiariesSCHEDULE II – Condensed Financial Information of Cigna Corporation (Registrant)
The accompanying condensed financial statements should be read in conjunction with the Consolidated Financial Statements and theaccompanying notes thereto contained in this Annual Report on Form 10-K (‘‘Form 10-K’’).
Note 1 – For purposes of these condensed financial statements, Cigna Corporation’s (the ‘‘Company’’) wholly-owned and majority-ownedsubsidiaries are recorded using the equity basis of accounting.
In the first quarter of 2016, the Company implemented the Financial Accounting Standards Board’s new guidance that changed the accountingfor certain aspects of share-based payments to employees (Accounting Standards Update (‘‘ASU’’) 2016-09. The standard had the followingimpacts for the year ended December 31, 2016:
$29 million of tax benefits was recorded in net income that previously would have been reported in additional paid-in capital.
$79 million and $53 million of tax withholding for the year ended December 31, 2015 and December 31, 2014 were retrospectively reclassifiedfrom operating to financing activities in the Cigna Corporation Statements of Cash Flows. The comparable tax withholding amount reportedin financing activities for the year ended December 31, 2016 was $72 million.
Note 2 – Short-term and long-term debt consisted of the following at December 31:
(In millions) December 31, 2016 December 31, 2015
Short-term:
Commercial Paper $ – $ 100
Current maturities of long-term debt 250 –
Other, including capital leases 7 –
Total short-term debt $ 257 $ 100
Long-term:
Uncollateralized debt:
$250 million, 5.375% Notes due 2017 – 249
$131 million, 6.35% Notes due 2018 131 131
$250 million, 4.375% Notes due 2020(1) 252 254
$300 million, 5.125% Notes due 2020(1) 301 303
$300 million, 4.5% Notes due 2021(1) 302 304
$750 million, 4% Notes due 2022 744 743
$100 million, 7.65% Notes due 2023 100 100
$17 million, 8.3% Notes due 2023 17 17
$900 million, 3.25% Notes due 2025 893 892
$300 million, 7.875% Debentures due 2027 299 299
$83 million, 8.3% Step Down Notes due 2033 82 82
$500 million, 6.15% Notes due 2036 498 498
$300 million, 5.875% Notes due 2041 296 295
$750 million, 5.375% Notes due 2042 743 743
Total long-term debt $ 4,658 $ 4,910
(1) The Company has entered into interest rate swap contracts hedging a portion of these fixed-rate debt instruments.
The following debt transactions occurred in April 2015:
The Company redeemed its 2.75% Notes due 2016, including accrued interest from November 15, 2014 through the settlement date of April 13,2015. The redemption price equaled the present value of the remaining principal and interest payments on the Notes being redeemed,discounted at a rate equal to the 10-year Treasury Rate plus a fixed spread of 30 basis points. The Company paid $626 million includingaccrued interest and expenses, resulting in a pre-tax loss on early debt extinguishment of $21 million ($14 million after-tax) that wasrecognized in the second quarter of 2015.
CIGNA CORPORATION - 2016 Form 10-K FS-7
Notes to Condensed Financial Statements
•
•
•

PART IVITEM 15. Exhibits and Financial Statement Schedules
The Company redeemed its 8.50% Notes due 2019, including accrued interest from November 1, 2014 through the settlement date of April 13,2015. The redemption price equaled the present value of the remaining principal and interest payments on the Notes being redeemed,discounted at a rate equal to the 10-year Treasury Rate plus a fixed spread of 50 basis points. The Company paid $329 million includingaccrued interest and expenses, resulting in a pre-tax loss on early debt extinguishment of $79 million ($51 million after-tax) that wasrecognized in the second quarter of 2015.
The Company has a five-year revolving credit and letter of credit agreement for $1.5 billion that permits up to $500 million to be used for lettersof credit. This agreement extends through December 2019 and is diversified among 16 banks with three banks each having 12% of thecommitment and the remainder spread among 13 banks. The credit agreement includes options to increase the commitment amount to$2 billion and to extend the term past December 2019, subject to consent by the administrative agent and the committing banks. The creditagreement is available for general corporate purposes including for the issuance of letters of credit. The credit agreement contains customarycovenants and restrictions, including a financial covenant that the Company may not permit its leverage ratio – that is total consolidated debtto total consolidated capitalization (each as defined in the credit agreement) – to exceed 0.50. The leverage ratio excludes the following itemsthat are included in accumulated other comprehensive loss on the Company’s Consolidated Balance Sheets: net unrealized appreciation infixed maturities and the portion of the post-retirement benefits liability adjustment attributable to pension. The Company was in compliancewith its debt covenants as of December 31, 2016.
The Company had $9.7 billion of borrowing capacity within the maximum debt coverage covenant in the letter of credit agreement, in additionto the $5 billion of debt outstanding as of December 31, 2016. This additional borrowing capacity includes the $1.5 billion available under thecredit agreement. Letters of credit outstanding as of December 31, 2016 totaled $14 million.
On March 11, 2015, the Company issued $900 million of 10-Year Notes due April 15, 2025 at a stated interest rate of 3.25% ($892 million, net ofdiscount and issuance costs, with an effective annual interest rate of 3.36%). Interest is payable on April 15 and October 15 of each yearbeginning October 15, 2015. The proceeds of this debt were used to repay debt maturing in 2016 and in 2019 as described below.
The Company may redeem these Notes, at any time, in whole or in part, at a redemption price equal to the greater of:
100% of the principal amount of the Notes to be redeemed; or
the present value of the remaining principal and interest payments on the Notes being redeemed discounted at the applicable Treasury rateplus 17.5 basis points.
Maturities of long-term debt are as follows (in millions): $250 in 2017, $131 in 2018, none in 2019, $549 in 2020, $299 in 2021 and $3,694 in yearsafter 2021. Interest expense on long-term and short-term debt was $244 in 2016, $246 million in 2015 and $252 million in 2014. The 2015expense excludes losses on the early extinguishment of debt.
Note 3 – Intercompany liabilities consist primarily of payables to Cigna Holdings, Inc. of $658 million as of December 31, 2016 and $875 millionas of December 31, 2015. Interest was accrued at an average monthly rate of 0.93% for 2016 and 0.60% for 2015.
Note 4 – As of December 31, 2016, the Company had guarantees and similar agreements in place to secure payment obligations or solvencyrequirements of certain wholly-owned subsidiaries as follows:
Various indirect, wholly-owned subsidiaries have obtained surety bonds in the normal course of business. If there is a claim on a surety bondand the subsidiary is unable to pay, the Company guarantees payment to the company issuing the surety bond. The aggregate amount ofsuch surety bonds as of December 31, 2016 was $98 million.
The Company is obligated under a $6 million letter of credit required by the insurer of its high-deductible self-insurance programs toindemnify the insurer for claim liabilities that fall within deductible amounts for policy years dating back to 1994.
The Company also provides solvency guarantees aggregating $34 million under state and federal regulations in support of its indirect wholly-owned medical HMOs in several states.
The Company has arranged an $8 million letter of credit in support of Cigna Europe Insurance Company, an indirect wholly-owned subsidiary.The Company has agreed to indemnify the banks providing the letters of credit in the event of any draw. Cigna Europe Insurance Company isthe holder of the letters of credit.
The Company has agreed to indemnify payment of losses included in Cigna Europe Insurance Company’s reserves on the assumedreinsurance business transferred from ACE. As of December 31, 2016, the reserve was $14 million.
The Company guarantees the payment of up to $10 million for certain expenses of an indirect wholly-owned subsidiary operating as aProfessional Employer Organization in the state of Kansas.
The Company operates a global notional currency pool in support of certain foreign subsidiaries and provides a guarantee of borrowing bysubsidiaries from the notional pool. The aggregate amount of such borrowing at December 31, 2016 was $31 million.
The Company guarantees that it would compensate the lessors for a shortfall of up to $42 million in the market value of certain leasedequipment at the end of the lease. Guarantees of $10 million expire in 2017, $25 million expire in 2022 and $7 million expire in 2026. TheCompany recorded liabilities for these guarantees of $5 million as of December 31, 2016.
In 2016, no payments have been made on these guarantees. The Company provided other guarantees to subsidiaries that, in the aggregate, donot represent a material risk to the Company’s results of operations, liquidity or financial condition.
FS-8 CIGNA CORPORATION - 2016 Form 10-K
•
•
•
•
•
•
•
•
•
•
•

(This page has been left blank intentionally.)

PART IVITEM 15. Exhibits and Financial Statement Schedules
Cigna Corporation and Subsidiaries
Schedule III – Supplementary Insurance Information
Deferred Future policy Medical claimspolicy benefits and payable and
(in millions) acquisition contractholder unpaid UnearnedSegment costs deposit funds claims (1) premiums
Year Ended December 31, 2016:Global Health Care $ 16 $ 161 $ 2,532 $ 170Global Supplemental Benefits 1,752 3,225 384 435Group Disability and Life 1 1,786 4,342 13Other Operations 49 12,934 191 16Corporate – – – –
Total $ 1,818 $ 18,106 $ 7,449 $ 634
Year Ended December 31, 2015:Global Health Care $ 11 $ 169 $ 2,355 $ 145Global Supplemental Benefits 1,593 3,006 353 453Group Disability and Life 1 1,714 4,006 13Other Operations 54 13,033 215 18Corporate – – – –
Total $ 1,659 $ 17,922 $ 6,929 $ 629
Year Ended December 31, 2014:Global Health Care $ 17 $ 182 $ 2,180 $ 155Global Supplemental Benefits 1,437 2,785 339 431Group Disability and Life 1 1,662 3,839 15Other Operations 47 13,443 222 20Corporate – – – –
Total $ 1,502 $ 18,072 $ 6,580 $ 621
(1) Unpaid claims balances reported in Corporate in 2014 and 2015 have been retrospectively reclassified to the Group Disability and Life segment to conform tothe presentation of unpaid claim balances in Note 8 to the Consolidated Financial Statements. These amounts represent elimination entries.
FS-9 CIGNA CORPORATION - 2016 Form 10-K

PART IVITEM 15. Exhibits and Financial Statement Schedules
Amortizationof deferred
Net policy Otherinvestment Benefit acquisition operating
Segment Premiums (1) income (2) expenses (1)(3) expenses expenses (4)
Year Ended December 31, 2016:Global Health Care $ 23,295 $ 315 $ 19,009 $ 47 $ 9,411Global Supplemental Benefits 3,226 110 1,784 238 1,030Group Disability and Life 4,002 343 3,354 1 918Other Operations 103 358 339 6 24Corporate – 21 – – 528
Total $ 30,626 $ 1,147 $ 24,486 $ 292 $ 11,911
Year Ended December 31, 2015:Global Health Care $ 22,696 $ 340 $ 18,354 $ 53 $ 8,621Global Supplemental Benefits 3,000 103 1,659 227 963Group Disability and Life 3,843 337 2,934 1 861Other Operations 103 369 343 5 26Corporate – 4 – – 502
Total $ 29,642 $ 1,153 $ 23,290 $ 286 $ 10,973
Year Ended December 31, 2014:Global Health Care $ 20,709 $ 337 $ 16,694 $ 73 $ 7,843Global Supplemental Benefits 2,844 109 1,544 209 981Group Disability and Life 3,549 335 2,716 1 796Other Operations 112 384 380 6 27Corporate – 1 – – 340
Total $ 27,214 $ 1,166 $ 21,334 $ 289 $ 9,987
(1) Amounts presented are shown net of the effects of reinsurance. See Note 9 to the Consolidated Financial Statements included in this Form 10-K.
(2) The allocation of net investment income is based upon the investment year method, the identification of certain portfolios with specific segments, or acombination of both.
(3) Benefit expenses include Global Health Care medical costs and other benefit expenses.
(4) Other operating expenses includes mail order pharmacy costs, other operating expenses, and net amortization of other intangible assets. It excludesamortization of deferred policy acquisition expenses.
CIGNA CORPORATION - 2016 Form 10-K FS-10

PART IVITEM 15. Exhibits and Financial Statement Schedules
Cigna Corporation and SubsidiariesSchedule IV – Reinsurance
PercentageCeded to other Assumed from of amount
(In millions) Gross amount companies other companies Net amount assumed to net
Year Ended December 31, 2016:Life insurance in force 1,047,002 55,399 2,827 994,430 0.3%
Premiums:Life insurance and annuities $ 2,881 $ 310 $ 22 $ 2,593 0.8%Accident and health insurance 27,874 203 362 28,033 1.3%
Total $ 30,755 $ 513 $ 384 $ 30,626 1.3%
Year Ended December 31, 2015:Life insurance in force 1,047,982 72,208 3,273 979,047 0.3%
Premiums:Life insurance and annuities $ 2,886 $ 335 $ 106 $ 2,657 4.0%Accident and health insurance 26,926 235 294 26,985 1.1%
Total $ 29,812 $ 570 $ 400 $ 29,642 1.3%
Year Ended December 31, 2014:Life insurance in force 879,508 58,133 3,180 824,555 0.4%
Premiums:Life insurance and annuities $ 2,302 $ 320 $ 32 $ 2,014 1.6%Accident and health insurance 24,913 283 570 25,200 2.3%
Total $ 27,215 $ 603 $ 602 $ 27,214 2.2%
FS-11 CIGNA CORPORATION - 2016 Form 10-K

PART IVITEM 15. Exhibits and Financial Statement Schedules
Cigna Corporation and SubsidiariesSchedule V – Valuation and Qualifying Accounts and Reserves
Charged ChargedBalance at (Credited) (Credited)
(In millions) beginning of to costs and to other Other Balance atDescription year expenses (1) accounts deductions (2) end of year
2016:Investment asset valuation reserves:
Commercial mortgage loans $ 15 $ – $ – $ (10) $ 5Allowance for doubtful accounts:
Premiums, accounts and notes receivable $ 75 $ 134 $ (8) $ (1) $ 200Deferred tax asset valuation allowance $ 71 $ 21 $ (5) $ – $ 87Reinsurance recoverables $ 3 $ – $ – $ – $ 32015:Investment asset valuation reserves:
Commercial mortgage loans $ 12 $ 7 $ – $ (4) $ 15Allowance for doubtful accounts:
Premiums, accounts and notes receivable $ 101 $ (10) $ (15) $ (1) $ 75Deferred tax asset valuation allowance $ 49 $ 8 $ 14 $ – $ 71Reinsurance recoverables $ 4 $ – $ (1) $ – $ 32014:Investment asset valuation reserves:
Commercial mortgage loans $ 8 $ 4 $ – $ – $ 12Allowance for doubtful accounts:
Premiums, accounts and notes receivable $ 43 $ 53 $ 5 $ – $ 101Deferred tax asset valuation allowance $ 49 $ 21 $ (21) $ – $ 49Reinsurance recoverables $ 4 $ – $ – $ – $ 4
(1) Amounts for 2016 include risk corridor allowance. See Note 22 to the Consolidated Financial Statements for additional information.
(2) Amounts for commercial mortgage loans primarily reflect charge-offs upon sales and repayments, as well as transfers to foreclosed real estate.
CIGNA CORPORATION - 2016 Form 10-K FS-12

(This page has been left blank intentionally.)
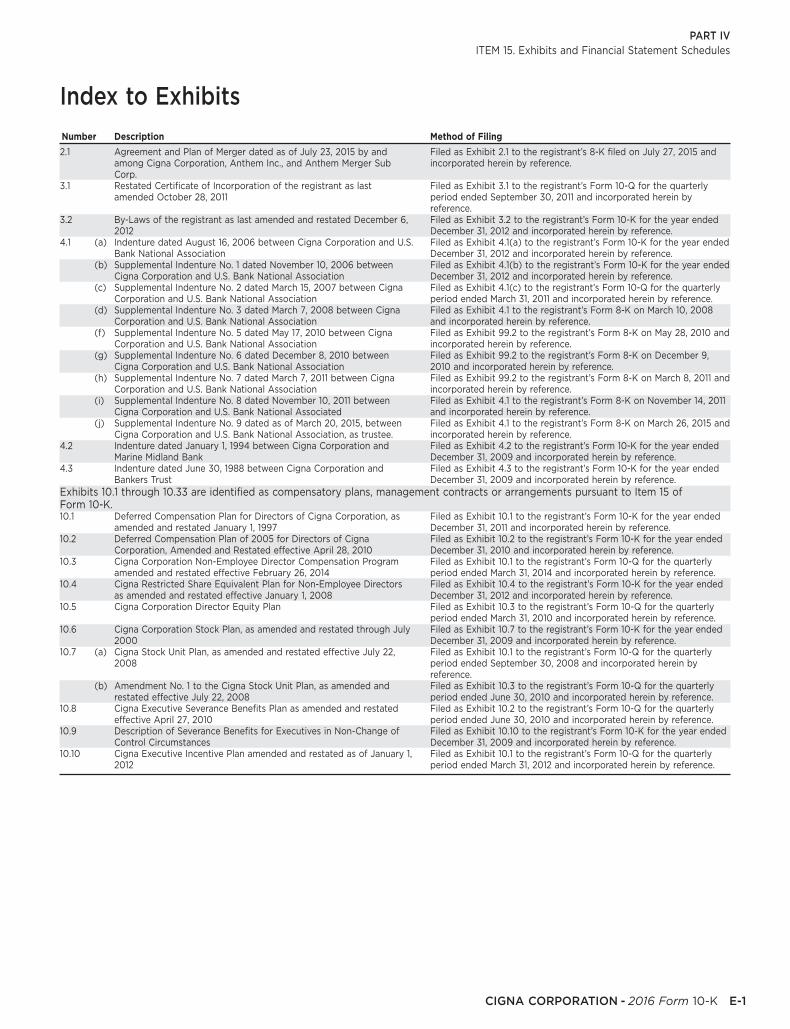
PART IVITEM 15. Exhibits and Financial Statement Schedules
Index to Exhibits
Number Description Method of Filing
2.1 Agreement and Plan of Merger dated as of July 23, 2015 by and Filed as Exhibit 2.1 to the registrant’s 8-K filed on July 27, 2015 andamong Cigna Corporation, Anthem Inc., and Anthem Merger Sub incorporated herein by reference.Corp.
3.1 Restated Certificate of Incorporation of the registrant as last Filed as Exhibit 3.1 to the registrant’s Form 10-Q for the quarterlyamended October 28, 2011 period ended September 30, 2011 and incorporated herein by
reference.3.2 By-Laws of the registrant as last amended and restated December 6, Filed as Exhibit 3.2 to the registrant’s Form 10-K for the year ended
2012 December 31, 2012 and incorporated herein by reference.4.1 (a) Indenture dated August 16, 2006 between Cigna Corporation and U.S. Filed as Exhibit 4.1(a) to the registrant’s Form 10-K for the year ended
Bank National Association December 31, 2012 and incorporated herein by reference.(b) Supplemental Indenture No. 1 dated November 10, 2006 between Filed as Exhibit 4.1(b) to the registrant’s Form 10-K for the year ended
Cigna Corporation and U.S. Bank National Association December 31, 2012 and incorporated herein by reference.(c) Supplemental Indenture No. 2 dated March 15, 2007 between Cigna Filed as Exhibit 4.1(c) to the registrant’s Form 10-Q for the quarterly
Corporation and U.S. Bank National Association period ended March 31, 2011 and incorporated herein by reference.(d) Supplemental Indenture No. 3 dated March 7, 2008 between Cigna Filed as Exhibit 4.1 to the registrant’s Form 8-K on March 10, 2008
Corporation and U.S. Bank National Association and incorporated herein by reference.(f) Supplemental Indenture No. 5 dated May 17, 2010 between Cigna Filed as Exhibit 99.2 to the registrant’s Form 8-K on May 28, 2010 and
Corporation and U.S. Bank National Association incorporated herein by reference.(g) Supplemental Indenture No. 6 dated December 8, 2010 between Filed as Exhibit 99.2 to the registrant’s Form 8-K on December 9,
Cigna Corporation and U.S. Bank National Association 2010 and incorporated herein by reference.(h) Supplemental Indenture No. 7 dated March 7, 2011 between Cigna Filed as Exhibit 99.2 to the registrant’s Form 8-K on March 8, 2011 and
Corporation and U.S. Bank National Association incorporated herein by reference.(i) Supplemental Indenture No. 8 dated November 10, 2011 between Filed as Exhibit 4.1 to the registrant’s Form 8-K on November 14, 2011
Cigna Corporation and U.S. Bank National Associated and incorporated herein by reference.(j) Supplemental Indenture No. 9 dated as of March 20, 2015, between Filed as Exhibit 4.1 to the registrant’s Form 8-K on March 26, 2015 and
Cigna Corporation and U.S. Bank National Association, as trustee. incorporated herein by reference.4.2 Indenture dated January 1, 1994 between Cigna Corporation and Filed as Exhibit 4.2 to the registrant’s Form 10-K for the year ended
Marine Midland Bank December 31, 2009 and incorporated herein by reference.4.3 Indenture dated June 30, 1988 between Cigna Corporation and Filed as Exhibit 4.3 to the registrant’s Form 10-K for the year ended
Bankers Trust December 31, 2009 and incorporated herein by reference.Exhibits 10.1 through 10.33 are identified as compensatory plans, management contracts or arrangements pursuant to Item 15 ofForm 10-K.10.1 Deferred Compensation Plan for Directors of Cigna Corporation, as Filed as Exhibit 10.1 to the registrant’s Form 10-K for the year ended
amended and restated January 1, 1997 December 31, 2011 and incorporated herein by reference.10.2 Deferred Compensation Plan of 2005 for Directors of Cigna Filed as Exhibit 10.2 to the registrant’s Form 10-K for the year ended
Corporation, Amended and Restated effective April 28, 2010 December 31, 2010 and incorporated herein by reference.10.3 Cigna Corporation Non-Employee Director Compensation Program Filed as Exhibit 10.1 to the registrant’s Form 10-Q for the quarterly
amended and restated effective February 26, 2014 period ended March 31, 2014 and incorporated herein by reference.10.4 Cigna Restricted Share Equivalent Plan for Non-Employee Directors Filed as Exhibit 10.4 to the registrant’s Form 10-K for the year ended
as amended and restated effective January 1, 2008 December 31, 2012 and incorporated herein by reference.10.5 Cigna Corporation Director Equity Plan Filed as Exhibit 10.3 to the registrant’s Form 10-Q for the quarterly
period ended March 31, 2010 and incorporated herein by reference.10.6 Cigna Corporation Stock Plan, as amended and restated through July Filed as Exhibit 10.7 to the registrant’s Form 10-K for the year ended
2000 December 31, 2009 and incorporated herein by reference.10.7 (a) Cigna Stock Unit Plan, as amended and restated effective July 22, Filed as Exhibit 10.1 to the registrant’s Form 10-Q for the quarterly
2008 period ended September 30, 2008 and incorporated herein byreference.
(b) Amendment No. 1 to the Cigna Stock Unit Plan, as amended and Filed as Exhibit 10.3 to the registrant’s Form 10-Q for the quarterlyrestated effective July 22, 2008 period ended June 30, 2010 and incorporated herein by reference.
10.8 Cigna Executive Severance Benefits Plan as amended and restated Filed as Exhibit 10.2 to the registrant’s Form 10-Q for the quarterlyeffective April 27, 2010 period ended June 30, 2010 and incorporated herein by reference.
10.9 Description of Severance Benefits for Executives in Non-Change of Filed as Exhibit 10.10 to the registrant’s Form 10-K for the year endedControl Circumstances December 31, 2009 and incorporated herein by reference.
10.10 Cigna Executive Incentive Plan amended and restated as of January 1, Filed as Exhibit 10.1 to the registrant’s Form 10-Q for the quarterly2012 period ended March 31, 2012 and incorporated herein by reference.
CIGNA CORPORATION - 2016 Form 10-K E-1
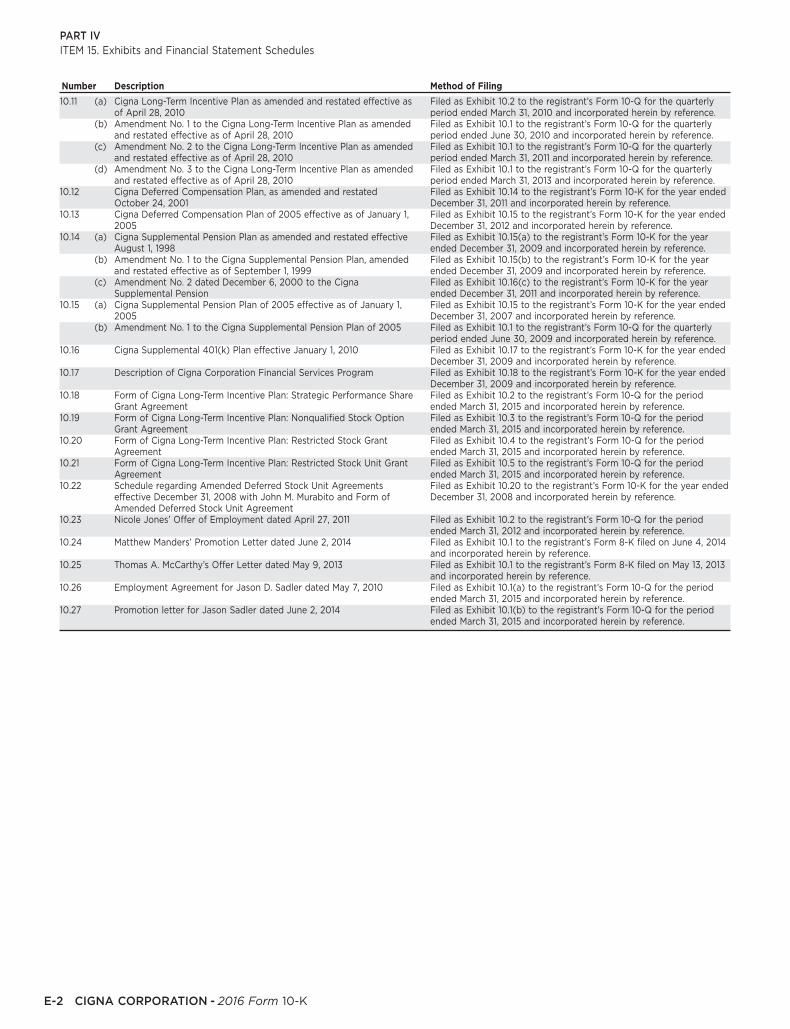
PART IVITEM 15. Exhibits and Financial Statement Schedules
Number Description Method of Filing
10.11 (a) Cigna Long-Term Incentive Plan as amended and restated effective as Filed as Exhibit 10.2 to the registrant’s Form 10-Q for the quarterlyof April 28, 2010 period ended March 31, 2010 and incorporated herein by reference.
(b) Amendment No. 1 to the Cigna Long-Term Incentive Plan as amended Filed as Exhibit 10.1 to the registrant’s Form 10-Q for the quarterlyand restated effective as of April 28, 2010 period ended June 30, 2010 and incorporated herein by reference.
(c) Amendment No. 2 to the Cigna Long-Term Incentive Plan as amended Filed as Exhibit 10.1 to the registrant’s Form 10-Q for the quarterlyand restated effective as of April 28, 2010 period ended March 31, 2011 and incorporated herein by reference.
(d) Amendment No. 3 to the Cigna Long-Term Incentive Plan as amended Filed as Exhibit 10.1 to the registrant’s Form 10-Q for the quarterlyand restated effective as of April 28, 2010 period ended March 31, 2013 and incorporated herein by reference.
10.12 Cigna Deferred Compensation Plan, as amended and restated Filed as Exhibit 10.14 to the registrant’s Form 10-K for the year endedOctober 24, 2001 December 31, 2011 and incorporated herein by reference.
10.13 Cigna Deferred Compensation Plan of 2005 effective as of January 1, Filed as Exhibit 10.15 to the registrant’s Form 10-K for the year ended2005 December 31, 2012 and incorporated herein by reference.
10.14 (a) Cigna Supplemental Pension Plan as amended and restated effective Filed as Exhibit 10.15(a) to the registrant’s Form 10-K for the yearAugust 1, 1998 ended December 31, 2009 and incorporated herein by reference.
(b) Amendment No. 1 to the Cigna Supplemental Pension Plan, amended Filed as Exhibit 10.15(b) to the registrant’s Form 10-K for the yearand restated effective as of September 1, 1999 ended December 31, 2009 and incorporated herein by reference.
(c) Amendment No. 2 dated December 6, 2000 to the Cigna Filed as Exhibit 10.16(c) to the registrant’s Form 10-K for the yearSupplemental Pension ended December 31, 2011 and incorporated herein by reference.
10.15 (a) Cigna Supplemental Pension Plan of 2005 effective as of January 1, Filed as Exhibit 10.15 to the registrant’s Form 10-K for the year ended2005 December 31, 2007 and incorporated herein by reference.
(b) Amendment No. 1 to the Cigna Supplemental Pension Plan of 2005 Filed as Exhibit 10.1 to the registrant’s Form 10-Q for the quarterlyperiod ended June 30, 2009 and incorporated herein by reference.
10.16 Cigna Supplemental 401(k) Plan effective January 1, 2010 Filed as Exhibit 10.17 to the registrant’s Form 10-K for the year endedDecember 31, 2009 and incorporated herein by reference.
10.17 Description of Cigna Corporation Financial Services Program Filed as Exhibit 10.18 to the registrant’s Form 10-K for the year endedDecember 31, 2009 and incorporated herein by reference.
10.18 Form of Cigna Long-Term Incentive Plan: Strategic Performance Share Filed as Exhibit 10.2 to the registrant’s Form 10-Q for the periodGrant Agreement ended March 31, 2015 and incorporated herein by reference.
10.19 Form of Cigna Long-Term Incentive Plan: Nonqualified Stock Option Filed as Exhibit 10.3 to the registrant’s Form 10-Q for the periodGrant Agreement ended March 31, 2015 and incorporated herein by reference.
10.20 Form of Cigna Long-Term Incentive Plan: Restricted Stock Grant Filed as Exhibit 10.4 to the registrant’s Form 10-Q for the periodAgreement ended March 31, 2015 and incorporated herein by reference.
10.21 Form of Cigna Long-Term Incentive Plan: Restricted Stock Unit Grant Filed as Exhibit 10.5 to the registrant’s Form 10-Q for the periodAgreement ended March 31, 2015 and incorporated herein by reference.
10.22 Schedule regarding Amended Deferred Stock Unit Agreements Filed as Exhibit 10.20 to the registrant’s Form 10-K for the year endedeffective December 31, 2008 with John M. Murabito and Form of December 31, 2008 and incorporated herein by reference.Amended Deferred Stock Unit Agreement
10.23 Nicole Jones’ Offer of Employment dated April 27, 2011 Filed as Exhibit 10.2 to the registrant’s Form 10-Q for the periodended March 31, 2012 and incorporated herein by reference.
10.24 Matthew Manders’ Promotion Letter dated June 2, 2014 Filed as Exhibit 10.1 to the registrant’s Form 8-K filed on June 4, 2014and incorporated herein by reference.
10.25 Thomas A. McCarthy’s Offer Letter dated May 9, 2013 Filed as Exhibit 10.1 to the registrant’s Form 8-K filed on May 13, 2013and incorporated herein by reference.
10.26 Employment Agreement for Jason D. Sadler dated May 7, 2010 Filed as Exhibit 10.1(a) to the registrant’s Form 10-Q for the periodended March 31, 2015 and incorporated herein by reference.
10.27 Promotion letter for Jason Sadler dated June 2, 2014 Filed as Exhibit 10.1(b) to the registrant’s Form 10-Q for the periodended March 31, 2015 and incorporated herein by reference.
E-2 CIGNA CORPORATION - 2016 Form 10-K

PART IVITEM 15. Exhibits and Financial Statement Schedules
Number Description Method of Filing10.28 (a) Retention Agreement with Herbert Fritch dated October 24, 2011 Filed as Exhibit 10.1 to the registrant’s Form 10-Q for the period
ended March 31, 2013 and incorporated herein by reference.(b) Agreement dated December 7, 2011 with Herbert Fritch Filed as Exhibit 10.2 to the registrant’s Form 10-Q for the period
ended March 31, 2013 and incorporated herein by reference.(c) Retention Agreement with Herbert Fritch dated September 15, 2014. Filed as Exhibit 10.1 to the registrant’s Form 8-K filed on
September 19, 2014 and incorporated herein by reference.10.29 Agreement and Release between Cigna Corporation and Herbert A. Filed as Exhibit 10.1 to the registrant’s Form 8-K filed on October 21,
Fritch dated October 20, 2016 2016 and incorporated herein by reference10.30 Advisory Services Agreement between Cigna Corporation and Filed as Exhibit 10.2 to the registrant’s Form 8-K filed on October 21,
Herbert A. Fritch dated October 20, 2016 2016 and incorporated herein by reference10.31 HealthSpring, Inc. Amended and Restated 2006 Equity Incentive Plan Filed as Exhibit 10.3 to the registrant’s Form 10-Q for the period
(the ‘‘HealthSpring Equity Incentive Plan’’) ended March 31, 2013 and incorporated herein by reference.10.32 HealthSpring Equity Incentive Plan: Form of Restricted Share Award Filed as Exhibit 10.4 to the registrant’s Form 10-Q for the period
ended March 31, 2013 and incorporated herein by reference.10.33 HealthSpring Equity Incentive Plan: Form of Non-Qualified Stock Filed as Exhibit 10.5 to the registrant’s Form 10-Q for the period
Option Agreement ended March 31, 2013 and incorporated herein by reference.10.34 Master Transaction Agreement, dated February 4, 2013 among Filed as Exhibit 10.29 to the registrant’s Form 10-K for the year ended
Connecticut General Life Insurance Company, Berkshire Hathaway Life December 31, 2012 and incorporated herein by reference.Insurance Company of Nebraska and, solely for purposes ofSections 3.10, 6.1, 6.3, 6.4, 6.6, 6.9 and Articles II, V, VII, and VIII,thereof, National Indemnity Company (including the Forms ofRetrocession Agreement, the Collateral Trust Agreement, the Securityand Control Agreement, the Surety Policy and the ALC ModelPurchase Option Agreement as exhibits)
12 Computation of Ratios of Earnings to Fixed Charges Filed herewith.21 Subsidiaries of the Registrant Filed herewith.23 Consent of Independent Registered Public Accounting Firm Filed herewith.31.1 Certification of Chief Executive Officer of Cigna Corporation pursuant Filed herewith.
to Rule 13a-14(a) or Rule 15d-14(a) of the Securities Exchange Act of1934
31.2 Certification of Chief Financial Officer of Cigna Corporation pursuant Filed herewith.to Rule 13a-14(a) or Rule 15d-14(a) of the Securities Exchange Act of1934
32.1 Certification of Chief Executive Officer of Cigna Corporation pursuant Furnished herewith.to Rule 13a-14(b) or Rule 15d-14(b) and 18 U.S.C. Section 1350
32.2 Certification of Chief Financial Officer of Cigna Corporation pursuant Furnished herewith.to Rule 13a-14(b) or Rule 15d-14(b) and 18 U.S.C. Section 1350
101 The following materials from Cigna Corporation’s Annual Report on Filed herewith.Form 10-K for the year ended December 31, 2016, formatted in XBRL(Extensible Business Reporting Language): (i) the ConsolidatedBalance Sheets; (ii) the Consolidated Statements of Income; (iii) theConsolidated Statements of Comprehensive Income; (iv) theConsolidated Statements of Cash Flows; (v) the ConsolidatedStatements of Changes in Total Equity; (vi) the Notes to ConsolidatedFinancial Statements and (vii) Financial Statement Schedules I, II, III,IV and V.
* Schedules have been omitted pursuant to Item 601(b)(2) of Regulation S-K. The Company agrees to furnish supplementally to the Securities and Exchange Commission a copy of anyomitted schedule upon request.
The registrant will furnish to the Commission upon request of any other instruments defining the rights of holders of long-term debt.
Shareholders may obtain copies of exhibits by writing to Cigna Corporation, Shareholder Services Department, 1601 Chestnut Street,Philadelphia, PA 19192.
CIGNA CORPORATION - 2016 Form 10-K E-3

PART IVITEM 15. Exhibits and Financial Statement Schedules
Cigna Corporation – Computation of Ratio of Earnings to Fixed Charges
(Dollars in millions)
Year Ended December 31, 2016 2015 2014 2013 2012
Income before income taxes $ 2,979 $ 3,327 $ 3,304 $ 2,176 $ 2,477Adjustments:
(Income) loss from equity investee, net(1) 45 3 (18) (17) (10)(Income) loss attributable to noncontrolling interests 24 17 5 (3) (1)
Income before income taxes, as adjusted $ 3,048 $ 3,347 $ 3,291 $ 2,156 $ 2,466
Fixed charges included in income:Interest expense $ 251 $ 252 $ 265 $ 270 $ 268Interest portion of rental expense 50 54 50 38 43Interest credited to contractholders 1 1 3 5 4
$ 302 $ 307 $ 318 $ 313 $ 315
Income available for fixed charges $ 3,350 $ 3,654 $ 3,609 $ 2,469 $ 2,781
Ratio of earnings to fixed charges: 11.1 11.9 11.3 7.9 8.8
(1) Beginning in 2015, net of distributions received from equity method investments
E-4 CIGNA CORPORATION - 2016 Form 10-K
EXHIBIT 12

PART IVITEM 15. Exhibits and Financial Statement Schedules
Subsidiaries of the RegistrantListed below are subsidiaries of Cigna Corporation as of December 31, 2016 with their jurisdictions of organization. Those subsidiaries not listedwould not, in the aggregate, constitute a ‘‘significant subsidiary’’ of Cigna Corporation, as that term is defined in Rule 1-02(w) of Regulation S-X.
Entity Name Jurisdiction
Allegiance Life & Health Insurance Company, Inc. MontanaAllegiance Re, Inc. MontanaAmerican Retirement Life Insurance Company OhioBenefits Management Corp. MontanaBravo Health Mid-Atlantic, Inc. MarylandBravo Health of Pennsylvania, Inc. PennsylvaniaCareAllies, Inc. DelawareCentral Reserve Life Insurance Company OhioCeres Sales of Ohio, LLC OhioCigna & CMB Life Insurance Company Limited ChinaCigna Alder Holdings, LLC DelawareCigna Apac Holdings Limited BermudaCigna Arbor Life Insurance Company ConnecticutCigna Beechwood Holdings, SdC/MTS BelgiumCigna Behavioral Health of California, Inc. CaliforniaCigna Behavioral Health of Texas, Inc. TexasCigna Behavioral Health, Inc. MinnesotaCigna Bellevue Alpha, LLC DelawareCigna Benefits Financing, Inc. DelawareCigna Brokerage & Marketing (Thailand) Limited ThailandCigna Cedar Holdings, Ltd. MaltaCigna Chestnut Holdings, Ltd. United KingdomCigna Corporate Services, LLC DelawareCigna Data Services (Shanghai) Company Limited ChinaCigna Dental Health of California, Inc. CaliforniaCigna Dental Health of Colorado, Inc. ColoradoCigna Dental Health of Delaware, Inc. DelawareCigna Dental Health of Florida, Inc. FloridaCigna Dental Health of Illinois, Inc. IllinoisCigna Dental Health of Kansas, Inc. KansasCigna Dental Health of Kentucky, Inc. KentuckyCigna Dental Health of Maryland, Inc. MarylandCigna Dental Health of Missouri, Inc. MissouriCigna Dental Health of New Jersey, Inc. New JerseyCigna Dental Health of North Carolina, Inc. North CarolinaCigna Dental Health of Ohio, Inc. OhioCigna Dental Health of Pennsylvania, Inc. PennsylvaniaCigna Dental Health of Texas, Inc. TexasCigna Dental Health of Virginia, Inc. VirginiaCigna Dental Health Plan of Arizona, Inc. ArizonaCigna Dental Health, Inc. FloridaCigna Elmwood Holdings, SPRL BelgiumCigna Europe Insurance Company S.A.-N.V. BelgiumCigna European Services (UK) Limited United KingdomCigna Finans Emeklilik ve Hayat A.S. TurkeyCigna Global Holdings, Inc. DelawareCigna Global Insurance Company Limited Guernsey, C.ICigna Global Reinsurance Company, Ltd. BermudaCigna Global Wellbeing Holdings Limited United KingdomCigna Global Wellbeing Solutions Limited United KingdomCigna Health and Life Insurance Company ConnecticutCigna Health Corporation DelawareCigna Health Management, Inc. DelawareCigna Health Solutions India Pvt. Ltd. IndiaCigna Healthcare Holdings, Inc. ColoradoCigna Healthcare Mid-Atlantic, Inc. MarylandCigna Healthcare of Arizona, Inc. ArizonaCigna Healthcare of California, Inc. CaliforniaCigna Healthcare of Colorado, Inc. ColoradoCigna Healthcare of Connecticut, Inc. ConnecticutCigna Healthcare of Florida, Inc. FloridaCigna Healthcare of Georgia, Inc. GeorgiaCigna Healthcare of Illinois, Inc. IllinoisCigna Healthcare of Indiana, Inc. IndianaCigna Healthcare of Maine, Inc. MaineCigna Healthcare of Massachusetts, Inc. MassachusettsCigna Healthcare of New Hampshire, Inc. New HampshireCigna Healthcare of New Jersey, Inc. New JerseyCigna Healthcare of North Carolina, Inc. North Carolina
CIGNA CORPORATION - 2016 Form 10-K E-5
EXHIBIT 21

PART IVITEM 15. Exhibits and Financial Statement Schedules
Entity Name JurisdictionCigna Healthcare of Pennsylvania, Inc. PennsylvaniaCigna Healthcare of South Carolina, Inc. South CarolinaCigna Healthcare of St. Louis, Inc. MissouriCigna Healthcare of Tennessee, Inc. TennesseeCigna Healthcare of Texas, Inc. TexasCigna Healthcare of Utah, Inc. UtahCigna HLA Technology Services Company Limited Hong KongCigna Holdings Overseas, Inc. DelawareCigna Holdings, Inc. DelawareCigna Hong Kong Holdings Company Limited Hong KongCigna Insurance Public Company Limited ThailandCigna Insurance Services (Europe) Limited United KingdomCigna Intellectual Property, Inc. DelawareCigna International Corporation DelawareCigna International Health Services Kenya Limited KenyaCigna International Health Services SDN BHD MalaysiaCigna International Health Services BVBA BelgiumCigna International Health Services, LLC FloridaCigna International Services Australia Pty. Ltd. AustraliaCigna Investment Group, Inc. DelawareCigna Investments, Inc. DelawareCigna Korea Chusik Hoesa KoreaCigna Laurel Holdings, Ltd. BermudaCigna Legal Protection UK Ltd. United KingdomCigna Life Insurance Company of Canada CanadaCigna Life Insurance Company of Europe S.A.- N.V. BelgiumCigna Life Insurance Company of New York New YorkCigna Life Insurance New Zealand Limited New ZealandCigna Linden Holdings, Inc. DelawareCigna Magnolia Holdings, Ltd. BermudaCigna Myrtle Holdings, Ltd. MaltaCigna Nederland Alpha Cooperatief U.A. NetherlandsCigna Nederland Beta N.V. NetherlandsCigna Nederland Gamma N.V. NetherlandsCigna Oak Holdings, Ltd. United KingdomCigna Palmetto Holdings, Ltd. BermudaCigna Poplar Holdings, Inc. DelawareCigna Saico Benefits Services WLL BahrainCigna Sequoia Holdings, SPRL BelgiumCigna Taiwan Life Assurance Company Limited TaiwanCignaTTK Health Insurance Company Limited IndiaCigna Walnut Holdings, Ltd. United KingdomCigna Willow Holdings, Ltd. United KingdomCigna Worldwide General Insurance Company Limited Hong KongCigna Worldwide Insurance Company DelawareCigna Worldwide Life Insurance Company Limited Hong KongConnecticut General Corporation ConnecticutConnecticut General Life Insurance Company ConnecticutFirstAssist Administration Limited United KingdomGreat-West Healthcare of Illinois, Inc. IllinoisGrown Ups New Zealand Limited New ZealandHealth-Lynx New JerseyHealthsource, Inc. New HampshireHealthSpring, Inc. DelawareHealthSpring of Alabama, Inc AlabamaHealthSpring of Florida, Inc. FloridaHealthSpring Life & Health Insurance Company, Inc. TexasHealthSpring of Tennessee, Inc. TennesseeKDM Thailand Limited ThailandLife Insurance Company of North America PennsylvaniaLINA Financial Service KoreaLINA Life Insurance Company of Korea KoreaLoyal American Life Insurance Company OhioMCC Independent Practice Association of New York, Inc. New YorkNewQuest, LLC TexasNewQuest Management Northeast, LLC DelawareOlympic Health Management Services, Inc. WashingtonProvident American Life and Health Insurance Company OhioPT Asuransi Cigna IndonesiaQualcare Alliance Networks, Inc. New JerseyQualcare Captive Insurance Company Inc. PCC New JerseyQualcare Management Resources Limited Liability Company New Jersey
E-6 CIGNA CORPORATION - 2016 Form 10-K

PART IVITEM 15. Exhibits and Financial Statement Schedules
Entity Name JurisdictionQualcare, Inc. New JerseyRHP (Thailand) Limited ThailandScibal Associates, Inc. New JerseySterling Life Insurance Company IllinoisTel Drug, Inc. South DakotaTel Drug of Pennsylvania, LLC PennsylvaniaTemple Insurance Company Limited BermudaUnited Benefit Life Insurance Company Ohio
CIGNA CORPORATION - 2016 Form 10-K E-7

PART IVITEM 15. Exhibits and Financial Statement Schedules
Consent of Independent Registered Public Accounting FirmWe hereby consent to the incorporation by reference in the Registration Statements on Form S-8 (No. 333-179307, No. 333-166583,No. 333-163899, No. 333-147994, No. 333-64207, No. 333-129395, No. 333-107839, No. 333-90785, No. 333-64207, No. 333-31903,No. 333-22391, No. 033-60053 and No. 033-51791) of Cigna Corporation of our reports dated February 23, 2017 relating to the financialstatements, the financial statement schedules and the effectiveness of internal control over financial reporting, which appear in this Form 10-K.
/s/ PricewaterhouseCoopers LLP
PricewaterhouseCoopers LLPHartford, ConnecticutFebruary 23, 2017
E-8 CIGNA CORPORATION - 2016 Form 10-K
EXHIBIT 23

PART IVTEM 15. Exhibits and Financial Statement Schedules
CertificationI, DAVID M. CORDANI, certify that:
I have reviewed this Annual Report on Form 10-K of Cigna Corporation;
Based on my knowledge, this report does not contain any untrue statement of a material fact or omit to state a material fact necessary tomake the statements made, in light of the circumstances under which such statements were made, not misleading with respect to theperiod covered by this report;
Based on my knowledge, the financial statements, and other financial information included in this report, fairly present in all materialrespects the financial condition, results of operations and cash flows of the registrant as of, and for, the periods presented in this report;
The registrant’s other certifying officer(s) and I are responsible for establishing and maintaining disclosure controls and procedures (asdefined in Exchange Act Rules 13a-15(e) and 15d-15(e)) and internal control over financial reporting (as defined in Exchange ActRules 13a-15(f) and 15d-15(f)) for the registrant and have:
designed such disclosure controls and procedures, or caused such disclosure controls and procedures to be designed under oursupervision, to ensure that material information relating to the registrant, including its consolidated subsidiaries, is made known to usby others within those entities, particularly during the period in which this report is being prepared;
designed such internal control over financial reporting, or caused such internal control over financial reporting to be designed underour supervision, to provide reasonable assurance regarding the reliability of financial reporting and the preparation of financialstatements for external purposes in accordance with generally accepted accounting principles;
evaluated the effectiveness of the registrant’s disclosure controls and procedures and presented in this report our conclusions aboutthe effectiveness of the disclosure controls and procedures, as of the end of the period covered by this report based on suchevaluation; and
disclosed in this report any change in the registrant’s internal control over financial reporting that occurred during the registrant’s mostrecent fiscal quarter (the registrant’s fourth fiscal quarter in the case of an annual report) that has materially affected, or is reasonablylikely to materially affect, the registrant’s internal control over financial reporting; and
The registrant’s other certifying officer(s) and I have disclosed, based on our most recent evaluation of internal control over financialreporting, to the registrant’s auditors and the audit committee of the registrant’s board of directors (or persons performing the equivalentfunctions):
all significant deficiencies and material weaknesses in the design or operation of internal control over financial reporting which arereasonably likely to adversely affect the registrant’s ability to record, process, summarize and report financial information; and
any fraud, whether or not material, that involves management or other employees who have a significant role in the registrant’s internalcontrol over financial reporting.
/s/ DAVID M. CORDANI
Chief Executive OfficerDate: February 23, 2017
CIGNA CORPORATION - 2016 Form 10-K E-9
EXHIBIT 31.1
1.
2.
3.
4.
a)
b)
c)
d)
5.
a)
b)
PART IVITEM 15. Exhibits and Financial Statement Schedules
CertificationI, THOMAS A. MCCARTHY, certify that:
I have reviewed this Annual Report on Form 10-K of Cigna Corporation;
Based on my knowledge, this report does not contain any untrue statement of a material fact or omit to state a material fact necessary tomake the statements made, in light of the circumstances under which such statements were made, not misleading with respect to theperiod covered by this report;
Based on my knowledge, the financial statements, and other financial information included in this report, fairly present in all materialrespects the financial condition, results of operations and cash flows of the registrant as of, and for, the periods presented in this report;
The registrant’s other certifying officer(s) and I are responsible for establishing and maintaining disclosure controls and procedures (asdefined in Exchange Act Rules 13a-15(e) and 15d-15(e)) and internal control over financial reporting (as defined in Exchange ActRules 13a-15(f) and 15d-15(f)) for the registrant and have:
designed such disclosure controls and procedures, or caused such disclosure controls and procedures to be designed under oursupervision, to ensure that material information relating to the registrant, including its consolidated subsidiaries, is made known to usby others within those entities, particularly during the period in which this report is being prepared;
designed such internal control over financial reporting, or caused such internal control over financial reporting to be designed underour supervision, to provide reasonable assurance regarding the reliability of financial reporting and the preparation of financialstatements for external purposes in accordance with generally accepted accounting principles;
evaluated the effectiveness of the registrant’s disclosure controls and procedures and presented in this report our conclusions aboutthe effectiveness of the disclosure controls and procedures, as of the end of the period covered by this report based on suchevaluation; and
disclosed in this report any change in the registrant’s internal control over financial reporting that occurred during the registrant’s mostrecent fiscal quarter (the registrant’s fourth fiscal quarter in the case of an annual report) that has materially affected, or is reasonablylikely to materially affect, the registrant’s internal control over financial reporting; and
The registrant’s other certifying officer(s) and I have disclosed, based on our most recent evaluation of internal control over financialreporting, to the registrant’s auditors and the audit committee of the registrant’s board of directors (or persons performing the equivalentfunctions):
all significant deficiencies and material weaknesses in the design or operation of internal control over financial reporting which arereasonably likely to adversely affect the registrant’s ability to record, process, summarize and report financial information; and
any fraud, whether or not material, that involves management or other employees who have a significant role in the registrant’s internalcontrol over financial reporting.
/s/ THOMAS A. MCCARTHY
Chief Financial OfficerDate: February 23, 2017
E-10 CIGNA CORPORATION - 2016 Form 10-K
EXHIBIT 31.2
.1
2.
3.
4.
a)
b)
c)
d)
5.
a)
b)

PART IVITEM 15. Exhibits and Financial Statement Schedules
Certification of Chief Executive Officer of Cigna Corporation pursuant to18 U.S.C. Section 1350
I certify that, to the best of my knowledge and belief, the Annual Report on Form 10-K of Cigna Corporation for the fiscal period endingDecember 31, 2016 (the ‘‘Report’’):
complies with the requirements of Section 13(a) or 15(d) of the Securities Exchange Act of 1934; and
the information contained in the Report fairly presents, in all material respects, the financial condition and results of operations of CignaCorporation.
/s/ DAVID M. CORDANI
David M. CordaniChief Executive OfficerFebruary 23, 2017
CIGNA CORPORATION - 2016 Form 10-K E-11
EXHIBIT 32.1
(1)
(2)

PART IVITEM 15. Exhibits and Financial Statement Schedules
Certification of Chief Financial Officer of Cigna Corporation pursuant to18 U.S.C. Section 1350
I certify that, to the best of my knowledge and belief, the Annual Report on Form 10-K of Cigna Corporation for the fiscal period endingDecember 31, 2016 (the ‘‘Report’’):
complies with the requirements of Section 13(a) or 15(d) of the Securities Exchange Act of 1934; and
the information contained in the Report fairly presents, in all material respects, the financial condition and results of operations of CignaCorporation.
/s/ THOMAS A. MCCARTHY
Thomas A. McCarthyChief Financial OfficerFebruary 23, 2017
E-12 CIGNA CORPORATION - 2016 Form 10-K
EXHIBIT 32.2
(1)
(2)

(This page has been left blank intentionally.)

(This page has been left blank intentionally.)

OUR MISSION
To help the people we serve improve their health, well-being and sense of security.
All Cigna products and services are provided exclusively by or through operating subsidiaries of Cigna Corporation, including Cigna Health and Life Insurance Company, Connecticut General Life Insurance Company, Life Insurance Company of North America, Cigna Life Insurance Company of New York (New York, NY), Cigna Behavioral Health, Inc., Cigna Health Management, Inc., and HMO or service company subsidiaries of Cigna Health Corporation and Cigna Dental Health, Inc. The Cigna name, logo, and other Cigna marks are owned by Cigna Intellectual Property, Inc.
901595 03/2017 © 2017 Cigna. Some content provided under license.

900 COTTAGE GROVE ROAD, BLOOMFIELD, CT 06002
GO DEEP
GO GLOBAL
GO INDIVIDUAL
CIGNA.COM