go-ahead bus investor event · pdf filego-ahead bus investor event 18 october 2012 martin...
TRANSCRIPT

GO-AHEAD BUS INVESTOR EVENT
18 October 2012
David Brown, Group Chief Executive

Growing our core bus division
• Committed to operating in the UK rail market
• Committed to growing our UK bus division:
– 100% owned
– Highly cash generative
– Flexible cost base
– Stable earnings throughout economic downturn
– Significant growth potential in deregulated bus
– High contract retention rate in London and
more stable market
HIGHLIGHTS
• UK bus is core to our business and we see
it as a strong growth area
Bus and rail operating profit
• Our target: £100m of bus operating profit
by FY’2015/16 achieved through organic
growth
£m
Unless otherwise stated, all references to operating profit exclude amortisation and exceptional items 10

GO-AHEAD BUS INVESTOR EVENT
18 October 2012
John Trayner, Managing Director - Go-Ahead London

What does it take to run a good bus business in
London?
12

London’s bus network
13

Statistics for London
• 8,000+ buses
• 750 routes
• Population rising by 1m by 2020
• Passenger numbers 2.3 billion
per annum
• Nearly 50% of all bus journeys in
England made in London
• Buses carry twice as many
people as the Tube every day
14

Go-Ahead London
• Market share 24%
• Revenue £312m
• Passenger journeys 391m
• 1,800 buses, including 60 hybrids
• Expansion – 25% more vehicles,
staff and passenger journeys in
the last five years plus 35%
increase in revenue
15

Where we operate
• 17 depots, significant number
are freehold
• South East/South West
• More recently moved into the
North East
• Operate most central London
routes
16

Business model
• First priority – operating legally and safely
• Key components:
– Bid success
– Maximising outputs
– High quality
– Cost effectiveness
– Profitability
• Underpinned by successful execution
17

Measuring our success
• Our performance is measured by:
– Excess Waiting Time for high frequency contracts
– Punctuality for low frequency contracts
– Mileage operated
• Performance against these determine our contract revenue and Quality Incentive
Contract (QIC) bonuses
• As performance improves QIC targets are tightened
18
Excess Waiting Time Punctuality

Contract bidding
19
• Contracts on average run for five years
• 20% of all contracts therefore come up every year
• High retention rate
• Well placed to bid for new routes

Monitoring performance
• Rigorous approach
• Four weekly depot performance
audits
• Closely managed by Directors
20
Northumberland Park

Achievements
• Growing the business +25%
• Controlling insurance costs -17%
• Controlling staff costs
21

A weekend of change, known as ‘Mad March’
• Introduced five new contracts (73 pvr)
• Introduced three retained contracts (13 pvr)
• Moved two contracts to Camberwell (37 pvr)
• TUPE transferred 135 drivers from three companies
• Completed acquisition of Northumberland Park, which included 13 routes,
130 vehicles and 400 staff TUPE transferred.
All on 31 March 2012
£42m worth of business started on one day
22
Peak vehicle requirement (pvr)
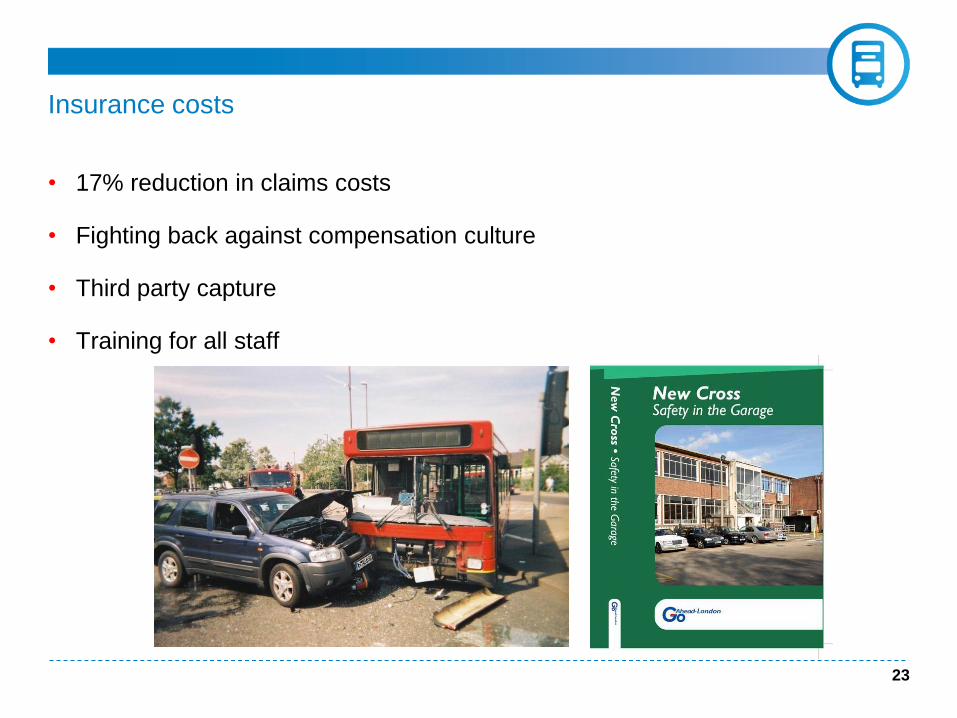
Insurance costs
• 17% reduction in claims costs
• Fighting back against compensation culture
• Third party capture
• Training for all staff
23

Staffing
• 65% of our costs
• Company legacy
• Effect of TUPE
• Competitive advantage
• Training
24

To remain successful
• Understand the market
• Understand our stakeholder - TfL
• Sustainable bids
• Good depot locations with the best
management teams
• TUPE has made the process more
transparent
• Innovative cost savings
• Playing field becoming more level
• Quality and compliance becoming more
important
25

GO-AHEAD BUS INVESTOR EVENT
18 October 2012
Martin Dean, Managing Director – Bus Development

Others
6% Largest municipals
2% Transdev
1% Wellglade
1% Rotala
1% EYMS
18% Independently owned
UK bus market (outside London)
22%
28%
7%
6%
15%
22%
FirstGroup
Others
Go-Ahead
National Express
Arriva
Stagecoach
27
N.B. Market share by revenue

What do we look for when making acquisitions?
Positives Evidence
Growth potential Mix of commercial and tendered
services
Markets served
Social and economic indicators
Local authority relationships and
partnerships
Strength of competition
Stability of target business Financial indicators
Reputation
Management team
Asset base Operating centre
Vehicle condition
Potential for synergies Proximity to existing Go-Ahead bus
businesses
Regulatory Likelihood of OFT intervention
28
Relationship building with potential vendors
29
• Industry stakeholder events
• Pro-active approach
• Corporate finance advisors
• Go-Ahead attractive to vendors because of our well-established reputation
for devolved management and maintenance of local brands
• We have no control over the timing of vendors coming to the market but
usually an active pipeline

Improving acquired businesses
30
• Capital for new vehicles and other assets
• Expertise e.g. smartcards, property, financial systems
• Synergies e.g. payroll and invoice processing
• Group buying power e.g. vehicle parts, fuel
• Our approach: to add value while encouraging local innovation

Recent acquisitions
31
Carousel Hedingham Anglian Chambers
Consideration £3.1m £4.3m £4.4m £3.2m
Date of purchase March 2012 March 2012 April 2012 June 2012
Buses 51 90 71 29
Staff 105 120 134 40
Rationale • Synergies with
Oxford
• Good commercial
corridors
• Good asset base
with room for
expansion
• Local authority with
track record of
support for local
bus services
• Synergies with
existing Norfolk
operation (Konect)
• Strong record of
network growth
• Proximity to Hedingham:
opportunity to share
overheads
• Very strong core
commercial corridor
Progress/Initiatives • Relocated depot
site
• Improved fleet
through internal
cascades
• Intensified service
on key commercial
corridor
• Fleet renewal
through internal
cascades
• Tender wins in
September 2012
• Launch of new
commercial
services
September and
November 2012
• Sharing of existing
finance resource to
other East Anglian
businesses
• Implementation of
Group IT systems
for financial
reporting,
purchasing and
payroll
• Transfer of operating
base to underutilised
Hedingham depot
• Fleet renewal
• Sharing of commercial
expertise from other
East Anglian
businesses

Bus Service Operators Grant (BSOG)
32
£240m
£80m
Current total pot (England) £320m
£80m
London (paid
direct to
operators)
£240m
Commercial and
tendered services
outside London (paid
direct to operators)

Bus Service Operators Grant (BSOG)
33
£150m
£10m
£80m
£50m
£30-40m
Future total pot (England) £320m
£150m
Commercial
services outside
London (paid direct
to operators)
£80m
London (paid
to TfL)
£30-40m
(paid to Local Transport
Authorities in Better Bus
Areas)
£50m
Supported services
outside London (paid
to Local Transport
Authorities)
Uplift for AVL, smartcards
and low carbon incentives
(paid direct to operators)

Summary
34
• Value adding acquisitions made but….
• ….still only 7% of deregulated market
• Proactive approach
• Always assessing opportunities
• Good growth prospects

GO-AHEAD BUS INVESTOR EVENT
18 October 2012
Kevin Carr, Managing Director – Go North East

Operating in a deregulated market
• Go North East is the largest bus operator in the North East of England
• Primarily operating buses within Tyne and Wear with services crossing
the boundaries into Northumberland, Durham and Tees Valley
• Operate mainly inter-urban services, from seven core garages with four
outstations
• 90% of our operations are commercial
• Over 2000 staff
• 72 million passenger journeys per year
• Annual revenue of £97m
• Been in business for 100 years in 2013
36

Current position
• Autonomous management
• Vigorous commercial strategy has grown the business
• Growth in revenue and passenger numbers
• Sound cost base and strong cost control
• High passenger satisfaction - 91% in recent Passenger Focus survey
• Competition: two large bus operators, small independent operators, Metro, the
car
• Differentiate through robust commercial strategy - branding, operational
performance, innovation, product quality, flexible and innovative pricing, value
for money ethos
• Continual improvement through balance of revenue generation and cost
control
• Growth initiatives through organic growth, new contracts and acquisitions
37

Organic growth
• Commercial service network offers growth opportunities
• Robust commercial strategy – regular review of services; treating each one as
a product with a life cycle
• Services categorised as core commercial, secondary commercial and social or
secured services
• Each product requires a combination of elements to deliver on service quality
and price
• Recognise that the balance between change and stability is key
• Identify and understand the local markets
38

Organic growth – what constitutes a service /product?
Service/ Product
Vehicle Age / Quality
Vehicle Type
Ticketing Options
Brand Identity
Marketing / Information
Route Destination
Customer Requirements
Driver appearance,
customer skills etc
Value for Money
Journey time / Frequency
39

Organic growth
• Targeted investment
• Recognition and visibility within the local markets are achieved with ‘local’
brand identity
• Ticket offerings targeted to meet lifestyle choices
• Ticketing range tailored to meet customer needs, with discounts to ‘buy in’
loyalty and channel shift to online
40
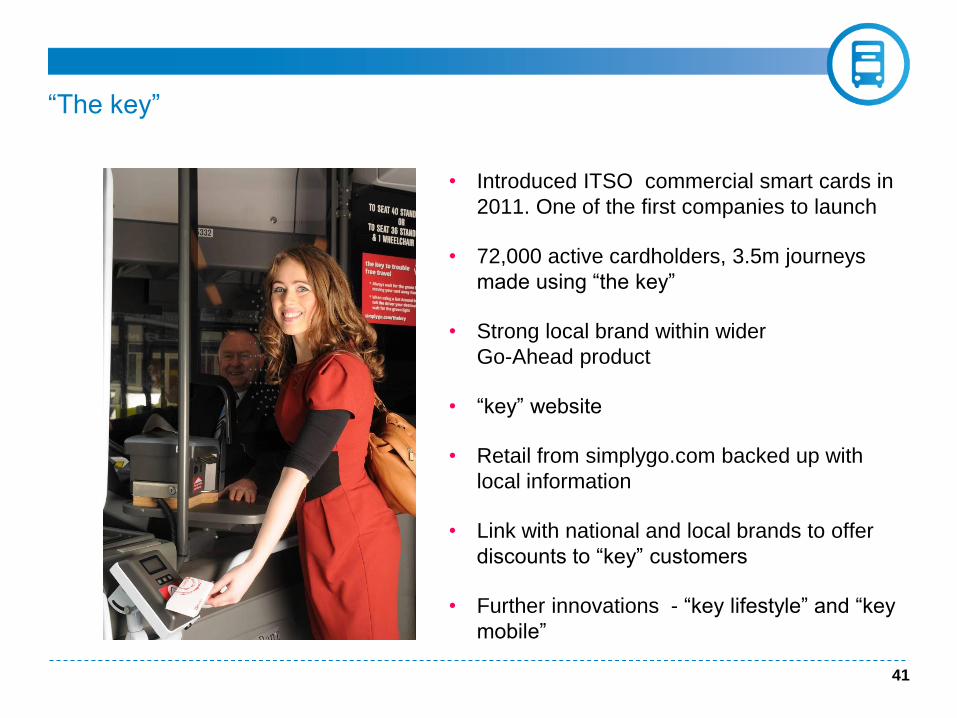
“The key”
• Introduced ITSO commercial smart cards in
2011. One of the first companies to launch
• 72,000 active cardholders, 3.5m journeys
made using “the key”
• Strong local brand within wider
Go-Ahead product
• “key” website
• Retail from simplygo.com backed up with
local information
• Link with national and local brands to offer
discounts to “key” customers
• Further innovations - “key lifestyle” and “key
mobile”
41

“The key lifestyle”
42

M-ticketing
43

Service/Product – “Ten”
44

Service/Product – “Red Arrow”
45

Service/Product – “Tyne Tees Express”
46
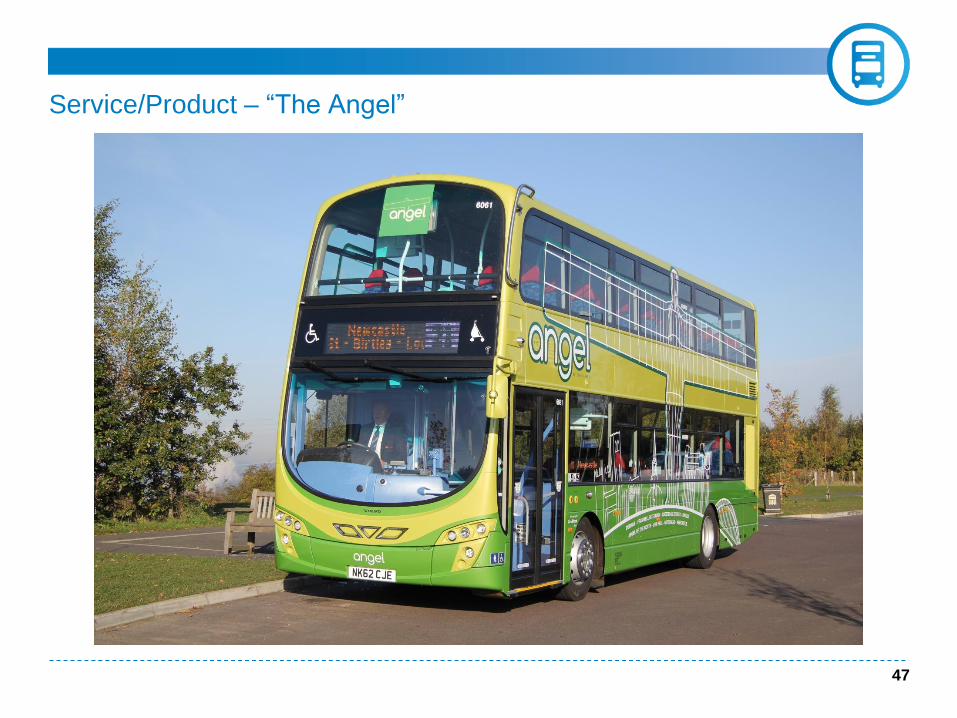
Service/Product – “The Angel”
47

Performance monitoring and management
• Regular customer surveys - enables bespoke offerings to meet customer
requirements
• Service performance reviewed on an ongoing basis using reports, surveys,
focus groups, mystery traveller, route costing, ticket data and operational
performance
• Routes/brands are organised into manageable groups. Service Delivery
Managers responsible for service quality and performance
• All services have qualitative and financial targets to achieve and are measured
against those targets
48

Balanced approach
• Balancing revenue generation and cost control
• Efficiency and productivity
• Continual improvement
• Simplify, standardise and share best practice
49

GO-AHEAD BUS INVESTOR EVENT
18 October 2012
Gillian Singh, Group Marketing Director

The Customer Proposition – 3 years ago… Customer proposition four years ago…
…who were our passengers?
51
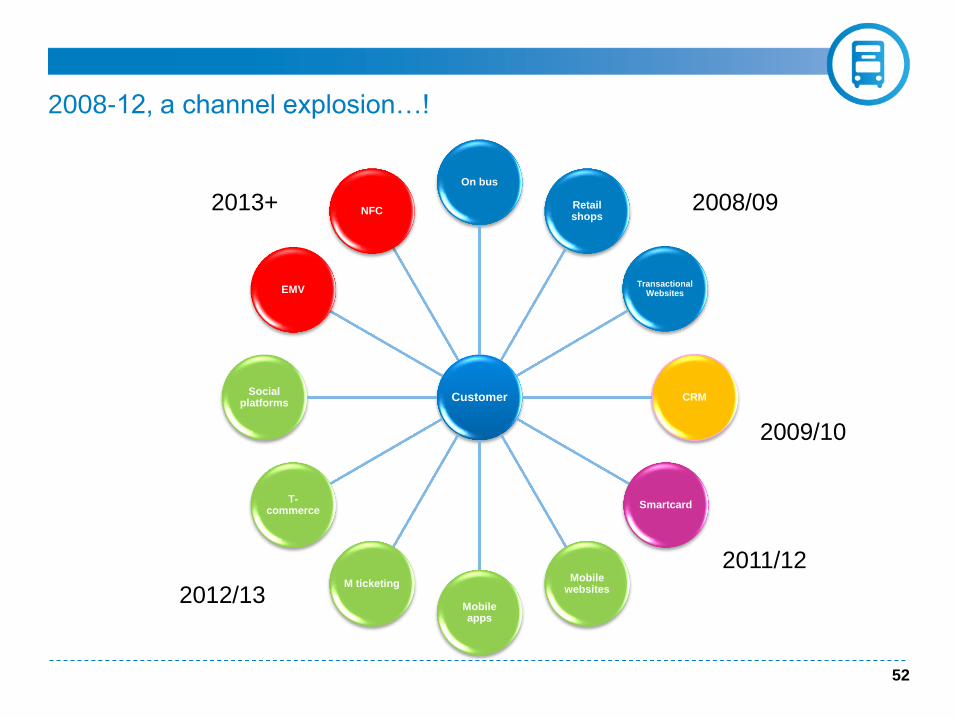
On bus
Retail shops
Transactional Websites
CRM
Smartcard
Mobile websites
Mobile apps
M ticketing
T-commerce
Social platforms
Customer
EMV
NFC
2008-12, a channel explosion…!
2008/09
2009/10
2011/12
2012/13
2013+
52

Current customer details
53
0
100
200
300
400
500
600
700
2011-12 2012-13
Key customers
Social customers
Online customers
8k
238k
386k
500k
573k
140k
target

Plymouth online customers demographics
54

Marketing functional plan – 2012 retailing vision
55

Corporate and marketing opportunities for 2012/13
• Local marketing plans and KPIs set
• Growing passenger numbers
• Supporting top line revenue growth
• Increasing yield from existing passengers
• Simplifying existing products and developing new products
• Launching new channels to market
• Reducing the cost of retailing from new channels
• Improving provision of information
• Growing corporate B2B sales
• Improving loyalty and engagement
56
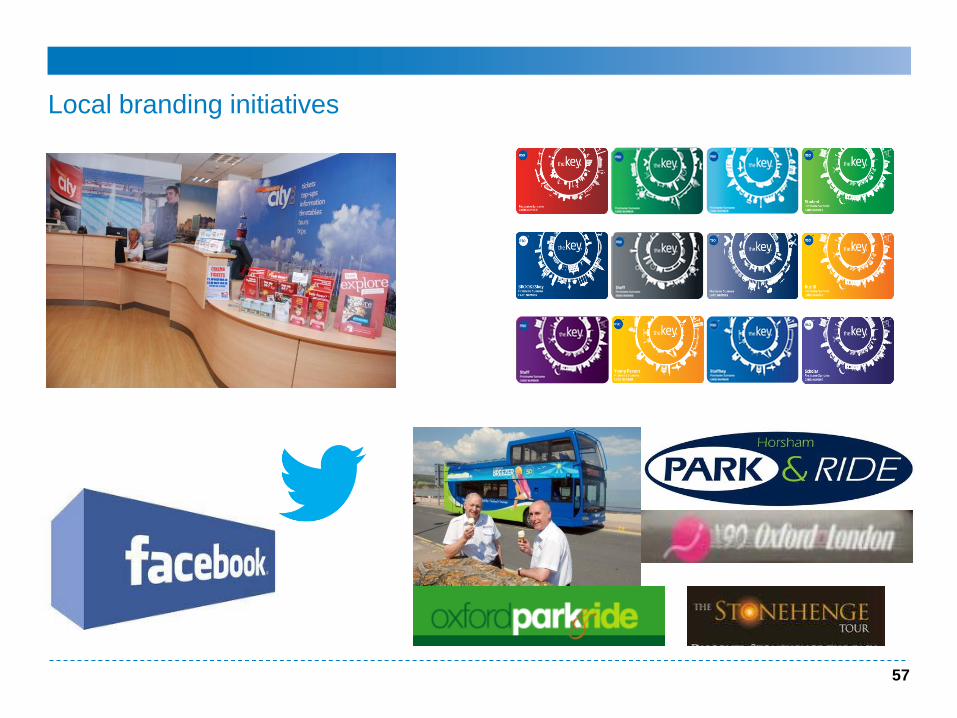
Local branding initiatives
57

Local Facebook / Twitter sites
58

59

Innovation – launch new websites
60

61
Innovation

Innovation – mobile retailing websites
62

Innovation – roll out M-ticketing
63

Mobile ticketing application: a ticket machine in your pocket
64

Making it easier to purchase – smartcards Innovation – further roll out of “the key”
65

2012 2012
2012 2011
2011
2011 2011
2010 2010
Konectbus
Metrobus
Southern
Brighton
Plymouth
Go North East
Oxford
London Midland
Progress of smartcards
Go South Coast
66

Innovation – Plymouth Citybus “key” launch
67

68
Innovation – launch multi-modal travel
Metrobus Brighton & Hove
Southern
Addition of plusbus and bus travel products from Metrobus and Brighton & Hove
added to Southern Key.

Key benefits launch
69
Key customers are rewarded by obtaining discounts with local attractions and
businesses

2012/13 – launch a B2B version of “the key”
70
Company X

71
Innovation – improve data communications on the move

72
Growth – grow passengers
Daily
• Commuters
• Business
Non-users
• Car/taxi/ coach
users
• Lapsed customers
Frequent
• Young persons
• Students
• Leisure
Infrequent
• Tourism
• Business

M2 extension to Southbourne Growth – Go South Coast “More” extension
Growing local routes by encouraging passengers to try our services.
73

74
Growth – Brighton & Hove night buses
Growing local routes by encouraging passengers to try our services.

Growth – Metrobus commuters
Introduction of new faster commuter services
75

Retention – maximising our own estate
Maximising the benefit of our own buses and bus stops
76
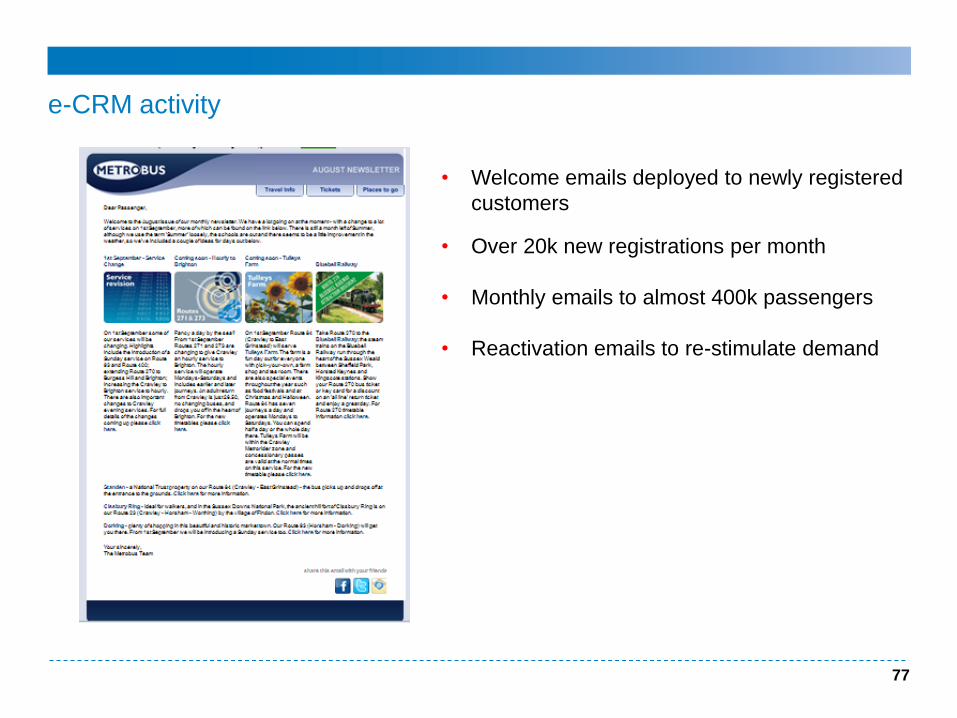
e-CRM activity
• Welcome emails deployed to newly registered
customers
• Over 20k new registrations per month
• Monthly emails to almost 400k passengers
• Reactivation emails to re-stimulate demand
77

Establishing T-commerce
78
Focus on the development of a tablet strategy

Go-Ahead’s 89% customer satisfaction is a top tier result
Customer satisfaction
49
45
47
52
69
53
46
54
45
46
44
49
40
46
42
39
28
37
45
38
39
36
43
35
8
5
8
7
2
7
5
5
12
9
9
12
2
3
1
1
1
3
2
2
2
3
3
3
1
0
1
1
0
0
1
1
2
6
1
1
Go-Ahead Group…
Blue Star (298)
Brighton & Hove (1213)
Go North East (1773)
Konectbus (210)
Metrobus (768)
Oxford Bus (523)
Oxford Park & Ride…
Plymouth Citybus (393)
Southern Vectis (221)
Thames Travel (186)
Wilts & Dorset (534)
Very satisfied Fairly satisfied Neither satisfied nor dissatisfied Fairly dissatisfied Very dissatisfied
% sat.
89
91
89
91
97
90
92
92
84
82
87
84
Linking customer satisfaction to revenue growth
79

Marketing awards
Plymouth Citybus – highly
commended in Eureka
award for Dennis Dart 2011
2011
2012 - nominations
Go North East – Marketing initiatives
and Marketing excellence
Metrobus – Marketing excellence
Bluestar – Eureka awards for marketing
80
• Recognising our efforts…
Plymouth Citybus – Won CSR
for Dennis Dart
Highly commended in
Innovation award for “the key”
2012
2011
Go-Ahead – Excellence in
Technology for “the key”

Summary
• Detailed local marketing plans produced
• KPI’s and implementation plans set
• Marketing strategies developed to drive:
– Brand development and engagement
– Innovation
– Passenger growth
– Increasing yield from existing customers
• Strong focus on mobile and tablet as new retailing channels
• Increased customer insight and feedback at the heart of all strategies
81

GO-AHEAD BUS INVESTOR EVENT
18 October 2012
David Brown, Group Chief Executive

Strong track record of organic growth
HIGHLIGHTS
• Strong track record of delivering growth
• Sector leading passenger journey growth
• Throughout the economic downturn, deregulated
bus profits have grown each year:
– 9.9% profit CAGR over last five years
• Sector leading growth – significantly
outperforming the wider market over the last five
years:
– c.5% l-f-l revenue growth p.a.
– c.2.5% l-f-l passenger growth p.a.
• Growth also through acquisitions
Deregulated bus operating profit (£m)
and operating margin (%)
Bus volume growth in England
(exc London) vs Go-Ahead
83

Sector leading London bus business
HIGHLIGHTS
• Best in class operating margins
• A high quality and cost efficient operator
• Strong and experienced management team
– understand the market with an effective
business model
• Good network of freehold depots
• Operating profit and margins have reduced due to
a reduction in revenue from QICs across the sector
• Market now more stable
• Opportunities for growth remain
Regulated bus operating profit (£m)
and operating margin (%)
• Market more stable
84

Growing bus profits
HIGHLIGHTS
• Our target: £100m of bus profits by
FY’2015/16
• Target assumes flat profits in year one (FY’2012/13) as a result of £20m of increased
costs due to BSOG and fuel prices
• Target assumes no significant profit growth in regulated bus
• Achieved through a combination of revenue growth and cost efficiencies
• Evidenced by a strong track record of driving growth with ‘enablers’ of technology,
marketing and structures in place
• Growth to be achieved organically
85

Bus revenue growth – pull factors
HIGHLIGHTS
• High quality services
• Innovative products and marketing
• Offer a high quality service – punctual,
convenient and value for money
– 89% customer satisfaction score –
best in sector
• Continue to invest in our fleet
– £80m invested in FY’2012, similar for
FY’2013
• Local management teams have in depth
knowledge of the areas they operate
– all local markets have unique
characteristics
• Strong local management teams
• Operate in resilient markets
• Marketing potential through smart-
ticketing
– 250,000 smartcards in issue
• Innovative products
– at the forefront of passengers needs
• Operate in resilient vibrant areas
– 90% of business in the South
• Good relationships with local authorities
and other key stakeholders
– our companies are an integral part of
local communities
Pull factors – more of what we have been doing...
86

Bus revenue growth – push factors
HIGHLIGHTS
• Modal shift - high motoring costs • Political support - buses help drive
economic growth
• Economic climate and high cost of motoring
– petrol prices have increased by 40% over
last five years
– insurance premiums for 17-20 year olds
have risen 68% over last five years
• Congested urban areas, expensive parking
– congestion costs £11bn per annum in
urban areas
• Behavioural shift towards using public transport
– particularly amongst young urban
dwellers
• Local authorities pro-public transport
– Brighton & Hove consistently pro-public
transport
• Increasing focus on ‘greener’ and ‘healthier’
lifestyles
– evidenced by significant rise in cyclists
• Political support – bus use helps foster
sustainable economic growth
– more people commute by bus than all other
forms of public transport combined.
Push factors – we can take further advantage of market strengths...
87

Cost efficiencies
HIGHLIGHTS
• Continue cost efficiency journey
• Not one easy solution, continue to make small incremental savings
• Continual improvement:
– Bus insurance costs - £3.5m reduction last year
– Bus procurement - £4m saving over last four years
– Fuel efficiency - £6m saving over last three years
– Scheduling analysis
• Better Together forums
• Simplify, Standardise and Share
• Leverage benefits of Group scale
88

89
Key external risks
• Economy - further weakness in the economy could impact our target. However, also
opportunity through modal shift.
• Political and regulatory framework
– tax changes such as BSOG and fuel duty
– regulatory changes eg quality contracts
– subsidy and general bus support eg concessionary fare reimbursement
– Transport for London budget constraints / changing priorities
• Fuel costs - our established fuel hedging policy reduces uncertainty and enables us to
plan ahead
We have successfully managed these external risks over the last five years and still
delivered growth.

90
• Committed to growing our core UK bus division:
– £100m of bus operating profit by FY’2015/16 achieved through organic growth
– in addition, there is the expectation of further acquisitions
• Committed to UK rail market:
– operate 30% of UK rail passenger journeys
– potential to influence the outcome of review process
– remain shortlisted for Thameslink
• Strong group fundamentals:
– highly cash generative & effective cash
management
– robust balance sheet
• Committed to maintaining dividend
– bus earnings underpin dividend
Summary
Year 0
FY’2011/12
£70m
Year 4
FY’2015/16
£100m

Q&A
Download our new IR app and follow us on Twitter and Facebook