gns science polygonal fault systems in the canterbury ... · petroleum modelling in pep38258...
TRANSCRIPT
Austral Pacific Energy Ltd. 2007. Petroleum Modelling in PEP38258 Offshore Canterbury Basin New Zealand. New Zealand open-file Petroleum Report 3504.Wellington: Ministry of Economic Development.
Cartwright, J.A. and Dewhurst, D.N. 1998. Layer-bound compaction faults in fine-grained sediments. Bulletin of the Geological Society of America: 110, 1242-1257.
Cartwright, J. 2011. Diagenetically induced shear failure of fine-grained sediments and the development of polygonal fault systems. Marine and Petroleum Geology: 28, 1593-1610.
Gay, A., Lopez, M., Cochonat, P. and Sermondadaz, G. 2004. Polygonal faults-furrows system related to early stages of compaction - upper Miocene to recent sediments of the Lower Congo Basin. Basin Research: 16(1): 101-116.
Leary, R.O. and Mogg, W.G. 2008. The petroleum potential of the offshore Canterbury Basin: insights from petroleum system modelling. PESA Eastern Australian Basins Symposium III: Sydney: 349-368.
7. References
Figure 1. Location map of the offshore Canterbury Basin showing 3D (Waka 3D) and 2D seismic data coverage and drilled wells.
Canterbury Basin is one of the southeast frontier basins in New Zealand and is under active
exploration. Marine mudstones within the Cretaceous and Paleocene succession are the main seal
rocks for the underlying Cretaceous reservoir units in the basin.
High-quality 2D and 3D seismic data reveal the presence of extensive Paleocene and Eocene
Polygonal Fault Systems (PFS) in the offshore Canterbury Basin.
These extensive layer-bound normal fault systems typically develop in fine-grained (hemi-pelagic)
sediments during early stages of burial and compaction (Cartwright and Dewhurst, 1998;
Cartwright, 2011). The presence of PFS provide information on the depositional environment in
areas with limited well coverage.
Timing of development of PFS in relation to the petroleum expulsion is critical for understanding
fluid migration and basin prospectivity.
In this study we show the distribution of polygonal faulting in the basin, utilising the detailed
geometry of the faults in the Waka 3D seismic volume. We also discuss their significance for
interpreting paleo-depositional environments and lithologies, and implications for fluid migration.
1. Introduction
3. Characterisation of the Polygonal Fault Systems (PFS)
2. Data and methods
— Polygonal Fault Systems (PFS) in the offshore Canterbury Basin occur in three layer bound fault tiers and are widely distributed in the Paleocene and Eocene intervals.
— Presence of PFS indicate a mudstone-dominated facies in an outershelf–bathyal depositional environment.
— Especially during early stages of compaction, PFS in the Paleocene and lower Eocene intervals may have acted as conduits (seal bypass systems) for petroleum expelled from the mid Cretaceous source rocks.
— At present there is a lack of clear evidence of non-intrusive related fluid escape features within polygonal fault intervals and it may indicate a sealing nature of these faults. Further analysis is required to determine whether PFS negatively impact on seal integrity.
6. Conclusions and uncertainties
Acknowledgements
This project was carried out as part of on-going research into the evolution of New Zealand's petroleum basins, as part of the Petroleum Basin Research (PBR) programme at GNS Science, funded by direct core funding provided to
GNS Science by the New Zealand Government. We would like to thank Paradigm for providing licenses of interpretation software for this work.GNS Science
GNS Science1 Fairway DriveAvalonLower Hutt 5010PO Box 30368Lower Hutt 5040New ZealandT +64-4-570 1444F +64-4-570 4600
Polygonal Fault Systems in the Canterbury Basin, New Zealand
1Tusar R. Sahoo , Hannu Seebeck and Andy [email protected]
4. Implications on facies and depositional environment interpretation 5. Implications for fluid migration
— PFS are mainly observed in the mudstone dominated layers (e.g. Clipper-1 in Figure 7).
— All mudstone-dominated layers do not contain polygonal faults (Figures 6 and 7). Polygonal faults may be confined to mudstones dominated by clay-sized particles.
1 km
top Paleocenetop Paleocenetop Paleocene
intra Eocene 1intra Eocene 1intra Eocene 1
intra Eocene 2intra Eocene 2intra Eocene 2
intra Eocene 3intra Eocene 3intra Eocene 3
Figure 2. A 3D image showing examples of coherency attribute along interpreted horizons and seismic intersections in the Waka 3D seismic survey.
Figure 3. Coherency attribute map at top of the Paleocene showing presence o f Po lygona l Fau l t Systems (PFS).
Figure 4. Seismic section showing interpreted horizons and PFSs. Three tiers of faults are observed; tier-1 occur mainly within the Paleocene interval; tier-2 occur within the lower Eocene interval; tier-3 occur within the upper Eocene interval. Polygonal faults in the upper Eocene (tier-3) are highly faulted, well connected, and have more vertical extension compared to other fault tiers.
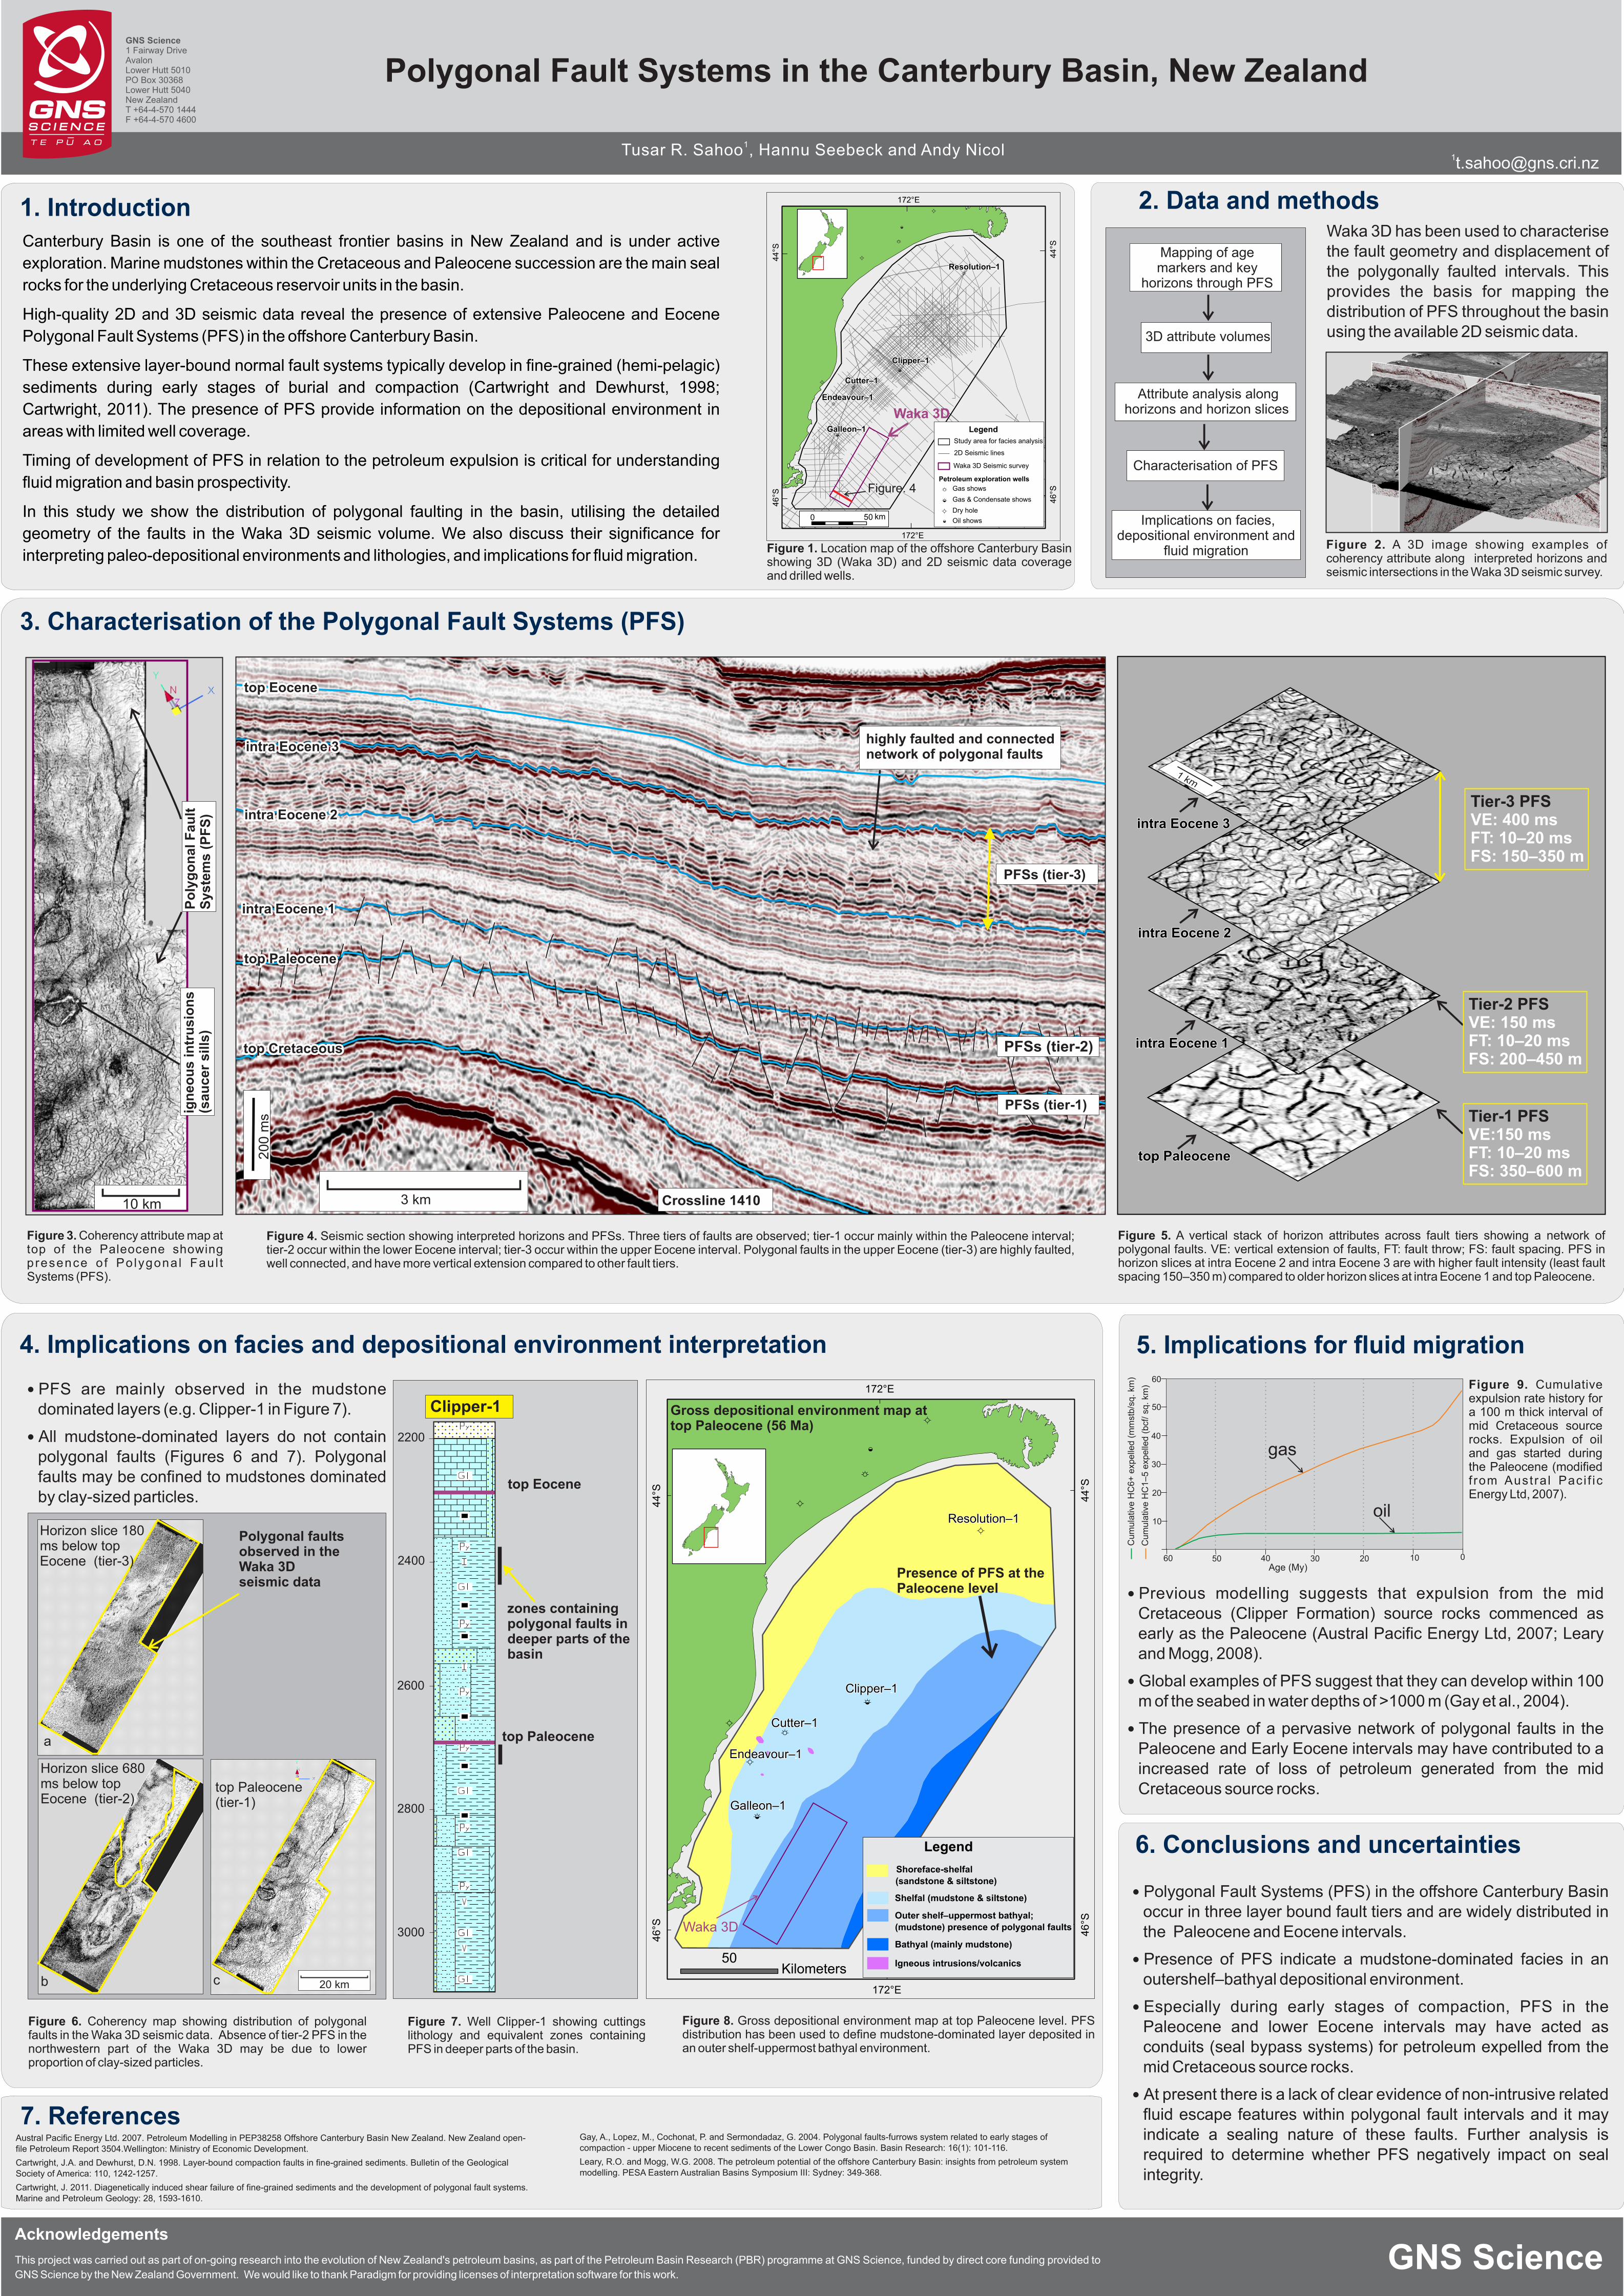
Figure 5. A vertical stack of horizon attributes across fault tiers showing a network of polygonal faults. VE: vertical extension of faults, FT: fault throw; FS: fault spacing. PFS in horizon slices at intra Eocene 2 and intra Eocene 3 are with higher fault intensity (least fault spacing 150–350 m) compared to older horizon slices at intra Eocene 1 and top Paleocene.
Figure 6. Coherency map showing distribution of polygonal faults in the Waka 3D seismic data. Absence of tier-2 PFS in the northwestern part of the Waka 3D may be due to lower proportion of clay-sized particles.
Figure 7. Well Clipper-1 showing cuttings lithology and equivalent zones containing PFS in deeper parts of the basin.
Figure 8. Gross depositional environment map at top Paleocene level. PFS distribution has been used to define mudstone-dominated layer deposited in an outer shelf-uppermost bathyal environment.
— Previous modelling suggests that expulsion from the mid Cretaceous (Clipper Formation) source rocks commenced as early as the Paleocene (Austral Pacific Energy Ltd, 2007; Leary and Mogg, 2008).
— Global examples of PFS suggest that they can develop within 100 m of the seabed in water depths of >1000 m (Gay et al., 2004).
— The presence of a pervasive network of polygonal faults in the Paleocene and Early Eocene intervals may have contributed to a increased rate of loss of petroleum generated from the mid Cretaceous source rocks.
Waka 3D has been used to characterise the fault geometry and displacement of the polygonally faulted intervals. This provides the basis for mapping the distribution of PFS throughout the basin using the available 2D seismic data.
Figure 9. Cumulative expulsion rate history for a 100 m thick interval of mid Cretaceous source rocks. Expulsion of oil and gas started during the Paleocene (modified f rom Austra l Paci f ic Energy Ltd, 2007).
172°E
0
0
ª
ª
+
µ
ª
+
ª
ª
172°E
44
°S
44
°S
46
°S
46
°S
Resolution–1Resolution–1Resolution–1
Cutter–1Cutter–1Cutter–1
Endeavour–1Endeavour–1Endeavour–1
Galleon–1Galleon–1Galleon–1
Clipper–1Clipper–1Clipper–1
0 50 km
Legend
Study area for facies analysis
Petroleum exploration wells
+ Gas shows
0 Gas & Condensate shows
ª Dry hole
µ Oil shows
2D Seismic lines
Waka 3D Seismic survey
Waka 3D
Figure. 4
Mapping of age markers and key horizons through PFSs
3D attribute volumes
Attribute analysis along horizons and horizon slices
Mapping of age markers and key
horizons through PFS
Characterisation of PFS
3D attribute volumes
Attribute analysis along horizons and horizon slices
Implications on facies, depositional environment and
fluid migration
200 m
s
3 km
PFSs (tier-3)
PFSs (tier-1)
PFSs (tier-2)
top Paleocenetop Paleocenetop Paleocene
intra Eocene 1intra Eocene 1intra Eocene 1
intra Eocene 2intra Eocene 2intra Eocene 2
intra Eocene 3intra Eocene 3intra Eocene 3
top Eocenetop Eocenetop Eocene
top Cretaceoustop Cretaceoustop Cretaceous
Crossline 1410
highly faulted and connected network of polygonal faults
0
0
ª
ª
+
µ
ª
+
ª
ª
172°E
172°E
44°S
44°S
46°S
46°S
50Kilometers
Legend
Shoreface-shelfal
Shelfal (mudstone & siltstone)
Outer shelf–uppermost bathyal;
Bathyal (mainly mudstone)
Igneous intrusions/volcanics
(sandstone & siltstone)
(mudstone) presence of polygonal faults
Resolution–1Resolution–1Resolution–1
Cutter–1Cutter–1Cutter–1
Endeavour–1Endeavour–1Endeavour–1
Galleon–1Galleon–1Galleon–1
Clipper–1Clipper–1Clipper–1
Presence of PFS at the Paleocene level
Waka 3D
60 50 40 30 20 10 0
60
50
10
20
30
40
Cu
mu
lativ
e H
C6
+ e
xpe
lled
(m
mst
b/s
q.
km)
Cu
mu
lativ
e H
C1
–5
exp
elle
d (
bcf
/ sq
. km
)
20 km
top Paleocene (tier-1)
Horizon slice 680 ms below top Eocene (tier-2)
Polygonal faults observed in the Waka 3D seismic data
a
cb
top Paleocene
top Eocene
2200
2400
2600
2800
3000
zones containing polygonal faults in deeper parts of the basin
Clipper-1 Gross depositional environment map at top Paleocene (56 Ma)
gas
oil
Age (My)
Tier-3 PFSVE: 400 msFT: 10–20 msFS: 150–350 m
Tier-2 PFSVE: 150 msFT: 10–20 msFS: 200–450 m
Tier-1 PFSVE:150 msFT: 10–20 msFS: 350–600 m
10 km
Po
lyg
on
al
Fa
ult
S
ys
tem
s (
PF
S)
ign
eo
us i
ntr
usio
ns
(sau
cer
sil
ls)
Horizon slice 180 ms below top Eocene (tier-3)