gn, fabrication and test of an apparatus to monitor the...
TRANSCRIPT
Design, Fabrication and Test of an Apparatus to Monitor the Wetting Behaviour of High Service
Temperature Brazing Materials
Rafid A. Khoja-Mendwi
A Thesis
in
The department
of
Mechanical and Industrial Engineering
Presented in partial fulfilment of the requirements for the degree of Master of Applied Science (Mechanical Engineering) at
Concordia University Montreal, Quebec, Canada
November 2009
©Rafid A. Khoja-Mendwi, 2009

iii
Abstract
Design, Fabrication and Test of an Apparatus to Monitor the Wetting Behaviour of High Service
Temperature Brazing Materials
Rafid A. Khoja-Mendwi
In high temperature brazing processes, the substrate wetting and the spreading of the
filler metals into the joint gap is crucial for successful joining. In this work, a new
approach for the assessment of the molten filler spreading behaviour is proposed based
on an existing and well accepted wetting behaviour characterization method. This method
is based on recording the spreading behaviour of the molten filler video-graphically, for
which requires sophisticated hardware. For this reason, the remainder of the work is
focused on providing the means to implement the proposed test considering the specific
demands of the brazing process and the test method. Accordingly, a high temperature
brazing facility with the capacity to monitor the test sample, has been designed,
implemented and successfully tested to fit the purpose of the proposed test. The data
collected from the preliminary tests were refined and analysed using image analysis
techniques. The results of this analysis showed very promising potentials for the testing
facility and the selected characterization method.

iv
Acknowledgments
I begin my gratitude with my family for the love, wishes and support. I thank the
Mandaian community in Canada for the trust and encouragements. I also express my
gratitude to my friends Faris, Haider, Wadah and Alaa for sharing the hope and
opportunity.
On the professional side, I start with a very special gratitude towered my laboratory and
research group mates for helping me to start-up, sharing the knowledge and being my
family during the study period. I thank the Mechanical and Industrial Engineering
department administrative staff for their kindness and technical staff (Robert Oliver,
Gilles Huard and Brad Luckhart) for their willingness, availability and friendly attitude. I
thank Daniel Turner from Pratt & Whitney Canada for his sincere interactions. I also
thank Dr. Philippe Bocher from École de Technologie Supérieure for his correctness. At
last but not the least, I like to tell my deep regards and gratitude to my professor Dr.
Mamoun Medraj for initiating the great opportunity, accepting the challenge and for the
commitment.

v
Table of Contents
List of figures .................................................................................................................. v
Nomenclature ................................................................................................................ vii
Chapter 1 Introduction ................................................................................................................. 1
Chapter 2 Background .................................................................................................................. 4
2.1 Wetting and spreading of brazing filler ........................................................................... 4
2.1.1 Non‐reactive wetting and spreading ....................................................................... 4
2.1.2 The effect of Oxygen at high temperature ............................................................ 11
2.1.3 Alloying element and reactive wetting .................................................................. 19
2.1.4 Brazing filler characteristic flow ............................................................................. 25
2.1.5 Observations and motivation................................................................................. 27
2.2 An overview of the experimental techniques ................................................................ 28
Chapter 3 Apparatus ................................................................................................................... 31
3.1 Design outline ................................................................................................................ 31
3.2 The apparatus subsystems ............................................................................................. 34
3.3 The furnace subsystem .................................................................................................. 35
3.4 The vacuum subsystem .................................................................................................. 40
3.5 The argon subsystem ..................................................................................................... 47
3.6 The control subsystem ................................................................................................... 51
3.7 The imaging subsystem .................................................................................................. 56
3.8 The sample delivery subsystem ..................................................................................... 59
Chapter 4 Testing and Measurements ....................................................................................... 61
Chapter 5 Discussion, concluding remarks, contributions and future recommendations ......... 71
5.1 Discussion....................................................................................................................... 71
5.2 Concluding remarks ....................................................................................................... 78
5.3 Contributions ................................................................................................................. 78
5.4 Recommendations for the future work ......................................................................... 79
References ..................................................................................................................... 80
Appendix A ................................................................................................................... 93

vi
List of Figures
Figure 1 A: The viscous bending in the hydrodynamic approach B: the molecular kinetic approach [52]. ................................................................................................................... 10 Figure 2 The S-shape representation of the influence of oxygen on surface tension, redrawn based on Ricci and Passerone [58]. .................................................................... 13 Figure 3 Schematic presentation of the four characteristic reaction regimes on a log-log diagram, Redrawn based on Costa et al. [64] and Ricci et al. [66] ................................... 16 Figure 4 Schematic presentation of the four reaction regimes influence on the gas-liquid metal surface exchange, Redrawn based on Costa et al. [64] and Ricci et al. [66] .......... 16 Figure 5 The change of the characteristic velocity of the brazing filler (redrawn based on Ambrose et al. [79]). ......................................................................................................... 26 Figure 6 Schematic diagram for the wetting and spreading behaviour testing apparatus. 33 Figure 7 Illustration for the furnace hot core design ......................................................... 36 Figure 8 View of the furnace hot core .............................................................................. 37 Figure 9 View of the furnace hot core during assembly ................................................... 37 Figure 10 Illustration of the control circuit of the furnace ................................................ 39 Figure 11 External view of the furnace controller ............................................................ 39 Figure 12 Internal view of the furnace controller ............................................................. 40 Figure 13 Rotary vane type pump used for rough vacuum ............................................... 41 Figure 14 Oil diffusion pump used for deep vacuum ....................................................... 42 Figure 15 Schematic of the layout for the vacuum and argon subsystem ........................ 43 Figure 16 View of the vacuum subsystem tubing layout .................................................. 44 Figure 17 Standard ISO flanges used to connect between the vacuum components ........ 45 Figure 18 Convection enhanced Pirani gauge .................................................................. 46 Figure 19 X-ray enhanced hot cathode ionization gauge (Bayard-Alpert) ....................... 47 Figure 20 View of the argon inlet line .............................................................................. 49 Figure 21 View of the argon exhaust and safety arrangements ........................................ 50 Figure 22 Control and communication board ................................................................... 51 Figure 23 Valves and sensor synchronization board ........................................................ 52 Figure 24 Control dash panel ............................................................................................ 53 Figure 25 View of the imaging subsystem ....................................................................... 59 Figure 26 View of the sample delivery assembly ............................................................. 60 Figure 27 View of the complete facility to monitor the spreading behaviour of the brazing filler metals at high temperature ....................................................................................... 61 Figure 28 View of the heating panel during operation ..................................................... 62 Figure 29 View of the vacuum control panel during operation ........................................ 63 Figure 30 View of the argon subsystem during operation ................................................ 64 Figure 31 View of a 1 mm sample in the furnace at room temperature ........................... 65 Figure 32 View of a 1 mm sample in the furnace at 1100°C ............................................ 65 Figure 33 Image acquired at a lower resolution ................................................................ 66 Figure 34 The steps used for image analysis .................................................................... 67 Figure 35 Example of a substrate represented by a smooth line ....................................... 69 Figure 36 Example of a distorted substrate ....................................................................... 69 Figure 37 View of the spreading of a large drop hindered by inertia. .............................. 71

vii
Figure 38 View of the spreading of a large drop assisted by inertia ................................. 72 Figure 39 The change of the height of the brazing filler drop (measured from the magnified image) with time .............................................................................................. 74 Figure 40 The change of the width of the brazing filler drop with (measured from the magnified image) time. ..................................................................................................... 75 Figure 41 The change of the left contact angle with (measured from the magnified image) time. .................................................................................................................................. 75 Figure 42 The change of the right contact angle with (measured from the magnified image) time. ...................................................................................................................... 76 Figure 43 The plot of the change of the height of the drop with time on a log-log diagram............................................................................................................................................ 77 Figure 44 The plot of the change of the width of the drop with time on a log-log diagram............................................................................................................................................ 77 Figure 45 View of the control panel during roughing vacuum ......................................... 95 Figure 46 View of the heating controller .......................................................................... 95 Figure 47 View of the control panel during diffusion pump operation ............................ 96 Figure 48 View of the control panel during argon flow operation ................................... 96

viii
Nomenclature
R Drop radius V* Characteristic vilosity (surface tension to viscosity ratio) Ω Drop volum t Spreading time m Constant of ѲD Dynamic contact angle Ѳm Micorscopic contact angle U Wetting velocity FW Contact line driving force K° The equilibrium frequency of the random molecular displacements occurring
within the three-phase zone λ Average distance of each molecular displacement γ Surface tension X Mole fraction Г Adsorption ε° Ratio between the metal to oxygen fluxes Ф Thiele modulus (the ratio of reaction to diffusion rates)

1
Chapter 1 Introduction The choice of joining process for a specific application involves many different
parameters such as cost, joint strength, geometry and dynamic loading. Brazing is an
attractive choice when a permanent joint with high integrity is needed. It is very attractive
for the applications that involve highly engineered materials that can not tolerate
microstructure or shape distortion and residual stresses. Brazing provides a strong,
uniform and leak proof joint and it can be the choice for joining inaccessible parts and
multi component complex geometry assemblies. However, as the braze filler has a lower
melting temperature than the base metal, brazing can face challenges in high temperature
applications [1]. For this, nickel-based brazing alloys are well known for brazing
superalloys and high-alloyed steels for high service temperature applications in industries
such as nuclear and aerospace [2]. One of the main characteristics of nickel brazing fillers
is it contents a relatively high concentration of metalloids (boron, phosphorus and silicon)
as melting point depressants (MPD) that reduce the composition melting point to
somewhere between 1000°C (1832°F) and 1250°C (2282°F) [3]. This property is put into
application in transient liquid phase (TLP) bonding. This brazing technique is based on
the change of the brazing seam composition through the diffusion of the melting point
depressant from the brazing filler toward the base metal until isothermal solidification
takes place. This technique produces joints that can perform at temperatures that exceed
the brazing filler melting point [4]. On the other hand, the brazing as an industrial process
can be challenged by other parameters like the process success rate and reliability. Such
parameters are mostly influenced by the wetting of the work piece by the molten filler
metal. As wetting is essential for the validity of the process and one of its most important

2
evaluation parameters, then the understanding and the ability to assess the filler wetting
and spreading behaviour is essential to control the industrial process.
In its most abstract concept, the triple phase equilibrium wetting configuration was first
described by Young (1805) as a mechanical balance between the energies of the involved
surfaces at their common point of contact. This balance was accordingly characterised by
the macroscopic angle of contact between condensed phases. At the same time, Laplace
(1806) put forward the relation between pressure difference across liquid surface and its
curvature. Dupré (1869) related Young’s contact angle to the work of adhesion through
the liquid surface tension. The three contributions set the knowledge base for the
capillary flow concept [5, 6].
Brazing filler spreading and wetting of the substrate is way more complex than the simple
wetting concept. Reaching the equilibrium state is arrested by solidification and
spreading behaviour is usually dominated by one or more of several competing sub
processes. These sub processes, permanently or temporarily, alter the real nature of the
materials and their interactions at the exact interface. This is especially true in the case of
brazing high service temperature alloys due to the higher affinity for diffusion,
evaporation and reaction at elevated brazing temperatures. Furthermore, the influence of
the trace impurities and the alloying elements can dominate the interface interactions
during the process [7]. This deems the solidified or even equilibrium contact angle
measurement at most non-representative and leaves the industry with no well agreed
upon method to assess the wetting behaviour. For this reason, the exact relation between
the process input parameters and wetting behaviour is not well established. The industrial
practices are usually based on general scientific guidelines, experience and statistical

3
predictions [8]. In high temperature brazing, the critical areas of application and the high
cost of materials imposes the need for a better characterization technique to predict the
effect of the involved industrial practices during the process on its output success and
reliability [9]. Accordingly, this work is motivated to propose a different way to test and
evaluate the spreading of the brazing filler metal. As the new testing approach is not
established yet, there is no commercially available test facility to implement such a test.
This fact set the objective of this work is to provide the mean to implement the proposed
test.
In this thesis, chapter 2 is dedicated to review the current understanding of the spreading
phenomena and to highlight some of issues that influence high temperature wetting
behaviour specifically in brazing. Based on the literature review, this study favoured one
wetting behaviour characterization technique and comments on its potential importance
as a testing method. The chapter ends by an overview of some of the experimental
techniques used to assess high temperature spreading behaviour. Chapter 3 is focused on
the design of the testing facility and the design relation to the process requirements and
the components specifications. The chapter also includes details about the apparatus
implementation. Chapter 4, the details of the test facility basic functions are presented
and followed by the details of the results of testing some spreading samples. The method
used to analyse the data collected from the real test is explained. This data is presented
and discussed in chapter 5. This chapter ends with some concluding remarks
contributions and future recommendations.

4
Chapter 2 Background
2.1 Wetting and spreading of brazing filler
2.1.1 Non-reactive wetting and spreading
2.1.1.1 Static wetting Early attempts to shed light on the wetting and spreading in capillary joining processes
were mainly focused on the relation of equilibrium thermodynamics to the success of the
joining process. A good review can be found in Baily and Watkens [10] and Milner [11].
The concept of equilibrium wetting was established through the earlier studies for low
energy solids and liquids, and was used to study soldering as it takes place at lower
temperatures. Some of the most important issues around this concept are addressed
below.
For ideal surface (smooth, homogeneous, rigid, and non volatile), Gibbs (1876) [12]
suggested three conditions for equilibrium. The first is Young-Dupré equation, the
second is Laplace equation and the third is the balance between the chemical potentials
and gravitational intensities of the fluid components [13]. Massive contributions can be
found in the scientific literature to expand the concept to include the complexities of the
real surface, even though some of these efforts [14-17] ended up questioning the integrity
of Gibbs and Young’s approaches. Wenzel [18] proposed the addition of a roughness
factor to Young equation to account for the difference between the actual surface area
and the geometrical surface area (obtained from measuring the boundary that encloses the
actual surface area). The factor compensate the mismatch between the net change in
liquid surface area and the net corresponding change in solid liquid interface during the
liquid spreading or repelling. The increase of the roughness according to Wenzel’s [18]

5
approach has a magnifying effect on the spreading or repelling of the liquid. This
treatment takes into account the effect of surface roughness with an implicit assumption
that the features of the substrate surface are significantly small. Suttleworth and Bailey
[19] expanded Wenzel’s [18] approach and included the effect of surface features on
spreading. In the course of their work, they explained the surface roughness contribution
to contact angle hysteresis which is used to be attributed only to the chemical
heterogeneity of the surface. Hitchcock et al. [20] studied the effect of the surface texture
on a combination of high and low energy liquids and substrates under thermal and
mechanical disturbance effects. In conclusion, they suggested that the increase in surface
roughness will decrease the wettability of both wetting and non-wetting liquids. They
suggested as well that the effect of roughening the surface reduced by increasing the
liquid thermal or mechanical energy. Cassie and Baxter [21] expanded Wenzel’s
reasoning beyond physical heterogeneity to include chemical heterogeneity. In this
treatment, the contact angle is considered to be the sum of the contact angle values for
each surface domain multiplied by its fraction of the surface. Cassie [22] discussed the
difference between the advancing and receding contact angle in terms of multi-molecular
adsorption theory to indicate that the advancing contact angle can be unique, whilst the
receding one generally less than the advancing and should not have a unique value. Li
and Neumann [23] argued that in spite of the fact that Wenzel’s and Cassie’s treatments
identified the appropriate equilibrium contact angle for heterogeneous surface, still it is
not very useful. As for a heterogeneous surface there are different metastable contact
angles.

6
To establish the relation between the equilibrium contact angle and spreading, Harkins
and Feldman [24] proved that the spreading or non-spreading of a liquid can be presented
through a very simple thermodynamically determined coefficient called the spreading
coefficient. The spreading coefficient is the result of simple comparison of the work of
adhesion between the liquid and the substrate, which drives the spreading, and the work
of cohesion of the liquid which resists the spreading. According to Padday [25] the first
concept of the spreading coefficient is attributed to Dupre (1869). In a tutorial fashion
Youst [26] reviewed Gibbs thermodynamics of capillary, with focus on nonreactive
spreading process and utilized Buff-Goodrich [27-29] vector approach to calculate
various meniscus shapes and wetting forces.
2.1.1.2 Spreading and wetting dynamics While static wetting describes the equilibrium state, the process by which the final state is
achieved is described by wetting dynamics [30]. Milner [11] analyzed the brazing joint
filling in analogy to the fluid flow in a pipe. The filler metal driving force was calculated
from the surface tension theory and the flow resistance was determined from the fluid
flow theory using Newton-Poiseuille streamline flow [31] approach. This approach is
widely cited to provide some qualitative analysis to relate the measured contact angle to
brazing filler spreading in spite of the fact that Milner’s calculations showed that the
model failed to predict even the order of magnitude of the experimental data reported in
the literature [32].
Wetting dynamics as a phenomenon is a vast area of research and researchers in the field
of fluid dynamics are keen on separating the different physical regimes to be addressed
with key experiments and simplified analysis. For example, to reduce the gravity effect,

7
smaller drops can be used. The size of the system has to be very small in comparison with
its characteristic capillary length in order to neglect the effect of the gravity. On the other
hand, the capillary driven spreading, as an irreversible thermodynamic process, is energy
dispersive. Accordingly, in most of the work done to study the capillary spreading
phenomena, the driving force is calculated from unbalanced Young forces, while the
energy dispersion channels is diversely considered [33]. To bring into attention the state
of the art understanding of the phenomena some of the significant contributions in this
regard will be reviewed. In this context Schonhorn [34] measured experimentally the rate
of change of the dynamic contact angle toward its final value, for a spherical drop, and
correlated it to the change in the drop radius, surface tension and viscosity. Newman [35]
substituted Schonhorn’s time dependent contact angle into Poiseuille’s law to predict the
rate of penetration in capillaries and slits. Based on these two contributions, Yin [36]
derived a formulism for the spreading of a spherical cap shaped droplet on a smooth
horizontal surface. He assumed that spreading is promoted by net surface tension at the
interface only and retarded by the viscous friction in the bulk of the liquid. Later on
Hoffman [37] tested the forced flow of silicon oils on a glass capillary where it was
concluded that the apparent contact angle is a function of the capillary number. In another
approach, Voinov [38] introduced formalism for the hydrodynamics of wetting. The two-
dimensional motion of a liquid with a free surface was considered. In this formulism the
dynamic contact angle was considered at the microscopic scale, the boundary conditions,
and the scope of application for the hydrodynamic description of the fluid were
established. The change of the surface energy and the work of the surface forces were
considered equal to the energy dissipation due to viscosity and the energy dissipation at

8
the microscopic scale. Different aspects of spreading phenomena were explained based
on the provided solution, including the previous findings that the spreading of liquids of
the same viscosity on different smooth surfaces occurs in a similar manner. Voinov’s
calculations showed that for spontaneous spreading of a spherical droplet, which
completely wet the substrate, the droplet radius is proportional to the time with the power
of one tenth. In another development Tanner’s [39] experiment revealed a relation
between the edge velocity and the free surface maximum slope that occurs at an
inflection point close to the moving wedge. This relation corresponds to a power
exponent of 2/3. It is concluded, based on the data analysis, that the edge velocity is
approximately proportional to the cube of the slope at the inflection. In light of these
contributions, Lelah and Marmur [40] tested the spreading of water and some other
liquids on glass. The graphical representation of their data and some other data from the
literature showed a power low relation between the spreading area and the time for both
of complete and partial wetting cases. Whereas in a review of the wetting statics and
dynamics, de Gennes [41] discussed the energy dissipation channels of the hydrodynamic
theory and suggested that the processor film plays an important role in the process. Based
on the work of Hoffman [37], Tanner [39], and Lelah and Marmure [40], a power law
relation had been proposed between time and the drop radius at constant volume and the
characteristic velocity (surface tension to viscosity ratio ) as represented by equation
(1) [41].
Ω ( ) The contradiction between the hydrodynamic theory utilization of the traditional no-slip
boundary condition, and the moving wedge led to the divergence of Navier–Stokes

9
equation solution were the forces exerted by the liquid on the solid become infinite. For
this reason, the no-slip condition has to be released at a certain distance from the contact
line [42]. Different models varied in their assumptions of the viscous dissipation
mechanisms and in their treatments for the distance where the no-slip condition has to be
released and in the range of contact angle treated [41, 43, 44].
On the other hand, Blake [45, 46] departed from the continuum solution in the molecular
kinetic theory to utilize what is introduced as Frankel / Eyring [47, 48] view of liquid
transport. Wetting is described as energy activated hopping of the molecules between
adsorption sites in the three phase zone. The motion of the contact line is determined by
statistical dynamics of the molecules adsorption and desorption and is assumed to be a
stress modified molecular rate process. The molecules in the three phase zone have to
overcome energy barriers to advance or recede, considered as the wetting line friction,
while the surface tension out of balance is the driving force. The macroscopic dynamic
angle is linked directly to the triple line motion. In its simplest formulation the molecular
kinetic approach oversees the viscous interaction between the bulk liquid molecules. On
the other hand, Voinov [38] pointed out that when the velocity is sufficiently small, the
hydrodynamic effect is unimportant and referred to other phenomena to take over such as
Blake’s [45] liquid kinetics approach. This led other researchers [49-51] to work on
hybrid models to integrate the hydrodynamics of wetting and the contact line friction
together.
Blake [52] introduced a brief comparison between the different models as depicted in
Figure (1).

10
Figure 1 A: The viscous bending in the hydrodynamic approach B: the molecular kinetic approach [52]. At the beginning of the spreading process, wetting forces are still fresh and overcome
easily the viscous resistance, the contact line moves fast with nearly constant
configuration at the triple line. In this phase, the liquid inertia resists the motion and
dominates spreading. The contact line speed is damped by the rate at which the liquid
moves from the drop bulk to the triple line, driven by the difference in the capillary
pressure. As spreading goes along, the driving forces decrease as well as the contact
angle, accompanied by increase in the viscous friction, both leads to damp the speed of
spreading and the reduction of inertia forces till the crossing to a hydrodynamic
dominated wetting. Eustathopoulos et al. [53] explained based on previous experimental
observations and simple calculations that for liquid metal viscous friction can be
important only in very late stage of completely wetting systems.
2.1.1.3 The effect of high temperature In an attempt to correlate between the on going efforts to understand the low-temperature
spreading phenomena and the less addressed high-temperature spreading, Size et al. [54]
studied the non-reactive spreading of liquid metal and oxides on molybdenum substrate,

11
using drop transfer technique with high-speed videography. It had been found that for
liquid metals, the models based on the viscous dissipation predicted triple line speeds
higher than the experimentally recorded ones. The molecular kinetic model was more
representative in triple line speed prediction, temperature dependence of the liquid-solid
friction, and the solid-liquid wetting activation energy. For the higher viscosity oxide
droplets, the combined model used successfully to predict spreading. This led to the
conclusion that the molecular interaction energies of liquid molecules, appears as a
higher surface energy and work of adhesion in high-temperature liquids, play a
determining role in the dominant spreading energy dissipation channel.
2.1.2 The effect of Oxygen at high temperature
In this section, some of the work done to understand the most important effects of the
presence of oxygen in the atmosphere of high temperature brazing process will be
discussed. It is not unusual for the researchers to emphasize on the influence of the
oxygen content in the atmosphere of high temperature interfacial experiments and
processes. It can be said that the oxygen content is one of the hardest to control
parameters in these experiments and processes [55]. It is literally impossible to eliminate
oxygen existence in the process atmosphere as it is one of the biosphere constituents and
also comes out of the humidity decomposition at high temperatures. The influence of
oxygen on the high temperature processes is a combination of complex effects, one or
more of these effects might end up dominating the whole process. It is essential here to
bear in mind that the important difference that distinguishes the surface and interfacial

12
properties from the bulk properties is that, a very small amount of surface active
components, at the level of few parts per million can dramatically change the surface
tension and its temperature dependency [56].
Thermochemistry of oxide formation and disassociation during high temperature brazing
process is adequately shown in the work of Milner [11]. The equilibrium
thermochemistry of oxide formation can express the energetic potential for the bulk
oxidation reactions. However, a lot of work is done to establish the understanding of the
kinetic and interfacial energetic influence of oxygen on the high temperature processes.
Some of this work will be highlighted hereafter.
In an approach to estimate the effect of a strong surface active solute on the surface
tension of liquid metals, Belton [57] represented group VI elements fractional coverage
of the surface in Gibbs isotherm by Langmuir (ideal site-fillage) isotherm, to evaluate its
degradation to the surface tension of liquid metals. The resulted isotherm found to be a
very good representation for the available data. In another attempt using the available
data also, Ricci and Passerone [58, 59] investigated the effect of oxygen on the surface
tension of a group of liquid metals at constant temperature. Surface tension as a function
of the oxygen partial pressure (from a very low value close to zero up to the liquid
saturation) shows typical sigmoidal curves. A model was presented to describe this
behaviour based on Fowler-Guggenhime [60] isotherm and the assumptions are: 1) the
system adsorption can be described by a monolayer and 2) only the nearest neighbour
interactions are effective. The model considered the transfer of oxygen atoms from the
liquid bulk to the surface free sites (surface segregation reaction). The dependence of the
surface tension on the oxygen content is divided into three regions of the sigmoidal

cu
th
th
ox
ar
su
th
ox
FR B
th
al
al
se
m
v
urve. In the
he surface; th
he second r
xygen-oxyg
round it by o
urface oxyge
he surface te
xides start to
igure 2 The S-Ricci and Passe
Based on the
he effect of
lloys. To ac
lloys, Lee et
essile drop
markedly by
ariation of c
first region,
he surface te
region, whe
en atoms in
other oxygen
en concentra
ension decre
o appear on t
-shape represerone [58].
ese contribu
sulphur and
chieve more
t al. [62] stud
technique.
y increasing
chromium w
at a very dil
ension show
en the surfa
nteractions, e
n atoms. The
ation up to th
eases almos
the surface o
entation of th
tions, Yuchu
d oxygen pr
understandi
died the surf
It was foun
the oxygen
with fixing t
13
lute solution
ws a linear de
ace oxygen
each atom p
e surface ten
he oxygen m
st in a logar
of most of th
e influence of
u et al. [61]
resence on t
ing of the ox
face tension
nd that the
n content a
the oxygen c
n, there are a
ependency on
concentratio
prevents the
nsion change
maximum ad
rithmic func
he metals.
f oxygen on su
used Belton
the surface
xygen influe
of liquid Fe
surface ten
and fixing t
content show
a large numb
n the surface
on is suffic
occupation
es in a steep
dsorption. In
ction up to
rface tension,
n’s [57] equ
tension of s
nce on the s
e-Cr-O alloy
nsion of the
the chromiu
wed almost
ber of free si
e compositio
cient enough
of the free
function wit
n the third re
saturation w
redrawn base
uation to esti
steels and n
surface tensi
ys at 1823K u
e alloy decr
um content.
no effect o
tes at
on. In
h for
sites
th the
egion,
where
ed on
imate
nickel
on of
using
reases
The
n the
14
surface tension. The variation of both oxygen and chromium content showed a steeper
decrease in the surface tension of the alloy with the increase of oxygen at higher
chromium content. As the surface tension of Fe-Cr alloy has no composition dependence,
this decrease in surface tension can be attributed to the stronger affinity of chromium to
oxygen.
Surface tension degradation is not the only influence of oxygen presence in the
atmosphere of high temperature metallurgical processes. Turkdogan et al. [63] concluded
on a theoretical base that the rate of vaporization in a stream of neutral gas should
increase with the increase of the partial pressure of a reactive gas such as oxygen. The
increase of the oxygen partial pressure increases the oxygen flux towards the metal
surface; this in turn decreases the thickness of the boundary diffusion layer which leads to
increase the metal evaporation rate. As the oxygen partial pressure further increases, the
oxygen flux toward the surface accordingly increases till a critical point where the metal
evaporation rate reaches a value near the rate of evaporation in vacuum. Any further
increase in the oxygen partial pressure, the flux of oxygen towards the surface becomes
greater than the metal flux and surface oxides form. Experimental results verified the
validity of these theoretical considerations. On a broader base Costa et al. [64] considered
the rates and sequence of diffusion and reaction in the gas phase, which controls the gas-
metal surface exchange, to evaluate the oxygen concentration near the surface of the
liquid metal and the effective oxygen supply to the liquid phase. Based on Astarista [65],
four characteristic reaction regimes where defined based on the evaluation of the Thiele
modulus Ф (the ratio of reaction to diffusion rates) and ε° parameter (the ratio between
the metal to oxygen fluxes). The first regime (Figures 2- and 3- a) the reaction is slow

15
enough not to affect the gas-metal surface exchange. The second regime (Figures 2- and
3- b) is a fast reaction with excess oxygen, in such a case all the metal vapour gets
consumed and the reaction is confined near the metal surface. The excess oxygen is the
actual oxygen supply to the surface. The Third regime (Figures 2- and 3- c) is a fast
reaction with excess metal vapour, in this case all the oxygen is consumed and the
reaction is confined to the atmosphere side of the boundary diffusion layer. The fourth
regime (Figures 2- and 3- d) is instantaneous reaction and it is confined to a narrow
intermediate region inside the boundary diffusion layer. Based on this approach, Ricci et
al. [66] provided a kinetic-flow dynamic description for the process that might take place
at the liquid vapour interface in the presence of an inert carrier flow containing definite
amount of oxygen. This description leads to the determination of the possible reaction
regimes based on a graphical evaluation of the relation between ε° and the Thiele
modulus Ф on a log-log diagram. This approach allows the definition of the stability field
for a chosen oxide. This description of the process at the interface allows a kinetic-fluid
dynamic description of the system by knowing the flow parameters and the geometry of
the experimental setup. The different possible regimes are illustrated in Figures (3) and
(4).

16
Figure 3 Schematic presentation of the four characteristic reaction regimes on a log-log diagram, Redrawn based on Costa et al. [64] and Ricci et al. [66]
Figure 4 Schematic presentation of the four reaction regimes influence on the gas-liquid metal surface exchange, Redrawn based on Costa et al. [64] and Ricci et al. [66]

17
On the other hand, for a system under Knudsen regime, Castello et al. [67] modeled the
process of oxygen exchange at the interface between a gas and a liquid metal. In this
model, global fluxes of metal and oxygen were considered, taking into account the
double contribution of molecular O2 and the volatile oxides to the oxygen content. As the
vacuum discharge keeps the system out of equilibrium, non-equilibrium steady-state
conditions are obtained when the degree of saturation remains constant. Such steady-state
conditions are used to express the oxygen activity in the liquid as a function of the
residual oxygen pressure and the vapour pressure of the volatile oxide in the system. The
thermodynamic driving force in this scenario is function of the concentration gradients.
Based on each region across the interface, four steps of mass transfer were taken into
account; mass transfer inside the liquid phase, liquid-interface mass transfer, interface-
gas phase mass transfer, and mass transfer in the gas phase. Based on the assumption that
the transport process in the gas phase has no influence on the total mass exchange at the
interface (due to the large mean free path of gas molecules in a system under Knudsen
regime), the interface mass transport was considered to be mainly controlled by interface
phenomena and by oxygen penetration equilibrium inside the liquid. The model utilized
kinetic coefficients in its thermodynamic based equations to account for the transport
kinetics. The work came short in terms of justification and explanation of these
coefficients.
In an effort to find the best compromise between a higher metal evaporation rate at
higher vacuum and higher oxidation potential at higher atmosphere dew point, Sakamoto
[68] measured the area of spreading and the final contact angle of several selected high
temperature brazing filler drops and substrates as a function of the pressure and the inert

18
gas (argon) flow. It had been concluded that a very low level of atmosphere impurities
can be maintained by the control of the argon flow rate and the furnace pressure in the
pumping range of the mechanical evacuation without deteriorating the joint mechanical
properties.
Meclean and Houndors [69] pointed out that at early stages of oxide formation the
interface energies at the metal oxide and the oxide vapour interface may contribute
significantly to stable oxides formation at oxygen potentials below those derived from
bulk oxide thermodynamic data. For high temperature alloys that form in soluble non-
vacuum degradable oxide layers, like alumina formers, heating in vacuum produces an
imperfect oxide film at the surface. Wall and Milner [70] investigated experimentally the
mechanism of surface oxide film removal by liquid metals in vacuum of some alumina
forming alloys. By heating different specimens of different aluminum content in air
subsequent to heating in vacuum, it had been observed that the ones contain more than
1% aluminum had developed a considerable oxidation resistance during the vacuum heat
treat compared to these with less aluminum content. In other test, aluminum containing
alloys showed a visible oxide film when heated in air, but subsequent heating in vacuum
led to the disappearance of this film. It had been concluded that aluminum containing
alloys encounter a selective oxidation process in vacuum were the lower atmosphere
content of oxygen allows enough time for aluminum atoms to diffuse out of the bulk to
form a transparent layer of alumina. A combination of the aluminum containing and
selectively oxidized samples with non aluminum containing ones were used in spreading-
drop test. Spreading under the oxide film was verified by the observation of lifting the
oxide layer adjacent to the spreading front. Experimental observations led to believe that

19
metal penetrates the oxide film by vapour phase diffusion. On the aluminum containing
samples the spreading process were related to the mutual solubility between the liquid
metal and the substrate. While limited solubility led to good spreading, large solubility
led to substrate erosion with limited spreading. The samples that contained no aluminum
were not affected by solubility. It had been further noticed that if the furnace partial
pressure exceeded “Critical Value”, specific for each alloy, the surface oxidizes
substantially and the brazing cannot be accomplished satisfactorily.
2.1.3 Alloying element and reactive wetting This section will be dedicated to review some of the work performed to understand the
importance of alloying elements and surface reactions.
Wetting behavior and adhesion are strongly affected by the presence of oxides at the
wetting front. Some alloying elements are usually added to the brazing paste to
undermine, dissolve, or react with surface oxides, or at least, to improve wetting and
adhesion over the oxide surface.
Skapiski [71] presented a simple model to relate the surface tension to the heat of
vaporization. Based on the test of the model Skapiski concluded that the calculated
surface tension values for liquid metals show a negative deviation from its experimental
values. This deviation was blamed on the model shortage in counting for the contribution
of the change in the electrons kinetic energy at the surface. However, Wassink [72]
presented the same model (even more simplified by neglecting the surface tension
temperature coefficient) for rough surface tension estimation. Based on this approach and
Gibbs surface thermodynamics, the latter indicated a relation between the heat of alloying
for random solutions and the interfacial tension. As the solubility at a specific

20
temperature depends on the entropy of mixing as well as the heat of mixing, Wassink
went to evaluate the possibilities of their combined effect. This confirmed the
experimental findings that metal with no mutual solubility should show poor wetting
behavior. Even though this approximate model is not sufficient to calculate the wetting
contact angle, the model and the argument behind it are used to explain the role of
alloying elements in commercial brazing alloys. For the base metal filler combinations
that are insoluble in each other, a limited addition of an alloying element that is soluble in
both can enhance their wetting characteristics. It had been demonstrated that the basic
assumptions of the model cease to hold for combinations that form intermetallics.
In an effort to describe the role of alloying element on the non-reactive wetting of iono-
covalent oxide by liquid metal, Li et al. [73] estimated the trend of change of contact
angle and work of adhesion with the concentration of infinitely dilute solution in the
matrix of another metal. The monolayer model for the surface of regular solutions was
used to describe the surface tension for a binary liquid metal in contact with an external
phase. At first, to describe the surface tension of the liquid alloy, the external phase was
replaced by vacuum. The liquid-oxide interface is then described using the surface
tension model after adding the bond energy between the metal and the oxide atoms. For a
system in which the molecular exchange energy over temperature ratio is very negative
(or very positive) the model could only predict the sign and the order of the magnitude
for the surface tension slope for high volume fraction of one constituent, i.e., for the
extremes of the binary isotherm. For this reason, Li et al. [73] focused on the trend of
change rather than the exact magnitude of the change. According to this model [73], it
had been concluded that the adsorption of the solute at the liquid metal oxide interface

21
can be divided into the adsorption of the solute into the free liquid surface and the
adhesion to the oxide. Based on the comparison between the surface tension and the work
of adhesion of the solute and the matrix to the substrate, different types of isotherms for
the work of adhesion and contact angle were considered. The authors demonstrated the
applicability of the isotherm to the representative systems in the literature [73]. In
conclusion, it had been proposed that a lower solute surface tension and a higher
adhesion with the oxide in comparison with that of the matrix should result in lower
contact angle and higher work of adhesion between the binary alloy and the oxide. Under
these conditions, repulsive or attraction interaction (between the solute and the matrix)
should accordingly lead to amplifying or attenuating this effect, respectively.
To study the wetting enhancement mechanism by a non-reactive alloying element
addition to a system that encounter poor wettability, Kritsalis et al. [74] studied the effect
of chromium addition to the system copper alumina. In this work, the first assumption
that is chromia forms from the reaction of chromium with the dissolved oxygen or from
the reduction of alumina was rejected based on the analysis of solidified drop in the bulk
and at the interface (The micrograph of the interface showed no evidence of alumina
dissolution). Still though, based on the experimental evidences the authors related the
increase in the work of adhesion and the reduction of the contact angle to the oxygen
mole fraction in the liquid. The reduction in the interfacial tension was related through
Gibbs adsorption isotherm to the oxygen activity rather than its mole fraction. The
authors showed by thermodynamic analysis that in the absence of chromia, the chromium
in the alloy should result in a considerable decrease in the oxygen activity in the liquid. It
means that the oxygen is not responsible for the increase in the work of adhesion. This

22
led to believe that the active species at the interface should be chromium monoxide CrO
clusters, which were adsorbed strongly at the metal-oxide interface because of the iono-
covalent character of CrO.
Aksay et al. [75] studied the wetting phenomena under chemical equilibrium and non
equilibrium conditions. Based on Johanson’s [15] treatment for Gibbs surface
thermodynamics approach, wetting equilibrium was analyzed rigorously. This led to the
correlation between the interfacial energies, the interfacial areas, and the contact angle
configurations at the triple point. For wetting under chemical equilibrium conditions, the
formation of the solid liquid interface was considered in analogy to the formation of a
solution between the liquid and the vapor phase. The construction of this interface is
considered as the result of the readjustment of the particles, which were originally part of
the solid vapor and liquid vapor interfaces, to minimize the structural discontinuity and
maintain equilibrium across the interface. Even though, the value of equilibrium surface
tension has to be between the solid vapor and the liquid vapor value. If it is greater than
both, then true interface does not form, while if it is less than both a transient condition,
involving chemical reaction, will take place. It had been proposed that the specific free
energy of the reaction at the involved interface contributes to the value of the interfacial
tension. This contribution results in negative surface energy during the reaction, which
promotes spreading or emulsification, unlike the equilibrium surface energy which
always has a positive value in comparison to the bulk. Based on this argument, Aksay et
al. [75] provided a detailed description of the spreading scenarios in the cases where the
liquid or the solid is not saturated with some or all of the other phase constituents. The
authors mentioned that the same reasoning applies to the cases where both of the solid

23
and the liquid are not saturated with each other’s constituents and to the compound
forming reactions.
To test Aksay et al.’s [75] argument, Espie et al. [76] designed an experiment that
allowed the change of Gibbs free energy of the interfacial reaction, which means the
change of the specific free energy of the reaction at the involved interface, while keeping
the same interfacial chemistry. This was approached using a drop of titanium containing
alloy, with fixed titanium activity, on three different oxide substrates that exhibit different
reactivity with respect to the liquid alloy. The final measured contact angles on the three
substrates are equal. The role of titanium in enhancing wettability was attributed to two
effects. The first is the reaction of the dissolved oxygen in the liquid alloy to form surface
active species that get adsorbed on the interface and reduce the interfacial tension, while
the second is the formation of an intermetallic layer at the interface that shows better
wetting characteristics than the original substrate. This led to the conclusion that the
contribution of the specific free energy of the reaction, at the involved interface, is
negligible to the wetting processes and the final wetting angle is that of the liquid on the
interfacial products. However, Espie et al. [76] admitted that the free energy of the
reaction could contribute to the wetting process in some other cases, when the reaction is
heavily localized at the triple line.
To test the effect of reaction rate on the contact angle and the wetting kinetics, Landry et
al. [77] compared the effect of changing silicon mole fraction as a reactive alloying
element on the wetting behavior of copper-carbon and copper-silicon/carbide systems.
They concluded that the reaction products of the first system (copper-silicon alloy on a
carbon substrate) is silicon carbide, in spite of the difficulty to demonstrate that through

24
experimental analysis as it is not easy to screen carbon owing to the thinness of the
reaction products layer. Based on the same experimental analysis, they mentioned that the
layer of reaction products is grown outside the area of contact between the liquid alloy
and silicon carbide substrate before cooling. For the second system (copper-silicon alloy
on silicon carbide substrate), the analysis showed no trace of reaction except a very slight
dissolution of the substrate, just enough to saturate the liquid drop with carbon. It was
observed from the plot of the contact angle variation with time at the tested compositions
for both systems that the final contact angle for all the studied cases is around the same
value. This final contact angle was considered to be the equilibrium contact angle for the
system copper-silicon alloy on a silicon carbide substrate. However, the rate of the
decrease in the contact angle, from its initial value, increases with the increase of the
silicon mole fraction. It had been observed for the second system that the contact angle
decreaseing rate is of several orders of magnitude higher than the characteristic rate of
non-reactive systems, in spite of the absence of experimental evidence for reaction
existence. This contradiction was justified by the existence of an oxide reduction
reaction. The silicon oxide SiO2, forms on the drop and substrate surfaces during heating,
was reduced by the excess silicon in the drop to a gaseous silicon monoxide SiO which
gets dissipated in the atmosphere. The comparison of the graphs reported in [77] at a 25
at. % silicon showed three distinguishable spreading stages for the first system and only
two stages for the second. The first stage was considered related to oxide reduction
reactions in both systems, and not a characteristic of the studied system. While the last
spreading stage in both of the systems was considered for spreading over silicon carbide
till equilibrium. The middle stage in the first system was attributed to the interfacial

25
reaction between the alloy and the carbon substrate. As the work of adhesion and the final
contact angle did not change by the change of the reaction rate, it had been concluded
that interfacial free energy contribution to the reactive wetting driving force is negligible.
The authors proposed that the final contact angle and reaction kinetics are independent of
the type of interfacial reaction that might exist beyond 100 seconds. Nevertheless, for
faster reactions, the contribution of the interfacial reaction free energy cannot be
excluded from wetting driving force.
2.1.4 Brazing filler characteristic flow Ambrose et al. [78] experimentally examined the wetting behavior of eutectic Ni-P
brazing filler alloy on several laboratory produced Fe-Cr and Fe-Cr-Ni work pieces as
well as commercial martensitic, austenitic steels and nickel based supper alloys. The
spreading tests were followed by a careful examination of the sample features to predict
the chemistry behind the observed spreading behavior. The resulted observations were
summarized by Ambrose et al. [79] and the data were analyzed in consideration of the
fundamental models of liquid flow. The log-log plot of the drop radio variations with
time showed some characteristic curvature indicating sophisticated behaviors, still though
the data could be fitted around a straight line with a slope of (0.13 to 0.16). For Yin’s
[36] model to be satisfied the slope should be 0.2 and for de Gennes [41] model to hold,
the slope should be 0.1 (provided that the integration constant was neglected and the
power of the apparent contact angle from Hoffman relation (m) was fixed to 3 according
to de Gennes [41]). Ambrose et al. [79] tested the applicability of de Gennes’ relation by
presenting the data on a log-log plot between the drop radios R and the contact line speed
dR/dt, both normalized to their values at 5 seconds. The plot showed a quantitatively

26
similar behavior for all the substrates where three characteristic stages for spreading were
distinguished. The first and last have a slope of -2.5 and -4.5, respectively, while the
slope of the middle stage was slightly positive as can be seen in Figure (5). It is worth
noting that according to de Gennes [41], the slope of the first and last stage should be
around 3.
Figure 5 The change of the characteristic velocity of the brazing filler (redrawn based on Ambrose et al. [79]). The deviation of the slope of the first and the last stages (when the system is considered
microstructurally stable) from de Gennes [41] model was justified by the change of the
liquid volume resulted from the substrate dissolution. The middle stage is related to the
production of a new phase at the interface. This stage did not show a power low behavior
but the data were fitted empirically by an exponential relation. The authors showed that
this relation is also successful to describe the behavior of some other systems from the

27
literature that encounter compound formation from the reaction of liquid metal with
ceramic substrates. This led to believe that the proposed empirical equation may
represent the characteristic behavior of broad class of liquid spreading where reaction
occurs with the substrate. Even though de Gennes’ [41] relationship was applied when
the substrate was microstructurally stable, the work of Ambrose [80] showed that the
spreading rates were by far slower than those predicted by de Gennes [41] model.
Ambrose [80] suggested, based on the experimental observations, that oxide reduction by
dissolution acted as an additional damping force.
In spite of the importance of the current work for modeling the spreading behavior of
brazing alloys, it can be more important in characterizing the industrial process behavior.
2.1.5 Observations and motivation
It is important to realize that the most significant work of Schonhorn [34], Hoffman [37],
Tanner [39], Lelah and Marmur [40] and Ambrose et al, [79] relied mostly on
experimental curve fitting. At the same time, it is obvious from the work of Ambrose et
al. [79] that the graphical representation of the brazing filler flow data displays well, the
stages and trends of the brazing filler flow process, regardless of their real complexity.
This representation can reveal the influence of the input parameter on the actual
spreading behavior during the brazing process. This approach might lead to defining the
exact window of operation for the process based on the dominant parameters.
The mean to monitor the brazing drop spreading in a real environment at high
temperature with a redundant flexibility to change the process input parameters is needed.
As the required equipment is not available commercially and it is usually customized for

28
the purpose, this work will be dedicated to the detailed design, construction and testing of
an apparatus suitable to study wetting and spreading behavior at working condition
similar to those used during brazing operations. During designing this equipment all the
concerns and concepts in this chapter were taken into consideration (as will be discussed
in chapter 3).
2.2 An overview of the experimental techniques It is usual to find authors in the literature who emphasize on the lag of high temperature
spreading experimental work than its low temperature counterpart [54]. It is quite logical
to guess that the sensitivity of the process and the capital cost of the equipments increase
with the increase of the temperature of the experiment. This becomes significant at
elevated temperatures where controlling the atmosphere becomes complex and even
challenging to a certain extent. At the same time, the material selection becomes critical
where it has to account for temperature, atmosphere and reactivity challenges [81]. Two
major approaches are used to monitor high temperature liquid spreading; the first is using
a hot stage with an optical or scanning electron microscopy, the second is using a high
temperature furnace with imaging capability [78, 82-88]. The first method can reach a
higher magnification. High magnification is desirable in the experimental set-ups.
However, it implies that the monitoring screen should be in close proximity to the sample
which can lead to the condensation of vapors from the high temperature liquid on the
colder monitoring screen. More than that, the optics and the monitoring screen should be
able to tolerate the high temperature and the chamber should stay vacuum-tight at low
and high temperatures [86].

29
In the following part, an overview of the equipments and techniques used to evaluate
solder and brazing filler spreading, equilibrium contact angle and liquid metal surface
tension will be presented. Different techniques can be found in the literature to evaluate
spreading including transferred, dispensed and spreading drop methods. At the same
time, equilibrium contact angle measured using Sessile drop and Wilhelmy plate
methods, while sessile, confined, pendant, and oscillating-levitating drop methods used to
measure the liquid surface tension [53, 78, 99]. Sessile and spreading drop methods are
by far the most used due to their simplicity and ease of implementation. However, they
are criticized to be affected by solid and liquid surface contamination during heating and
the confusion between sample melting and spreading in early stages [53]. On the other
hand, Wilhelmy plate is criticized to be measuring non-equilibrium contact angle and for
this reason some researchers used the approach to measure the dynamic contact angle, but
it also measures the force driven dynamic contact angle and bypasses the complexity of
liquid contamination [13, 100]. The same criticism applies to the transferred and
dispensed drop methods where the drop is driven at the beginning of the transfer by
inertia. These methods are also blamed for the complexity of the approach and the fact
that for reactive liquid metal, there can be interaction between the liquid and the drop
dispensing mechanism [53]. In some cases, special techniques are used, like tilted drops
and drop shearing by moving objects to measure the advancing and the receding contact
angle. In other cases, the spreading of brazing filler in slits was monitored to resemble the
actual brazing gap [101, 102].

30
In all of the techniques used in the literature, heating method was either resistive or
inductive. While inductive heating is faster temperature control is easier and more
accurate in resistive heating [103].
Imaging techniques varied from still photography, videography and flash videography
and samples were illuminated by light or X ray [104, 105]. The contact angle and the
spreading area use to be measured from the hard images at early times. This was replaced
by specialized hardware for edge detection as a part of the video circuits and specialized
software based on thresholding and other edge detection techniques in imaging software
era [106].

31
Chapter 3 Apparatus
3.1 Design outline The goal of this work is to build a testing facility that can satisfy the demanding
conditions required to study the wetting behavior of elevated service temperature
materials used for capillary joining process. The equipment should also provide the
capability to monitor and record the spreading behavior of the brazing filler metal under
precisely controlled experimental parameters.
The joining environment requirements for Inconel718 as substrate, which is considered as
one of the brazing environment sensitive nickel superalloys because of its titanium
contents, and nickel filler metal AWS BNi-2 are used as a reference for the apparatus
design. Based on the properties of these materials the furnace hot zone maximum
operation temperature is selected to be 1450°C (2642°F). This exceeds the melting
temperature of the metalloids containing nickel brazing filler alloys which is in the range
of 1000 to 1250°C (1832 to 2282°F) [3].
A pre-brazing vacuum stage is needed to bring the brazing chamber and the sample
surrounding environment to vacuum of at least 1х10-5 torr before heating the sample.
This brings the chamber to the range of the dry-down vacuum zone to allow the best
possible removal of the adsorbed oxygen, moisture and the volatile organic compounds in
appropriate time [107].
Precisely controlled flow and partial pressure of high purity argon are needed. This will
allow the evaluation of the effect of argon partial pressure on the spreading behavior of
brazing fillers. Where the brazing chamber partial pressure is a compromise between the

32
higher amount of atmosphere impurities, such as oxygen and water vapor, which result
from the increase of the argon partial pressure and the evaporation of the volatile braze
filler contents that result from the increase of the vacuum at the test temperature [68].
Sample insertion to the hot zone should take place after the required temperature has been
reached to acquire rapid sample heating. This is needed to achieve high sample heating
rate that results in limiting the diffusion of melting point depressant (MPD) from the
braze filler toward the bulk or the surface of the substrate prior to the melting of the braze
filler. Melting point depressant diffusion out of the brazing filler prior to spreading leads
to MPD depletion of the sample. MPD depletion might cause isothermal solidification on
the sample periphery which in turn entangles spreading [108].
The droplet diameter estimated to be between one and three millimeters, this should
minimize the effect of gravity on spreading to a negligible limit, and the substrate is
around one square centimeter.
An externally heated tube furnace with 1.5 inch (3.8 cm) tube diameter is found to be the
best suggested fit considering the sample size and the requirements of environment
control. The choice of a vacuum tight tube with standard vacuum flange end-caps for the
hot zone is an easy to implement and affordable design. One of the end-caps should be
connected to a viewing port within not more than 35 centimeters form the sample to
enable the special optics to acquire the droplet image in the hot zone at an acceptable
zoom to monitor the spreading phenomena. An illustration of the furnace design based on
similar systems in the literature [68, 87, 89-98] is shown in Figure 6.

F
T
S
te
th
ac
th
en
m
igure 6 Schem
The need of
ilica glass
emperature
hermocouple
ccurately us
he furnace tu
nds does no
manufacturer
matic diagram
the hot zone
(fused qua
is 1200°C
e for the fu
sed for a ma
ube to the va
ot exceed 20
r technical in
for the wettin
e temperatur
artz) for th
(2192°F) [
furnace temp
aximum of 1
acuum end-c
00°C (392°F
nformation.
33
ng and spread
re to exceed
he furnace
[109]. For
perature co
1250°C (228
caps impose
F) in case o
Because of
ding behaviour
d 1250°C (2
tube becau
the same r
ontrol is als
82°F). The n
e that the tem
of using Vit
f the need t
r testing appa
282°F) elim
use its max
reason, the
so eliminate
need for an o
mperature of
ton o-ring
o be as clos
aratus.
minates the u
ximum oper
use of K
ed as it ca
o-ring to con
f the furnace
according to
se as possib
use of
ration
type
an be
nnect
e tube
o the
ble to

34
monitor the droplet and the limitation of the hot tube ends temperature, water cooling is
needed for the furnace end sides.
The sample has to be transferred from the cold zone to the hot furnace core without
breaking the vacuum, a special arrangement has to be done for this purpose. This will be
discussed in more details later in the sample delivery subsystem section.
3.2 The apparatus subsystems The described apparatus is composed of many components that perform different
functionality either as a major contributor to the process or as a support for the other
components. The apparatus design can be viewed as a collection of subsystems that are
integrated to produce the desired performance and it can be sub-classified based on the
different parts functionality as explained below:
• Furnace subsystem: This subsystem is responsible for heating the sample. It is
composed of the heating core and the controller. The heating core is made to
satisfy the dimensions and temperature requirements described in section (3.1).
• Vacuum subsystem: This subsystem is responsible for evacuating the system and
to drive the argon flow. It is composed of two vacuum pumps, two pressure
gauges, valves and standard vacuum connections.
• Argon subsystem: This subsystem is responsible for the control of the argon flow
and ensures that the apparatus remains under controlled atmosphere throughout
the entire test period. It is composed of an argon cylinder, different types of
valves to isolate the different parts of the system and to control the flow, and
mass flow controller.

35
• Water cooling subsystem: this support subsystem is necessary to the functionality
of the furnace core and the diffusion pump as their operation requires water
cooling. It is composed of valves, hoses, connections and a flow meter.
• Control subsystem: This subsystem is responsible for the sequence, the logic and
operation of the different parts in the vacuum and argon subsystems. It is
composed of two major control units and a pneumatic manifold in addition to the
different sensors and the pneumatically controlled valves.
• Imaging subsystem: This subsystem is responsible for the sample illumination
and image acquisition. It is composed of a high speed camera and an optics
system including the lens assembly, illumination light source, a timer and an
assembly holder.
• Sample delivery subsystem: This subsystem is responsible for moving the sample
from the cold zone to the furnace core hot zone without breaking the vacuum, in
addition to the sample temperature data acquisition. It is composed of a
thermocouple and a temperature data logger and a vacuum feedthrough assembly.
The next section will explain the details of each subsystem.
3.3 The furnace subsystem The furnace hot core and controller is designed and implemented by Thoughtventions
Unlimited LLC according to the design requirements expressed in section 3.2. Detailed
views of this subsystem are shown in Figures 7 to 12.
The furnace hot zone is enclosed inside a smooth alumina tube as it has a working
temperature of 1600°C (2912°F) and its vapor pressure is around 7.6 Х 10-7 at this
temperature [110]. These properties of alumina made it suitable for the high temperature

op
on
en
(D
b
b
fi
F T
el
o
b
T
al
al
te
peration and
n two alumi
nd blocks a
DuPont) rec
eyond whic
locks is wat
igure 7.
igure 7 Illustr
The alumina
lement. As t
f the furnac
ecause oxidi
The heating e
lumina brick
luminum en
emperature g
d to tolerate
inum end blo
and the alum
commended
ch it release
ter cooled b
ration for the f
tube is exte
the SiC elem
ce is limited
ization is the
element is w
ks and the
nd blocks an
gradient betw
the vacuum
ocks that are
mina tube i
a maximum
s toxic gase
by circulating
furnace hot co
ernally heate
ment has 1600
to 1450°C
e main drawb
warped with
second is a
nd the heat
ween the hot
36
m at that temp
e part of the
is sealed w
m working te
es including
g water in a
ore design
ed using a 2
0°C (2912°F
(2642°F) to
back of this
h two layers
alumina woo
insulators to
t zone and th
perature. Th
e furnace fram
with Viton o
emperature
g hydrogen
a jacket insi
25 cm cylind
F) maximum
o prevent th
type of elem
of insulator
ol. A small
o allow the
he water coo
his alumina t
me. The con
o-ring. As t
of 200°C (3
fluoride, th
de these blo
drical silicon
m surface tem
e oxidizatio
ments [111].
r. The first
air gap is
alumina tub
led ends.
tube is suspe
ntact betwee
the manufac
392°F) for V
he aluminum
ocks as show
n carbide he
mperature, th
n of the ele
layer is mad
left between
be to have
ended
en the
cturer
Viton
m end
wn in
eating
he use
ement
de of
n the
some

37
The alumina tube end in the aluminum blocks is interfaced on the opposite side of the
aluminum end blocks with a standard bulkhead clamp base to allow standard interfacing
with the vacuum and the argon subsystem as shown in Figures (8 and 9).
Figure 8 View of the furnace hot core
Figure 9 View of the furnace hot core during assembly

38
The heating process is controlled by a closed loop temperature control system to achieve
a precise temperature control (See figures 10 to 12). This kind of temperature control
requires a power controller to feed the heaters. As the resistance of silicon carbide heaters
changes with aging and with temperature, a phase angle firing SCR power control with
soft start and current limiting feature is used. These features allow smooth temperature
ramping and prevent rapid element heating. This reduces the element oxidation and leads
to longer element life. The power controller circuit is provided with a current limiting fast
acting class T fuses to protect against elements short circuiting.
The silicon controlled rectifier receives a 4-20 mA signal from a panel programmable
Proportional Integral Differential (PID) controller. This signal is based on a user set
program and the feedback of an R type thermocouple to the SiC elements. This set-up
gives a true proportioning control for the heating element temperature. The R type
thermocouple is a platinum rhodium based thermocouple where it is known to be stable
and suitable for high temperature measurements 1450°C (2642°F) with significantly
reduced drift due to ageing and lower basic tolerance 0.25%. It is necessary here to stress
that the furnace measured temperature represents the heating element temperature which
might differ form the local temperature inside the tube. This imposes the necessity to
measure the local sample temperature at the test time and to account for the variation
when setting the furnace test temperature.

F
F
igure 10 Illust
igure 11 Exter
tration of the
rnal view of th
control circui
he furnace con
39
it of the furna
ntroller
ce

40
Figure 12 Internal view of the furnace controller
3.4 The vacuum subsystem The vacuum subsystem has a dual role. The first is to circulate the argon under partial
pressure. The second is to clean the sample and the environment around it by the removal
of the undesirable adsorbants.
For argon circulation, the positive displacement oil sealed vane type rotary pump can
drive the argon at the test desirable partial pressure and flow in a suitable cost. The use of
this type of pumps can exceed the range of 10-4 torr but still its use is limited by oil vapor
pressure at the operation temperature [112]. Exceeding the oil vapor pressure under
molecular gas flow shall increase the rate of oil back streaming. Oil back stream is the
major drawback of this type of pumps. The gas blast facility makes this choice more
attractive where it allows the brazing paste to be dried in the same furnace prior to the
test. Figure 13 shows the rotary pump used here.
SCR Power controller
Class T fusses
(PID) controller
Power Contactor
Power and emergency switches

41
Figure 13 Rotary vane type pump used for rough vacuum For the purpose of cleaning the sample from any adsorbed contaminants, the positive
displacement oil sealed type pumps cannot handle the task satisfactorily. It is not
recommended to run this pump in the molecular gas flow region [112]. The need for
another displacement pump to handle this task practically narrows the choice between the
vapor jet and the turbomolecular pumps. Because of the fact that the turbomolecular
pump involves an accurate high speed moving parts, it is an expensive and maintenance
demanding choice. The vapor jet, on the other hand, is simple and less expensive choice.
However, using this kind of pumps is more demanding in control and operation.
Generally speaking, vapor jet pumps are more favorable except in the processes that are
very sensitive to oil contamination. In general, the regular level of oil contamination
generated from the oil diffusion pump is deemed acceptable for many processes including
brazing [113]. Based on this compromise the oil diffusion pump is used here for
adsorbents cleaning. The diffusion pump used in the current work is shown in Figure 14.

42
Figure 14 Oil diffusion pump used for deep vacuum Even though the oil diffusion pump can perform up to a vacuum pressure lower than 10-12
torr, still the system ultimate vacuum pressure is dominated by the other components in
the system. For the rough vacuum prior to the diffusion pump operation and to provide
the required critical backing vacuum to operate the diffusion pump, the oil sealed vane
type pump is used. This is the third role of the oil sealed vane type pump.
The triple role of the oil sealed rotary pump is managed through multi path layout
controlled by valves and controllers. For backing the oil diffusion pump the foreline is
linked to the rotary vane type pump via a line controlled by an isolation valve as seen in
Figure 15. To handle the chamber rough vacuum, a roughing line linked the oil sealed
rotary pump with the vacuum chamber. The flow through the roughing line controlled by
isolation valve and butterfly throttle valve as can be seen in Figures 15 and 16. The
throttle valve is used to differentiate between the foreline and chamber pressure. Figure
15 illustrate the complete system layout.
Water cooled walls
Oil heating
pot
Outlet get valve controller
Ther
mal
ly
snap
switc
h

Figure 15 Schematic of the laayout for the v
43
vacuum and aargon subsysteem

44
Figure 16 View of the vacuum subsystem tubing layout To protect the vacuum chamber from the rotary pump oil contamination at high vacuum,
the diffusion pump act as a seal against the rotary pump back streaming. However, it is
still necessary to keep a slight flow of argon in the furnace chamber during rough
vacuum. This argon flow should keep a viscous gas behavior in the furnace chamber to
drift the back-streamed oil towered the pump [112]. As it is not recommended to start the
diffusion pump when there is viscous gas flow at its inlet, the argon partial pressure has
to be kept in the transition region between the viscous and the molecular flow. For this
purpose, a manually controlled throttle valve is used on the roughing line to control the
gas drift. A pneumatic auto soft valve is also used to protect the sample from being
drifted at the beginning of the roughing process where a high gas flow rate is expected.
Throttle valve
Foreline isolation valve
Roughing line isolation valve
Foreline
To the rotary vane type pump
Roughing line
Argon line
45
Stainless steel tubes and fittings are used to connect the different vacuum components
and the furnace. These components are linked together using standard ISO quick flanges
as shown in Figure 17.
Figure 17 Standard ISO flanges used to connect between the vacuum components
The standard flanges are sealed using Viton O rings. The use of Viton in the flange
assembly set the maximum vacuum in the range of 10-9 torr according to the
manufacturer data sheets. This can be considered the theoretical ultimate vacuum
pressure for this system. This limit is higher lower the practically expected pressure
because of the different sources of out-gassing and virtual leaks epically the water
adsorbed on the different internal walls of the system. Even though the system cannot be
baked out due to the fact that many of the system components have a low baking
temperature, still the system performance should be continuously enhanced with the use
of the vacuum system. This expectation of performance enhancement with the system use
Centering ring
ISO flange
Viton O ring
Clamp

46
relies on the condition that the set-up has to be kept continuously under vacuum and it
should be vented using dry argon rather than air.
To measure the chamber pressure and to control the vacuum subsystem operation,
convection enhanced thermal conductivity vacuum gauge (Figure 18) is used.
Figure 18 Convection enhanced Pirani gauge For this type of gauge, it is important to keep in mind that for the range covered by
sensing the gas convection (around 1 torr to atmospheric), the measurement accuracy is
affected by the position of the gauge. The gauge should be positioned aligned to the
horizontal axis. It is also important not to position this gauge in a hot environment as its
principle is based on sensing the difference between the gauge hot filament temperature
and the environment temperature [114]. The hot filament cooling rate is pressure and gas
dependant where gases of different molecular size show different readings for the same
pressure [114]. This is an important issue that should be considered when argon is used in
this setup as the commercially available gauges, in general, are initially calibrated for air
Thermal conductivity
gauge

47
or nitrogen use. When a thermal conductivity gauge that is filled with argon and
calibrated with nitrogen, it will show a lower reading than argon actual pressure. This
might lead to over pressurizing the chamber which can be considered as safety hazard
[112].
To measure the vacuum pressure beyond the thermal conductivity gauge working range,
an X-ray enhanced hot cathode ionization gouge (Bayard-Alpert) shown in Figure 19 is
used.
Figure 19 X-ray enhanced hot cathode ionization gauge (Bayard-Alpert) The gauge tungsten hot filament should not be exposed to a pressure more than 10-3 torr
during operation. If the hot filament is exposed to air at a pressure higher than this limit,
the filament will be oxidized. Because of the pumping effect in this type of gauge,
degassing has to be done from time to time to ensure accurate gauge reading.
3.5 The argon subsystem The argon is used to provide a dry inert test environment that satisfies the requirements of
the brazing process and to support the vacuum subsystem operation. Precise control of

48
the gas flow and partial pressure provides the ability to test the effect of the process
atmosphere dew point and the oxygen potential on the brazing process. Because of the
argon flow subsystem and the vacuum subsystem act on the same furnace chamber, it is
important for the argon subsystem to provide the required vacuum seal during the deep
vacuum operation. As the argon is brought into the system using bottled gas, there is a
possibility that the system might accidentally be exposed to positive pressure. Many of
the components designed to work under vacuum and have a very limited tolerance to
positive pressure. Precautions have to be taken not to allow positive pressure in the
system. As the thermal conductivity gauge cannot be trusted for this task because its
readings are gas dependant and because of its slow time response, a capacitance
manometer pressure switch is used to trigger a valve that vents the system to the
atmosphere if the chamber pressure exceeds 30 torr Gauge. The diaphragm manometers
are independent of the gas type and have fast response [114].
For the sensitivity of the test materials to the atmosphere impurities, high purity argon is
used. To keep the gas purity, rubber and polymer pipes and fittings are not appropriate in
high purity gas handling where the gas can be contaminated from these materials
themselves [8]. At the same time, copper tubes and fittings are not suitable to handle
pressurized gas. All metal stainless steel tubes and fittings are used in this setup where
the different parts are interconnected using VCR and compression fittings. As the gas
handling components are used unbaked there is a possibility for the gas to be
contaminated from the adsorbed water and oxygen on the inner walls of the pipes and
fittings used to handle the gas. To reduce the effect of the gas contamination a micron
filter used in the late stage of the gas handling. This micron filter reduces the amount of

49
the impurities in the gas up to 1 part per million according to the manufacturer
specifications. This type of filters causes a high pressure drop in the line and limits the
gas flow. This feature can be considered as an additional protection for the system from
the cylinder pressure.
As the pressure drop in the system might vary with changing the valves settings and as
the pressure drop in different parts of the system changes with the diameter of that part,
thermal mass flow controller (0-50 standard cubic centimeters per minute (SCCM)) is
used to control the gas flow in the system. This gives accuracy, flexibility and ease of
control of the gas flow. Benefiting from the lairized input and output of the controller, a
simple potentiometer is used to select the desired input portion of the maximum
controller flow and a simple linear display used to display the measured flow. In spite of
the possibility to connect the mass flow controller that is designed to function on vacuum
system directly to the vacuum chamber, a smooth vent isolation valve is used in between
as shown in Figure 20.
Figure 20 View of the argon inlet line
Mass flow Controller
To the argon cylinder gauge
manifold
Smooth vent isolation valve
Micron filter
Viewing port
V.C.R fitting
Compression fitting

50
The use of the smooth vent valve allows the possibility to use many flow controllers
together to act on the system. This arrangement gives the flexibility to expand the argon
flow range and to mix different gases. The flexibility of mixing different gases accurately
gives an opportunity to test the vacuum leak effect on the system and to test the fluxing
effect of different gas mixtures.
To facilitate a more flexible pressure control at higher chamber pressure, a thin line used
to pass the gas from the chamber to the mechanical pump. On this gas line, an isolation
valve is used to seal the system during vacuum and a metering valve are (seen in Figure
15 and 21) used for precise flow control.
Figure 21 View of the argon exhaust and safety arrangements
System vent isolation
valve
Isolation valve
Metering valve Argon
line
Capacitance manometer
pressure switch

51
3.6 The control subsystem The operation of the vacuum and argon subsystems is fairly complex and requires a good
attention against catastrophic failure that might end with system contamination or safety
hazard. The control subsystem designed and implemented by the author to facilitate
reasonable operation and to provide the necessary protections.
The control subsystem logic circuit and dash board is distributed in two control boxes
shown in Figures 22 and 23.
Figure 22 Control and communication board

52
Figure 23 Valves and sensor synchronization board The circuit can be operated manually based on user input, see Figure 24, or to be
controlled using a digital signal from a computer or a microcontroller. The last feature
made the whole apparatus readily computerizable.

53
Figure 24 Control dash panel Besides the user input the controllers receive different inputs from the sensors around the
system. The behavior of the pumps and the different valves around the system results
from the combination of these different inputs and the control circuit logic. The control
circuit receives the feedback from the sensors and the valves indicators to assess the
success or the failure of the process. All the isolation valves in the system are normally
closed and pneumatically operated.
Ionization gauge
readout
Mass flow controller readout
Valves and sensor
synchronization control box
Control and communication
box

54
A 24 VDC pneumatic manifold handles the signal interfacing between the control circuit
and the isolation valves. The tasks preformed by the control subsystem can be explained
based on the steps of system operation.
The requirements for rough vacuum are that the rotary vane type pump should be
running and the roughing line isolation valve has to be opened. At the time the flow of
the gas reaches the transition region between the viscous and the molecular flow, the
argon flow should be started by opening the smooth vent valve. The high vacuum is
divided into two operational steps. The first part is when the diffusion pump oil starts
warming before reaching a fully developed jet. The second is when the jet is fully
developed and the pumping starts. At the pre-developed jet operation the rotary pump has
to keep roughing the furnace chamber besides backing-up the diffusion pump. This
means that the backing and the roughing valves have to be open but the diffusion pump
inlet valve has to stay closed. The argon flow should continue while the throttle valve has
to differentiate between the chamber and the backing pressure. The high vacuum
operation starts when the oil jet gets fully developed. The diffusion pump should handle
evacuating the chamber at high vacuum with no argon flow while the rotary pump should
keep backing the diffusion pump. For the high vacuum operation, the roughing valve and
argon flow valve should be closed while the diffusion pump inlet and backing valves
should be open. When the high vacuum operation end the chamber has to be filled with
clean argon. This implies that when the diffusion pump stops and its inlet and outlet
valves are closed the roughing valve has to stay closed not to have the air backfill the
furnace through the rotary pump.
55
The argon flow pass through two different routes. At higher chamber pressure, the argon
should flow through thin line for better pressure control. The isolation valve on the argon
line should be opened while the isolation valves on the roughing line, the inlet and the
outlet of the diffusion pump are kept closed. At lower chamber pressure, the argon passes
through the roughing line by closing the valves on the argon thin line and the inlet and
the outlet valves of the diffusion pump and opening the isolation valve on the roughing
line.
The sensors and the feedback around the system distributed to fulfill the requirements of
each step of the operation in terms of performance and protection. The rotary pump use
for the roughing purpose is the first step of operation and does require any special
control. As a protection for the system operator the three phase motor on the rotary pump
gets operated through a contactor that receives 110 VAC signal from the control circuit.
An essential condition for the operation of the diffusion pump is that the backing
pressure remains less than the critical backing pressure set by the manufacturer. This is
monitored by the thermal conductivity gauge pressure switch and the foreline isolation
valve feedback. Similarly the successful operation of the diffusion pump implies that the
pump cooled walls temperature does not exceed the temperature defined by the
manufacturer. Another important condition is that the oil boiler temperature does not
exceed 200°C (392°F). These temperatures are monitored by thermally snap switches. All
the mentioned conditions for the diffusion pump sound operation are guarded by the
control circuit. The failure of any of them means that the diffusion pump will fail to start
or will shut down and close the inlet and the outlet valves to prevent the contamination of
chamber. To predict the right moment to switch from the diffusion pump pre-developed

56
jet operation to fully developed jet operation, the diffusion pump exit temperature has to
meet the manufacturer specifications. This is monitored by a thermally snap switch.
Another protection is added by setting a 10 minutes delay timer from the moment the
pump starts till the opening of the pump inlet gate. When both of the conditions satisfied
roughing line isolation valve will close and the diffusion pump inlet valve opens. To
protect the diffusion pump inlet from being exposed to high pressure side, the pump inlet
isolation valve is activated using the feedback signal from closing the roughing line
isolation valve. To protect the diffusion pump from the argon high pressure, the argon
circuit is deactivated by activating the diffusion pump inlet valve. To protect the
ionization gauge from being exposed to high pressure the gauge power is activated by the
thermal conductivity gauge relay signal. For the argon flow operation, the argon circuit is
activated through the pressure switch relay and the diffusion pump inlet valve closed
feedback.
For switching the system operation to computer mode, 5 volts relays are arranged in a
way that can manipulate the panel operation and take over the system control. This is in
addition to the fact that all the gauges and the controllers in the system accept 0-5 volt
signal or have a 0-5 volt output.
3.7 The imaging subsystem The main role of the imaging subsystem is to monitor the braze filler behavior during
spreading. Also, it can be used for sample thermocouple calibration and to estimate the
thermocouple time lag by monitoring samples that possess a well known melting
temperature.

57
As the furnace tube diameter is 1.5 inch (3.8 cm) and the sample width can be around 1
cm and the braze droplet diameter should be between 1 and 3 mm. The proposed field of
view is 9Х3 mm. The depth of field suitable for this scenario should be more than half of
the diameter of the spread droplet. To monitor the braze droplet at a distance of 300 mm
which came from the dimensions of the furnace, it is not easy to provide a large depth of
field with a suitable resolution. For this reason, the depth of field of the commercially
available lenses can be enough to monitor the droplet profile. As the initial stage of the
spreading phenomena can happen in one tenth of a second, the camera required to
monitor the phenomena should be fast enough to monitor its progress. The regular video
cameras standard can be 25 or 30 fps and some can be 60 fps interlaced. To acquire
higher frame rates a special machine vision camera is needed. As the imaging shutter
speed increases the exposure time is reduced. The light collection efficiency of the lens
depends on the numerical aperture and the exposure time. The numerical aperture is
defined by the sample distance, the effective aperture and the resolution. As the braze
filler spreading phenomenon occurs at elevated temperatures exceeding 1000°C, this
means that the sample and its environment should be bright enough to overcome the
challenges imposed by the distance and the imaging speed. However, the excess
brightness of the sample surroundings might affect the image clarity and blur the edges of
the sample. This effect can be more serious in the case of using a CCD sensor where it is
well known about its light sensitivity and the blooming effect. For this reason, the COMS
censor can be a better choice for this application, where it has a high dynamic rate as its
structure prevents blooming, in spite of its reduced light sensitivity.

58
Taking into account all the details mentioned above, the imaging subsystem is built from
the following components. A stand alone high speed (25 – 250 fps) C-mount camera that
has a 2/3 inch 8 bit COMS monochrome sensor. This camera has a 1280 Х 1024 pixel
array at 25 fps and 640 Х 480 at 250 fps and provided with 512 MB of internal memory
which can give 8.7 seconds of continuous recording at 250 fps. The camera has an LCD
view finder with a panel trigger as well as a USB view finder interface that allows
computer trigger. The camera can accept contact closer or TTL signal for synchronization
and trigger. The trigger starts recording till the memory gets filled or recording is
interrupted keeping whatever recorded in the memory. This gives the flexibility to trigger
after seeing the action on the viewfinder. A telecentric 1X fix magnification lens is used
with this camera. This can give a field of view of 9Х9 mm at the distance of 305 and a
depth of field of 1.82 mm and a resolution of 0.015mm. To reduce the effect of vibration
on the image the lens is mounted on a heavy holder that allows flexible position and
direction adjustments. A variable intensity halogen light source with a flexible fiber optic
extension is used to illuminate the sample during the sample adjustments prior to heating
where the sample is not bright at that period. As the coaxial illumination affects the light
collection efficiency of the lens, a side mounted illumination used in spite of the space
limitation in front of the furnace tube as can be seen in Figure 25.

59
Figure 25 View of the imaging subsystem
3.8 The sample delivery subsystem To achieve the highest possible sample heating rate, a mechanism that allows introducing
the sample in to the furnace after reaching the set temperature without disturbing the
vacuum is added. This mechanism also allows attaching a thermocouple to the sample to
acquire the most accurate heating rate and local temperature. An additional benefit can be
taken from this assembly is predicting the furnace temperature profile to have an exact
expectation about its performance.
This mechanism is simply a Viton o ring sealed compression flange and a ½ inch (1.3
cm) stainless steel tube slides through it. Inside the tube, a K type thermocouple probe
with an inconel 600 clad passes in the furnace. The stainless steel tube and the Inconel
High speed camera
Telecentric fix magnification lens
Variable intensity halogen light source
Camera stand
Flexible fiber optic extension

60
clad are sealed together using stainless steel compression fittings. An Inconel 600 plate is
welded on top of the thermocouple cladding to be the sample platform as can be seen in
Figure 26.
Figure 26 View of the sample delivery assembly
This assembly should not be used beyond 1150°C according to the manufacturer
specifications.
As it is not possible to use the exposed type thermocouple to avoid breaking the vacuum,
also, it is not preferred to use the grounded thermocouple because of the possibility for
signal interference. Hence, an ungrounded thermocouple is used. The use of the
ungrounded thermocouple type imposes limited time delay in the thermocouple
measurements. A USB thermocouple data logger with a temperature update rate of 30 Hz
is used for temperature acquisition.
Sample platform
Inconel clad
Stainless steel tube
O ring sealed compression flange

61
Chapter 4 Testing and Measurements The efforts summarized in the previous chapter were focused on the design and the
implementation of the desired facility. These efforts ended successfully in constructing
the test facility shown in Figure 27.
Figure 27 View of the complete facility to monitor the spreading behaviour of the brazing filler metals at high temperature This chapter will be focused on testing the essential functions of this equipment and the
type of data obtained using it. For the description of the control panel functions and some
preliminary guide lines for operation see appendix A.
As the essential design requirement of the heating subsystem is the capability to operate
at high temperature up to 1400°C (2552°F), the furnace hot core was tested successfully
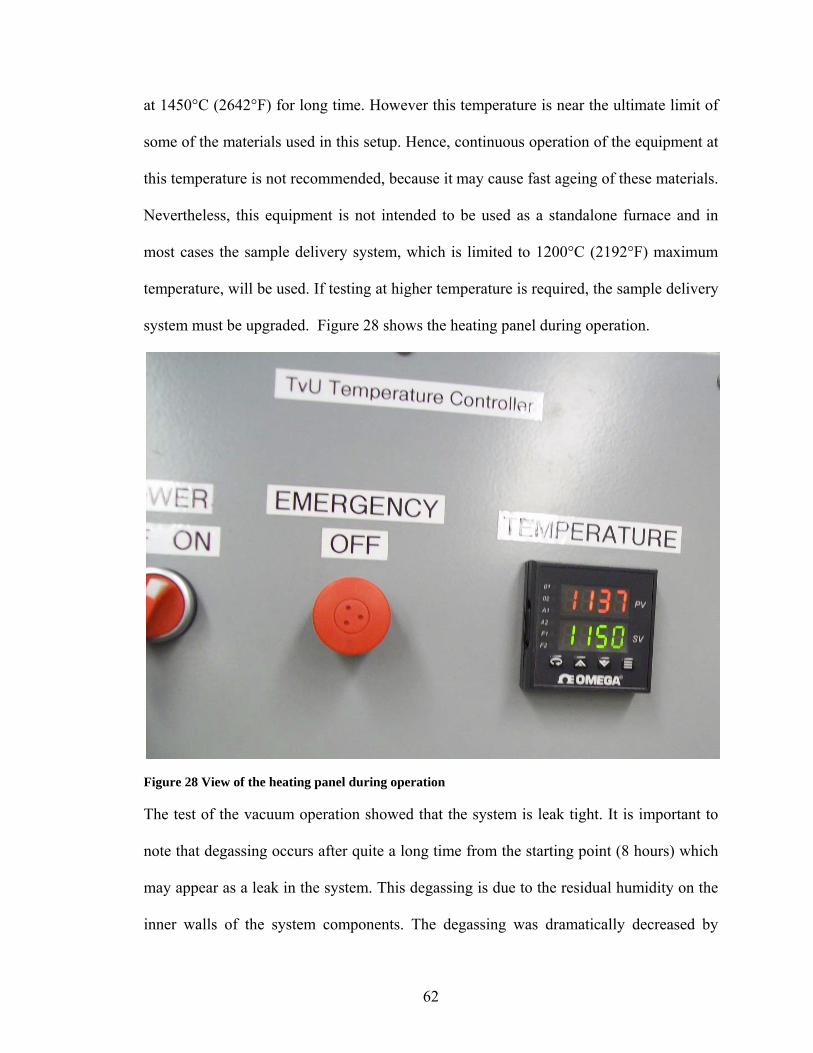
62
at 1450°C (2642°F) for long time. However this temperature is near the ultimate limit of
some of the materials used in this setup. Hence, continuous operation of the equipment at
this temperature is not recommended, because it may cause fast ageing of these materials.
Nevertheless, this equipment is not intended to be used as a standalone furnace and in
most cases the sample delivery system, which is limited to 1200°C (2192°F) maximum
temperature, will be used. If testing at higher temperature is required, the sample delivery
system must be upgraded. Figure 28 shows the heating panel during operation.
Figure 28 View of the heating panel during operation
The test of the vacuum operation showed that the system is leak tight. It is important to
note that degassing occurs after quite a long time from the starting point (8 hours) which
may appear as a leak in the system. This degassing is due to the residual humidity on the
inner walls of the system components. The degassing was dramatically decreased by

63
keeping the system continuously under vacuum. On the other hand, the test of the
vacuum operation showed a sound and successful operation of the related controllers
which kept the system functional and fault free during the operations. It was possible to
keep the system under vacuum in the range of 10-7 torr as shown in Figure 29.
Figure 29 View of the vacuum control panel during operation
The test of the argon flow showed stability for wide range of operation and precise
control of the argon flow rate and the chamber partial pressure. The gas flow was
controllable up to 104 division of the mass flow meter full range (50 standard cubic
centimeters per minute SCCM); while the partial pressure was controllable in 0.01 torr
steps as shown in Figure 30.

64
Figure 30 View of the argon subsystem during operation Testing the imaging subsystem showed the ability to observe small objects at low
temperature down to room temperature, where the sample was illuminated using the
coaxial light source. Operating at low temperature is more difficult because at high
temperatures the sample is emitting light. Figure 31 shows an image at room temperature
for a 1 mm brazing filler drop with a resolution of 640X480 while figure 32 shows the
same sample at 1100 °C. Both figures were acquired at the speed of 30 frames per
second, at higher imaging speed the obtained image becomes darker and hard to be
presented in printing.

65
Figure 31 View of a 1 mm sample in the furnace at room temperature
Figure 32 View of a 1 mm sample in the furnace at 1100°C

66
It was also possible to monitor the sample at 320X240 resolution as shown in Figure 33.
This option increases the image acquisition duration which is limited by the camera’s
internal memory.
Figure 33 Image acquired at a lower resolution As the basic function of the system has been tested and well established, the efforts are
directed towards examining the potential output data. Few tests were conducted using
different high temperature alloys like SS410, INCO625 and INCO718. As the target of
the experiment is to examine the capabilities of the test facility rather than the material
properties, there was no attention paid to the sample preparation requirements or the
choice of the test atmosphere. In general, due to the use of COMS sensor, the large zoom
and the high recording speed, the acquired images were relatively dark. When the
imaging speed is very high, the images might be non-presentable and difficult to analyze.
For this reason, digital image processing and analysis techniques are used to obtain

67
meaningful data out of the original images. To facilitate this task freeware programs have
been used. VIPBase Program [115] has been used to break the video into images then
these images were flipped upside down, thresholded, edge detected and inverted. This
treatment ended in representing the substrate and the drop shape by an easy to analyze
curve. Figure 34 shows the steps used in image analysis.
Figure 34 The steps used for image analysis
Original image Flipped upside down
Thresholded Edge detected
Inverted

68
MB-Ruler [116] and SCALE 2.0 [117] programs have been used to measure the screen
dimensions and the apparent contact angle for a selected set of images. The screen
dimensions are certainly different than the real sample dimensions and there might be
some distortion in the image aspect ratio. However, it is assumed that the distortion is
constant through the image and it should not affect the frame to frame comparison. The
relation between the screen measurements and the real dimensions can be established by
the precise measurement of the droplet dimensions before and after the test.
It is important to note that the use of software for droplet measurements on the screen
might end up confusing as the magnitude of on screen zoom used in a specific scenario
might influence the extracted results. A good judgment is necessary for accurate
measurements. In this work, the height of the droplet and the contact angle measurements
were fairly manageable, whereas measuring the width of the droplet was more
challenging. As the substrate in the digitally modified images is some time represented
by a smooth line (see Figure 35) and in other times by more of a distorted line (see figure
36), it was not possible to conclude in any case if the difference is based on the existence
of a thin layer of liquid or measurement artifact resulted from the image quality and/or
the used image analysis technique.

F
F
igure 35 Exam
igure 36 Exam
mple of a subs
mple of a disto
Badis
trate represen
orted substrat
ase line stortions
69
nted by a smo
e
oth line

70
This artifact can be caused by on one or more reasons such as the imaging analysis, the
low imaging resolution, the vibration, the possible mismatch between the optical axis and
the substrate plane and the optical illusion due to the glow and the illumination.

71
Chapter 5 Discussion, concluding remarks, contributions and future recommendations
5.1 Discussion
In this chapter, some basic issues concerning the observed spreading behavior will be
highlighted and some elementary analysis will be carried out. The purpose here is to
demonstrate the fitness of the test facility for monitoring the brazing filler spreading
behavior.
The test of a large sample, 3.5 mm in diameter, showed a nonsymmetrical spreading that
can be an indication of the influence of the liquid gravity on the wetting behavior. The
acute contact angle in the direction of spreading indicated a capillary driven spreading,
while the curvature of the liquid front indicated inertia inhibited spreading as the liquid
still was sluggish at the beginning. Figure 37 shows an early stage of a large drop
spreading.
Figure 37 View of the spreading of a large drop hindered by inertia.

72
As melting is completed the flow of the liquid in the bulk of the drop resulted in inertia
assisted spreading as it can be seen from the liquid front shape in figure 38.
Figure 38 View of the spreading of a large drop assisted by inertia Testing of a smaller droplet, 1 mm in diameter, shows a more uniform spreading which is
an indication of the dominance of capillary forces on spreading as shown in Figure 33.
The change in the droplet height, width, left contact angle and right contact angle with
time for a selected number of frames measured and listed in table 1. As spreading starts
with melting, there is a period where the changes in height and width start while the
liquid surface still forming and not well defined. The contact angle in this period is
designated by M in the table.

73
Frame
No
Time
(sec)
Height
(mm)
Width
(mm)
Width
at
30%
of the
height
Left contact
angle (°)
Right contact angle
(°)
0 0 188 315 251 M 90 M 90
25 1 183 317 251 M 90 M 90
50 2 177 315 251 M 90 M 90
75 3 164 320 262 M 90 M 90
100 4 148 325 270 68 57
125 5 103 352 283 41 35
150 6 63 373 328 28 22
175 7 50 376 339 23 21
200 8 48 389 344 21 19
300 12 40 381 354 18 13
400 16 37 365 368 16 11
500 20 32 368 402 10 8
600 24 29 373 376 9 7
700 28 29 386 362 8 8
800 32 26 405 402 8 7
900 36 29 368 368 8 8
1000 40 24 413 413 7 7
1500 60 21 405 405 5 5
2000 80 21 362 362
4 4
Table 1 The data obtained from the analysis of the primary facility test results

74
The data in Table 1 are plotted against the time to examine the trend of change in each
set. The drop height change with time, shown in Figure 39, indicates a clear dependence
on time.
Figure 39 The change of the height of the brazing filler drop (measured from the magnified image) with time The plot of the change of the drop base width with time started to show a clear trend at
the beginning, till the drop height decreased to a level that influenced the measurements.
From that point the scatter of the data dominated the curve, as shown in Figure 40.
0
50
100
150
200
0 20 40 60 80 100
Hei
ght (
mm
)
Time (second)

75
Figure 40 The change of the width of the brazing filler drop with (measured from the magnified image) time. The plots of the contact angle change with time for the both sides are shown in Figures
41 and 42. Distinctive time dependant behaviour is observed, very similar to what had
been seen for the drop height with time.
Figure 41 The change of the left contact angle with (measured from the magnified image) time.
0
20
40
60
80
0 20 40 60 80 100
contact a
ngle (d
egree)
Time (second)
300
350
400
450
0 20 40 60 80 100
Width (m
m)
Time (second)

76
Figure 42 The change of the right contact angle with (measured from the magnified image) time.
To examine the three stages of spreading, the changes in the height and width of the
liquid drop with time are plotted on a log-log diagram. The plot of the height against the
time, see Figure 43, showed a clear three distinctive regions. In a very similar fashion to
what had been reported by Ambrose et al. [79]. This behaviour is considered as a
characteristic function of the spreading of a specific material at certain experimental
conditions [79].
0
20
40
60
0 20 40 60 80 100
Con
tact
ang
le (d
egre
e)
Time (second)

77
Figure 43 The plot of the change of the height of the drop with time on a log-log diagram. The plot of the drop width change with time on a log-log diagram, Figure 44, shows the
three-region trend, except the fact that the data in the third region are scattere due to the
previously mentioned problem in measuring the width accurately.
Figure 44 The plot of the change of the width of the drop with time on a log-log diagram.
1.000
1.500
2.000
2.500
0 0.5 1 1.5 2
log
Hei
ght
log Time
2.460
2.520
2.580
2.640
0 0.5 1 1.5 2
log
Wid
th
log Time

78
5.2 Concluding remarks The final remarks can be summarized as following.
• The survey of the current understanding of high temperature brazing filler metal
spreading phenomenon revealed a great deal of complexity and sensitivity.
Although the scientific and academic contributions are steadily advancing
towards understanding this complex behavior, the direct implementation of this
basic knowledge in the applied field still far away from completion.
• The current practice in industry for the brazing process quality control is
empirical, while the wettability test (static contact angle measurement) is used for
no more than an educated guess. This wettability test is not a reliable indicator for
the process success.
• The absence of the appropriate well agreed upon test to characterize the high
temperature spreading of the brazing filler metal is due to the lack of a well
established test concept rather than the technology to implement such a test.
• The empirical characterization of the spreading behavior of the brazing filler
metal was achieved by the use an easily accessible technology.
• The spreading test results can be combined with the other experimental analysis
techniques to reach a better understanding of this phenomenon.
5.3 Contributions An approach to assess the wettability of the high temperature brazing filler metals have
been proposed based on a well accepted brazing filler metal characterization method. The
required test facility was designed, constructed and successfully tested to meet the

79
requirements of testing the wetting and spreading behavior of sensitive materials such as
titanium containing Ni super alloys.
5.4 Recommendations for the future work
• The integration of the brazing filler spreading characterization technique with the
currently used statistical quality control methods can result in more realistic
process evaluation which in turn should relax the current specifications and
enhance the process reliability.
• The long term use of the flow characterization method combined with the other
metallurgical analysis can result in clear distinction of the influence of each
contributing phenomena on the spreading process.
• A Significant enhancement to the apparatus can be achieved by adding a residual
gas analyzer, this will enhance the ability to assess the real sample atmosphere.

80
References
1. M. M. Schwartz: Brazing.ASM International, Ohio, 2003, pp.1-13
2. M. D. Bellware: Fundamentals of Brazing for Elevated-temperature Service. The
Welding Journal, Vol.37, No.6, 1958, pp.683-691
3. W. F. Gale: Applying TLP Bonding to the Joining Structural intermetallic
Compounds. JOM, Vol.51, No.2, 1999, pp.49-52
4. D. S. Duvall, W. A. Owczarski and D. F. Paulonis: TLP Bonding a New Method
for Joining Heat Resistant Alloys. The Welding Journal, Vol.53, No.4, 1974,
pp.203-214
5. A. W. Adamson, A. P. Gast: Physical Chemistry of Surfaces, 6th Edition. Wiley-
Interscience: New York, 1997, pp.4-43
6. J. Pellicer, J. A. Manzanares and S. Mafé: The physical description of elementary
surface phenomena: Thermodynamics versus mechanics. American Journal of
Physics, Vol.63, No.6, 1995, pp.542-547
7. Y. Adda, M.H. Ambroise and F. Barbier: Reactive wetting by liquid metals in
materials science. Materials Science Forum, Vols.155-156, 1994, pp.511-526
8. G. Humpston and D. M. Jacobson: Principles of soldering and brazing, ASM
International, 2005, pp. 268
9. D. Furrer and H. Fecht: Ni-based superalloys for turbine discs. JOM, Vol.51, No.1,
1999, pp.14-17
10. G. L. J. Bailey and H. C. Watkins: The flow of liquid metals on solid metal
surfaces and its relation to soldering, brazing, and hot-dip coating. Journal of the
Institute of Metals, Vol.51, 1952, pp.57-76

81
11. D. R. Milner: A Survey of the Scientific Principles Related to Wetting and
Spreading. British Welding Journal, Vol.5, 1958, pp.90-105
12. J. W. Gibbs: The scientific papers of JW Gibbs Vol. I, Thermodynamics. Oxbow
Press, Woodbridge, CT, 1993, pp.219-319
13. C. A. Ward and M. R. Sasges: Effect of gravity on contact angle: A theoretical
investigation. Journal of Chemical Physics, Vol.109, 1998, pp.3651-3660
14. A. I. Rusanov: Classification of line tension. Colloids and Surfaces A:
Physicochemical and Engineering Aspects, Vol.156, No.1-3, 1999, pp.315-322
15. R. E. Johnson Jr: Conflicts between Gibbsian Thermodynamics and Recent
Treatments of Interfacial Energies in Solid-Liquid-Vapor. Journal of Physical
Chemistry, Vol.63, No.10, 1959, pp.1655-1658
16. M. E. Schrader: Young-Dupre Revisited. Langmuir, Vol. 11, No. 9, 1995,
pp.3585-3589
17. J. J. Bikerman: The physical basis of wetting. Colloid and Polymer Science,
Vol.218, No.1, 1967, pp.52-56
18. R. N. Wenzel: Resistance of solid surfaces to wetting by water. Industrial and
Engineering Chemistry, Vol.28, No.8, 1936, pp.988-994
19. R. Shuttleworth and G. L. J. Bailey: The spreading of a liquid over a rough solid.
Discussions of the Faraday Society, Vol.3, 1948, pp.16-22
20. S. J. Hitchcock, N. T. Carroll, M. G. Nicholas: Some effects of substrate
roughness on wettability. Journal of Materials Science, Vol.16, No.3, 1981,
pp.714-732

82
21. A. B. D. Cassie and S. Baxter: Wettability of porous surfaces. Transactions of the
Faraday Society, Vol.40, 1944, pp.546-551
22. A. B. D. Cassie: Contact angles. Discussions of the Faraday Society, Vol.3, 1948,
pp.11-16
23. D. Li and A. W. Neumann: Surface heterogeneity and contact angle hysteresis.
Colloid and Polymer Science, Vol.270, No.5, 1992, pp.984-504
24. W. D. Harkins, A. Feldman: Films. The spreading of liquids and the spreading
coefficient. Journal of the American Chemical Society, Vol.44, No.12, 1922,
pp.2665-2685
25. J. F. Padday: Sessile Drop Profiles: Corrected Methods for Surface Tension and
Spreading Coefficients. Proceedings of the Royal Society of London. Series A,
Mathematical and Physical Sciences, Vol.330, No.1583, 1972, pp.561-572
26. F. G. Yost: Fundamentals of wetting and spreading with emphasis on soldering.
Sandia National Labs, Albuquerque, NM (United States). 1991
27. F. P. Buff: The molecular hydrostatic analysis of Gibbs' theory of capillarity.
Discussions of the Faraday Society, Vol.30, 1960, pp.52-58
28. F. C. Goodrich: The Mathematical Theory of Capillarity. I. Proceedings of the
Royal Society of London. Series A, Mathematical and Physical Sciences,
Vol.260, No.1303, 1961, pp.481-489
29. F. C. Goodrich: The Mathematical Theory of Capillarity. II. Proceedings of the
Royal Society of London. Series A, Mathematical and Physical Sciences,
Vol.260, No.1303, 1961, pp.490-502

83
30. T. D. Blake and J. De Coninck: The influence of solid–liquid interactions on
dynamic wetting. Advances in Colloid and Interface Science, Vol.96, No.1-3,
2002, pp.21-36
31. E. J. Shaughnessy, I. M. Katz and J. P. Schaffer: Introduction to Fluid Mechanics.
Oxford university press, New York, 2005
32. D. R. Milner and R. L. Apps: Introduction to welding and brazing. Pergamon
Press, Oxford, 1968
33. G. Kumar and K. N. Prabhu: Review of non-reactive and reactive wetting of
liquids on surfaces. Advances in Colloid and Interface Science, Vol.133, No.2,
2007, pp.61-89
34. H. Schonhorn, H. L. Frisch and T. K. Kwei: Kinetics of Wetting of Surfaces by
Polymer Melts. Journal of Applied Physics, Vol.37, No.13, 1966, pp.4967-4973
35. S. Newman: Kinetics of wetting of surfaces by polymers: Capillary flow. Journal
of Colloid and Interface Science, Vol.26, 1968, pp.209-213
36. T. P. Yin: Kinetics of spreading. Journal of Physical Chemistry, Vol.73, No.7,
1969, pp.2413-2417
37. R. L. Hoffman: A Study of the advancing interface 1. Interface shape in liquid-
gas systems. Journal of Colloid and Interface Science, Vol.50, No.2, 1975,
pp.228-241
38. O. V. Voinov: Hydrodynamics of wetting. fluid dynamics, Vol.11, No.5, 1976,
pp.714-721
39. L. H. Tanner: The spreading of silicone oil drops on horizontal surfaces. Journal
of Physics D: Applied Physics, Vol.12, No.9, 1979, pp.1473-1484

84
40. M. D. Lelah, A. Marmur: Spreading kinetics of drops on glass. Journal of Colloid
and Interface Science, Vol.82, No.2, 1981, pp.518-525
41. P. G. de Gennes: Wetting: statics and dynamics. Reviews of Modern Physics,
Vol.57, No.3, 1985, pp.827-525
42. E. B. Dussan V.: The moving contact line: the slip boundary condition. Journal of
Fluid Mechanics, Vol.44, No.4, 1976, pp.665-684
43. E. B. Dussan: On the spreading of liquids on solid surfaces: static and dynamic
contact lines. Annual Review of Fluid Mechanics, Vol.11, 1979, pp.371-400
44. R. G. Cox: The dynamics of the spreading of liquids on a solid surface. Part 1.
Viscous flow. Journal of Fluid Mechanics, Vol.163, 1986, pp.169-194
45. T.D. Blake: The contact angle and two-phase flow, Ph.D. thesis, University of
Bristol (United Kingdom), 1968.
46. T.D. Blake: Dynamic contact angles and wetting kinetics. Surfactant Science
Series, Vol. 49, 1993, pp.251-309
47. S. Glasstone, K. J. Laidler and H. Eyring: The Theory of Rate Processes.
McGraw-Hill, New York, 1941,pp.611
48. J. I. Frenkel: Kinetic Theory of Liquids. Oxford Univ, Press, Oxford,1946
49. P. Petrov, I. Petrov: A combined molecular-hydrodynamic approach to wetting
kinetics. Langmuir, Vol.8, No.7, 1992, pp.1762–1767
50. F. Brochard-Wyart and P. G. de Gennes: Dynamics of partial wetting. Advances
in Colloid and Interface Science, Vol.39, 1992, pp.1-11
51. M.J. de Ruijter, J. De Coninck and G. Oshanin: Droplet Spreading: Partial
Wetting Regime Revisited. Langmuir, Vol.15, No.6, 1999, pp.2209–2216
85
52. T.D. Blake: The physics of moving wetting lines. Journal of Colloid and Interface
Science, Vol.229, No.1, 2006, pp.1-13
53. N. Eustathopoulos, M. G. Nicholas and B. Drevet: Wettability at High
Temperatures. Elsevier Science, 1999, ISBN: 9780080421469, pp.419
54. E. Saiz, A. P. Tomsia, N. Rauch, C. Scheu, M. Ruehle, M. Benhassine, D.
Seveno, J. de Coninck and S. Lopez-Esteban: Nonreactive spreading at high
temperature: molten metals and oxides on molybdenum. Physical Review, Vol.76,
No.4, 2007, pp.041602-041617
55. R. L. Peaslee P. F. Walter: How oxygen affects nickel brazing filler metals.
Welding Journal, Vol.74, No.1, 1995, pp.61-67
56. K. C. Mills, E. D. Hondros and Z. Li: Interfacial phenomena in high temperature
processes. Journal of Materials Science, Vol.40, No.9, 2005, pp.2403-2409
57. G. R. Belton: Langmuir adsorption, the Gibbs adsorption isotherm, and interracial
kinetics in liquid metal systems. Metallurgical and Materials Transactions B,
Vol.7, No.1, 1976, pp.35-24
58. E. Ricci and A. Passerone: Review: Surface tension and its relations with
adsorption, vapourization and surface reactivity of liquid metals. Materials
Science and Engineering: A, Vol.161, No.1, 1993, pp.31-40
59. E. Ricci, A. Passerone, J. C. Joudb: Thermodynamic study of adsorption in liquid
metal-oxygen systems. Surface Science, Vol.206, No.3, 1988, pp.533-553
60. R. H. Fowler and E. A. Guggenheim: Statistical thermodynamics. Cambridge
University Press, London, 1949, pp.422

86
61. S. U. Yuchu, K. C. Mills and A. Dinsdale: A model to calculate surface tension of
commercial alloys. Journal of Materials Science, Vol.40, No.9-10, 2005, pp.1573-
4803
62. J. Lee, K. Yamamoto and K. Morita: Surface tension of liquid Fe-Cr-O alloys at
1823 K. Metallurgical and Materials Transactions B, Vol.36, No.2, 2005, pp.241-
246
63. E. T. Turkdogan, P. Grieveson and L. S. Darken: Enhancement of diffusion-
limited rates of vaporization of metals. Journal of Physical Chemistry, Vol.67,
No.8, 1963, pp.1647–1654
64. P. Costa, A. Passerone and E. Ricci: Oxygen fluxes and the measurement of the
surface tension of liquid metals. High Temperatures - High Pressures, Vol.20,
No.11, 1988, pp.59-72
65. G. Astarita: Mass Transfer with Chemical Reaction. Elsevier Publishing,
Amsterdam, 1967, pp.188
66. E. Ricci, A. Passerone and P. Castello: Surface reactivity of liquid metal with
oxygen and its relationship with surface tension measurements: a kinetic-
fluodynamic model. Journal of Materials Science, Vol. 29, No.7, 1994, pp.1833-
1846
67. P Castello, E Ricci, A Passerone and P Costa: Oxygen mass transfer at liquid-
metal-vapour interfaces under a low total pressure. Journal of Materials Science.
Vol.29, No.23, 1994, pp.6104-6114
68. A. Sakamoto: Wetting in vacuum-inert gas partial pressure atmosphere brazing.
Welding Journal, Research Supplement, Vol.63, No.10, 1983, pp.272s-281s

87
69. M. McLean and E. D. Hondros: Interfacial energies and chemical compound
formation. Journal of Materials Science, Vol.8, No.3, 1973, pp.349-351
70. A. J. Wall and D. R. Milner: Wetting and spreading phenomena in a vacuum.
Journal of the Institute of Metals, Vol.90, 1962, pp.394-402
71. A. S. Skapski: The Surface Tension of Liquid Metals. Journal of Chemical
Physics, Vol.16, No.4, 1948, pp.389-393
72. R. J. Klein-Wassink: Wetting of solid-metal surfaces by molten metals. Journal of
the Institute of Metals, Vol.95, 1967, pp.38-43
73. J. G. Li, L. Coudurier and N. Eustathopoulos: Work of adhesion and contact-
angle isotherm of binary alloys on ionocovalent oxides. Journal of Materials
Science, Vol.24, No.3, 1989, pp.1109-1116
74. P. Kritsalis, J. G. Li and N. Eustathopoulos: Role of Clusters on the Wettability
and Work of Adhesion of the Cu-Cr/A12O3 System. Journal of Materials Science
Letters, Vol.9, 1990, pp.1332-1335
75. I. A. Aksay, C. E. Hoge and J. A. Pask: Wetting under chemical equilibrium and
nonequilibrium conditions. Journal of Physical Chemistry, Vol.78, No.12, 1974,
pp.1178-1183
76. L. Espie, B. Drevet, N. Eustathopoulos: Experimental study of the influence of
interfacial energies and reactivity on wetting in metal/oxide systems.
Metallurgical and Materials Transactions B, Vol.25, 1994, PP.599-605.
77. K. Landry, C. Rado and N. Eustathopoulos: Influence of interfacial reaction rates
on the wetting driving force in metal/ceramic systems. Metallurgical and
Materials Transactions A, Vol.27, No.10, 1996, pp.3181-3186

88
78. J. C. Ambrose, M. G. Nicholas, N. Young and S. L. Jenkins: Wetting and
spreading of Ni-P brazes: Effects of workpiece and braze composition. Materials
Science and Technology, Vol.6, No.10, 1990, pp.1021-1031
79. J. C. Ambrose, M. G. Nicholas and A. M. Stoneham: Dynamics of braze
spreading. Acta Metallurgica et Materialia, Vol.40, No.10, 1992, pp.2483-2488
80. J. C. Ambrose: Wetting and speading of nickel brazes on steel substrates, Ph.D.
thesis, University of London (United Kingdom),1992
81. N. Sobczak, M. Singh and R. Asthana: High-temperature wettability
measurements in metal/ceramic systems – Some methodological issues. Current
Opinion in Solid State and Materials Science, Vol.9, No.4-5, 2005, pp.241-253
82. K. Schlimbach, E. F. Lugscheider, W.Tillmann, W.F. Gale: Optical Hot Stage
Microscopy for Brazing Investigations. Proceedings from Materials Solutions
Conference (99), 1999, pp.58-63
83. E. Lugscheider, K. Schlimbach, W. Tillmann, Schaan and W.F. Gale, Auburn:
Optical hot stage microscopy for brazing investigations. DVS BERICHTE,
Vol.184, 1997, pp.180-182
84. J. M. Cohen and J. E. Castle: Analytical heating stage development for vacuum
studies of brazing alloys at high temperature. Brazing & Soldering, Vol.5, 1983,
pp.4-6
85. J. M. Cohen, J. E. Castle and M. B. Waldron: High-temperature observations of
braze alloy spreading by oxide penetration. Metal Science, Vol.15, No.10, 1981,
pp.455-462

89
86. K. A. Thorsen, H. Fordsmand and P. L. Praestgaard: Optical hot stage microscopy
for brazing investigations. Welding Research Supplement, Vol.63, No.11, 1984,
pp.339s-344s
87. W. D. Kingery and M. Humenik, Jr.: Surface tension at elevated temperatures. I.
Furnace and method for use of the sessile drop method; surface tension of silicon,
iron and nickel. The Journal of Physical Chemistry, Vol.57, No.3, 1953, pp.359-
363
88. B. Schwarz, C. Eisenmenger-Sittner and H. Steiner: Construction of a high-
temperature sessile drop device. Vaccum, Vol.82, No.2, 2008, pp.186-188
89. Z. F. Yuan, K. Mukai, K. Takagi, M. Ohtaka, W. L. Huang and Q. S. Liu: Surface
tension and its temperature coefficient of molten tin determined with sessile drop
method at different oxygen partial pressures. Journal of Colloid and Interface
Science, Vol.254, No.2, 2002, pp.338-345
90. V. Laurent, D. Chatain and N. Eustathopoulos: Wettability of Sic by aluminium
and Al-Si Alloys. Journal of Materials Science, Vol. 22, No.1, 1987, pp.244-250
91. X. Huang, S. Togawa, S. Chung, K. Terashima and S. Kimura: Surface tension of
a Si melt: Influence of oxygen partial pressure. Journal of Crystal Growth,
Vol.156, No.1, 1995, pp.52-58
92. Z. Jun and K. Mukal: The surface tension of liquid iron containing nitrogen and
oxygen. ISIJ International, Vol.38, No.10, 1998, pp.1039-1044
93. J. Lee and K. Morita: Evaluation of surface tension and adsorption for liquid Fe-S
alloys. ISIJ International, Vol.42, No.6, 2002, pp.588-594

90
94. W. J. O’Brien and G. Ryge: Relation between molecular force calculations and
observed strengths of enamel-metal interfaces. Journal of the American Ceramic
Society, Vol.42, No.6, 2002, pp.588-594
95. R. Lu, G. P. Görler, H. J. Fecht and R. Willnecker: Investigation of specific heat
and thermal expansion in the glass-transition regime of Pd-based metallic glasses.
Journal of Non-Crystalline Solids, Vol.274, No.1-3, 2000, pp.294-300
96. J. Ho Lee and D. N. Lee: Use of thermodynamic data to calculate surface tension
and viscosity of Sn-based soldering alloy systems. Journal of Electronic
Materials, Vol.30, No.9, 2001, pp.1112-1119
97. M. Diemer, A. Neubrand, K. P. Trumble and J. Rodel: Influence of oxygen partial
pressure and oxygen content on the wettability in the copper–oxygen–alumina
system. Journal of the American Ceramic Society, Vol.82, No.10, 2004, pp.2825 -
2832
98. E. Ricci, E. Arato, A. Passerone and P. Costa: Oxygen tensioactivity on liquid-
metal drops. Advances in Colloid and Interface Science, Vol.117, No.1-3, 2005,
pp.15-32
99. N. Eustathopoulos, N. Sobczak, A. Passerone and K. Nogi: Measurement of
contact angle and work of adhesion at high temperature. Journal of Materials
Science, Vol.40, No.9, 2005, pp.2271-2280
100. H. D. Solomon, R. E. Delair and J. Thyssen: The High-temperature wetting
balance and the influence of grit blasting on brazing of IN718. The Welding
Journal, Vol.82, No.10, 2003, pp.278s-287s

91
101. N. Sobczak, R. Nowak, W. Radziwill, J. Budzioch, A. Glenz: Experimental
complex for investigations of high temperature capillarity phenomena. Materials
Science and Engineering A, Vol.495, No.1-2, 2008, pp.43-49.
102. A.C. Hall, F. M. Hosking and M. Reece: Visual observations of liquid filler
metal flow within braze gap. Science and Technology of Welding and Joining,
Vol.9, No.2, 2004, pp.95-102
103. A. Sharan and A. W. Cramb: Surface tension and wettability studies of liquid
Fe-Ni-O alloys. Metallurgical and Materials Transactions B, Vol.28, No.3, 1997,
pp.465-472
104. J. C. Ambrose and M.G. Nicholas: Wetting and spreading of nickel-phosphorus
brazes: detailed real time observations of spreading on iron-chromium substrates.
Materials science and technology, Vol.12, No.1, 1996, pp.72-80
105. Y. V. Naidich and N. F Grigorenko: Capillary characteristics of high
temperature melts measured by sessile-drop method using computer-aided TV
system. Journal of Materials Science, Vol.27, No.11, 1992, pp.3092-3097
106. D. Sankowski and K. Strzecha: The development of image processing and
analysis unit for building a solderability tester. Instrumentation and Measurement
Technology Conference, 2003. IMTC '03. Proceedings of the 20th IEEE, Vol.1,
1992, PP.14-19.
107. P. Danielson: Anatomy of a PumpDown, R&D Magazine, June 2004, p. 33.
108. W. F. Gale, E. R. Wallach: Wettability of nickel alloys by Ni-Si-B fillers:
influence of substrate oxide reduction and isothermal solidification. Journal of
Materials Science, Vol. 27, No. 20, 1992, p. 5653-5660

92
109. C. B. Carter, M. G. Norton: Ceramic Materials Science and Engineering.
Springer,2007, PP. 147
110. J. F. Shackelford, R. H. Doremus: Ceramic and Glass Materials Structure,
Properties and Processing, Springer, 2008, PP. 13
111. K. Pelissier, T. Chartier, J. M. Laurent: Silicon carbide heating elements,
Ceramics International, Vol. 24, No. 5, 1998, P. 371-377
112. E. N. Kaufmann et al. : Characterization of Materials, Wiley-VCH, 2003, pp
1392
113. H. R. Brooker and E. V. Beatson: Industrial brazing, Newnes-Butterworths,
London, 1975, pp 263
114. K. H.-L. Chau, et. al.:Pressure and Sound Measurement, CRC Press LLC, 2000
115. http://vipbase.net/
116. http://www.markus-bader.de/MB-Ruler/
117. http://www.sgrillo.net/scale.htm

93
Appendix A: Steps for the apparatus operation
1. Prepare the sample according to the nature and the requirements of the specific
sample
2. Load the sample into the furnace chamber
3. Adjust the sample and the camera to bring the sample into focus
a. Start the camera and the illumination light (see the camera supporting
documents)
b. Start the computer and the camera software
c. Change the camera speed to 25 fps
d. Adjust the camera height and the sample angle and distance until focus is
achieved
4. Bake out and degas the sample and the furnace ( Figure 1,2,3)
a. Start the argon flow
b. Turn-on the air
c. Switch the control panel power on
d. Switch on the mechanical vacuum pump
e. Adjust the argon flow until the chamber partial pressure reaches 1 torr
f. Turn the cooling water on
g. Heat to 125 °C for two hours
h. Stop the heating
i. Verify and adjust the diffusion pump cooling water flow based on the
rotameter reading as marked on the device
j. Start the diffusion pump heater

94
k. Turn the argon flow off before the diffusion pump gate opens (
approximately 9 minutes after starting the diffusion pump)
l. Keep the diffusion pump for several hours (according to the specific
sample and experiment requirements)and then turn it off
5. Test and imaging
a. Start and adjust the argon flow till you reach the desirable pressure in the
chamber
b. Start heating towards the test temperature
c. At around 900°C change to the desired frame rate and turn off the
illumination if required
d. Further adjust the image if required and keep monitoring the sample
e. At the right moment trigger the camera
f. Turn-off the heating
g. When the furnace temperature reach less than 150 shut the cooling water
off

95
Figure 45 View of the control panel during roughing vacuum
Figure 46 View of the heating controller
Chamber pressure Argon flow rate
Argon flow controller power switch
Argon flow control
Roughing valve on indicator
Roughing valve off indicator
Controller power switch
Mechanical pump power indicator
Mechanical pump power switch
Controller power indicator
24V power supply indicator
Argon flow/diffusion pump selection switch

96
Figure 47 View of the control panel during diffusion pump operation
Figure 48 View of the control panel during argon flow operation
Diffusion pump inlet valve on indicator
Diffusion pump inlet valve off indicator
Diffusion pump power on switch
Diffusion pump power off switch
Ion gauge power switch
Ion gauge degassing switch
Ion gauge reading
Ion gauge power indicator
Diffusion pump heater power on indicator
Diffusion pump get indicator
Diffusion pump outlet valve on indicator
Diffusion pump outlet valve off indicator
Smooth vent valve auxiliary on indicator
Smooth vent valve auxiliary on indicator
Argon line valve on indicator
High chamber pressure indicator
Argon flow circuit on switch
Argon flow circuit indicator
Argon flow circuit off switch