glycemic properties of maternal diet in relation to ... · glycemic properties of maternal diet in...
TRANSCRIPT

Glycemic properties of maternal diet in relation to preterm delivery
and abnormal birth weight
Linda Englund Ögge
Department of Obstetrics and Gynecology Institute of Clinical Sciences
Sahlgrenska Academy at University of Gothenburg
Gothenburg 2017

Cover picture: Fotolia
Glycemic properties of maternal diet in relation to preterm delivery and abnormal birth weight© Linda Englund Ögge [email protected] ISBN 978-91-629-0115-8
Printed by Ineko, GothenburgSweden 2017

”Where there is no struggle, there is no strength.” ― Frederick Douglass


ABSTRACT
Aims: To examine whether glycemic aspects of maternal diet, affects the risk of preterm delivery or of having a small for gestational age (SGA) or large for gestational age (LGA) baby.
Subjects and methods: The studies included pregnant women from the Norwegian Mother and Child Cohort Study (MoBa). Study I included 60,761, Study II and Study III (part II) 66,000, Study III (part I) 65,487 and Study IV included 65,904 women. Information about maternal diet was collected in mid-pregnancy with a self-reported, validated food frequency questionnaire. Data on covariates were obtained from responses to two questionnaires during pregnancy. Information on gestational length and birth weight was obtained from the Medical Birth Registry of Norway. Binary logistic regression, Spearman’s correlation coefficient and factor analysis were used to analyze data. Unadjusted and adjusted analyses were performed.
Results: Paper I: More than one daily serving of sugar-sweetened beverages was associated with a 25% increased risk of preterm delivery, the same intake of artificially sweetened beverages was associated with an 11% increased risk, compared to non-intake. Paper II: High intake of a “prudent” dietary pattern was associated with an 11% lower risk of preterm delivery, compared to low intake. A high prudent intake was associated with lower risk of both late and spontaneous preterm delivery. No independent association was found for the “Western” dietary pattern. High adherence to the “traditional” dietary pattern was related to a 9% reduced risk. Paper III: High adherence to a “main meal” frequency pattern was associated with an 11% reduction in preterm delivery risk, as well as reduced risks of late preterm delivery and of preterm delivery in overweight women. No associations were found between preterm delivery and glycemic load, glycemic index, carbohydrates, added sugar or dietary fiber. Paper IV: The “high prudent” diet was associated with increased risk of SGA and decreased risk of LGA. The “high traditional” diet was associated with increased LGA risk.
Conclusions: Maternal diet may be an important risk factor for preterm delivery. Food quality may be relevant for SGA and LGA risks. The role of maternal diet in adverse pregnancy outcomes requires further study.
Keywords: Preterm delivery, SGA, LGA, sugar-/artificially sweetened drinks, dietary patterns, meal frequency, glycemic index, glycemic load, carbohydrates, sugar, fiber.
ISBN 978-91-629-0115-8 (Print) ISBN 978-91-629-0116-5 (PDF)

vi
SAMMANFATTNING PÅ SVENSKADen gravida kvinnans kost påverkar det växande fostret och man har börjat intressera sig för hur kostintag påverkar graviditetsutfallet. Syftet med den här avhandlingen är att studera hur mammans kost under graviditeten, särskilt kostens glykemiska egenskaper, påverkar risken att föda för tidigt och risken att födas för liten (SGA) eller för stor (LGA) för tiden. Dessa tillstånd kan vara kopplade till ökad sjuklighet hos barn.
Vi har använt data från den stora norska nationella graviditetskohortstudien ”Den norske mor og barn-undersøkelsen” (MoBa), varifrån 60 761 kvinnor inkluderades i studie I, 66 000 kvinnor i studie II och studie III (del II), 65 487 i studie III (del I) och 65 904 kvinnor i studie IV. Kvinnorna besvarade ett detaljerat och validerat frågeformulär angående kostintag under graviditeten. Kostformuläret näringsvärdesberäknades. Vi har även använt oss av två andra frågeformulär, som kvinnorna har svarat på under graviditeten, för information om övriga kofaktorer. Information om graviditetslängd och födelsevikt har hämtats ur Norska Födelseregistret.
Delarbete I: Ett högt intag av socker och artificiellt sötade drycker var kopplat till en ökad risk för förtidsbörd. Mer än ett glas per dag var associerat till 25 % respektive 11 % ökad risk för förtidsbörd, jämfört med inget intag. Delarbete II: Gravida som åt rikligt med “hälsosam” kost, dvs. högt intag av råa grönsaker, frukt, bär, olja, vatten som måltidsdryck, fullkornsflingor och fiberrikt bröd, hade 11 % minskad risk för förtidsbörd, jämfört med kvinnor med lågt intag av motsvarande kost. Sambandet var också signifikant avseende sen och spontan förtidsbörd. Kvinnor som åt mycket ”husmanskost”, dvs. kokta grönsaker, kokt potatis, fisk och lättmjölk, hade 9 % minskad risk för förtidsbörd, jämfört med kvinnor med lågt intag. Delarbete III: En regelbunden måltidsordning (frukost, lunch, middag) var associerat till 11 % minskad risk för förtidsbörd. Det fanns inget samband mellan förtidsbörd och glykemiskt index, glykemiskt load, kolhydrater, tillsatt socker eller kostfiber. Delarbete IV: Högt intag av hälsosam mat ökade SGA-risken och minskade LGA-risken. Högt intag av husmanskost ökade LGA-risken.
Studierna visar att kosten kan påverka risken för förtidsbörd och avvikande födelsevikt. Kostens betydelse under graviditet bör studeras ytterligare eftersom många kvinnor då är motiverade till livsstilsförändringar. Förhoppningen är att eventuellt kunna bidra till minskad förekomst av dessa tillstånd.

vii
LIST OF PAPERS
This thesis is based on the following studies, referred to in the text by their Roman numerals.
I. Englund-Ögge L, Brantsæter AL, Haugen M, Sengpiel V, Khatibi A, Myhre R, Myking S, Meltzer HM, Kacerovsky M, Nilsen RM, Jacobsson B. Association between intake of artificially sweetened and sugar-sweetened beverages and preterm delivery: a large prospective cohort study. Am J Clin Nutr. 2012 Sep;96(3):552-9.
II. Englund-Ögge L, Brantsæter AL, Sengpiel V, Haugen M, Birgisdottir BE, Myhre R, Meltzer HM, Jacobsson B. Maternal dietary patterns and preterm delivery: results from large prospective cohort study. BMJ. 2014 Mar4;348:g1446.
III. Englund-Ögge L, Birgisdottir BE, Sengpiel V, Brantsæter AL, Haugen M, Myhre R, Meltzer HM, Jacobsson B. Meal frequency patterns and glycemic properties of maternal diet in relation to preterm delivery: Results from a large prospective cohort study. PLoS One. 2017 Mar 1;12(3):e0172896.
IV. Englund-Ögge L, Brantsæter AL, Haugen M, Meltzer HM, Jacobsson B, Sengpiel V. Maternal dietary patterns and associations of having a small-for-gestational-age or a large-for-gestational-age baby in the Norwegian Mother and Child Cohort Study. Manuscript.

ix
CONTENTSPreface .......................................................................................................................................xi
Abbreviations ......................................................................................................................xiii
Brief Definitions .................................................................................................................xv
1. Introduction................................................................................................................... 17
1.1 Preterm delivery ....................................................................................................... 171.2 Birth weight ................................................................................................................ 211.3 The importance of maternal diet ....................................................................... 231.4 Glucose metabolism in pregnancy .................................................................... 241.5 Influence of diet on glucose metabolism ....................................................... 251.6 Dietary assessment methods............................................................................... 29
2. Aims ...................................................................................................................................... 31
3. Methods ............................................................................................................................. 33
3.1 Study population ....................................................................................................... 343.2 Study design ................................................................................................................ 353.3 Exposure variable: maternal diet ..................................................................... 353.4 Outcome variables.................................................................................................... 383.5 Statistical Methods .................................................................................................. 393.6 Ethical and other approvals ................................................................................. 43
4. Results .............................................................................................................................. 45
4.1 Study I. ........................................................................................................................... 464.2 Study II. ........................................................................................................................ 484.3 Study III. ....................................................................................................................... 534.4 Study IV. ....................................................................................................................... 55
5. Discussion ......................................................................................................................... 61
5.1 Discussion of main results .................................................................................... 615.2 Methodological considerations .......................................................................... 66
6. Conclusions ..................................................................................................................... 77

x
7. Future perspectives .................................................................................................. 79
8. Acknowledgements ..................................................................................................... 81
References ............................................................................................................................. 83
Appendix ................................................................................................................................105

xi
PREFACEAs an obstetrician, I deal on a daily basis with complications arising from preterm delivery and with babies who are small for gestational age (SGA) or large for gestational age (LGA). Preterm-born infants are especially vulnerable and present challenges for health-care staff, affected families and, not least, themselves, often with long-term consequences. Moreover, infants who are born SGA or LGA due to medical issues require special management.
As I am also a dietician, I am interested in issues related to nutrition, especially whether and how nutritional factors can affect health-related outcomes and illness, and whether this knowledge can contribute to prevention. Therefore, I was thrilled at the opportunity to study maternal diet in relation to adverse pregnancy outcomes. If diet is indeed related to any of these conditions, it is exciting to think that altering maternal diet might prevent them to some extent. However, diet is a very complex phenomenon and not easily studied, especially in pregnant women.
In this thesis, I have tried to comprehensively present the relationships between maternal dietary glycemic characteristics and the phenomena of preterm delivery and abnormal birth weight. Pregnancy is a state of insulin resistance and high postprandial plasma glucose levels can have multiple negative long-term effects, e.g. increased oxidative stress with endothelial dysfunction and unfavorable plasma lipid composition, with consequent vascular damage. This could possibly affect the risk of adverse outcomes.
Since soft drinks are a major source of sugar intake, artificially sweetened (AS) soft drinks are usually recommended as an alternative. However, there have been reports that women who consume AS beverages are at increased risk of preterm delivery. Furthermore, beverage choice is usually associated with overall diet. In a mixed diet, nutrients act together, making it difficult to assess the impact of an individual food in relation to preterm delivery or abnormal birth weight. Assessing overall dietary patterns is one way to overcome this problem. Furthermore, meal frequency has been shown to affect the risk of preterm delivery in animal trials, although meal frequency recommendations have been removed from guidelines for humans, due to lack of supporting evidence. Assessing meal frequency patterns in relation to preterm delivery is thus important. In this context, other components of maternal diet/nutrition, such as glycemic index, glycemic load, total carbohydrates, added sugar and dietary fiber, should also be considered and assessed in relation to preterm delivery. Maternal energy intake is of major importance for fetal growth

xii
and it affects birth weight. However, the issue of whether the quality of maternal diet influences the risks of SGA or LGA has not been sufficiently studied.
In this thesis, my aims were to investigate glycemic properties of maternal diet in relation to preterm delivery and abnormal birth weight, defined as SGA and LGA. My overall motivation was to contribute new scientific knowledge that could provide supportive evidence for preventive interventions.

xiii
ABBREVIATIONSAS Artificially sweetened
AUC Area under curve
BMI Body mass index
BPD Biparietal diameter
CI Confidence interval
CMV Cytomegalovirus
CNS Central nervous system
CRH Corticotropin-releasing hormone
DHA Docosahexaenoic acid
DoHaD Developmental origins of health and disease
EPA Eicosapentaenoic acid
FFQ Food frequency questionnaire
FL Femur length
g Grams
GI Glycemic index
GL Glycemic load
GLUT Glucose transporters
HPA Hypothalamic-pituitary-adrenal
HR Hazard ratio
IL Interleukin
IUFD Intrauterine fetal death
IUGR Intrauterine growth restriction
IVF In vitro fertilization
kcal Kilocalorie
kJ KiloJoule

xiv
LGA Large for gestational age
LMP Last menstrual period
MAD Mean abdominal diameter
MAR Missing at random
MBRN Medical Birth Registry of Norway
MCAR Missing completely at random
MCP Monocyte chemoattractant protein
MJ MegaJoule
MMP Matrix metalloproteinase
MNAR Missing not at random
MoBa The Norwegian Mother and Child Cohort Study
NEC Necrotizing enterocolitis
OR Odds ratio
PG Prostaglandin
PPROM Preterm prelabor ruptures of membranes
PTD Preterm delivery
PTL Preterm labor
RCT Randomized control trial
ROS Reactive oxygen species
SGA Small for gestational age
SS Sugar-sweetened
TNF Tumor necrosis factor
VHHDI Very high human development index
xv
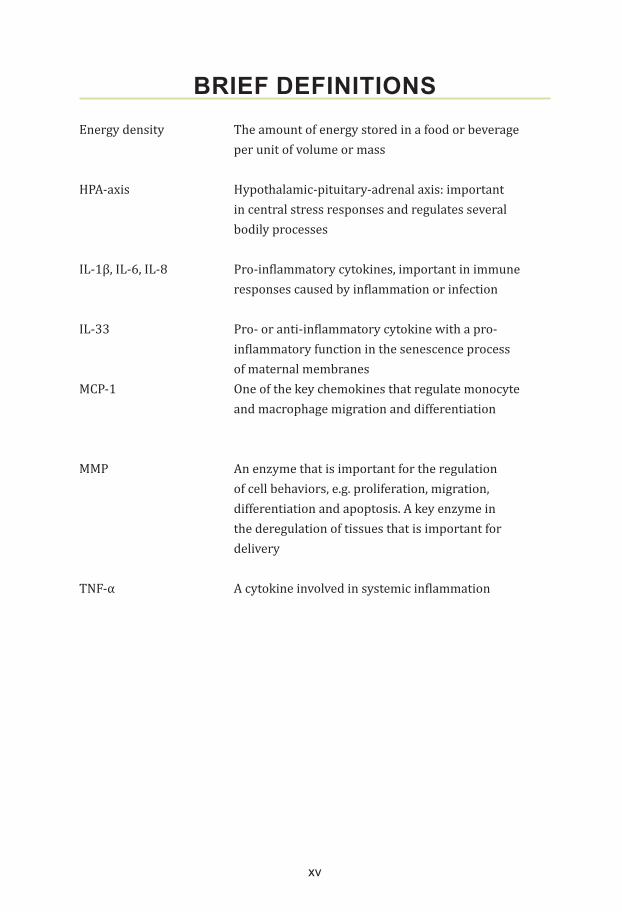
BRIEF DEFINITIONSEnergy density The amount of energy stored in a food or beverage
per unit of volume or mass
HPA-axis Hypothalamic-pituitary-adrenal axis: important in central stress responses and regulates several bodily processes
IL-1β, IL-6, IL-8 Pro-inflammatory cytokines, important in immune responses caused by inflammation or infection
IL-33 Pro- or anti-inflammatory cytokine with a pro-inflammatory function in the senescence process of maternal membranes
MCP-1 One of the key chemokines that regulate monocyte and macrophage migration and differentiation
MMP An enzyme that is important for the regulation of cell behaviors, e.g. proliferation, migration, differentiation and apoptosis. A key enzyme in the deregulation of tissues that is important for delivery
TNF-α A cytokine involved in systemic inflammation


17
1. INTRODUCTIONThis introductory section outlines current knowledge concerning preterm delivery and abnormal birth weight and their respective links to health problems. Risk factors, prevalence, potential mechanisms and treatment regimens are presented, followed by a brief explanation of the importance of maternal diet during pregnancy and mention of some of the studies that inspired the studies reported in this thesis. Dietary assessment methods, important for comprehending the subsequent sections are also presented.
1.1 Preterm deliveryPreterm babies, i.e. babies born before 37 complete gestational weeks, are at increased risk of several severe neonatal complications such as intraventricular hemorrhage, bronchopulmonary dysplasia, respiratory distress syndrome and severe infections. These babies also have a higher risk of developing lifelong complications such as impaired vision, impaired hearing, cerebral palsy, other CNS lesions and ischemic heart disease (1-5). Overall preterm delivery accounts for almost 75% of perinatal mortality (6) and increases the risk of long-term consequences nine-fold (7).
Definitions of preterm deliveryPreterm delivery is defined as giving birth before the completion of 37 gestational weeks (8), or at less than 259 days from the first day of the last menstrual period (LMP). It can also be defined based on ultrasound assessment (9). Preterm delivery can be further subdivided according to length of gestation and mode of delivery onset (10).
When it comes to gestational length late to moderately preterm delivery, occurring at gestational weeks 32+0 - 36+6, is the most common category, accounting for about 85% of all preterm deliveries. Early preterm delivery, occurring between gestational weeks 28+0 and 31+6, accounts for 10% of preterm deliveries, while extremely preterm delivery, occurring at less than 28+0 weeks of gestation, accounts for the remaining 5% of preterm births (11).
Preterm delivery can also be categorized as spontaneous or iatrogenic. More than half of preterm births are spontaneous. A spontaneous preterm delivery usually starts as preterm labor (PTL), with irregular or regular contractions that cause shortening and dilation of the cervix (12) (Figure 1). However, spontaneous preterm delivery can also start as preterm pre-labor rupture of membranes (PPROM), in which the fetal membranes break and the amniotic fluid leaks out

18
Linda Englund Ögge
before onset of contractions. In most cases of PPROM, contractions start within 24 hours of membrane rupture (13).
Figure 1. Clinical presentations of PTL and PPROM. Illustration: Jan Funke.
Iatrogenic preterm delivery comprises medically induced deliveries, including
conditions (10).
Prevalence of preterm delivery In total, 14.9 million babies were born preterm worldwide in 2010, representing 11% of all births, although preterm birth rates differ widely in different parts of the world. More than 60% of preterm deliveries occurred in sub-Saharan Africa and South Asia (14). The rate of preterm delivery in Europe is 5.5%–10% (15-17). In the US, the prevalence is higher, about 11%, while in Canada the rate is about 8% (15). In the Nordic countries, the prevalence is lower, 5%–7% (18).
The overall rate of preterm delivery is increasing worldwide (10), but has leveled
Sweden (19). The rate has declined somewhat in the US (20). Comparing preterm delivery rates in different countries is challenging. Assessment of gestational length and registration of birth differ, especially as countries register early deaths differently. Furthermore, different healthcare systems and socioeconomic conditions must also

19
Glycemic properties of maternal diet in relation to preterm delivery and abnormal birth weight
multiple pregnancy rates (16), and in vitro fertilization (IVF) rates also contribute to varying preterm delivery rates (16, 19). However, these known differences between populations fail to fully explain why preterm delivery rates differ, and further research is thus needed (21).
Mechanisms of preterm delivery Delivery is a complex process involving the interplay of many different organs and hormones. The exact mechanisms of delivery and preterm delivery are still not known but it is believed that several systemic changes lead to preterm delivery (22).
Inflammation plays a major role in the term and preterm delivery processes, which are both complex. Briefly; the production of pro-inflammatory cytokines, e.g. interleukin (IL)-1β, IL-6 and IL-8, increases in the inflammatory process. This alters transcription of proteins that promote, for example, myometrial contractility, and increases the number of progesterone receptors, oxytocin receptors, and gap junction connexins in the tissues. Other pro-inflammatory cytokines, e.g. IL-6, IL-8, monocyte chemoattractant protein (MCP)-1 and tumor necrosis factor (TNF)-α, are involved in the process, increasing the production and secretion of prostaglandins (PG), which in turn trigger uterine contractility, ripening of the cervix and degradation of the amniotic membranes. These pro-inflammatory cytokines also increase the expression of matrix metalloproteinase (MMP), which is responsible for the breakdown of collagen in the cervix and fetal membranes (23-25).
Other inflammation mechanisms are also involved. Oxidative stress is an important factor in preterm delivery. Reactive oxygen species (ROS) are formed in the mitochondria during cellular respiration and high levels of ROS in tissues are linked to chronic inflammation. An excess of ROS can cause changes in cellular DNA, leading to apoptosis or reduction of the telomeres (the very ends of the genome), which are linked to biological ageing or senescence (26). In this process, the ROS particles accumulate in the amniotic fluid, causing aging of the amniotic membranes. ROS induce an anti-inflammatory signal which releases different substances, e.g. IL-33, heat shock proteins, cell-free DNA and telomerase fragments, that affect aging and generate sterile inflammation. This leads to progesterone withdrawal in the myometrium and onset of contractions (27).
Progesterone is important in pregnancy, and decreased levels are associated with delivery. Administration of vaginal progesterone to women with a short cervix has been found to prevent some cases of PTL (28, 29).

20
Linda Englund Ögge
Imbalances in other systems may also be important for triggering preterm delivery. The hypothalamic-pituitary-adrenal (HPA) axis is important as a director of the maturity process leading to delivery. Corticotropin-releasing hormone (CRH) is found in both the placenta and the membranes. It is an important hormone, responsible for altered pathways, leading to changes in the amniotic membranes, increased uterine contractility and shortening of the cervix (30). It is also known that placental CRH increases the production and secretion of PG, which in turn directly cause myometrial contraction and PTL (25). In humans, increased CRH levels have been found as early as at gestational week 16 in women who subsequently deliver prematurely. Therefore, CRH has been suggested as the “placental clock” that modulates the timing of delivery (30).
Twin studies have demonstrated that stretching of the uterus increases the number of oxytocin receptors and sensitivity to contractions (31). Interestingly, uterine stretching also triggers an inflammatory response, involving the release of pro-inflammatory cytokines, important for preterm delivery (32).
Another known preterm delivery mechanism is placental abruption, which is seen in about 1% of pregnancies. Risk factors for abruption include hypertension, smoking, and infections (33).
Risk factors for preterm delivery There are several known risk factors for preterm delivery. Women with hypertension have a significantly increased risk (34), as do women with diabetes mellitus (35). Interestingly, maternal insulin resistance, hyperglycemia and high postprandial glucose levels are linked to polyhydroamnios and accelerating fetal growth, in turn related to PTL (36). Maternal underweight and obesity are also associated with preterm delivery (37, 38). Maternal weight-related complications, e.g. LGA or hypertension, are common reasons for induction of labor (39). Indeed, labor is induced more frequently in glucose-intolerant women (40).
Moreover, both chronic hypertension and diabetes increase the risk of placental changes (41), thereby affecting placental oxygen exchange (42), which in turn increases the risk of preeclampsia (43, 44). Women with preeclampsia are at increased risk of iatrogenic preterm delivery (45). Other known risk factors include multiple gestation and vaginal bleeding (46, 47).
Infections increase the risk of preterm delivery (48, 49), most commonly with bacteria colonizing the lower genital tract, e.g. Gardnerella vaginalis, Ureaplasma urealyticum, Mycoplasma hominis and various Bacteroides spp. (50, 51). While hematogenous spread is very rare, it is a pathway through which Listeria

21
Glycemic properties of maternal diet in relation to preterm delivery and abnormal birth weight
monocytogenes can disseminate. Moreover, several other bacterial infections are associated with PTL and PPROM, e.g. Escherichia coli, Staphylococcus aureus, Klebsiella spp, Haemophilus spp. and Trichomonas vaginalis (52-54).
The potential role of maternal diet and nutritional status in relation to preterm delivery has been studied, with particular focus on the role of long-chain poly-unsaturated marine fatty acids (55) and seafood (56, 57) Although promising, the results are not conclusive (58-61). Relatively few studies have examined other dietary components or dietary patterns in relation to preterm delivery, and more studies are warranted.
unknown in most cases (62) and further research is needed to prevent this condition and its consequences (21).
1.2 Birth weightAccording to national birth registry data, the average birth weight in Sweden and Norway is around 3,500 g (63). In addition to gestational length, birth weight is closely related to other factors, e.g. maternal pre-pregnancy BMI, educational level and parity (64). Moreover, it is dependent on genetic growth potential and often
(IUGR) refers to a pathological condition in which the baby has not reached its full growth potential (65). IUGR can have placental or cord-related causes or be
Figure 2. Causes of IUGR and relationships between IUGR and SGA (67).
SGANormal Growthbut small
Maternal causes:agesocioeconomic statussubstance abuse eg. smoking, alcoholpoor dietary intakedisorders e.g hypertension, diabetesgenetic factors
IUGRPlacental causes:placental infectionsvelamentous umbilical cord insertionmultiple infarctionsplacental dysfunctione.g preeclampsiagenetic factors
Fetal causes:chromosomal abnormalitiesgenetic syndromecongenital anomalitiescongenital infectionsmetabolic disordersgenetic factors

22
Linda Englund Ögge
Definitions of SGA and LGASGA and LGA are terms used for babies whose respective birth weights deviate from the norm for the respective gestational length. Unfortunately, there is no internationally accepted definition of SGA or LGA. Table 1 presents three different definitions used in Nordic and other European countries but other definitions are used in other parts of the world. It is thus important to take divergent definitions into account when comparing SGA and LGA prevalences and birth weight-related outcomes in studies (68-70).
Table 1: Definitions of small for gestational age and large for gestational age
SGA/LGA, ultrasound-based definition <2SD or > 2SD of the expected birth weight, according to Marsal’s ultrasound-derived growth curves (68)
SGA/LGA, population-based definition <10th percentile or >90th percentile, according to growth curves derived from the Norwegian population-based growth curves for newborns (69)
SGA/LGA, customized definition <10th percentile or >90th percentile, suggested by Gardosi (70), based on Hadlock’s ultrasound-derived growth curves (71) and infant sex and maternal weight, height, parity and ethnicity (72)
Prevalences of SGA and LGAIn 2010, more than 32 million babies were born SGA (population based- definition). Since SGA includes both pathological conditions and genetically smaller, normal babies, it is difficult to discern trends but it is believed that the prevalence of pathological SGA has declined (73). In contrast, LGA is on the increase, largely due to increased maternal BMI and maternal diabetes.
Risks and risk factors associated with SGA and LGAMaternal nutrition is a major contributor to fetal growth (74) but endogenous and exogenous factors can also cause growth to digress from its potential (75-77). SGA is common but only a fraction of cases are caused by IUGR (78). IUGR increases the risks of intrauterine fetal death (IUFD) (79), hypoxia during delivery (80) and neonatal complications (81) such as hypoglycemia (82) and necrotizing enterocolitis (NEC) (83).
Among the fetal causes of SGA are genetic potential, congenital malformations and infections. Placental dysfunction can cause SGA and is correlated to poor
23
Glycemic properties of maternal diet in relation to preterm delivery and abnormal birth weight
uteroplacental perfusion, occurring, for instance, in preeclampsia. Poor nutritional status, age (84), smoking and hypertension are among the maternal causes of SGA (85).
LGA is associated with prolonged delivery, excessive maternal hemorrhaging and severe vaginal ruptures, as well as cesarean section (86, 87). Known risk factors for LGA are high pre-pregnancy BMI and excessive weight gain (87). LGA is also more common among women with diabetes (88).
Prevention of SGA and LGAPreventing LGA and SGA would have significant clinical impact. Many of the causes of SGA are indeed preventable, e.g. by working towards alcohol abstinence during pregnancy, smoking cessation and more stringent management of hypertension. The single most important risk factor for LGA is maternal overweight; maternal nutritional status is thus a major contributor to birth weight (89), as indicated above. There is a clear dose-response relationship between birth weight and grade of obesity. A woman with a BMI >35 has a 13-fold higher risk of having an LGA baby (90).
It is well known that under-nutrition is related to SGA (91). In recent years, the focus has been not only on total energy intake but also on food quality and the overall diary pattern (92). Some studies have shown that an overall unhealthy dietary pattern increases the risk of SGA (93, 94), while others have found no correlations (95). Acquiring extensive knowledge of how maternal nutrition is associated with SGA and LGA is important in order to establish nutritional interventions aimed at reducing both infant and maternal mortality and morbidity rates. However, few studies have assessed associations between diet and SGA or LGA.
The respective definitions of SGA or LGA do not distinguish pathology from benign conditions but they are the best proxy measures currently available.
1.3 The importance of maternal dietThere has been a profound change in our understanding of the importance of nutrition during pregnancy and how it affects the baby’s health (96). Until the 1980s, consensus was that the fetus was protected by and lived more or less as a parasite on its mother, only being affected if maternal nutrition was extremely unbalanced or insufficient (97). Subsequent research, mostly thanks to the emergence of epigenetics, indicated a much more important role of maternal diet during pregnancy. Diet has an effect on all systems in the body, including the fetus, and abnormalities

24
Linda Englund Ögge
well below the levels linked to malnutrition can modulate different functions (e.g. gene expression, hormone concentrations and risk of developing disease later in life) (98-101). Barker and colleagues established one of the most important links between maternal diet and neonatal outcome (102), showing that fetal adaptation to prenatal and postnatal environments influences the genes controlling cellular and organ functions. According to the DOHaD (Developmental Origins of Health and Diseases) principle, changes in the intrauterine environment cause changes in fetal gene activity.
Over the last decades, people in the Western world have radically changed their dietary habits, from consumption of whole foods to consumption of industrially produced and processed foods. This transition has occurred in parallel with economic and social development. The result of a sedentary lifestyle, combined with high intakes of fat, sugar and salt, is a dramatic increase in diet-related chronic diseases such as obesity, diabetes, cardiovascular disease and cancer, the most common global causes of death and a great burden on society (3). Increased understanding of the role of diet for health and disease has also prompted interest in its role in adverse pregnancy outcomes (60), for instance abnormal birth weight (103), hypertensive disorders in pregnancy (104) and preterm delivery (105).
1.4 Glucose metabolism in pregnancyThe placenta mediates the exchange of nutrients, oxygen and waste products between the fetus and the mother. Two layers, the fetal endothelium and the syncytiotrophoblast, separate the maternal and fetal circulations. Several factors affect the exchange process, e.g. utero-placental blood flow, nutrient concentration gradient, wall thickness, the area of exchange and placental metabolism. Amino acids cross the placental layers via specific transporters and fatty acids in a multi-step process. Glucose is transported by specific glucose transporter proteins called GLUTs (Figure 3). There are at least 14 known GLUT families, several of which are expressed in the placenta, with varying expression patterns during pregnancy. GLUT 1 is the most common placental version (106).
Glucose transport across the placenta is proportional to the maternal plasma glucose concentration. While glucose is the main fetal energy substrate, the fetus is incapable of gluconeogenesis so all its glucose comes from the mother. An increase in maternal postprandial plasma glucose leads to an increase in glucose flux across the placenta, in turn increasing fetal insulin production. An excess of insulin increases the risk of macrosomia and possibly also of preterm delivery (107). Interestingly, it has been found that women’s choices of diet and beverages, as well as their

25
Glycemic properties of maternal diet in relation to preterm delivery and abnormal birth weight
level of physical activity, alters the expression of placental glucose transporters. Furthermore, high sugar intake increases GLUT-1 expression (108).
Figure 3. Placental transporters. Brett et al. Maternal–Fetal Nutrient Transport in Pregnancy Pathologies: The Role of the Placenta. Int. J. Mol. Sci. 2014, 15(9), 16153-16185.
Carbohydrates, which are responsible for the postprandial rise in plasma glucose, are composed of monosaccharides, i.e. glucose, fructose and galactose. Glucose generates high plasma glucose peaks due to its rapid and complete absorption. The glycemic responses to fructose and galactose are much lower because their absorption from the intestine is low (109), although fructose has a negative metabolic effect by providing the backbone for triacylglycerol (110). Disaccharides are constructed from two monosaccharides and polysaccharides are constructed from many monosaccharides (109).
1.5 Influence of diet on glucose metabolism
High sugar intake In this thesis, the overall focus is on characteristics of maternal diet that influence maternal blood glucose level, in relation to adverse pregnancy outcomes. Plasma glucose levels can be affected by specific dietary components such as high added sugar content, overall dietary composition, meal frequency/pattern and glycemic properties of the nutrients. Carbohydrate content and quality of the diet directly affect plasma glucose levels, while fat and protein content indirectly affect plasma glucose levels, for instance via delayed gastric emptying. Carbohydrates can be divided into simple (e.g. sucrose, glucose and fructose) and complex (e.g. starch and
26
Linda Englund Ögge
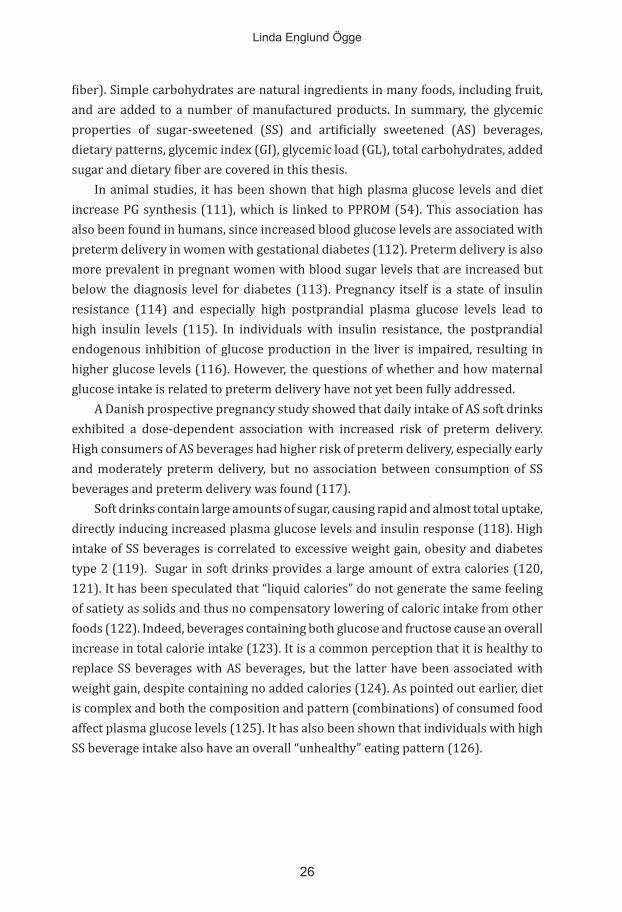
fiber). Simple carbohydrates are natural ingredients in many foods, including fruit, and are added to a number of manufactured products. In summary, the glycemic properties of sugar-sweetened (SS) and artificially sweetened (AS) beverages, dietary patterns, glycemic index (GI), glycemic load (GL), total carbohydrates, added sugar and dietary fiber are covered in this thesis.
In animal studies, it has been shown that high plasma glucose levels and diet increase PG synthesis (111), which is linked to PPROM (54). This association has also been found in humans, since increased blood glucose levels are associated with preterm delivery in women with gestational diabetes (112). Preterm delivery is also more prevalent in pregnant women with blood sugar levels that are increased but below the diagnosis level for diabetes (113). Pregnancy itself is a state of insulin resistance (114) and especially high postprandial plasma glucose levels lead to high insulin levels (115). In individuals with insulin resistance, the postprandial endogenous inhibition of glucose production in the liver is impaired, resulting in higher glucose levels (116). However, the questions of whether and how maternal glucose intake is related to preterm delivery have not yet been fully addressed.
A Danish prospective pregnancy study showed that daily intake of AS soft drinks exhibited a dose-dependent association with increased risk of preterm delivery. High consumers of AS beverages had higher risk of preterm delivery, especially early and moderately preterm delivery, but no association between consumption of SS beverages and preterm delivery was found (117).
Soft drinks contain large amounts of sugar, causing rapid and almost total uptake, directly inducing increased plasma glucose levels and insulin response (118). High intake of SS beverages is correlated to excessive weight gain, obesity and diabetes type 2 (119). Sugar in soft drinks provides a large amount of extra calories (120, 121). It has been speculated that “liquid calories” do not generate the same feeling of satiety as solids and thus no compensatory lowering of caloric intake from other foods (122). Indeed, beverages containing both glucose and fructose cause an overall increase in total calorie intake (123). It is a common perception that it is healthy to replace SS beverages with AS beverages, but the latter have been associated with weight gain, despite containing no added calories (124). As pointed out earlier, diet is complex and both the composition and pattern (combinations) of consumed food affect plasma glucose levels (125). It has also been shown that individuals with high SS beverage intake also have an overall “unhealthy” eating pattern (126).
27
Glycemic properties of maternal diet in relation to preterm delivery and abnormal birth weight
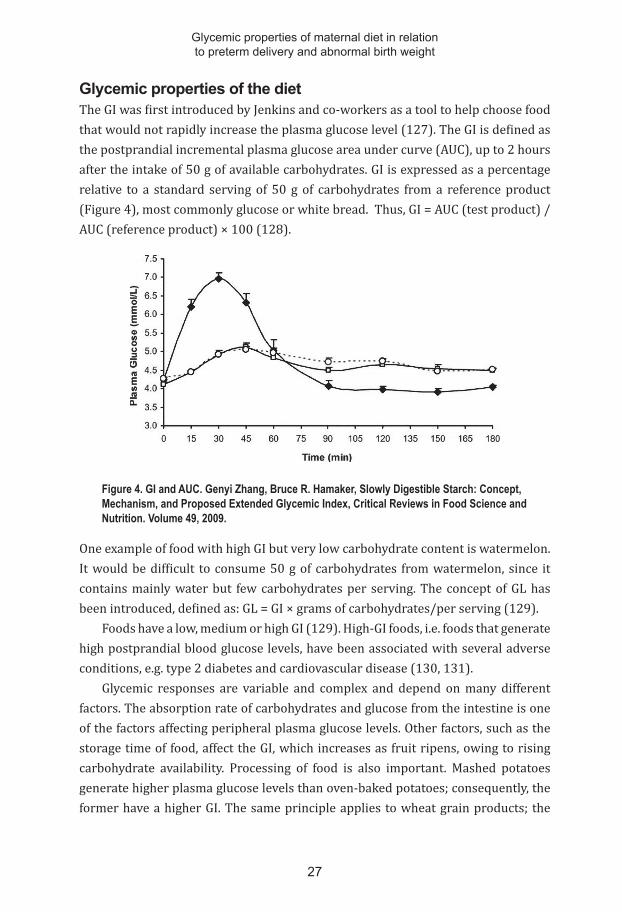
Glycemic properties of the diet The GI was first introduced by Jenkins and co-workers as a tool to help choose food that would not rapidly increase the plasma glucose level (127). The GI is defined as the postprandial incremental plasma glucose area under curve (AUC), up to 2 hours after the intake of 50 g of available carbohydrates. GI is expressed as a percentage relative to a standard serving of 50 g of carbohydrates from a reference product (Figure 4), most commonly glucose or white bread. Thus, GI = AUC (test product) / AUC (reference product) × 100 (128).
Figure 4. GI and AUC. Genyi Zhang, Bruce R. Hamaker, Slowly Digestible Starch: Concept, Mechanism, and Proposed Extended Glycemic Index, Critical Reviews in Food Science and Nutrition. Volume 49, 2009.
One example of food with high GI but very low carbohydrate content is watermelon. It would be difficult to consume 50 g of carbohydrates from watermelon, since it contains mainly water but few carbohydrates per serving. The concept of GL has been introduced, defined as: GL = GI × grams of carbohydrates/per serving (129).
Foods have a low, medium or high GI (129). High-GI foods, i.e. foods that generate high postprandial blood glucose levels, have been associated with several adverse conditions, e.g. type 2 diabetes and cardiovascular disease (130, 131).
Glycemic responses are variable and complex and depend on many different factors. The absorption rate of carbohydrates and glucose from the intestine is one of the factors affecting peripheral plasma glucose levels. Other factors, such as the storage time of food, affect the GI, which increases as fruit ripens, owing to rising carbohydrate availability. Processing of food is also important. Mashed potatoes generate higher plasma glucose levels than oven-baked potatoes; consequently, the former have a higher GI. The same principle applies to wheat grain products; the

28
Linda Englund Ögge
more processed the grain, the higher the GI and the postprandial plasma glucose response. Furthermore, food texture is important. Soft and farinaceous foods, e.g. King Edward potatoes, lead to higher postprandial plasma glucose levels than potatoes with a firmer texture, e.g. Bintje. The cooking method also affects GI. Pasta al dente causes lower postprandial plasma glucose increases than pasta cooked longer. The fat and fiber contents of food tend to lower postprandial plasma glucose levels because they delay emptying of the stomach (132-134). These factors are important to understand and consider when assessing GI in relation to different outcomes.
Babies of both diabetic and non-diabetic pregnant women with higher plasma glucose levels are at higher risk of high birth weight (135-137). An Australian study found that women with a medium-/high-GI diet during pregnancy had babies with significantly higher birth weights than those consuming a low-GI diet. The low-GI diet has been recommended for pregnant women (138). However, Scholl et al. found, in a prospective study of over 1,000 healthy pregnant women, that low-GI foods doubled the risk of having a SGA baby (139). According to a meta-analysis, more studies regarding the safety of consuming low-GI foods during pregnancy (140) are needed. A study from the US found that high dietary GI was associated, with borderline significance, with a higher risk of preterm delivery (141). Another study found that dietary GL was associated with preterm delivery among overweight and obese women (142).
Meal frequency Irregular meals are related to adverse effects on postprandial glucose concentrations and increased insulin resistance (143, 144). The importance of meal frequency for human health and the prevention of disease is under debate (145-147). Recommendations regarding meal regularity and frequency may be important during pregnancy (148), since animal studies have shown that longer periods of food withdrawal increase PG production (149) and uterine contractions (150).
Mediterranean-type dietA Mediterranean-type diet is characterized by high intakes of fish, vegetable oils, fruit, vegetables and nuts, and low intakes of red meat, dairy products, and eggs (151). The Mediterranean-type diet or components thereof have been shown reduce the risks of atherosclerosis, type 2 diabetes (125) and major cardiovascular events, probably due to beneficial effects on lipoproteins (152). This type of diet is rich in natural antioxidants and dietary fiber and entails a balanced fat intake (153). It has been speculated that since lipoprotein production increases during pregnancy (154),

29
Glycemic properties of maternal diet in relation to preterm delivery and abnormal birth weight
the maternal lipid profile might be associated with adverse obstetric outcomes, e.g. preterm delivery (155).
Foods with prebiotic or probiotic propertiesIn a sub-study of 18,000 women participating in the Norwegian Mother and Child Cohort Study (MoBa), it was found that high intakes of dried fruit and garlic were associated with reduced risk of spontaneous preterm delivery and PPROM. It was speculated that food with antimicrobial or prebiotic characteristics accounted for this reduced risk (156). Dietary fiber, resistant starches and oligosaccharides that can alter gut microflora composition in favor of potentially health-promoting bacteria, with consequent beneficial systemic effects, are regarded as prebiotic foods (157). The definition of a probiotic food is not entirely standardized but the term refers to live microbes that either impact on the gut microbiota or enhance immune responses (158). A high intake of milk-based probiotic products has been associated with a significantly reduced risk of spontaneous preterm delivery (159) and preeclampsia (160).
1.6 Dietary assessment methodsAccurate assessment of the “true” habitual diet in large population groups is a challenge, as all available dietary assessment methods have shortcomings. Studies of diet-disease relationships receive much attention and criticism because the exposure is both of immediate interest and notoriously difficult to measure (161).
Information about dietary intake can be collected either through objective or subjective observations (162). One objective method is to analyze specific biological markers in blood, urine, hair, nails or other tissues (163, 164). However, the high cost of sampling and analysis and the existence of only a few validated biomarkers are major limitations. Moreover, the biomarker method captures only a single component of the diet, while the habitual diet contains substances acting together (162, 165). The duplicate diet approach is another objective dietary assessment method, in which study subjects (or staff observing what subjects eat) weigh and put aside a duplicate portion of all the food consumed throughout a defined period. This method is mostly used for analysis of contaminant concentrations. It is expensive and not suitable for assessing diet in large populations (162).
Subjective dietary assessment methods include the “24-hour recall”, “dietary record”, “dietary history” and “food frequency questionnaire” (FFQ) approaches (162). The 24-hour recall method entails an interview-based survey to collect detailed information about dietary intake during the previous 24 hours. Trained

30
Linda Englund Ögge
interviewers typically ask participants about food type, brand, levels of intake (in cups, bowls, glasses, etc.), food preparation, timing, etc. This in-depth interview usually takes 20 to 30 minutes. The disadvantages of this method relate to the risk of the subject’s possibly defective memory and to the interviewer’s skill in accurately eliciting the subject’s dietary intake. The method is not applicable for assessing intake over long periods of time. However, if two or more 24-hour recalls are achieved, the usual intake of specific nutrients or substances can be modelled using probabilistic models that take between-person and with-person variation into account (166).
The dietary record method is based on the same principle, i.e. that all foods and beverages should be recorded, although it differs in that the study participant prospectively records all items he or she consumes throughout a defined period. This requires some training or initial instructions. The dietary records are usually filled out over several days, e.g. three consecutive weekdays and one Saturday and Sunday. The record should preferably represent “typical” days for the participant. This method is cheap and the fact that reported intake will mirror actual intake, if typical days are recorded, is also an advantage. However, there are also disadvantages, for instance that highly motivated participants are needed, since all intakes must be measured and weighed. This usually means that a specific group of participants is selected, so results may not be representative of the overall population. This method can also affect the actual intake, since the study participant may consider it too tedious to record all intakes, with the consequent risk that some will be skipped (167).
The FFQ method was introduced in the nineties and consists of a food list with frequency responses. Selection of food items and the length of the food list are central when creating a FFQ. The FFQ has been heavily criticized because of doubts related to its accuracy (168-170). However, it is now considered to be an important tool for investigating dietary intake in large populations. The FFQ is usually semi-quantitative, meaning that the study participant should report both amounts and intake frequencies of food and beverages. Information about serving sizes, e.g. cups or tablespoons, should be provided in the questionnaire and clear to the participants. The FFQ must be well-structured so that it accurately reflects intakes of the main foods and beverages consumed by the study population. Competently implemented, it can effectively record dietary intake data from a very large cohort (167, 171). In our four studies, we have used a FFQ specifically developed and validated for use in the MoBa.

31
2. AIMSThe primary aims of this thesis were to study associations between the glycemic properties of maternal diet during pregnancy and the risks of preterm delivery and abnormal birth weight.
The objectives of the specific papers were to:
• investigate the associations between maternal consumption of AS and SS beverages and preterm delivery (Paper I)
• determine whether maternal dietary patterns are associated with preterm delivery (Paper II)
• examine whether meal frequency patterns are related to preterm de-livery, as well as study associations between preterm delivery and GI/GL, consumption of total carbohydrates, added sugar and dietary fiber in maternal diet (Paper III)
• explore the associations between maternal dietary patterns and the risks of SGA and LGA (Paper IV)


33
3. METHODSThe Norwegian Mother and Child Study This thesis comprises four observational studies, all based on data from the MoBa. MoBa is a population-based pregnancy cohort study with a prospective design, conducted by the Norwegian Institute of Public Health. Its overall aims are to detect early signs of disease and to investigate the development of disease. Participants were recruited from all over Norway between 1999 and 2008. Women were invited to participate in connection with the routine ultrasound examination offered free of charge to all women in Norway around gestational week 17-19. Consent was given by 41% of these pregnant women. The MoBa cohort currently includes 114,500 children, 95,200 mothers and 75,200 fathers. Follow-up is conducted by questionnaires and by linkage to national health registries. The MoBa cohort database is linked to the Medical Birth Registry of Norway (MRBN). Blood samples are obtained from both parents during pregnancy and from mothers and babies (umbilical cord) at birth (Figure 5). A broader discussion of MoBa aims and methods is found in Magnus et al. (172).
Figure 5. MoBa data collection points for data used in Papers I-IV. Illustration by Jan Funke.
In our four studies, we used MoBa data from three questionnaires answered during pregnancy, i.e. at gestational weeks 15-17 (questionnaire 1), 22 (questionnaire 2) and 30 (questionnaire 3). Questionnaires 1 and 3 cover women’s lifestyle, sociodemographic variables, illness and health-related factors (173). Questionnaire 2 is a semi-quantitative FFQ, in which women reported eating habits during the current pregnancy, i.e. the average frequencies of food, drink and dietary supplement
Child
Mother
Father
Week 17 Week 22 Week 33 Birth 6 months 18 months 3 years 7 years
Umbillical cord
Q1 Q3 Q4 Q6Q2 Q5 Q7

34
Linda Englund Ögge
intakes since the start of pregnancy. Information about gestational length and birth weight was obtained from the MRBN.
3.1 Study population
Mother and Child Cohort study
Total MoBa Sample (Version 5), 1999-2008, n=108,264 children
Study I: Excluded (24,561):
Multiple births: n=3,805 Not answered Q1: n=5,230 Not answered FFQ: n=14,129 Invalid energy intake: n=1,397
Study II-VI: Excluded (24,878):
Multiple births: n=3,805 Not live births: n=624 Not answered Q1: n=5,193 Not answered FFQ: n=13,920 Invalid energy intake: n=1,336
Total n=83,703 eligible for analysis Excluded (22,942)
Missing data covariates: n=6,630
Not live birth: n=317 Restrict first participation: n=6,871
n=931 n=8,193
Diabetes Pregnancy duration <154 or >293 days:
Study sample study I
Total n=60,761 mother-infant pairs
Total n=83,386 eligible for analysis. Excluded (17,386):
Missing information parity: n=51 Missing information PTD: n=42
n=9,488 n=1,007 n=6,798
: Diabetes Pregnancy duration <154 or >293 days:
Study sample II and III part 2:
Total n=66,000 mother-infant pairs
“Excluded, missing meal frequency information
frequency: n=513
Study sample study III part 1:
n=65,487 mother-infant pairs
Excluded, inaccurate infant anthropometric data
n=96
Study sample study IV:
n=65,904 mother-infant pairs

35
Glycemic properties of maternal diet in relation to preterm delivery and abnormal birth weight
In Study I, women (Figure 6) were eligible for inclusion if they were registered in the MBRN with a singleton live delivery and had answered questionnaires 1 and 2. The FFQ developed for MoBa was introduced in 2002 and the number of women excluded due to “not answered FFQ” is thus high. Around 10,000 women answered a different FFQ, covering intakes during the year prior to pregnancy. To be included in the study, women had to have an energy intake within a plausible range (4.5 MJ to 20 MJ), described in detail elsewhere (173). Women with missing information about covariates (previous preterm delivery, maternal age, smoking, pre-pregnancy BMI, height, total energy intake, marital status, parity and educational level) were excluded. Birth between gestational weeks 22+0 and 41+6 was an additional inclusion criterion. To avoid the use of multiple dependent observations, only the first pregnancy enrolled in the MoBa was included, irrespective of parity. Finally, we decided to exclude women with any type of diabetes mellitus (type 1, type 2, gestational diabetes and other subtypes), because dietary modification is a vital part of management. This resulted in a study population of 60,761 women.
In Studies II and III (both part I and II), we decided not to exclude women with missing information on pre-pregnancy BMI and maternal education, instead placing them in a category of their own.
In Study III, part I, women with missing information about meal frequency were also excluded, resulting in a study sample of 65,487 women.
Study IV was based on the 66,000 women from Study II but we also excluded an additional 96 women, due to inaccurate information about infant anthropometric measurements, resulting in a total study cohort of 65,904 women.
3.2 Study designAll four studies in this thesis have a observational prospective study design, in which all participants provided information about the exposure (dietary intakes) before the outcomes occurred (174).
3.3 Exposure variable: maternal diet Data in this thesis are based on MoBa data. As mentioned above, the FFQ in these studies has been used from March 2002 and onward. It was validated in a subsample including 119 cohort participants (175). The FFQ has a semi-quantitative design, meaning that participants fill in intake frequencies and amounts for the included food and beverage items. It was designed to provide information on eating and drinking habits during the first 4–5 months of pregnancy. A total of 255 food and beverage items are covered in the FFQ. Women were instructed to indicate frequency by
36
Linda Englund Ögge
choosing one of 8-10 options ranging from several times daily, weekly, or monthly, to never. The FFQs were optically read and food frequencies were converted into daily intakes grams/day. Intakes of energy and nutrients were calculated with FoodCalc and the Norwegian Food Composition Table (176).
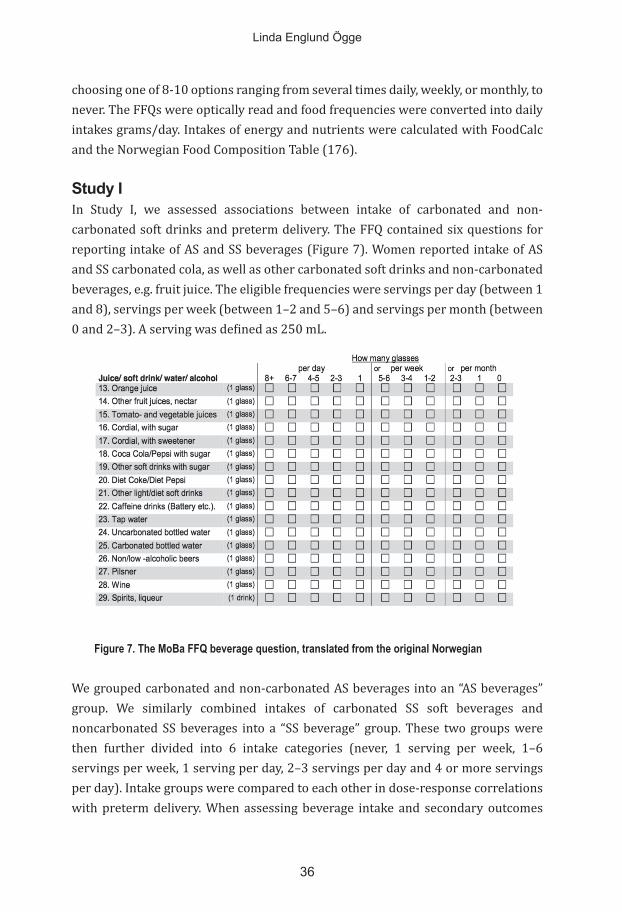
Study I In Study I, we assessed associations between intake of carbonated and non-carbonated soft drinks and preterm delivery. The FFQ contained six questions for reporting intake of AS and SS beverages (Figure 7). Women reported intake of AS and SS carbonated cola, as well as other carbonated soft drinks and non-carbonated beverages, e.g. fruit juice. The eligible frequencies were servings per day (between 1 and 8), servings per week (between 1–2 and 5–6) and servings per month (between
We grouped carbonated and non-carbonated AS beverages into an “AS beverages” group. We similarly combined intakes of carbonated SS soft beverages and noncarbonated SS beverages into a “SS beverage” group. These two groups were then further divided into 6 intake categories (never, 1 serving per week, 1–6 servings per week, 1 serving per day, 2–3 servings per day and 4 or more servings per day). Intake groups were compared to each other in dose-response correlations with preterm delivery. When assessing beverage intake and secondary outcomes

37
Glycemic properties of maternal diet in relation to preterm delivery and abnormal birth weight
(gestational age, mode of delivery and preterm delivery in different BMI groups), the frequency alternatives were reduced to 1 serving per week, 1–6 servings per week and more than 1 serving per day. This distribution was chosen since we aimed to compare our results with a another similar cohort study of Danish women (117).
Studies II and IVIn Study II, we examined the associations between three maternal dietary patterns and the risk of preterm delivery. All participants had scores on all patterns and each of the three patterns were adjusted for the other patterns. In Study IV, we started with the same dietary patterns but divided the participants into non-overlapping dietary pattern groups and examined the associations between these groups and SGA and LGA. Defining dietary patterns, rather than focusing on single foods or nutrients, is a well-established method of studying overall dietary behavior in a population. The foods and beverages in the FFQ were combined into 58 non-overlapping food groups. These new groups were similar in nutritional content, common characteristics and culinary use. For instance, the “white bread” group contained white bread, low-fiber bread, baguette and ciabatta and the “fruit juice” group contained orange juice, apple juice, etc. The “oily fish” group contained mackerel, herring, salmon and trout. Extraction of dietary patterns using principle component factor analysis is described in more detail later in this section.
Study III In Study III, we aimed to study whether meal frequency patterns were associated with preterm delivery. The FFQ covered how often women consumed meals on a weekly basis and included questions about eight meals: breakfast, morning snack, lunch, afternoon snack, dinner, evening snack, supper and, night meal (Figure 8). Response alternatives ranged from zero to seven times weekly. In this study, other glycemic properties of maternal diet were also assessed and a GI database was constructed based on the FFQ, using values from international GI reference tables (177). Dietary GL for each participant was calculated by adding the GI of each food item, divided by the amount of carbohydrates from the foods. We also calculated daily intake of total carbohydrates, added sugar and dietary fiber, based on the FFQ data.

38
Linda Englund Ögge
3.4 Outcome variables
Preterm delivery
between gestational weeks 22+0 and 36+6 or at 154-258 days of gestation. In Study I, all 60,761 women’s gestational ages were calculated based on fetal biparietal diameter and femur length on routine ultrasound at gestational week 17-19. In Studies II-IV, information about ultrasound was missing in 1,154 cases (1.7%) and gestational age was therefore calculated based on the LMP. Preterm delivery was sub-divided into late (34+0 – 36+6 wks.), moderately (32+0 – 33+6 wks.) and early (22+0 – 31+6 wks.) preterm. Preterm delivery was also studied according to subgroups based on onset, i.e. spontaneous or iatrogenic. In Studies II-IV, the material was also separately analyzed for PPROM.
Birth weight In Study IV, our primary outcomes were the prevalences of SGA and LGA, according
customized ultrasound-based growth standards (see Introduction).
associations observed in the full sample are consistent in all subgroups of the study
interacts with exposure. In sensitivity analyses, the robustness of the association

39
Glycemic properties of maternal diet in relation to preterm delivery and abnormal birth weight
is tested by excluding a subgroup. In stratified analyses, on the other hand, the associations are studied separately by subcategories of another variable (e.g. age, educational level, etc.). When analyses are performed in separate strata, it is more important to evaluate whether the effect estimates are comparable than whether associations are statistically significant. BMI is one example of a relevant variable to examine by sub-strata, as overweight/obesity is associated with insulin resistance, low-grade systemic inflammation (178, 179), and increased risk of preterm delivery (37). BMI is also closely associated with birth weight (180). In Studies II-III, we also stratified the analyses by parity since it is known that food and beverage intakes differ with increasing parity (181). In Study III, the association between glycemic properties of maternal diet and preterm delivery was also stratified by age (<35 years and 35+ years), as the “older” women usually have more risk factors for cardiovascular disease (182) and are therefore more vulnerable to food that quickly increases plasma glucose levels. There were 54,792 women under the age of 35 and 11,208 women aged over 35 in this study. In Studies II-III, stratified analyses were performed for time of delivery (subgroups: late, moderately and early preterm) and for mode of delivery (subgroups: iatrogenic and spontaneous preterm).
3.5 Statistical Methods All statistical analyses were performed with Statistical Package for the Social Sciences (SPSS), version 19 for Windows (IBM SPSS Statistics). For assessment of normal distribution, we used the Kolmogorov-Smirnov test. Moreover, we visually inspected histograms and curves in addition to descriptive statistics (skewness and kurtosis). P values were 2-sided, and values <0.05 were considered statistically significant. Continuous variables were described as means and ± standard deviations (SD), whereas categorical variables were described as frequencies. Logistic regression models, presented below, were used to examine associations between exposures and the outcomes preterm delivery and SGA/LGA. P values for linear trend were obtained by incorporating the categorical exposure variable as a linear term in the respective regression model.
Study I We used binary logistic regression analyses to examine the associations between intake of AS and SS beverages and preterm delivery. All regression analyses were performed crudely as well as with adjustment for maternal age, pre-pregnancy BMI, height, total energy intake, marital status, parity, smoking, education, previous preterm delivery and the other beverage.

40
Linda Englund Ögge
Studies II and IVPrinciple component factor analysis was used to extract dietary patterns. This is a common method for dietary pattern identification. The method is used to reduce a large number of variables to new linear factors by grouping correlated variables. The dietary patterns (components) derived by principle component factor analysis reflect the combinations of foods consumed by individual participants.
When food and beverage intakes were input variables, we extracted three patterns that were respectively named “prudent”, “Western” and “traditional”, based on the food items and beverages with high factor loadings in the pattern. Factor loadings are the correlations of each input variable (food item) with that factor. The total cumulative variance from these patterns was 16%. Food items with factor loadings ≥ ± 0.25 were considered important for interpretation of patterns. The number of patterns to extract is a subjective decision made by evaluation of a Scree plot and the interpretability of the patterns. A Scree plot shows the proportion of the variance in the input variables (total consumption) explained by each pattern/component (183). Figure 9 is the Scree plot for evaluation of dietary patterns in Studies II and IV.
Figure 9. Scree plot for identification of dietary components factor analysis in Studies II and IV. Published by the BMJ 2014;348 doi: https://doi.org/10.1136/bmj.g1446.

41
Glycemic properties of maternal diet in relation to preterm delivery and abnormal birth weight
We used Bartlett’s Test of Sphericity and the Kaiser-Mayer-Olkin test (KMO) to assess sampling accuracy and to test whether the input variables were sufficiently correlated for principle component factor analysis to be appropriate. Bartlett’s Test of Sphericity should be significant and this was the case in our study (p<0.001). KMO values between 0.8-1 are considered good, values between 0.6-0.8 are considered acceptable, values between 0.5-0.6 can be acceptable depending on the number of input variables, while values < 0.5 indicate that the other methods should be used (184, 185).
When food and drink items were input variables, the KMO value was 0.67. Dietary pattern scores/factor scores are created by multiplying the factor loading for each input variable with the corresponding standardized value of the variable, i.e. food and beverage items, and adding all these items. Factor scores indicate the extent to which a participant’s diet conformed to the respective dietary patterns. SPSS calculates factor scores for the number of patterns determined by the researchers, i.e. three patterns in the case of Studies II and IV. These factor scores served as the exposure variables and were used both as continuous variables and divided into tertiles. In Study II, we used the Cox regression model and results were presented as hazard ratio (HR) and 95 % confidence interval (95% CI). We adjusted data for maternal age, pre-pregnancy BMI, height, total energy intake, marital status, parity, smoking, education, previous preterm delivery and the alternative beverage, as in Study I, but we also additionally adjusted for total household income.
Study III (part I and II)The meal frequency patterns were also extracted by principle component factor analysis in the SPSS. Bartlett’s Test of Sphericity was significant (p <0.01) and the KMO value was 0.50, which was acceptable, given the relatively low number of input variables (n= 8 meals) and the low number of alternative meal frequency responses (ranging from 0 to 7 times per week). To compensate for the low KMO value, we considered meals with factor loadings >± 0.50 important for the interpretability of each meal frequency pattern’s characteristics. From the Scree plot, we extracted three meal frequency patterns (Figure 10) and we named them: “main meal” pattern, “snack meal” pattern and “evening meal” pattern.

42
Linda Englund Ögge
Figure 10. Scree plot for identification of dietary components factor analysis used in Study III.
These three patterns accounted for 52% of the variation in reported meal frequencies. Meal frequency pattern scores were divided into quartiles as well as mean daily intake of the glycemic properties, i.e. GI, GL, total carbohydrates, added sugar and dietary fiber. In this study, we also applied the Cox regression model. Crude and adjusted data were used and results were presented as HR with 95% CI. All meal frequency patterns were entered into the same model. The models were adjusted for the same confounding factors as in Studies II and IV, but with additional adjustments for dietary fiber. In additional analyses, we also adjusted for alcohol intake, first- trimester nausea and working irregular hours. Since we did multiple testing, we also performed a modified Bonferroni correction in which the sum of all p values were added and then divided by the total number of analyses. Moreover, we also performed a Bonferroni post hoc test to analyze differences between BMI categories in relation to the main meal pattern.
Study IV In the fourth study, we used tertiles of the three dietary pattern scores assessed in Study II to create non-overlapping dietary patterns comprising individuals with the highest scores in each pattern. We named these non-overlapping patterns “high prudent”, “high Western” and “high traditional” (Table 2). Women with pattern scores that did not fit into any of these predefined groups were classified as the “mixed”

43
Glycemic properties of maternal diet in relation to preterm delivery and abnormal birth weight
group. To be included in the high prudent group, women had to be in the highest tertile of the prudent pattern group, as well as scoring in the middle or lowest tertile of the other two patterns. The high Western and high traditional patterns were similarly defined. The high Western group was set as the reference category in the regression analyses.
We used the four non-overlapping dietary pattern groups as the exposure variable in multiple logistic regression models, with SGA or LGA as the outcome. Results are presented as odds ratios (OR) and 95% CI. Variables included in the adjusted models were: maternal age, height, BMI, parity, smoking, alcohol intake, maternal education, household income and total energy intake.
Table 2. Composition of the non-overlapping patterns
High prudent * Third tertile of the prudent dietary pattern* Second tertile of the Western dietary pattern * Second tertile of the traditional dietary pattern* First tertile of the Western dietary pattern* First tertile of the traditional dietary pattern
High Western * Third tertile of the Western dietary pattern* Second tertile of the prudent dietary pattern * Second tertile of the traditional dietary pattern* First tertile of the prudent dietary pattern* First tertile of the traditional dietary pattern
High traditional * Third tertile of the traditional dietary pattern* Second tertile of the prudent dietary pattern * Second tertile of the Western dietary pattern* First tertile the dietary pattern* First tertile of the Western dietary pattern
Mixed *All other combinations of dietary patterns
3.6 Ethical and other approvalsThe Regional Committee for Ethics in Medical Research (REK 2010/2683) (S-06075) and the Data Inspectorate in Norway approved the study. Written informed consent was obtained from all participants. Data from MoBa are available to all qualified researchers/research groups in Norway, as well as to international researchers collaborating with a Norwegian researcher. All researchers wishing to access MoBa data must obtain a project-specific approval from the Regional Committee for Medical and Health Research Ethics before questionnaire data can be released. All manuscripts, including syntax files, must also be submitted to MoBa and approved before publication (186).


45
4. RESULTS The main results in the four papers are summarized in this introductory section.
In Study I, we assessed associations between AS and SS beverages and preterm delivery (187). We found that high intakes of AS and SS beverages were both associated with preterm delivery. Drinking SS beverages on a daily basis was also associated with a higher risk of preterm delivery in overweight women. Trend tests were positive for both beverages.
In Study II, we aimed to investigate whether the observed associations in Study I could be explained by overall maternal dietary patterns. Associations between dietary patterns and preterm delivery were analyzed (188). We found that an overall prudent dietary pattern was associated with a significantly decreased risk of preterm delivery, as well as with a significantly lower risk of late and spontaneous preterm delivery. No independent association between the Western dietary pattern and preterm delivery was found. The traditional dietary pattern was associated with a small but significantly decreased risk of preterm delivery.
Overall meal frequency is important for glycemic control and in Study III, we assessed potential associations between maternal meal frequency patterns and preterm delivery. We found that women with high adherence to a main meal pattern (breakfast, lunch and dinner) had a significantly reduced risk of preterm delivery, compared to low adherence to the same pattern. High adherence to the main meal pattern was also associated with a lower risk of late preterm delivery and a lower risk of preterm delivery in overweight women. No significant associations between the glycemic properties (GI, GL, total carbohydrates, added sugar and dietary fiber) and preterm delivery were observed.
In Study IV, we wanted to assess whether maternal diet was associated with SGA/LGA. We studied associations between non-overlapping maternal dietary patterns and risks of SGA and LGA. A high prudent diet was associated with increased risk of SGA and decreased risk of LGA, compared to a high Western diet. High adherence to a traditional diet was associated with increased risk of LGA.

46
Linda Englund Ögge
4.1 Study I.
Associations between intake of artificially sweetened and sugar-sweetened beverages and preterm delivery: a large prospective cohort studyOur primary outcome was preterm delivery, which occurred in 5.2% of the women in the cohort (3,185 cases). Of these, 3.9% (2,358 cases) were late preterm, 438 (0.7%) were moderately preterm, and 389 (0.6%) were early preterm deliveries. 1,828 (3.0%) delivered spontaneously preterm and 1,278 (2.1%) had an iatrogenic preterm delivery. In 79 cases (0.1%), information about mode of delivery was missing.
Beverage intake in relation to preterm delivery Daily consumption of 1 serving or more of AS beverages was significantly associated with an increased risk of preterm delivery (adjusted OR 1.11; 95% CI: 1.00, 1.24; p for trend 0.025) (Table 3). The same daily intake of SS beverages was also significantly associated with preterm delivery (adjusted OR 1.25; 95% CI: 1.08, 1.45; p for trend 0.009). Women consuming 4 or more servings daily of SS beverages had an adjusted OR of 1.37 (95% CI: 1.08, 1.74). After mutual adjustment for AS and SS beverages, the linear trend for SS beverages was strengthened, with a p for trend at 0.008. In order to ascertain whether the observed association between SS beverages and preterm delivery could be explained by a correlation with other sugar calorie sources, we added calculated daily intake of sugar from other sources than SS beverages to the confounding variables. This did not change the results; an independent association remained between high intake of SS beverages and preterm delivery, with an adjusted OR of 1.41 (95% CI: 1.11, 1.79) for 4 or more servings daily, compared with no SS beverage intake. We also analyzed carbonated and noncarbonated AS and SS beverages separately in relation to preterm delivery, failing to find any significant associations in either the crude or adjusted model, possibly due to lack of power or under-reporting of carbonated beverage intake.

47
Glycemic properties of maternal diet in relation to preterm delivery and abnormal birth weight
Asso
ciat
ions
bet
ween
inta
ke o
f sof
t bev
erag
es d
urin
g pr
egna
ncy a
nd p
rete
rm d
eliv
ery (
PTD
), <
37 co
mpl
eted
gesta
tiona
l wee
ks, i
n 60
761
wom
en fr
om th
e Nor
wegi
an M
othe
r and
Chi
ld C
ohor
t Stu
dy¹
Al
l
n
PTD
%
4 Un
adju
sted
OR
(95%
CI)
Adju
sted
OR²
(95%
CI)
Adju
sted
OR³
(95%
CI)
Arti
ficia
lly sw
eete
ned
beve
rage
s
1 1
1 51.0±0.5
922 22 reve
N <
1 se
rvin
gs/w
k 14
919
5.
1±0.
18
1.01
(0.9
2, 1
.11)
1.
01 (0
.92,
1.1
1)
1.01
(0.9
2, 1
.12)
1-6
serv
ings
/wk
13 2
04
5.4±
0.20
1.
08 (0
.98,
1.1
9)
1.07
(0.9
7, 1
.18)
1.
09 (0
.99,
1.2
0)
1
serv
ing/
d 43
09
6.0±
0.36
1.
21 (1
.05,
1.3
9)
1.19
(1.0
3, 1
.37)
1.
20 (1
.04,
1.3
9)
2
-3 se
rvin
gs/d
39
98
5.2±
0.35
1.
04 (0
.90,
1.2
1)
0.99
(0.8
5, 1
.16)
1.
01 (0
.87,
1.1
8)
≥
4 se
rvin
gs/d
p fo
r tre
nd
2102
6.
0±0.
52
1.22
(1.0
0, 1
.47)
0.
007
1.08
(0.8
9, 1
.32)
0.
127
1.12
(0.9
2, 1
.36)
0.
053
Suga
r-sw
eete
ned
beve
rage
s
1 1
1 72.0±7.4
5516 reve
N <
1 se
rvin
gs/w
k 18
082
5.
2±0.
17
1.13
(0.9
8, 1
.29)
1.
14 (0
.99,
1.3
1)
1.15
(1.0
0, 1
.32)
1-6
serv
ings
/wk
24 9
06
5.2±
0.14
1.
11 (0
.97,
1.2
6)
1.14
(1.0
0, 1
.30)
1.
15 (1
.01,
1.3
2)
1
serv
ing/
d 58
32
5.6±
0.30
1.
21 (1
.03,
1.4
2)
1.23
(1.0
4, 1
.46)
1.
25 (1
.05,
1.4
8)
2
-3 se
rvin
gs/d
41
48
5.5±
0.35
1.
19 (0
.99,
1.4
2)
1.16
(0.9
7, 1
.40)
1.
19 (0
.99,
1.4
3)
≥
4 se
rvin
gs/d
16
38
6.8±
0.62
1.
48 (1
.18,
1.8
6)
1.37
(1.0
8, 1
.74)
1.
41 (1
.11,
1.7
9)
p
800.0
710.0 300.0
dnert rof
¹Odd
s rat
ios (
OR)
wer
e cal
cula
ted
by u
sing
logi
stic r
egre
ssio
n m
odel
s.
² Adj
uste
d fo
r pre
viou
s pre
term
del
iver
y, m
ater
nal a
ge, p
re-p
regn
ancy
BM
I, he
ight
, tot
al en
ergy
inta
ke, m
arita
l stat
us, p
arity
, sm
okin
g du
ring
preg
nanc
y, an
d ed
ucat
ion.
³ A
dditi
onal
adju
stmen
ts fo
r the
oth
er b
ever
age
4 %
± S
EM (a
ll su
ch v
alue
s)
5 p va
lues
for l
inea
r tre
nd w
ere o
btain
ed b
y in
corp
orat
ing
the v
ariab
le as
a lin
ear t
erm
in lo
gisti
c reg
ress
ion
mod
els.
Tabl
e 3.

48
Linda Englund Ögge
Stratification by sub-groups according to time of delivery revealed a positive dose-response effect for both AS and SS beverages and late preterm delivery. p for trend was 0.022 for AS beverages and 0.046 for SS beverage (see tables presented in the manuscript). Furthermore, the highest AS beverage intake group (≥ 1 serving daily) was associated with late preterm delivery (adjusted OR: 1.14; 95% CI: 1.00, 1.29). The same intake of SS beverage was associated only with early preterm delivery (adjusted OR: 1.75; 95% CI: 1.13, 2.73). When women were stratified into different BMI groups, we found that overweight and obese women (BMI > 25 kg/m2) had significantly increased risk of preterm delivery in all higher consumption groups, compared to non-consumers. Women with the highest consumption (≥ 1 serving daily) had a significantly higher OR for preterm delivery (1.41; 95% CI: 1.10, 1.82; p for trend 0.024). Estimates in the other BMI groups pointed in the same direction, but effect estimates were weaker.
4.2 Study II.
Maternal dietary patterns and preterm delivery: results from a large prospective cohort study In this study (as well as in Study III), a total of 3,505 (5.3%) women had preterm deliveries. Late preterm delivery occurred in 2,558 (3.9%), 478 (0.7%) were moderately preterm and 469 (0.7%) were early preterm. Spontaneous preterm deliveries occurred in 2,003 (3.1%) and 1,414 (2.2%) were iatrogenic. Information about onset of delivery was missing in 88 (0.13%) cases.
Dietary patterns Three dietary patterns were extracted. The first pattern had high positive factor loadings for raw and cooked vegetables, salad, onion/leek/garlic, fruit and berries, nuts, vegetables oils, water as beverage, whole grain cereals, poultry and fiber-rich bread, and negative factor loadings for processed meat products (hot dogs, hamburgers, etc.), white bread and pizza/tacos. We named this pattern “prudent”, based on the characteristics of the food and beverages with high factor loadings it included (Figure 11).

49
Glycemic properties of maternal diet in relation to preterm delivery and abnormal birth weight
To assess whether the extracted pattern was appropriately labeled, we examined
nutrients. The prudent pattern scores correlated with folic acid (r=0.61), dietary
The second extracted pattern had high positive factor loadings for salty snacks, chocolate and sweets, cakes, French fries, white bread, ketchup, SS beverages,
and it was thus labeled “Western”. The Western pattern scores correlated with total fat (r=0.55), saturated fat (r=0.55) and added sugar (r=0.59). The correlation between energy density and the Western dietary pattern was r=0.30. The pattern labeling was considered to be appropriate.
as negative factor loadings for poultry and pizza/tacos. These foods with positive factor loadings are typically traditional in Norway and this pattern was named “traditional” (Figure 12). A Spearman correlation was also run for this pattern, which was correlated with potassium (r=0.42), magnesium (r=0.39), protein (r=0.38)
pattern (r=0.01).

50
Linda Englund Ögge
Figure 12. Content of the traditional dietary pattern. Photo: Linda Englund-Ögge, 2014.
The factor scores for each participant indicated the extent to which her diet conformed to each respective dietary pattern. A high factor score for a given pattern indicated high adherence to the pattern, while a low score indicated low adherence. It was possible for a participant to have high scores (or low scores) for more than one pattern.
Dietary patterns in relation to maternal characteristics Dietary habits and preferences are closely linked to other behaviors and are known to differ with age, educational level, smoking habits and other parameters. This was also evident when the pattern scores were examined by maternal characteristics. Typically, the prudent pattern score increased with increasing maternal age and education and was lower in women with higher BMI and in smokers. On the other hand, the Western pattern score was higher in younger women, in smokers, in women with less education, in parous women and in those with previous preterm delivery. Both underweight and overweight women had higher scores in the Western pattern than did normal- weight women. When it came to the traditional pattern, mean factor scores were higher in the younger (<20 years) and older (≥40 years) age groups than in the intermediate age groups. The traditional pattern scores also increased with decreasing education and were higher in parous women, in smokers and in women with a history of preterm delivery.
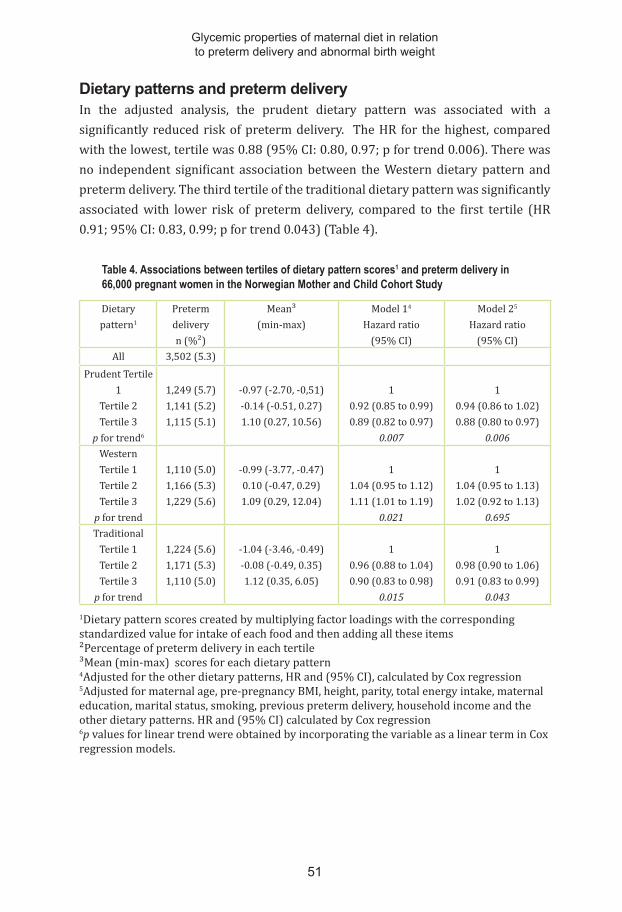
51
Glycemic properties of maternal diet in relation to preterm delivery and abnormal birth weight
Dietary patterns and preterm delivery In the adjusted analysis, the prudent dietary pattern was associated with a significantly reduced risk of preterm delivery. The HR for the highest, compared with the lowest, tertile was 0.88 (95% CI: 0.80, 0.97; p for trend 0.006). There was no independent significant association between the Western dietary pattern and preterm delivery. The third tertile of the traditional dietary pattern was significantly associated with lower risk of preterm delivery, compared to the first tertile (HR 0.91; 95% CI: 0.83, 0.99; p for trend 0.043) (Table 4).
Table 4. Associations between tertiles of dietary pattern scores1 and preterm delivery in 66,000 pregnant women in the Norwegian Mother and Child Cohort Study
Dietary pattern1
Preterm deliveryn (%²)
Mean³(min-max)
Model 14
Hazard ratio(95% CI)
Model 25
Hazard ratio(95% CI)
All 3,502 (5.3)Prudent Tertile
1Tertile 2Tertile 3
p for trend6
1,249 (5.7)1,141 (5.2)1,115 (5.1)
-0.97 (-2.70, -0,51)-0.14 (-0.51, 0.27)1.10 (0.27, 10.56)
10.92 (0.85 to 0.99)0.89 (0.82 to 0.97)
0.007
10.94 (0.86 to 1.02)0.88 (0.80 to 0.97)
0.006WesternTertile 1Tertile 2Tertile 3
p for trend
1,110 (5.0)1,166 (5.3)1,229 (5.6)
-0.99 (-3.77, -0.47)0.10 (-0.47, 0.29)1.09 (0.29, 12.04)
11.04 (0.95 to 1.12)1.11 (1.01 to 1.19)
0.021
11.04 (0.95 to 1.13)1.02 (0.92 to 1.13)
0.695Traditional
Tertile 1Tertile 2Tertile 3
p for trend
1,224 (5.6)1,171 (5.3)1,110 (5.0)
-1.04 (-3.46, -0.49)-0.08 (-0.49, 0.35)1.12 (0.35, 6.05)
10.96 (0.88 to 1.04)0.90 (0.83 to 0.98)
0.015
10.98 (0.90 to 1.06)0.91 (0.83 to 0.99)
0.043
1Dietary pattern scores created by multiplying factor loadings with the corresponding standardized value for intake of each food and then adding all these items²Percentage of preterm delivery in each tertile ³Mean (min-max) scores for each dietary pattern 4Adjusted for the other dietary patterns, HR and (95% CI), calculated by Cox regression5Adjusted for maternal age, pre-pregnancy BMI, height, parity, total energy intake, maternal education, marital status, smoking, previous preterm delivery, household income and the other dietary patterns. HR and (95% CI) calculated by Cox regression 6p values for linear trend were obtained by incorporating the variable as a linear term in Cox regression models.

52
Linda Englund Ögge
We wanted to test whether the identified associations were still significant after adjusting for additional covariates (potential confounders) that could affect both exposure and outcomes. Additional adjustment for physical activity, nausea, alcohol intake, passive smoking and planned pregnancy did not change the results, nor did adjustment for energy density, confirming that properties reflected by the energy density variable were already represented by the dietary patterns.
Women were stratified into two BMI groups (<25 kg/m2 and ≥25 kg/m2). In the low-BMI group, the adjusted HR for preterm delivery in the third tertile of the prudent dietary pattern was 0.88 (95% CI: 0.78, 0.99), while the corresponding adjusted HR in the high-BMI group was 0.92 (95%CI: 0.78, 1.08), the latter indicating lower risk, but with a weaker effect estimate that did not reach statistical significance. Women in the low-BMI group had a significantly reduced risk of preterm delivery if they adhered to a traditional dietary pattern (HR 0.87; 95% CI: 0.78 ,0.98), but no significant association was seen in the high-BMI group.
In our study population, 34,217 (51.8%) women were nulliparous. In the nulliparous group, the adjusted HRs for the prudent dietary pattern in the second and third tertiles were 0.86 (95% CI: 0.78, 0.96) and 0.75 (95% CI: 0.67, 0.85), respectively (p for trend <0.001). However, in parous women, there were no statistically significant associations between the dietary patterns and preterm delivery, but the corresponding estimates pointed in the same direction.
The prudent dietary pattern was associated with late preterm delivery. HRs were significant for the second and third tertiles: 0.91 (95% CI: 0.82, 0.99) and 0.86 (95% CI: 0.78, 0.96), respectively (p for trend 0.007). There was also a significant association between the third tertile of the traditional dietary pattern and late preterm delivery (HR 0.89; 95% CI: 0.80, 0.99). None of the patterns were significantly associated with increased risk of moderately or early preterm delivery, although the corresponding trends were similar.
Finally, the prudent dietary pattern was also associated with a reduced risk of spontaneous preterm delivery (adjusted HR 0.85; 95% CI: 0.75, 0.96). We also found a reduced risk of iatrogenic preterm delivery with high adherence to the traditional dietary pattern; the adjusted HR for the highest versus the lowest tertile was 0.85 (95% CI: 0.74, 0.99).

53
Glycemic properties of maternal diet in relation to preterm delivery and abnormal birth weight
4.3 Study III.
Meal frequency patterns and glycemic properties of maternal diet in relation to preterm delivery: results from a large prospective cohort studyMeal patterns in relation to maternal characteristics The main meal pattern score was higher in women in the highest age group (≥ 35 years), in normal-weight women, in cohabiting women and in women in the highest income group. The evening meal pattern score was higher in younger women, in women with low educational level (<12 years) and in daily smokers. Main meal pattern scores were low in overweight and obese women.
When other glycemic properties were analyzed in relation to maternal characteristics, we found lower GL, lower total carbohydrate intake, lower added sugar intake and higher fiber intake in women aged ≥35 years and in women with higher educational level. Intake of added sugar and of total carbohydrates were higher in smokers than in non-smokers, while intake of dietary fiber was lower in smokers than in non-smokers.
Meal frequency patterns and preterm delivery The main meal frequency pattern was associated with lower risk of preterm delivery. The adjusted HRs for the third and fourth quartiles were 0.89 (95% CI: 0.80, 0.98) and 0.90 (95% CI: 0.81, 0.99), respectively, with p for trend 0.028 (Table 5).
To exclude the possibility of confounding by an overall healthier diet in women with a main meal pattern we re-ran the analyses, adjusting for fiber as well as the prudent dietary pattern from Study II; this did not change the results.
Stratification of the outcome by time of delivery showed that the main meal frequency pattern was associated with lower risk of late preterm delivery (adjusted HR 0.88; 95% CI: 0.78, 0.99) when the highest and lowest quartiles were compared. The trends were in the same direction for early preterm delivery, but these associations were not significant. (See manuscript, Tables 3 and 4).
As in Study II, women were stratified into two BMI groups (<25 kg/m2 and ≥25 kg/m2). High adherence to the main meal frequency pattern was associated with lower risk of preterm delivery in both groups, but reached statistical significance only in the high-BMI group. The adjusted HR for the highest versus the lowest quartile was 0.92 (95%CI: 0.81, 1.05) in the low- BMI group and 0.89 (95% CI: 0.80, 0.98) in the high-BMI group. The results did not change after additional adjustment for dietary fiber as proxy for a healthy diet, or after adjustment for the prudent

54
Linda Englund Ögge
dietary pattern. None of the other two meal frequency patterns were significantly associated with preterm birth, either in the crude or adjusted analysis.
Table 5. Associations between meal frequency patterns and preterm delivery in 65,487 pregnant women in the Norwegian Mother and Child Cohort Study (MoBa)
Meal frequency pattern¹
Preterm deliveryn (%²)
Model 1³HR (95% CI)
Model 24
HR (95% CI)
All 3,473 (5.3)Snack meal patternQuartile 1Quartile 2Quartile 3Quartile 4p for trend5
875 (1.3)842 (1.3)873 (1.3)883 (1.3)
10.98 (0.89, 1.07)1.01 (0.92, 1.11)1.04 (0.94, 1.14)
0.566
10.98 (0.89, 1.07)1.00 (0.91, 1.10)1.00 (0.90, 1.10)
0.821Main meal patternQuartile 1Quartile 2Quartile 3Quartile 4p for trend5
979 (1.5)905 (1.4)779 (1.2)807 (1.2)
10.93 (0.85, 1.02)0.80 (0.72, 0.88)0.79 (0.72, 0.87)
<0.001
10.99 (0.90, 1.08)0.89 (0.80, 0.98)0.90 (0.81, 0.99)
0.028Evening meal patternQuartile 1Quartile 2Quartile 3Quartile 4p for trend5
829 (1.3)879 (1.3)892 (1.4)873 (1.3)
11.08 (0.98, 1.19)1.14 (1.02, 1.26)1.06 (0.96, 1.17)
0.083
11.06 (0.96, 1.17)1.10 (0.99, 1.23)1.03 (0.93, 1.14)
0.403
1 Meal frequency pattern scores analyzed as categorical data, divided into quartiles² Percentage of preterm delivery in each quartile ³ Unadjusted hazard ratio, but adjusted for the other meal frequency patterns4 HRs adjusted for maternal age, pre-pregnancy BMI, height, parity, total energy intake, maternal education, marital status, smoking, income, previous preterm delivery and the other meal frequency patterns5p values for linear trend were obtained by incorporating the variable as a linear term in Cox regression models
We found no associations between the assessed glycemic properties (GI, GL, total carbohydrates, added sugar and dietary fiber) and overall preterm delivery. GL was associated with increased risk of late preterm delivery, with adjusted HR 1.31 (95% CI: 1.06, 1.63; p for trend 0.015) for the highest versus the lowest quartile. In the case of younger women (aged under 35), the highest quartile of dietary fiber intake was associated with reduced risk of preterm delivery (adjusted HR 0.84; 95% CI: 0.73, 0.97; p for trend 0.017), while trends toward higher GL and increased risk of preterm birth were found in women aged 35 years and up. However, after adjusting

55
Glycemic properties of maternal diet in relation to preterm delivery and abnormal birth weight
eight p values according to the Bonferroni correction, none of the associations
BMI or for PPROM. Adjusting for nausea in early pregnancy, alcohol intake during pregnancy, IVF and shift work did not change the results.
The meal frequency scores were weakly correlated with GI and GL. The highest correlations (Spearman’s rho) were r=0.12 (p<0.001) for the evening meal pattern and GL and r=0.44 (p<0.001) for the main meal pattern and GL.
4.4 Study IV.
Maternal dietary patterns in relation to birth weight and increased risks of SGA and LGA Our primary outcomes in this study were prevalences of SGA and LGA. Rates of SGA

56
Linda Englund Ögge
Maternal characteristics in the study populationThe study population comprised 65,904 pregnant women. Their mean age was 30 years, their mean BMI was 24.0 kg/m2 and they had a calculated mean daily energy intake of 2,313 kcal (9727 kJ). When it came to BMI, the low- BMI group (<25kg/m2 2) included 19,825 (30.1%) women. Women in the low-BMI group reported higher average daily energy intake (2,335 kcal (9,820 kJ)) than those in the high-BMI group (i.e. 2,261 kcal (9,511 kJ)).
In the study population as a whole, 91.4% reported that they were non-smokers and 89% reported no alcohol intake during pregnancy. The infant sex distribution was 49.7% girls and 50.3% boys. The mean average birth weight was 3,497 g for girls and 3,607 g for boys.
Characteristics of the non-overlapping dietary pattern groupsEnergy and nutrient intakes in the high prudent, high Western and high traditional
with high loadings in the original dietary patterns described in Study II (Table 6). Energy intake was highest in the high Western group and lowest in the high prudent group. Women in the high Western group had the highest intake of fat, carbohydrates

57
Glycemic properties of maternal diet in relation to preterm delivery and abnormal birth weight
and added sugar and the lowest intake of dietary fiber. Women in the high prudent group contrasted with the high Western group concerning all these variables, with the lowest intake of fat, carbohydrates and added sugar and highest intake of dietary fiber. Women in the high traditional group had the highest mean intake of protein. The mixed dietary pattern group was most similar to the Western pattern group.
Table 6. Distribution of energy and macronutrient intakes in the non-overlapping dietary pattern groups
High Western High prudent High traditional
Mixed
Energy (kcal/day) 2434±5191 2197±466 2227±469 2336±700
Fat (g/day) 86±20 74±20 77±20 81± 27
Protein (g/day) 84±18 87±18 88±19 88±23
Carbohydrate (g/day) 329±85 294±72 296±70 313±104
Dietary fiber (g/day) 28±8 34±10 27±8 31±12
Sugar (g/day) 86±49 49±24 51±27 63±35
1 Mean and standard deviation
Maternal characteristics in the dietary pattern groups There were an unequal number of participants in the four non-overlapping dietary pattern groups: 9,562 (14.5%) in the high Western, 10,150 (15.4%) in the high prudent, 9,754 (14.8%) in the high traditional and 36,438 (55.3%) in the mixed dietary pattern group. Mean maternal age was highest in the high prudent group and lowest in the high Western group. The highest mean BMI was found in the high Western group and the lowest mean BMI was found in the high prudent group. The mean birth weight was highest in the high traditional group (3,605±561g), while the lowest mean birth weight was found in the high prudent group (3,549±577g) (Tables 2-4 in manuscript).
The infants of women adhering to the high Western pattern had a higher mean birth weight than those born to women in the high prudent pattern group and a lower mean birth weight than the infants of women in the high traditional group. Birth weight in the mixed group did not differ much from that in the high Western group (Figure 15).

58
Linda Englund Ögge
Figure 15. Boxplot of mean birth weight percentiles and 25th and 75th percentiles of weight in the four dietary pattern groups. Definitions of birth weight as described in the Introduction section (68-70). Figure legend created by Julius Juodakis.
Dietary patterns in relation to SGA and LGAWomen in the high prudent group had an increased risk of SGA. Risk estimates for the high prudent group were in the same direction for all definitions of SGA, but the association was only significant for the ultrasound-based definition (adjusted OR 1.25; 95% CI: 1.08, 1.54) The lower risk of LGA was significant for the population-based and customized-based definitions (adjusted ORs 0.84 (95% CI: 0.75, 0.94) and 0.88 (95% CI: 0.78, 0.99), respectively). The ultrasound-based definition is the strictest definition with the fewest number of cases (Table 7).
The high traditional pattern was associated with reduced risk of SGA according to the customized definition (adjusted OR 0.92; 95% CI: 0.84, 0.99). However, the same pattern was associated with increased risk of LGA according to the population-based and customized definitions (adjusted ORs 1.12 (95% CI: 1.02, 1.24) and 1.14 (95% CI: 1.03, 1.27), respectively).
0
25
50
75
100
Birth
wei
ght p
erce
ntile
s
Dietary group Mixed High−prudent High−Western High−traditional

59
Glycemic properties of maternal diet in relation to preterm delivery and abnormal birth weight
Crud
e an
d ad
juste
d od
ds ra
tios (
OR)
and
95%
conf
iden
ce in
terv
als (
95%
CI)
for a
ssoc
iatio
ns b
etwe
en d
ieta
ry p
atte
rn g
roup
s and
SG
A an
d LG
A (th
ree d
efin
ition
s of t
he o
utco
mes
) in
65,9
04 p
regn
ant w
omen
in N
orwe
gian
Mot
her a
nd C
hild
Coh
ort S
tudy
(MoB
a)
Pa
ttern
SGA
N (%
)1
SGA
Crud
e OR
(95%
CI)
SGA
Adju
sted
OR2 (9
5%
CI)
LGA
N (%
)
LGA
Crud
e OR
(95%
CI)
LGA
Adju
sted
OR2 (9
5%
CI)
Ultr
asou
nd-b
ased
H
igh
Wes
tern
H
igh
prud
ent
Hig
h tra
ditio
nal
Mix
ed
17
7 (1
.9)
237
(2.3
) 18
6 (1
.9)
724
(2.0
)
1 1.
27 (1
.04,
1.5
4)
1.03
(0.8
4, 1
.27)
1.
08 (0
.91,
1.2
7)
1 1.
25 (1
.08,
1.5
4)
1.16
(0.9
4, 1
.43)
1.
11 (0
.94,
1.3
1)
37
8 (4
.0)
262
(2.6
) 44
9 (4
.6)
1,35
7 (3
.7)
1 0.
64 (0
.55,
0.7
6)
1.17
(1.0
2, 1
.35)
0.
94 (0
.84,
1.0
6)
1 0.
87 (0
.73,
1.0
2)
1.09
(0.9
4, 1
.26)
1.
01 (0
.89,
1.1
4)
Po
pula
tion
base
d H
igh
Wes
tern
H
igh
prud
ent
Hig
h tra
ditio
nal
Mix
ed
88
9 (9
.3)
1,08
7 (1
0.7)
76
3 (7
.8)
3,24
4 (8
.9)
1 1.
17 (1
.07,
1.2
9)
0.83
(0.7
5, 0
.92)
0.
95 (0
.88,
1.0
3)
1 1.
04 (0
.94,
1.1
5)
0.91
(0.8
2, 1
.01)
0.
94 (0
.87,
1.0
2)
89
1 (9
.3)
658
(6.5
) 1,
078
(11.
1)
3,17
0 (8
.7)
1 0.
68 (0
.61,
0.7
5)
1.03
(1.0
1, 1
.33)
0.
93 (0
.86,
1.0
0)
1 0.
84 (0
.75,
0.9
4)
1.12
(1.0
2, 1
.24)
0.
97 (0
.90,
1.0
5)
Cu
stom
ized
Hig
h W
este
rn
Hig
h pr
uden
t H
igh
tradi
tiona
l M
ixed
1,
426
(14.
9)
1,60
0 (1
5.8)
1,
316
(13.
5)
5,15
5 (1
4.1)
1 1.
07 (0
.99,
1.1
5)
0.89
(0.8
2, 0
.97)
0.
94 (0
.88,
1.0
0)
1 1.
06 (0
.98,
1.1
5)
0.92
(0.8
4, 0
.99)
0.
95 (0
.89,
1.0
1)
66
6 (7
.0)
563
(5.5
) 78
1 (8
.0)
2,47
5 (6
.8)
1 0.
78 (0
.70,
0.8
8)
1.16
(1.0
4, 1
.29)
0.
97 (0
.89,
1.0
6)
1 0.
88 (0
.78,
0.9
9)
1.14
(1.0
3, 1
.27)
1.
00 (0
.92,
1.1
0)
1 Num
ber a
nd p
erce
ntag
e of c
ases
in th
at d
ieta
ry p
atte
rn g
roup
2 A
djus
ted
for m
ater
nal a
ge, t
otal
ener
gy in
take
, pre
-pre
gnan
cy B
MI,
heig
ht, p
arity
, sm
okin
g, a
lcoh
ol in
take
, tot
al h
ouse
hold
inco
me,
and
mat
erna
l edu
catio
n.
Tabl
e 7.
60
Linda Englund Ögge
The mixed dietary pattern was not significantly associated with abnormal birth weight according to any of the definitions.
Furthermore, we repeated the analyses after stratification by pre-pregnant BMI. The association between the prudent dietary pattern and increased risk of SGA was indicated in both BMI groups, but reached statistical significance only in the low-BMI group (See Table 4 in manuscript).
In additional analyses after adjustment for nausea and physical activity during pregnancy, the associations remained unchanged. Finally, we repeated the analyses in a group with term deliveries (n=62,415) and found that the associations between the dietary pattern groups and SGA were unchanged.

61
5. DISCUSSIONThe aim of observational studies, as in the four studies comprising this thesis, is to establish associations between exposures and outcomes. The long-term goal is to contribute new scientific knowledge and provide supportive evidence for prevention of adverse outcomes, i.e. preterm delivery and SGA/LGA in this thesis. Associations can be further evaluated and results can be compared to other types of studies. The randomized controlled trial (RCT), considered the best study design for establishing causal evidence, is not always applicable (189), especially when an RCT involves dictating everything a woman is supposed to eat or avoid. This is obviously not feasible in a large population over a long time period. Indeed, most RCTs investigating diet have studied dietary supplementation or dietary counseling during a limited time period (190).
Prevention would the best, cheapest and most lenient way to reduce preterm delivery and abnormal birth weight. While it will never be possible to prevent all cases, prevention of at least some would make a considerable difference. Dietary changes are cheap and might decrease other adverse health outcomes as well. Furthermore, pregnancy is a period in a woman’s life when she is open to lifestyle changes. Implementing dietary changes might benefit both the woman and her baby during pregnancy but might also, if maintained, yield long-term benefits. If women change their diet, other family members may switch to the same diet, which can impact the whole family and, ultimately, public health. If diet matters when it comes to these adverse obstetric outcomes, medical practitioners might be convinced that dietary recommendations are important and be inspired to devote more time and attention to dietary counseling. But before drawing any of these conclusions, the methods, bias, validity, generalizability and plausibility of these findings must be considered.
Importantly, this thesis assesses associations. Causality cannot be verified by observational studies. Discussion of possible mechanisms linking maternal diet to preterm delivery or abnormal birth weight thus relies on theories and hypotheses derived from experimental in-vitro and in-vivo studies in humans and animals.
5.1 Discussion of main results
Intake of sweet beverages We found associations between high intakes of AS beverages and SS beverages and preterm delivery. Plasma glucose levels rise after high consumption of SS beverages

62
Linda Englund Ögge
(177). It is possible that pregnant women have a higher plasma glucose response due to their higher insulin resistance (GI tables lack information about pregnant women). Scholl et al (191) reported an increased risk of preterm delivery in non-diabetic women with elevated plasma glucose levels. High plasma glucose is related to elevated levels of several inflammatory cytokines, e.g. IL-6 and TNF-α (192, 193), that have been shown to be elevated in preterm labor (24, 48, 54, 194).
Associations between intake of SS beverages and preterm delivery were stronger in the overweight group than in the normal-weight or underweight group. These differences in significance may be biologically explained by the fact that obese women are more insulin-resistant than lean women (195), with a consequently higher risk of elevated plasma glucose levels (196, 197) and increased inflammation (192, 198), which could be linked to preterm delivery. We also found that high intake of SS beverages was especially associated with early preterm delivery. An early pregnancy is generally sensitive to inflammation and infection (199). The Scholl study found that the combination of high maternal plasma glucose levels and choriamnionitis increased preterm delivery 12-fold (191). However, there is a loss of power when stratifying the study population into the subgroups high and low BMI and early, moderately and late preterm. The magnitude and direction of the associations must be evaluated, not only the degree of statistical significance in the sub-groups. The risk estimates for all three weight groups showed the highest risks in the high-intake groups and the same trend was seen for time of delivery.
Dietary patterns A prudent dietary pattern was associated with reduced risk of overall preterm delivery. The prudent dietary pattern was also associated to a reduced risk of preterm delivery subgroups and stratified groups; in late preterm, spontaneous preterm delivery and preterm delivery among nulliparous women. It is possible that both early and moderately preterm delivery could have a more serious underlying cause than late preterm delivery or that a prudent dietary pattern might not modify intra-amniotic infection, for instance. It is also conceivable that the prudent dietary pattern might reduce the progression to preterm delivery only marginally, and that the association thus is most detectable in the late preterm delivery group. But the association and the “protective effect”, only in the late preterm group, could also reflect the lack of statistical power due to the low number of cases in the moderately and early preterm groups. All risk estimates pointed in the same direction in this case as well; the group with the highest prudent diet intake exhibited a lower risk. The prudent pattern was only significantly associated with reduced risk in the

63
Glycemic properties of maternal diet in relation to preterm delivery and abnormal birth weight
normal-weight group; however, risk estimates for both groups indicated lower risk. From a biological perspective, it might be speculated that the negative effect of overweight is greater than the positive protective effect of a prudent diet. It is also known that overweight pregnant women tend to underreport dietary intake, especially “unhealthy” foods, to a larger degree than normal-weight women, which may be another explanation for these findings (200).
It is not known how diet affects biological mechanisms linked to preterm delivery. As mentioned above, the HPA axis is involved in the process of delivery. A high-fat diet can act as a stressor on the HPA axis and increase the production of glucocorticoids (201). The HPA axis is susceptible to maternal diet during fetal development, which can lead to permanent changes in glucocorticoid receptors and glucocorticoid regulatory enzymes, especially pronounced in cases of maternal under-nutrition (202). However, the impact of high plasma glucose from high sugar intake or that of a prudent, low-fat diet on the HPA axis in pregnancy has not been studied.
Modification of gut microbiota is among other possible explanations for the effect of diet on preterm delivery risk. While gut microbes were once considered either neutral or harmful, new knowledge has revealed that they are crucial for optimal functioning of the digestive and immune systems (203). Gut microbial gene richness is a key feature of a healthy flora (204). A study on dietary quality and microbial gene richness showed that participants with high gene counts consumed more fruit, vegetables and fish and had lower inflammatory marker levels than subjects with low gene counts (205). The metabolites of the microbiota are important factors for an individual’s health, due to local and systemic effects on inflammation (206). Certain metabolites are likely to reduce the risk, for instance, of insulin resistance (207). The type of microbes colonizing the gut is also associated with reduced risk of systemic inflammation (208). In terms of dietary patterns, this fits well with the prudent and traditional dietary patterns being associated with lower prevalence of preterm delivery. Milk and yoghurt products enriched with probiotics such as Lactobacillus have been reported to be associated with a reduced risk of preterm delivery (159, 209), and probiotic-enriched milk products had positive loading in the prudent dietary pattern in our study.
It was previously believed that the fetal environment was relatively sterile (210), but there has been a recent paradigm shift and it is now believed that the fetus is exposed to the maternal microbiome from an early stage. The current hypothesis is that the fetus may be inoculated with maternal microbes already before birth (211). Aagaard et al (212) have shown that the fetal placenta harbors a microbiome similar

64
Linda Englund Ögge
to that in the maternal oral cavity (tongue, throat, tonsils), as well as that in the airways, stool and vagina. This is an interesting hypothesis that might represent one important link between maternal diet and adverse pregnancy outcomes. The mechanism behind this transmission is as yet unknown but I believe that much more will be known in only a few years.
Meal frequency patterns The main meal frequency pattern, with a regular intake of breakfast, lunch and dinner, was associated with lower risk of preterm delivery. This association was found for overall preterm delivery and late preterm delivery, and was also found in overweight/obese women. It has been shown in mares that food withdrawal increased late preterm delivery. Levels of free fatty acids rose and PG production increased, leading to uterine contractions, changes that were reversed when food was provided (149). In humans, it has been shown that women skipping meals had a significantly increased risk of preterm labor or PPROM 24 hours later (213). Furthermore, pregnant women who ate fewer than three main meals and more than two snacks daily during pregnancy had a significantly increased risk of PPROM (214). It has also been shown that pregnant women had an increased risk of preterm labor after the Jewish fasting period of Yom Kippur (215). Another study from MoBa found that women with high adherence to a Nordic diet, defined as eating regular meals in combination with an overall healthy eating pattern, had a significantly reduced risk of preterm delivery (148).
Other glycemic properties We found no association between any of the glycemic properties and preterm delivery after adjusting p values for multiple testing. However, other studies have found such associations. High GL has been linked to preterm delivery in overweight women (142) and other studies have found associations between high dietary GI and preterm delivery (216). However, while GI values are calculated for one food at a time, the actual plasma glucose response will differ substantially when foods are eaten in combination, as is the case in reality. Importantly, the FFQ used in our study was not validated with regard to GI and GL. Furthermore, the use of FFQs to study GI and GL has been questioned due to limitations in the number of questions asked, aggregation of several food items and lack of day-to-day variation. Other assessment methods might have been better for assessing GI and GL, e.g. a food diary or repeated 24-hour recalls. In the MoBa FFQ, calculation of GI and GL was based on the questions covering different types of bread, buns, crisp bread and crackers, with

65
Glycemic properties of maternal diet in relation to preterm delivery and abnormal birth weight
a single GI value for each question. Therefore, it could be argued that this FFQ is not sensitive enough for correct estimation of GI and GL. We found no association between maternal intake of added sugar and preterm delivery, despite having found a significant association between high intake of SS beverages and preterm delivery in our first study. It can be challenging to assess added sugar in the diet with a FFQ. It is difficult to adequately assess varying amounts of added sugar in some foods, e.g. sugar intake from cereals differs greatly between different brands. Assessing SS beverage intake is actually a good method of assessing overall intake of added sugar, since the amount of added sugar does not vary between different brands (217).
Non-overlapping dietary patterns The high prudent pattern comprised the lowest intake of total fat, carbohydrates and added sugar, as well as the highest intake of dietary fiber. Women eating according to this prudent pattern were regarded as extremely health-conscious. The high Western pattern contrasted with the prudent pattern. There are sound biological explanations for the findings that food quality affects the risk of abnormal birth weight. A high intake of dietary fat in early pregnancy is associated with increased birth weight and reduced risk of SGA (218). Food with easily accessible carbohydrates causes increasing postprandial plasma glucose levels (219), correlated to a higher risk of high birth weight (113). Dietary fiber counteracts the rise in postprandial plasma glucose (219, 220) and lower plasma glucose levels are correlated to lower risk of high birth weight (221). A high fiber intake also generates satiety (222), which could benefit weight management (223) during pregnancy. Excessive weight gain increases the risk of LGA (224) and obesity is one of the strongest risk factors for LGA (180). Sadly, many of the negative obstetric outcomes in obese women are not preventable, despite lifestyle changes during pregnancy, as prevention might require important metabolic alterations prior to pregnancy (225). However, healthy eating can reduce the risk of negative pregnancy outcomes, e.g. gestational diabetes, macrosomia, hypertension and birth defects, all related to both preterm delivery and abnormal birth weight (96). The high traditional dietary pattern was associated with increased prevalence of LGA. This finding concurred with another MoBa study that assessed maternal adherence to an a priori-defined New Nordic Diet Score, finding that women with high scores had increased risk of LGA (148). Despite the fact that the New Nordic Diet Score differs substantially from the traditional dietary pattern in our study, they do have similar qualities; both patterns reflect high intake of fish and other food items shown to be associated with increased fetal growth (226).

66
Linda Englund Ögge
5.2 Methodological considerations
Selection bias Forty percent of all pregnant Norwegian women chose to participate in the MoBa, which could be considered a low rate. Participants were older, better educated and less often smokers than the general pregnant population. A very selected cohort can affect interpretation of results and enable the drawing of wrong conclusions, if this issue is not addressed (227). Nilsen et al. evaluated the potential bias due to self-selection in the MoBa study, compared to the overall pregnant population in Norway. The authors evaluated eight exposure-outcomes in MoBa participants using data from the MBRN. Despite the difference in prevalence of both exposures and outcomes between the two groups, there were no substantial differences in exposure-outcome associations, among which were preterm delivery and low birth weight (228).
Selection bias might also have arisen in the exclusion process. The initial dataset for this study comprised a total of 108,000 deliveries (including triplets, twins, stillborn, etc.). The exclusion process was carefully considered and extensively discussed in our research group. Women with factors, such as multiple pregnancies, that might cause result errors were excluded. Furthermore, almost 14,000 women were excluded from the overall cohort because information about eating and drinking habits was missing. The MoBa study was initiated in 1999. During 1999-2002, 8,955 participants completed a FFQ covering diet during the year prior to pregnancy. The new FFQ developed specifically for MoBa was not ready for use until March 2002, which is why so many were excluded due to missing dietary data. Moreover, more than 1,000 women were excluded because of invalid energy intake, since accuracy of data could not be trusted. Women with diabetes mellitus prior to pregnancy or diagnosed during pregnancy were excluded in all four studies due to dietary modification and increased risk of spontaneous and iatrogenic preterm delivery, as well as abnormal birth weight, associated with the condition (229-231). Table 8 presents differences in characteristics in the overall MoBa cohort, compared to the included women in our four studies.

67
Glycemic properties of maternal diet in relation to preterm delivery and abnormal birth weight
Table 8. Overview of maternal characteristics in eligible participants as well as study participants in Studies I-IV.
MoBa women* I II and III (2) III (1) IVParticipants, n 72,344 60,761 66,000 65,487 65,904
Maternal age at delivery, y < 35 ≥ 35
59,929 (82.8)12,415 (17.2)
50, 651 (83.4)10,110 (16.6)
54,792 (83.0)11,208 (17.0)
54,381 (83.0)11,106 (17.0)
54,715 (83.0)11,189 (17.0)
BMI (kg/m2) <18.5 18.5-24.9 25-29.9 ≥30missing cases
2149 (3.0)46,365 (64.1)15,254 (21.1)6698 (9.3)1,878 (2.6)
1,901 (3.1)40,315 (66.4)13,026 (21.4)5,519 (9.1)
2,029 (3.1)42,704 (64.7)13,754 (20.8)5,824 (8.8)1,689 (2.6)
2,017 (3.1)42,398 (64.7)13,643 (20.8)5,769 (8.9)1,660 (2.5)
2,025 (3.1)42,644 (64.9)13,729 (20.8)5,819 (8.8)1,687 (2.6)
Parity Nulliparous Parous
38,568 (53.3)33,717 (46.6)
32,258 (53.3)28,403 (46,7)
34,217 (51.8)31,783 (48.2)
33,968 (51.9)31,519 (48.1)
34,164 (51.8)31,740 (48.2)
Marital status Cohabiting Single
69,520 (96.1)2824 (3.9)
58,712 (96.6)2,049 (3.4)
63,446 (96.1)2554 (3.9)
62,964 (96.1)2,523 (3.9)
63,354 (96.1)2,550 (3.9)
Maternal education, y <13 13-16 ≥17 missing cases
22,543 (31.2)29,983 (41.4)18,274 (25.3)1544 (2.1)
19,184 (31.6)25,881 (42.6)15,696 (25.8)
20,472 (31.0)27,432 (41.6)16,704 (2.1)1,401 (2.1)
20,255 (30.9)27,267 (41.6)16.594 (25.3)1,371 (2.1)
20,444 (31.0)27,388 (41.6)16,672 (25.3)1,400 (2.1)
Smoking No Occasional Daily missing cases
66,053 (91.3)1967 (2.7)3911 (5.4)413 (0.6)
55,561 (91.4)5,200 (8,6)§
60,321 (91.4)1748 (2.6)3553 (5.4)378 (0.6)
20,255 (91.4)1,725 (2.6)3,520 (5.4)371 (0.6)
60,235 (91.4)1,744 (2.6)3,547 (5.4)378 (0.6)
Previous PTD, n (%) No Yes missing
69,827 (96.5)2482 (3.4)35
58,569 (96.4)2,192 (3.6)
63,667 (96.5)2,333 (3.5)
63,667 (96.5)2,333 (3.5)
*Source population (n=83,386), of which 72,344 were first enrolled pregnancies in MoBa §Reported occasional or daily smoking
The prevalences of preterm delivery in our study sample (Studies II-IV) and those in the 17,386 pregnancies excluded from MoBa were compared, revealing that the prevalence was actually higher in the study population (5.3%; 3,505 cases) than in the excluded group (3.8%; 660 cases). It is difficult to explain this discrepancy since one of the reasons women were excluded was missing information. It is likely that

68
Linda Englund Ögge
women with lower education and lower socio-economic status more often return incomplete reports than those with more a favorable socio-economic profile.
CovariatesAs previously mentioned, conclusions about causality cannot be drawn based on observational studies, since adjustment cannot be made for all potential confounding factors (236). The MoBa dataset contains much information about possible covariates, which we have thoroughly considered and adjusted for. Previous preterm delivery is one of the strongest risk factors for current preterm delivery (237); we have thus adjusted for this in all studies in which preterm delivery was the outcome. As this data was obtained from the MBRN, it is considered to be reliable. Different socio-economic factors are also well-known risk factors for preterm delivery (238, 239). We adjusted for many of the important ones: years of education (all four studies), cohabiting or single (all four studies) and total household income (all four studies). Another important covariate for preterm delivery is smoking (240), which was also adjusted for. The risk of unreported smoking (241), because it is considered “shameful”, is, however, well known. Under- or misreporting of smoking habits can lead to validity problems and the risk of faulty conclusions if association measurements are incorrect (242). However, maternal smoking during pregnancy reported in the first MoBa questionnaire was evaluated by Kvalvik et al, using plasma cotinine concentration as an objective reference measure (243). This study showed that, the questionnaire sensitivity was 82% and specificity was 99% for self-reported smoking, interpreted as reliability for representing smoking habits correctly. It is also known that alcohol intake during pregnancy is a risk factor for preterm delivery (244). It could be speculated that women adhering to a prudent dietary pattern also consume some alcohol, since especially smaller amounts of red wine have been part of a “health awareness” concept. Adjusting for alcohol intake did not change the results. In all our studies, we adjusted for total energy intake. In Study II, additional adjustment for energy density made it possible to evaluate intakes of food and nutrients independently of total energy intake (245). Additional adjustments suitable for the specific exposure were made in the respective studies, e.g. added sugar in Study I and shift work in Study III. Nausea is common in pregnancy and can affect both what is eaten and possibly also outcome, especially birth weight, with a higher risk of SGA (246). Adjustment for nausea was performed in additional analyses in all studies, with no change in results. Maternal height was adjusted for in all four studies, as height was associated with both the exposure and the outcome.

69
Glycemic properties of maternal diet in relation to preterm delivery and abnormal birth weight
diet, and height is correlated to both preterm delivery and birth weight (247).
Observational studies are important for promoting new theories, to improve understanding and acquire deeper knowledge. It would be unethical to expose pregnant women to foods known to be unhealthy or to a high-glucose diet during pregnancy.
Observational studies cannot determine causality. A cause is a factor that contributes to or is responsible for the development of a disease or condition. A confounding factor is associated with both exposure and outcome. Confounding occurs when the observed relationship between exposure and disease differs from
variables are known, their effects can be taken into account. How variables are believed or known to be correlated with the exposure, the outcome and the other
which confounders must be included in the model.
Green arrows indicate causal links and pink arrows confounding links.

70
Linda Englund Ögge
The British epidemiologist Austin Bradford Hill listed the following key criteria for evaluating association versus causation in epidemiological studies (248): strength, consistency, temporality, biological gradient (dose-response), plausibility, coherence and experimental evidence. Applying these criteria to observational studies provides further insight into the nature of the observed associations. The papers included in this thesis were written according to guidelines for reporting of observational studies (Strengthening the Reporting of Observational Studies in Epidemiology (STROBE) (249). These guidelines are designed to improve the quality of research and clearly show the reader what was planned, what was done, what was found and what the results mean (see Appendix for the STROBE checklist). Moreover, new guidelines, termed STROBE-nut, have recently been published, aiming to improve the quality of nutritional research. They stipulate that the methodological details, such as recruitment, dropout, compliance, statistical methods and dietary intake assessment, be clearly reported (250).
Multiple testing and errorsIn all our studies, several exposures were assessed and different stratifications and sub-analyses, i.e. multiple testing, were undertaken. The problem with multiple testing is that when a number of statistical analyses are performed, there is a risk that some significant p values will emerge. A p value set at 0.05 means that 20% of all p values would be significant just by chance. If 20 different analyses are performed, there is a 64% risk that the results are due to chance findings. This is called a type I error, finding false significance and falsely rejecting the null hypothesis (251). In our studies, associations were found both in both the overall analyses and in the subgroup analyses, which we interpreted as a decreased risk of chance findings.
In Study III, we found an association between dietary fiber and reduced risk of preterm delivery only in the younger women. We also found a positive association between higher GL and increased risk of preterm birth in women aged 35 years and up. But we found no association, either in the overall analysis, after any other stratifications or in any other subgroup analysis. Therefore, p values from all the separate analyses for each variable were added and divided with the total number of p values (a type of Bonferroni adjustment). With these stricter criteria for statistical significance, the results for GL and dietary fiber were no longer significant. However, one of the general problems with Bonferroni adjustment it that it increases the risk of type II errors, that is that the null hypothesis is not rejected despite the existence of a true association (252).

71
Glycemic properties of maternal diet in relation to preterm delivery and abnormal birth weight
Food frequency questionnaireIn this thesis, information about diet was based on a self-reported FFQ in which women were asked to report daily dietary intake during the first four months of pregnancy. This covers an important period of fetal development during which maternal nutrition may affect fetal well-being, but could also negatively impact long-term health later in the child’s life (96, 253). As mentioned in Section 1.6, dietary assessment is particularly challenging, as there is no method without errors and shortcomings. First, there is the possibility for responders to over- or underreport intake. Misreporting can be conscious or unconscious and “dietary image” (254) may be distorted in the same way as body image. Foods perceived as unhealthy are most likely to be underreported and foods perceived as healthy are most likely to be over-reported. In MoBa, participants with a large amount of missing data or gross misreporting of intake are eliminated by only including participants with a reasonable calculated energy intake. Exclusion of subjects with improbable energy intakes omits approximately 1% at each end of the energy distribution curve (98% CI) and will not correct for any misreporting or bias (173). As the intake of nearly all foods and nutrients correlates with energy intake, dietary exposures must be adjusted for energy intake (255).
Secondly, there is always a risk of memory bias when filling in a FFQ. The prospective design of the studies is an advantage since women were at least unaware of pregnancy outcomes when they responded to the FFQ, minimizing the risk of memory bias. Certain groups of women, especially overweight pregnant women, are known to underreport intake in FFQs (200). A prospective design study is especially important in those cases, but does not entirely solve the problem. The risk of misreporting of data should be kept in mind when interpreting results.
Thirdly, it is crucial that the FFQ cover all the existing foods and beverages in a country, without being too extensive, which could cause carelessness in responses and missing data, as previously mentioned. However, the nutritional specialists responsible for the development of this FFQ are extremely knowledgeable about available food and beverage items in Norway. Missing data in the FFQ must be treated with especial consideration. In the MoBa FFQ, minor “missing data”, due to participants’ failing to check any of the boxes, was interpreted as zero intake. Poor-quality FFQs, due to a large amount of missing data or gross misreporting of intake, were excluded using the pre-defined filter for biologically implausible intake, specifically developed for MoBa (173).
Fourthly, filling in an FFQ challenges respondents with rather complex cognitive tasks. Individuals that are willing and able to answer may be more interested in

72
Linda Englund Ögge
healthy practices than the average individual and may thus have different dietary habits than non-participants. The MoBa FFQ was available only in Norwegian (the English version is available only for researchers), and some groups were unable to participate due to language barriers. This might have affected the external validity of the study, but it was a conscious choice on the part of the study initiators. Other studies have been carried out in subgroups of immigrants.
From the start, MoBa was intended to include a large number of participants, and the FFQ was the only realistic alternative for assessing maternal diet during pregnancy. However, before dietary data can be used in diet-outcome studies, every new FFQ must be validated, in order to obtain an impression of the degree to which it is accurate in the target population. One hundred nineteen women participated in the validation study of the MoBa FFQ. Their reported intakes of food items, energy and nutrients in the FFQ were compared with intake records from a four-day weighed food diary. This prospective recording of all food and drink intakes during four days is considered to be the best model for dietary assessment. In addition to keeping the food diary, women in the validation study were also asked to wear a motion sensor for assessing total energy expenditure, to give blood samples and to collect 24-hour urine specimens (175). Urinary nitrogen excretion was used to evaluate the relative validity of the calculated protein intake (175), urinary iodine excretion was used to evaluate the relative validity of the calculated iodine intake and the main food sources of iodine (256), and urinary excretion of flavonoids was used to evaluate the relative validity of fruit, vegetables and tea (257). Blood concentrations of arsenic, mercury and selenium, as well as long-chain n-3 polyunsaturated fatty acids in red blood cells were used to evaluate the calculated intakes of different fish and seafood items (258). Furthermore, plasma concentrations of 25-hydroxy-vitamin D and serum folate were used to evaluate the calculated intakes of vitamin D and folate, including the calculated amount of these vitamins contributed by dietary supplement use (259). The validation study showed that the MoBa FFQ is accurate, relative to the reference methods (food diary and biomarkers), for ranking pregnant women according to high and low intakes of energy, nutrients and food (175).
Factor analysisThe three dietary patterns extracted by principal component factor analysis for Studies II and IV accounted for 16% of the total variance in the input variables, which can be regarded as quite low. However, this is totally acceptable since dietary patterns are qualitative indices reflecting food choices and major variation in eating habits. The Scree plot also revealed three distinct meal frequency patterns, which

73
Glycemic properties of maternal diet in relation to preterm delivery and abnormal birth weight
accounted for 52% of the variance in the input variables. This is high, compared with 16% in Study II, but the level is due to the fact that combinations of fewer variables yield higher explained variance. In Study II, we had 255 food and beverage variables, too many for this method, and we ended up with 58 non-overlapping groups. A study describing this process showed how aggregation of food items into fewer variables increased the explained variance, but also attenuated the association with disease outcome (260). This study was instrumental for our decisions on how to aggregate food and beverage items.
We used different factor loadings for the interpretability of patterns in the different studies. In Studies II and IV, factor loadings were set at ±0.25, while they were set at ±0.5 or above in Study III. One reason for this difference is the lower number of variables in Study III (261). Furthermore, we were initially investigating which groups the SS and AS beverages belonged to in Study III. We set the factor loadings low as we found that SS beverages had a factor loading of 0.36 in the Western dietary pattern. Factor loadings for the AS beverages were less than 0.25, and they were thus not found to be related to any specific dietary pattern.
There are other available methods when assessing patterns, e.g. cluster analysis. Cluster analysis is a method in which individuals with similar patterns are clustered into one group depending on the mean intake of a food or beverage variable. There are several different methods for cluster analysis, of which k-mean analysis is the most common when aiming at determining input variables efficiently in nutritional research. However, the number of clusters must be determined before performing k-mean analysis, often with a hierarchical cluster analysis (262).
We chose factor analysis instead of cluster analysis for several reasons. Factor analysis yields information, by the factor-loading coefficient, about how all food, beverages and meals are associated with a specific pattern. The factor loading coefficient score provides a better understanding of which specific variables have the highest impact on the pattern in question. In factor analysis, all women are included in all patterns, an important difference from cluster analysis. The complexity of dietary habits leads to women sometimes adhering to more than one specific pattern, e.g. high adherence to both the prudent and traditional dietary pattern. One disadvantage of cluster analysis is that there can also be extremely uneven numbers of participants in each cluster, making comparison between groups difficult. This difficulty can, however, be avoided with factor analysis. Moreover, factor analysis provides information about variables with negative factor loadings, i.e. very low intakes of a specific food, beverage or meal. This information is, on the other hand, unavailable in cluster analysis. In a study comparing dietary patterns assessed

74
Linda Englund Ögge
with principle component analysis and cluster analysis, no significant differences between recorded food and beverage items were found (262), and we thus chose factor analysis for processing our data.
Validity and generalizability Internal validity means that the conclusion is correct for the study population and is based on bias, confounding factors, chance findings and cause. External validity and generalizability refer to whether the conclusion would also be true for other populations (263).
Bias and confounding factors affect internal validity and have been discussed previously. The ORs, HRs and CIs (often close to 1) in these studies affect internal validity. It has been suggested that the relative risk (RR) should be under 0.5 or above 2.0; otherwise, associations are likely to be due to bias or chance (264). In our studies, the OR and HR estimates are close to 1. However, the models were stable despite all the adjustments for covariates. Furthermore, diet is usually not a matter of “intake: yes or no”, but rather of comparing food amounts or diet quality, with considerable overlap among groups for many nutrients. It is thus not unexpected to only find small effect sizes. Due to the imprecise measurements in nutrition studies, true findings tend rather to be underestimated. Imprecision in exposure measurements in nutrition studies is likely to attenuate a “true” exposure-outcome association (265). It has been argued that weak associations in epidemiological studies should not be published (264). However, taking the nature, complexity and challenges related to dietary assessment into account, this criticism should not be directed at nutrition studies. A study within the Norwegian Women and Cancer study explored how measurement errors could affect estimates of disease risk, using alcohol intake and high blood pressure as the example (266). The authors showed that the most common effect of measurement error was an attenuation of the risk estimate. However, when the measurement error is systematic, e.g. underreporting fat intake, bias in the risk estimate can instead result in an overestimated association, as demonstrated in a sub-sample of adult Danish men (267). Although the effect estimates are weak, the studies included in this thesis add supporting evidence for current dietary guidelines, as was acknowledged in an accompanying editorial to our Study II in the British Medical Journal (268).
The findings in Study I have partly been confirmed by other studies. In a Danish study (117) with a similar pregnancy cohort, AS intake, but not SS intake, was associated with preterm delivery. More women in the Danish study than in the MoBa reported that they never drank either SS or AS beverages during pregnancy,

75
Glycemic properties of maternal diet in relation to preterm delivery and abnormal birth weight
and more women reported high intake of both SS and AS beverages in the latter, compared to the former. The FFQ questions regarding intake of these two beverage types were identical but the assessed time period was different. In the MoBa FFQ filled out at gestational weeks 17-22, women reported intake of these beverages during the first four months of pregnancy. In the Danish study, women filled out the FFQ at gestational week 25 and they were asked to report intake during the preceding four weeks. We wanted to assess whether women might have shifted from SS to AS beverages before answering the FFQ, based on the possibility that women with early pregnancy complications had changed their lifestyle. Therefore, we performed an analysis comparing intakes of AS and SS beverages before pregnancy, reported in the first (from questionnaire 1) and third trimesters (from questionnaire 3), but these results did not indicate such a shift in consumption. There were other differences between the studies as well. In our study, we adjusted for previous preterm delivery (269), as well as combining carbonated and noncarbonated soft drinks and excluding women with diabetes. The two studies are thus not exactly comparable. Another similar cohort study of a multi-ethnic cohort of over 8,000 pregnant women in Bradford UK found an association between a high intake of SS beverages, but not AS beverages, and preterm delivery (270). Observational studies such as the MoBa and the Danish National Birth Cohort are not suitable for establishing diet-disease causality, but are important for discovering associations requiring further investigation, especially in the case of nutrients that are freely available on the market and consumed by women during pregnancy.
Studies II and IV raise the question of whether Norwegian dietary patterns differ from those in other countries. Are Norwegian pregnant women in general healthier than other populations? This is an important question for evaluating generalizability. In Norway, a high fish intake and consumption of cod liver oil is typical and considered part of a healthy diet. But the prudent dietary pattern was also rich, for instance, in fruit and vegetables, cooking oil and nuts, resembling the typically Mediterranean pattern (151). Studies do not show that a typical Nordic diet, either in the general population or in pregnant women, contains more prudent-pattern foods than diets elsewhere (271, 272). However, differences in dietary patterns in different countries could partly be explained by differences in socio-economic factors and maternal characteristics, e.g. BMI, smoking, etc. (273). Differences in gestational length assessment also affect results (16) and must be considered when comparing prevalences between populations. Our findings are likely to be generalizable outside Norway and can contribute to the general body of research on diet and health, but the issue of population-specific dietary patterns must be kept in mind.

76
Linda Englund Ögge
Study III raises the issue of how meal frequency patterns differ between different countries in Europe (274), which could make comparison difficult, as well as affecting the external validity and the possibility to reproduce the findings in other populations.
When comparing the results of Study IV to others, we found that exposure-outcome relationships were greatly dependent on the applied definitions of exposure and outcome. In a similar Danish cohort of almost 45,000 women, it was found that women adhering to a high prudent dietary pattern, similar to our prudent pattern but with fewer variables, had reduced risk of SGA according to the same ultra-sound based definition (93). Comparison of this Danish study to ours revealed that women in the “health-conscious” group had higher energy intake than in the MoBa prudent dietary pattern group. It could be speculated that Norwegian women are more health-conscious, contributing to a higher prevalence of SGA in this group. A study from China showed that women with a diet high in fruit, nuts and desserts delivered babies with higher birth weight and had lower risk of SGA than women with low intakes of these food items. That study used a SGA/LGA definition similar to the customized definition in our study (275). A New Zealand study including 2,000 pregnant women reported that a traditional dietary pattern was associated with lower risk of SGA. However, this pattern was more like our prudent pattern, since it was rich in fruit, but with a higher content of cheese and dairy products (276). In another study of the MoBa cohort, it was shown that high scores for a New Nordic Diet, characterized by traditional Nordic foods, e.g. apples, pears, root vegetables, whole grains, potatoes, fish, milk and water as beverage, was associated with a reduced risk of SGA (148). The New Nordic Diet score is an a-priori score, but it resembles the traditional dietary pattern in Studies II and IV. The findings for the New Nordic Diet group are comparable to ours for the high traditional group, i.e. reduced risk of SGA according the customized definition. Finally, in a smaller US study of 1,151 participants with seven different dietary patterns, no associations were reported for any of the patterns and SGA or LGA (277). The main difference between our study and others seems to be that our prudent pattern is associated with increased risk of SGA, while the others found a decrease in risk. Different populations with varied genotypes have been assessed and birth weight is one of the variables that is strongly correlated with genetic factors (278). However, there are also differences in other factors, such as maternal BMI and age, that can affect birth weight, probably through epigenetic mechanisms (279). Discrepancies in definitions of SGA and LGA must also be kept in mind when comparing results.

77
6. CONCLUSIONSThis thesis adds the knowledge that diet seems to matter when it comes to preterm delivery and abnormal birth weight, although birth weight was assessed less extensively.
High intake of artificially and sugar-sweetened beverages may increase the risk of preterm delivery; the higher the intake, the greater the risk.
High intake of a prudent dietary pattern may reduce the risk of preterm delivery.
A main meal frequency pattern, consisting of breakfast, lunch and dinner, may reduce the risk of preterm delivery. However, other glycemic properties, i.e. GI, GL, total carbohydrates, added sugar and dietary fiber, do not seem to be associated with preterm delivery.
A high prudent dietary pattern may increase the risk of SGA and reduce the risk of LGA. A high traditional diet may increase the risk of LGA.
Despite the observational nature of these data, all results thus indicate that diet matters, especially for preterm delivery. Maternal dietary habits should be further studied and evaluated, as a possible component in the studied conditions.
The clinical implications of our results are that medical practitioners working with pregnant women may be inspired to devote more attention to the importance of dietary counselling.


79
7. FUTURE PERSPECTIVESThese hypothesis-generating observational studies cannot constitute the basis on which to draw conclusions about causality. A next step might be an observational study with the same exposures in another cohort. If more studies, carried out with the same exposures in different cohorts, find the same results, guidelines could be created despite the observational character of the data. This is an example of a clinical issue for which health care authorities must rely on results of observational studies only, as RCTs are neither feasible nor ethical.
The pathophysiology behind a probable causal association can be established by preclinical studies or animal models. Mechanistic studies provide important information about biological processes and could generate knowledge about how sugar affects, and perhaps initiates, processes in placental cells. Our hypothesis is that a high level of sugar, in women who are already insulin-resistant, causes an increase in the inflammatory response linked to preterm delivery. This could be assessed by exposing healthy placental cells from pregnant women, without a history of preterm delivery or diabetes, to different concentrations of glucose respectively mimicking euglycemia, moderate hyperglycemia and severe hyperglycemia in maternal blood. It is important to assess placental macrophages because they are regulators in the immune response and have an important function in maintaining a normal and healthy pregnancy (280). It is conceivable that they respond to high glucose levels and increase cytokine production, which might conceivably be the link to preterm delivery. Is it possible that glucose alters the balance between pro- and anti-inflammatory macrophages toward a more inflammatory type? Studies like this are important for assessing links between diet and pregnancy outcome, but are also an important piece of the puzzle of understanding the mechanisms underlying pregnancy complications. The ROS pathway also warrants more detailed study. Is maternal diet linked to premature aging of the fetal membranes? This question could be addressed by fetal membranes being exposed to hyperglycemia with subsequent measurement of IL-33, DAMP, HMGB1, heat shock protein, cell-free DNA and telomerase fragment responses. Furthermore, does maternal diet affect the amniotic fluid?
If observational, mechanistic and clinical studies show that maternal diet affects the risk of preterm delivery and SGA/LGA, guidelines must be changed and more emphasis must be put on dietary counseling during, and perhaps prior to, pregnancy in order to prevent preterm delivery and abnormal birth weight. Prevention of these conditions is the safest and cheapest way to address this major clinical problem.


81
8. ACKNOWLEDGEMENTSMany people have helped and encouraged me during this journey, from the first article to this thesis. I want to thank them here and I feel deeply appreciative for everything they have done for me.
Bo Jacobsson, my excellent main supervisor, who has always supported and encouraged me in the best way, who has been a true professional role model, who has also created an open and eclectic research group and who is my greatest inspiration, by far, when it comes to continuing research. Also, thank you for all the opportunities you have given me during these years, as well as for your generosity in providing me with contacts!
AnneLise Brantsaeter, my other outstanding supervisor, who has been my guiding star through the studies, from whom I always learn new things and who has an incredible amount of research knowledge in this field. I am so happy and honored to have had the chance to work with you during these years. Thank you for helping me up and encouraging me during the rough period!
Verena Sengpiel, my third excellent supervisor, for your excellent support, calmness, wisdom, positive thinking, commitment, and great knowledge of research. Thank you for helping and guiding me through this journey!
Bryndis Eva Birgisdotter, one of my main co-author, thank you for all your commitment, encouragement, hospitality, patience and great knowledge, as well as for your always positive attitude.
Margareta Haugen, Helle Margrete Meltzer, Ronny Myhre, my excellent co-authors in all the studies. Thank you for all your knowledge, commitments and helpful comments.
Marian Kacerovsky, Ali Khatibi, Solveig Myking, also co-authors, many thanks to you too for all helpful comments.
Jonas Bacelis, Julius Juodakis and Staffan Nilsson, for helping and supporting me with statistical issues.
Lena Otterlind, for making it possible to combine research and clinical work. Anja Andersson, for your always helpful manner and friendly support. Ylva Folkesson, for all your encouragement, open and happy attitude and all
support.Panos Tsiartas, for inspiration and support. Kristina Ahlin, for supporting me with tips about writing this thesis. Maria Hallingström, for your open and happy attitude.

82
Linda Englund Ögge
Joy Ellis, for excellent linguistic help.Jan Funke for your great illustrations.My family, my husband Rickard and our four girls, Sandra, Ebba, Alice and Lowa.
Because of you, everything is possible!To my mom and dad, Lillemor and Cay, thanks for your support!
This thesis was supported by Swedish government grants to researchers in public health service (ALFGBG-2863, ALFGBG-11522), Freemasons’ Directorate Board for Children, the Adlerbertska Foundation, the Norwegian Research Council (FUGE 183220/S10, FRIMEDKLI-05 ES236011) and the Jane and Dan Olsson Foundation. The Norwegian Mother and Child Cohort Study was also supported by the Norwegian Ministry of Health and the Ministry of Education and Research, NIH/NIEHS (contract no N01-ES-75558), NIH/NINDS (grant no.1 UO1 NS 047537-01 and grant no.2 UO1 NS 047537-06A1) and the Norwegian Research Council/FUGE (grant no. 151918/S10).

83
REFERENCES1. Morken NH, Kallen K, Jacobsson B. Outcomes of preterm children according to
type of delivery onset: a nationwide population-based study. Paediatr Perinat Epidemiol. 2007;21(5):458-64.
2. Glass HC, Costarino AT, Stayer SA, Brett CM, Cladis F, Davis PJ. Outcomes for extremely premature infants. Anesth Analg. 2015;120(6):1337-51.
3. In: Behrman RE, Butler AS, editors. Preterm Birth: Causes, Consequences, and Prevention. The National Academies Collection: Reports funded by National In-stitutes of Health. Washington (DC)2007.
4. Mikkola K, Ritari N, Tommiska V, Salokorpi T, Lehtonen L, Tammela O, et al. Neurodevelopmental outcome at 5 years of age of a national cohort of ex-tremely low birth weight infants who were born in 1996-1997. Pediatrics. 2005;116(6):1391-400.
5. Feng Y, Abdel-Latif ME, Bajuk B, Lui K, Oei JL. Causes of death in infants admit-ted to Australian neonatal intensive care units between 1995 and 2006. Acta Paediatr. 2012.
6. Pennell CE, Jacobsson B, Williams SM, Buus RM, Muglia LJ, Dolan SM, et al. Ge-netic epidemiologic studies of preterm birth: guidelines for research. Am J Ob-stet Gynecol. 2007;196(2):107-18.
7. Loftin RW, Habli M, Snyder CC, Cormier CM, Lewis DF, Defranco EA. Late preterm birth. Rev Obstet Gynecol. 2010;3(1):10-9.
8. Butt K, Lim K, Society of O, Gynaecologists of C. Determination of gestational age by ultrasound. J Obstet Gynaecol Can. 2014;36(2):171-83.
9. Hoffman CS, Messer LC, Mendola P, Savitz DA, Herring AH, Hartmann KE. Com-parison of gestational age at birth based on last menstrual period and ultra-sound during the first trimester. Paediatr Perinat Epidemiol. 2008;22(6):587-96.
10. Blencowe H, Cousens S, Chou D, Oestergaard M, Say L, Moller AB, et al. Born too soon: the global epidemiology of 15 million preterm births. Reprod Health. 2013;10 Suppl 1:S2.
11. Moutquin JM. Classification and heterogeneity of preterm birth. BJOG. 2003;110 Suppl 20:30-3.
12. Morken NH, Kallen K, Hagberg H, Jacobsson B. Preterm birth in Sweden 1973-2001: rate, subgroups, and effect of changing patterns in multiple births, ma-ternal age, and smoking. Acta Obstet Gynecol Scand. 2005;84(6):558-65.

84
Linda Englund Ögge
13. Caughey AB, Robinson JN, Norwitz ER. Contemporary diagnosis and man-agement of preterm premature rupture of membranes. Rev Obstet Gynecol. 2008;1(1):11-22.
14. Nour NM. Premature delivery and the millennium development goal. Rev Ob-stet Gynecol. 2012;5(2):100-5.
15. Lisonkova S, Sabr Y, Butler B, Joseph KS. International comparisons of preterm birth: higher rates of late preterm birth are associated with lower rates of still-birth and neonatal death. BJOG. 2012;119(13):1630-9.
16. Delnord M, Blondel B, Zeitlin J. What contributes to disparities in the preterm birth rate in European countries? Curr Opin Obstet Gynecol. 2015;27(2):133-42.
17. Zeitlin J, Szamotulska K, Drewniak N, Mohangoo AD, Chalmers J, Sakkeus L, et al. Preterm birth time trends in Europe: a study of 19 countries. BJOG. 2013;120(11):1356-65.
18. Morken NH, Vogel I, Kallen K, Skjaerven R, Langhoff-Roos J, Kesmodel US, et al. Reference population for international comparisons and time trend surveil-lance of preterm delivery proportions in three countries. BMC Womens Health. 2008;8:16.
19. Chang HH, Larson J, Blencowe H, Spong CY, Howson CP, Cairns-Smith S, et al. Preventing preterm births: analysis of trends and potential reductions with in-terventions in 39 countries with very high human development index. Lancet. 2013;381(9862):223-34.
20. Schoen CN, Tabbah S, Iams JD, Caughey AB, Berghella V. Why the United States preterm birth rate is declining. Am J Obstet Gynecol. 2015;213(2):175-80.
21. Ferrero DM, Larson J, Jacobsson B, Di Renzo GC, Norman JE, Martin JN, Jr., et al. Cross-Country Individual Participant Analysis of 4.1 Million Singleton Births in 5 Countries with Very High Human Development Index Confirms Known As-sociations but Provides No Biologic Explanation for 2/3 of All Preterm Births. PLoS One. 2016;11(9):e0162506.
22. Romero R, Espinoza J, Kusanovic JP, Gotsch F, Hassan S, Erez O, et al. The preterm parturition syndrome. BJOG. 2006;113 Suppl 3:17-42.
23. Kemp MW. Preterm birth, intrauterine infection, and fetal inflammation. Front Immunol. 2014;5:574.
24. Kemp MW, Saito M, Newnham JP, Nitsos I, Okamura K, Kallapur SG. Preterm birth, infection, and inflammation advances from the study of animal models. Reprod Sci. 2010;17(7):619-28.

85
Glycemic properties of maternal diet in relation to preterm delivery and abnormal birth weight
25. Yang S, Reid G, Challis JR, Kim SO, Gloor GB, Bocking AD. Is there a role for pro-biotics in the prevention of preterm birth? Front Immunol. 2015;6:62.
26. Menon R. Oxidative stress damage as a detrimental factor in preterm birth pa-thology. Front Immunol. 2014;5:567.
27. Menon R. Human fetal membranes at term: Dead tissue or signalers of parturi-tion? Placenta. 2016;44:1-5.
28. Romero R, Yeo L, Chaemsaithong P, Chaiworapongsa T, Hassan SS. Proges-terone to prevent spontaneous preterm birth. Semin Fetal Neonatal Med. 2014;19(1):15-26.
29. Romero R, Stanczyk FZ. Progesterone is not the same as 17alpha-hydroxypro-gesterone caproate: implications for obstetrical practice. Am J Obstet Gynecol. 2013;208(6):421-6.
30. Wood CE, Keller-Wood M. The critical importance of the fetal hypothalamus-pi-tuitary-adrenal axis. F1000Res. 2016;5.
31. Turton P, Arrowsmith S, Prescott J, Ballard C, Bricker L, Neilson J, et al. A com-parison of the contractile properties of myometrium from singleton and twin pregnancies. PLoS One. 2013;8(5):e63800.
32. Adams Waldorf KM, Singh N, Mohan AR, Young RC, Ngo L, Das A, et al. Uter-ine overdistention induces preterm labor mediated by inflammation: obser-vations in pregnant women and nonhuman primates. Am J Obstet Gynecol. 2015;213(6):830 e1- e19.
33. Oyelese Y, Ananth CV. Placental abruption. Obstet Gynecol. 2006;108(4):1005-16.
34. Catov JM, Nohr EA, Olsen J, Ness RB. Chronic hypertension related to risk for preterm and term small for gestational age births. Obstet Gynecol. 2008;112(2 Pt 1):290-6.
35. Rayanagoudar G, Hashi AA, Zamora J, Khan KS, Hitman GA, Thangaratinam S. Quantification of the type 2 diabetes risk in women with gestational diabe-tes: a systematic review and meta-analysis of 95,750 women. Diabetologia. 2016;59(7):1403-11.
36. Nobile de Santis MS, Radaelli T, Taricco E, Bertini S, Cetin I. Excess of amniot-ic fluid: pathophysiology, correlated diseases and clinical management. Acta Biomed. 2004;75 Suppl 1:53-5.
37. Khatibi A, Brantsaeter AL, Sengpiel V, Kacerovsky M, Magnus P, Morken NH, et al. Prepregnancy maternal body mass index and preterm delivery. Am J Obstet Gynecol. 2012;207(3):212 e1-7.

86
Linda Englund Ögge
38. Han Z, Mulla S, Beyene J, Liao G, McDonald SD, Knowledge Synthesis G. Mater-nal underweight and the risk of preterm birth and low birth weight: a system-atic review and meta-analyses. Int J Epidemiol. 2011;40(1):65-101.
39. Jensen DM, Ovesen P, Beck-Nielsen H, Molsted-Pedersen L, Sorensen B, Vinter C, et al. Gestational weight gain and pregnancy outcomes in 481 obese glu-cose-tolerant women. Diabetes Care. 2005;28(9):2118-22.
40. Magon N, Chauhan M. Pregnancy in Type 1 Diabetes Mellitus: How Special are Special Issues? N Am J Med Sci. 2012;4(6):250-6.
41. Rahman MH, Sultana SZ, Mannan S, Sultana S, Hossain MA. Vascular change in the placenta of diabetic mothers and hypertensive diabetic mothers. Mymens-ingh Med J. 2006;15(2):176-9.
42. Vambergue A, Fajardy I. Consequences of gestational and pregestational diabe-tes on placental function and birth weight. World J Diabetes. 2011;2(11):196-203.
43. Sibai BM. Risk factors, pregnancy complications, and prevention of hyperten-sive disorders in women with pregravid diabetes mellitus. J Matern Fetal Med. 2000;9(1):62-5.
44. Melamed N, Ray JG, Hladunewich M, Cox B, Kingdom JC. Gestational hyper-tension and preeclampsia: are they the same disease? J Obstet Gynaecol Can. 2014;36(7):642-7.
45. Mashiloane CD, Moodley J. Induction or caesarean section for preterm pre-ec-lampsia? J Obstet Gynaecol. 2002;22(4):353-6.
46. Kurdi AM, Mesleh RA, Al-Hakeem MM, Khashoggi TY, Khalifa HM. Multiple pregnancy and preterm labor. Saudi Med J. 2004;25(5):632-7.
47. Sharami SH, Faraji Darkhaneh R, Zahiri Z, Milani F, Asgharnia M, Shakiba M, et al. The relationship between vaginal bleeding in the first and second trimester of pregnancy and preterm labor. Iran J Reprod Med. 2013;11(5):385-90.
48. Holst RM, Mattsby-Baltzer I, Wennerholm UB, Hagberg H, Jacobsson B. Inter-leukin-6 and interleukin-8 in cervical fluid in a population of Swedish women in preterm labor: relationship to microbial invasion of the amniotic fluid, in-tra-amniotic inflammation, and preterm delivery. Acta Obstet Gynecol Scand. 2005;84(6):551-7.
49. Jacobsson B, Mattsby-Baltzer I, Andersch B, Bokstrom H, Holst RM, Wenner-holm UB, et al. Microbial invasion and cytokine response in amniotic fluid in a Swedish population of women in preterm labor. Acta Obstet Gynecol Scand. 2003;82(2):120-8.

87
Glycemic properties of maternal diet in relation to preterm delivery and abnormal birth weight
50. Aaltone R, Jalava J, Laurikainen E, Karkkainen U, Alanen A. Cervical ureaplasma urealyticum colonization: comparison of PCR and culture for its detection and association with preterm birth. Scand J Infect Dis. 2002;34(1):35-40.
51. Bretelle F, Rozenberg P, Pascal A, Favre R, Bohec C, Loundou A, et al. High Atopobium vaginae and Gardnerella vaginalis vaginal loads are associated with preterm birth. Clin Infect Dis. 2015;60(6):860-7.
52. McDonald HM, O’Loughlin JA, Jolley PT, Vigneswaran R, McDonald PJ. Changes in vaginal flora during pregnancy and association with preterm birth. J Infect Dis. 1994;170(3):724-8.
53. McDonald HM, O’Loughlin JA, Jolley P, Vigneswaran R, McDonald PJ. Prenatal microbiological risk factors associated with preterm birth. Br J Obstet Gynae-col. 1992;99(3):190-6.
54. Musilova I, Kutova R, Pliskova L, Stepan M, Menon R, Jacobsson B, et al. In-traamniotic Inflammation in Women with Preterm Prelabor Rupture of Mem-branes. PLoS One. 2015;10(7):e0133929.
55. Yelland LN, Gajewski BJ, Colombo J, Gibson RA, Makrides M, Carlson SE. Pre-dicting the effect of maternal docosahexaenoic acid (DHA) supplementation to reduce early preterm birth in Australia and the United States using results of within country randomized controlled trials. Prostaglandins Leukot Essent Fatty Acids. 2016;112:44-9.
56. Brantsaeter AL, Englund-Ogge L, Haugen M, Birgisdottir BE, Knutsen HK, Seng-piel V, et al. Maternal intake of seafood and supplementary long chain n-3 po-ly-unsaturated fatty acids and preterm delivery. BMC Pregnancy Childbirth. 2017;17(1):41.
57. Olsen SF, Osterdal ML, Salvig JD, Kesmodel U, Henriksen TB, Hedegaard M, et al. Duration of pregnancy in relation to seafood intake during early and mid pregnancy: prospective cohort. Eur J Epidemiol. 2006;21(10):749-58.
58. Makrides M, Duley L, Olsen SF. Marine oil, and other prostaglandin precursor, supplementation for pregnancy uncomplicated by pre-eclampsia or intrauter-ine growth restriction. Cochrane Database Syst Rev. 2006(3):CD003402.
59. Rasmussen MA, Maslova E, Halldorsson TI, Olsen SF. Characterization of di-etary patterns in the Danish national birth cohort in relation to preterm birth. PLoS One. 2014;9(4):e93644.
60. Chen X, Zhao D, Mao X, Xia Y, Baker PN, Zhang H. Maternal Dietary Patterns and Pregnancy Outcome. Nutrients. 2016;8(6).

88
Linda Englund Ögge
61. Gresham E, Bisquera A, Byles JE, Hure AJ. Effects of dietary interventions on pregnancy outcomes: a systematic review and meta-analysis. Matern Child Nutr. 2016;12(1):5-23.
62. Yuan W, Duffner AM, Chen L, Hunt LP, Sellers SM, Bernal AL. Analysis of preterm deliveries below 35 weeks’ gestation in a tertiary referral hospital in the UK. A case-control survey. BMC Res Notes. 2010;3:119.
63. Folkehelseinstituttet.´“Fødselsvekt i Norge - Faktaark Med Statistikk.” www.fhi.no/hn/statistikk/statistikk3/fodselsvekt-i-norge-faktaark/ (acces-sed 7 Dec 2015).
64. Catalano PM, Thomas AJ, Huston LP, Fung CM. Effect of maternal metabolism on fetal growth and body composition. Diabetes Care. 1998;21 Suppl 2:B85-90.
65. Bamberg C, Kalache KD. Prenatal diagnosis of fetal growth restriction. Semin Fetal Neonatal Med. 2004;9(5):387-94.
66. Militello M, Pappalardo EM, Ermito S, Dinatale A, Cavaliere A, Carrara S. Obstet-ric management of IUGR. J Prenat Med. 2009;3(1):6-9.
67. Alberry M, Soothill P. Management of fetal growth restriction. Arch Dis Child Fetal Neonatal Ed. 2007;92(1):F62-7.
68. Marsal K, Persson PH, Larsen T, Lilja H, Selbing A, Sultan B. Intrauterine growth curves based on ultrasonically estimated foetal weights. Acta Paediatr. 1996;85(7):843-8.
69. Skjaerven R, Gjessing HK, Bakketeig LS. Birthweight by gestational age in Nor-way. Acta Obstet Gynecol Scand. 2000;79(6):440-9.
70. Gardosi J, Chang A, Kalyan B, Sahota D, Symonds EM. Customised antenatal growth charts. Lancet. 1992;339(8788):283-7.
71. Hadlock FP, Harrist RB, Martinez-Poyer J. In utero analysis of fetal growth: a sonographic weight standard. Radiology. 1991;181(1):129-33.
72. Gardosi J. New definition of small for gestational age based on fetal growth potential. Hormone research. 2006;65 Suppl 3:15-8.
73. Lee AC, Katz J, Blencowe H, Cousens S, Kozuki N, Vogel JP, et al. National and regional estimates of term and preterm babies born small for gestational age in 138 low-income and middle-income countries in 2010. Lancet Glob Health. 2013;1(1):e26-36.
74. Ramakrishnan U. Nutrition and low birth weight: from research to practice. Am J Clin Nutr. 2004;79(1):17-21.
75. Grieger JA, Clifton VL. A review of the impact of dietary intakes in human preg-nancy on infant birthweight. Nutrients. 2015;7(1):153-78.
89
Glycemic properties of maternal diet in relation to preterm delivery and abnormal birth weight
76. Jancevska A, Tasic V, Damcevski N, Danilovski D, Jovanovska V, Gucev Z. Chil-dren born small for gestational age (SGA). Prilozi. 2012;33(2):47-58.
77. Moore LG. Fetal growth restriction and maternal oxygen transport during high altitude pregnancy. High Alt Med Biol. 2003;4(2):141-56.
78. Faraci M, Renda E, Monte S, Di Prima FA, Valenti O, De Domenico R, et al. Fetal growth restriction: current perspectives. J Prenat Med. 2011;5(2):31-3.
79. Bukowski R, Hansen NI, Willinger M, Reddy UM, Parker CB, Pinar H, et al. Fetal growth and risk of stillbirth: a population-based case-control study. PLoS Med. 2014;11(4):e1001633.
80. Werner EF, Savitz DA, Janevic TM, Ehsanipoor RM, Thung SF, Funai EF, et al. Mode of delivery and neonatal outcomes in preterm, small-for-gestational-age newborns. Obstet Gynecol. 2012;120(3):560-4.
81. Francis JH, Permezel M, Davey MA. Perinatal mortality by birthweight centile. Aust N Z J Obstet Gynaecol. 2014;54(4):354-9.
82. Arya VB, Flanagan SE, Kumaran A, Shield JP, Ellard S, Hussain K, et al. Clini-cal and molecular characterisation of hyperinsulinaemic hypoglycaemia in infants born small-for-gestational age. Arch Dis Child Fetal Neonatal Ed. 2013;98(4):F356-8.
83. Beeby PJ, Jeffery H. Risk factors for necrotising enterocolitis: the influence of gestational age. Arch Dis Child. 1992;67(4 Spec No):432-5.
84. Hendrix N, Berghella V. Non-placental causes of intrauterine growth restric-tion. Semin Perinatol. 2008;32(3):161-5.
85. McCowan L, Horgan RP. Risk factors for small for gestational age infants. Best Pract Res Clin Obstet Gynaecol. 2009;23(6):779-93.
86. Ng SK, Olog A, Spinks AB, Cameron CM, Searle J, McClure RJ. Risk factors and obstetric complications of large for gestational age births with adjustments for community effects: results from a new cohort study. BMC Public Health. 2010;10:460.
87. Araujo Junior E, Peixoto AB, Zamarian AC, Elito Junior J, Tonni G. Macrosomia. Best Pract Res Clin Obstet Gynaecol. 2017;38:83-96.
88. Morrens A, Verhaeghe J, Vanhole C, Devlieger R, Mathieu C, Benhalima K. Risk factors for large-for-gestational age infants in pregnant women with type 1 di-abetes. BMC Pregnancy Childbirth. 2016;16(1):162.
89. Wu G, Bazer FW, Cudd TA, Meininger CJ, Spencer TE. Maternal nutrition and fetal development. J Nutr. 2004;134(9):2169-72.
90
Linda Englund Ögge
90. Cnattingius S, Villamor E, Lagerros YT, Wikstrom AK, Granath F. High birth weight and obesity--a vicious circle across generations. Int J Obes (Lond). 2012;36(10):1320-4.
91. Abu-Saad K, Fraser D. Maternal nutrition and birth outcomes. Epidemiol Rev. 2010;32:5-25.
92. Jacques PF, Tucker KL. Are dietary patterns useful for understanding the role of diet in chronic disease? Am J Clin Nutr. 2001;73(1):1-2.
93. Knudsen VK, Orozova-Bekkevold IM, Mikkelsen TB, Wolff S, Olsen SF. Major di-etary patterns in pregnancy and fetal growth. Eur J Clin Nutr. 2008;62(4):463-70.
94. Okubo H, Miyake Y, Sasaki S, Tanaka K, Murakami K, Hirota Y, et al. Maternal dietary patterns in pregnancy and fetal growth in Japan: the Osaka Maternal and Child Health Study. Br J Nutr. 2012;107(10):1526-33.
95. Poon AK, Yeung E, Boghossian N, Albert PS, Zhang C. Maternal Dietary Patterns during Third Trimester in Association with Birthweight Characteristics and Early Infant Growth. Scientifica (Cairo). 2013;2013:786409.
96. Cetin I, Berti C, Calabrese S. Role of micronutrients in the periconceptional pe-riod. Hum Reprod Update. 2010;16(1):80-95.
97. Susser M, Stein Z. Timing in prenatal nutrition: a reprise of the Dutch Famine Study. Nutrition reviews. 1994;52(3):84-94.
98. Cutfield WS, Hofman PL, Mitchell M, Morison IM. Could epigenetics play a role in the developmental origins of health and disease? Pediatr Res. 2007;61(5 Pt 2):68R-75R.
99. Ouni M, Castell AL, Linglart A, Bougneres P. Genetic and Epigenetic Modulation of Growth Hormone Sensitivity Studied With the IGF-1 Generation Test. The Journal of clinical endocrinology and metabolism. 2015;100(6):E919-25.
100. Martino F, Magenta A, Pannarale G, Martino E, Zanoni C, Perla FM, et al. Epi-genetics and cardiovascular risk in childhood. J Cardiovasc Med (Hagerstown). 2016;17(8):539-46.
101. Schierding W, Cutfield WS, O’Sullivan JM. The missing story behind Genome Wide Association Studies: single nucleotide polymorphisms in gene deserts have a story to tell. Frontiers in genetics. 2014;5:39.
102. Barker DJ, Winter PD, Osmond C, Margetts B, Simmonds SJ. Weight in infancy and death from ischaemic heart disease. Lancet. 1989;2(8663):577-80.
103. Meltzer HM, Brantsaeter AL, Nilsen RM, Magnus P, Alexander J, Haugen M. Ef-fect of dietary factors in pregnancy on risk of pregnancy complications: results

91
Glycemic properties of maternal diet in relation to preterm delivery and abnormal birth weight
from the Norwegian Mother and Child Cohort Study. Am J Clin Nutr. 2011;94(6 Suppl):1970S-4S.
104. Schoenaker DA, Soedamah-Muthu SS, Mishra GD. The association between di-etary factors and gestational hypertension and pre-eclampsia: a systematic re-view and meta-analysis of observational studies. BMC medicine. 2014;12:157.
105. Ramakrishnan U, Grant F, Goldenberg T, Zongrone A, Martorell R. Effect of women’s nutrition before and during early pregnancy on maternal and infant outcomes: a systematic review. Paediatr Perinat Epidemiol. 2012;26 Suppl 1:285-301.
106. Gaccioli F, Lager S. Placental Nutrient Transport and Intrauterine Growth Re-striction. Front Physiol. 2016;7:40.
107. Lowe LP, Metzger BE, Dyer AR, Lowe J, McCance DR, Lappin TR, et al. Hypergly-cemia and Adverse Pregnancy Outcome (HAPO) Study: associations of mater-nal A1C and glucose with pregnancy outcomes. Diabetes Care. 2012;35(3):574-80.
108. Brett KE, Ferraro ZM, Holcik M, Adamo KB. Prenatal physical activity and diet composition affect the expression of nutrient transporters and mTOR signaling molecules in the human placenta. Placenta. 2015;36(2):204-12.
109. Biochemistry. 5th edition. New York: W H Freeman. 2002.110. Bray GA. How bad is fructose? Am J Clin Nutr. 2007;86(4):895-6.111. Kanter JE, Kramer F, Barnhart S, Averill MM, Vivekanandan-Giri A, Vickery
T, et al. Diabetes promotes an inflammatory macrophage phenotype and atherosclerosis through acyl-CoA synthetase 1. Proc Natl Acad Sci U S A. 2012;109(12):E715-24.
112. Scifres C, Feghali M, Althouse AD, Caritis S, Catov J. Adverse Outcomes and Po-tential Targets for Intervention in Gestational Diabetes and Obesity. Obstet Gy-necol. 2015;126(2):316-25.
113. Group HSCR, Metzger BE, Lowe LP, Dyer AR, Trimble ER, Chaovarindr U, et al. Hyperglycemia and adverse pregnancy outcomes. N Engl J Med. 2008;358(19):1991-2002.
114. Barbour LA, McCurdy CE, Hernandez TL, Kirwan JP, Catalano PM, Friedman JE. Cellular mechanisms for insulin resistance in normal pregnancy and gestation-al diabetes. Diabetes Care. 2007;30 Suppl 2:S112-9.
115. Lautt WW. Postprandial insulin resistance as an early predictor of cardiovascu-lar risk. Ther Clin Risk Manag. 2007;3(5):761-70.
116. Gin H, Rigalleau V. Post-prandial hyperglycemia. post-prandial hyperglycemia and diabetes. Diabetes Metab. 2000;26(4):265-72.

92
Linda Englund Ögge
117. Halldorsson TI, Strom M, Petersen SB, Olsen SF. Intake of artificially sweetened soft drinks and risk of preterm delivery: a prospective cohort study in 59,334 Danish pregnant women. Am J Clin Nutr. 2010;92(3):626-33.
118. Kellett GL, Brot-Laroche E, Mace OJ, Leturque A. Sugar absorption in the intes-tine: the role of GLUT2. Annu Rev Nutr. 2008;28:35-54.
119. Malik VS, Hu FB. Sweeteners and Risk of Obesity and Type 2 Diabetes: The Role of Sugar-Sweetened Beverages. Curr Diab Rep. 2012.
120. Kit BK, Fakhouri TH, Park S, Nielsen SJ, Ogden CL. Trends in sugar-sweetened beverage consumption among youth and adults in the United States: 1999-2010. Am J Clin Nutr. 2013;98(1):180-8.
121. Duffey KJ, Huybrechts I, Mouratidou T, Libuda L, Kersting M, De Vriendt T, et al. Beverage consumption among European adolescents in the HELENA study. Eur J Clin Nutr. 2012;66(2):244-52.
122. Wolf A, Bray GA, Popkin BM. A short history of beverages and how our body treats them. Obes Rev. 2008;9(2):151-64.
123. Kuzma JN, Cromer G, Hagman DK, Breymeyer KL, Roth CL, Foster-Schubert KE, et al. No difference in ad libitum energy intake in healthy men and women consuming beverages sweetened with fructose, glucose, or high-fructose corn syrup: a randomized trial. Am J Clin Nutr. 2015;102(6):1373-80.
124. Shearer J, Swithers SE. Artificial sweeteners and metabolic dysregulation: Les-sons learned from agriculture and the laboratory. Rev Endocr Metab Disord. 2016;17(2):179-86.
125. Willett WC. The Mediterranean diet: science and practice. Public Health Nutr. 2006;9(1A):105-10.
126. Azeredo CM, de Rezende LF, Canella DS, Moreira Claro R, de Castro IR, Luiz Odo C, et al. Dietary intake of Brazilian adolescents. Public Health Nutr. 2015;18(7):1215-24.
127. Jenkins DJ, Wolever TM, Jenkins AL, Thorne MJ, Lee R, Kalmusky J, et al. The gly-caemic index of foods tested in diabetic patients: a new basis for carbohydrate exchange favouring the use of legumes. Diabetologia. 1983;24(4):257-64.
128. Brand-Miller JC, Stockmann K, Atkinson F, Petocz P, Denyer G. Glycemic index, postprandial glycemia, and the shape of the curve in healthy subjects: analysis of a database of more than 1,000 foods. Am J Clin Nutr. 2009;89(1):97-105.
129. Foster-Powell K, Holt SH, Brand-Miller JC. International table of glycemic index and glycemic load values: 2002. Am J Clin Nutr. 2002;76(1):5-56.
130. Willett W, Manson J, Liu S. Glycemic index, glycemic load, and risk of type 2 diabetes. Am J Clin Nutr. 2002;76(1):274S-80S.

93
Glycemic properties of maternal diet in relation to preterm delivery and abnormal birth weight
131. Livesey G, Taylor R, Hulshof T, Howlett J. Glycemic response and health--a sys-tematic review and meta-analysis: relations between dietary glycemic proper-ties and health outcomes. Am J Clin Nutr. 2008;87(1):258S-68S.
132. Vinoy S, Laville M, Feskens EJ. Slow-release carbohydrates: growing evidence on metabolic responses and public health interest. Summary of the symposium held at the 12th European Nutrition Conference (FENS 2015). Food Nutr Res. 2016;60:31662.
133. Vinoy S, Normand S, Meynier A, Sothier M, Louche-Pelissier C, Peyrat J, et al. Cereal processing influences postprandial glucose metabolism as well as the GI effect. J Am Coll Nutr. 2013;32(2):79-91.
134. Venn BJ, Green TJ. Glycemic index and glycemic load: measurement issues and their effect on diet-disease relationships. Eur J Clin Nutr. 2007;61 Suppl 1:S122-31.
135. Sermer M, Naylor CD, Gare DJ, Kenshole AB, Ritchie JW, Farine D, et al. Impact of increasing carbohydrate intolerance on maternal-fetal outcomes in 3637 wom-en without gestational diabetes. The Toronto Tri-Hospital Gestational Diabetes Project. Am J Obstet Gynecol. 1995;173(1):146-56.
136. Farmer G, Russell G, Hamilton-Nicol DR, Ogenbede HO, Ross IS, Pearson DW, et al. The influence of maternal glucose metabolism on fetal growth, development and morbidity in 917 singleton pregnancies in nondiabetic women. Diabetolo-gia. 1988;31(3):134-41.
137. Higgins M, Mc Auliffe F. A review of maternal and fetal growth factors in diabet-ic pregnancy. Curr Diabetes Rev. 2010;6(2):116-25.
138. Moses RG, Luebcke M, Davis WS, Coleman KJ, Tapsell LC, Petocz P, et al. Effect of a low-glycemic-index diet during pregnancy on obstetric outcomes. Am J Clin Nutr. 2006;84(4):807-12.
139. Scholl TO, Chen X, Khoo CS, Lenders C. The dietary glycemic index during preg-nancy: influence on infant birth weight, fetal growth, and biomarkers of carbo-hydrate metabolism. Am J Epidemiol. 2004;159(5):467-74.
140. Louie JC, Brand-Miller JC, Markovic TP, Ross GP, Moses RG. Glycemic index and pregnancy: a systematic literature review. J Nutr Metab. 2010;2010:282464.
141. Carmichael SL, Yang W, Shaw GM, National Birth Defects Prevention S. Ma-ternal dietary nutrient intake and risk of preterm delivery. Am J Perinatol. 2013;30(7):579-88.
142. Rhodes ET, Pawlak DB, Takoudes TC, Ebbeling CB, Feldman HA, Lovesky MM, et al. Effects of a low-glycemic load diet in overweight and obese pregnant wom-en: a pilot randomized controlled trial. Am J Clin Nutr. 2010;92(6):1306-15.

94
Linda Englund Ögge
143. Farshchi HR, Taylor MA, Macdonald IA. Regular meal frequency creates more appropriate insulin sensitivity and lipid profiles compared with irregular meal frequency in healthy lean women. Eur J Clin Nutr. 2004;58(7):1071-7.
144. Sermer M, Naylor CD, Gare DJ, Kenshole AB, Ritchie JW, Farine D, et al. Im-pact of time since last meal on the gestational glucose challenge test. The Toronto Tri-Hospital Gestational Diabetes Project. Am J Obstet Gynecol. 1994;171(3):607-16.
145. Kulovitz MG, Kravitz LR, Mermier C, Gibson AL, Conn CA, Kolkmeyer D, et al. Po-tential role of meal frequency as a strategy for weight loss and health in over-weight or obese adults. Nutrition. 2014;30(4):386-92.
146. Mattson MP. Energy intake, meal frequency, and health: a neurobiological per-spective. Annu Rev Nutr. 2005;25:237-60.
147. Mattson MP, Allison DB, Fontana L, Harvie M, Longo VD, Malaisse WJ, et al. Meal frequency and timing in health and disease. Proc Natl Acad Sci U S A. 2014;111(47):16647-53.
148. Hillesund ER, Overby NC, Engel SM, Klungsoyr K, Harmon QE, Haugen M, et al. Associations of adherence to the New Nordic Diet with risk of preeclampsia and preterm delivery in the Norwegian Mother and Child Cohort Study (MoBa). Eur J Epidemiol. 2014;29(10):753-65.
149. Silver M, Fowden AL. Uterine prostaglandin F metabolite production in relation to glucose availability in late pregnancy and a possible influence of diet on time of delivery in the mare. J Reprod Fertil Suppl. 1982;32:511-9.
150. Binienda Z, Massmann A, Mitchell MD, Gleed RD, Figueroa JP, Nathanielsz PW. Effect of food withdrawal on arterial blood glucose and plasma 13,14-dihy-dro-15-keto-prostaglandin F2 alpha concentrations and nocturnal myometrial electromyographic activity in the pregnant rhesus monkey in the last third of gestation: a model for preterm labor? Am J Obstet Gynecol. 1989;160(3):746-50.
151. Trichopoulou A, Martinez-Gonzalez MA, Tong TY, Forouhi NG, Khandelwal S, Prabhakaran D, et al. Definitions and potential health benefits of the Mediter-ranean diet: views from experts around the world. BMC Med. 2014;12:112.
152. Liyanage T, Ninomiya T, Wang A, Neal B, Jun M, Wong MG, et al. Effects of the Mediterranean Diet on Cardiovascular Outcomes-A Systematic Review and Me-ta-Analysis. PLoS One. 2016;11(8):e0159252.
153. Potentas E, Witkowska AM, Zujko ME. Mediterranean diet for breast cancer prevention and treatment in postmenopausal women. Prz Menopauzalny. 2015;14(4):247-53.

95
Glycemic properties of maternal diet in relation to preterm delivery and abnormal birth weight
154. Lippi G, Albiero A, Montagnana M, Salvagno GL, Scevarolli S, Franchi M, et al. Lipid and lipoprotein profile in physiological pregnancy. Clin Lab. 2007;53(3-4):173-7.
155. Smith GC, Pell JP, Walsh D. Pregnancy complications and maternal risk of isch-aemic heart disease: a retrospective cohort study of 129,290 births. Lancet. 2001;357(9273):2002-6.
156. Myhre R, Brantsaeter AL, Myking S, Eggesbo M, Meltzer HM, Haugen M, et al. Intake of Garlic and Dried Fruits Is Associated with Lower Risk of Spontaneous Preterm Delivery. J Nutr. 2013.
157. Gibson GR, Probert HM, Loo JV, Rastall RA, Roberfroid MB. Dietary modulation of the human colonic microbiota: updating the concept of prebiotics. Nutr Res Rev. 2004;17(2):259-75.
158. Sanders ME. Probiotics: definition, sources, selection, and uses. Clin Infect Dis. 2008;46 Suppl 2:S58-61; discussion S144-51.
159. Myhre R, Brantsaeter AL, Myking S, Gjessing HK, Sengpiel V, Meltzer HM, et al. Intake of probiotic food and risk of spontaneous preterm delivery. Am J Clin Nutr. 2011;93(1):151-7.
160. Brantsaeter AL, Myhre R, Haugen M, Myking S, Sengpiel V, Magnus P, et al. In-take of probiotic food and risk of preeclampsia in primiparous women: the Norwegian Mother and Child Cohort Study. Am J Epidemiol. 2011;174(7):807-15.
161. Byers T. Food frequency dietary assessment: how bad is good enough? Am J Epidemiol. 2001;154(12):1087-8.
162. Shim JS, Oh K, Kim HC. Dietary assessment methods in epidemiologic studies. Epidemiol Health. 2014;36:e2014009.
163. Kho M, Lee JE, Song YM, Lee K, Kim K, Yang S, et al. Genetic and environmental influences on sodium intake determined by using half-day urine samples: the Healthy Twin Study. Am J Clin Nutr. 2013;98(6):1410-6.
164. Kim YJ, Kim OY, Cho Y, Chung JH, Jung YS, Hwang GS, et al. Plasma phospho-lipid fatty acid composition in ischemic stroke: importance of docosahexae-noic acid in the risk for intracranial atherosclerotic stenosis. Atherosclerosis. 2012;225(2):418-24.
165. Potischman N. Biologic and methodologic issues for nutritional biomarkers. J Nutr. 2003;133 Suppl 3:875S-80S.
166. Souverein OW, Dekkers AL, Geelen A, Haubrock J, de Vries JH, Ocke MC, et al. Comparing four methods to estimate usual intake distributions. Eur J Clin Nutr. 2011;65 Suppl 1:S92-101.
96
Linda Englund Ögge
167. Margetts BM, Cade JE, Osmond C. Comparison of a food frequency question-naire with a diet record. Int J Epidemiol. 1989;18(4):868-73.
168. Brown D. Do food frequency questionnaires have too many limitations? J Am Diet Assoc. 2006;106(10):1541-2.
169. Kristal AR, Peters U, Potter JD. Is it time to abandon the food frequency ques-tionnaire? Cancer Epidemiol Biomarkers Prev. 2005;14(12):2826-8.
170. Kelemen LE. Food frequency questionnaires: not irrelevant yet. Cancer Epide-miol Biomarkers Prev. 2006;15(5):1054.
171. Willett WC, Sampson L, Stampfer MJ, Rosner B, Bain C, Witschi J, et al. Repro-ducibility and validity of a semiquantitative food frequency questionnaire. Am J Epidemiol. 1985;122(1):51-65.
172. Magnus P, Birke C, Vejrup K, Haugan A, Alsaker E, Daltveit AK, et al. Cohort Profile Update: The Norwegian Mother and Child Cohort Study (MoBa). Int J Epidemiol. 2016;45(2):382-8.
173. Meltzer HM, Brantsaeter AL, Ydersbond TA, Alexander J, Haugen M. Method-ological challenges when monitoring the diet of pregnant women in a large study: experiences from the Norwegian Mother and Child Cohort Study (MoBa). Matern Child Nutr. 2008;4(1):14-27.
174. Song JW, Chung KC. Observational studies: cohort and case-control studies. Plast Reconstr Surg. 2010;126(6):2234-42.
175. Brantsaeter AL, Haugen M, Alexander J, Meltzer HM. Validity of a new food fre-quency questionnaire for pregnant women in the Norwegian Mother and Child Cohort Study (MoBa). Matern Child Nutr. 2008;4(1):28-43.
176. Rimestad AH, Borgejordet Å, Vesterhus KN, Sygnestveit K, Løken EB, Trygg K, et al. [Den store matvaretabellen] The Norwegian Food Composition Table. Nor-wegian Food Safety Authority; Norwegian Directorate of Health; University of Oslo, Department of Nutrition. 2001.
177. Atkinson FS, Foster-Powell K, Brand-Miller JC. International tables of glycemic index and glycemic load values: 2008. Diabetes Care. 2008;31(12):2281-3.
178. Riserus U, Arnlov J, Berglund L. Long-term predictors of insulin resistance: role of lifestyle and metabolic factors in middle-aged men. Diabetes Care. 2007;30(11):2928-33.
179. Maachi M, Pieroni L, Bruckert E, Jardel C, Fellahi S, Hainque B, et al. Systemic low-grade inflammation is related to both circulating and adipose tissue TN-Falpha, leptin and IL-6 levels in obese women. Int J Obes Relat Metab Disord. 2004;28(8):993-7.
97
Glycemic properties of maternal diet in relation to preterm delivery and abnormal birth weight
180. Gaudet L, Ferraro ZM, Wen SW, Walker M. Maternal obesity and occurrence of fetal macrosomia: a systematic review and meta-analysis. Biomed Res Int. 2014;2014:640291.
181. Northstone K, Emmett P, Rogers I. Dietary patterns in pregnancy and as-sociations with socio-demographic and lifestyle factors. Eur J Clin Nutr. 2008;62(4):471-9.
182. Franklin WJ, Benton MK, Parekh DR. Cardiac disease in pregnancy. Tex Heart Inst J. 2011;38(2):151-3.
183. Newby PK, Tucker KL. Empirically derived eating patterns using factor or clus-ter analysis: a review. Nutr Rev. 2004;62(5):177-203.
184. Budaev. SV. Using Principal Components and Factor Analysis in Animal Be-haviour Research: Caveats and Guidelines. Ethology. 2010;5 Feb.
185. Kaiser-Meyer-Olkin (KMO) Test for Sampling Adequacy. www.statisticshowto.com/kaiser-meyer-olkin/ (accessed 30 Maj 2016).
186. Norwegian Institute of Public Health. “Research and data access from the Nor-wegian Mother and Child Cohort Study.” www.fhi.no/...health...health.../re-search-and-data-access/(accessed 18 April 2016).
187. Englund-Ogge L, Brantsaeter AL, Haugen M, Sengpiel V, Khatibi A, Myhre R, et al. Association between intake of artificially sweetened and sugar-sweetened beverages and preterm delivery: a large prospective cohort study. Am J Clin Nutr.96(3):552-9.
188. Englund-Ogge L, Brantsaeter AL, Sengpiel V, Haugen M, Birgisdottir BE, Myhre R, et al. Maternal dietary patterns and preterm delivery: results from large pro-spective cohort study. BMJ. 2014;348:g1446.
189. Bothwell LE, Greene JA, Podolsky SH, Jones DS. Assessing the Gold Stan-dard--Lessons from the History of RCTs. N Engl J Med. 2016;374(22):2175-81.
190. Dodd JM, Turnbull D, McPhee AJ, Deussen AR, Grivell RM, Yelland LN, et al. An-tenatal lifestyle advice for women who are overweight or obese: LIMIT ran-domised trial. BMJ. 2014;348:g1285.
191. Scholl TO, Sowers M, Chen X, Lenders C. Maternal glucose concentration influ-ences fetal growth, gestation, and pregnancy complications. Am J Epidemiol. 2001;154(6):514-20.
192. Esposito K, Nappo F, Marfella R, Giugliano G, Giugliano F, Ciotola M, et al. In-flammatory cytokine concentrations are acutely increased by hyperglycemia in humans: role of oxidative stress. Circulation. 2002;106(16):2067-72.

98
Linda Englund Ögge
193. Ling PR, Smith RJ, Bistrian BR. Hyperglycemia enhances the cytokine produc-tion and oxidative responses to a low but not high dose of endotoxin in rats. Crit Care Med. 2005;33(5):1084-9.
194. Gucer F, Balkanli-Kaplan P, Yuksel M, Yuce MA, Ture M, Yardim T. Maternal se-rum tumor necrosis factor-alpha in patients with preterm labor. J Reprod Med. 2001;46(3):232-6.
195. Ye J. Mechanisms of insulin resistance in obesity. Front Med. 2013;7(1):14-24.196. Lao TT, Ho LF. Does maternal glucose intolerance affect the length of gestation
in singleton pregnancies? J Soc Gynecol Investig. 2003;10(6):366-71.197. Anderberg E, Kallen K, Berntorp K. The impact of gestational diabetes mellitus
on pregnancy outcome comparing different cut-off criteria for abnormal glu-cose tolerance. Acta Obstet Gynecol Scand. 2010;89(12):1532-7.
198. McArdle MA, Finucane OM, Connaughton RM, McMorrow AM, Roche HM. Mechanisms of obesity-induced inflammation and insulin resistance: insights into the emerging role of nutritional strategies. Front Endocrinol (Lausanne). 2013;4:52.
199. Lamont RF. Advances in the Prevention of Infection-Related Preterm Birth. Front Immunol. 2015;6:566.
200. Olafsdottir AS, Thorsdottir I, Gunnarsdottir I, Thorgeirsdottir H, Steingrims-dottir L. Comparison of women’s diet assessed by FFQs and 24-hour recalls with and without underreporters: associations with biomarkers. Ann Nutr Me-tab. 2006;50(5):450-60.
201. Sullivan EL, Riper KM, Lockard R, Valleau JC. Maternal high-fat diet program-ming of the neuroendocrine system and behavior. Horm Behav. 2015;76:153-61.
202. Correia-Branco A, Keating E, Martel F. Maternal undernutrition and fetal devel-opmental programming of obesity: the glucocorticoid connection. Reprod Sci. 2015;22(2):138-45.
203. Maslowski KM, Mackay CR. Diet, gut microbiota and immune responses. Nat Immunol. 2011;12(1):5-9.
204. Le Chatelier E, Nielsen T, Qin J, Prifti E, Hildebrand F, Falony G, et al. Rich-ness of human gut microbiome correlates with metabolic markers. Nature. 2013;500(7464):541-6.
205. Cotillard A, Kennedy SP, Kong LC, Prifti E, Pons N, Le Chatelier E, et al. Dietary in-tervention impact on gut microbial gene richness. Nature. 2013;500(7464):585-8.

99
Glycemic properties of maternal diet in relation to preterm delivery and abnormal birth weight
206. Shen J, Obin MS, Zhao L. The gut microbiota, obesity and insulin resistance. Mol Aspects Med. 2013;34(1):39-58.
207. Jeffery IB, O’Toole PW. Diet-microbiota interactions and their implications for healthy living. Nutrients. 2013;5(1):234-52.
208. Conlon MA, Bird AR. The impact of diet and lifestyle on gut microbiota and human health. Nutrients. 2015;7(1):17-44.
209. Stojanovic N, Plecas D, Plesinac S. Normal vaginal flora, disorders and applica-tion of probiotics in pregnancy. Arch Gynecol Obstet. 2012;286(2):325-32.
210. Underwood MA, Gilbert WM, Sherman MP. Amniotic fluid: not just fetal urine anymore. J Perinatol. 2005;25(5):341-8.
211. Funkhouser LJ, Bordenstein SR. Mom knows best: the universality of maternal microbial transmission. PLoS Biol. 2013;11(8):e1001631.
212. Aagaard K, Ma J, Antony KM, Ganu R, Petrosino J, Versalovic J. The pla-centa harbors a unique microbiome. Science translational medicine. 2014;6(237):237ra65.
213. Hernandez-Diaz S, Boeke CE, Romans AT, Young B, Margulis AV, McElrath TF, et al. Triggers of spontaneous preterm delivery--why today? Paediatr Perinat Epidemiol. 2014;28(2):79-87.
214. Siega-Riz AM, Herrmann TS, Savitz DA, Thorp JM. Frequency of eating during pregnancy and its effect on preterm delivery. Am J Epidemiol. 2001;153(7):647-52.
215. Kaplan M, Eidelman AI, Aboulafia Y. Fasting and the precipitation of labor. The Yom Kippur effect. JAMA. 1983;250(10):1317-8.
216. Carmichael SL, Yang W, Shaw GM. Maternal Dietary Nutrient Intake and Risk of Preterm Delivery. AM J Perinatal. 2013 Aug; 30(7):579-588.
217. Sanchez-Pimienta TG, Batis C, Lutter CK, Rivera JA. Sugar-Sweetened Beverages Are the Main Sources of Added Sugar Intake in the Mexican Population. J Nutr. 2016;146(9):1888S-96S.
218. Mani I, Dwarkanath P, Thomas T, Thomas A, Kurpad AV. Maternal fat and fatty acid intake and birth outcomes in a South Indian population. Int J Epidemiol. 2016;45(2):523-31.
219. Silva FM, Kramer CK, Crispim D, Azevedo MJ. A high-glycemic index, low-fi-ber breakfast affects the postprandial plasma glucose, insulin, and ghrelin re-sponses of patients with type 2 diabetes in a randomized clinical trial. J Nutr. 2015;145(4):736-41.

100
Linda Englund Ögge
220. Hagander B, Asp NG, Efendic S, Nilsson-Ehle P, Schersten B. Dietary fiber de-creases fasting blood glucose levels and plasma LDL concentration in noninsu-lin-dependent diabetes mellitus patients. Am J Clin Nutr. 1988;47(5):852-8.
221. Group HSCR. Hyperglycemia and Adverse Pregnancy Outcome (HAPO) Study: associations with neonatal anthropometrics. Diabetes. 2009;58(2):453-9.
222. Rebello CJ, O’Neil CE, Greenway FL. Dietary fiber and satiety: the effects of oats on satiety. Nutr Rev. 2016;74(2):131-47.
223. Clark MJ, Slavin JL. The effect of fiber on satiety and food intake: a systematic review. J Am Coll Nutr. 2013;32(3):200-11.
224. Lee JM, Kim MJ, Kim MY, Han JY, Ahn HK, Choi JS, et al. Gestational weight gain is an important risk factor for excessive fetal growth. Obstet Gynecol Sci. 2014;57(6):442-7.
225. Catalano P, deMouzon SH. Maternal obesity and metabolic risk to the offspring: why lifestyle interventions may have not achieved the desired outcomes. Int J Obes (Lond). 2015;39(4):642-9.
226. Brantsaeter AL, Birgisdottir BE, Meltzer HM, Kvalem HE, Alexander J, Magnus P, et al. Maternal seafood consumption and infant birth weight, length and head circumference in the Norwegian Mother and Child Cohort Study. Br J Nutr. 2012;107(3):436-44.
227. Pannucci CJ, Wilkins EG. Identifying and avoiding bias in research. Plast Recon-str Surg. 2010;126(2):619-25.
228. Nilsen RM, Vollset SE, Gjessing HK, Skjaerven R, Melve KK, Schreuder P, et al. Self-selection and bias in a large prospective pregnancy cohort in Norway. Pae-diatr Perinat Epidemiol. 2009;23(6):597-608.
229. Kock K, Kock F, Klein K, Bancher-Todesca D, Helmer H. Diabetes mellitus and the risk of preterm birth with regard to the risk of spontaneous preterm birth. J Matern Fetal Neonatal Med. 2010;23(9):1004-8.
230. Kjos SL, Henry OA, Montoro M, Buchanan TA, Mestman JH. Insulin-requiring diabetes in pregnancy: a randomized trial of active induction of labor and ex-pectant management. Am J Obstet Gynecol. 1993;169(3):611-5.
231. Logan KM, Gale C, Hyde MJ, Santhakumaran S, Modi N. Diabetes in pregnancy and infant adiposity: systematic review and meta-analysis. Arch Dis Child Fetal Neonatal Ed. 2017;102(1):F65-F72.
232. Kang H. The prevention and handling of the missing data. Korean J Anesthesiol. 2013;64(5):402-6.
233. Norwegian Institute of Public Health.“Revised PROTOCOL.” www.fhi.no/.../pdf/moba-protocol-revised-oct-2012.pdf (accessed Oct 2012).
101
Glycemic properties of maternal diet in relation to preterm delivery and abnormal birth weight
234. Cade J, Thompson R, Burley V, Warm D. Development, validation and utilisation of food-frequency questionnaires - a review. Public Health Nutr. 2002;5(4):567-87.
235. Holmberg L, Ohlander EM, Byers T, Zack M, Wolk A, Bruce A, et al. A search for recall bias in a case-control study of diet and breast cancer. Int J Epidemiol. 1996;25(2):235-44.
236. Kovesdy CP, Kalantar-Zadeh K. Observational studies versus randomized con-trolled trials: avenues to causal inference in nephrology. Adv Chronic Kidney Dis. 2012;19(1):11-8.
237. Mazaki-Tovi S, Romero R, Kusanovic JP, Erez O, Pineles BL, Gotsch F, et al. Recur-rent preterm birth. Semin Perinatol. 2007;31(3):142-58.
238. Joseph KS, Fahey J, Shankardass K, Allen VM, O’Campo P, Dodds L, et al. Effects of socioeconomic position and clinical risk factors on spontaneous and iatro-genic preterm birth. BMC Pregnancy Childbirth. 2014;14:117.
239. Morgen CS, Bjork C, Andersen PK, Mortensen LH, Nybo Andersen AM. Socio-economic position and the risk of preterm birth--a study within the Danish National Birth Cohort. Int J Epidemiol. 2008;37(5):1109-20.
240. Kyrklund-Blomberg NB, Granath F, Cnattingius S. Maternal smoking and causes of very preterm birth. Acta Obstet Gynecol Scand. 2005;84(6):572-7.
241. Foss OP HK, Hesla PE, Lund-Larsen PG, Vasli LR. Can we rely on self-reported smoking habits? Tidsskr Nor Laegeforen. 1998 May 30;118(14):2165-8.
242. England LJ, Grauman A, Qian C, Wilkins DG, Schisterman EF, Yu KF, et al. Mis-classification of maternal smoking status and its effects on an epidemiologic study of pregnancy outcomes. Nicotine Tob Res. 2007;9(10):1005-13.
243. Kvalvik LG, Nilsen RM, Skjaerven R, Vollset SE, Midttun O, Ueland PM, et al. Self-reported smoking status and plasma cotinine concentrations among preg-nant women in the Norwegian Mother and Child Cohort Study. Pediatr Res. 2012;72(1):101-7.
244. Parazzini F, Chatenoud L, Surace M, Tozzi L, Salerio B, Bettoni G, et al. Moderate alcohol drinking and risk of preterm birth. Eur J Clin Nutr. 2003;57(10):1345-9.
245. Willett WC, Howe GR, Kushi LH. Adjustment for total energy intake in epidemi-ologic studies. Am J Clin Nutr. 1997;65(4 Suppl):1220S-8S; discussion 9S-31S.
246. Bird AL, Grant CC, Bandara DK, Mohal J, Atatoa-Carr PE, Wise MR, et al. Ma-ternal health in pregnancy and associations with adverse birth outcomes: Evi-dence from Growing Up in New Zealand. Aust N Z J Obstet Gynaecol. 2016.

102
Linda Englund Ögge
247. Han Z, Lutsiv O, Mulla S, McDonald SD. Maternal height and the risk of preterm birth and low birth weight: a systematic review and meta-analyses. J Obstet Gynaecol Can. 2012;34(8):721-46.
248. Hill AB. The Environment and Disease: Association or Causation? Proceedings of the Royal Society of Medicine. 1965;58:295-300.
249. von Elm E, Altman DG, Egger M, Pocock SJ, Gotzsche PC, Vandenbroucke JP. The Strengthening the Reporting of Observational Studies in Epidemiology (STROBE) statement: guidelines for reporting observational studies. Lancet. 2007;370(9596):1453-7.
250. Lachat C, Hawwash D, Ocke MC, Berg C, Forsum E, Hornell A, et al. Strengthen-ing the Reporting of Observational Studies in Epidemiology-Nutritional Epi-demiology (STROBE-nut): An Extension of the STROBE Statement. PLoS medi-cine. 2016;13(6):e1002036.
251. Feise RJ. Do multiple outcome measures require p value adjustment? BMC Med Res Methodol. 2002;2:8.
252. Perneger TV. What’s wrong with Bonferroni adjustments. BMJ. 1998;316(7139):1236-8.
253. Wadhwa PD, Buss C, Entringer S, Swanson JM. Developmental origins of health and disease: brief history of the approach and current focus on epigenetic mechanisms. Semin Reprod Med. 2009;27(5):358-68.
254. Drewnowski A. Diet image: a new perspective on the food-frequency question-naire. Nutr Rev. 2001;59(11):370-2.
255. Satija A, Yu E, Willett WC, Hu FB. Understanding nutritional epidemiology and its role in policy. Adv Nutr. 2015;6(1):5-18.
256. Brantsaeter AL, Haugen M, Julshamn K, Alexander J, Meltzer HM. Evaluation of urinary iodine excretion as a biomarker for intake of milk and dairy products in pregnant women in the Norwegian Mother and Child Cohort Study (MoBa). Eur J Clin Nutr. 2009;63(3):347-54.
257. Brantsaeter AL, Haugen M, Rasmussen SE, Alexander J, Samuelsen SO, Meltzer HM. Urine flavonoids and plasma carotenoids in the validation of fruit, vegeta-ble and tea intake during pregnancy in the Norwegian Mother and Child Cohort Study (MoBa). Public Health Nutr. 2007;10(8):838-47.
258. Brantsaeter AL, Haugen M, Thomassen Y, Ellingsen DG, Ydersbond TA, Hagve TA, et al. Exploration of biomarkers for total fish intake in pregnant Norwegian women. Public Health Nutr. 2010;13(1):54-62.
259. Brantsaeter AL, Haugen M, Hagve TA, Aksnes L, Rasmussen SE, Julshamn K, et al. Self-reported dietary supplement use is confirmed by biological mark-

103
Glycemic properties of maternal diet in relation to preterm delivery and abnormal birth weight
ers in the Norwegian Mother and Child Cohort Study (MoBa). Ann Nutr Metab. 2007;51(2):146-54.
260. McCann SE, Marshall JR, Brasure JR, Graham S, Freudenheim JL. Analysis of pat-terns of food intake in nutritional epidemiology: food classification in principal components analysis and the subsequent impact on estimates for endometrial cancer. Public Health Nutr. 2001;4(5):989-97.
261. Varraso R, Garcia-Aymerich J, Monier F, Le Moual N, De Batlle J, Miranda G, et al. Assessment of dietary patterns in nutritional epidemiology: principal com-ponent analysis compared with confirmatory factor analysis. Am J Clin Nutr. 2012;96(5):1079-92.
262. Thorpe MG, Milte CM, Crawford D, McNaughton SA. A comparison of the di-etary patterns derived by principal component analysis and cluster analysis in older Australians. Int J Behav Nutr Phys Act. 2016;13:30.
263. Jepsen P, Johnsen SP, Gillman MW, Sorensen HT. Interpretation of observational studies. Heart. 2004;90(8):956-60.
264. Grimes DA. Epidemiologic research with administrative databases: red her-rings, false alarms and pseudo-epidemics. Hum Reprod. 2015;30(8):1749-52.
265. Freedman LS, Schatzkin A, Midthune D, Kipnis V. Dealing with dietary measure-ment error in nutritional cohort studies. J Natl Cancer Inst. 2011;103(14):1086-92.
266. Parr CL, Veierod MB, Laake P, Lund E, Hjartaker A. Test-retest reproducibility of a food frequency questionnaire (FFQ) and estimated effects on disease risk in the Norwegian Women and Cancer Study (NOWAC). Nutr J. 2006;5:4.
267. Heitmann BL, Lissner L. Can adverse effects of dietary fat intake be overes-timated as a consequence of dietary fat underreporting? Public Health Nutr. 2005;8(8):1322-7.
268. Poston L. Healthy eating in pregnancy. BMJ. 2014;348:g1739.269. Iams JD, Goldenberg RL, Mercer BM, Moawad A, Thom E, Meis PJ, et al. The
Preterm Prediction Study: recurrence risk of spontaneous preterm birth. Na-tional Institute of Child Health and Human Development Maternal-Fetal Medi-cine Units Network. Am J Obstet Gynecol. 1998;178(5):1035-40.
270. Petherick ES, Goran MI, Wright J. Relationship between artificially sweet-ened and sugar-sweetened cola beverage consumption during pregnancy and preterm delivery in a multi-ethnic cohort: analysis of the Born in Bradford co-hort study. Eur J Clin Nutr. 2014;68(3):404-7.

104
Linda Englund Ögge
271. Mendez MA, Kogevinas M. A comparative analysis of dietary intakes during pregnancy in Europe: a planned pooled analysis of birth cohort studies. Am J Clin Nutr. 2011;94(6 Suppl):1993S-9S.
272. Slimani N, Fahey M, Welch AA, Wirfalt E, Stripp C, Bergstrom E, et al. Diversity of dietary patterns observed in the European Prospective Investigation into Cancer and Nutrition (EPIC) project. Public Health Nutr. 2002;5(6B):1311-28.
273. Sommer C, Sletner L, Jenum AK, Morkrid K, Andersen LF, Birkeland KI, et al. Ethnic differences in maternal dietary patterns are largely explained by so-cio-economic score and integration score: a population-based study. Food Nutr Res. 2013;57.
274. Huseinovic E, Winkvist A, Slimani N, Park MK, Freisling H, Boeing H, et al. Meal patterns across ten European countries - results from the European Prospec-tive Investigation into Cancer and Nutrition (EPIC) calibration study. Public Health Nutr. 2016:1-12.
275. He JR, Xia HM, Liu Y, Xia XY, Mo WJ, Wang P, et al. A new birthweight reference in Guangzhou, southern China, and its comparison with the global reference. Arch Dis Child. 2014;99(12):1091-7.
276. Thompson JM, Wall C, Becroft DM, Robinson E, Wild CJ, Mitchell EA. Maternal dietary patterns in pregnancy and the association with small-for-gestation-al-age infants. Br J Nutr. 2010;103(11):1665-73.
277. Colon-Ramos U, Racette SB, Ganiban J, Nguyen TG, Kocak M, Carroll KN, et al. Association between dietary patterns during pregnancy and birth size mea-sures in a diverse population in Southern US. Nutrients. 2015;7(2):1318-32.
278. Johnston LB, Clark AJ, Savage MO. Genetic factors contributing to birth weight. Arch Dis Child Fetal Neonatal Ed. 2002;86(1):F2-3.
279. Dunger DB, Petry CJ, Ong KK. Genetics of size at birth. Diabetes Care. 2007;30 Suppl 2:S150-5.
280. Yu J, Zhou Y, Gui J, Li AZ, Su XL, Feng L. Assessment of the number and func-tion of macrophages in the placenta of gestational diabetes mellitus patients. J Huazhong Univ Sci Technolog Med Sci. 2013;33(5):725-9.
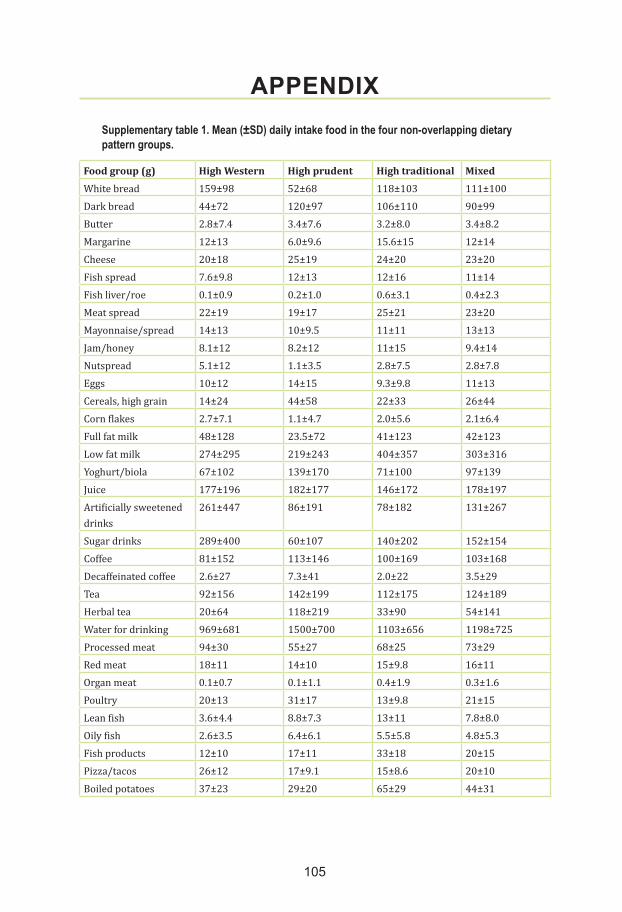
105
APPENDIXSupplementary table 1. Mean (±SD) daily intake food in the four non-overlapping dietary pattern groups.
Food group (g) High Western High prudent High traditional MixedWhite bread 159±98 52±68 118±103 111±100Dark bread 44±72 120±97 106±110 90±99Butter 2.8±7.4 3.4±7.6 3.2±8.0 3.4±8.2Margarine 12±13 6.0±9.6 15.6±15 12±14Cheese 20±18 25±19 24±20 23±20Fish spread 7.6±9.8 12±13 12±16 11±14Fish liver/roe 0.1±0.9 0.2±1.0 0.6±3.1 0.4±2.3Meat spread 22±19 19±17 25±21 23±20Mayonnaise/spread 14±13 10±9.5 11±11 13±13Jam/honey 8.1±12 8.2±12 11±15 9.4±14Nutspread 5.1±12 1.1±3.5 2.8±7.5 2.8±7.8Eggs 10±12 14±15 9.3±9.8 11±13Cereals, high grain 14±24 44±58 22±33 26±44Corn flakes 2.7±7.1 1.1±4.7 2.0±5.6 2.1±6.4Full fat milk 48±128 23.5±72 41±123 42±123Low fat milk 274±295 219±243 404±357 303±316Yoghurt/biola 67±102 139±170 71±100 97±139Juice 177±196 182±177 146±172 178±197Artificially sweetened drinks
261±447 86±191 78±182 131±267
Sugar drinks 289±400 60±107 140±202 152±154Coffee 81±152 113±146 100±169 103±168Decaffeinated coffee 2.6±27 7.3±41 2.0±22 3.5±29Tea 92±156 142±199 112±175 124±189Herbal tea 20±64 118±219 33±90 54±141Water for drinking 969±681 1500±700 1103±656 1198±725Processed meat 94±30 55±27 68±25 73±29Red meat 18±11 14±10 15±9.8 16±11Organ meat 0.1±0.7 0.1±1.1 0.4±1.9 0.3±1.6Poultry 20±13 31±17 13±9.8 21±15Lean fish 3.6±4.4 8.8±7.3 13±11 7.8±8.0Oily fish 2.6±3.5 6.4±6.1 5.5±5.8 4.8±5.3Fish products 12±10 17±11 33±18 20±15Pizza/tacos 26±12 17±9.1 15±8.6 20±10Boiled potatoes 37±23 29±20 65±29 44±31

106
Linda Englund Ögge
French fries 12±10 5.1±4.9 6.1±5.1 7.9±8.2Rice 26±22 36.4±29 18±12 27±24Pasta/spaghetti 26±20 24±18 16±11 22±18Ketchup 2.5±2.7 1.1±1.2 1.3±1.3 1.6±1.9Olive oil 0.6±0.8 1.4±1.1 0.5±0.7 0.8±0.9Cooking oil 0.9±1.5 4.2±5.4 0.7±1.1 1.7±3.1Raw vegetables other than leafy greens
16±16 41±32 18±17 26±28
Green leafy vegetables 56±43 104±59 53±40 72±55Cooked vegetables 34±23 62±40 45±29 50±43Onion/leek/garlic 7.5±7.3 15±12 5.6±5.4 9.5±10Mushroom 3.0±3.6 6.1±6.7 2.3±2.4 4.0±5.7Gravy 15±11 8.3±6.9 18±14 15±14Fruit/berries 223±163 351±206 241±161 285±215Dried fruits 1.3±3.2 6.7±13 2.1±5.1 3.2±2.5Nuts 1.4±2.8 5.3±12 1.2±2.5 2.3±6.0Milk desserts 24±22 18±15 15±12 21±21Waffles/pancakes 12±9.2 8.3±6.6 11±7.6 11±10Buns 7.4±11 4.9±5.6 4.2±4.8 5.9±8.6Cakes 9.9±8.3 7.2±5.9 6.9±5.5 8.9±9.8Chocolate sweets 67±52 37±27 32±24 45±39Salty snacks 20±16 11±8.6 11±7.8 14±14Rice pudding 6.5±7.6 4.5±6.7 12±11 7.5±8.5Crisp bread 11±16 16±19 13±18 15±19Sweet biscuits 4.0±8.0 2.6±4.6 2.1±3.5 3.3±6.9