glutathione primes t cell metabolism for inflammation primes t cell metabolism for ... primer that...
TRANSCRIPT
Immunity, Volume 46
Supplemental Information
Glutathione Primes
T Cell Metabolism for Inflammation
Tak W. Mak, Melanie Grusdat, Gordon S. Duncan, Catherine Dostert, YannicNonnenmacher, Maureen Cox, Carole Binsfeld, Zhenyue Hao, Anne Brüstle, MomoeItsumi, Christian Jäger, Ying Chen, Olaf Pinkenburg, Bärbel Camara, MarkusOllert, Carsten Bindslev-Jensen, Vasilis Vasiliou, Chiara Gorrini, Philipp A.Lang, Michael Lohoff, Isaac S. Harris, Karsten Hiller, and Dirk Brenner

1
Supplemental Information
Supplemental Experimental Procedures
Immunoblotting
Immunoblotting was performed as described previously (Brenner et al., 2009). Antibodies
used were as follows: anti-pp38 (Cell Signaling), anti-pERK (Cell Signaling), anti-pJNK
(Santa Cruz), anti-pAKT (Cell Signaling), anti-pGSK3β (Cell Signaling), anti-GSK3β (Cell
Signaling), anti-Gclc (Santa Cruz), anti-actin (Sigma-Aldrich), anti-NFATc1 (Santa Cruz),
anti-IκBα (Santa Cruz), anti-PKM2 (Cell Signaling), and anti-MYC (Santa Cruz).
Cloning and retroviral transduction
The gene encoding murine full length c-Myc was cloned from plasmid pHCMV-Myc-wt
(Herold et al., 2002), kindly provided by S. Herold (University of Würzburg, Germany). This
cDNA was digested with BamHI (5‘ and 3‘) and cloned into the BglII-digested and
dephosphorylated pMIG vector. 293T/17 cells were transfected with pEco, pCGP and
pMIG or pMIG-cMyc plasmids using calcium phosphate precipitation. Viral supernatants
were collected at 24h and 48h post-transfection.
For retroviral transduction, purified naı̈ve CD4+T cells were plated for 19h on culture
plates that were coated with anti-CD3 Abs. Fresh retroviral supernatants were added and
the cells were centrifuged at 2700 rpm for 1.5h at 37oC. After spin infection, the cells were
re-cultured in the stored culture medium. After 24h, T cells were sorted by flow cytometry
on the basis of coexpressed GFP and used for experiments
Quantitative RT-PCR
RNA was isolated from cell pellets using RNAeasy (Qiagen). cDNA was prepared using a
iScript cDNA synthesis kit (Bio-Rad), and RT-PCR was carried out using Sybrgreen Master
Mix (ABI) and the primers listed in Supplemental Table 1. Reactions were run on an ABI
7500HT Fast qRT-PCR instrument. Data were normalized to GAPDH transcription and
analyzed using the ∆∆Ct method.
2
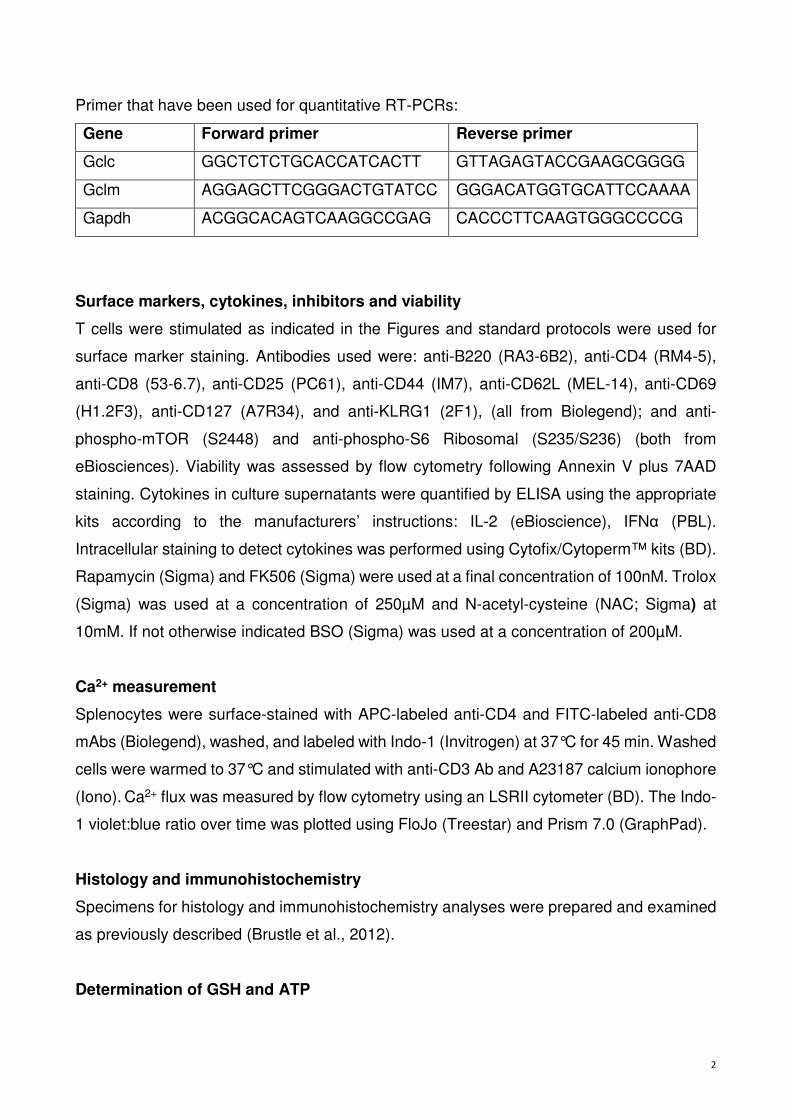
Primer that have been used for quantitative RT-PCRs:
Gene Forward primer Reverse primer
Gclc GGCTCTCTGCACCATCACTT GTTAGAGTACCGAAGCGGGG
Gclm AGGAGCTTCGGGACTGTATCC GGGACATGGTGCATTCCAAAA
Gapdh ACGGCACAGTCAAGGCCGAG CACCCTTCAAGTGGGCCCCG
Surface markers, cytokines, inhibitors and viability
T cells were stimulated as indicated in the Figures and standard protocols were used for
surface marker staining. Antibodies used were: anti-B220 (RA3-6B2), anti-CD4 (RM4-5),
anti-CD8 (53-6.7), anti-CD25 (PC61), anti-CD44 (IM7), anti-CD62L (MEL-14), anti-CD69
(H1.2F3), anti-CD127 (A7R34), and anti-KLRG1 (2F1), (all from Biolegend); and anti-
phospho-mTOR (S2448) and anti-phospho-S6 Ribosomal (S235/S236) (both from
eBiosciences). Viability was assessed by flow cytometry following Annexin V plus 7AAD
staining. Cytokines in culture supernatants were quantified by ELISA using the appropriate
kits according to the manufacturers’ instructions: IL-2 (eBioscience), IFNα (PBL).
Intracellular staining to detect cytokines was performed using Cytofix/Cytoperm™ kits (BD).
Rapamycin (Sigma) and FK506 (Sigma) were used at a final concentration of 100nM. Trolox
(Sigma) was used at a concentration of 250µM and N-acetyl-cysteine (NAC; Sigma) at
10mM. If not otherwise indicated BSO (Sigma) was used at a concentration of 200µM.
Ca2+ measurement
Splenocytes were surface-stained with APC-labeled anti-CD4 and FITC-labeled anti-CD8
mAbs (Biolegend), washed, and labeled with Indo-1 (Invitrogen) at 37°C for 45 min. Washed
cells were warmed to 37°C and stimulated with anti-CD3 Ab and A23187 calcium ionophore
(Iono). Ca2+ flux was measured by flow cytometry using an LSRII cytometer (BD). The Indo-
1 violet:blue ratio over time was plotted using FloJo (Treestar) and Prism 7.0 (GraphPad).
Histology and immunohistochemistry
Specimens for histology and immunohistochemistry analyses were prepared and examined
as previously described (Brustle et al., 2012).
Determination of GSH and ATP
3
T cells were stimulated as indicated and 2x10⁵ T cells/well were measured using the GSH-
Glo™ assay (Promega) for GSH or the CellTiter-Glo assay (Promega) for ATP (Verbist et
al., 2016) according to the manufacturer's protocol.
Alternatively GSH was measured by LC-MS as described below.
LC-MS measurement
Relative quantification of GSH was performed using an Agilent 1290 Series LC coupled to
an Agilent 6550 Q-TOF MS system equipped with a Dual Agilent Jet Stream ESI source.
Column used: Waters ACQUITY UPLC HSS T3 1.8 µm; Length, I.D., Particle Size: 100
mm x 2.1 mm x 1.8 µm; maintained at 45°C. The autosampler was kept at 4 °C and the
injection volume was 1 µL. The flow rate was set to 0.25 mL/min and the mobile phases
consisted of 0.1% formic acid in water (Eluent A) and 0.1% formic acid in methanol (Eluent
B). The run consisted of an isocratic delivery of 1% Eluent B over 5 min, followed by a
linear gradient to 95% Eluent B over 1 min, isocratic delivery of 95% Eluent B for 4 min,
and a re-equilibration phase on starting conditions with 1% Eluent B for 5 min.
MS experiments were performed using electrospray ionization in positive mode (+ESI)
with a capillary voltage of 3.5 kV. The protonated molecules of GSH were monitored in
high resolution mode (slicer position: 5) and Extended Dynamic Range (2GHz) with the
following Q-TOF MS conditions: drying gas temperature: 225°C, drying gas flow: 14 L/min
(nitrogen), nebulizer: 35 psig, sheath gas temperature: 350°C, sheath gas flow: 11 L/min,
fragmentor: 400 V, Oct RF Vpp: 750 V. Full scan spectra were acquired from m/z 100 to
1000 (2 spectra/sec). External mass calibration was performed before measurement of
each set of samples. All data were acquired with Agilent Mass Hunter LC/MS Data
Acquisition (ver B.06.01) and analyzed with Agilent Mass Hunter Qualitative Analysis (ver
B.07.00). The peak area of intracellular GSH (m/z 308.0911, protonated) was divided by
the peak area of the internal standard (m/z 311.0948, protonated) and normalized to the
corresponding cell number multiplied by 1 million.
Cell transfer experiments for LCMV infections
P14-Gclcfl/fl and P14-CD4Cre-Gclcfl/fl CD8+ T cells were purified from spleen and lymph
nodes utilizing the Dynabeads FlowComp Mouse CD8+ kit (Invitrogen). Following CD8+ T
cell isolation, control T cells were labeled with 2.5µM CellTracker Green (Molecular
Probes) for 9 minutes at 37 degrees Celsius. Gclc-deficient T cells were labeled with
4
2.5µM CellTrace Violet (Molecular Probes) for 9 minutes at 37 degrees Celsius. Following
labeling, cells were counted and mixed at a 1:1 ratio and injected intraperitoneally (i.p.)
into recipient CD45.1 animals so that each recipient received 1.6x10⁶ P14-specific Tcells
of each genotype. The following day, recipient mice were infected with 2x10⁵ plaque
forming units of LCMV-Armstrong i.p. Recipient mice were sacrificed 36 and 60 hours
post-infection. Donor P14 T cells were identified based on CD45.2 staining, and genotype
of the transferred T cells were discriminated based on CellTracker Green or CellTrace
Violet staining, respectively.
Supplemental Figure Legends
Supplemental Figure 1, related to Figure 1: Ablation of Gclc does not influence
thymocyte development.
(A) Colorimetric determination of GSH concentrations in WT CD4+ T cells isolated and
pooled from spleen plus lymph nodes (LN) and stimulated in vitro for 24h with the indicated
concentrations of anti-CD3/28 Abs, with or without the GCL inhibitor BSO. Data are derived
from kinetic measurements and are representative of 6 independent experiments. (B)
Immunoblot to detect GCLC protein in Gclcfl/fl and CD4Cre-Gclcfl/fl T cells that were activated
in vitro with 3µg/mL anti-CD3/28 for the indicated times. Actin, loading control. Data are
representative of 2 independent experiments. (C, D) Gclcfl/fl and CD4Cre-Gclcfl/fl mice were
injected i.p. with 150 µg/mouse SEB. After 48h, Vβ8+ CD4+ and CD8+ T cells were sorted
by flow cytometry, and GSH (C) and ROS levels (D) were determined as described in
Experimental Procedures. Data are the mean ± SEM (n=3) and representative of 2
independent experiments. (E) Flow cytometric determinations of thymocyte subsets in thymi
isolated from 6-week-old Gclcfl/fl and CD4Cre-Gclcfl/fl mice. Double negative (DN)
thymocytes were gated after exclusion of Lineage-positive cells
(CD4+/CD8+/CD11b+/CD11c+/Gr-1+/NK1.1+/B220+/TER119+). DN1: CD44+CD25-; DN2:
CD44+CD25+; DN3: CD44-CD25+; DN4: CD44- CD25-, Double positive (DP): CD4+CD8+.
Data are the mean ± SEM (n=6) and representative of 2 experiments. (F) Flow cytometric
analysis of lymphoid cell subsets that were harvested from peripheral blood of Gclcfl/fl and
CD4Cre-Gclcfl/fl mice. Data are the mean ± SEM (n=4) and representative of 3 experiments.
*p<0.05.

5
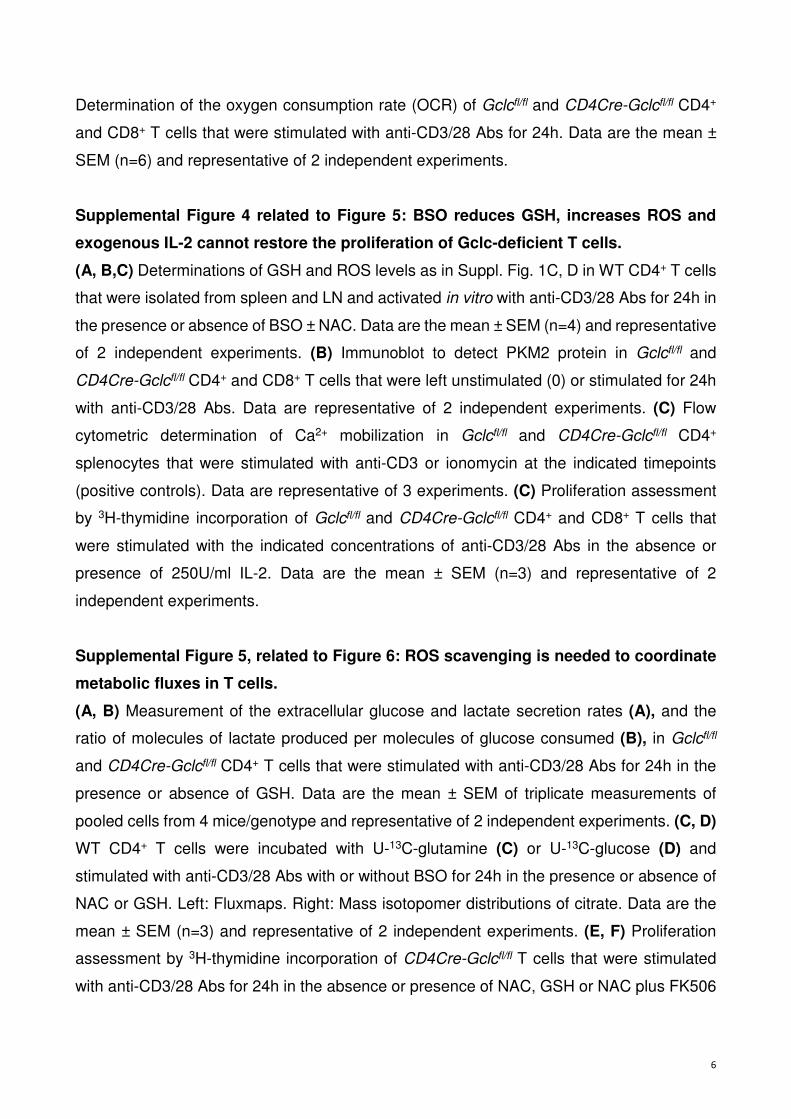
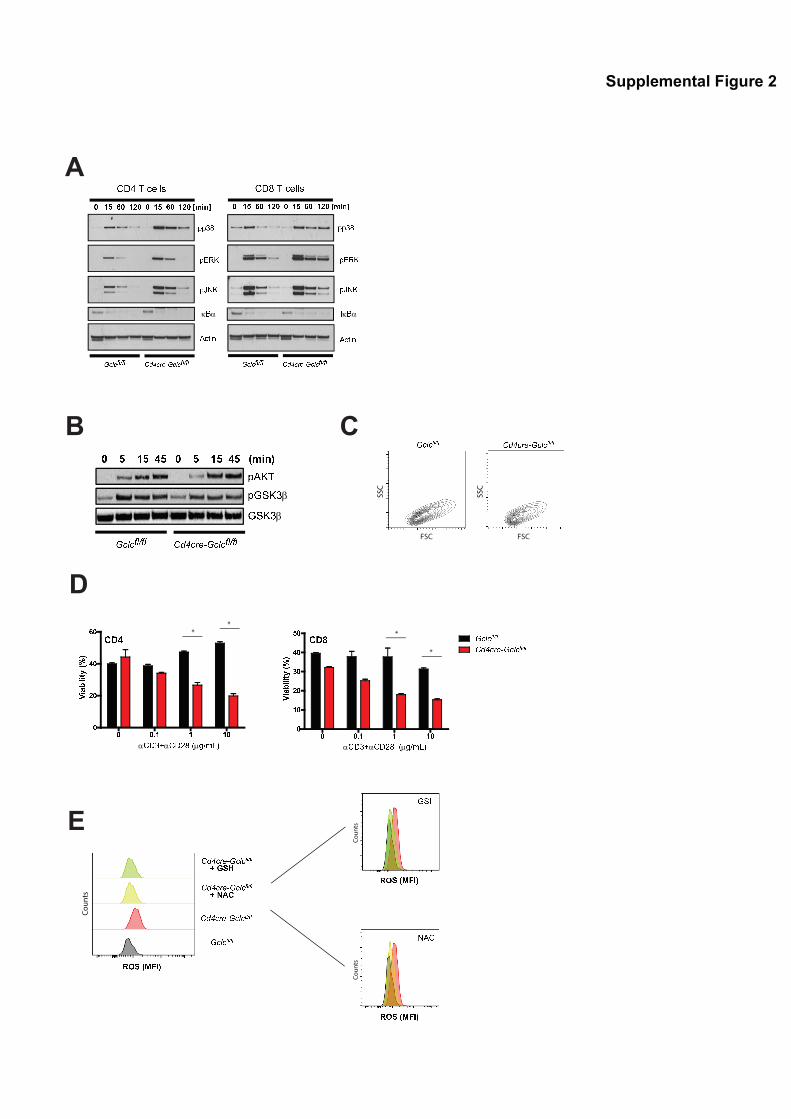
Supplemental Figure 2, related to Figure 1: Effects of Gclc deficiency on T cell
signaling and ROS levels.
(A) Immunoblots to detect the indicated proteins in CD4+ and CD8+ T cells that were isolated
from Gclcfl/fl or CD4Cre-Gclcfl/fl spleen plus LN and stimulated with PMA/Iono for the
indicated times. Data are representative of 3 independent experiments. (B) Immunoblot to
detect the indicated phosphorylated proteins in CD4+ T cells that were isolated from spleen
plus LN of Gclcfl/fl or CD4Cre-Gclcfl/fl mice and stimulated with PMA/Iono for the indicated
times. GSKβ, loading control. Data are representative of 3 experiments. (C) Flow cytometric
FSC/SSC measurement of the cells in Fig.1F. Data are representative of 2 trials. (D) Flow
cytometric determination of % viability of Gclcfl/fl and CD4Cre-Gclcfl/fl T cells that were
stimulated with the indicated concentrations of anti-CD3/28 Abs for 48hr and stained with
7AAD/AnnexinV. Data are the mean ± SEM (n=3) and representative of 6 independent
experiments. (E) Flow cytometric determination of DCF-DA staining of Gclcfl/fl and CD4Cre-
Gclcfl/fl CD4+ T cells that were stimulated with anti-CD3/28 for 24h and co-incubated with or
without NAC or GSH, as indicated. Data are representative of 4 independent experiments.
Supplemental Figure 3, related to Figure 3: Gclc deficiency alters T cell metabolism.
(A) Schematic illustration of a glutamine fluxmap and U-13C-glutamine isotopomer
distribution through progressive TCA cycling. (B) Mathematical determination of the M2/M4
citrate isotopologues ratio in activated Gclcfl/fl and CD4Cre-Gclcfl/fl CD4+ T cells. Data are
the mean ± SEM and representative of 3 independent experiments. ***p<0.001. (C) Flow
cytometric measurement of % viability of Gclcfl/fl and CD4Cre-Gclcfl/fl CD4+ T cells that were
left unstimulated (non-stim.) or stimulated with 10µg/mL anti-CD3/28 Abs or PMA/Iono for
24h and stained with 7AAD/ AnnexinV. Data are the mean ± SEM of triplicate measurements
and representative of 3 independent experiments. (D) Proliferation assessment by 3H-
thymidine incorporation of Gclcfl/fl and CD4Cre-Gclcfl/fl CD4+ T cells that were stimulated with
anti-CD3/28 Abs and supplemented with the indicated concentrations of glutamine for 48h.
Data are the mean ± SEM (n=3) and representative of 3 independent experiments. (E)
Proliferation assessment as in (C) of Gclcfl/fl and CD4Cre-Gclcfl/fl CD4+ and CD8+ T cells that
were stimulated with anti-CD3/28 Abs and supplemented with the indicated concentrations
of dimethyl-α-ketoglutarate (DMK) for 24h. Data are the mean ± SEM (n=3) and
representative of 3 independent experiments. (F) Schematic illustration of a glucose fluxmap
and U-13C-glucose isotopomer distribution through progressive TCA cycling. (G)
6
Determination of the oxygen consumption rate (OCR) of Gclcfl/fl and CD4Cre-Gclcfl/fl CD4+
and CD8+ T cells that were stimulated with anti-CD3/28 Abs for 24h. Data are the mean ±
SEM (n=6) and representative of 2 independent experiments.
Supplemental Figure 4 related to Figure 5: BSO reduces GSH, increases ROS and
exogenous IL-2 cannot restore the proliferation of Gclc-deficient T cells.
(A, B,C) Determinations of GSH and ROS levels as in Suppl. Fig. 1C, D in WT CD4+ T cells
that were isolated from spleen and LN and activated in vitro with anti-CD3/28 Abs for 24h in
the presence or absence of BSO ± NAC. Data are the mean ± SEM (n=4) and representative
of 2 independent experiments. (B) Immunoblot to detect PKM2 protein in Gclcfl/fl and
CD4Cre-Gclcfl/fl CD4+ and CD8+ T cells that were left unstimulated (0) or stimulated for 24h
with anti-CD3/28 Abs. Data are representative of 2 independent experiments. (C) Flow
cytometric determination of Ca2+ mobilization in Gclcfl/fl and CD4Cre-Gclcfl/fl CD4+
splenocytes that were stimulated with anti-CD3 or ionomycin at the indicated timepoints
(positive controls). Data are representative of 3 experiments. (C) Proliferation assessment
by 3H-thymidine incorporation of Gclcfl/fl and CD4Cre-Gclcfl/fl CD4+ and CD8+ T cells that
were stimulated with the indicated concentrations of anti-CD3/28 Abs in the absence or
presence of 250U/ml IL-2. Data are the mean ± SEM (n=3) and representative of 2
independent experiments.
Supplemental Figure 5, related to Figure 6: ROS scavenging is needed to coordinate
metabolic fluxes in T cells.
(A, B) Measurement of the extracellular glucose and lactate secretion rates (A), and the
ratio of molecules of lactate produced per molecules of glucose consumed (B), in Gclcfl/fl
and CD4Cre-Gclcfl/fl CD4+ T cells that were stimulated with anti-CD3/28 Abs for 24h in the
presence or absence of GSH. Data are the mean ± SEM of triplicate measurements of
pooled cells from 4 mice/genotype and representative of 2 independent experiments. (C, D)
WT CD4+ T cells were incubated with U-13C-glutamine (C) or U-13C-glucose (D) and
stimulated with anti-CD3/28 Abs with or without BSO for 24h in the presence or absence of
NAC or GSH. Left: Fluxmaps. Right: Mass isotopomer distributions of citrate. Data are the
mean ± SEM (n=3) and representative of 2 independent experiments. (E, F) Proliferation
assessment by 3H-thymidine incorporation of CD4Cre-Gclcfl/fl T cells that were stimulated
with anti-CD3/28 Abs for 24h in the absence or presence of NAC, GSH or NAC plus FK506
7
(E) or NAC plus rapamycin (Rap.) (F). Data are the mean ± SEM (n=3) and representative
of 2 independent experiments.
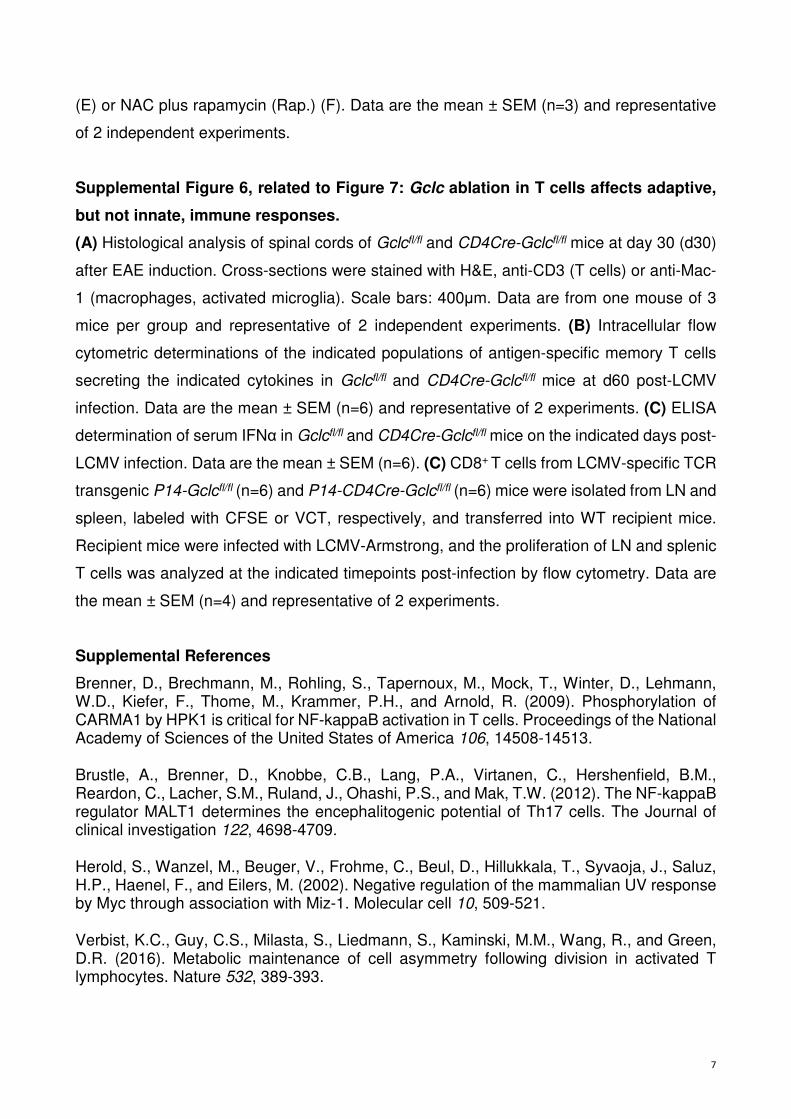
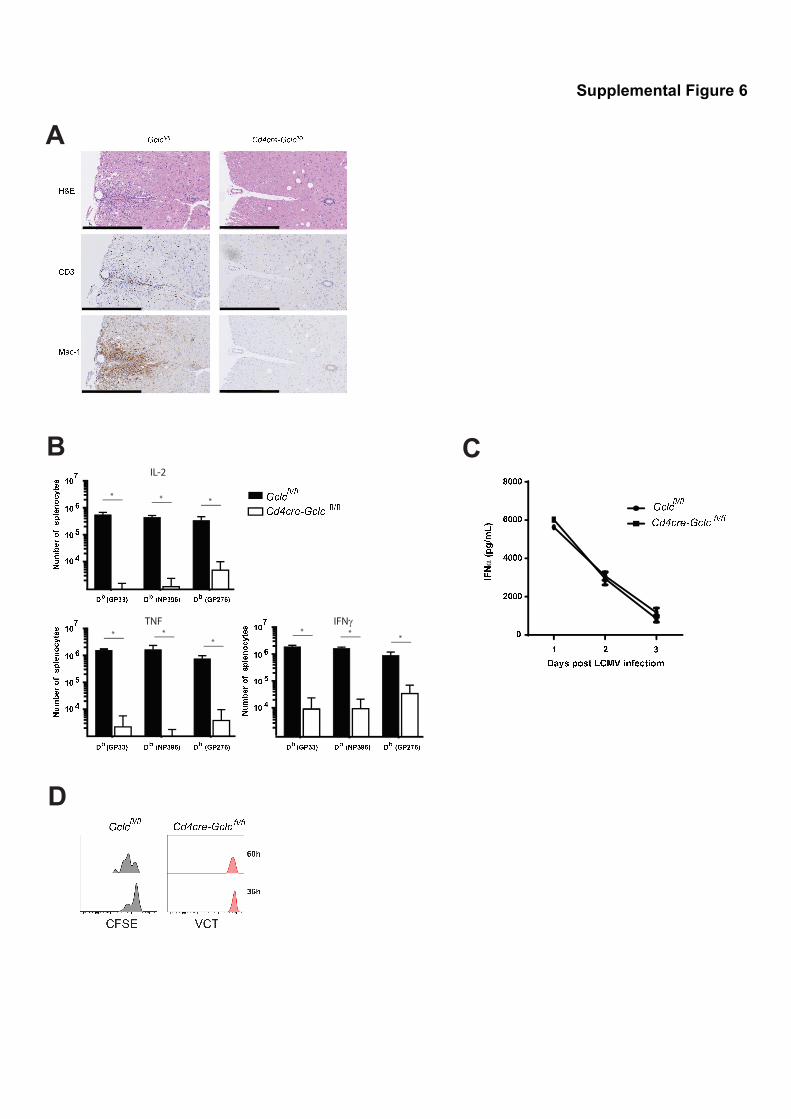
Supplemental Figure 6, related to Figure 7: Gclc ablation in T cells affects adaptive,
but not innate, immune responses.
(A) Histological analysis of spinal cords of Gclcfl/fl and CD4Cre-Gclcfl/fl mice at day 30 (d30)
after EAE induction. Cross-sections were stained with H&E, anti-CD3 (T cells) or anti-Mac-
1 (macrophages, activated microglia). Scale bars: 400µm. Data are from one mouse of 3
mice per group and representative of 2 independent experiments. (B) Intracellular flow
cytometric determinations of the indicated populations of antigen-specific memory T cells
secreting the indicated cytokines in Gclcfl/fl and CD4Cre-Gclcfl/fl mice at d60 post-LCMV
infection. Data are the mean ± SEM (n=6) and representative of 2 experiments. (C) ELISA
determination of serum IFNα in Gclcfl/fl and CD4Cre-Gclcfl/fl mice on the indicated days post-
LCMV infection. Data are the mean ± SEM (n=6). (C) CD8+ T cells from LCMV-specific TCR
transgenic P14-Gclcfl/fl (n=6) and P14-CD4Cre-Gclcfl/fl (n=6) mice were isolated from LN and
spleen, labeled with CFSE or VCT, respectively, and transferred into WT recipient mice.
Recipient mice were infected with LCMV-Armstrong, and the proliferation of LN and splenic
T cells was analyzed at the indicated timepoints post-infection by flow cytometry. Data are
the mean ± SEM (n=4) and representative of 2 experiments.
Supplemental References
Brenner, D., Brechmann, M., Rohling, S., Tapernoux, M., Mock, T., Winter, D., Lehmann, W.D., Kiefer, F., Thome, M., Krammer, P.H., and Arnold, R. (2009). Phosphorylation of CARMA1 by HPK1 is critical for NF-kappaB activation in T cells. Proceedings of the National Academy of Sciences of the United States of America 106, 14508-14513. Brustle, A., Brenner, D., Knobbe, C.B., Lang, P.A., Virtanen, C., Hershenfield, B.M., Reardon, C., Lacher, S.M., Ruland, J., Ohashi, P.S., and Mak, T.W. (2012). The NF-kappaB regulator MALT1 determines the encephalitogenic potential of Th17 cells. The Journal of clinical investigation 122, 4698-4709. Herold, S., Wanzel, M., Beuger, V., Frohme, C., Beul, D., Hillukkala, T., Syvaoja, J., Saluz, H.P., Haenel, F., and Eilers, M. (2002). Negative regulation of the mammalian UV response by Myc through association with Miz-1. Molecular cell 10, 509-521. Verbist, K.C., Guy, C.S., Milasta, S., Liedmann, S., Kaminski, M.M., Wang, R., and Green, D.R. (2016). Metabolic maintenance of cell asymmetry following division in activated T lymphocytes. Nature 532, 389-393.

� � � � � � � � � � � � ��� �� � �α
� �α
� � �µ
� � � � ����� µ
��
� ����� ��!"# $%�&$" '( )* )+ ), )- ). / +. / 0. / *. / 1
2 3 4 5 6 2 3 4 5 6 7 8 9: ; < ;= > ? @ AB C D C E F G C H I J B C D C K L M K LK L M K L
N O P Q R S P T U V T W X U � ��"# $%�&$" '()* )+ ), )1 ) )- )
Y . -Y . +. /. Z N O P Q R S P T U V T W X U
[\ [] [^ [_ `a bcd ef bcghih jjkl mnef jomp bqrst
u v w x x y z v w x x y { | }z v w x x y { | ~z v w x x y*
*
*� �
��� ����� �� � � �� � � �� � � �� � � �� � � � �� � � � ��β
� � � � � �β
� � � � �� � � � � � � � � � � � � � � � � � � � � � � � � � � � � � � �� � � � � � � � �� � � � � � � � ��β
� � � � � �β
� � � � ��� � � �� � � �� � � ��� ¡¢� £¡¤¥ ¦ § ¨ © ª « ¬
�β
� � � � �¥ ¦ § ¨ © ª « ¬
�β
� � � � � ®̄°± ² *
*
*
³ ´ µ ´ ¶ · ¸ ¶ ·¹ º » ´ ¼ ½ ¾ ³ ´ µ ´ ¶ · ¸ ¶ ·
³ ´ µ ´ ¶ · ¸ ¶ ·¹ º » ´ ¼ ½ ¾ ³ ´ µ ´ ¶ · ¸ ¶ ·
� � � �� � � �� � � �� � � � � � � � � � �� � � � � � � � � � � � � � � � � � � � � � � � � � � � � � � � � � � � � � � � � � � � � � � � � � � � � �� � � �� � � �� � � ! " ! # " $ # " % & ' ! ( ) * ! " ! # " $ # " ! " ! # " $ # " % & ' ! ( ) * ! " ! # " $ # "+
κ,α
+κ
,α
- . / . 0 . - . / . 0 . 1 2 3 4 56 7 8 7 9 8 : 9 8 ; < = 7 > ? @ 6 7 8 7 9 8 : 9 8 A B C DA E F C G
βE F C Gβ
H H I J J J HHJ HK HL HM HN HOP QRPSP T UVWXH H I J J J HHK HM HY HOP QRPSP T UVWX Z [ \ [ ] ^ _ ] ^` a b [ c d e Z [ \ [ ] ^ _ ] ^f g h f g iα
j k l mα
j k n o pµ
q r s t uα
j k l mα
j k n o pµ
q r s t u*
*
*
*
v w x y z { | } Z [ \ [ ] ^ _ ] ^` a b [ c d e Z [ \ [ ] ^ _ ] ^` a b [ c d e Z [ \ [ ] ^ _ ] ^~ � � �` a b [ c d e Z [ \ [ ] ^ _ ] ^~ � � � v w x y z { | } � � �
v w x y z { | } � � �
FSC FSC
SSC
SSC
Z [ \ [ ] ^ _ ] ^ ` a b [ c d e Z [ \ [ ] ^ _ ] ^
Counts
Counts
Counts

� � � � � � � � � � � � � � � � � � � � � � ��� � � � � � � � � � � � � � ���� � � � � � �� � � � � �� � � � � � � � � � � �� � �� � � � � � � � �� ! � " # $ � � � � � � � � �*
*
*
% & ' & ( ) * ( * + , - . / 0 1 2 3 , 4 % 5�� �6 �7 �89 :;9<9 = >?@A
αB C D E
αB C F GH I H J K L M N O P Q R S T I H I
� � � � � � � � �� ! � " # $ � � � � � � � � �
* U & V * & U V * & * U V + , - . W - X� � � � � � � � �� ! � " # $ � � � � � � � � ��� � � � � � � � � � � � � � ���� Y W Z
* U & V * & U V * & * U V + , - . W - X�� � � � � � � � � � � � � � ���� Y W [**
*
**
****
****
\ ] � ] ^ _ ` ^ _ a b c d e f g h d � d i j k i j a b c d e f gl m n l m oh d � d i j k i j\ ] � ] ^ _ ` ^ _� � �� � �� � �6 � �� � �pqr? ��s<t �9 uA **
**

α� � � � � � � � � � � � � � � � � � �
α� � �
� � ��� � � � � � � �
� � � � � � � � � � � � � � � ! "# $ % # $� � � � # $ % # $� � � � � � ! "# $ % # $� � � � � � � � � � � # $ % # $��� � � & � � � �
' ' ( ) ( ) ( ) ( ) * + , -. / 0 12343 56756 89:;< =>;?; @AB@AC D E F G H I I J C D K F G H I I J2343 56756 89:;L< =>;?; @AB@A 2343 56756 89:;L< =>;?; @AB@A M G N O P
� � � � � &
QR Q Q Q Q QS Q Q Q Q QT Q Q Q Q QU Q Q Q Q QV W X Y Z W [ \ ] ^_̀abcdef g h i j k l m n op o oq o o oq p o or o o or p o o s t u
� v � wxyz{x |z} ~ � �� ���� � s t u~ � �
� � � � # $ % # $� � � � � � � � � � � # $ % # $ � v � oq o o or o o o� o o owxyz{x |z} s t u~ � �~ � � � � � �
*
*
*
**
**
*
α� � � �
α� � " � �
µ� � � �
α� � � �
α� � " � �
µ� � � �
α� � � �
α� � " � �
µ� � � �
α� � � �
α� � " � �
µ� � � �

� �� � � � � �� � � � � � � � � �� � � � � � � �
� �� � � � � �� � � � � � � � � �� � � � � � � �
� � ��� ����� �� ����� � � � � � � � ! " # $ %� � � � & ! " # $ %'( ' ' ') ' ' '* ' ' '+ ' ' '
, & -. / 0 / 1 2 3 1 24 5 6 / 7 8 9 . / 0 / 1 2 3 1 2 : � � � � � � � � � � � & ; < = >, & -
. / 0 / 1 2 3 1 24 5 6 / 7 8 9 . / 0 / 1 2 3 1 2� � ��� ����� �� ���� ( ' ' ') ' ' '* ' ' '+ ' ' '*
*
*
*
*
*
*
*
*
*
? @ A B C D E F B G B H G I H GF B G B H G I H G? @ A B C D E F B G B H G I H G J K L M? @ A B C D E F B G B H G I H GF B G B H G I H G? @ A B C D E F B G B H G I H G J K L M
�� � � �� � � � � � � � � � � � � � � �
� � �� � � �� � � �� � � ���� α
� ��� ���� �
� � �� � � � !� � "# $%& '()* +,- '.)/01 '+� � �� � � � !� � "# $%& '()* +,- '.)/01 '+� � �� � � � !� � "# $%& '()* +,- '.)/01 '+
2 3 4 5 6 7 7 8 2 3 4 9 6 7 : ; 8 2 3 4 5 6 < = ; 82 3 4 5 6 7 7 8 2 3 4 9 6 7 : ; 8 2 3 4 5 6 < = ; 82 3 4 5 6 7 7 8 2 3 4 9 6 7 : ; 8 2 3 4 5 6 < = ; 8
IL-2
TNF IFNγ
> ? @ ?A B C ? D E F > ? @ ? G H I G HJ K L J KM N O P Q R P S T U V W X Y Z [ \ S X R ]
* * *
*
** * **
^ _ ` _ a b c a b d e f _ g h i ^ _ ` _ a b c a bj k lm n op q r s t
u � v� � v> ? @ ? A B C ? D E F > ? @ ? J K L J KJ K L J Kw x y z { w |