gluecon monitoring microservices and containers: a challenge
TRANSCRIPT

Monitoring Microservices & Containers: A Challenge
Adrian Cockcroft @adrianco Technology Fellow - Battery Ventures
May 2015

Monitoring !
Update of my monitoring rules from Monitorama 2014

Rule #1: Spend more time working on code that analyzes the meaning of metrics, than
code that collects, moves, stores and displays metrics.

Rule #2: Metric to display latency needs to be less than human attention span (~10s)

Rule #3: Validate that your measurement system has enough accuracy and precision.
Collect histograms of response time.
Rule #4: Monitoring systems need to be more available and scalable than the
systems being monitored.
Rule #5: Optimize for distributed, ephemeral, cloud native, containerized
microservices.

Rule #6: Fit metrics to models to understand relationships. (New rule)
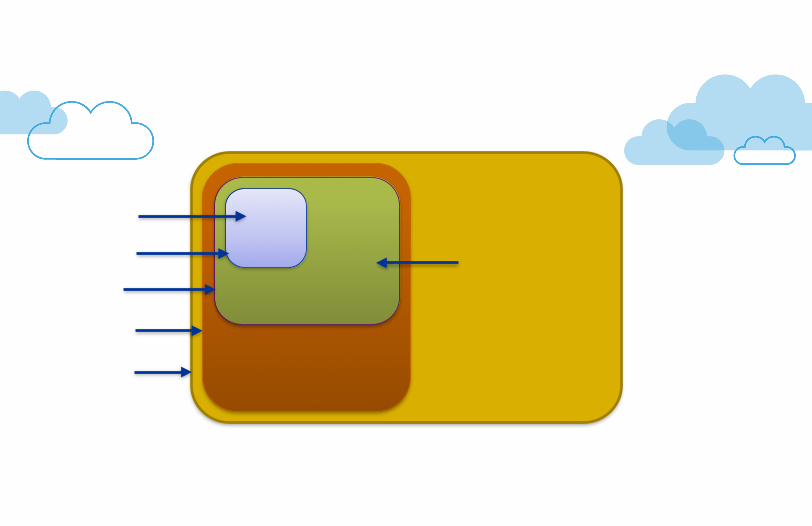
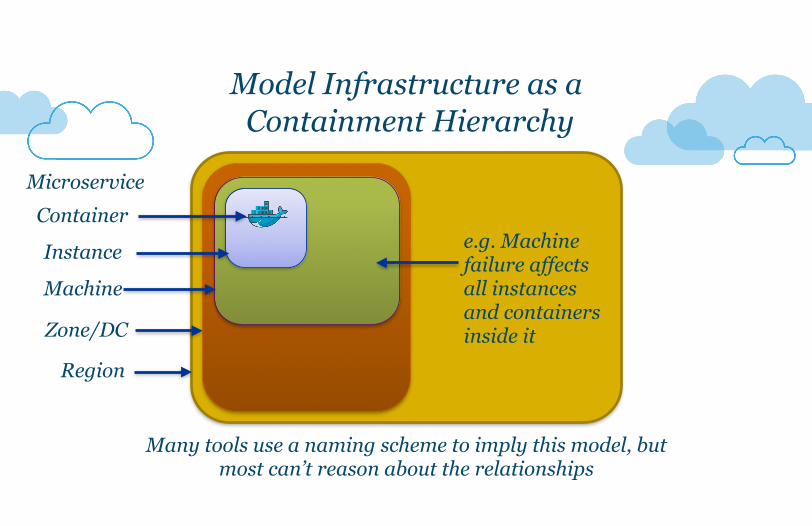
Container
Instance e.g. Machine failure affects all instances and containers inside itZone/DC
Region
Microservice
Model Infrastructure as a Containment Hierarchy
Machine
Many tools use a naming scheme to imply this model, but most can’t reason about the relationships


Request
Model Applications and Networks as a Dataflow Graph
APM Tools often model these as business transactions
Microservice Zone/DC
Region

Developer Developer
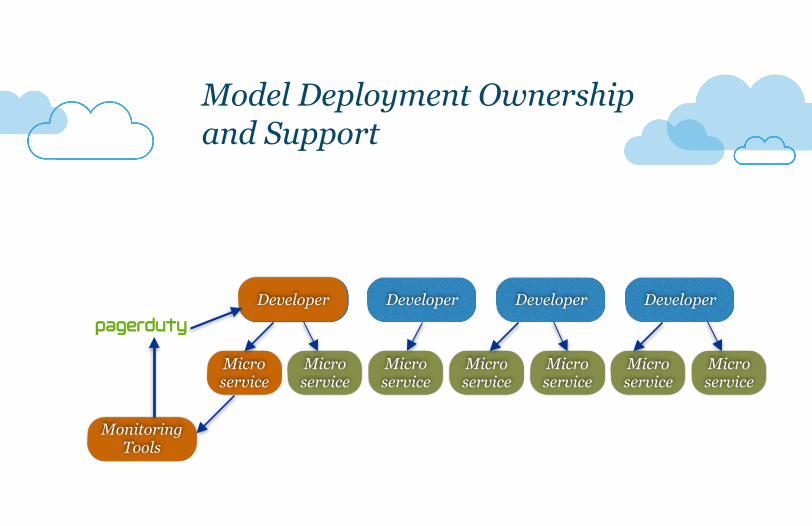
Model Deployment Ownership and Support
Developer Developer

Developer Developer
Model Deployment Ownership and Support
Micro service
Micro service
Micro service
Micro service
Micro service
Micro service
Micro service
Developer Developer

Developer Developer
Model Deployment Ownership and Support
Micro service
Micro service
Micro service
Micro service
Micro service
Micro service
Micro service
Developer Developer
Monitoring Tools
DeveloperDeveloper Developer
Model Deployment Ownership and Support
Micro service
Micro service
Micro service
Micro service
Micro service
Micro service
Micro service
Developer Developer
Monitoring Tools
DeveloperDeveloper Developer
Model Deployment Ownership and Support
Micro service
Micro service
Micro service
Micro service
Micro service
Micro service
Micro service
Developer Developer
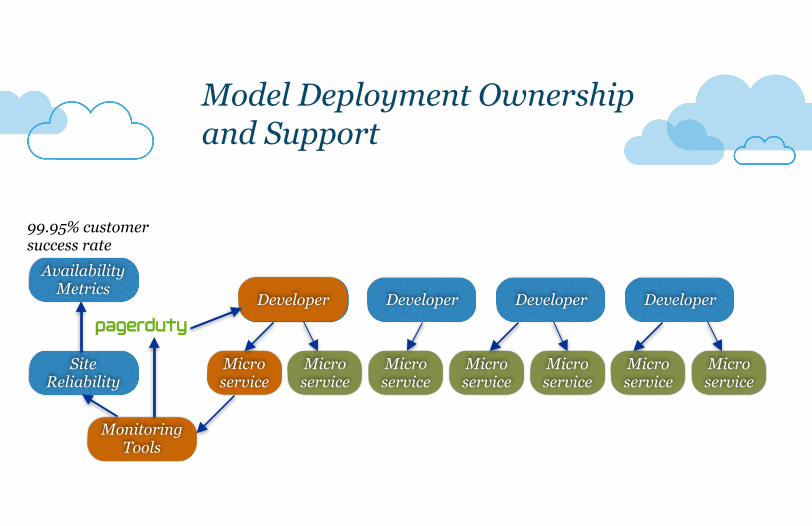
Site Reliability
Monitoring Tools
Availability Metrics
99.95% customer success rate

DeveloperDeveloper Developer
Model Deployment Ownership and Support
Micro service
Micro service
Micro service
Micro service
Micro service
Micro service
Micro service
Developer Developer
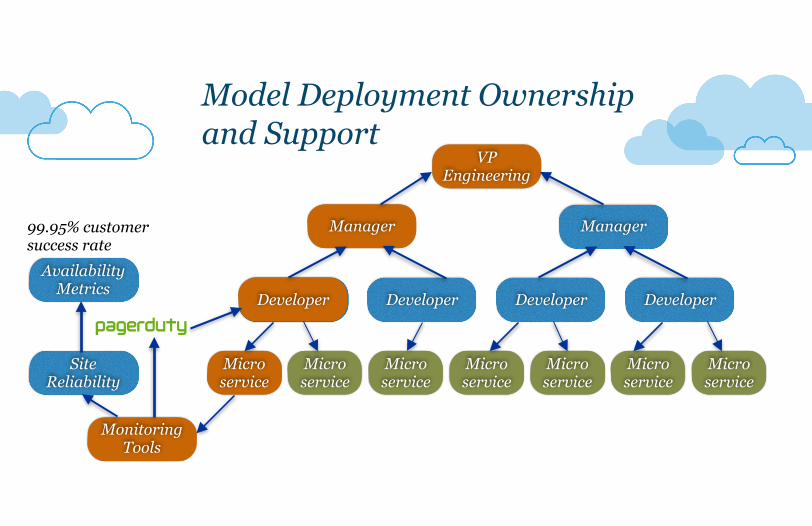
Manager Manager
Site Reliability
Monitoring Tools
Availability Metrics
99.95% customer success rate
DeveloperDeveloper Developer
Model Deployment Ownership and Support
Micro service
Micro service
Micro service
Micro service
Micro service
Micro service
Micro service
Developer Developer
Manager Manager
VP Engineering
Site Reliability
Monitoring Tools
Availability Metrics
99.95% customer success rate
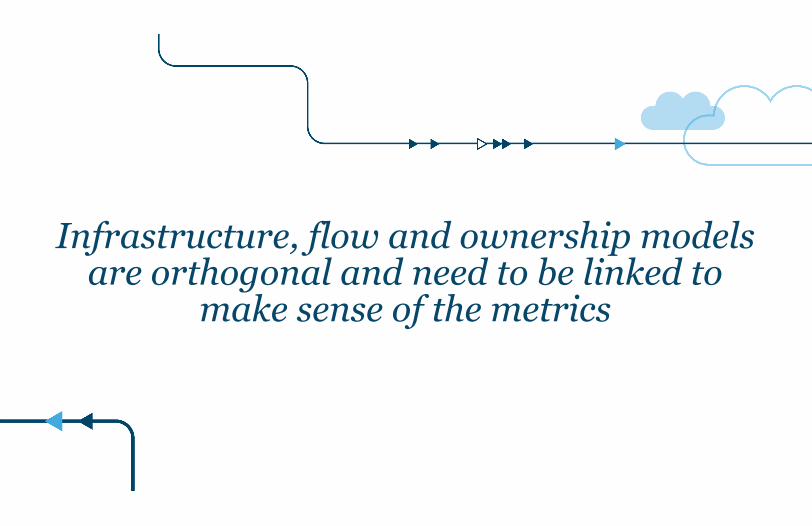
Infrastructure, flow and ownership models are orthogonal and need to be linked to
make sense of the metrics

Monitoring Rules by @adrianco
1. Spend more time on analysis than data collection and display 2. Reduce key business metric latency to less than 10s 3. Validate your measurement system, use histograms 4. Be more available and scalable than the services being monitored 5. Optimize for distributed, ephemeral cloud native applications 6. Fit metrics to models to understand relationships

Microservices
Microservices@ideavist

A Microservice Definition !
Loosely coupled service oriented architecture with bounded contexts

A Microservice Definition !
Loosely coupled service oriented architecture with bounded contexts
If every service has to be updated at the same time it’s not loosely coupled

A Microservice Definition !
Loosely coupled service oriented architecture with bounded contexts
If every service has to be updated at the same time it’s not loosely coupled
If you have to know too much about surrounding services you don’t have a bounded context. See the Domain Driven Design book by Eric Evans.

Complexity
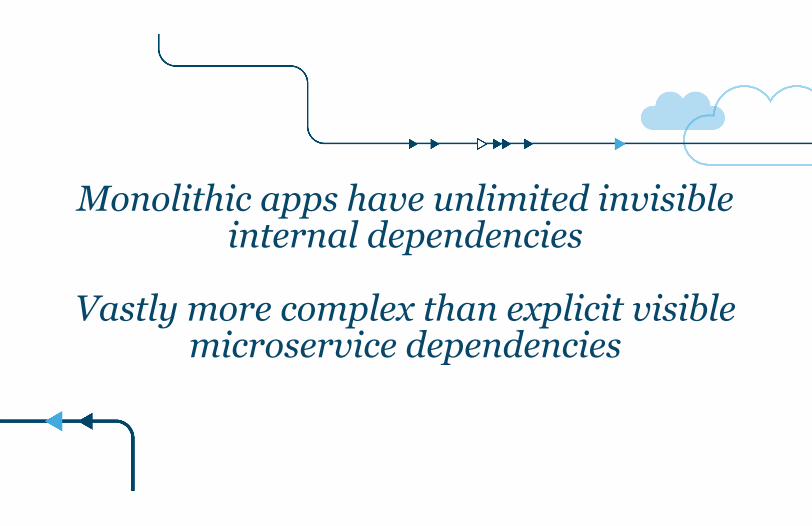
Monolithic apps have unlimited invisible internal dependencies
!Vastly more complex than explicit visible
microservice dependencies

Speed

Speeding Up Deployments
Datacenter Snowflakes • Deploy in months • Live for years

Speeding Up Deployments
Datacenter Snowflakes • Deploy in months • Live for years
Virtualized and Cloud • Deploy in minutes • Live for weeks

Speeding Up Deployments
Datacenter Snowflakes • Deploy in months • Live for years
Virtualized and Cloud • Deploy in minutes • Live for weeks
Container Deployments • Deploy in seconds • Live for minutes/hours

Speeding Up Deployments
Datacenter Snowflakes • Deploy in months • Live for years
Virtualized and Cloud • Deploy in minutes • Live for weeks
Container Deployments • Deploy in seconds • Live for minutes/hours
AWS Lambda Events • Respond in milliseconds • Live for seconds
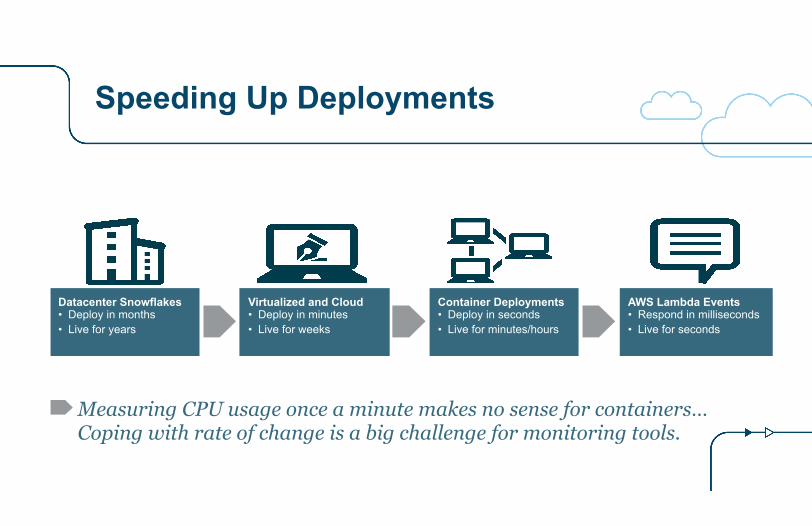
Speeding Up Deployments
Measuring CPU usage once a minute makes no sense for containers… Coping with rate of change is a big challenge for monitoring tools.
Datacenter Snowflakes • Deploy in months • Live for years
Virtualized and Cloud • Deploy in minutes • Live for weeks
Container Deployments • Deploy in seconds • Live for minutes/hours
AWS Lambda Events • Respond in milliseconds • Live for seconds

Scale

A Possible Hierarchy Continents
Regions Zones
Services Versions
Containers Instances
How Many? 3 to 5
2-4 per Continent 1-5 per Region 100’s per Zone
Many per Service 1000’s per Version
10,000’s
It’s much more challenging than just a large number of
machines

Flow

Some tools can show the request flow
across a few services

But interesting architectures have a lot of microservices! Flow visualization is
a challenge.
See http://www.slideshare.net/LappleApple/gilt-from-monolith-ruby-app-to-micro-service-scala-service-architecture

Failures

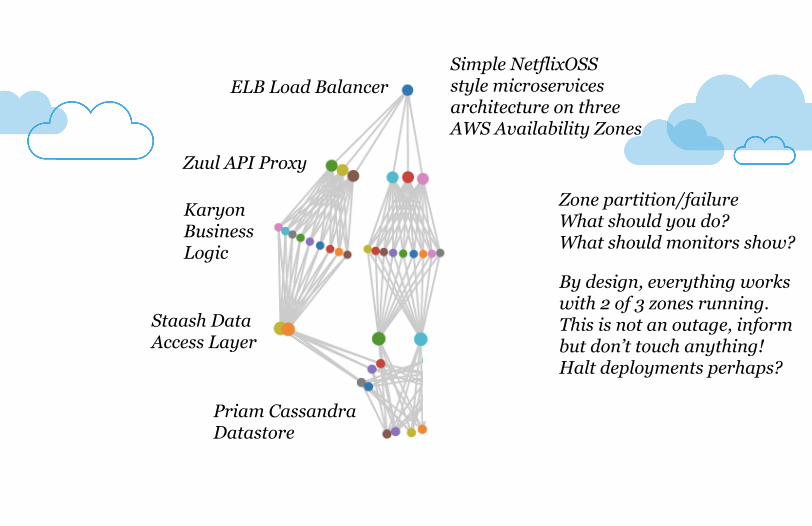
ELB Load Balancer
Zuul API Proxy
Karyon Business Logic
Staash Data Access Layer
Priam Cassandra Datastore
Simple NetflixOSS style microservices architecture on three AWS Availability Zones

ELB Load Balancer
Zuul API Proxy
Karyon Business Logic
Staash Data Access Layer
Priam Cassandra Datastore
Simple NetflixOSS style microservices architecture on three AWS Availability Zones

ELB Load Balancer
Zuul API Proxy
Karyon Business Logic
Staash Data Access Layer
Priam Cassandra Datastore
Simple NetflixOSS style microservices architecture on three AWS Availability Zones
Zone partition/failure What should you do? What should monitors show?
ELB Load Balancer
Zuul API Proxy
Karyon Business Logic
Staash Data Access Layer
Priam Cassandra Datastore
Simple NetflixOSS style microservices architecture on three AWS Availability Zones
Zone partition/failure What should you do? What should monitors show?
By design, everything works with 2 of 3 zones running. This is not an outage, inform but don’t touch anything! Halt deployments perhaps?
Challenge: understand and communicate common microservice failure patterns.

Testing

Testing monitoring tools at scale gets expensive quickly…

Simulation
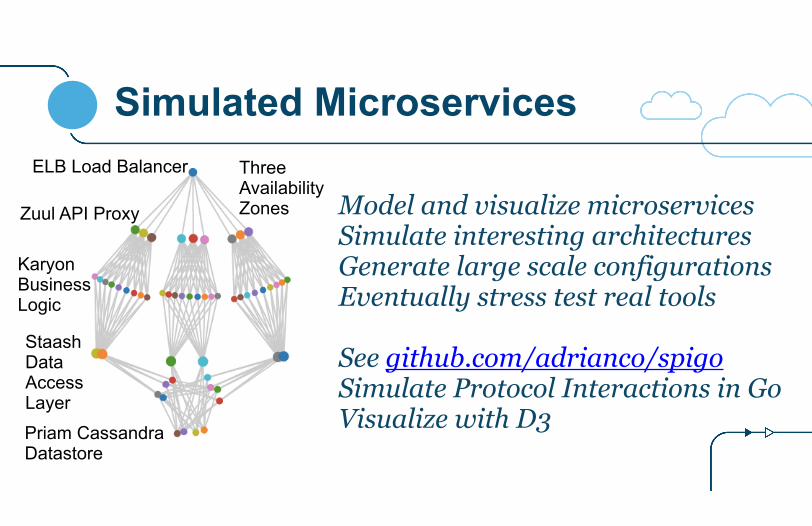
Simulated Microservices
Model and visualize microservices Simulate interesting architectures Generate large scale configurations Eventually stress test real tools !See github.com/adrianco/spigo Simulate Protocol Interactions in Go Visualize with D3
ELB Load Balancer
Zuul API Proxy
Karyon Business Logic
Staash Data Access Layer
Priam Cassandra Datastore
Three Availability Zones

netflixoss.go architecture!!!!!!!!!asgard.Create(cname, asgard.PriamCassandraPkg, regions, priamCassandracount, "eureka", cname) asgard.Create(tname, asgard.StaashPkg, regions, staashcount, cname) asgard.Create(jname, asgard.KaryonPkg, regions, javacount, tname) asgard.Create(nname, asgard.KaryonPkg, regions, nodecount, jname) asgard.Create(zuname, asgard.ZuulPkg, regions, zuulcount, nname) asgard.Create(elbname, asgard.ElbPkg, regions, 0, zuname) asgard.Run(asgard.Create(dns, asgard.DenominatorPkg, 0, 0, elbname), jname) // victimize a javaweb
Tooling New tier name
Tier package
Region count: 1
Node count
List of tier dependencies

Run and log results to json$ spigo -a netflixoss -d 10 -j 2015/05/21 00:05:32 netflixoss: scaling to 100% 2015/05/21 00:05:32 netflixoss.edda: starting 2015/05/21 00:05:32 netflixoss.us-east-1.zoneA.eureka.eureka.eureka0: starting 2015/05/21 00:05:32 netflixoss.us-east-1.zoneB.eureka.eureka.eureka1: starting 2015/05/21 00:05:32 netflixoss.us-east-1.zoneC.eureka.eureka.eureka2: starting 2015/05/21 00:05:32 netflixoss.*.*.www.denominator.www0 activity rate 10ms 2015/05/21 00:05:37 chaosmonkey delete: netflixoss.us-east-1.zoneC.javaweb.karyon.javaweb14 2015/05/21 00:05:42 asgard: Shutdown 2015/05/21 00:05:42 netflixoss.us-east-1.zoneB.eureka.eureka.eureka1: closing 2015/05/21 00:05:42 netflixoss.us-east-1.zoneA.eureka.eureka.eureka0: closing 2015/05/21 00:05:42 netflixoss.us-east-1.zoneC.eureka.eureka.eureka2: closing 2015/05/21 00:05:42 spigo: complete 2015/05/21 00:05:42 netflixoss.edda: closing
10 sec run time
edda.go logs config to json
eureka.go service registry per zone
Chaos monkey victim!

Simianviz from json logs http://simianviz.divshot.io/netflixoss/1
ELB splits traffic over zones in single region
microservicesCassandra Cluster Six regions
Big thanks to @kurtiskemple
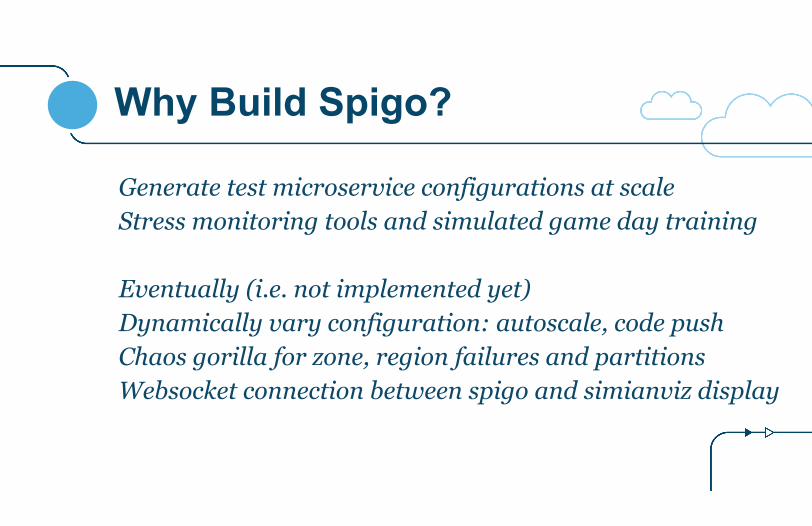
Why Build Spigo?
Generate test microservice configurations at scale Stress monitoring tools and simulated game day training !Eventually (i.e. not implemented yet) Dynamically vary configuration: autoscale, code push Chaos gorilla for zone, region failures and partitions Websocket connection between spigo and simianviz display !

My challenge to you: Build your architecture in Spigo. Stress monitoring tools with it.
Help fix monitoring for microservices! !
@mgroeniger

Questions?
Disclosure: some of the companies mentioned may be Battery Ventures Portfolio Companies See www.battery.com for a list of portfolio investments
● Microservices Challenges ● Speed and Scale ● Flow and Failures ● Testing and Simulation !
● Battery Ventures http://www.battery.com ● Adrian’s Tweets @adrianco and Blog http://perfcap.blogspot.com ● Slideshare http://slideshare.com/adriancockcroft ● Github http://github.com/adrianco/spigo

What does @adrianco do?
@adrianco
Technology Due Diligence on Deals
Presentations at Conferences
Presentations at Companies
Technical Advice for Portfolio Companies
Program Committee for Conferences
Networking with Interesting PeopleTinkering with
Technologies
Maintain Deep Relationship with Cloud Vendors

| Battery Ventures
Portfolio Companies for Enterprise IT
Security
Visit http://www.battery.com/our-companies/ for a full list of all portfolio companies in which all Battery Funds have invested.
Palo Alto Networks
Enterprise IT
Operations & Management
Big DataCompute
Networking
Storage