glucose regulation in diabetes - amazon web services · glucose regulation in diabetes 1. ... what...
TRANSCRIPT

Glucose Regulation in the Body:
New Understandings for Management
Curtis Triplitt, PharmD, CDE
Texas Diabetes Institute
Assistant Professor, Medicine/Diabetes
University of Texas Health Science Center at San Antonio
San Antonio, TX
1

2
Faculty InformationPresenter
Curtis Triplitt, PharmD, CDE
Texas Diabetes Institute
Assistant Professor, Medicine/Diabetes
University of Texas Health Science Center at San Antonio
San Antonio, TX
Q&A Moderator
Jeff D. Prescott, PharmD, RPh
Vice President, Clinical and Scientific Affairs
American Journal of Managed Care
This activity is supported by an educational grant from
Bristol-Myers Squibb and AstraZeneca LP.

3
Disclosures
Curtis Triplitt, PharmD, CDE, has disclosed the following commercial
financial relationships:
Consultant/Advisory Board: Roche, Takeda Pharmaceuticals
Speaker’s Bureau: Amylin, Eli Lilly, Pfizer
The planning staff from Pharmacy Times Office of Continuing
Professional Education have no relevant financial relationships to
disclose related to this program.
The contents of this webinar may include information regarding the use
of products that may be inconsistent with or outside the approved
labeling for these products in the United States. Physicians should note
that the use of these products outside current approved labeling is
considered experimental and are advised to consult prescribing
information for these products.

4
Educational Objectives
After completion of this activity, participants should be better able
to:
• Examine pathophysiology of diabetes and different mechanisms
involved in maintaining glucose balance
• Explain new understandings in defects of glucose balance and
their role in the pathophysiology of diabetes
• Review the role of different organ systems in maintaining
glucose homeostasis

5
Pharmacy Accreditation
Pharmacy Times Office of Continuing
Professional Education is accredited by the
Accreditation Council for Pharmacy Education
(ACPE) as a provider of continuing pharmacy
education. This enduring activity is approved for 1
contact hour (0.1 CEU) under the ACPE universal
activity number 0290-9999-11-046-H01-P. This
activity is available for CE credit through October
19, 2013.
Type of Activity: Knowledge
Glucose Regulation in the Body: New
Understandings for Management
Curtis Triplitt, PharmD, CDE
Texas Diabetes Institute
Assistant Professor, Medicine/Diabetes
University of Texas Health Science Center at San Antonio
San Antonio, TX
6

7
Glucose Regulation in Diabetes
1. How is glucose tightly regulated in normal healthy people?
2. What are the problems that cause glucose regulation to be
abnormal in diabetes?
3. How can each of these 8 key abnormalities be addressed in
diabetes?

8
The “Lingo”
• Gluconeogenesis: making glucose
• Glycogen: stored glucose
• Glycogenolysis: breaking down stored glucose
• FFA: free fatty acid
• Ra: rate of appearance of glucose
• Rd: rate of disappearance of glucose
• NGT: normal glucose tolerance
• IGT: impaired glucose tolerance
• T2DM: type 2 diabetes mellitus
• GLP-1: glucagon-like peptide-1
• GIP: glucose-dependent insulinotropic polypeptide

9
Glucose
REASN14-6/2000
Pathogenesis of Type 2 Diabetes: Insulin
Resistance and -Cell Dysfunction
-Cell Dysfunction
Pancreas Liver Muscle Fat
Insulin Resistance
REASN14-6/2000
Pathogenesis of Type 2 Diabetes: Insulin
Resistance and -Cell Dysfunction
-Cell Dysfunction
Pancreas Liver Muscle Fat
Insulin Resistance
GLUCOSE
INPUTS
1. Gut (meals)
2. Liver (makes and
stores glucose)
3. Muscle (storage)
GLUCOSE
BLOOD
VESSEL
REASN14-6/2000
Pathogenesis of Type 2 Diabetes: Insulin
Resistance and -Cell Dysfunction
-Cell Dysfunction
Pancreas Liver Muscle Fat
Insulin Resistance
Insulin-Sensitive
Tissues
The rate of movement of glucose out of the circulation is called
the glucose disposal rate (Rd)
The rate of glucose appearance into the blood is called Ra
which is mainly from the liver or a meal

10
Normal, Hyper-, and Hypoglycemic States
Ra = the rate of appearance of glucose
into the blood
Rd = the rate of disappearance of
glucose from the blood
When Ra = Rd = “Euglycemic”
HYPERGLYCEMIA HYPOGLYCEMIA
Ra > Rd; Ra↑ or Rd↓ Ra < Rd; Ra↓ or Rd↑
Rd
Ra
50
mg/dL
Ra
Rd
50
mg/dL
Ra
Rd
200
mg/dL
Ra
Rd
200
mg/dL
Ra
Rd
100
mg/dL

11
Glucose Regulation Is Tightly Controlled

12
IncreasedHGP
Hyperglycemia
ETIOLOGY OF T2DM
DEFN75-3/99 Decreased GlucoseUptake
Impaired InsulinSecretion Increased Lipolysis
DecreasedIncretin EffectDecreased Insulin
Secretion
Increased
Hepatic
Glucose
Production
IncreasedGlucagonSecretion
Increased Lipolysis
Increased
Glucose
Reabsorption
NeurotransmitterDysfunction
Decreased Glucose
Uptake
Adapted from DeFronzo RA. Med Clin N Am. 2004;88(4):787-835.
Islet α cell
HYPERGLYCEMIA
Ominous Octet

13
IncreasedHGP
Hyperglycemia
ETIOLOGY OF T2DM
DEFN75-3/99 Decreased GlucoseUptake
Impaired InsulinSecretion Increased Lipolysis
DecreasedIncretin EffectDecreased Insulin
Secretion
Increased
Hepatic
Glucose
Production
IncreasedGlucagonSecretion
Increased Lipolysis
Increased
Glucose
Reabsorption
NeurotransmitterDysfunction
Decreased Glucose
Uptake
Adapted from DeFronzo RA. Med Clin N Am. 2004;88(4):787-835.
Islet α cell
DRUG?
Ominous Octet
HYPERGLYCEMIA

14
Muscle insulin resistance
Liver HGP (gluconeogenesis)
Pancreas insulin secretion
Fat cell “sick”
Adipocytes represent a storage depot for energy
(ie, fat). When the capacity of adipocytes to
store fat is exceed, there is an overflow of fat to:
HGP indicates hepatic glucose production.
Overflow Hypothesis

FFA
Gluconeogenesis
FFA
FFA
GlucoseOxidation
Insulin
Secretion
FFA indicates free fatty acid. 15
Lipotoxicity
Send discussion questions to

16
Relationship Between Insulin Sensitivity and
Intramyocellular Triglyceride Concentration in
Pima Indians With NGT
Skeletal Muscle–Associated Triglyceride
( mol/g wet weight of tissue)
0.2
0.4
0.6
0.8
06 8 102 4
r = -0.53
P <.0006
FFM indicates fat-free mass; NGT, normal glucose tolerance.
Reprinted with permission from Pan DA, Lillioja S, Kriketos AD, et al. Diabetes. 1997;46(6):983-988.
Insu
lin S
en
sitiv
ity
(Cla
mp
Lo
g1
0M
)
(mg/m
in·k
g F
FM
+ 1
7.7
)

17
Baseline
With
Insulin
Baseline
With
Insulin
0
25
50
75
100
125
Suppre
ssio
n o
f H
GP
(mg/m
2 ●
min
)
Low LiverFat (1.7%)
High LiverFat (10.5%)
a
FPI (pM)
Lo Fat 32±4Hi Fat 44±3b
LEAN MEN WITHOUT
DIABETES
aP <.05; bP <.02.
FPI indicates fasting plasma insulin; HGP, hepatic glucose production.
Seppälä-Lindroos A, Vehkavaara S, Häkkinen AM, et al. J Clin Endocrinol Metab. 2002;87(7):3023-3028.
Impact of Hepatic Fat Content on Ability to
Decrease Hepatic Glucose Production

18Adapted from Ryysy L, Häkkinen AM, Goto T, et al. Diabetes. 2000;49(5):749-758.
Fat mass (kg)
% S
up
pre
ss
ion
of
EG
P b
y I
ns
ulin
Liver fat (%)Liver fat (%)
Ins
ulin
Do
se
(U
/da
y)
Liv
er
fat
(%)
10 20 30
-100
-50
0
20 30 40
10
20
30
10 20 30
100
200
0
r = 0.72
P <.01
r = 0.76
P <.001
r = 0.73
P <.001
0 00
0
T2DM Patients Treated With Bedtime Insulin + Metformin
EGP indicates endogenous glucose production; T2DM, type 2 diabetes mellitus.
Liver Fat Content and Suppression of
Glucose Production From Liver

19
ADIPOCYTE
ASP & Adipsin
FFA
TNF
MIF
IL-6
Leptin
PAI-1
Resistin
Angioten-sinogen
Adiponectin
ASP indicates acylation-stimulating protein; FFA, free fatty acid; IL-6, interleukin 6; MIF, macrophage migration inhibitory factor; PAI-1,
plasminogen activator inhibitor-1; TNF , tumor necrosis factor-alpha.
―Sick,‖ Dysfunctional Fat Cell

20
IncreasedHGP
Hyperglycemia
ETIOLOGY OF T2DM
DEFN75-3/99 Decreased GlucoseUptake
Impaired InsulinSecretion Increased Lipolysis
DecreasedIncretin EffectDecreased Insulin
Secretion
Increased
Hepatic
Glucose
Production
IncreasedGlucagonSecretion
Increased Lipolysis
Increased
Glucose
Reabsorption
NeurotransmitterDysfunction
Decreased Glucose
Uptake
Adapted from DeFronzo RA. Med Clin N Am. 2004;88(4):787-835.
Islet α cell
Ominous Octet
DRUG?
HYPERGLYCEMIA

21
• Major source of net endogenous glucose production (kidney
maybe 10%-15% fasting)
• Accomplished by gluconeogenesis and glycogenolysis when
glucose is low and glycogen synthesis when glucose is high
• Can oxidize glucose for energy and convert it to fat which can
be incorporated into VLDL for transport
• In T2DM, there is increased gluconeogenesis
Liver and Kidney
T2DM indicates type 2 diabetes mellitus; VLDL, very low density lipoprotein.
Send discussion questions to

22
DECREASE INCREASE
0
Parasympathetic
Hyperglycemia
Insulin
FFA
Cortisol
Glucagon
Epinephrine
Growth Hormone
Sympathetic
FFA indicates free fatty acid.
Regulation of Hepatic Glucose Production

23
DECREASE INCREASE
0
Parasympathetic
Hyperglycemia
InsulinFFA
Cortisol
Glucagon
Epinephrine
Growth Hormone
Sympathetic
Regulation of Hepatic Glucose Production
FFA indicates free fatty acid.

24
DECREASE INCREASE
0
Parasympathetic
Hyperglycemia
Insulin
FFA
Cortisol
Glucagon
Epinephrine
Growth Hormone
Sympathetic
Regulation of Hepatic Glucose Production
FFA indicates free fatty acid.

25
Direct effect: 60%-70%
Indirect effect: 30%-40%
— FFA (adipocyte)
— Glucagon (alpha cell)
— Gluconeogenic precursors
Amino acids (muscle)
Glycerol (adipocyte)
Direct Versus Indirect Effect of Insulin on
Hepatic Glucose Production
FFA indicates free fatty acid.

26DeFronzo RA, Ferrannini E, Simonson DC. Metabolism. 1989;38(4):387-395.
Basal H
GP
(m
g/k
g ●
min
)
2.8
2.4
2.0
1.6
P <.001
CONTROL T2DM
FPG (mg/dL)
FPG indicates fasting plasma glucose; HGP, hepatic glucose production; T2DM, type 2 diabetes mellitus.
Basal Hepatic Glucose Production in T2DM:
Relationship With Fasting Plasma GlucoseB
asal H
GP
(mg
/kg
●m
in)
2.0
2.5
3.0
3.5
4.0
100 200 300
r = 0.85, P <.001
• Control
• T2DM

27
• Can convert glucose to glycogen (storage)
• Can convert glucose to pyruvate through glycolysis;
pyruvate is further metabolized to lactate, transaminated
to alanine, or channeled into the TCA cycle (energy)
• In the fasting state, can utilize FFA for fuel and mobilize
amino acids by proteolysis for transport to the liver for
gluconeogenesis
• Can break down glycogen (mobilization of stored
glucose)
FFA indicates free fatty acid; TCA, tricarboxylic acid.
Muscle

28Adapted from DeFronzo RA. Med Clin N Am. 2004;88(4):787-835. Cusi K, Maezono K, Osman A, et al. J Clin Invest. 2000;105(3):311-320; Miyazaki Y, He H, Mandarino LJ,
DeFronzo RA. Diabetes. 2003;52(8):1943-1950.
InsulinReceptor
Plasma Membrane
ProteinSynthesis
LipidSynthesis
GlycogenSynthesis
+ Artery
p85Akt
PI-3-Kinase
p110
IRS-1
GlucoseGLUT4
GLUT4 indicates glucose transporter type 4; IRS-1, insulin receptor substrate-1; NOS, nitric oxide synthase; PI-3, phosphatidylinositol-3.
Insulin Signaling System in Humans

29
+ Artery
InsulinReceptor
Plasma Membrane
p85 p110Akt
InflammationAtherosclerosis
Shc
PI-3-Kinase
IRS-1
GLUT4
GLUT4 indicates glucose transporter type 4; IRS-1, insulin receptor substrate-1; MAP, mitogen-activated protein; NOS, nitric oxide synthase; PI-
3, phosphatidylinositol-3. Adapted from DeFronzo RA. Med Clin N Am. 2004;88(4):787-835. Cusi K, Maezono K, Osman A, et al. J Clin Invest. 2000;105(3):311-320; Miyazaki Y, He H, Mandarino LJ,
DeFronzo RA. Diabetes. 2003;52(8):1943-1950.
Insulin Signaling System in Humans

30
IncreasedHGP
Hyperglycemia
ETIOLOGY OF T2DM
DEFN75-3/99 Decreased GlucoseUptake
Impaired InsulinSecretion Increased Lipolysis
DecreasedIncretin EffectDecreased Insulin
Secretion
Increased
Hepatic
Glucose
Production
IncreasedGlucagonSecretion
Increased Lipolysis
Increased
Glucose
Reabsorption
NeurotransmitterDysfunction
Decreased Glucose
Uptake
Adapted from DeFronzo RA. Med Clin N Am. 2004;88(4):787-835.
Islet α cell
Ominous Octet
DRUG? DRUG?
HYPERGLYCEMIA

31
Ins
uli
n S
ecre
tio
n
AIR
(µ
U/m
L)
IGT
NGT
NGTNGT NGT
DIA
500
400
300
200
100
0
Insulin Sensitivity
M-low (mg/kg EMBS per minute)
Progressors
Non-Progressors
1 2 3 4 5
Reprinted with permission from Weyer C, Bogardus C, Mott DM, Pratley RE. J Clin Invest. 1999;104(6):787-794.
Early Insulin Secretion Increases
With Decreasing Insulin Action
AIR indicates acute insulin secretory response; DIA, diabetes; EBMS, estimated metabolic body size; IGT, impaired glucose tolerance;
NGT, normal glucose tolerance.

32FPG indicates fasting plasma glucose; IFG, impaired fasting glucose; NGT, normal glucose tolerance; T2DM, type 2 diabetes mellitus.
FP
G
(mg
/dL
)ß
-cell
Vo
lum
e (%
)
4
3
2
1
0
250
200
150
100
50
NGT
NGT
IFG
IFG
P <.01
P <.01
T2DM
T2DM
P <.001
P <.001
Adapted from Butler AE, Janson J, Bonner-Weir S, et al. Diabetes. 2003;52(1):102-110.
Beta Cell Volume Is Related to
Fasting Plasma Glucose Levels

33Gastaldelli A, Ferrannini E, Miyazaki Y, et al. Beta-cell dysfunction and glucose intolerance: results from the San Antonio metabolism (SAM) study. Diabetologia. 2004;47(1):31-39.
IGT
30
20
10
0
40∆
IN
SU
LIN
/ ∆
G
LU
CO
SE
÷IR
Lean
NGT
Obese
2-Hour PG
(mg/dL)
T2DM
CALCULATED
VIA OGTT
IGT indicates impaired glucose tolerance; IR, insulin resistance; NGT, normal glucose tolerance; OGTT, oral glucose tolerance test; PG, plasma
glucose; T2DM, type 2 diabetes mellitus.
Ability to Release Insulin in
Response to a Glucose Load

34
Med
ian
HB
A1c (
%)
Time (years)
Glibenclamide
Metformin
9
8
7
6
0
0 3 6 9 12 15
Conventional
HbA1c indicates glycosylated hemoglobin; Rx, prescription; SU, sulfonylurea; UKPDS, United Kingdom Prospective Diabetes Study.
UK Prospective Diabetes Study (UKPDS) Group. Lancet. 1998;352(9131):837-853;
UK Prospective Diabetes Study (UKPDS) Group. Lancet. 1998;352(9131):854-865.
UKPDS: Effect of SU & Metformin Rx on HbA1c

35
Insulin Resistance
Age
β CellFailure
Genetics
(TCF7L2)
Lipotoxicity
FFA
Glucose
Toxicity
Amyloid (IAPP)Deposition
Incretin
Effect
Etiology of Beta Cell Failure in T2DM
FFA indicates free fatty acid; IAPP, islet amyloid polypeptide; TCF7L2, transcription factor 7-like 2; T2DM, type 2 diabetes mellitis.
36
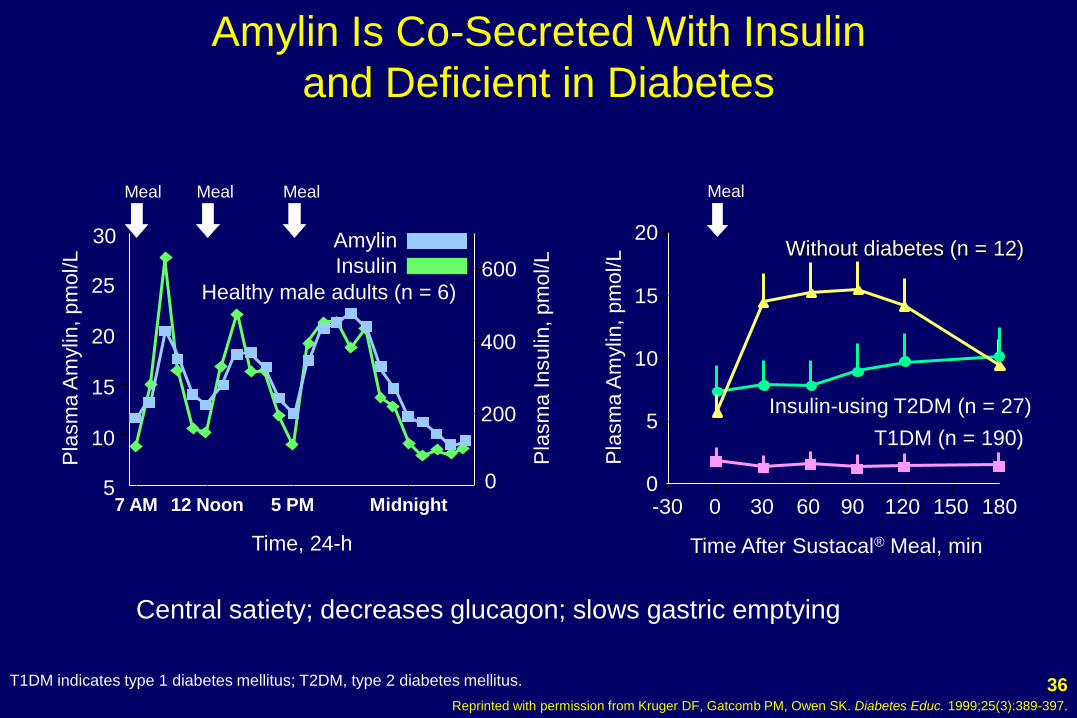
Time After Sustacal® Meal, min
0
5
10
15
20
-30 0 30 60 90 120 150 180
Pla
sm
a A
mylin
, pm
ol/L
Meal
T1DM (n = 190)
Insulin-using T2DM (n = 27)
Without diabetes (n = 12)
Pla
sm
a Insulin
, pm
ol/L
30
25
20
15
10
5
Time, 24-h
600
400
200
0
Meal Meal Meal
Amylin
Insulin
Pla
sm
a A
mylin
, pm
ol/L
Healthy male adults (n = 6)
7 AM Midnight5 PM12 Noon
Central satiety; decreases glucagon; slows gastric emptying
Reprinted with permission from Kruger DF, Gatcomb PM, Owen SK. Diabetes Educ. 1999;25(3):389-397.
Amylin Is Co-Secreted With Insulin
and Deficient in Diabetes
T1DM indicates type 1 diabetes mellitus; T2DM, type 2 diabetes mellitus.

37
IncreasedHGP
Hyperglycemia
ETIOLOGY OF T2DM
DEFN75-3/99 Decreased GlucoseUptake
Impaired InsulinSecretion Increased Lipolysis
DecreasedIncretin EffectDecreased Insulin
Secretion
Increased
Hepatic
Glucose
Production
IncreasedGlucagonSecretion
Increased Lipolysis
Increased
Glucose
Reabsorption
NeurotransmitterDysfunction
Decreased Glucose
Uptake
Adapted from DeFronzo RA. Med Clin N Am. 2004;88(4):787-835.
Islet α cell
Ominous Octet
DRUG?
DRUG? HYPERGLYCEMIA

The Incretin Effect Is Reduced
in Patients With T2DM
• In diabetic patients vs. healthy subjects challenged with
an oral 50 g glucose load and IV glucose:
o Differences between responses to oral and IV glucose were
attributed to factors other than glucose itself (incretin effect)
o After oral glucose, immunoreactive insulin and connecting
peptide responses were delayed in diabetic vs. healthy subjects
o After IV glucose, insulin and connecting peptide responses were
greater in diabetic patients vs. healthy subjects (as
consequence of higher glycemic stimulus)
Nauck M, Stöckmann F, Ebert R, Creutzfeldt W. Diabetologia. 1986;29(1):46-52.

GLP-1 and GIP Responses in T2DM
• Postprandial GLP-1 levels are decreased in patients with
IGT and T2DM, compared to controls with normal
glucose tolerance
o Most pronounced GLP-1 decreases seen in T2DM
• Glucose-dependent insulinotrophic polypeptide (GIP)
levels are increased in T2DM, compared to controls with
normal glucose tolerance
Toft-Nielsen MB, Damholt MB, Madsbad S, et al. J Clin Endocrinol Metab. 2001;86(8):3717-3723.
Jones IR, Owens DR, Luzio S, Williams S, Hayes TM. Diabetologia. 1989;32(9):668-677.

40Flint A, Raben A, Astrup A, Holst JJ. J Clin Invest. 1998;101(3):515-520; Larsson H, Holst JJ, Ahrén B. Acta Physiol Scand. 1997;160(4):413-422;
Nauck MA, Wollschläger D, Werner J, et al. Diabetologia. 1996;39(12):1546-1553; Drucker DJ. Diabetes. 1998;47(2):159-169.
Stomach:Helps regulate gastric
emptying
Promotes satiety and
reduces appetite
Liver:
Glucagon reduces hepatic
glucose output
(glycogenolysis)β cells:
Enhances glucose-dependent
insulin secretion
α cells:Postprandial
glucagon secretion
GLP-1: Secreted upon the
ingestion of food
Exenatide: IV infusion
GLP-1 indicates glucagon-like peptide-1; IV, intravenous.
GLP-1 Modulates Numerous Functions in Humans

41
IncreasedHGP
Hyperglycemia
ETIOLOGY OF T2DM
DEFN75-3/99 Decreased GlucoseUptake
Impaired InsulinSecretion Increased Lipolysis
DecreasedIncretin EffectDecreased Insulin
Secretion
Increased
Hepatic
Glucose
Production
IncreasedGlucagonSecretion
Increased Lipolysis
Increased
Glucose
Reabsorption
NeurotransmitterDysfunction
Decreased Glucose
Uptake
Adapted from DeFronzo RA. Med Clin N Am. 2004;88(4):787-835.
Islet α cell
Ominous Octet
DRUG?
HYPERGLYCEMIA

42
SGLT1
SGLT-2
(180 L/day) (900 mg/L) = 162 g/day
10%
90%
Glucose
NOGLUCOSE
S1
S3
SGLT indicates sodium glucose cotransporter.
Renal Handling of Glucose
Send discussion questions to

43Adapted from Rahmoune H, Thompson PW, Ward JM, Smith CD, Hong G, Brown J. Diabetes. 2005;54(12):3427-3434.
CON T2DM
AMG UPTAKE
0
500
1000
1500
2000
CP
M
a
SGLT-2 PROTEIN
0
1
2
3
4
5
CON T2DM
a
SGLT-2 mRNA
CON T2DM
0
2
4
6
No
rma
lize
d G
luc
os
e
Tra
ns
po
rte
r L
eve
lsa
Fo
ld In
cre
as
e
IN HUMAN RENAL PROXIMAL TUBULAR CELLS
aP <.05 - P <.01.
AMG indicates methyl-α-D-[U14C]-glucopyranoside; CON, control; CPM, counts per minute; mRNA, messenger ribonucleic acid; SGLT, sodium
glucose cotransporter; T2DM, type 2 diabetes mellitus.
Increased SGLT-2 Glucose Transporter mRNA

44
• Multiple drugs are likely necessary in type 2 diabetes mellitus to address
the underlying abnormalities
– Brain: amylinomimetics, GLP-1 agonists, dopamine agonists
– Fat: thiazolidinediones (TZDs)
– Liver and muscle: metformin and TZDs, but HGP can be reduced by “mass
action” through increased insulin (insulin, SU, etc)
– Glucagon: GLP-1 agonists, DPP-4 inhibitors, amylinomimetics
– Insulin: insulin, sulfonylureas, meglitinides, DPP-4 inhibitors, and GLP-1
agonists
– Incretins: GLP-1 agonists, DPP-4 inhibitors, alpha glucosidase inhibitors (?),
bile acid sequestrants (?)
– Renal glucose absorption: SGLT-2 inhibitors (not currently on the market)
DPP-4 indicates dipeptidyl peptidase 4; GLP-1, glucagon-like peptide-1; HGP, hepatic glucose production; SGLT, sodium glucose cotransporter; SU,
sulfonylurea; TZD, thiazolidinedione.
Summary

45
• Glucose is tightly regulated in our bodies
• Regulation can be disrupted through many different pathways
• At least 8 different pathways or abnormalities have been identified
in diabetes
• None of the pathways have been proved to fully correct all of the
abnormalities associated with type 2 diabetes mellitus
• Affecting multiple pathways is likely advantageous
Summary

46
THANK YOU!
For any questions regarding this activity, contact:
Glucose Regulation in the Body:
New Understandings for Management