glof south lhonak system teesta basin final -...
TRANSCRIPT
Central Water Commission Ministry of Water Resources,
River Development & Ganga Rejuvenation
Advisory Sheet
Glacial Lake Outburst Flood –South Lhonak System in Teesta River Basin
Planning and Development Organisation March 2015
i
Table of Contents
EXECUTIVE SUMMARY ....................................................................................................... 1 1. INTRODUCTION .......................................................................................................... 2 2. OBJECTIVE .................................................................................................................. 2 3. STUDY AREA AND DATA ............................................................................................. 2 3.1. Study Area .......................................................................................................... 2 3.2. Data.................................................................................................................... 3 4. VULNERABLE LOCATIONS ........................................................................................... 4 5. BEHAVIOUR OF GLACIAL LAKES .................................................................................. 5 6. POSSIBLE SCENARIOS FOR STUDY ............................................................................... 6 7. METHODOLOGY ......................................................................................................... 6 7.1. Volume of Glacial Lakes ...................................................................................... 6 7.2. Scheme of the River Network ............................................................................. 7 7.3. Cross sections ..................................................................................................... 7 7.4. Mathematical Model setup ................................................................................. 7 7.5. Assumptions and Limitations .............................................................................. 9 8. RESULTS ..................................................................................................................... 9 9. ADVISORY ................................................................................................................ 13 10. SUCGESTIONS FOR FURTHER WORK ......................................................................... 14 11. Acknowledgement ................................................................................................... 14 12. Reference................................................................................................................. 15
ii
LIST OF FIGURES:
Fig. 1: Google earth imagery of vulnerable lakes and critical locations in
River Teesta Fig. 2: Line diagram depicting the scheme of glacial lakes and habitation/
water resources projects downstream Fig. 3: Graph showing variation in water spread area Fig. 4: Longitudinal profile of River Teesta Fig. 5a: Hydrograph at various locations with time lag for scenario a Fig. 5b: Hydrograph at various locations with time lag for scenario b Fig. 5c: Hydrograph at various locations with time lag for scenario c Fig. 5d: Hydrograph at various locations with time lag for scenario d Fig. 5e: Hydrograph at various locations with time lag for scenario e
LIST OF TABLES: Table 1: Details of vulnerable area downstream of glacial lakes Table 2: Water spread area of glacial lakes Table 3: Maximum water spread area and volume of glacial lakes Table 4a: Scenario a Table 4b: Scenario b Table 4c: Scenario c Table 4d: Scenario d Table 4e: Scenario e Table 5: Water levels, discharge and maximum velocities at various
locations (all lakes burst at same time) Table 6: Water levels, discharge and maximum velocities at various
locations
ABBREVIATIONS: DEM – Digital Elevation Model GL – Glacial Lake GLOF – Glacial Lake Outburst Flood WB – Water Body
1
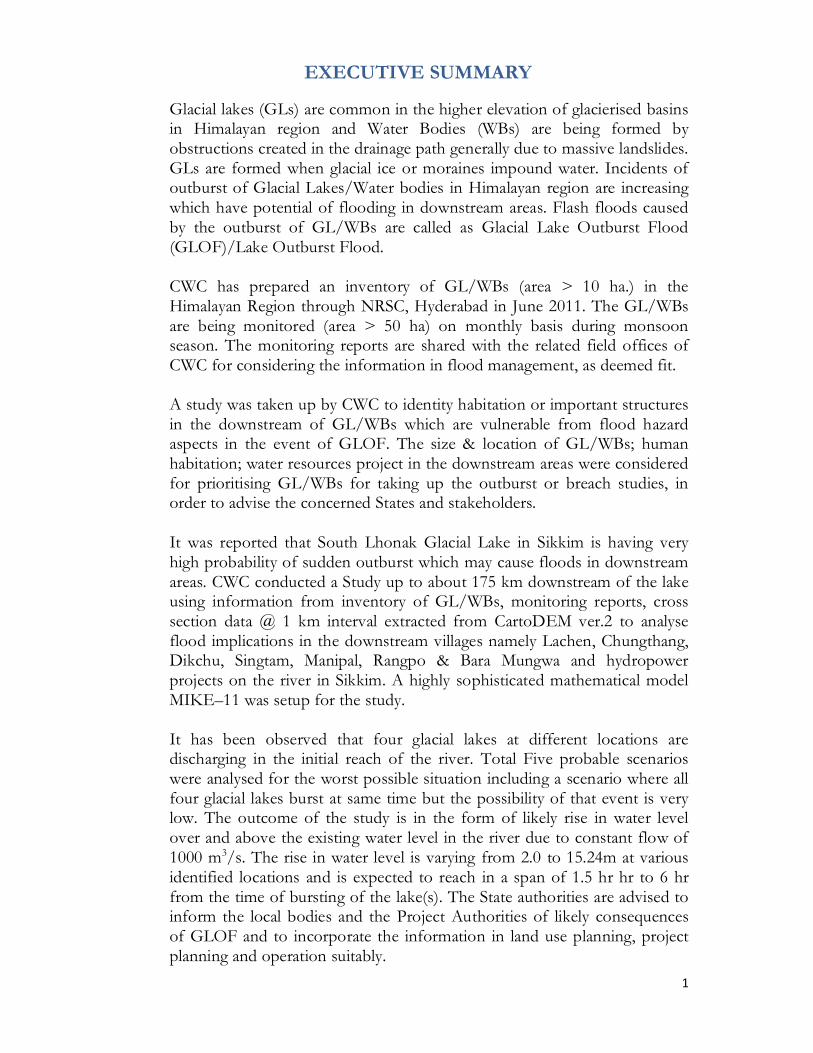
EXECUTIVE SUMMARY
Glacial lakes (GLs) are common in the higher elevation of glacierised basins in Himalayan region and Water Bodies (WBs) are being formed by obstructions created in the drainage path generally due to massive landslides. GLs are formed when glacial ice or moraines impound water. Incidents of outburst of Glacial Lakes/Water bodies in Himalayan region are increasing which have potential of flooding in downstream areas. Flash floods caused by the outburst of GL/WBs are called as Glacial Lake Outburst Flood (GLOF)/Lake Outburst Flood. CWC has prepared an inventory of GL/WBs (area > 10 ha.) in the Himalayan Region through NRSC, Hyderabad in June 2011. The GL/WBs are being monitored (area > 50 ha) on monthly basis during monsoon season. The monitoring reports are shared with the related field offices of CWC for considering the information in flood management, as deemed fit. A study was taken up by CWC to identity habitation or important structures in the downstream of GL/WBs which are vulnerable from flood hazard aspects in the event of GLOF. The size & location of GL/WBs; human habitation; water resources project in the downstream areas were considered for prioritising GL/WBs for taking up the outburst or breach studies, in order to advise the concerned States and stakeholders. It was reported that South Lhonak Glacial Lake in Sikkim is having very high probability of sudden outburst which may cause floods in downstream areas. CWC conducted a Study up to about 175 km downstream of the lake using information from inventory of GL/WBs, monitoring reports, cross section data @ 1 km interval extracted from CartoDEM ver.2 to analyse flood implications in the downstream villages namely Lachen, Chungthang, Dikchu, Singtam, Manipal, Rangpo & Bara Mungwa and hydropower projects on the river in Sikkim. A highly sophisticated mathematical model MIKE–11 was setup for the study. It has been observed that four glacial lakes at different locations are discharging in the initial reach of the river. Total Five probable scenarios were analysed for the worst possible situation including a scenario where all four glacial lakes burst at same time but the possibility of that event is very low. The outcome of the study is in the form of likely rise in water level over and above the existing water level in the river due to constant flow of 1000 m3/s. The rise in water level is varying from 2.0 to 15.24m at various identified locations and is expected to reach in a span of 1.5 hr hr to 6 hr from the time of bursting of the lake(s). The State authorities are advised to inform the local bodies and the Project Authorities of likely consequences of GLOF and to incorporate the information in land use planning, project planning and operation suitably.
2
1. INTRODUCTION
Glacial lakes (GLs) are common in the high elevation of glacierised basins in Himalayan region and Water Bodies (WBs) are being formed by obstructions created in the drainage path due to landslides or manmade structures. GLs are formed when glacial ice or moraines impound water. There are varieties of such lakes, ranging from melt water ponds on the surface of glacier to large lakes in side valleys dammed by a glacier in the main valley. These lakes normally drain their water through seepage in front of the retreating glacier. The moraine creates topographic depression in which the melt water is generally accumulated leading to formation of glacial lake. When this lake is watertight, melt waters will accumulate in the basin until seepage or overflow limits the lake level. The impoundment of the lake may be unstable, leading to sudden release of large quantities of stored water. Flash floods caused by the outburst of GL/WBs, called as Glacial Lake Outburst Flood (GLOF)/Lake Outburst Flood, are well known in Himalaya. The shrinkage of Himalayan glaciers has resulted in the formation of more moraine-dammed lakes. Bursting of such lakes lead to flash floods and these floods redistribute sediments and modify the landscape. The study has been taken up to analyse the impact of GLOF at vulnerable locations including villages, water resources projects etc. in the downstream areas. The analysis has been carried out by developing mathematical model of the system using MIKE-11 software.
2. OBJECTIVE
The objectives of the study are as following: 1. To develop mathematical model for glacial lake outburst study for Teesta
River. 2. To study impact of outburst flood at identified vulnerable locations
along the river in downstream.
3. STUDY AREA AND DATA
3.1. Study Area
Main study area is upper reaches of the Teesta River which is one of the major tributaries of River Brahmaputra. The river reach, considered for the study starts from origin of critical lake(s) to village Bara Mungwa [Lat: 27° 3'56.13"N Long: 88°25'27.69"E]. There are four lakes whose outburst may cause serious flash flood situation in the downstream areas.

3
3.2. Data
Water spread area and lake-IDs of the four glacial lakes have been taken from the report “Inventory of Glacial Lakes/Water Bodies in Himalayan Region of Indian River Basin” and monthly monitoring reports. Cross sections of the river reach @ 1 km internal have been extracted using CartoDEM ver.2. In the absence of bed profile of the lakes, due to inaccessibility, the average depth of lakes has been taken as 30 m and also an existing constant flow of 1000 m3/s has been assumed in the river for the purpose of study. Fig. 1 below shows Google earth image of glacial lakes and locations of villages and hydro power projects (existing and planned) on the River Teesta and the schematic diagram showing locations and their drainage path are shown in Fig. 2.
Fig. 1: Google earth image of glacial lakes and locations of villages and hydro power projects (existing and planned) on the River Teesta

4
Fig. 2: Line diagram depicting glacial lakes, habitation and hydropower
projects along River Teesta
4. VULNERABLE LOCATIONS
Details of the vulnerable locations along Teesta river downstream of the glacial lakes taken for the study as identified in the “Vulnerability Study of
Bara Mungwa 176.3 km
Rangpo 158 km
Manipal 157 km
Singtam 152.7 km
Village: Mangan 108.7 km HP Project: Teesta IV
Village: Chungthang 89.4 km and Teesta III
Village: Lachen 70.5 km HP Project: Teesta II
Lhonak 35 km 67 km
10 km
2 km
Lake 1 (03_77A_014) South Lhonak Lake
Lake 3 (03_77D_004)
Lake 2 (03_77D_002)
Lake 4 (03_78A_001)
HP Project: Teesta VI 151.7 km
HP Project: DikChu (Teesta V) 121km
Teesta Low Dam III
Teesta Low Dam IV
HP Project: Teesta I
Origin of River
5
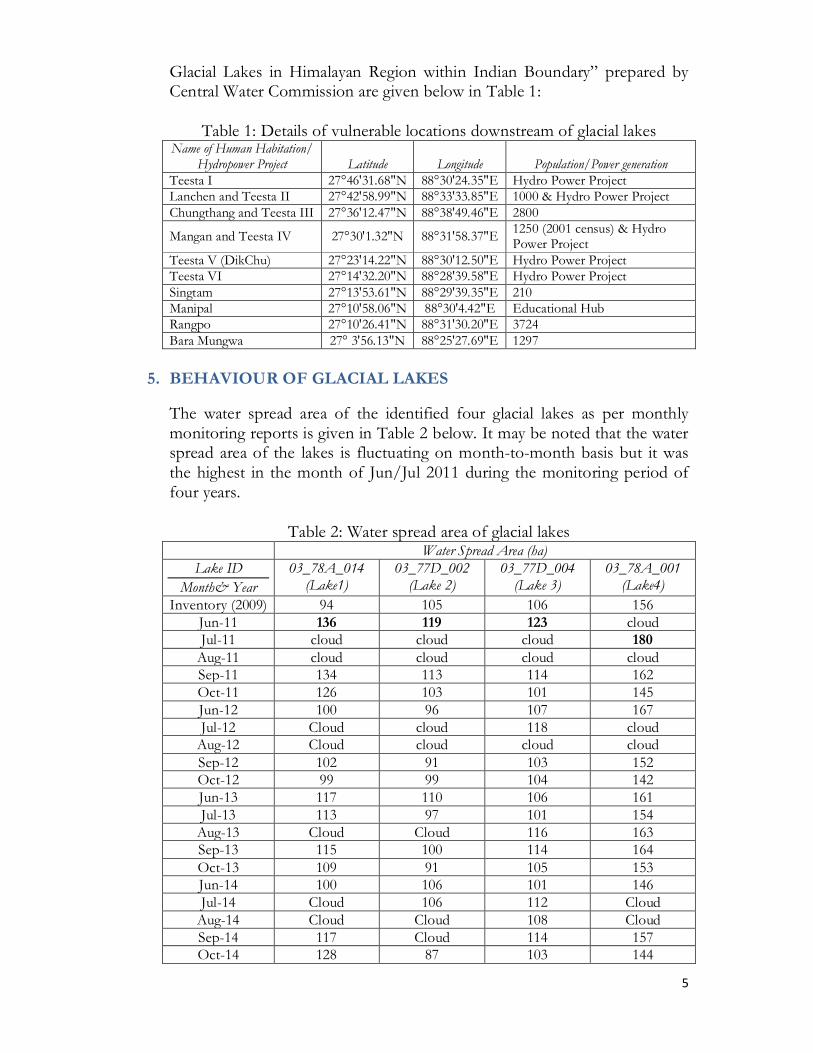
Glacial Lakes in Himalayan Region within Indian Boundary” prepared by Central Water Commission are given below in Table 1:
Table 1: Details of vulnerable locations downstream of glacial lakes Name of Human Habitation/
Hydropower Project Latitude Longitude Population/Power generation Teesta I 27°46'31.68"N 88°30'24.35"E Hydro Power Project Lanchen and Teesta II 27°42'58.99"N 88°33'33.85"E 1000 & Hydro Power Project Chungthang and Teesta III 27°36'12.47"N 88°38'49.46"E 2800
Mangan and Teesta IV 27°30'1.32"N 88°31'58.37"E 1250 (2001 census) & Hydro Power Project
Teesta V (DikChu) 27°23'14.22"N 88°30'12.50"E Hydro Power Project Teesta VI 27°14'32.20"N 88°28'39.58"E Hydro Power Project Singtam 27°13'53.61"N 88°29'39.35"E 210 Manipal 27°10'58.06"N 88°30'4.42"E Educational Hub Rangpo 27°10'26.41"N 88°31'30.20"E 3724 Bara Mungwa 27° 3'56.13"N 88°25'27.69"E 1297
5. BEHAVIOUR OF GLACIAL LAKES
The water spread area of the identified four glacial lakes as per monthly monitoring reports is given in Table 2 below. It may be noted that the water spread area of the lakes is fluctuating on month-to-month basis but it was the highest in the month of Jun/Jul 2011 during the monitoring period of four years.
Table 2: Water spread area of glacial lakes Water Spread Area (ha)
Lake ID Month& Year
03_78A_014 (Lake1)
03_77D_002 (Lake 2)
03_77D_004 (Lake 3)
03_78A_001 (Lake4)
Inventory (2009) 94 105 106 156 Jun-11 136 119 123 cloud Jul-11 cloud cloud cloud 180
Aug-11 cloud cloud cloud cloud Sep-11 134 113 114 162 Oct-11 126 103 101 145 Jun-12 100 96 107 167 Jul-12 Cloud cloud 118 cloud
Aug-12 Cloud cloud cloud cloud Sep-12 102 91 103 152 Oct-12 99 99 104 142 Jun-13 117 110 106 161 Jul-13 113 97 101 154
Aug-13 Cloud Cloud 116 163 Sep-13 115 100 114 164 Oct-13 109 91 105 153 Jun-14 100 106 101 146 Jul-14 Cloud 106 112 Cloud
Aug-14 Cloud Cloud 108 Cloud Sep-14 117 Cloud 114 157 Oct-14 128 87 103 144
6
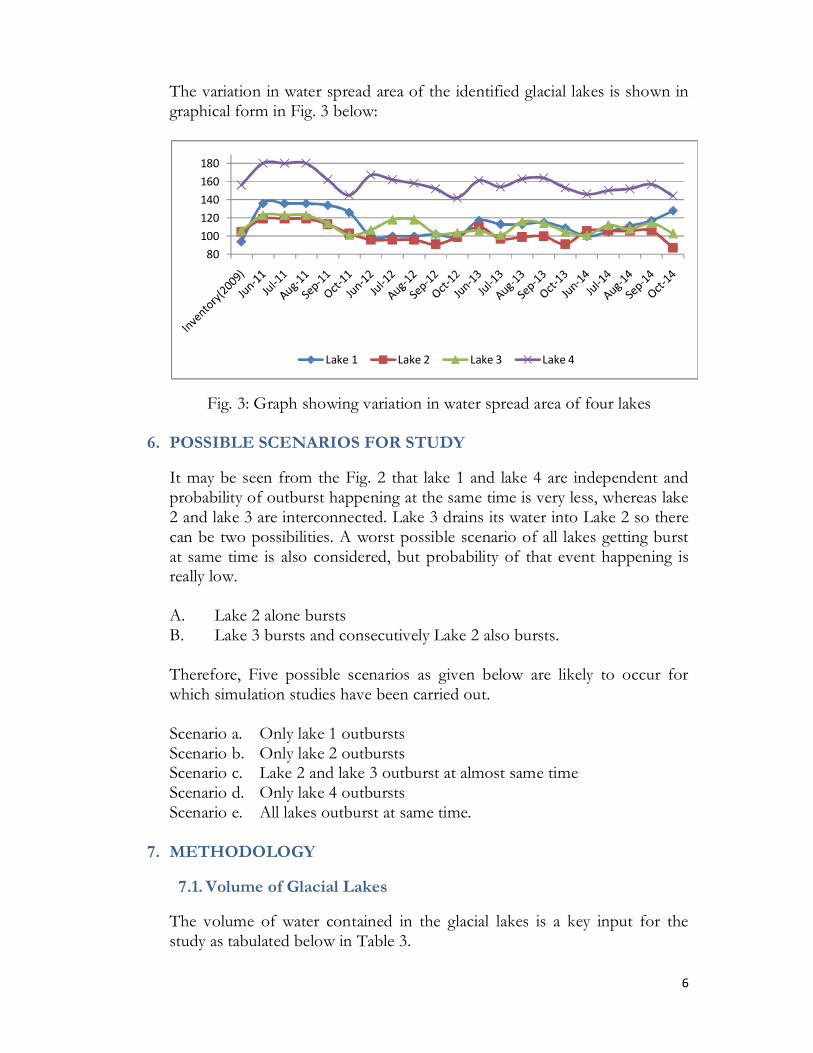
The variation in water spread area of the identified glacial lakes is shown in graphical form in Fig. 3 below:
Fig. 3: Graph showing variation in water spread area of four lakes
6. POSSIBLE SCENARIOS FOR STUDY
It may be seen from the Fig. 2 that lake 1 and lake 4 are independent and probability of outburst happening at the same time is very less, whereas lake 2 and lake 3 are interconnected. Lake 3 drains its water into Lake 2 so there can be two possibilities. A worst possible scenario of all lakes getting burst at same time is also considered, but probability of that event happening is really low. A. Lake 2 alone bursts B. Lake 3 bursts and consecutively Lake 2 also bursts. Therefore, Five possible scenarios as given below are likely to occur for which simulation studies have been carried out. Scenario a. Only lake 1 outbursts Scenario b. Only lake 2 outbursts Scenario c. Lake 2 and lake 3 outburst at almost same time Scenario d. Only lake 4 outbursts Scenario e. All lakes outburst at same time.
7. METHODOLOGY
7.1. Volume of Glacial Lakes
The volume of water contained in the glacial lakes is a key input for the study as tabulated below in Table 3.
80100120140160180
Lake 1 Lake 2 Lake 3 Lake 4
7
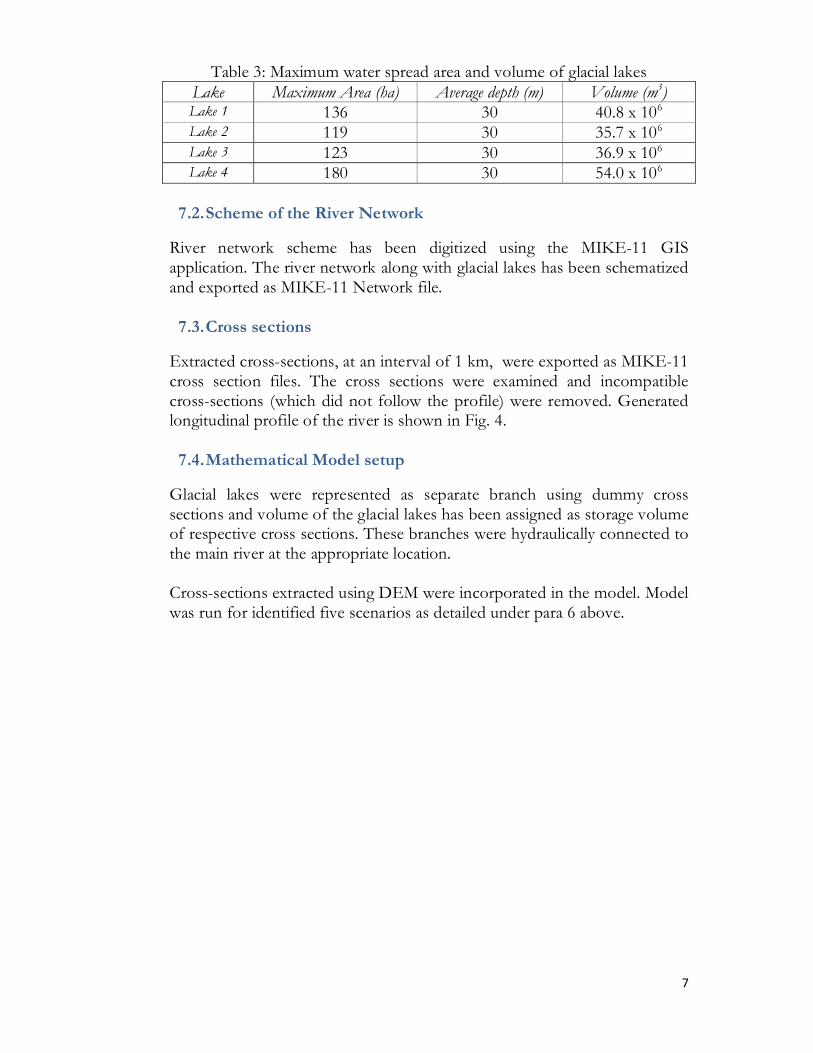
Table 3: Maximum water spread area and volume of glacial lakes Lake Maximum Area (ha) Average depth (m) Volume (m3) Lake 1 136 30 40.8 x 10⁶ Lake 2 119 30 35.7 x 10⁶ Lake 3 123 30 36.9 x 10⁶ Lake 4 180 30 54.0 x 10⁶
7.2. Scheme of the River Network
River network scheme has been digitized using the MIKE-11 GIS application. The river network along with glacial lakes has been schematized and exported as MIKE-11 Network file.
7.3. Cross sections
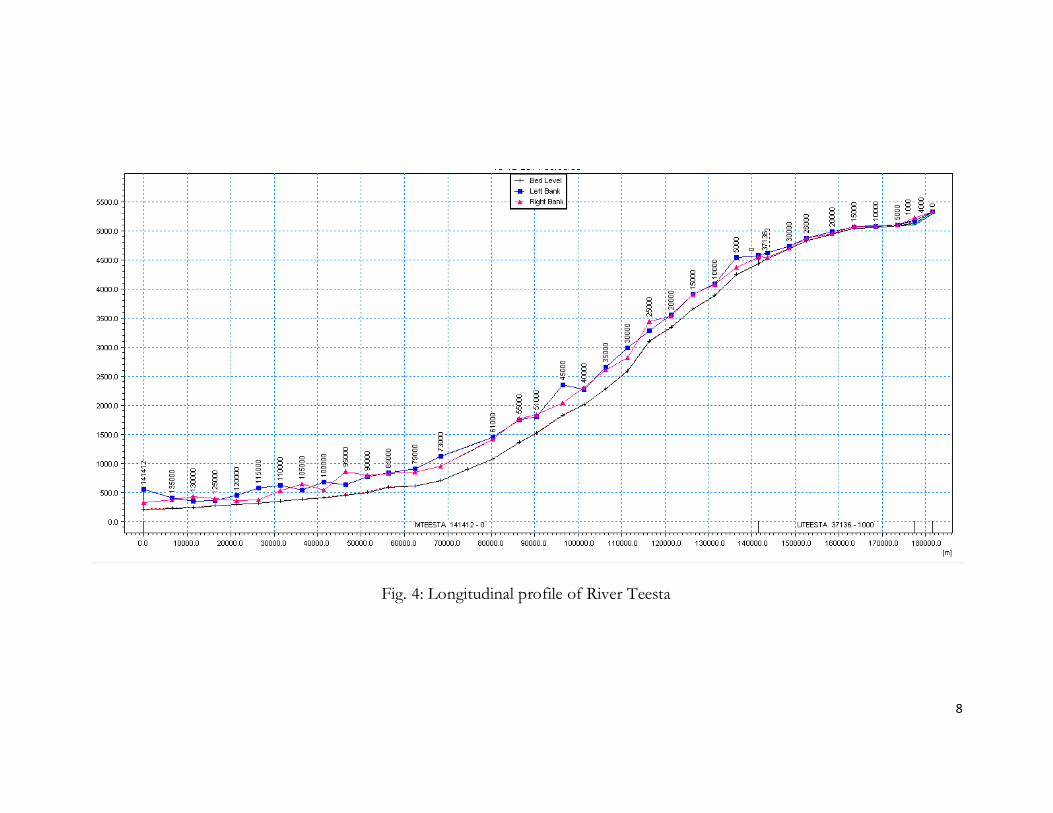
Extracted cross-sections, at an interval of 1 km, were exported as MIKE-11 cross section files. The cross sections were examined and incompatible cross-sections (which did not follow the profile) were removed. Generated longitudinal profile of the river is shown in Fig. 4.
7.4. Mathematical Model setup
Glacial lakes were represented as separate branch using dummy cross sections and volume of the glacial lakes has been assigned as storage volume of respective cross sections. These branches were hydraulically connected to the main river at the appropriate location. Cross-sections extracted using DEM were incorporated in the model. Model was run for identified five scenarios as detailed under para 6 above.
8
Fig. 4: Longitudinal profile of River Teesta
9
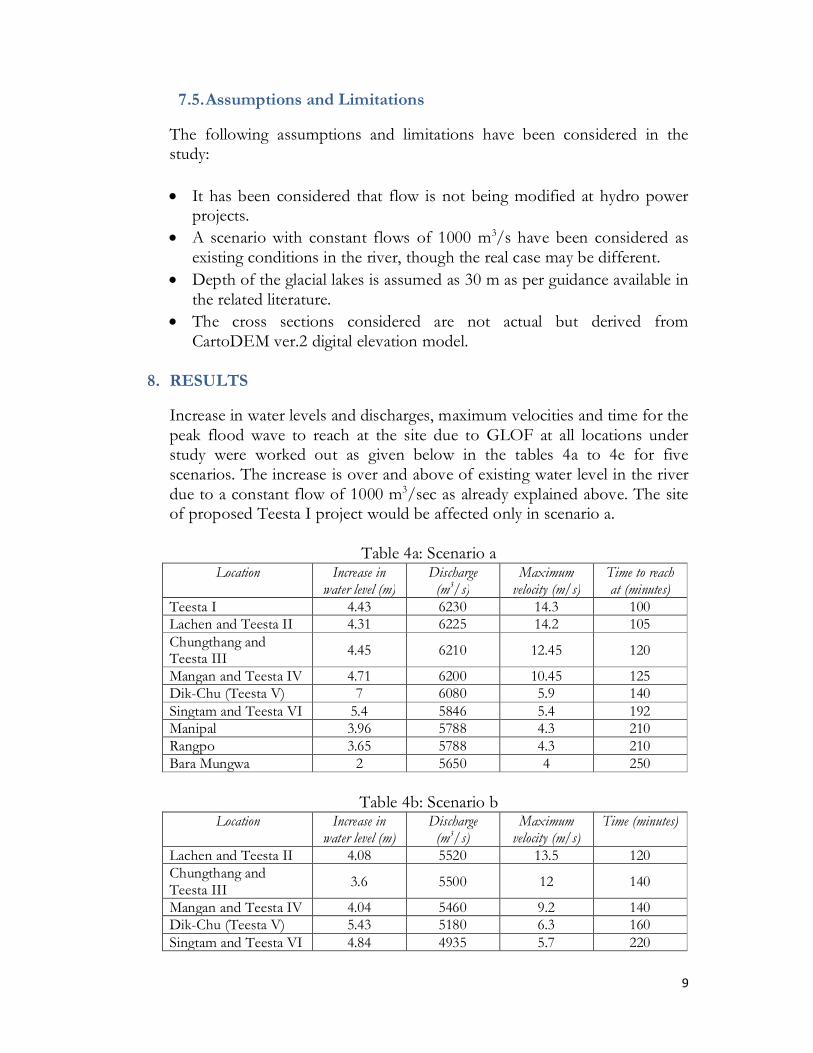
7.5. Assumptions and Limitations
The following assumptions and limitations have been considered in the study: • It has been considered that flow is not being modified at hydro power
projects. • A scenario with constant flows of 1000 m3/s have been considered as
existing conditions in the river, though the real case may be different. • Depth of the glacial lakes is assumed as 30 m as per guidance available in
the related literature. • The cross sections considered are not actual but derived from
CartoDEM ver.2 digital elevation model.
8. RESULTS
Increase in water levels and discharges, maximum velocities and time for the peak flood wave to reach at the site due to GLOF at all locations under study were worked out as given below in the tables 4a to 4e for five scenarios. The increase is over and above of existing water level in the river due to a constant flow of 1000 m3/sec as already explained above. The site of proposed Teesta I project would be affected only in scenario a.
Table 4a: Scenario a Location Increase in
water level (m) Discharge
(m3/s) Maximum
velocity (m/s) Time to reach at (minutes)
Teesta I 4.43 6230 14.3 100 Lachen and Teesta II 4.31 6225 14.2 105 Chungthang and Teesta III 4.45 6210 12.45 120
Mangan and Teesta IV 4.71 6200 10.45 125 Dik-Chu (Teesta V) 7 6080 5.9 140 Singtam and Teesta VI 5.4 5846 5.4 192 Manipal 3.96 5788 4.3 210 Rangpo 3.65 5788 4.3 210 Bara Mungwa 2 5650 4 250
Table 4b: Scenario b
Location Increase in water level (m)
Discharge (m3/s)
Maximum velocity (m/s)
Time (minutes)
Lachen and Teesta II 4.08 5520 13.5 120 Chungthang and Teesta III 3.6 5500 12 140
Mangan and Teesta IV 4.04 5460 9.2 140 Dik-Chu (Teesta V) 5.43 5180 6.3 160 Singtam and Teesta VI 4.84 4935 5.7 220

10
Location Increase in water level (m)
Discharge (m3/s)
Maximum velocity (m/s)
Time (minutes)
Manipal 3.38 4800 4.5 260 Rangpo 3.28 4770 4.1 260 Bara Mungwa 2.37 4640 3.5 280
Table 4c: Scenario c Location Increase in
water level (m) Discharge
(m3/s) Maximum
velocity (m/s) Time (minutes)
Lachen and Teesta II 7.51 11810 18.3 120 Chungthang and Teesta III 7.03 11600 16.5 120
Mangan and Teesta IV 7.64 11500 12.2 140 Dik-Chu (Teesta V) 8.87 10800 8.2 160 Singtam and Teesta VI 8.29 10250 7.35 200 Manipal 6.15 9900 5.4 220 Rangpo 5.81 9820 5.2 220 Bara Mungwa 4.21 9080 4.5 260
Table 4d: Scenario d Location Increase in
water level (m) Discharge
(m3/s) Maximum
velocity (m/s) Time (minutes)
Lachen and Teesta II 4.4 6090 14.1 180 Chungthang and Teesta III 4.11 6070 12.8 190
Mangan and Teesta IV 4.49 6050 9.5 190 Dik-Chu (Teesta V) 6.04 5900 6.6 220 Singtam and Teesta VI 5.55 5690 6 270 Manipal 3.85 5630 4.4 290 Rangpo 3.78 5600 4.1 290 Bara Mungwa 2.87 5490 3.5 330
Table 4e: Scenario e Location Increase in
water level (m) Discharge
(m3/s) Maximum
velocity (m/s) Time to reach at (minutes)
Teesta I 4.43 6230 14.3 100 Lachen and Teesta II 12.65 30520 29.64 115 Chungthang and Teesta III 12.78 30430 25.96 125
Mangan and Teesta IV 13.25 30400 21.52 130 Dik-Chu (Teesta V) 15.24 30110 16.20 135 Singtam and Teesta VI 13.51 28900 11.241 165 Manipal 13.48 28215 8.98 172 Rangpo 13.45 28180 8.25 176 Bara Mungwa 12.71 26149 7.2 195
11
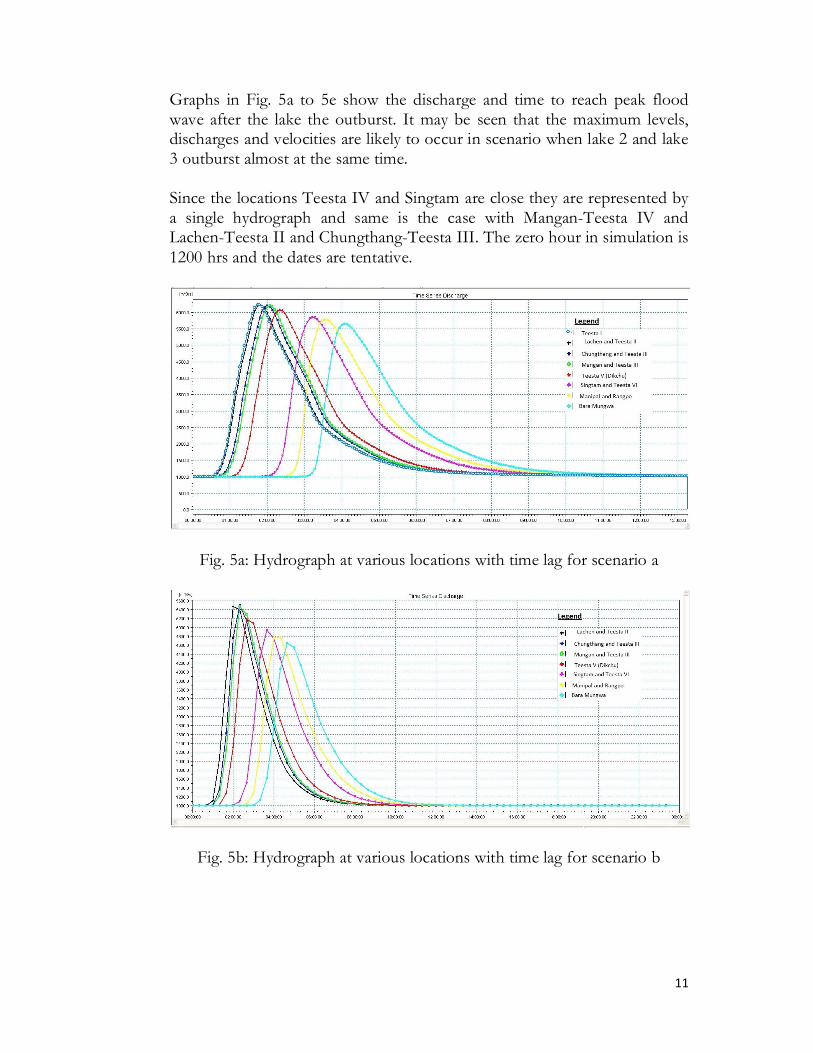
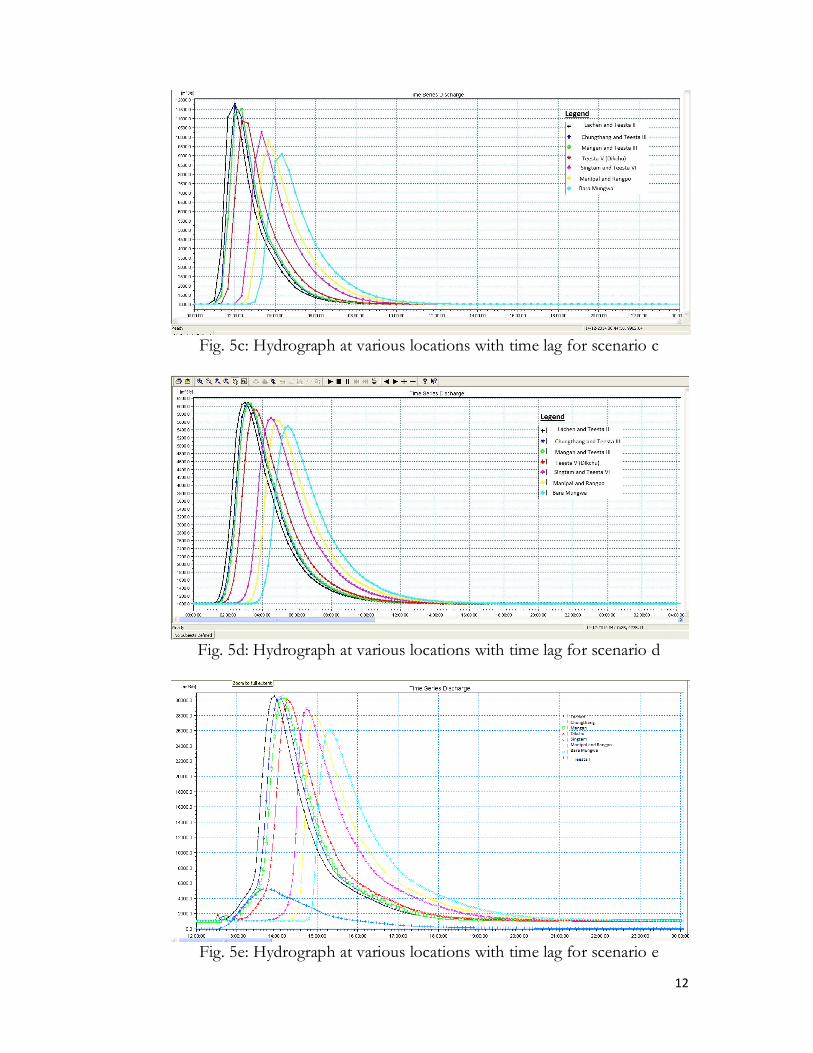
Graphs in Fig. 5a to 5e show the discharge and time to reach peak flood wave after the lake the outburst. It may be seen that the maximum levels, discharges and velocities are likely to occur in scenario when lake 2 and lake 3 outburst almost at the same time. Since the locations Teesta IV and Singtam are close they are represented by a single hydrograph and same is the case with Mangan-Teesta IV and Lachen-Teesta II and Chungthang-Teesta III. The zero hour in simulation is 1200 hrs and the dates are tentative.
Fig. 5a: Hydrograph at various locations with time lag for scenario a
Fig. 5b: Hydrograph at various locations with time lag for scenario b
12
Fig. 5c: Hydrograph at various locations with time lag for scenario c
Fig. 5d: Hydrograph at various locations with time lag for scenario d
Fig. 5e: Hydrograph at various locations with time lag for scenario e
13
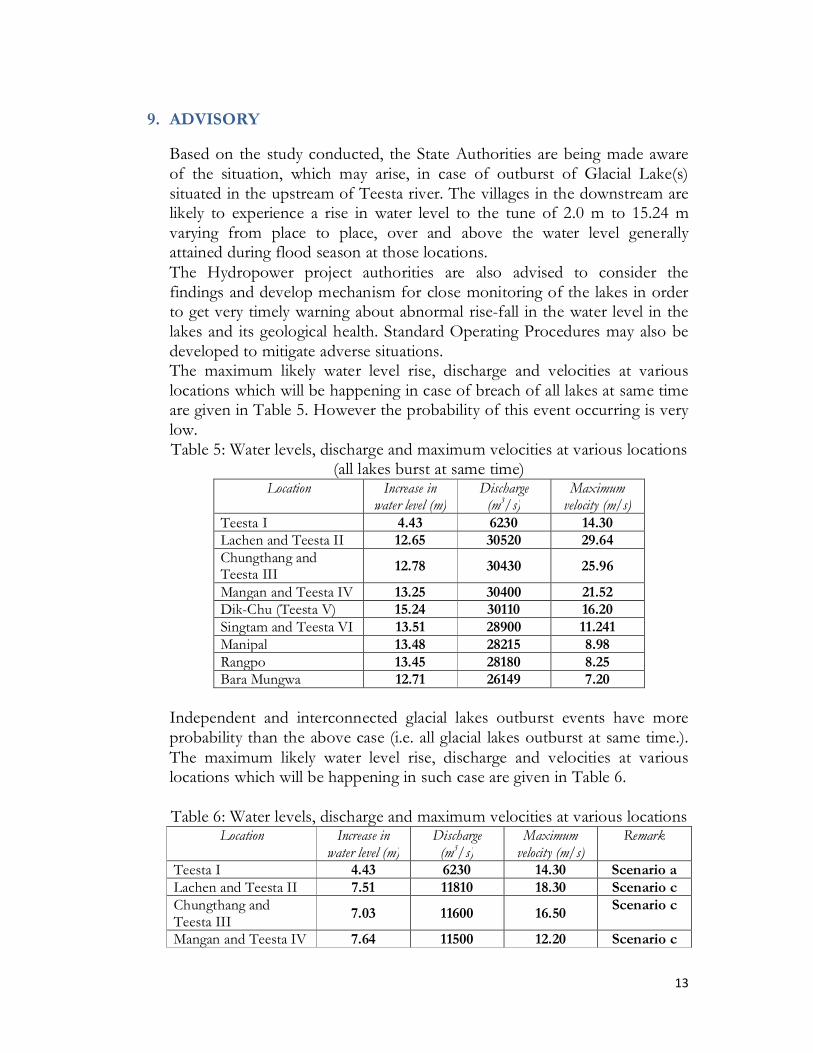
9. ADVISORY
Based on the study conducted, the State Authorities are being made aware of the situation, which may arise, in case of outburst of Glacial Lake(s) situated in the upstream of Teesta river. The villages in the downstream are likely to experience a rise in water level to the tune of 2.0 m to 15.24 m varying from place to place, over and above the water level generally attained during flood season at those locations. The Hydropower project authorities are also advised to consider the findings and develop mechanism for close monitoring of the lakes in order to get very timely warning about abnormal rise-fall in the water level in the lakes and its geological health. Standard Operating Procedures may also be developed to mitigate adverse situations. The maximum likely water level rise, discharge and velocities at various locations which will be happening in case of breach of all lakes at same time are given in Table 5. However the probability of this event occurring is very low. Table 5: Water levels, discharge and maximum velocities at various locations
(all lakes burst at same time) Location Increase in
water level (m) Discharge
(m3/s) Maximum
velocity (m/s) Teesta I 4.43 6230 14.30 Lachen and Teesta II 12.65 30520 29.64 Chungthang and Teesta III 12.78 30430 25.96
Mangan and Teesta IV 13.25 30400 21.52 Dik-Chu (Teesta V) 15.24 30110 16.20 Singtam and Teesta VI 13.51 28900 11.241 Manipal 13.48 28215 8.98 Rangpo 13.45 28180 8.25 Bara Mungwa 12.71 26149 7.20
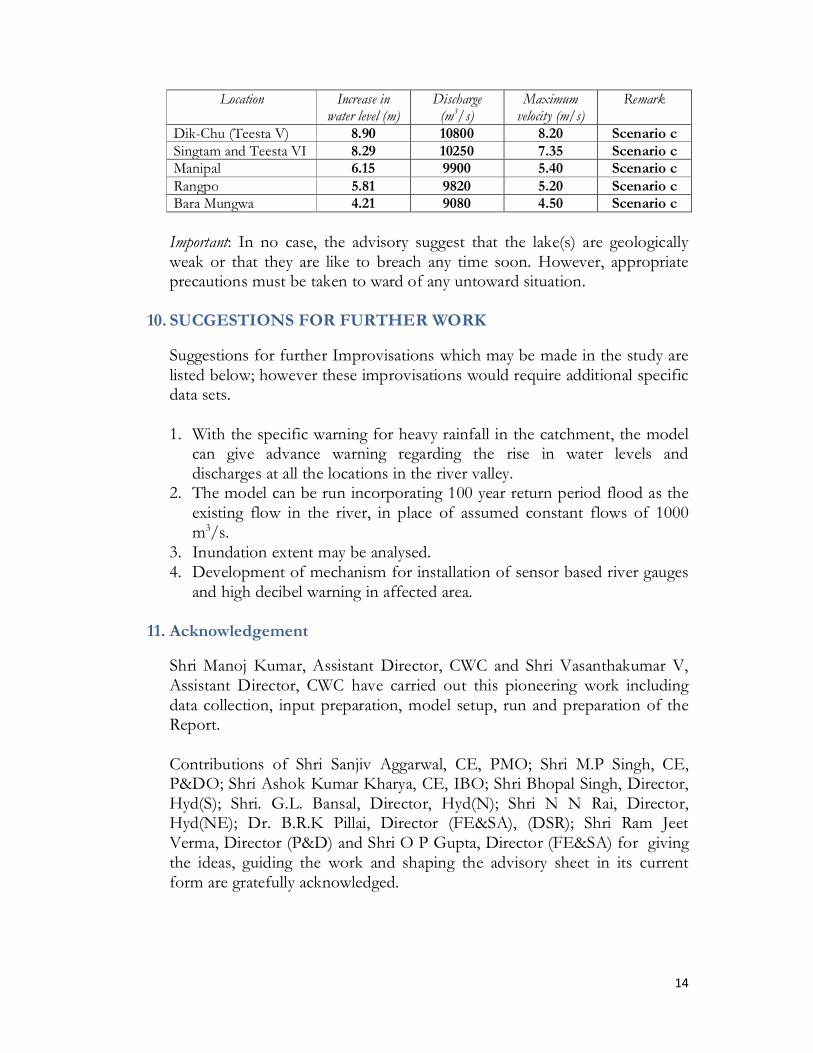
Independent and interconnected glacial lakes outburst events have more probability than the above case (i.e. all glacial lakes outburst at same time.). The maximum likely water level rise, discharge and velocities at various locations which will be happening in such case are given in Table 6. Table 6: Water levels, discharge and maximum velocities at various locations
Location Increase in water level (m)
Discharge (m3/s)
Maximum velocity (m/s)
Remark
Teesta I 4.43 6230 14.30 Scenario a Lachen and Teesta II 7.51 11810 18.30 Scenario c Chungthang and Teesta III 7.03 11600 16.50 Scenario c
Mangan and Teesta IV 7.64 11500 12.20 Scenario c
14
Location Increase in water level (m)
Discharge (m3/s)
Maximum velocity (m/s)
Remark
Dik-Chu (Teesta V) 8.90 10800 8.20 Scenario c Singtam and Teesta VI 8.29 10250 7.35 Scenario c Manipal 6.15 9900 5.40 Scenario c Rangpo 5.81 9820 5.20 Scenario c Bara Mungwa 4.21 9080 4.50 Scenario c Important: In no case, the advisory suggest that the lake(s) are geologically weak or that they are like to breach any time soon. However, appropriate precautions must be taken to ward of any untoward situation.
10. SUCGESTIONS FOR FURTHER WORK
Suggestions for further Improvisations which may be made in the study are listed below; however these improvisations would require additional specific data sets. 1. With the specific warning for heavy rainfall in the catchment, the model
can give advance warning regarding the rise in water levels and discharges at all the locations in the river valley.
2. The model can be run incorporating 100 year return period flood as the existing flow in the river, in place of assumed constant flows of 1000 m3/s.
3. Inundation extent may be analysed. 4. Development of mechanism for installation of sensor based river gauges
and high decibel warning in affected area.
11. Acknowledgement
Shri Manoj Kumar, Assistant Director, CWC and Shri Vasanthakumar V, Assistant Director, CWC have carried out this pioneering work including data collection, input preparation, model setup, run and preparation of the Report. Contributions of Shri Sanjiv Aggarwal, CE, PMO; Shri M.P Singh, CE, P&DO; Shri Ashok Kumar Kharya, CE, IBO; Shri Bhopal Singh, Director, Hyd(S); Shri. G.L. Bansal, Director, Hyd(N); Shri N N Rai, Director, Hyd(NE); Dr. B.R.K Pillai, Director (FE&SA), (DSR); Shri Ram Jeet Verma, Director (P&D) and Shri O P Gupta, Director (FE&SA) for giving the ideas, guiding the work and shaping the advisory sheet in its current form are gratefully acknowledged.

15
12. Reference
(i) Inventory of Glacial Lakes/Water Bodies in the Himalayan region of Indian River Basin by CWC in association with NRSC, Hyderabad.
(ii) Monthly Monitoring reports of the Glacial Lakes/Water Bodies in the Himalayan region of Indian River Basin by CWC in association with NRSC, Hyderabad.
(iii) Report on the Prioritization of Glacial Lakes/Water Bodies in the Himalayan region of Indian River Basin prepared by CWC.
(iv) ICIMOD guidelines on depth of glacial lakes in Nepal and Bhutan.
PLANNING AND DEVELOPMENT DIRECTORATE RIVER MANAGEMENT WING CENTRAL WATER COMMISSION WING 7, GROUND FLOOR, WEST BLOCK-II R K PURAM NEW DELHI -110066 www.cwc.nic.in