globalsantafe corporation -...
TRANSCRIPT
GlobalSantaFe corporation AnnuAl report 2006
letter to SHAreHolDerS
During 2006, our people worked safer and our
operations were more profitable than they have ever
been. It was the most successful year in GlobalSan-
taFe’s history by almost any measure, and we have
every reason to expect even better results in 2007.
Robust demand for offshore contract drilling
services outstripped the supply of rigs, creating a
market imbalance throughout 2006 that produced
continued high utilization and record-high dayrates
for every class of equipment in our worldwide
fleet. We reported net income of more than $1
billion and more than doubled our contract drilling
revenue backlog to nearly $11 billion during the
year, as we secured more long-term contracts at
leading-edge rates.
This strong financial performance resulted in a
2006 total shareholder return of 24 percent – the
best in our peer group – aided by share repur-
chases during the year in excess of $1 billion
and dividends in excess of $200 million. While
our preference is to grow our earnings capability
through acquisition or construction of additional
rigs, to the extent we are unable to prudently rein-
vest our capital, we remain committed to returning
excess cash to our shareholders through share
repurchases and regular quarterly dividends.
Our contract drilling operations have continued
to benefit in early 2007 from strong demand and
high dayrates for jackup and floating rigs in every
market except the U.S. Gulf of Mexico jackup
market, where we have reduced our jackup fleet
to only three rigs. While we remain cautious about
the impact of future jackup capacity increases,
our outlook remains strong for the remainder of
this year, and we’re optimistic beyond that, given
that it will take an annualized demand increase of
only about 6 percent to balance jackup markets
through 2009. The continued strong demand for
deepwater semisubmersibles and drillships gives
us confidence in the long-term outlook for this
market, despite the industry’s planned newbuild
deliveries through 2010.
The greatest immediate challenge we face during
this period of worldwide fleet expansion is to retain,
attract and develop our people while managing
costs and continuing to improve customer service
and safety performance. We have made significant
investments in, and remain focused on, these critical
areas, and I am confident of our continued success.
The fundamental economic and political drivers that
created this very positive market environment are
still in place. Sustained world economic growth,
particularly in the developing economies, contin-
ues to drive hydrocarbon demand, while oil and
gas producers are struggling to add incremental
production in the face of accelerated depletion of
existing reservoirs and growing geopolitical tensions.
As a consequence, we anticipate our customer
base will be compelled to increase capital spending
to meet the growing world energy demand.
We were pleased to add W. Richard Anderson to
our board last September and look forward to his
continued contributions; however, we will miss the
talents and wise counsel of directors Ferdinand A.
Berger and Paul J. Powers, whose many years of
valuable service to our company will end when their
terms expire in June 2007. GlobalSantaFe’s future
remains very bright, and I am confident that we have
the people, the resolve and the financial strength to
capitalize on the opportunities ahead.
On behalf of our board of directors and the 7,600
men and women of GlobalSantaFe, I thank you for
your continued support.
Jon A. MarshallPresident and CEO12 March 2007
GlobalSantaFe Corporation
15375 Memorial Drive
Houston, Texas 77079-4101
www.globalsantafe.com
Glo
balS
antaFe Co
rpo
ration A
NN
UA
L RE
PO
RT 2
00
6
C
M
Y
CM
MY
CY
CMY
K
GSF 2006AR_Spine Art.pdf 4/13/07 5:27:52 PM
4
17 35
5
2
436
1
25
3
13
12
9
33
10
31
20
30
29
5556
7
8
1819
14 15
16
2122
23
28
37
41
39
4226
40
49
48
53
58
60
34 3611
4546 44
47 5759
50
51
52
54
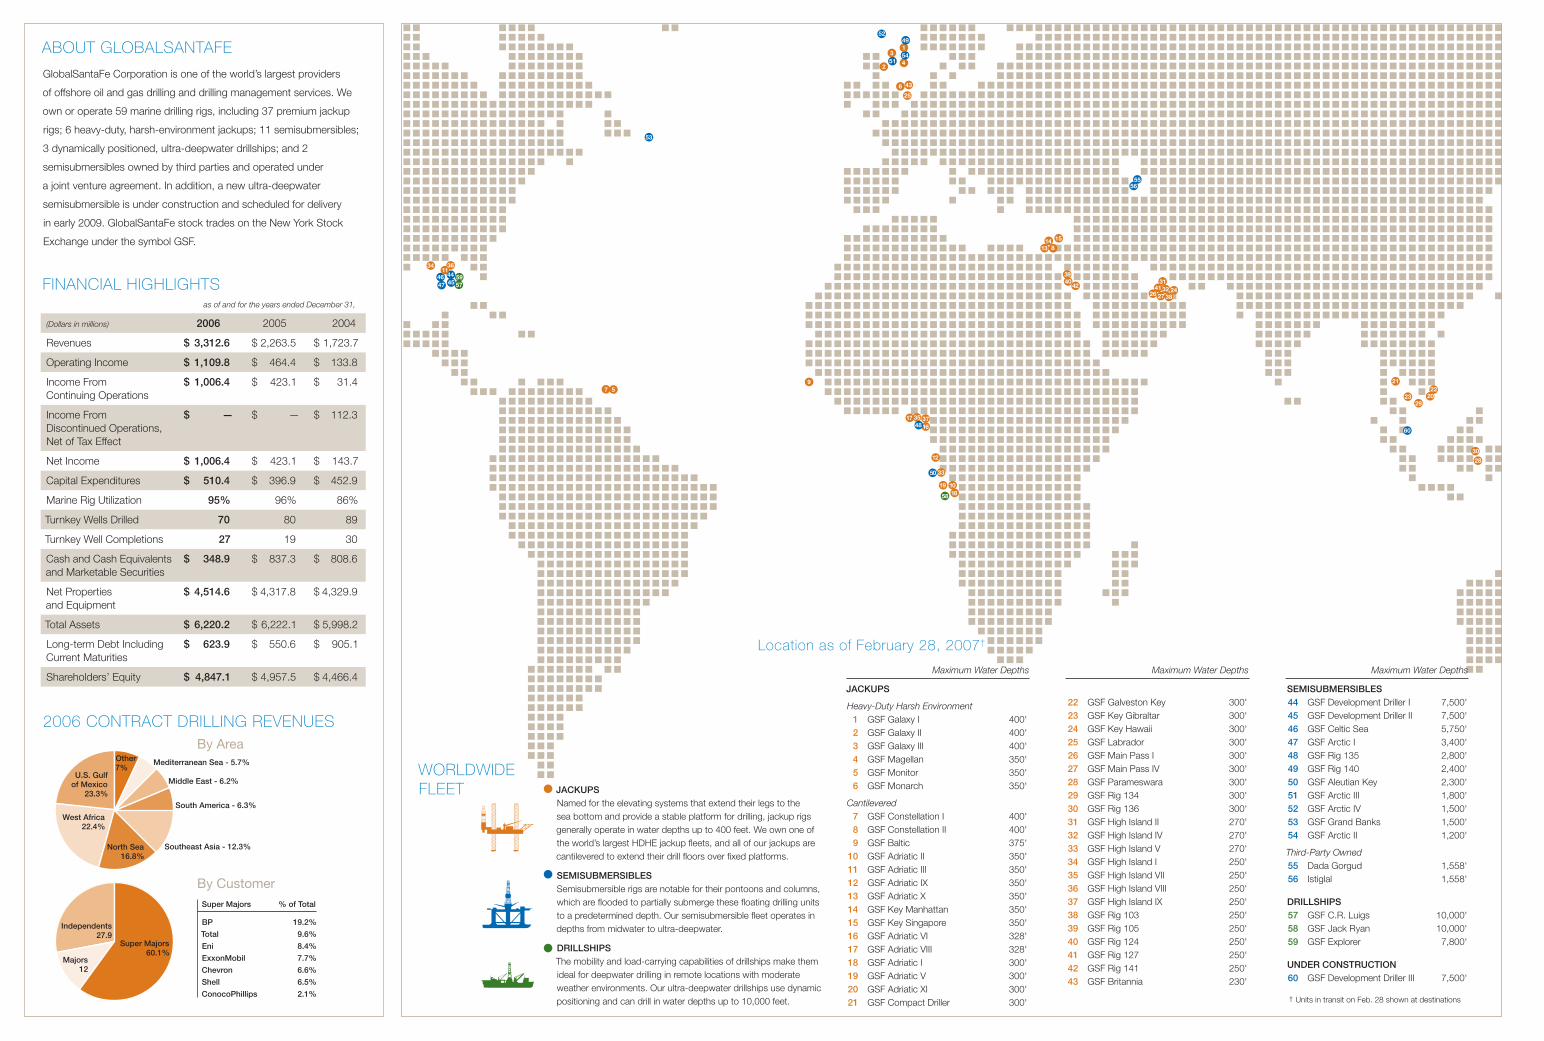
as of and for the years ended December 31,
(Dollars in millions) 2006 2005 2004
Revenues $ 3,312.6 $ 2,263.5 $ 1,723.7
Operating Income $ 1,109.8 $ 464.4 $ 133.8
Income From Continuing Operations
$ 1,006.4 $ 423.1 $ 31.4
Income From Discontinued Operations, Net of Tax Effect
$ — $ — $ 112.3
Net Income $ 1,006.4 $ 423.1 $ 143.7
Capital Expenditures $ 510.4 $ 396.9 $ 452.9
Marine Rig Utilization 95% 96% 86%
Turnkey Wells Drilled 70 80 89
Turnkey Well Completions 27 19 30
Cash and Cash Equivalents and Marketable Securities
$ 348.9 $ 837.3 $ 808.6
Net Properties and Equipment
$ 4,514.6 $ 4,317.8 $ 4,329.9
Total Assets $ 6,220.2 $ 6,222.1 $ 5,998.2
Long-term Debt Including Current Maturities
$ 623.9 $ 550.6 $ 905.1
Shareholders’ Equity $ 4,847.1 $ 4,957.5 $ 4,466.4
About GlobAlSAntAFe
GlobalSantaFe Corporation is one of the world’s largest providers
of offshore oil and gas drilling and drilling management services. We
own or operate 59 marine drilling rigs, including 37 premium jackup
rigs; 6 heavy-duty, harsh-environment jackups; 11 semisubmersibles;
3 dynamically positioned, ultra-deepwater drillships; and 2
semisubmersibles owned by third parties and operated under
a joint venture agreement. In addition, a new ultra-deepwater
semisubmersible is under construction and scheduled for delivery
in early 2009. GlobalSantaFe stock trades on the New York Stock
Exchange under the symbol GSF.
FinAnciAl HiGHliGHtS
2006 contrAct DrillinG revenueS
West Africa22.4%
U.S. Gulf of Mexico
23.3%
North Sea 16.8%
Southeast Asia - 12.3%
Other7%
South America - 6.3%
Middle East - 6.2%
Mediterranean Sea - 5.7%
Super Majors60.1%
Independents27.9
Majors12
Super Majors % of Total
BP 19.2%
Total 9.6%
Eni 8.4%
ExxonMobil 7.7%
Chevron 6.6%
Shell 6.5%
ConocoPhillips 2.1%
By Area
By Customer
WorlDWiDe Fleet
JACkUPS
Heavy-Duty Harsh Environment 1 GSF Galaxy I 400' 2 GSF Galaxy II 400' 3 GSF Galaxy III 400' 4 GSF Magellan 350' 5 GSF Monitor 350' 6 GSF Monarch 350'
Cantilevered 7 GSF Constellation I 400' 8 GSF Constellation II 400' 9 GSF Baltic 375' 10 GSF Adriatic II 350' 11 GSF Adriatic III 350' 12 GSF Adriatic IX 350' 13 GSF Adriatic X 350' 14 GSF Key Manhattan 350' 15 GSF Key Singapore 350' 16 GSF Adriatic VI 328' 17 GSF Adriatic VIII 328' 18 GSF Adriatic I 300' 19 GSF Adriatic V 300' 20 GSF Adriatic XI 300' 21 GSF Compact Driller 300'
22 GSF Galveston Key 300' 23 GSF Key Gibraltar 300' 24 GSF Key Hawaii 300' 25 GSF Labrador 300' 26 GSF Main Pass I 300' 27 GSF Main Pass IV 300' 28 GSF Parameswara 300' 29 GSF Rig 134 300' 30 GSF Rig 136 300' 31 GSF High Island II 270' 32 GSF High Island IV 270' 33 GSF High Island V 270' 34 GSF High Island I 250' 35 GSF High Island VII 250' 36 GSF High Island VIII 250' 37 GSF High Island IX 250' 38 GSF Rig 103 250' 39 GSF Rig 105 250' 40 GSF Rig 124 250' 41 GSF Rig 127 250' 42 GSF Rig 141 250' 43 GSF Britannia 230'
SEMISUBMErSIBlES 44 GSF Development Driller I 7,500' 45 GSF Development Driller II 7,500' 46 GSF Celtic Sea 5,750' 47 GSF Arctic I 3,400' 48 GSF Rig 135 2,800' 49 GSF Rig 140 2,400' 50 GSF Aleutian Key 2,300' 51 GSF Arctic III 1,800' 52 GSF Arctic IV 1,500' 53 GSF Grand Banks 1,500' 54 GSF Arctic II 1,200'
Third-Party Owned 55 Dada Gorgud 1,558' 56 Istiglal 1,558'
DrIllShIPS 57 GSF C.R. Luigs 10,000' 58 GSF Jack Ryan 10,000' 59 GSF Explorer 7,800'
UNDEr CONSTrUCTION 60 GSF Development Driller III 7,500'
† Units in transit on Feb. 28 shown at destinations
Maximum Water Depths Maximum Water Depths Maximum Water Depths
JACkUPSNamed for the elevating systems that extend their legs to the sea bottom and provide a stable platform for drilling, jackup rigs generally operate in water depths up to 400 feet. We own one of the world’s largest HDHE jackup fleets, and all of our jackups are cantilevered to extend their drill floors over fixed platforms.
SEMISUBMErSIBlESSemisubmersible rigs are notable for their pontoons and columns, which are flooded to partially submerge these floating drilling units to a predetermined depth. Our semisubmersible fleet operates in depths from midwater to ultra-deepwater.
DrIllShIPSThe mobility and load-carrying capabilities of drillships make them ideal for deepwater drilling in remote locations with moderate weather environments. Our ultra-deepwater drillships use dynamic positioning and can drill in water depths up to 10,000 feet.
location as of February 28, 2007†
24323827
Printed on Recycled Paper. FSC Certified.
corporAte inFormAtion
Executive Office
GlobalSantaFe Corporation
15375 Memorial Drive
Houston, Texas 77079-4101
Telephone: 281.925.6000
www.globalsantafe.com
regional Offices
GlobalSantaFe Aberdeen
Langlands House
Huntly Street
Aberdeen AB10 1SH, Scotland
GlobalSantaFe Angola
Travessa Nicolau Castelo Branco, No. 22/24
Bairro Maculusso
Municipo da Ingombota
Luanda, Angola
GlobalSantaFe Egypt
Kilometer No. 11
Kattameya – Ein Soukhna
Desert Road
P.O. Box 341
Cairo, Egypt
GlobalSantaFe France
16 Rue Clement Marot
75008 Paris, France
GlobalSantaFe Jakarta
Jalan Melawai IX / 2
P.O. Box 2351
Jakarta, Selatan, Indonesia
GlobalSantaFe Malaysia
9th Floor, Angkasa Raya Building
Jalan Ampang
50450 Kuala Lumpur
Malaysia
Investor relations Inquiries
Richard J. Hoffman
Vice President,
Investor Relations
Telephone: 281.925.6444
Subsidiary Offices
Applied Drilling Technology Inc.
Stephen E. Morrison, President
15375 Memorial Drive
Houston, Texas 77079-4101
Telephone: 281.925.7100
Challenger Minerals Inc.
Charles B. Hauf, President
15375 Memorial Drive
Houston, Texas 77079-4101
Telephone: 281.925.7200
registered Office
GlobalSantaFe Corporation
P.O. Box 309GT, Ugland House
South Church Street
George Town, Grand Cayman
Cayman Islands
Stock listing
New York Stock Exchange
Symbol: GSF
Stock Transfer Agent
and registrar
Computershare
P. O. Box 43078
Providence, RI 02940-3078
Toll Free: 1.877.273.7879
Auditors
PricewaterhouseCoopers LLP
Houston, Texas
Annual General Meeting
of Shareholders
June 7, 2007, 8:00 A.M. CDT
GlobalSantaFe Auditorium
15375 Memorial Drive
Houston, Texas 77079
Form 10-k
A copy of our 2006 Annual Report on
Form 10-K, as filed with the Securities and
Exchange Commission, will be furnished
without charge upon written request to:
Investor Relations, GlobalSantaFe
Corporation, 15375 Memorial
Drive, Houston, Texas, 77079-4101,
281.925.6444. Our 2006 Annual Report
on Form 10-K also is available on our Web
site at www.globalsantafe.com or from the
SEC’s EDGAR filings at www.sec.gov
Financial Information and
News releases
Information updates about us, including
quarterly financial results and current news
releases, are available to the public on our
Web site at www.globalsantafe.com or upon
request from the Company’s Investor Rela-
tions Department.
Forward looking Statements
The disclaimer regarding Forward Looking
Statements contained in the attached Form
10-K is incorporated herein by this reference.

GlobalSantaFe corporation AnnuAl report 2006
letter to SHAreHolDerS
During 2006, our people worked safer and our
operations were more profitable than they have ever
been. It was the most successful year in GlobalSan-
taFe’s history by almost any measure, and we have
every reason to expect even better results in 2007.
Robust demand for offshore contract drilling
services outstripped the supply of rigs, creating a
market imbalance throughout 2006 that produced
continued high utilization and record-high dayrates
for every class of equipment in our worldwide
fleet. We reported net income of more than $1
billion and more than doubled our contract drilling
revenue backlog to nearly $11 billion during the
year, as we secured more long-term contracts at
leading-edge rates.
This strong financial performance resulted in a
2006 total shareholder return of 24 percent – the
best in our peer group – aided by share repur-
chases during the year in excess of $1 billion
and dividends in excess of $200 million. While
our preference is to grow our earnings capability
through acquisition or construction of additional
rigs, to the extent we are unable to prudently rein-
vest our capital, we remain committed to returning
excess cash to our shareholders through share
repurchases and regular quarterly dividends.
Our contract drilling operations have continued
to benefit in early 2007 from strong demand and
high dayrates for jackup and floating rigs in every
market except the U.S. Gulf of Mexico jackup
market, where we have reduced our jackup fleet
to only three rigs. While we remain cautious about
the impact of future jackup capacity increases,
our outlook remains strong for the remainder of
this year, and we’re optimistic beyond that, given
that it will take an annualized demand increase of
only about 6 percent to balance jackup markets
through 2009. The continued strong demand for
deepwater semisubmersibles and drillships gives
us confidence in the long-term outlook for this
market, despite the industry’s planned newbuild
deliveries through 2010.
The greatest immediate challenge we face during
this period of worldwide fleet expansion is to retain,
attract and develop our people while managing
costs and continuing to improve customer service
and safety performance. We have made significant
investments in, and remain focused on, these critical
areas, and I am confident of our continued success.
The fundamental economic and political drivers that
created this very positive market environment are
still in place. Sustained world economic growth,
particularly in the developing economies, contin-
ues to drive hydrocarbon demand, while oil and
gas producers are struggling to add incremental
production in the face of accelerated depletion of
existing reservoirs and growing geopolitical tensions.
As a consequence, we anticipate our customer
base will be compelled to increase capital spending
to meet the growing world energy demand.
We were pleased to add W. Richard Anderson to
our board last September and look forward to his
continued contributions; however, we will miss the
talents and wise counsel of directors Ferdinand A.
Berger and Paul J. Powers, whose many years of
valuable service to our company will end when their
terms expire in June 2007. GlobalSantaFe’s future
remains very bright, and I am confident that we have
the people, the resolve and the financial strength to
capitalize on the opportunities ahead.
On behalf of our board of directors and the 7,600
men and women of GlobalSantaFe, I thank you for
your continued support.
Jon A. MarshallPresident and CEO12 March 2007
GlobalSantaFe Corporation
15375 Memorial Drive
Houston, Texas 77079-4101
www.globalsantafe.com
Glo
balS
antaFe Co
rpo
ration A
NN
UA
L RE
PO
RT 2
00
6
C
M
Y
CM
MY
CY
CMY
K
GSF 2006AR_Spine Art.pdf 4/13/07 5:27:52 PM
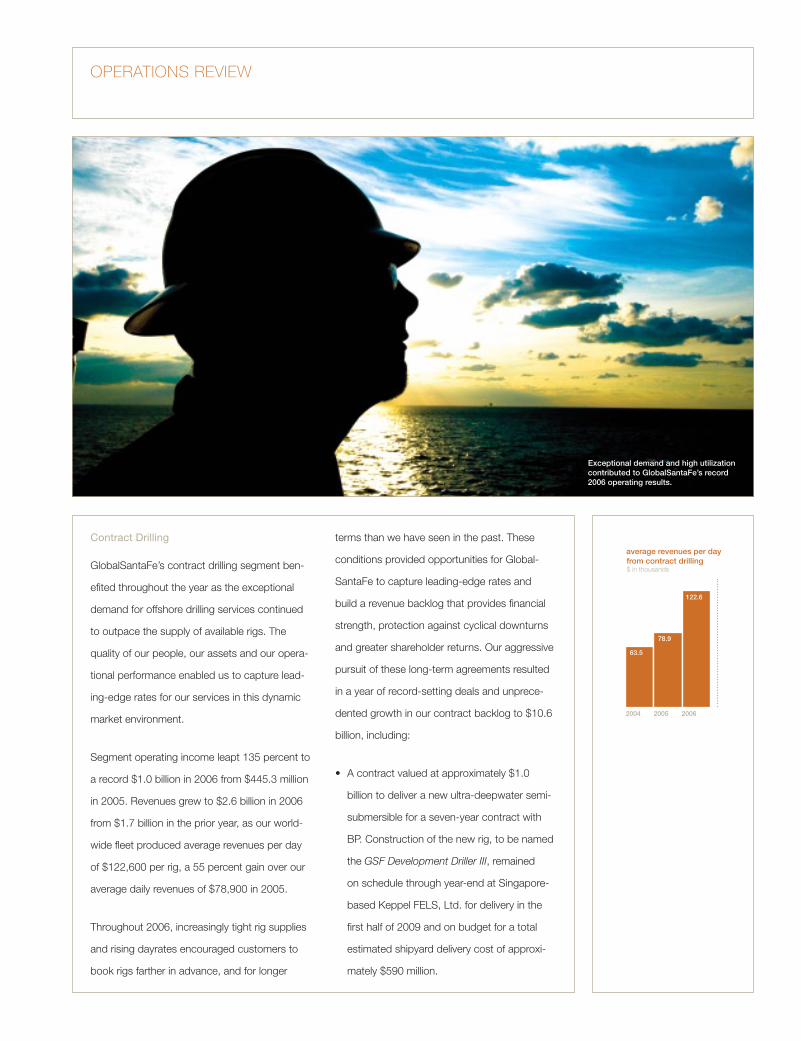
63.5
average revenues per day from contract drilling$ in thousands
2004 2005 2006
78.9
122.6
OperatiOns review
Contract Drilling
GlobalSantaFe’s contract drilling segment ben-
efited throughout the year as the exceptional
demand for offshore drilling services continued
to outpace the supply of available rigs. The
quality of our people, our assets and our opera-
tional performance enabled us to capture lead-
ing-edge rates for our services in this dynamic
market environment.
Segment operating income leapt 135 percent to
a record $1.0 billion in 2006 from $445.3 million
in 2005. Revenues grew to $2.6 billion in 2006
from $1.7 billion in the prior year, as our world-
wide fleet produced average revenues per day
of $122,600 per rig, a 55 percent gain over our
average daily revenues of $78,900 in 2005.
Throughout 2006, increasingly tight rig supplies
and rising dayrates encouraged customers to
book rigs farther in advance, and for longer
terms than we have seen in the past. These
conditions provided opportunities for Global-
SantaFe to capture leading-edge rates and
build a revenue backlog that provides financial
strength, protection against cyclical downturns
and greater shareholder returns. Our aggressive
pursuit of these long-term agreements resulted
in a year of record-setting deals and unprece-
dented growth in our contract backlog to $10.6
billion, including:
A contract valued at approximately $1.0
billion to deliver a new ultra-deepwater semi-
submersible for a seven-year contract with
BP. Construction of the new rig, to be named
the GSF Development Driller III, remained
on schedule through year-end at Singapore-
based Keppel FELS, Ltd. for delivery in the
first half of 2009 and on budget for a total
estimated shipyard delivery cost of approxi-
mately $590 million.
•
Exceptional demand and high utilization contributed to GlobalSantaFe’s record 2006 operating results.
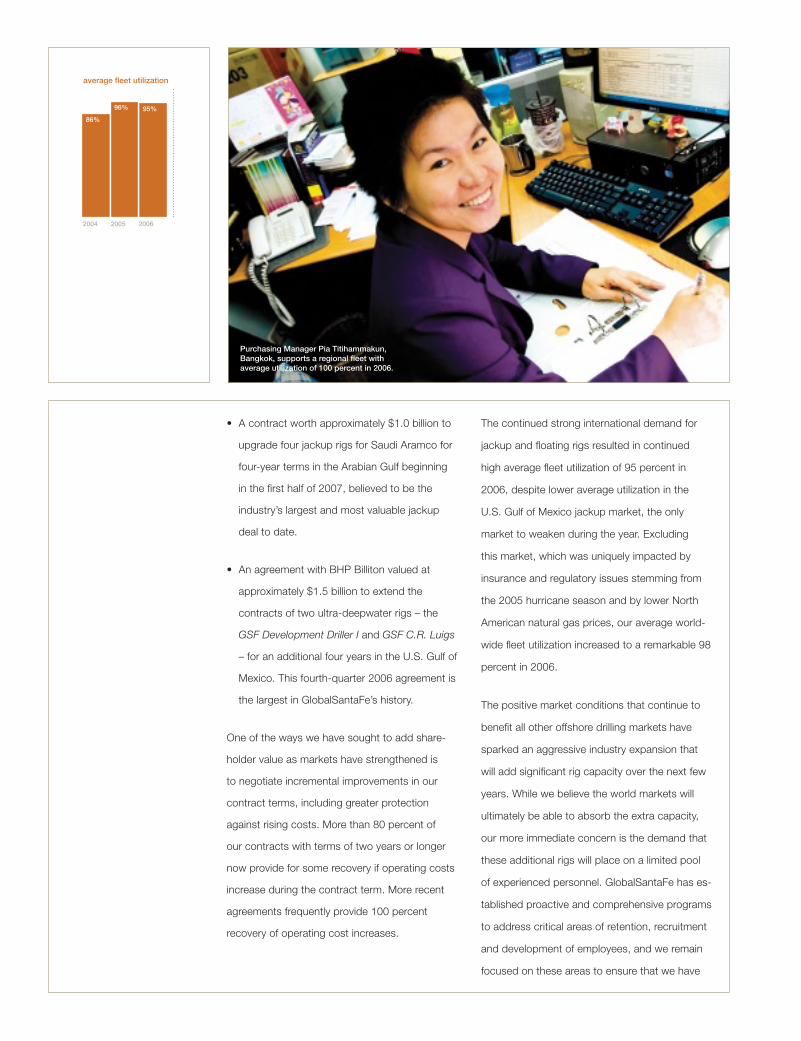
86%
A contract worth approximately $1.0 billion to
upgrade four jackup rigs for Saudi Aramco for
four-year terms in the Arabian Gulf beginning
in the first half of 2007, believed to be the
industry’s largest and most valuable jackup
deal to date.
An agreement with BHP Billiton valued at
approximately $1.5 billion to extend the
contracts of two ultra-deepwater rigs – the
GSF Development Driller I and GSF C.R. Luigs
– for an additional four years in the U.S. Gulf of
Mexico. This fourth-quarter 2006 agreement is
the largest in GlobalSantaFe’s history.
One of the ways we have sought to add share-
holder value as markets have strengthened is
to negotiate incremental improvements in our
contract terms, including greater protection
against rising costs. More than 80 percent of
our contracts with terms of two years or longer
now provide for some recovery if operating costs
increase during the contract term. More recent
agreements frequently provide 100 percent
recovery of operating cost increases.
•
•
The continued strong international demand for
jackup and floating rigs resulted in continued
high average fleet utilization of 95 percent in
2006, despite lower average utilization in the
U.S. Gulf of Mexico jackup market, the only
market to weaken during the year. Excluding
this market, which was uniquely impacted by
insurance and regulatory issues stemming from
the 2005 hurricane season and by lower North
American natural gas prices, our average world-
wide fleet utilization increased to a remarkable 98
percent in 2006.
The positive market conditions that continue to
benefit all other offshore drilling markets have
sparked an aggressive industry expansion that
will add significant rig capacity over the next few
years. While we believe the world markets will
ultimately be able to absorb the extra capacity,
our more immediate concern is the demand that
these additional rigs will place on a limited pool
of experienced personnel. GlobalSantaFe has es-
tablished proactive and comprehensive programs
to address critical areas of retention, recruitment
and development of employees, and we remain
focused on these areas to ensure that we have
average fleet utilization
95%96%
2004 2005 2006
Purchasing Manager Pia Titihammakun, Bangkok, supports a regional fleet with average utilization of 100 percent in 2006.
the right people with the right skills to meet
our customers’ needs. Despite the exceptional
demands that these fast-moving markets place
on our equipment and our crews, our people
have remained focused on consistent execu-
tion for our customers and continual improve-
ment of our operations.
GlobalSantaFe employees have embraced
safety as a core value, and our shared com-
mitment and constant focus on improvement
produced a year of record safety performance
in 2006. Our recordable incident rate, the
standard industry measure, has improved 42
percent during the last five years and fell to a
record low in 2006. During the year, our people
attended 675,000 hours of classroom safety
training, and we invested more than $30 million
toward achieving our goal of an injury-free
workplace.
Drilling Management Services
GlobalSantaFe’s drilling management services
segment, which includes Houston-based Ap-
plied Drilling Technology, Inc. (ADTI), and Ab-
erdeen-based ADT International, is the world’s
largest provider of turnkey drilling, completion
and related engineering and management
services. Many exploration and production
companies rely on our drilling management
services segment to effectively serve as their
outsourced drilling department. The segment
drilled 70 turnkey wells and performed 27 turn-
key completions in 2006, compared with 80
turnkey wells and 19 completions in 2005.
1.7
as of Dec. 31
10.6
4.8
contract drilling revenue backlog$ in billions
2004 2005 2006
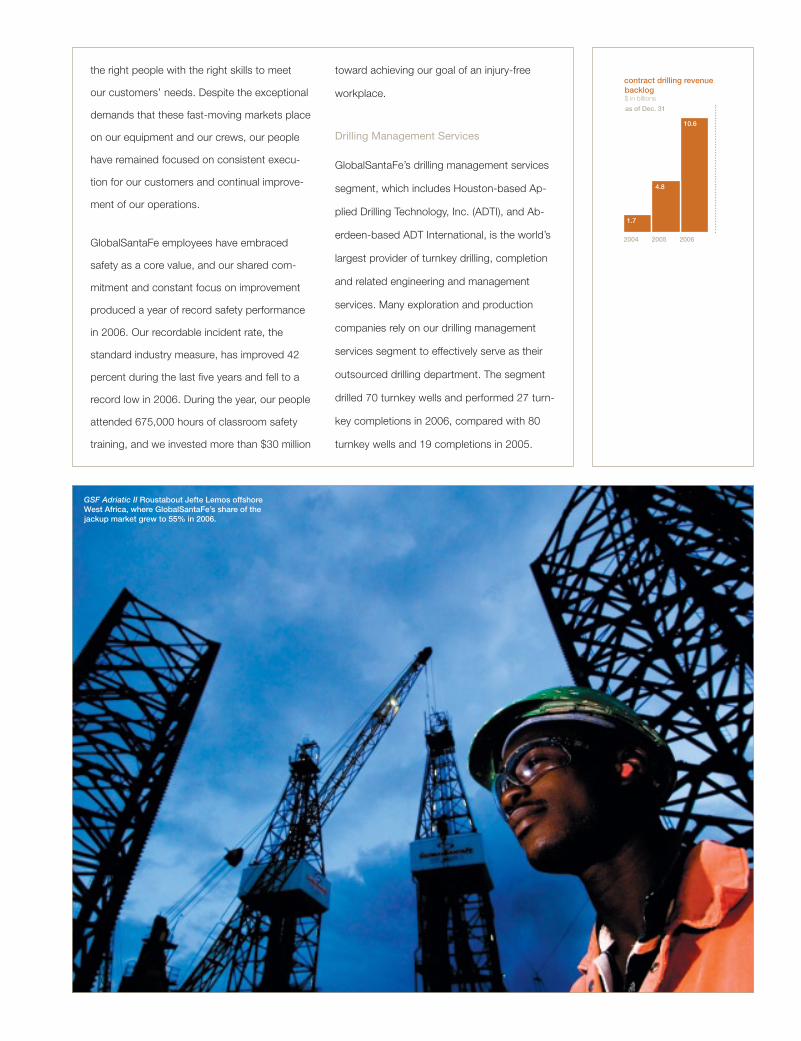
GSF Adriatic II Roustabout Jefte Lemos offshore West Africa, where GlobalSantaFe’s share of the jackup market grew to 55% in 2006.
Oil and Gas
The primary mission of our Challenger Minerals
(CMI) oil and gas division is to develop turnkey
opportunities for our drilling management
services segment and to help fund those
projects, in part, by attracting outside investors
to participate on an equity basis in the wells.
CMI typically takes a working interest in the
wells and generates revenues from its share
of the produced oil and natural gas. The
segment helped secure 37 contracts for drilling
management services during the year.
During 2006, our people worked safer and our operations were more profitable than they have ever been. it was the most successful year in GlobalsantaFe’s history by almost any measure, and we have every reason to expect even better results in 2007.
Contract Drilling
Drilling Management Service/Oil and Gas
1,085.2
income from operations$ in millions
2004 2005 2006
145.2
510.5
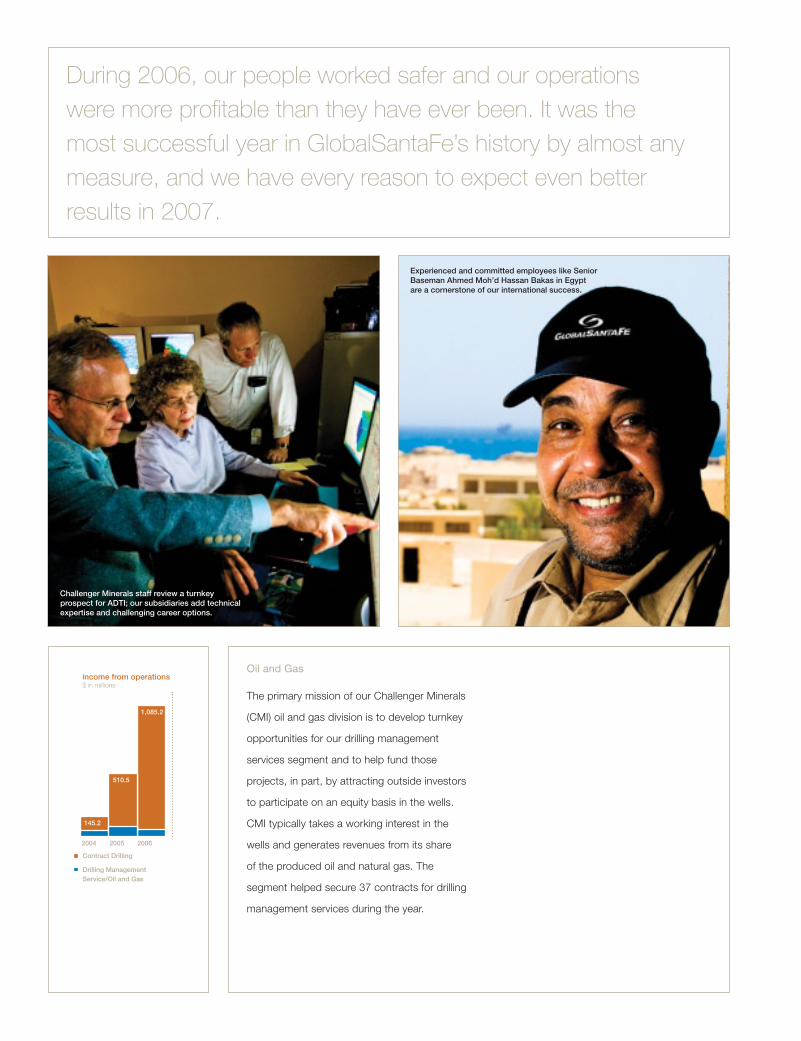
Challenger Minerals staff review a turnkey prospect for ADTI; our subsidiaries add technical expertise and challenging career options.
Experienced and committed employees like Senior Baseman Ahmed Moh’d Hassan Bakas in Egypt are a cornerstone of our international success.
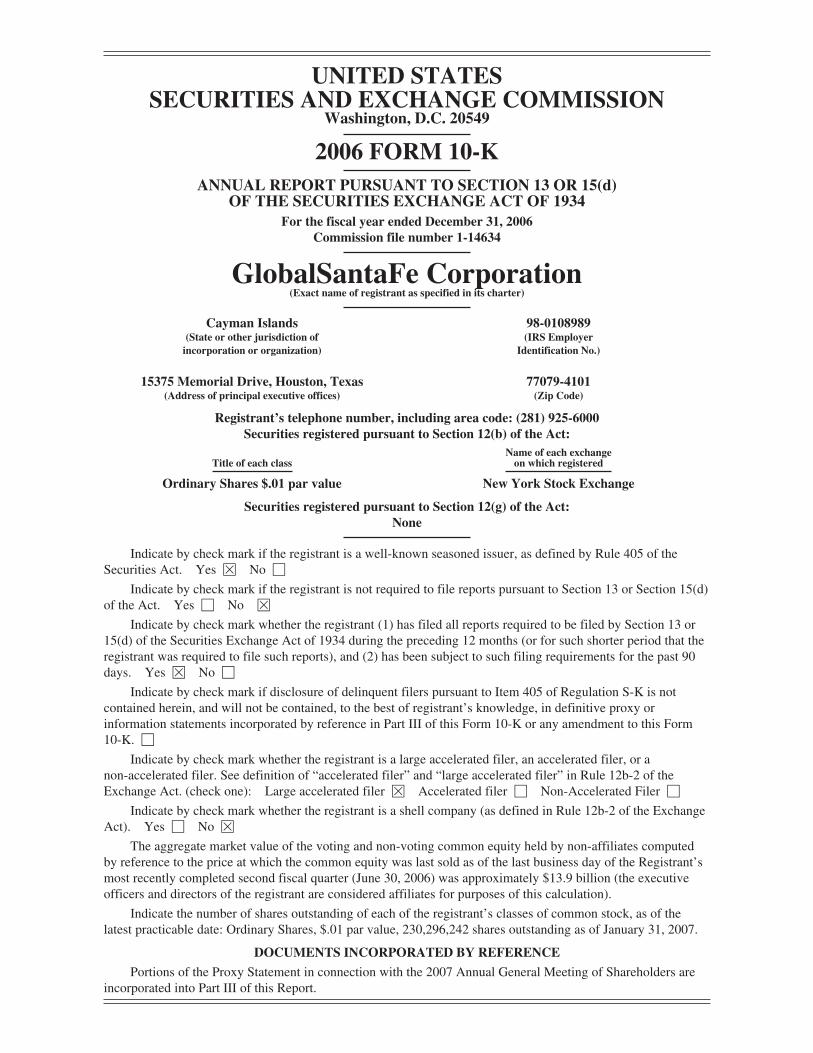
UNITED STATESSECURITIES AND EXCHANGE COMMISSION
Washington, D.C. 20549
2006 FORM 10-KANNUAL REPORT PURSUANT TO SECTION 13 OR 15(d)
OF THE SECURITIES EXCHANGE ACT OF 1934For the fiscal year ended December 31, 2006
Commission file number 1-14634
GlobalSantaFe Corporation(Exact name of registrant as specified in its charter)
Cayman Islands 98-0108989(State or other jurisdiction of
incorporation or organization)(IRS Employer
Identification No.)
15375 Memorial Drive, Houston, Texas 77079-4101(Address of principal executive offices) (Zip Code)
Registrant’s telephone number, including area code: (281) 925-6000Securities registered pursuant to Section 12(b) of the Act:
Title of each className of each exchange
on which registered
Ordinary Shares $.01 par value New York Stock Exchange
Securities registered pursuant to Section 12(g) of the Act:None
Indicate by check mark if the registrant is a well-known seasoned issuer, as defined by Rule 405 of theSecurities Act. Yes È No ‘
Indicate by check mark if the registrant is not required to file reports pursuant to Section 13 or Section 15(d)of the Act. Yes ‘ No È
Indicate by check mark whether the registrant (1) has filed all reports required to be filed by Section 13 or15(d) of the Securities Exchange Act of 1934 during the preceding 12 months (or for such shorter period that theregistrant was required to file such reports), and (2) has been subject to such filing requirements for the past 90days. Yes È No ‘
Indicate by check mark if disclosure of delinquent filers pursuant to Item 405 of Regulation S-K is notcontained herein, and will not be contained, to the best of registrant’s knowledge, in definitive proxy orinformation statements incorporated by reference in Part III of this Form 10-K or any amendment to this Form10-K. ‘
Indicate by check mark whether the registrant is a large accelerated filer, an accelerated filer, or anon-accelerated filer. See definition of “accelerated filer” and “large accelerated filer” in Rule 12b-2 of theExchange Act. (check one): Large accelerated filer È Accelerated filer ‘ Non-Accelerated Filer ‘
Indicate by check mark whether the registrant is a shell company (as defined in Rule 12b-2 of the ExchangeAct). Yes ‘ No È
The aggregate market value of the voting and non-voting common equity held by non-affiliates computedby reference to the price at which the common equity was last sold as of the last business day of the Registrant’smost recently completed second fiscal quarter (June 30, 2006) was approximately $13.9 billion (the executiveofficers and directors of the registrant are considered affiliates for purposes of this calculation).
Indicate the number of shares outstanding of each of the registrant’s classes of common stock, as of thelatest practicable date: Ordinary Shares, $.01 par value, 230,296,242 shares outstanding as of January 31, 2007.
DOCUMENTS INCORPORATED BY REFERENCE
Portions of the Proxy Statement in connection with the 2007 Annual General Meeting of Shareholders areincorporated into Part III of this Report.
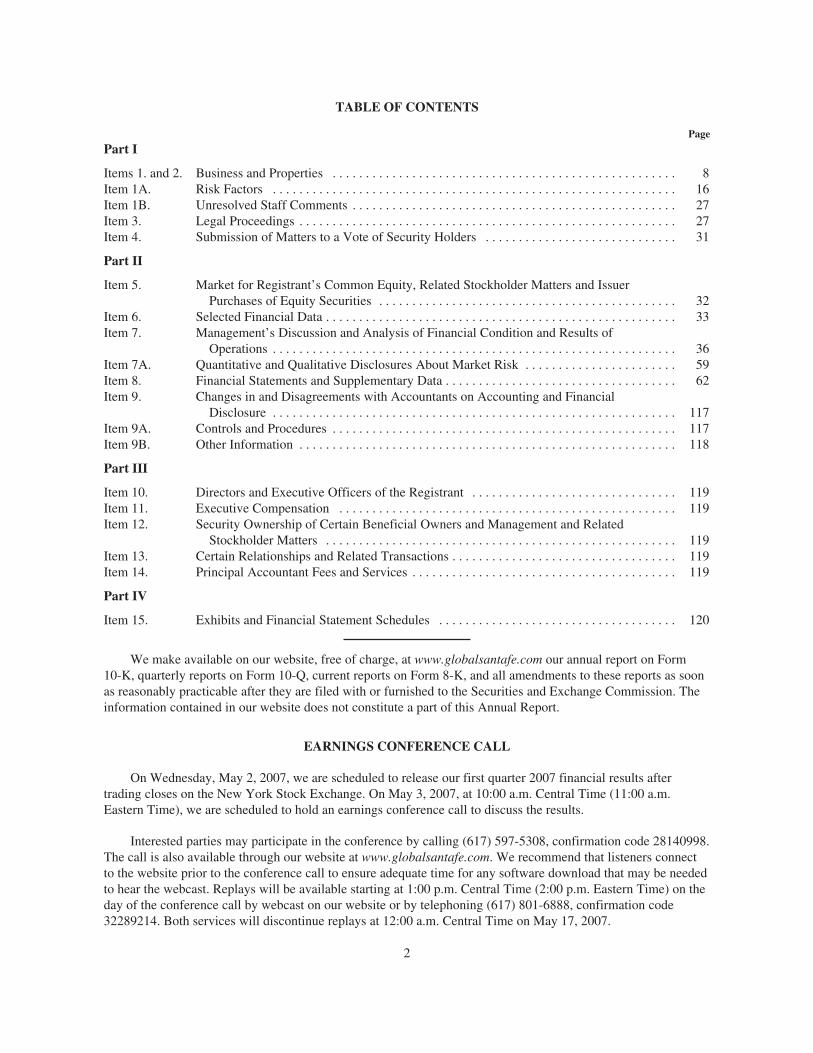
TABLE OF CONTENTS
Page
Part I
Items 1. and 2. Business and Properties . . . . . . . . . . . . . . . . . . . . . . . . . . . . . . . . . . . . . . . . . . . . . . . . . . . . 8Item 1A. Risk Factors . . . . . . . . . . . . . . . . . . . . . . . . . . . . . . . . . . . . . . . . . . . . . . . . . . . . . . . . . . . . . 16Item 1B. Unresolved Staff Comments . . . . . . . . . . . . . . . . . . . . . . . . . . . . . . . . . . . . . . . . . . . . . . . . . 27Item 3. Legal Proceedings . . . . . . . . . . . . . . . . . . . . . . . . . . . . . . . . . . . . . . . . . . . . . . . . . . . . . . . . . 27Item 4. Submission of Matters to a Vote of Security Holders . . . . . . . . . . . . . . . . . . . . . . . . . . . . . 31
Part II
Item 5. Market for Registrant’s Common Equity, Related Stockholder Matters and IssuerPurchases of Equity Securities . . . . . . . . . . . . . . . . . . . . . . . . . . . . . . . . . . . . . . . . . . . . . 32
Item 6. Selected Financial Data . . . . . . . . . . . . . . . . . . . . . . . . . . . . . . . . . . . . . . . . . . . . . . . . . . . . . 33Item 7. Management’s Discussion and Analysis of Financial Condition and Results of
Operations . . . . . . . . . . . . . . . . . . . . . . . . . . . . . . . . . . . . . . . . . . . . . . . . . . . . . . . . . . . . . 36Item 7A. Quantitative and Qualitative Disclosures About Market Risk . . . . . . . . . . . . . . . . . . . . . . . 59Item 8. Financial Statements and Supplementary Data . . . . . . . . . . . . . . . . . . . . . . . . . . . . . . . . . . . 62Item 9. Changes in and Disagreements with Accountants on Accounting and Financial
Disclosure . . . . . . . . . . . . . . . . . . . . . . . . . . . . . . . . . . . . . . . . . . . . . . . . . . . . . . . . . . . . . 117Item 9A. Controls and Procedures . . . . . . . . . . . . . . . . . . . . . . . . . . . . . . . . . . . . . . . . . . . . . . . . . . . . 117Item 9B. Other Information . . . . . . . . . . . . . . . . . . . . . . . . . . . . . . . . . . . . . . . . . . . . . . . . . . . . . . . . . 118
Part III
Item 10. Directors and Executive Officers of the Registrant . . . . . . . . . . . . . . . . . . . . . . . . . . . . . . . 119Item 11. Executive Compensation . . . . . . . . . . . . . . . . . . . . . . . . . . . . . . . . . . . . . . . . . . . . . . . . . . . 119Item 12. Security Ownership of Certain Beneficial Owners and Management and Related
Stockholder Matters . . . . . . . . . . . . . . . . . . . . . . . . . . . . . . . . . . . . . . . . . . . . . . . . . . . . . 119Item 13. Certain Relationships and Related Transactions . . . . . . . . . . . . . . . . . . . . . . . . . . . . . . . . . . 119Item 14. Principal Accountant Fees and Services . . . . . . . . . . . . . . . . . . . . . . . . . . . . . . . . . . . . . . . . 119
Part IV
Item 15. Exhibits and Financial Statement Schedules . . . . . . . . . . . . . . . . . . . . . . . . . . . . . . . . . . . . 120
We make available on our website, free of charge, at www.globalsantafe.com our annual report on Form10-K, quarterly reports on Form 10-Q, current reports on Form 8-K, and all amendments to these reports as soonas reasonably practicable after they are filed with or furnished to the Securities and Exchange Commission. Theinformation contained in our website does not constitute a part of this Annual Report.
EARNINGS CONFERENCE CALL
On Wednesday, May 2, 2007, we are scheduled to release our first quarter 2007 financial results aftertrading closes on the New York Stock Exchange. On May 3, 2007, at 10:00 a.m. Central Time (11:00 a.m.Eastern Time), we are scheduled to hold an earnings conference call to discuss the results.
Interested parties may participate in the conference by calling (617) 597-5308, confirmation code 28140998.The call is also available through our website at www.globalsantafe.com. We recommend that listeners connectto the website prior to the conference call to ensure adequate time for any software download that may be neededto hear the webcast. Replays will be available starting at 1:00 p.m. Central Time (2:00 p.m. Eastern Time) on theday of the conference call by webcast on our website or by telephoning (617) 801-6888, confirmation code32289214. Both services will discontinue replays at 12:00 a.m. Central Time on May 17, 2007.
2
FORWARD-LOOKING STATEMENTS
Under the Private Securities Litigation Reform Act of 1995, companies are provided a “safe harbor” fordiscussing their expectations regarding future performance. We believe it is in the best interests of ourshareholders and the investment community to use these provisions and provide such forward-lookinginformation. We do so in this report and other communications. Forward-looking statements are often but notalways identifiable by use of words such as “anticipate,” “believe,” “budget,” “could,” “estimate,” “expect,”“forecast,” “intend,” “may,” “might,” “plan,” “predict,” “project,” “should,” and “will.”
Our forward-looking statements include statements about the following subjects:
• our possible or assumed results of operations;
• our funding and financing plans;
• the dates drilling rigs will become available following completion of current contracts, the dates rigswill commence contracts and the dollar amount of such contracts, and the dates rigs will be mobilized toother locations;
• with respect to our new ultra-deepwater semisubmersible, the GSF Development Driller III, the estimateof the construction costs for the rig and its projected delivery date;
• our estimation of the costs to remediate thruster defects on the GSF Development Driller I and the GSFDevelopment Driller II and our expectation regarding who will bear those costs;
• our expectation that we will likely replace the jackup GSF Adriatic IV, which was lost in a fire, and theGSF High Island III and GSF Adriatic VII, which were damaged in Hurricane Rita, through theacquisition or construction of replacement assets;
• our expectation that the 60-day waiting period under our loss of hire insurance will serve as the onlydeductible for the Hurricane Katrina event;
• our expected insurance recoveries for certain of our rigs damaged by Hurricanes Katrina and Rita;
• our estimates of loss of hire recoveries from our insurers;
• our expectation that we will fund any costs incurred associated with remediating rigs, to the extent theyare not covered from insurance underwriters, from our existing cash, cash equivalents, and marketablesecurities balances and future cash flows from operations;
• our expectation that we will fund the costs we incur for the construction of the GSF DevelopmentDriller III, from our existing cash, cash equivalents and marketable securities balances and future cashflow from operations;
• our expectation that we will complete the sale of the GSF High Island III in the first quarter of 2007 andthat we do not expect the loss of the GSF High Island III or the GSF Adriatic VII to have a materialaffect in our results of operations in future periods;
• our contract drilling and drilling management services revenue backlogs and the amounts expected to berealized in 2007;
• our estimate of undiscounted future cash flows relating to the determination of impairment of rigs anddrilling equipment;
• our belief that we should prevail in the appeal of a proposed adjustment by the Internal Revenue Serviceand that the Internal Revenue Service could propose similar adjustments with respect to other periods;
• the expected outcomes of legal and administrative proceedings, their materiality, potential insurancecoverage and their expected effects on our financial position and results of operations;
3
• the assumptions as to risk-free interest rates, stock price volatility, dividend yield and expected lives ofawards used to estimate the fair value of stock-based compensation awards and the estimatedunrecognized compensation cost and the weighted average period over which such cost is expected to berealized;
• the return assumptions developed by our consultants in determining expected long-term rate of return onpension plan assets assumption;
• our expectations regarding future conditions in various geographic markets in which we operate and theprospects for future work, contract terms and dayrates in those markets;
• our expectations regarding supply and demand for equipment, ancillary services, and drilling rigs invarious geographic markets;
• our expectations regarding the time and impact of the entry into service of new rigs under construction,and rigs being upgraded or reactivated;
• our expectation that further new rig construction announcements are likely;
• estimated costs in 2006 for drilling management services;
• our estimated loss on a turnkey drilling project in the first quarter of 2007;
• our use of critical accounting estimates and the assumptions and estimates made by management duringthe preparation of our financial statements;
• our estimated capital expenditures in 2007;
• our future contractual obligations;
• our expectation that we will fund various commitments, primarily related to our debt and capital leaseobligations, leases for office space and other property and equipment, as well as the construction of ournew ultra-deepwater semisubmersible drilling rig, with existing cash, cash equivalents, marketablesecurities and future cash flows from operations;
• our expectation that our effective tax rate will continue to fluctuate from quarter to quarter and year toyear as our operations are conducted in different taxing jurisdictions and our expected effective tax ratefor 2007;
• our expectation that a subsidiary restructuring completed in fourth quarter of 2006 should facilitate themovement of cash through our subsidiaries at a low tax cost;
• our ability to meet all of our current obligations, including working capital requirements, capitalexpenditures, total lease obligations, construction and development expenses, and debt service, from ourexisting cash, cash equivalents and marketable securities balances and future cash flow from operations;
• our expectation that, if required, any additional payments made under certain fully defeased financingleases would not be material to our financial position, results of operations or cash flows in any givenyear;
• our belief that our exposure to interest rate fluctuations as a result of fixed-for-floating interest rateswaps is not material to our financial position, results of operations or cash flows;
• our belief that credit risk in our investments in commercial paper, money market funds, asset-backedsecurities, government issues and corporate obligations is minimal;
• our expectation regarding increases in contract drilling expenses in 2007;
• our estimation that the Minerals Management Service of the U.S. Department of Interior or InsuranceUnderwriters, or both, may impose operating criteria in the Gulf of Mexico that could increase thecapital cost or cost of operations or reduce the area of operations for rigs operating there, which couldmaterially and adversely affect our operations and financial condition;
4
• our ability to maintain adequate insurance at rates we consider reasonable and our ability to obtaininsurance against certain risks;
• our expectations regarding changes in insurance affecting our customers in the Gulf of Mexico and theimpact on those customers;
• our expectation regarding the effect of adoption of certain accounting standards; and
• any other statements that are not historical facts.
Our forward-looking statements speak only as of the date of this report and are based on currently availableindustry, financial, and economic data and our operating plans. They are also inherently uncertain, and investorsmust recognize that events could turn out to be materially different from our expectations.
Factors that could cause or contribute to such differences include, but are not limited to:
• higher than anticipated accruals for performance-based compensation due to better than anticipatedperformance, higher than anticipated severance expenses due to unanticipated employee terminations,higher than anticipated legal and accounting fees due to unanticipated financing or other corporatetransactions, and other factors that could increase G&A expenses;
• a material or extended decline in expenditures by the oil and gas industry, which is significantly affectedby indications and expectations regarding the level and volatility of oil and natural gas prices, which inturn are affected by such things as political, economic and weather conditions affecting or potentiallyaffecting regional or worldwide demand for oil and natural gas, actions or anticipated actions by OPEC,inventory level, deliverability constraints, and futures market activity;
• the extent to which customers and potential customers continue to pursue ultra-deepwater drilling;
• the extent to which we are required to idle rigs or to enter into lower dayrate contracts in response tofuture market conditions;
• exploration success or lack of exploration success by our customers and potential customers;
• our ability to enter into and the terms of future drilling contracts;
• the entry into service of newly constructed, upgraded or reactivated rigs;
• our ability to win bids for turnkey drilling operations;
• rig availability and our ability to hire suitable rigs at acceptable rates;
• our ability to retain and attract qualified personnel;
• the availability of adequate insurance at a reasonable cost;
• the occurrence of an uninsured or unidentified event;
• the implementation of additional operational requirements in the Gulf of Mexico by governmentalagencies or insurers;
• the risks of failing to complete a well or wells under turnkey contracts;
• other risks inherent in turnkey contracts;
• our failure to retain the business of one or more significant customers;
• the termination or renegotiation of contracts by customers;
• the operating hazards inherent in drilling for oil and natural gas;
• the risks of international operations and compliance with foreign laws;
• political and other uncertainties inherent in non-U.S. operations, including exchange and currencyfluctuations and the limitations on the ability to repatriate income or capital to the U.S.;
5
• compliance with or breach of environmental laws;
• proposed United States tax law changes or other changes in the tax laws or regulations of the U.S. oranother country or changes in tax treaties;
• limitations on our ability to use our U.S. tax net operating loss carryforwards;
• changes in employee demographics that impact the estimated remaining service lives of the activeparticipants in our pension plans;
• the impact of governmental laws and regulations and the uncertainties involved in their administration,particularly in some foreign jurisdictions;
• the highly competitive and cyclical nature of our business, with periods of low demand and excess rigavailability;
• the level of construction of new rigs, upgrade of existing rigs and reactivation of cold-stacked rigs;
• the continuation or escalation of existing armed hostilities, outbreak of war or other armed conflicts orterrorist attacks;
• the effect of SARS or other public health threats on our international operations;
• political or social disruptions that limit oil and/or gas production;
• the actions of our competitors in the oil and gas drilling industry, which could significantly influence rigdayrates and utilization;
• delays or cost overruns in our rig upgrade, refurbishment and construction projects and rig maintenanceand repairs, caused by such things as shortages of materials or skilled labor, unforeseen engineeringproblems, unanticipated actual or purported change orders, work stoppages, shipyard financial oroperating difficulties, adverse weather conditions or natural disasters, unanticipated cost increases, andthe inability to obtain requisite permits or approvals;
• the ultimate insurance recoveries for damages caused by Hurricanes Katrina and Rita;
• the unforeseen startup problems inherent in commencing operations with any new rig, including suchthings as engineering, permitting, crewing and equipment problems;
• the occurrence or nonoccurrence of anticipated changes in our revenue mix between domestic andinternational drilling markets due to changes in our customers’ oil and gas drilling plans, which can bethe result of such things as changes in regional or worldwide economic conditions and fluctuations inthe prices of oil and natural gas, which in turn could change or stabilize effective tax rates;
• the vagaries of the legislative process due to the unpredictable nature of politics and national and worldevents, among other things;
• currently unknown rig repair needs and/or additional opportunities to accelerate planned maintenanceexpenditures due to presently unanticipated rig downtime;
• changes in oil and natural gas drilling technology or in our competitors’ drilling rig fleets that couldmake our drilling rigs less competitive or require major capital investments to keep them competitive;
• the adequacy of sources of liquidity;
• the incurrence of secured debt or additional unsecured indebtedness or other obligations by us or oursubsidiaries;
• the uncertainties inherent in dealing with financial and other third-party institutions that could haveinternal weaknesses unknown to us;
• changes in accepted interpretations of accounting guidelines and other accounting pronouncements;
6
• the number and severity of future litigation claims, including asbestos-related claims, and thesufficiency of insurance;
• the effects and uncertainties of legal and administrative proceedings and other contingencies; and
• such other factors as may be discussed in this report in “Item 1A. Risk Factors” section and elsewhere,and in our other reports filed with the U.S. Securities and Exchange Commission.
You should not place undue reliance on forward-looking statements. Each forward-looking statement speaksonly as of the date of the particular statement, and we disclaim any obligation or undertaking to disseminate anyupdates or revisions to our statements, forward-looking or otherwise, to reflect changes in our expectations orany change in events, conditions or circumstances on which any such statements are based.
7
PART I
ITEMS 1. AND 2. BUSINESS AND PROPERTIES
GlobalSantaFe Corporation is an offshore oil and gas drilling contractor, owning or operating a fleet of 59marine drilling rigs. As of December 31, 2006, our fleet included 43 cantilevered jackup rigs, 11semisubmersible rigs, three drillships, and two additional semisubmersible rigs we operate for third parties undera joint venture agreement (see “Joint Venture, Agency and Sponsorship Relationships and Other Investments”).During the first quarter of 2006, we commenced construction of an additional semisubmersible, to be named theGSF Development Driller III. We also have a jackup rig, the GSF High Island III, that is currently not capable ofperforming drilling operations due to damage arising in 2005 as a result of Hurricane Rita. Subsequent toDecember 31, 2006, we entered into a contract to sell the rig to a third party and expect to complete the saleduring the first quarter of 2007. (See “Management’s Discussion and Analysis of Financial Condition andResults of Operations—Involuntary Conversions of Long-Lived Assets and Related Recoveries.”).
We provide offshore oil and gas contract drilling services to the oil and gas industry worldwide on a dailyrate (“dayrate”) basis. We also provide oil and gas drilling management services on either a dayrate orcompleted-project, fixed-price (“turnkey”) basis, as well as drilling engineering and drilling project managementservices, and we participate in oil and gas exploration and production activities. Business segment andgeographic information is set forth in Note 14 of Notes to Consolidated Financial Statements in Item 8 of thisAnnual Report on Form 10-K. We are a Cayman Islands company, with our principal executive offices inHouston, Texas.
Unless the context otherwise requires, the terms “we,” “us” and “our” refer to GlobalSantaFe Corporationand its consolidated subsidiaries. Substantially all of our businesses are conducted by subsidiaries ofGlobalSantaFe Corporation.
CONTRACT DRILLING
Substantially all of our domestic offshore contract drilling operations are conducted by GlobalSantaFeDrilling Company, a wholly owned subsidiary headquartered in Houston, Texas. International offshore contractdrilling operations are conducted by a number of our subsidiaries and joint venture companies with operations in21 countries throughout the world.
Rig Fleet. We have a modern, diversified fleet of 59 mobile offshore drilling rigs as of December 31, 2006,including six cantilevered heavy-duty harsh environment (“HDHE”) jackups, 37 cantilevered jackups, 11semisubmersibles, including two ultra-deepwater semisubmersibles, three ultra-deepwater, dynamicallypositioned drillships, and two additional semisubmersible rigs we operate for third parties. All of our rigs, withthe exception of the GSF Britannia jackup, were placed into service in 1974 or later, and, as of December 31,2006, the average age of the rigs in our fleet was approximately 21 years.
Our fleet is deployed in major offshore oil and gas operating areas worldwide. The principal areas in whichthe fleet is currently deployed are the U.S. Gulf of Mexico, the North Sea, West Africa, the Mediterranean Sea,Southeast Asia, South America, the Middle East and eastern Canada.
8
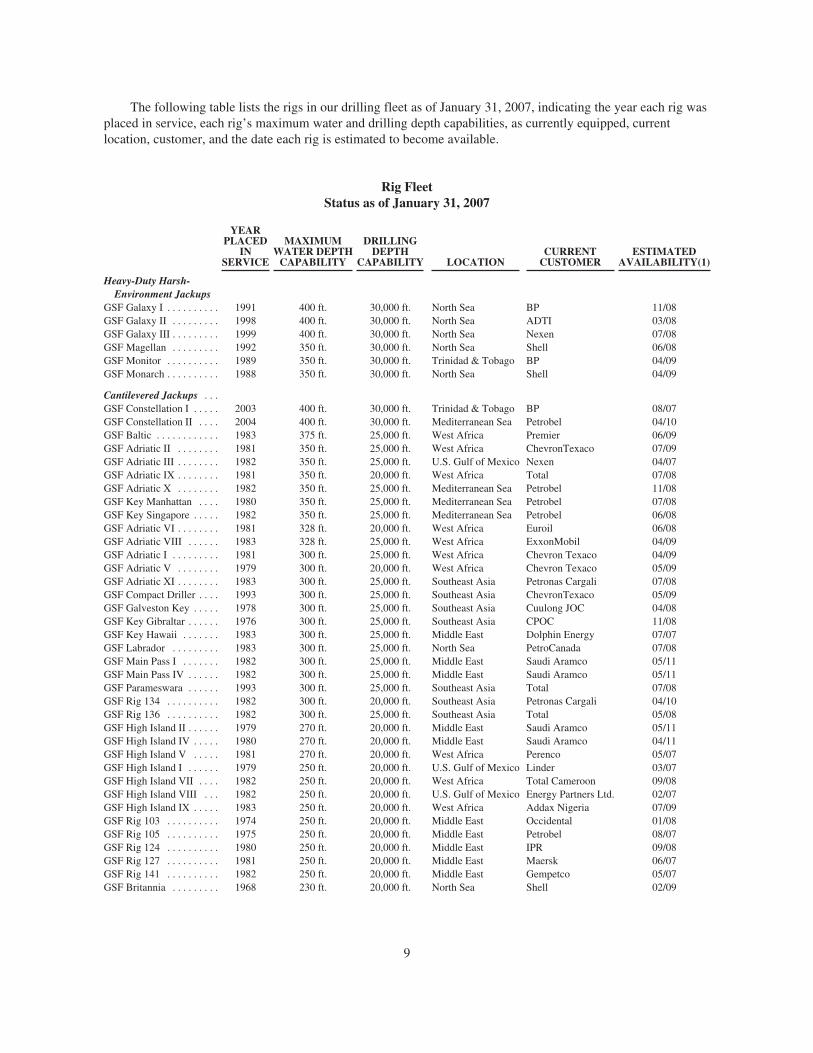
The following table lists the rigs in our drilling fleet as of January 31, 2007, indicating the year each rig wasplaced in service, each rig’s maximum water and drilling depth capabilities, as currently equipped, currentlocation, customer, and the date each rig is estimated to become available.
Rig FleetStatus as of January 31, 2007
YEARPLACED
INSERVICE
MAXIMUMWATER DEPTH
CAPABILITY
DRILLINGDEPTH
CAPABILITY LOCATIONCURRENT
CUSTOMERESTIMATED
AVAILABILITY(1)
Heavy-Duty Harsh-Environment Jackups
GSF Galaxy I . . . . . . . . . . 1991 400 ft. 30,000 ft. North Sea BP 11/08GSF Galaxy II . . . . . . . . . 1998 400 ft. 30,000 ft. North Sea ADTI 03/08GSF Galaxy III . . . . . . . . . 1999 400 ft. 30,000 ft. North Sea Nexen 07/08GSF Magellan . . . . . . . . . 1992 350 ft. 30,000 ft. North Sea Shell 06/08GSF Monitor . . . . . . . . . . 1989 350 ft. 30,000 ft. Trinidad & Tobago BP 04/09GSF Monarch . . . . . . . . . . 1988 350 ft. 30,000 ft. North Sea Shell 04/09
Cantilevered Jackups . . .GSF Constellation I . . . . . 2003 400 ft. 30,000 ft. Trinidad & Tobago BP 08/07GSF Constellation II . . . . 2004 400 ft. 30,000 ft. Mediterranean Sea Petrobel 04/10GSF Baltic . . . . . . . . . . . . 1983 375 ft. 25,000 ft. West Africa Premier 06/09GSF Adriatic II . . . . . . . . 1981 350 ft. 25,000 ft. West Africa ChevronTexaco 07/09GSF Adriatic III . . . . . . . . 1982 350 ft. 25,000 ft. U.S. Gulf of Mexico Nexen 04/07GSF Adriatic IX . . . . . . . . 1981 350 ft. 20,000 ft. West Africa Total 07/08GSF Adriatic X . . . . . . . . 1982 350 ft. 25,000 ft. Mediterranean Sea Petrobel 11/08GSF Key Manhattan . . . . 1980 350 ft. 25,000 ft. Mediterranean Sea Petrobel 07/08GSF Key Singapore . . . . . 1982 350 ft. 25,000 ft. Mediterranean Sea Petrobel 06/08GSF Adriatic VI . . . . . . . . 1981 328 ft. 20,000 ft. West Africa Euroil 06/08GSF Adriatic VIII . . . . . . 1983 328 ft. 25,000 ft. West Africa ExxonMobil 04/09GSF Adriatic I . . . . . . . . . 1981 300 ft. 25,000 ft. West Africa Chevron Texaco 04/09GSF Adriatic V . . . . . . . . 1979 300 ft. 20,000 ft. West Africa Chevron Texaco 05/09GSF Adriatic XI . . . . . . . . 1983 300 ft. 25,000 ft. Southeast Asia Petronas Cargali 07/08GSF Compact Driller . . . . 1993 300 ft. 25,000 ft. Southeast Asia ChevronTexaco 05/09GSF Galveston Key . . . . . 1978 300 ft. 25,000 ft. Southeast Asia Cuulong JOC 04/08GSF Key Gibraltar . . . . . . 1976 300 ft. 25,000 ft. Southeast Asia CPOC 11/08GSF Key Hawaii . . . . . . . 1983 300 ft. 25,000 ft. Middle East Dolphin Energy 07/07GSF Labrador . . . . . . . . . 1983 300 ft. 25,000 ft. North Sea PetroCanada 07/08GSF Main Pass I . . . . . . . 1982 300 ft. 25,000 ft. Middle East Saudi Aramco 05/11GSF Main Pass IV . . . . . . 1982 300 ft. 25,000 ft. Middle East Saudi Aramco 05/11GSF Parameswara . . . . . . 1993 300 ft. 25,000 ft. Southeast Asia Total 07/08GSF Rig 134 . . . . . . . . . . 1982 300 ft. 20,000 ft. Southeast Asia Petronas Cargali 04/10GSF Rig 136 . . . . . . . . . . 1982 300 ft. 25,000 ft. Southeast Asia Total 05/08GSF High Island II . . . . . . 1979 270 ft. 20,000 ft. Middle East Saudi Aramco 05/11GSF High Island IV . . . . . 1980 270 ft. 20,000 ft. Middle East Saudi Aramco 04/11GSF High Island V . . . . . 1981 270 ft. 20,000 ft. West Africa Perenco 05/07GSF High Island I . . . . . . 1979 250 ft. 20,000 ft. U.S. Gulf of Mexico Linder 03/07GSF High Island VII . . . . 1982 250 ft. 20,000 ft. West Africa Total Cameroon 09/08GSF High Island VIII . . . 1982 250 ft. 20,000 ft. U.S. Gulf of Mexico Energy Partners Ltd. 02/07GSF High Island IX . . . . . 1983 250 ft. 20,000 ft. West Africa Addax Nigeria 07/09GSF Rig 103 . . . . . . . . . . 1974 250 ft. 20,000 ft. Middle East Occidental 01/08GSF Rig 105 . . . . . . . . . . 1975 250 ft. 20,000 ft. Middle East Petrobel 08/07GSF Rig 124 . . . . . . . . . . 1980 250 ft. 20,000 ft. Middle East IPR 09/08GSF Rig 127 . . . . . . . . . . 1981 250 ft. 20,000 ft. Middle East Maersk 06/07GSF Rig 141 . . . . . . . . . . 1982 250 ft. 20,000 ft. Middle East Gempetco 05/07GSF Britannia . . . . . . . . . 1968 230 ft. 20,000 ft. North Sea Shell 02/09
9
YEARPLACED
INSERVICE
MAXIMUMWATER DEPTH
CAPABILITY
DRILLINGDEPTH
CAPABILITY LOCATIONCURRENT
CUSTOMERESTIMATED
AVAILABILITY (1)
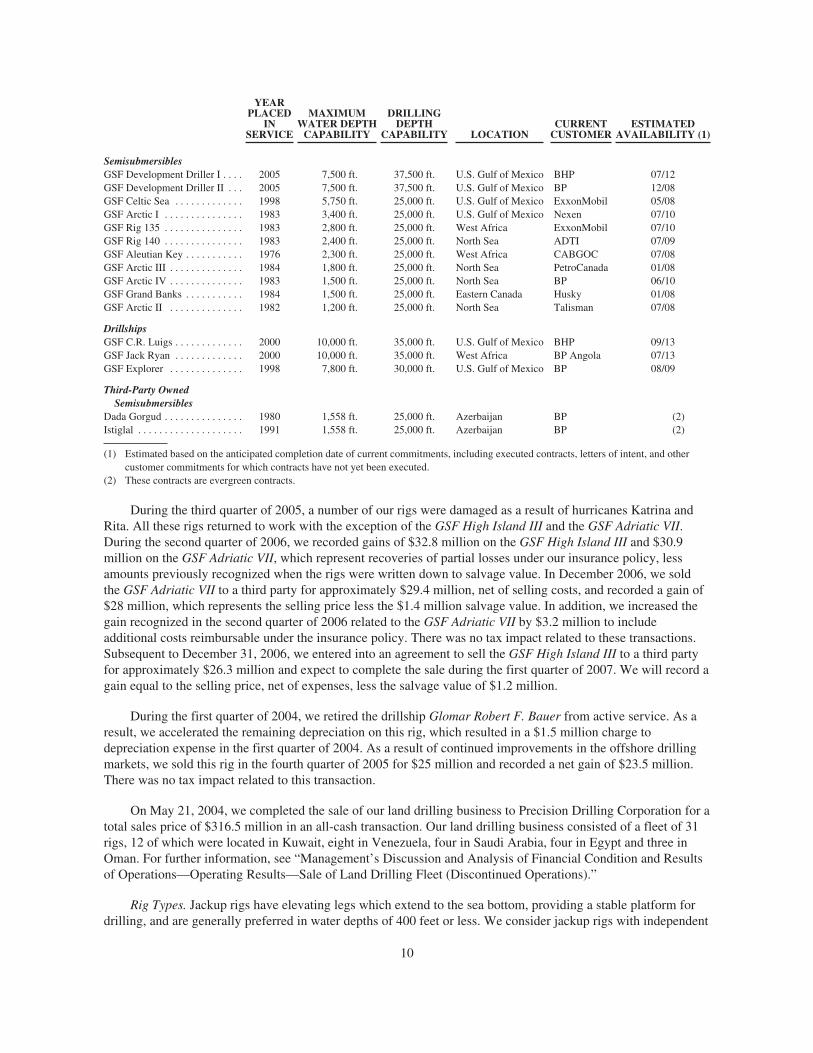
SemisubmersiblesGSF Development Driller I . . . . 2005 7,500 ft. 37,500 ft. U.S. Gulf of Mexico BHP 07/12GSF Development Driller II . . . 2005 7,500 ft. 37,500 ft. U.S. Gulf of Mexico BP 12/08GSF Celtic Sea . . . . . . . . . . . . . 1998 5,750 ft. 25,000 ft. U.S. Gulf of Mexico ExxonMobil 05/08GSF Arctic I . . . . . . . . . . . . . . . 1983 3,400 ft. 25,000 ft. U.S. Gulf of Mexico Nexen 07/10GSF Rig 135 . . . . . . . . . . . . . . . 1983 2,800 ft. 25,000 ft. West Africa ExxonMobil 07/10GSF Rig 140 . . . . . . . . . . . . . . . 1983 2,400 ft. 25,000 ft. North Sea ADTI 07/09GSF Aleutian Key . . . . . . . . . . . 1976 2,300 ft. 25,000 ft. West Africa CABGOC 07/08GSF Arctic III . . . . . . . . . . . . . . 1984 1,800 ft. 25,000 ft. North Sea PetroCanada 01/08GSF Arctic IV . . . . . . . . . . . . . . 1983 1,500 ft. 25,000 ft. North Sea BP 06/10GSF Grand Banks . . . . . . . . . . . 1984 1,500 ft. 25,000 ft. Eastern Canada Husky 01/08GSF Arctic II . . . . . . . . . . . . . . 1982 1,200 ft. 25,000 ft. North Sea Talisman 07/08
DrillshipsGSF C.R. Luigs . . . . . . . . . . . . . 2000 10,000 ft. 35,000 ft. U.S. Gulf of Mexico BHP 09/13GSF Jack Ryan . . . . . . . . . . . . . 2000 10,000 ft. 35,000 ft. West Africa BP Angola 07/13GSF Explorer . . . . . . . . . . . . . . 1998 7,800 ft. 30,000 ft. U.S. Gulf of Mexico BP 08/09
Third-Party OwnedSemisubmersibles
Dada Gorgud . . . . . . . . . . . . . . . 1980 1,558 ft. 25,000 ft. Azerbaijan BP (2)Istiglal . . . . . . . . . . . . . . . . . . . . 1991 1,558 ft. 25,000 ft. Azerbaijan BP (2)
(1) Estimated based on the anticipated completion date of current commitments, including executed contracts, letters of intent, and othercustomer commitments for which contracts have not yet been executed.
(2) These contracts are evergreen contracts.
During the third quarter of 2005, a number of our rigs were damaged as a result of hurricanes Katrina andRita. All these rigs returned to work with the exception of the GSF High Island III and the GSF Adriatic VII.During the second quarter of 2006, we recorded gains of $32.8 million on the GSF High Island III and $30.9million on the GSF Adriatic VII, which represent recoveries of partial losses under our insurance policy, lessamounts previously recognized when the rigs were written down to salvage value. In December 2006, we soldthe GSF Adriatic VII to a third party for approximately $29.4 million, net of selling costs, and recorded a gain of$28 million, which represents the selling price less the $1.4 million salvage value. In addition, we increased thegain recognized in the second quarter of 2006 related to the GSF Adriatic VII by $3.2 million to includeadditional costs reimbursable under the insurance policy. There was no tax impact related to these transactions.Subsequent to December 31, 2006, we entered into an agreement to sell the GSF High Island III to a third partyfor approximately $26.3 million and expect to complete the sale during the first quarter of 2007. We will record again equal to the selling price, net of expenses, less the salvage value of $1.2 million.
During the first quarter of 2004, we retired the drillship Glomar Robert F. Bauer from active service. As aresult, we accelerated the remaining depreciation on this rig, which resulted in a $1.5 million charge todepreciation expense in the first quarter of 2004. As a result of continued improvements in the offshore drillingmarkets, we sold this rig in the fourth quarter of 2005 for $25 million and recorded a net gain of $23.5 million.There was no tax impact related to this transaction.
On May 21, 2004, we completed the sale of our land drilling business to Precision Drilling Corporation for atotal sales price of $316.5 million in an all-cash transaction. Our land drilling business consisted of a fleet of 31rigs, 12 of which were located in Kuwait, eight in Venezuela, four in Saudi Arabia, four in Egypt and three inOman. For further information, see “Management’s Discussion and Analysis of Financial Condition and Resultsof Operations—Operating Results—Sale of Land Drilling Fleet (Discontinued Operations).”
Rig Types. Jackup rigs have elevating legs which extend to the sea bottom, providing a stable platform fordrilling, and are generally preferred in water depths of 400 feet or less. We consider jackup rigs with independent
10
cantilevers and a water depth capability of over 300 feet to be “premium” jackup units. All of our jackup rigshave drilling equipment mounted on cantilevers, which allow the equipment to extend outward from the rigs’hulls over fixed drilling platforms and enable operators to drill both exploratory and development wells. Inaddition, seven of our jackups are equipped with skid-off packages, which allow the drilling equipment to betransferred to fixed production platforms.
We own one of the world’s largest fleets of HDHE jackup rigs. Three of our HDHE rigs, the GSF Galaxy I,GSF Galaxy II and GSF Galaxy III, are Universe class rig designs capable of operating in water depths up to 400feet and are currently qualified to operate year-round in the harsh environment of the central North Sea in waterdepths of up to 360 feet. Our three other HDHE jackup rigs, the GSF Monarch, GSF Monitor and GSF Magellan,are Monarch class rig designs capable of operating in water depths of up to 350 feet. These rigs are capable ofoperating year-round in the central North Sea in water depths of up to 300 feet.
Semisubmersible rigs are floating offshore drilling units with pontoons and columns that, when flooded withwater, cause the unit to partially submerge to a predetermined depth. Most semisubmersibles are anchored to thesea bottom, but some use dynamic positioning (“DP”), which allows the vessels to be held in position bycomputer-controlled propellers, known as thrusters. Semisubmersibles are classified into five generations,distinguished mainly by their age, environmental rating, variable deck load and water-depth capability. The GSFAleutian Key is an upgraded second-generation conventionally moored semisubmersible capable of drilling inwater depths up to 2,300 feet. The GSF Arctic I, GSF Arctic II, GSF Arctic III, GSF Arctic IV, GSF GrandBanks, GSF Rig 135 and GSF Rig 140 semisubmersibles are third-generation, conventionally moored rigssuitable for drilling in water depths ranging from 1,200 to 3,400 feet. The GSF Celtic Sea, which utilizes amooring system that is DP-assisted, is a fourth-generation semisubmersible capable of drilling in water depths ofup to 5,750 feet. The fifth-generation ultra-deepwater semisubmersibles GSF Development Driller I and GSFDevelopment Driller II utilize a system that offers either conventional mooring or DP and are capable of drillingin water depths of up to 7,500 feet.
Our “deepwater” rigs consist of our semisubmersibles and drillships. We consider rigs with a maximumwater-depth capability of 7,500 feet or more, such as the semisubmersibles GSF Development Driller I and GSFDevelopment Driller II and the drillships GSF C.R. Luigs, GSF Jack Ryan and GSF Explorer, to be “ultra-deepwater” rigs.
The GSF C.R. Luigs, GSF Jack Ryan and GSF Explorer are dynamically positioned, ultra-deepwaterdrillships capable of drilling in water depths up to 10,000 feet, 10,000 feet and 7,800 feet, respectively, ascurrently equipped. With modifications, maximum water depth capabilities would be 12,000 feet for the GSFC.R. Luigs and GSF Jack Ryan, and 10,000 feet for the GSF Explorer. Drillships are generally preferred fordeepwater drilling in remote locations with moderate weather environments because of their mobility and largeload carrying capability.
We own all of the drilling rigs in our fleet in the table above excluding those specifically described as beingowned by third parties, the GSF Explorer, which is subject to a capital lease with a remaining term of 20 years,and the GSF Jack Ryan, which is subject to a fully defeased capital lease with a remaining term of 14 years.None of our offshore drilling rigs are currently subject to any outstanding liens or mortgages.
In January 2003, in order to take advantage of an attractive financing structure, we entered into a lease-leaseback arrangement with a European bank related to the GSF Britannia cantilevered jackup. Pursuant to thisarrangement, we leased the GSF Britannia to the bank, which then leased the rig back to us, each lease being fora five-year term. We have classified this arrangement as a capital lease.
In the first quarter of 2006 we entered into a contract with Keppel FELS, a shipyard located in Singapore,for construction of a new ultra-deepwater semisubmersible, to be named the GSF Development Driller III.Construction costs, excluding capital spares, startup costs, capitalized interest, customer-required modificationsand mobilization costs, are estimated to total approximately $590 million. Construction commenced in the first
11
quarter of 2006 and delivery is currently expected during the first quarter of 2009. As of December 31, 2006, wehave incurred approximately $220 million of capitalized costs related to the GSF Development Driller III,excluding capitalized interest. We anticipate funding construction through our existing cash, cash equivalents andmarketable securities balances and future cash flow from operations. In the second quarter of 2006 we executed aseven-year drilling contract with a major oil and gas company for the GSF Development Driller III, providing forexpected revenues of approximately $1 billion.
Backlog. Our contract drilling backlog at December 31, 2006, was $10.6 billion, consisting of $9.5 billionrelated to executed contracts and $1.1 billion related to customer commitments for which contracts had not yetbeen executed as of January 31, 2007. Approximately $3.2 billion of the backlog is expected to be realized in2007. Our contract drilling backlog at December 31, 2005 was $4.8 billion.
Drilling Contracts and Major Customers. Contracts to employ our crewed drilling rigs extend over aspecified period of time or the time required to drill a specified well or number of wells. While the final contractfor employment of a rig is the result of negotiations between us and the customer, most contracts are awardedbased upon competitive bidding. For a discussion of competitive conditions, see “Item 1A. Risk Factors—TheIntense Price Competition and Cyclicality of the Drilling Industry, Which is Currently Marked by High Demand,Limited Rig Availability, High Dayrates, and a Substantial Increase in the Supply of Drilling Units, Could Havea Material Adverse Effect on Our Revenues and Profitability.” The rates specified in drilling contracts aregenerally on a dayrate basis and vary depending upon the type of rig employed, equipment and services supplied,geographic location, term of the contract, competitive conditions at the time of negotiations and other variables.Each contract provides for a basic dayrate during drilling operations, and may include performance premiums orlower rates or no payment for periods of equipment breakdown, adverse weather or other conditions which maybe beyond our control. When a rig mobilizes to or demobilizes from an operating area, a contract may providefor different dayrates, specified fixed amounts or no payment during the mobilization or demobilization. Ourability to obtain favorable contract terms and conditions is dependent on market conditions. We are generallyable to avoid contract language allowing termination at the convenience of our customers in longer termcontracts. Of the $9.5 billion of executed contract backlog at January 31, 2007, approximately 1.7% can beterminated without the imposition of significant early termination payments, which are generally equal to the fulldayrate for all of the remaining term or substantial percentage of it. All of this 1.7% is at dayrates that areconsiderably below current market. Contracts may also terminate for other reasons. See “Item 1A. Risk Factors –We May Suffer Losses if our Customers Terminate or Seek to Renegotiate their Contracts.”
Our business is subject to the usual risks associated with having a limited number of customers for ourservices. One customer accounted for more than 10% of consolidated revenues in 2006: BP provided $494.1million of contract drilling revenues, $0.7 million of oil and gas revenues, and $0.4 million of drillingmanagement services revenues. One customer accounted for more than 10% of consolidated revenues in 2005:BP provided $261.0 million of contract drilling revenues and $1.2 million of oil and gas revenues. One customeraccounted for more than 10% of consolidated revenues in 2004: Total S.A. (“Total”) provided $186.0 million ofcontract drilling revenues. Our results of operations could suffer a material adverse effect if any of our majorcustomers terminates its contracts with us, fails to renew our existing contracts or refuses to award new contractsto us. See “Item 1A. Risk Factors—We Rely Heavily on a Small Number of Customers and the Loss of aSignificant Customer Could Have a Material Adverse Impact on Our Financial Results.”
DRILLING MANAGEMENT SERVICES
We provide drilling management services primarily on a turnkey basis through a wholly owned subsidiary,Applied Drilling Technology Inc. (“ADTI”), and through ADT International, a division of one of our U.K.subsidiaries. ADTI operates primarily in the U.S. Gulf of Mexico, and ADT International operates primarily inthe North Sea. Under a typical turnkey arrangement, we will assume responsibility for the design and executionof a well and deliver a logged or cased hole to an agreed depth for a guaranteed price, with payment contingentupon successful completion of the well program. As part of our turnkey drilling services, we provide planning,
12
engineering and management services beyond the scope of our traditional contract drilling business and therebyassume greater risk. In addition to turnkey arrangements, drilling management services also participates inproject management operations. In our project management operations we provide certain planning, managementand engineering services, purchase equipment and provide personnel and other logistical services to customers.Our project management services differ from turnkey drilling services in that the customer retains control of thedrilling operations and thus retains the risk associated with the project.
Our drilling management services business is also subject to the usual risks associated with having a limitednumber of customers for its services. In 2006, one customer, Helis Oil and Gas Company, LLC (“Helis”),accounted for $95.8 million, or 12.7%, of drilling management services revenues. In 2005, one customer, LundinPetroleum (“Lundin”), accounted for $97.5 million, or 16.5%, of drilling management services revenues. Twocustomers each accounted for more than 10% of drilling management services revenues in 2004: Helis provided$60.6 million, or 11.4%, of drilling management services revenues, and Lundin provided $56.6 million, or10.7%, of drilling management services revenues. See “Item 1A. Risk Factors—We Rely Heavily on a SmallNumber of Customers and the Loss of a Significant Customer Could Have a Material Adverse Impact on OurFinancial Results.”
As of December 31, 2006, our drilling management services revenue backlog was an estimated $114.1million, all of which is expected to be realized in 2007. Our drilling management services backlog was anestimated $23.5 million at December 31, 2005.
OIL AND GAS OPERATIONS
We conduct oil and gas exploration, development and production activities through our oil and gas division.We acquire interests in oil and gas properties principally in order to facilitate the awarding of turnkey contractsfor our drilling management services operations. In this capacity, we facilitated the award of 37 projects (27turnkey wells and 10 well completions) in 2006. We participated in 25 of the 27 turnkey wells, of which 22 weresuccessful. Our oil and gas activities are conducted primarily in the United States offshore Louisiana and Texasand in the U.K. sector of the North Sea.
In the first quarter of 2004 we sold our interest in a drilling project in West Africa for approximately $6.1million and recorded a gain of $2.7 million ($2.0 million net of taxes). In September 2004, we completed the saleof 50% of our interest in the Broom Field, a development project in the North Sea. We received net proceeds of$35.9 million and recorded a gain of $25.1 million ($13.3 million net of taxes) in connection with this sale. Weretained an eight percent working interest in this project. Pursuant to the terms of the sale, if commodity pricesexceeded a specified amount, we were also entitled to additional post-closing consideration equal to a portion ofthe proceeds from the production attributable to this interest sold through September 2005. In 2005, we recordedan additional gain associated with this deferred consideration arrangement of $4.5 million ($2.7 million net oftaxes).
JOINT VENTURE, AGENCY AND SPONSORSHIP RELATIONSHIPS AND OTHER INVESTMENTS
In some areas of the world, local customs and practice or governmental requirements necessitate theformation of joint ventures with local participation, which we may or may not control. We are an activeparticipant in several joint venture drilling companies, principally in Azerbaijan, Indonesia, Malaysia, Angolaand Nigeria.
In Azerbaijan, the semisubmersibles Istiglal and Dada Gorgud operate under long-term bareboat chartersbetween Caspian Drilling Company Limited (“CDC”), a joint venture in which we hold a 45% ownershipinterest, and the owner of both rigs, the State Oil Company of the Azerbaijan Republic (“SOCAR”), our soleequity partner in CDC. SOCAR has granted exclusive bareboat charter rights to CDC for the life of the jointventure. During 2005, these bareboat charter rights were extended through October 2011, pursuant to anamendment to the agreement establishing CDC.
13
We also participated in a joint venture that operated a petroleum supply base in Indonesia. The Indonesiansupply base, in which we held a 42% ownership interest, is located at Merak Point on the western portion of theisland of Java. In October 2005, the joint venture entered into an agreement with a third party to sell the entityholding the lease for the supply base. Completion of this sale occurred during the third quarter of 2006. The saledid not have a material impact on our financial statements.
A joint venture in which we hold a passive minority interest operates primarily in Libya, and to a limitedextent in Syria. Syria is identified by the U.S. State Department as a state sponsor of terrorism, In addition, Syriais subject to a number of economic regulations, including sanctions administered by the U.S. TreasuryDepartment’s Office of Foreign Assets Control, and comprehensive restrictions on the export and re-export ofU.S.-origin items to Syria. On June 30, 2006, Libya was removed from the U.S. government’s list of statesponsors of terrorism and is no longer subject to sanctions or embargoes. We believe our passive minorityinvestment has been maintained in accordance with all applicable laws and regulations. Potential investors couldview such passive minority interest negatively, which could adversely affect our reputation and the market forour ordinary shares. In addition, certain U.S. states have recently enacted legislation regarding investments bytheir retirement systems in companies that have business activities or contacts with countries that have beenidentified as terrorist-sponsoring states, and similar legislation may be pending or introduced in other states. As aresult, certain investors may be subject to reporting requirements with respect to investments in companies suchas ours or may be subject to limits or prohibitions with respect to those investments.
Local laws or customs in some areas of the world also effectively mandate establishment of a relationshipwith a local agent or sponsor. When appropriate in these areas, we enter into agency or sponsorship agreements.
EMPLOYEES
We had approximately 5,962 employees worldwide at December 31, 2006, excluding approximately 1,681employees provided through contract labor providers. We require highly skilled personnel to operate our drillingrigs and, accordingly, conduct extensive personnel training and safety programs. Approximately 126 of our localemployees in Nigeria and 195 of our local employees in Trinidad are represented by labor unions. Through ourmembership in the U.K. Drilling Contractors Association, we have also entered into a recognition agreementwith a union that covers approximately 820 of our 994 employees in the North Sea.
EXECUTIVE OFFICERS OF THE REGISTRANT
The name, age as of December 31, 2006, and office or offices currently held by each of our executiveofficers are as follows:
Name Age Office or Offices
Jon A. Marshall . . . . . . . . . . . 55 President and Chief Executive OfficerW. Matt Ralls . . . . . . . . . . . . 57 Executive Vice President and Chief Operating OfficerMichael R. Dawson . . . . . . . . 53 Senior Vice President and Chief Financial OfficerRoger B. Hunt . . . . . . . . . . . . 57 Senior Vice President, MarketingJames L. McCulloch . . . . . . . 54 Senior Vice President and General CounselCheryl D. Richard . . . . . . . . . 50 Senior Vice President, Human ResourcesR. Blake Simmons* . . . . . . . 48 President of Applied Drilling Technology Inc.Robert L. Herrin, Jr. . . . . . . . 48 Vice President and Controller
* Effective March 1, 2007, Mr. Simmons will be named Senior Vice President, Operations. Stephen E.Morrison will succeed Mr. Simmons in his role as President of Applied Drilling Technology Inc.Mr. Morrison currently serves as ADTI’s Vice President of Planning and Analysis, a position he has heldsince 1998.
14
Officers serve for a one-year term or until their successors are elected and qualified to serve. Each executiveofficer’s principal occupation has been as one of our executive officers or as an executive officer of one of ourpredecessors, Santa Fe International or Global Marine, for more than the past five years, with the exception ofMs. Richard, Mr. Simmons, and Mr. Herrin. Ms. Richard has been our Senior Vice President, Human Resourcessince 2003. Prior to joining our organization, Ms. Richard was Vice President, Human Resources, with ChevronPhillips Chemical Company from 2000 to 2003, prior to which she served in a variety of positions with PhillipsPetroleum Company (now ConocoPhillips), including operational, commercial and international positions.Mr. Simmons has been President of Applied Drilling Technology Inc. since 2003. Previously he served asRegional Vice President of GlobalSantaFe Drilling U.K. Limited from 2001 to 2003. Mr. Herrin has been VicePresident and Controller since 2005. He previously served as Vice President of Internal Audit from 2002 to 2005,prior to which he served as Director of Audit from 1997 to 2002. Mr. Ralls was promoted to Executive VicePresident and Chief Operating Officer in 2005. Mr. Ralls previously served as Senior Vice President and ChiefFinancial Officer from 1999 to 2005. Mr. Dawson was promoted to Senior Vice President and Chief FinancialOfficer in 2005. He previously served as Vice President and Controller from 2003 to 2005 and Vice Presidentand Treasurer from 2001 to 2003, prior to which he was Vice President, Investor Relations and CorporateCommunications.
OTHER
For a discussion of the effects of environmental regulation, see “Item 1A. Risk Factors—Laws andGovernmental Regulations May Add to Costs or Limit Drilling Activity.” and “—Governmental Regulations andEnvironmental Matters Could Significantly Affect Our Operations and Environmental Liabilities Could Have anAdverse Effect on Us.” We have made and will continue to make expenditures to comply with environmentalrequirements. To date we have not expended material amounts in order to comply and we do not believe that ourcompliance with such requirements will have a material adverse effect upon our results of operations orcompetitive position or materially increase our capital expenditures.
For a discussion of the risks associated with our foreign operations, see “Item 1A. Risk Factors—OurInternational Operations Involve Additional Risks Not Generally Associated With Our Domestic Operations,Which Could Have a Material Adverse Effect on Our Operations or Financial Results.” and “—We May SufferLosses as a Result of Foreign Exchange Restrictions, Foreign Currency Fluctuations, and Limitations on theAbility to Repatriate Income or Capital to the U.S.”
LICENSES AND PATENTS
We entered into a settlement with Transocean, effective February 14, 2006, that allowed us to obtain alicense in order to use their patented dual drilling structure and method on the GSF Development Driller I, GSFDevelopment Driller II, and GSF Development Driller III. See “Item 3. Legal Proceedings” for a furtherdescription of the license.
15
ITEM 1A. RISK FACTORS
Risk Factors
A MATERIAL OR EXTENDED DECLINE IN EXPENDITURES BY THE OIL AND GAS INDUSTRY, DUE TO A DECLINE
OR VOLATILITY IN OIL AND GAS PRICES, A DECREASE IN DEMAND FOR OIL AND GAS OR OTHER FACTORS,COULD SIGNIFICANTLY REDUCE OUR REVENUE AND INCOME.
Our business depends on the level of offshore oil and natural gas exploration, development and productionactivity in markets worldwide. Prices and demand for oil and natural gas, and market expectations of potentialchanges in demand and prices, significantly affect this level of activity. Worldwide military, political andeconomic events have contributed to oil and natural gas price volatility and are likely to continue to do so in thefuture. Numerous factors may affect oil and natural gas prices and, accordingly, the level of demand for ourservices, including:
• worldwide demand for oil and natural gas;
• the ability of the Organization of Petroleum Exporting Countries, or OPEC, to set and maintainproduction levels and pricing;
• the level of production by non-OPEC countries;
• changes in supply and demand resulting from the development of liquefied natural gas markets;
• the worldwide military or political environment, including uncertainty or instability resulting from thesituation in Iraq or other armed hostilities in the Middle East or other geographic areas in which weoperate, or further acts of terrorism in the United States or elsewhere;
• labor, political or other disruptions that limit exploration, development and production in oil-producingcountries;
• domestic and foreign tax policy;
• laws and governmental regulations that restrict exploration and development of oil and natural gas invarious jurisdictions;
• advances in exploration and development technology that may affect the marketability of our rigs; and
• further consolidation of our customer base.
Depending on the market prices of oil and natural gas, companies exploring for oil and gas may cancel orcurtail their drilling programs, thereby reducing demand for drilling services. Even during periods of high pricesfor oil and natural gas, companies exploring for oil and gas may cancel or curtail programs, or reduce their levelsof capital expenditures for exploration and production for a variety of reasons. Any reduction in the demand fordrilling services may materially erode dayrates and utilization rates for our rigs and adversely affect our financialresults.
THE INTENSE PRICE COMPETITION AND CYCLICALITY OF THE DRILLING INDUSTRY, WHICH IS CURRENTLY
MARKED BY HIGH DEMAND, LIMITED RIG AVAILABILITY, HIGH DAYRATES, AND A SUBSTANTIAL INCREASE IN
THE SUPPLY OF DRILLING UNITS, COULD HAVE A MATERIAL ADVERSE EFFECT ON OUR REVENUES AND
PROFITABILITY.
The contract drilling business is highly competitive, and we compete with numerous offshore drillingcontractors, one of which is larger and has greater resources than us. The drilling industry has experiencedconsolidation in recent years and may experience additional consolidation, which could create additional largecompetitors.
Drilling contracts are, for the most part, awarded on a competitive bid basis. Price competition is often theprimary factor in determining which qualified contractor is awarded a job, although rig availability and thequality and technical capability of service and equipment are also factors.
16
Mergers among oil and natural gas exploration and production companies have reduced the number ofavailable customers, and our business is subject to the risks associated with having a limited number ofcustomers for our services.
We may be required to idle rigs or to enter into lower dayrate contracts in response to market conditions inthe future. The industry in which we operate historically has been cyclical, with periods of high demand,inadequate rig supply and increasing dayrates, which have characterized the condition of the market for the lastfew years, being followed by periods of low demand or excess rig supply, resulting in lower utilization anddecreasing dayrates. During prior periods of high utilization and dayrates, industry participants have increasedthe supply of rigs by ordering the construction of new units. This has often created an oversupply of drilling unitsand has caused a decline in utilization and dayrates when the rigs enter the market, sometimes for extendedperiods of time as rigs were absorbed into the active fleet.
Eleven premium jackup newbuild rigs have entered into the market since January 1, 2006, and constructionis in progress or contracts have been announced for the construction of at least 65 additional premium jackuprigs, an increase in the worldwide premium jackup fleet of approximately 40%. In the deepwater and ultra-deepwater rig class, there have been announcements of the upgrade of five semisubmersibles to deepwater orultra-deepwater capability and the construction of over 50 new high-specification rigs, an increase in the units inthe deepwater fleet of approximately 50%. Most of these rigs, including our GSF Development Driller III, areultra-deepwater units and represent an increase in the number of ultra-deepwater units worldwide ofapproximately 160%. Delivery dates for newbuild units range from the first quarter of 2007 through 2010, with amajority of the newbuild jackups scheduled for delivery in 2007 and 2008. However, we expect that the deliveryof a number of the units, primarily the deepwater and ultra-deepwater rigs, will be delayed. A number of theshipyard contracts for units currently under construction provide for options for the construction of additionalunits and we believe further new construction announcements are likely for all classes of rigs. The entry intoservice of newly constructed, upgraded or reactivated units will increase supply and could curtail a furtherstrengthening of dayrates, or reduce them, in the affected markets or result in a softening of the affected marketsas rigs are absorbed into the active fleet, particularly in periods subsequent to 2007. In addition, the marketing ofthe newbuild jackup and deepwater and ultra-deepwater rigs scheduled for delivery in future periods could havean adverse effect, even in advance of the rigs’ delivery dates. Further increases in construction of new drillingunits could exacerbate any such negative impacts on utilization and dayrates. Lower utilization and dayrates inone or more of the regions in which we operate could adversely affect our revenues and profitability. Prolongedperiods of low utilization and dayrates could also result in the recognition of impairment charges on certain ofour drilling rigs if future cash flow estimates, based upon information available to management at the time,indicate that the carrying value of these assets may not be recoverable.
CONTINUING WORLD TENSIONS, INCLUDING AS THE RESULT OF WARS, OTHER ARMED CONFLICTS AND
TERRORIST ATTACKS, COULD HAVE A MATERIAL ADVERSE EFFECT ON OUR BUSINESS.
Continuing world tensions, including those relating to the Middle East and North Korea, as well as terroristattacks in various locations and related unrest, have significantly increased worldwide political and economicinstability, including as it relates to the exploration for and production of oil and gas. The continuation orescalation of existing armed hostilities or the outbreak of additional hostilities as a consequence of further acts ofterrorism or otherwise, could cause a downturn in the economies of the United States and other countries. Alower level of economic activity could result in a decline in energy consumption or an increase in the volatility ofenergy prices, either of which could adversely affect dayrates or utilization, and accordingly our results ofoperations and future prospects. In addition, our operations in the Middle East could be directly adverselyaffected by post-war conditions in Iraq to the extent armed hostilities, acts of terrorism or other unrest persist.Acts of terrorism and threats of armed conflicts elsewhere in the Middle East and in or around various other areasin which we operate, such as Southeast Asia and West Africa, could also directly limit or disrupt our markets andoperations through the evacuation of personnel, cancellation of drilling contracts, or loss of personnel or assets.Accordingly, our business could be materially adversely affected by the continuation of existing armed conflicts
17
or future armed conflicts or acts of terrorism and any resulting instability, either as a result of the adverse effectof these events on the oil and gas industry or the direct impact on our operations and assets.
Terrorism and world tensions have also caused instability in some of the world’s insurance and financialmarkets. Immediately following the events of September 11, 2001, our war risk and terrorist insuranceunderwriters canceled those coverages in accordance with the terms of the policies and would only reinstate themfor significantly higher premiums. We have reinstated and currently maintain war and terrorism coverage forphysical damage to our entire fleet. Such war and terrorism coverage is generally cancelable by underwriters onforty-eight hours’ notice, and, accordingly, following any future acts of terrorism or armed conflicts in andaround the various areas in which we operate, underwriters could cancel this coverage completely or cancel andthen offer to reinstate on terms that may not be acceptable to us. We may not have insurance to cover any or allof our liabilities to our personnel for death or injury caused by terrorist acts. These developments could subjectour worldwide operations to increased risks and, depending on their magnitude, could have a material adverseeffect on our business.
United States Government regulations effectively preclude us from actively engaging in business activitiesin certain countries, including oil-producing countries such as Iran. These regulations could be amended to covercountries where we currently operate or where we may wish to operate in the future.
WE AND CERTAIN OF OUR SUBSIDIARIES ARE SUBJECT TO LITIGATION THAT, IF NOT RESOLVED IN OUR FAVOR
AND NOT SUFFICIENTLY INSURED AGAINST, COULD HAVE A MATERIAL ADVERSE EFFECT ON US.
We and our subsidiaries are subject to a variety of litigation and may be sued in additional cases. Certain ofour subsidiaries are named as defendants in numerous lawsuits alleging personal injury as a result of exposure toasbestos, silicosis, exposure to toxic fumes or other occupational diseases and medical issues that can remainundiscovered for a considerable amount of time. Some subsidiaries that have been put on notice of potentialliabilities have no assets. Other subsidiaries are subject to litigation relating to environmental damage. We cannotpredict the outcome of these cases involving our subsidiaries or the potential costs to resolve them. We cannotassure you that insurance will be applicable and sufficient in all cases, that insurers will remain solvent, or thatpolicies will be located. Suits against non-asset owning subsidiaries have and may in the future give rise to alterego or successor in interest claims against GlobalSantaFe Corporation and its asset-owning subsidiaries to theextent a subsidiary is unable to pay a claim or insurance is not available or sufficient to cover the claims. To theextent that one or more pending or future litigation matters are not resolved in our favor and are not covered byinsurance, that could have a material adverse effect on our financial results and condition. For additionalinformation regarding these legal proceedings, see “Item 3. Legal Proceedings.”
TURNKEY DRILLING OPERATIONS ARE CONTINGENT ON OUR ABILITY TO WIN BIDS AND ON RIG AVAILABILITY,AND THE FAILURE TO WIN BIDS OR OBTAIN RIGS FOR ANY REASON MAY HAVE A MATERIAL ADVERSE EFFECT
ON OUR FINANCIAL RESULTS.
Our results of operations from our drilling management services segment may be limited by certain factors,including our ability to find and retain qualified personnel, to hire suitable rigs at acceptable rates, and to obtainand successfully perform turnkey drilling contracts based on competitive bids. Our ability to obtain turnkeydrilling contracts is largely dependent on the number of these contracts available for bid, which in turn isinfluenced by market prices for oil and natural gas, among other factors. Furthermore, our ability to enter intoturnkey drilling contracts may be constrained from time to time by the availability of GlobalSantaFe or third-party drilling rigs. Constraints on the availability of rigs may cause delays in our drilling management projectsand a reduction in the number of projects that we can complete overall, which could have an adverse effect onour results of operations.
18
TURNKEY DRILLING OPERATIONS EXPOSE US TO ADDITIONAL RISKS, WHICH CAN ADVERSELY AFFECT OUR
PROFITABILITY, BECAUSE WE ASSUME THE RISK FOR OPERATIONAL PROBLEMS AND THE CONTRACTS ARE ON
A FIXED-PRICE BASIS.
We enter into a significant number of turnkey contracts each year. Our compensation under turnkeycontracts depends on whether we successfully drill to a specified depth or, under some of our contracts, completethe well. Unlike dayrate contracts, where ultimate control is exercised by the customer, we are exposed toadditional risks when serving as a turnkey drilling contractor because we make all critical decisions. Under aturnkey contract, the amount of our compensation is fixed at the amount we bid to drill the well. Thus, we are notpaid if operational problems prevent performance unless we choose to drill a new well at our own expense.Further, we must absorb the loss if problems arise that cause the cost of performance to exceed the turnkey price.Given the complexities of drilling a well, it is not unusual for unforeseen problems to arise. We are not generallyinsured against risks of unbudgeted costs associated with turnkey drilling operations. By contrast, in a dayratecontract, the customer retains most of these risks. As a result of the additional risks we assume in performingturnkey contracts, costs incurred from time to time exceed revenues earned. Accordingly, in prior quarters wehave incurred significant losses on certain of our turnkey contracts, and we expect that will continue to be thecase in the future. Depending on the size of these losses, they may have a material adverse affect on theprofitability of our turnkey drilling segment in a given period.
FAILURE TO OBTAIN AND RETAIN KEY PERSONNEL COULD IMPEDE OPERATIONS.
We require highly skilled personnel to operate our rigs and provide technical services and support for ourcontract drilling and drilling management services business. Competition for the labor required for deepwaterand other drilling operations, including for our turnkey drilling and drilling management services businesses andour construction projects, intensifies as the number of rigs activated, added to worldwide fleets or underconstruction increases. Historically, in periods of high utilization, such as the current period, we have found itmore difficult to find and retain qualified individuals. We have experienced significant tightening in the relevantlabor markets over the last two years and have lost some experienced personnel to our customers andcompetitors. In response to these market conditions, we have instituted retention programs, including increases incompensation, and have incurred other costs to assist in our retention of our work force. If these labor trendscontinue, they could increase our costs further or limit our operations.
WE RELY HEAVILY ON A SMALL NUMBER OF CUSTOMERS AND THE LOSS OF A SIGNIFICANT CUSTOMER COULD
HAVE A MATERIAL ADVERSE IMPACT ON OUR FINANCIAL RESULTS.
Our contract drilling business is subject to the usual risks associated with having a limited number ofcustomers for our services. BP provided approximately $495.2 million, or 15%, of our consolidated revenues in2006. Our five next largest customers for 2006, Total, ENI, Shell, ExxonMobil, and Chevron, none of whichindividually represented more than 10% of revenues, accounted in the aggregate for approximately 31% of our2006 consolidated revenues. BP provided approximately $262.2 million, or 11.6%, of our consolidated revenuesin 2005. Our five next largest customers for 2005 (Chevron, Total, ExxonMobil, ENI, and Lundin Petroleum),none of which individually represented more than 10% of revenues, accounted in the aggregate forapproximately 36.5% of our 2005 consolidated revenues. Our results of operations could be materially adverselyaffected if any of our major customers were to terminate its contracts with us, fails to renew its existing contractsor refuses to award new contracts to us.
Our drilling management services business is also subject to the usual risks associated with having a limitednumber of customers for its services. In 2006, one customer, Helis, accounted for $95.8 million, or 12.7%, ofdrilling management services revenues. Our five next largest drilling management services customers, none ofwhich individually represented more than 10% of drilling management services revenues, accounted in theaggregate for approximately 31.5% of drilling management services revenues for 2006. In 2005, one customer,Lundin Petroleum, accounted for $97.5 million, or 16.5%, of drilling management services revenues. Our five
19
next largest drilling management services customers, none of which individually represented more than 10% ofdrilling management services revenues, accounted in the aggregate for approximately 35% of drillingmanagement services revenues for 2005.
WE MAY SUFFER LOSSES IF OUR CUSTOMERS TERMINATE OR SEEK TO RENEGOTIATE THEIR CONTRACTS.
Certain of our contracts with customers may be cancelable at the option of the customer upon payment of anearly termination payment. Such payments may not, however, fully compensate us for the loss of the contract.Contracts also customarily provide for either automatic termination or termination at the option of the customerfor poor performance, in the event of total loss of the drilling rig, if drilling operations are suspended forextended periods of time by reason of acts of God or excessive rig downtime for repairs, or in the event of otherspecified conditions. Early termination of a contract may result in a rig being idle for an extended period of time.Our revenues, results of operations and cash flow may be adversely affected by customers’ early termination ofcontracts, especially if we are unable to recontract the affected rig within a short period of time. Duringdepressed market conditions, a customer may no longer need a rig that is currently under contract or may be ableto obtain a comparable rig at a lower daily rate. As a result, customers may seek to renegotiate the terms of theirexisting drilling contracts or avoid their obligations under those contracts. The renegotiation of a number of ourdrilling contracts could adversely affect our financial position, results of operations and cash flows.
RIG UPGRADE, REFURBISHMENT AND CONSTRUCTION PROJECTS, INCLUDING OUR CURRENT SEMISUBMERSIBLE
CONSTRUCTION PROJECT, AND RIG MAINTENANCE AND REPAIRS ARE SUBJECT TO RISKS INCLUDING DELAYS
AND COST OVERRUNS, WHICH COULD HAVE A MATERIAL ADVERSE IMPACT ON OUR RESULTS OF OPERATIONS.
We currently have an ultra-deepwater semisubmersible rig under construction to be named the GSFDevelopment Driller III. We may also enter into contracts for the construction of additional rigs and may makemajor upgrade and refurbishment expenditures for our fleet in the future. Rig upgrade, refurbishment andconstruction projects and rig repairs are subject to the risks of delay or cost overruns inherent in any largeconstruction project, some of which currently may be exacerbated by increased drilling activity worldwide andthe increase in construction and upgrade projects. Such risks include the following:
• shortages of materials or skilled labor;
• unforeseen engineering problems;
• unanticipated actual or purported change orders;
• work stoppages;
• financial or operating difficulties of the shipyard upgrading, refurbishing or constructing the rig;
• adverse weather conditions;
• unanticipated cost increases; and
• inability to obtain any of the requisite permits or approvals.
These and other factors could cause delays in the delivery schedule and increases in the costs of upgrade ornewbuild projects, including the GSF Development Driller III, and materially and adversely affect our financialcondition and results of operations.
Our ongoing operations also rely on a significant supply of capital and consumable spare parts andequipment to maintain and repair our fleet. We also rely on the supply of ancillary services, including supplyboats and helicopters. Recently, we have experienced increased delivery times from vendors due to increaseddrilling activity worldwide and the increase in construction and upgrade projects. We have also experienced atightening in the availability of ancillary services. Unanticipated shortages in materials, delays in the delivery ofnecessary spare parts, equipment or other materials, or the unavailability of ancillary services could negativelyimpact our future operations and result in increases in rig downtime, and delays in the repair and maintenance ofour fleet.
20
Additionally, new, refurbished or upgraded rigs may face complications following completion ofconstruction work. For example, the commencement of initial drilling contracts for the GSF DevelopmentDriller I and GSF Development Driller II were delayed due to a thruster defect and resulting damage in thethruster nozzles. We could also encounter further unexpected difficulties or complications in the use of these rigsor of other rigs in the future that could result in additional downtime or the cancellation of drilling contracts. Inaddition, our two newly completed semisubmersibles, as well as the one under construction, employadvancements in technology that may lead to certain difficulties, both operational and legal, as to our use of thistechnology. Our inability to use this technology, or to use it efficiently, could render these rigs less competitivein the marketplace.
OUR BUSINESS INVOLVES NUMEROUS OPERATING HAZARDS AND WE ARE NOT FULLY INSURED AGAINST ALL
OF THEM AND THE AMOUNT OF RISK AGAINST WHICH WE ARE NOT INSURED MAY INCREASE; THE
OCCURRENCE OF AN UNINSURED OR UNIDENTIFIED EVENT COULD HAVE A MATERIAL ADVERSE EFFECT ON
OUR RESULTS OF OPERATIONS AND FINANCIAL CONDITION.
Our operations are subject to the usual hazards incident to the drilling of oil and natural gas wells, includingblowouts, explosions, oil spills and fires. Our activities are also subject to hazards peculiar to marine operations,such as collision, grounding, and damage or loss from severe weather. All of these hazards can cause personalinjury and loss of life, severe damage to and destruction of property and equipment, pollution or environmentaldamage and suspension of operations. We insure against, or have indemnification from customers for some, butnot all, of these risks. We insure only a small percentage of our fleet against loss of revenue for rigs that aredamaged. Our insurance contains various deductibles and limitations on coverage. The occurrence of asignificant event, including terrorist acts, war, civil disturbances, pollution, environmental damage or hurricanes,not fully insured or indemnified against or the failure of a customer to meet its indemnification obligations, couldmaterially and adversely affect our operations and financial condition.
During the third quarter of 2005, a number of our rigs were damaged as a result of Hurricanes Katrina andRita. All of these rigs have now returned to work with the exception of the GSF Adriatic VII, which we sold inDecember 2006, and the GSF High Island III, which is contracted for sale.
All of the rigs that were damaged in the hurricanes were covered for physical damage under the hull andmachinery provision of our insurance policy, which carries a deductible of $10 million per occurrence. Inaddition, three rigs damaged in Hurricane Katrina, the GSF Arctic I, the GSF Development Driller I and the GSFDevelopment Driller II, were covered by loss of hire insurance under which we are reimbursed for 100 percent ofeach rig’s contracted dayrate for up to a maximum of 270 days per rig following 60 days (the “waiting period”)of lost revenue. Our insurance policy provided that if claims for a single event are filed under both the hull andmachinery and loss of hire sections of the policy, we would bear only a single deductible from that occurrence ofno more than the highest deductible from any individual section. Hurricanes Katrina and Rita are each consideredto be a separate occurrence. Based on remediations completed for the three rigs covered under the loss of hireinsurance, the amount of revenue we lost during the waiting period will be higher than the $10 million hull andmachinery deductible. Therefore, the 60-day waiting period under our loss of hire insurance will serve as the onlydeductible for the Hurricane Katrina event. None of the jackup rigs damaged during Hurricane Rita were insuredfor loss of hire and, therefore, a single $10 million hull and machinery deductible applied for damage to the rigscaused by Hurricane Rita and was recognized as a loss in the third quarter of 2005. We have made substantialinsurance claims as a result of the damage sustained by these rigs. As required by the financial accounting rulesrequiring us to record amounts we consider to be collectible, we have recorded both an estimate of the loss forthe damage to our rigs in the hurricanes and an estimate of our expected insurance recovery for that loss.Although we have filed claims for those losses, we have thus far recovered only a portion of the amounts fromour insurers, and we have not received any assurances from them as to what our ultimate recovery will be. Inaddition, we could receive less than the anticipated amounts from our insurers for physical damage to our rigs,and we could therefore suffer losses in excess of the $10 million deductible for hull and machinery damage forvarious reasons, including disagreements with our insurers as to recoverable costs or financial difficulties of ourinsurers.
21
Moreover, there may be disputes with our insurers as to what amounts we may ultimately recover under ourhull and machinery and loss of hire insurance due to the thruster damage sustained by the GSF DevelopmentDriller I and the GSF Development Driller II prior to the hurricanes. The underwriters have formally reservedtheir rights to decline coverage for the thruster damage claims on the rigs in respect of both the hull andmachinery and loss of hire coverage. Both rigs were being remediated for a thruster defect and resulting damagewhen they sustained additional damage as a result of Hurricane Katrina, which further delayed the start of theinitial drilling contracts for both rigs. We have made claims under our hull and machinery and loss of hireinsurance for the GSF Development Driller I and GSF Development Driller II for the periods required toremediate the damage arising from both the thruster defect and Hurricane Katrina. If our insurers agree to pay thehull and machinery claims, significant unresolved issues remain as to the proper application of the loss of hirewaiting period, which could lead to substantial differences in the amount of the loss of hire recovery. As ofDecember 31, 2006, we have recorded estimated loss of hire insurance recoveries with respect to the GSFDevelopment Driller I, in the amount we deem to be probable under the assumption that the rig will bear twoconsecutive 60-day waiting periods, one for the thruster damage claim and one for the hurricane damage claim.The GSF Development Driller II was not out of service longer than the combined 120-day waiting period andtherefore no loss of hire recoveries have been recorded for this rig. When the loss of hire claims are resolved withthe underwriters, the amount of loss of hire recoveries could be different than the amount currently recorded. See“Item 7. Management’s Discussion and Analysis of Financial Condition and Results of Operations—Liquidityand Capital Resources—Investing and Financing Activities” for more information regarding these matters.
The catastrophic damage to the oil and gas industry infrastructure in the U.S. Gulf of Mexico brought aboutby Hurricanes Katrina and Rita and resulting insurance claims produced extremely large losses in the energyinsurance market and has led to substantial increases in reinsurance premiums and significant restrictions incoverage for our insurance underwriters. As a result, when we completed our annual renewal in 2006, ourinsurance premiums increased from an estimated $32 million to approximately $68 million, in part due to anapproximate 57% increase in insured hull values and a 161% increase in insured dayrates. We also experiencedchanges in our insurance coverage when we completed our annual renewal. Our deductible for insurance for rigphysical damage remains at $10 million per occurrence, but an additional $20 million annual aggregate has nowbeen imposed on us, which requires us to absorb the first $20 million of losses above the per occurrencedeductible. We also have an $11 million per occurrence retention for liability claims. Our windstorm coveragefor Gulf of Mexico claims is now subject to a $200 million annual aggregate limit, of which we self-insure21.5%, resulting in a maximum potential recovery of $157 million under this coverage. The increases inpremiums and deductibles would have substantially reduced our insurance recoveries from the 2005 hurricanes ifthese changes were in effect at the time and they may subject us to increased risks and could materially andadversely affect our operations and financial condition in the future.
Moreover, in the future we may experience instability in the world’s insurance markets, including capitalshortfalls and liquidity concerns for insurers of our assets. As a result of insurance market conditions anddevelopments, we may be required to pay higher premiums or may further increase our deductibles or limits inorder to offset or mitigate premium increases. We may also experience further reductions and exclusions fromcoverage, such as elimination of coverage, or significant restrictions on the amount of money recoverable forGulf of Mexico windstorm or other claims, or we may elect to change our insurance coverage, by increasingdeductibles, retentions and other limitations on coverage, which could effectively further increase the amount ofrisk against which we are not insured. We may not be able to maintain adequate insurance at rates we considerreasonable or be able to obtain insurance against certain risks in the future.
Additionally, insurance market conditions could adversely impact certain of our customers and their demandfor our services. In the Gulf of Mexico, our drilling management and oil and gas segments rely in large part onindependent oil and gas operators. As a result of the catastrophic impact of Hurricanes Katrina and Rita and theresulting insurance claims, insurance underwriters have substantially increased premiums and significantlyrestricted coverages for operators in the Gulf of Mexico. As a result, our drilling management clients andpartners in our oil and gas operations may not be able to maintain adequate insurance coverage or be able to
22
insure against certain risks. This could reduce the ability of these companies to borrow funds, and may result insignificant uninsured losses for physical damage or lost income as a result of hurricanes, and could reduce thenumber of such operators or reduce the volume of wells drilled in this region. These developments couldmaterially and adversely affect the operations of these lines of business in the Gulf of Mexico.
OUR ABILITY TO OPERATE OUR RIGS IN THE U.S. GULF OF MEXICO COULD BE RESTRICTED BY GOVERNMENT
REGULATION OR REQUIREMENTS OF OUR INSURANCE UNDERWRITERS.
Hurricanes Ivan, Katrina and Rita caused damage to a number of rigs in the Gulf of Mexico fleet and rigsthat were moved off location by the storms may have damaged platforms, pipelines, wellheads and other drillingrigs during their movements. The Minerals Management Service of the U.S. Department of the Interior (“MMS”)has conducted hearings and is undertaking studies to determine methods to prevent or reduce the number of suchincidents in the future. The MMS issued interim guidelines for the 2006 hurricane season requiring jackupdrilling rigs operating in the Gulf of Mexico to operate during hurricane season with a greater air gap betweenthe hull of the rig and the water, effectively reducing the water depth in which the rigs can operate. The interimregulations also require operators to conduct more stringent assessments of the soil conditions in which the rigsoperate in order to increase the survivability of rigs in hurricane conditions. These interim regulations limit theareas in which particular jackup rigs can operate and expose operators to greater risk of a contracted rig not beingable to operate at a specified location, and may reduce the marketability of certain rigs or generally decrease thedemand for jackup rigs during hurricane season. The MMS has proposed 2007 guidelines for jackups, whichcould add other requirements and may further reduce the capability of our Gulf of Mexico jackup fleet. In 2006,the MMS issued interim guidelines requiring that semisubmersibles operating in the Gulf of Mexico assess theirmooring systems against stricter criteria. Although our rigs operate in compliance with the MMS 2006 interimguidelines, the proposed MMS 2007 guidelines for semisubmersibles, which impose even stricter mooringsystem criteria, could negatively impact the operations of one of our semisubmersibles if it were to continueoperating in the Gulf of Mexico during hurricane season. Moreover, the MMS may issue additional regulationsor underwriters may take steps that could increase the cost of operations or reduce the area of operations for ourrigs in the future, thus reducing their marketability. Implementation of MMS regulations or requirements of ourinsurance underwriters may subject us to increased costs or limit the operational capabilities of our rigs and couldmaterially and adversely affect our operations in the Gulf of Mexico.
OUR INTERNATIONAL OPERATIONS INVOLVE ADDITIONAL RISKS NOT GENERALLY ASSOCIATED WITH
DOMESTIC OPERATIONS, WHICH COULD HAVE A MATERIAL ADVERSE EFFECT ON OUR OPERATIONS OR
FINANCIAL RESULTS.
Risks associated with our international operations, including drilling management services, any of whichcould limit or disrupt our markets or operations, include heightened risks of:
• terrorist acts, war and civil disturbances;
• expropriation or nationalization of assets;
• renegotiation or nullification of existing contracts;
• foreign taxation, including changes in law or interpretation of existing law;
• assaults on property or personnel;
• changing political conditions;
• foreign and domestic monetary policies; and
• travel limitations or operational problems caused by public health threats.
Additionally, our ability to compete in the international market may be adversely affected by non-U.S.governmental regulations favoring or requiring the awarding of drilling contracts to local contractors or requiring
23

foreign contractors to employ citizens of, or purchase supplies from, a particular jurisdiction. Furthermore,foreign governmental regulations, which may in the future become applicable to the oil and natural gas industry,could reduce demand for our services, or such regulations could directly affect our ability to compete forcustomers or significantly increase our costs.
Due to our structure and extensive foreign operations, our effective tax rate is based on the provisions ofnumerous tax treaties, conventions and agreements between various countries and taxing jurisdictions, as well asthe tax laws of many jurisdictions. Changes in one or more of these tax regimes, changes in tax laws or changesin the interpretation of existing laws in these regimes could also have a material adverse effect on us.
PUBLIC HEALTH THREATS COULD HAVE A MATERIAL ADVERSE EFFECT ON OUR INTERNATIONAL OPERATIONS
AND OUR FINANCIAL RESULTS.
Public health threats, such as Severe Acute Respiratory Syndrome (SARS), a highly communicable disease,outbreaks of which occurred early in 2003 in Southeast Asia and other parts of the world in which we operate, orthe widespread transmission of avian influenza (bird flu) in humans, could adversely impact the global economy,the worldwide demand for oil and natural gas, and the level of demand for our services. Any quarantine ofpersonnel or inability to access our offices or rigs could adversely affect our operations. Travel restrictions oroperational problems in any part of the world in which we operate, or any reduction in the demand for drillingservices caused by public health threats in the future, may materially impact operations and adversely affect ourfinancial results.
WE MAY SUFFER LOSSES AS A RESULT OF FOREIGN EXCHANGE RESTRICTIONS, FOREIGN CURRENCY
FLUCTUATIONS, AND LIMITATIONS ON THE ABILITY TO REPATRIATE INCOME OR CAPITAL TO THE U.S.
A substantial portion of our international drilling and services contracts are partially payable in localcurrency in amounts that are generally intended to approximate our estimated local operating costs, with thebalance of the payments under the contract payable in U.S. dollars (except in Malaysia, where we are paidentirely in local currency). In certain jurisdictions, including Egypt and Nigeria, regulations exist whichdetermine the amounts payable in local currency. Those amounts can exceed the local currency costs beingincurred, leading to accumulations of excess local currency, which in certain instances can be subject to eithertemporary blocking or difficulties in converting to U.S. dollars. To the extent our revenues and assetsdenominated in local currency do not equal our local operating expenses and liabilities, or during periods of idletime when no revenue is earned, we are exposed to currency exchange transaction losses, which could materiallyand adversely affect our results of operations and financial condition. We incurred foreign currency exchangelosses totaling approximately $0.9 million, $2.3 million, and $6.1 million in 2006, 2005, and 2004, respectively.Although we have not historically entered into financial hedging arrangements to manage risks relating tofluctuations in currency exchange rates, we may enter into such arrangements in the future and sucharrangements, themselves, could produce losses.
LAWS AND GOVERNMENTAL REGULATIONS MAY ADD TO COSTS OR LIMIT DRILLING ACTIVITY.
Our business is affected by changes in public policy and by federal, state, foreign and local laws andregulations relating to the energy industry. The drilling industry is dependent on demand for services from the oiland natural gas exploration and production industry and, accordingly, we are directly affected by the adoption oflaws and regulations curtailing exploration and development drilling for oil and natural gas for economic,environmental and other policy reasons. We may be required to make significant capital expenditures to complywith governmental laws and regulations. It is also possible that these laws and regulations may in the future addsignificantly to our operating costs or may significantly limit drilling activity.
Governments in some non-U.S. countries have become increasingly active in regulating and controlling theownership of concessions, companies holding concessions, the exploration for oil and natural gas, and other
24
aspects of the oil and natural gas industries in these countries. In some areas of the world, this governmentalactivity has adversely affected the amount of exploration and development work done by major oil companiesand may continue to do so.
GOVERNMENTAL REGULATIONS AND ENVIRONMENTAL MATTERS COULD SIGNIFICANTLY AFFECT OUR
OPERATIONS AND ENVIRONMENTAL LIABILITIES COULD HAVE A MATERIAL ADVERSE EFFECT ON US.
Our operations are subject to numerous federal, state, and local laws and regulations controlling thedischarge of materials into the environment or otherwise relating to the protection of the environment. As aresult, the application of these laws could have a material adverse effect on our results of operations byincreasing our cost of doing business, discouraging our customers from drilling for hydrocarbons, or subjectingus to liability. For example, we, as an operator of mobile offshore drilling units in navigable U.S. waters andcertain offshore areas, including the Outer Continental Shelf, are liable for damages and for the cost of removingoil spills for which we may be held responsible, subject to certain limitations. Our historical and currentoperations may involve the use or handling of materials that may be classified as environmentally hazardoussubstances. Laws and regulations protecting the environment have generally become more stringent and may incertain circumstances impose “strict liability,” rendering a person liable for environmental damage withoutregard to negligence or fault. Environmental laws and regulations may expose us to liability for the conduct of orconditions caused by others or for acts that were in compliance with all applicable laws at the time they wereperformed. We have potential liabilities under various statutes regulating the cleanup of a number of hazardouswaste disposal sites and cannot assure you that we will not be named in similar matters in the future. In addition,one of our subsidiaries was named as a defendant, along with nineteen other companies, in a lawsuit filed onbehalf of three landowners in Louisiana. That lawsuit alleges that the defendants contaminated the plaintiffs’property with naturally occurring radioactive material, produced water, drilling fluids, chlorides, hydrocarbons,heavy metals and other contaminants as a result of oil and gas exploration activities. The Louisiana Departmentof Environmental Quality is in the process of conducting its own investigation. The subsidiary, which no longerconducts operations or holds assets, has filed for bankruptcy in Delaware and has been dismissed as a defendant.The co-defendant of our subsidiary filed various motions in the Louisiana proceeding and in the Delawarebankruptcy proceeding attempting to assert alter ego and a similar doctrine of Louisiana law againstGlobalSantaFe Corporation and also seeking the dismissal of the bankruptcy. To the extent that one or morepending or future environmental matters or lawsuits are not resolved in our favor and are not covered byinsurance or indemnity agreements with subsequent operators in the field, that could have a material adverseeffect on our financial results and condition. For further discussion of potential environmental liabilities affectingus, see “Item 3. Legal Proceedings—Environmental Matters.”
WE ARE SUBJECT TO CHANGES IN TAX LAWS AND OUR TAX RETURNS ARE SUBJECT TO REVIEW AND POSSIBLE
ADJUSTMENTS.
We are a Cayman Islands company and we operate through our various subsidiaries in numerous countriesthroughout the world including the United States. Consequently, we are subject to changes in tax laws, treaties,and regulations in and between countries in which we operate, including treaties between the U.S. and othernations. Our income tax expense is based upon our interpretation of the tax laws in effect in various countries atthe time that the expense was incurred. A material change in these tax laws, treaties or regulations, includingthose in and involving the U.S., could result in a higher effective tax rate on our worldwide earnings.
Proposed legislation has been introduced in the U.S. Congress over the past several years that would limitthe deductibility of certain interest expense on related-party indebtedness. A similar proposal has also beenincluded in the President’s fiscal year 2008 budget proposals. Such legislation, if enacted, could cause asignificant increase in our U.S. tax liability. The American Jobs Creation Act of 2004 mandated the U.S.Treasury to complete a study on the effect of certain deductions such as related-party interest. It is possible thatthe U.S. Congress will propose further legislation in this regard after the study has been completed.
25
Our income tax returns are subject to review and examination in various countries. We are currently underreview in various countries, and some of those countries have issued proposed adjustments to our tax returns.While we have agreed to certain adjustments in some of the countries, we believe that our tax returns arematerially correct as filed, and we will defend ourselves against any adjustments that we determine to beunwarranted. For more information regarding these matters see “Item 7. Management’s Discussion and Analysisof Financial Condition and Results of Operations—Operating Results—Income Taxes.” We cannot rule out thepossibility that we may not prevail in all cases or that the final outcome of any future assessment may be adverseto us. However, we do not believe that the ultimate resolution of these outstanding or future assessments willhave a material adverse affect on our financial position, results of operations and cash flows.
WE MAY BE LIMITED IN OUR USE OF NET OPERATING LOSSES.
Our ability to benefit from our deferred tax assets depends on us having sufficient future earnings to utilizeour net operating loss (“NOL”) carryforwards before they expire. We have established a valuation allowanceagainst the future tax benefit for a number of our foreign NOL carryforwards, and we could be required to recordan additional valuation allowance against our foreign or U.S. deferred tax assets if market conditions changematerially and, as a result, our future earnings are, or are projected to be, significantly less than we currentlyestimate. Our NOL carryforwards are subject to review and potential disallowance upon audit by the taxauthorities of the jurisdictions where the NOLs were incurred.
As of December 31, 2006, we had approximately $344.1 million of NOL carryforwards for U.S. federalincome tax purposes. These NOL carryforwards include NOL carryforwards of Global Marine from periods priorto the 2001 merger of Global Marine with one of our subsidiaries. Section 382 of the U.S. Internal Revenue Codecould limit the use of some of these Global Marine NOL carryforwards if the direct and indirect ownership of thestock of Global Marine changed by more than 50% in certain circumstances over a prescribed testing period. TheInternal Revenue Service may take the position that the merger caused a greater-than-50-percent ownershipchange with respect to Global Marine. If the merger did not result in such an ownership change, changes in theownership of our ordinary shares following the merger may have resulted in such an ownership change. In theevent of such an ownership change, the Section 382 rules would limit the utilization of Global Marine’s NOLcarryforwards in each taxable year ending after the ownership change to an amount equal to a federal long-termtax-exempt rate published monthly by the Internal Revenue Service, multiplied by the fair market value of all ofGlobal Marine’s stock, each determined at the time of the ownership change. For purposes of this calculation, thevalue of Global Marine’s stock at such time may be subject to adjustments that would further limit our ability toutilize Global Marine’s NOL carryforwards. If a limitation were imposed under Section 382, it could result inGlobal Marine’s NOL carryforwards expiring unused or in our inability to fully offset taxable income with NOLsin a particular year, even though our NOL carryforwards exceeded our taxable income for that year.
WE MAY BE REQUIRED TO ACCRUE ADDITIONAL TAX LIABILITY ON CERTAIN EARNINGS.
We have not provided for U.S. deferred taxes on the unremitted earnings of our U.S. subsidiaries that arepermanently reinvested. Should a distribution be made from the unremitted earnings of these U.S. subsidiaries,we could be required to record additional U.S. current and deferred taxes that, if material, could have an adverseeffect on our financial position, results of operations and cash flows.
OUR SHAREHOLDERS HAVE LIMITED RIGHTS UNDER CAYMAN ISLANDS LAW.
We are incorporated under the laws of the Cayman Islands, and our corporate affairs are governed by ourmemorandum of association and our articles of association and by the Companies Law (2004 Revision) of theCayman Islands. Principles of law relating to matters such as the validity of corporate procedures, the fiduciaryduties of management, directors and controlling shareholders, and the rights of shareholders differ from thosethat would apply if we were incorporated in a jurisdiction within the United States. Further, the rights ofshareholders under Cayman Islands law are not as clearly established as the rights of shareholders under
26
legislation or judicial precedent applicable in some U.S. jurisdictions. As a result, our shareholders may facemore uncertainty in protecting their interests in the face of actions by the management or directors than theymight have as shareholders of a corporation incorporated in a U.S. jurisdiction.
ITEM 1B. UNRESOLVED STAFF COMMENTS
Not applicable.
ITEM 3. LEGAL PROCEEDINGS
In August 2004, certain of our subsidiaries were named as defendants in six lawsuits filed in Mississippi,five of which are pending in the Circuit Court of Jones County and one of which is pending in the Circuit Courtof Jasper County, Mississippi, alleging that certain individuals aboard our offshore drilling rigs had been exposedto asbestos. These six lawsuits are part of a group of twenty-three lawsuits filed on behalf of approximately 800plaintiffs against a large number of defendants, most of which are not affiliated with us. Our subsidiaries havenot been named as defendants in any of the other seventeen lawsuits. The lawsuits assert claims based on theoriesof unseaworthiness, negligence, strict liability and our subsidiaries’ status as Jones Act employers; and seekunspecified compensatory and punitive damages. In general, the defendants are alleged to have manufactured,distributed or utilized products containing asbestos. In the case of our named subsidiaries and that of severalother offshore drilling companies named as defendants, the lawsuits allege those defendants allowed suchproducts to be utilized aboard offshore drilling rigs. We have not been provided with sufficient information todetermine the number of plaintiffs who claim to have been exposed to asbestos aboard our rigs, whether theywere employees nor their period of employment, the period of their alleged exposure to asbestos, nor theirmedical condition. Accordingly, we are unable to estimate our potential exposure to these lawsuits. Wehistorically have maintained insurance which we believe will be available to address any liability arising fromthese claims. We intend to defend these lawsuits vigorously, but there can be no assurance as to their ultimateoutcome.
We and two of our subsidiaries were defendants in a lawsuit filed on July 28, 2003, by Transocean Inc.(“Transocean”) in the United States District Court for the Southern District of Texas, Houston Division. Thelawsuit alleged that the dual drilling structure and method utilized by the GSF Development Driller I and theGSF Development Driller II semisubmersibles infringe on United States patents granted to Transocean. OnAugust 31, 2006, the jury returned a verdict upholding the validity of certain of the Transocean apparatus claims,awarding past damages of approximately $3.6 million, and finding that we had willfully infringed the patents.The judge subsequently entered a ruling overturning the jury’s finding of willful infringement. Transocean hassimilar patents in most other jurisdictions in which ultra-deepwater semisubmersibles are likely to operate,excluding certain parts of West Africa. It also has patents in Singapore, where the GSF Development Driller Iand GSF Development Driller II were constructed and where the similarly designed GSF Development Driller IIIis being constructed, and in most other jurisdictions in which dual activity rigs are likely to be constructed. Wehad joined with other parties in proceedings in Europe and Brazil contesting the issuance of patents toTransocean for dual activity methods and structures. The patents that Transocean obtained in those jurisdictionswere substantially the same as those granted in the U.S. and Singapore. In June 2006, the European Patent Officeinvalidated the patent claims that were the subject of the proceedings, and the Brazilian Patent Office hasrecently entered a preliminary ruling invalidating the patents in that jurisdiction.
We entered into a settlement agreement with Transocean, effective February 14, 2007, in which we weregranted a personal, worldwide, royalty bearing and non-exclusive license to operate dual activity rigs under theTransocean patents. The primary terms of the settlement are as follows:
• we will pay approximately $3,000,000 to Transocean for the past use of dual activity by the GSFDevelopment Driller I and GSF Development Driller II;
• at any time we operate in a jurisdiction in which Transocean has a valid, non-expired patent for dualactivity, we will pay a royalty of 3% of the basic dayrate of the GSF Development Driller I, GSF
27
Development Driller II and GSF Development Driller III, or 5% of the basic dayrate of any dual activityrigs that we hereafter acquire or construct. The Transocean patents are set to expire in 2016;
• we will pay $12,000,000 to Transocean on behalf of ourselves and the shipyards that constructed theGSF Development Driller I and GSF Development Driller II, and the shipyard that is currentlyconstructing the GSF Development Driller III, and we and the shipyards will be relieved of any liabilityfor the alleged infringement arising from the construction of those rigs; and
• we will withdraw from the proceedings opposing the issuance of patents in Europe and Brazil, and wehave agreed not to challenge the validity of the Transocean patents in any jurisdiction.
One of our subsidiaries filed suit in February 2004 against its insurance underwriters in the Superior Courtof San Francisco County, California, seeking a declaration as to its rights to insurance coverage and the properallocation among its insurers of liability for claims payments in order to assist in the future management anddisposition of certain claims described below. The subsidiary’s three primary insurers have historically beenpaying settlement and defense costs for the subsidiary. One of these insurers was nearing insolvency and claimedexhaustion of its coverage limits, but following negotiations has agreed to make a cash payment in exchange fora release of all further liability for the subsidiary’s asbestos liabilities. Both of the subsidiary’s other primaryinsurers have entered into settlement agreements with the subsidiary that will provide for limited additionalfunding of asbestos liabilities and attorneys’ fees and costs associated therewith. The subsidiary also intends toenter into discussions with its excess insurers. We believe that the subsidiary will continue to have funds from itsinsurers sufficient to meet its settlement and defense obligations for the foreseeable future.
The insurance coverage in question relates to lawsuits filed against the subsidiary arising out of itsinvolvement in the design, construction and refurbishment of major industrial complexes. The operating assets ofthe subsidiary were sold and its operations discontinued in 1989, and the subsidiary has no remaining assets otherthan the insurance policies involved in the litigation and funds received from the cancellation of certain insurancepolicies. The subsidiary has been named as a defendant, along with numerous other companies, in lawsuitsalleging personal injury as a result of exposure to asbestos. As of January 1, 2007, the subsidiary had been namedas a defendant in approximately 4,200 lawsuits, the first of which was filed in 1990, and a substantial number ofwhich are currently pending. We believe that as of January 1, 2007, from $35 million to $40 million had beenexpended to resolve claims (including both attorney fees and expenses, and settlement costs), with the subsidiaryhaving expended $4 million of that amount due to insurance deductible obligations, all of which have now beensatisfied. Because we rely on information from the insurers of our subsidiary for information regarding theamounts expended in settlement and defense of these lawsuits and are not able to verify or confirm theinformation, the amount expended by the insurers is not known with precision. The subsidiary continues to benamed as a defendant in additional lawsuits and we cannot predict the number of additional cases in which it maybe named a defendant nor can we predict the potential costs to resolve such additional cases or to resolve thepending cases. However, the subsidiary has in excess of $1 billion in insurance limits. Although not all of thatwill be available due to the insolvency of certain insurers, we believe that the subsidiary will have sufficientinsurance available to respond to these claims. We do not believe that these claims will have a material impact onour consolidated financial position, results of operations or cash flows.
The same subsidiary is a defendant in a lawsuit filed against it by Union Oil Company of California(“Union”) in the Circuit Court of Cook County, Illinois. That lawsuit arises out of claims alleging personal injurycaused by exposure to asbestos at a refinery owned by Union and constructed by our subsidiary. Union hasalleged that the subsidiary is required to defend and indemnify it pursuant to the terms of contracts entered intofor the construction of the refinery. GlobalSantaFe Corporation has also been named as a defendant in thepending litigation. Union intends to attempt to establish liability against GlobalSantaFe Corporation as the alterego of, and successor in interest to, its subsidiary and on the basis of a fraudulent conveyance of the subsidiary’sassets, and seeks to pierce the corporate veil between the subsidiary and GlobalSantaFe Corporation. We believethat the allegations of the lawsuit are without merit and intend to vigorously defend against the lawsuit, butcannot provide any assurance as to its ultimate outcome.
28
We and a number of our subsidiaries were named as defendants in two lawsuits claiming that the GSFAdriatic VII caused damage to a platform in the South Marsh Island area of the Gulf of Mexico when the rigbroke free from its location during Hurricane Rita. On September 20, 2006, Devon Energy Corporation and PogoProducing Company filed suit in the United States District Court for the Southern District of Texas, HoustonDivision, claiming that the defendants caused damage in an amount exceeding $75 million. On the same dayApache Corporation, as successor in interest to BP p.l.c., filed suit against the defendants in the United StatesDistrict Court for the Western District of Louisiana, Lafayette Division, claiming damage in an unspecifiedamount. We have not been presented with evidence indicating that the GSF Adriatic VII caused the damage, ifany, claimed by plaintiffs. In any event, we believe that we will be entitled to the benefits of the Act of Goddefense. Any liability arising therefrom, including legal fees and expenses, will be paid by our insuranceunderwriters.
We and our subsidiaries are defendants or otherwise involved in a number of lawsuits in the ordinary courseof business. In the opinion of management, our ultimate liability with respect to these pending lawsuits is notexpected to have a material adverse effect on our consolidated financial position, results of operations or cashflows.
ENVIRONMENTAL MATTERS
We have certain potential liabilities under the Comprehensive Environmental Response, Compensation andLiability Act (“CERCLA”) and similar state acts regulating cleanup of various hazardous waste disposal sites,including those described below. CERCLA is intended to expedite the remediation of hazardous substanceswithout regard to fault. Potentially responsible parties (“PRPs”) for each site include present and former ownersand operators of, transporters to and generators of the substances at the site. Liability is strict and can be joint andseveral.
We have been named as a PRP in connection with a site located in Santa Fe Springs, California, known asthe Waste Disposal, Inc. site. We and other PRPs have agreed with the U.S. Environmental Protection Agency(“EPA”) and the U.S. Department of Justice (“DOJ”) to settle our potential liabilities for this site by agreeing toperform the remaining remediation required by the EPA. The form of the agreement is a consent decree, whichhas now been entered by the court. The parties to the settlement have entered into a participation agreement,which makes us liable for approximately 8% of the remediation and related costs. The remediation is complete,but our share of the future operation and maintenance costs of the site is estimated to have a present value ofapproximately $900,000. There are additional potential liabilities related to the site, but these cannot bequantified, and we have no reason at this time to believe that they will be material.
We have also been named as a PRP in connection with a site in California known as the Casmalia ResourcesSite. We and other PRPs have entered into an agreement with the EPA and the DOJ to resolve potentialliabilities. Under the settlement, we are not likely to owe any substantial additional amounts for this site beyondwhat we have already paid. There are additional potential liabilities related to this site, but these cannot bequantified at this time, and we have no reason at this time to believe that they will be material.
We have been named as one of many PRPs in connection with a site located in Carson, California, formerlymaintained by Cal Compact Landfill. On February 15, 2002, we were served with a required 90-day notificationthat eight California cities, on behalf of themselves and other PRPs, intend to commence an action against usunder the Resource Conservation and Recovery Act (“RCRA”). On April 1, 2002, a complaint was filed by thecities against us and others alleging that we have liabilities in connection with the site. However, the complainthas not been served. The site was closed in or around 1965, and we do not have sufficient information to enableus to assess our potential liability, if any, for this site.
One of our subsidiaries has recently been ordered by the California Regional Water Quality Control Boardto develop a testing plan for a site known as Campus 1000 Fremont in Alhambra, California. This site was
29
formerly owned and operated by certain of our subsidiaries. It is presently owned by an unrelated party, whichhas also received an order to develop a testing plan for the property. Although the testing plan has not yet beendeveloped and approved, testing costs are expected to be in the range of $200,000. We have also been advisedthat another subsidiary is likely to be named by the EPA as a PRP for the San Gabriel Valley, Area 3, Superfundsite, which includes this property. We have no knowledge at this time of the potential cost of any remediation,who else will be named as PRPs, and whether in fact any of our subsidiaries is a liable party. The subsidiaries inquestion do not own any operating assets and have limited ability to respond to any liabilities.
Resolutions of other claims by the EPA, the involved state agency and/or PRPs are at various stages ofinvestigation. These investigations involve determinations of:
• the actual responsibility attributed to us and the other PRPs at the site;
• appropriate investigatory and/or remedial actions; and
• allocation of the costs of such activities among the PRPs and other site users.
Our ultimate financial responsibility in connection with those sites may depend on many factors, including:
• the volume and nature of material, if any, contributed to the site for which we are responsible;
• the numbers of other PRPs and their financial viability; and
• the remediation methods and technology to be used.
It is difficult to quantify with certainty the potential cost of these environmental matters, particularly inrespect of remediation obligations. Nevertheless, based upon the information currently available, we believe thatour ultimate liability arising from all environmental matters, including the liability for all other related pendinglegal proceedings, asserted legal claims and known potential legal claims which are likely to be asserted, isadequately accrued and should not have a material effect on our financial position or ongoing results ofoperations. Estimated costs of future expenditures for environmental remediation obligations are not discountedto their present value.
On July 11, 2005, one of our subsidiaries, Santa Fe Minerals, Inc., was served with a lawsuit filed on behalfof three landowners in Louisiana in the 12th Judicial District Court for the Parish of Avoyelles, State ofLouisiana. The lawsuit names nineteen other defendants, all of which are alleged to have contaminated theplaintiffs’ property with naturally occurring radioactive material, produced water, drilling fluids, chlorides,hydrocarbons, heavy metals and other contaminants as a result of oil and gas exploration activities. The lawsuitspecifies 95 wells drilled on the property in question beginning in 1939, and alleges that our subsidiary, which isa dissolved corporation and no longer conducts operations or holds assets, was the operator or non-operatingpartner in 13 of the wells during certain periods of time. The plaintiffs allege that the defendants are liable on thebasis of strict liability, breach of contract, breach of the mineral leases, negligence, nuisance, trespass, andimproper handling of toxic or hazardous substances, that their storage and disposal of toxic and hazardoussubstances constituted an ultra-hazardous activity, and that they violated various state statutes. The lawsuit seeksunspecified amounts of compensatory and punitive damages, payment of funds sufficient to conduct anenvironmental assessment of the property in question, damages for diminution of property value and injunctiverelief requiring that defendants restore the property to its prior condition and prevent the migration of toxic andhazardous substances. Experts retained by the plaintiffs have issued a report suggesting significant contaminationin the area operated by the subsidiary and another codefendant, and claiming that over $300 million will berequired to properly remediate the contamination. The experts retained by the defendants conducted their owninvestigation and concluded that the remediation costs will amount to no more than a few million dollars. TheLouisiana Department of Environmental Quality is in the process of conducting its own investigation in thatregard. We believe that our subsidiary has meritorious defenses to the allegations contained in the lawsuit, andthat if liability is established against it that the judgment will be far lower than that being demanded by theplaintiffs. The plaintiffs and the codefendant threatened to add GlobalSantaFe Corporation as a defendant in the
30
lawsuit under the “single business enterprise” doctrine contained in Louisiana law. The single business enterprisedoctrine is an equitable construct created and applied by the judiciary to impose liability against the parentcompany or a different subsidiary or affiliated companies where more than one company represents precisely thesame single interests. The single business enterprise doctrine is similar to corporate veil piercing doctrines. OnAugust 16, 2006, Santa Fe Minerals, Inc. and its immediate parent company, 15375 Memorial Corporation,which is also an entity that no longer conducts operations or holds assets, filed voluntary petitions for relief underChapter 11 of the U.S. Bankruptcy Code in the United States Bankruptcy Court for the District of Delaware.Later that day, the plaintiffs dismissed Santa Fe Minerals, Inc. from the lawsuit. Subsequently, the codefendantfiled various motions in the lawsuit and in the Delaware bankruptcies attempting to assert alter ego and singlebusiness enterprise claims against GlobalSantaFe Corporation and two other subsidiaries in the lawsuit. Webelieve that these legal theories should not be applied against GlobalSantaFe Corporation or these other twosubsidiaries, and that in any event the manner in which the parent and its subsidiaries conducted their businessesdoes not meet the requirements of these theories for imposition of liability. The codefendant also seeks to dismissthe bankruptcies. To date, the efforts to assert alter ego and single business enterprise theory claims againstGlobalSantaFe Corporation have been rejected by the Court in Avoyelles Parish and we have filed an action withthe Delaware Court asking that any such claims be heard there. We intend to continue to vigorously defendagainst any action taken in an attempt to impose liability against us under these theories or otherwise.
OTHER LEGAL MATTERS
We and our subsidiaries are defendants or otherwise involved in a number of lawsuits in the ordinary courseof business. In the opinion of management, our ultimate liability with respect to these pending lawsuits is notexpected to have a material adverse effect on our consolidated financial position, results of operations or cashflows.
ITEM 4. SUBMISSION OF MATTERS TO A VOTE OF SECURITY HOLDERS
There were no matters submitted to a vote of our security holders during the fourth quarter of 2006.
31
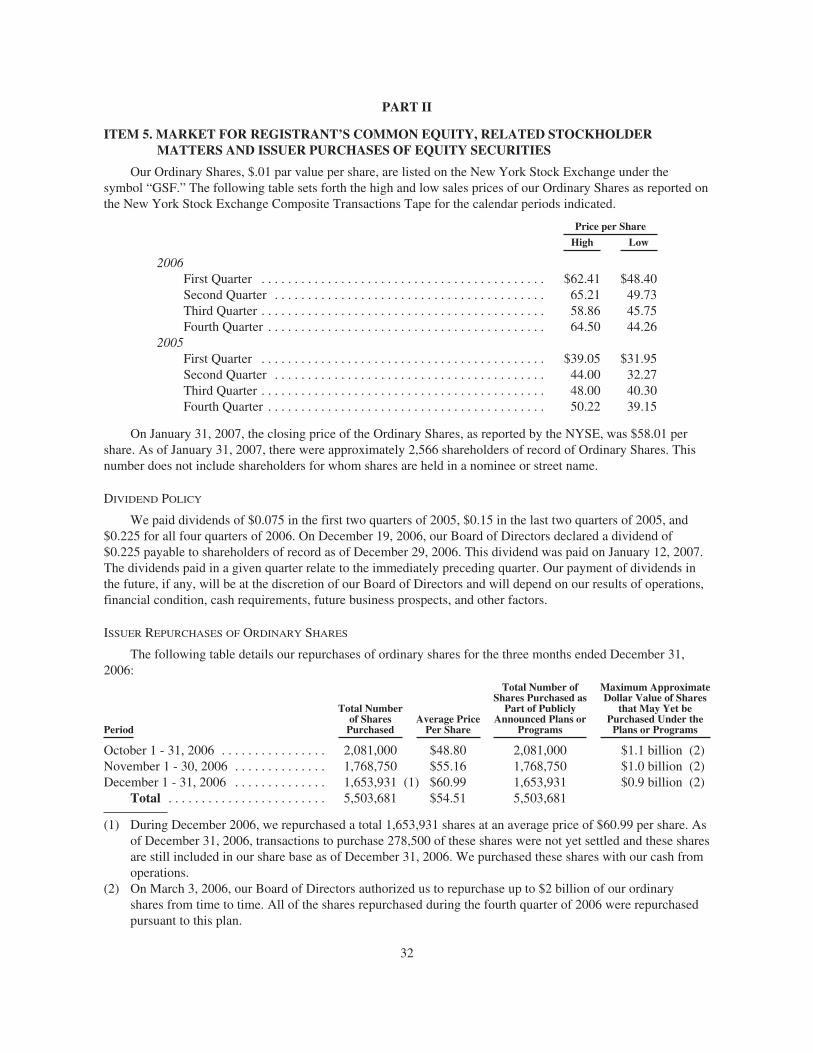
PART II
ITEM 5. MARKET FOR REGISTRANT’S COMMON EQUITY, RELATED STOCKHOLDERMATTERS AND ISSUER PURCHASES OF EQUITY SECURITIES
Our Ordinary Shares, $.01 par value per share, are listed on the New York Stock Exchange under thesymbol “GSF.” The following table sets forth the high and low sales prices of our Ordinary Shares as reported onthe New York Stock Exchange Composite Transactions Tape for the calendar periods indicated.
Price per Share
High Low
2006First Quarter . . . . . . . . . . . . . . . . . . . . . . . . . . . . . . . . . . . . . . . . . . . $62.41 $48.40Second Quarter . . . . . . . . . . . . . . . . . . . . . . . . . . . . . . . . . . . . . . . . . 65.21 49.73Third Quarter . . . . . . . . . . . . . . . . . . . . . . . . . . . . . . . . . . . . . . . . . . . 58.86 45.75Fourth Quarter . . . . . . . . . . . . . . . . . . . . . . . . . . . . . . . . . . . . . . . . . . 64.50 44.26
2005First Quarter . . . . . . . . . . . . . . . . . . . . . . . . . . . . . . . . . . . . . . . . . . . $39.05 $31.95Second Quarter . . . . . . . . . . . . . . . . . . . . . . . . . . . . . . . . . . . . . . . . . 44.00 32.27Third Quarter . . . . . . . . . . . . . . . . . . . . . . . . . . . . . . . . . . . . . . . . . . . 48.00 40.30Fourth Quarter . . . . . . . . . . . . . . . . . . . . . . . . . . . . . . . . . . . . . . . . . . 50.22 39.15
On January 31, 2007, the closing price of the Ordinary Shares, as reported by the NYSE, was $58.01 pershare. As of January 31, 2007, there were approximately 2,566 shareholders of record of Ordinary Shares. Thisnumber does not include shareholders for whom shares are held in a nominee or street name.
DIVIDEND POLICY
We paid dividends of $0.075 in the first two quarters of 2005, $0.15 in the last two quarters of 2005, and$0.225 for all four quarters of 2006. On December 19, 2006, our Board of Directors declared a dividend of$0.225 payable to shareholders of record as of December 29, 2006. This dividend was paid on January 12, 2007.The dividends paid in a given quarter relate to the immediately preceding quarter. Our payment of dividends inthe future, if any, will be at the discretion of our Board of Directors and will depend on our results of operations,financial condition, cash requirements, future business prospects, and other factors.
ISSUER REPURCHASES OF ORDINARY SHARES
The following table details our repurchases of ordinary shares for the three months ended December 31,2006:
Period
Total Numberof Shares
PurchasedAverage Price
Per Share
Total Number ofShares Purchased as
Part of PubliclyAnnounced Plans or
Programs
Maximum ApproximateDollar Value of Shares
that May Yet bePurchased Under the
Plans or Programs
October 1 - 31, 2006 . . . . . . . . . . . . . . . . 2,081,000 $48.80 2,081,000 $1.1 billion (2)November 1 - 30, 2006 . . . . . . . . . . . . . . 1,768,750 $55.16 1,768,750 $1.0 billion (2)December 1 - 31, 2006 . . . . . . . . . . . . . . 1,653,931 (1) $60.99 1,653,931 $0.9 billion (2)
Total . . . . . . . . . . . . . . . . . . . . . . . . 5,503,681 $54.51 5,503,681
(1) During December 2006, we repurchased a total 1,653,931 shares at an average price of $60.99 per share. Asof December 31, 2006, transactions to purchase 278,500 of these shares were not yet settled and these sharesare still included in our share base as of December 31, 2006. We purchased these shares with our cash fromoperations.
(2) On March 3, 2006, our Board of Directors authorized us to repurchase up to $2 billion of our ordinaryshares from time to time. All of the shares repurchased during the fourth quarter of 2006 were repurchasedpursuant to this plan.
32
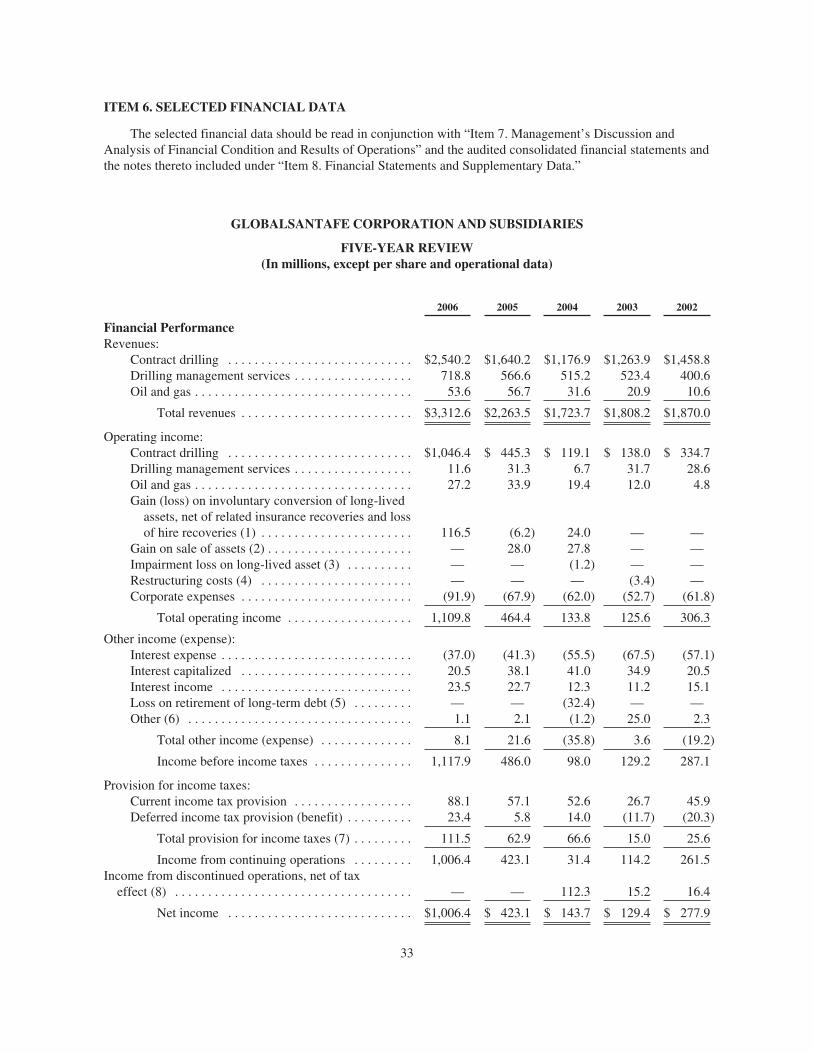
ITEM 6. SELECTED FINANCIAL DATA
The selected financial data should be read in conjunction with “Item 7. Management’s Discussion andAnalysis of Financial Condition and Results of Operations” and the audited consolidated financial statements andthe notes thereto included under “Item 8. Financial Statements and Supplementary Data.”
GLOBALSANTAFE CORPORATION AND SUBSIDIARIES
FIVE-YEAR REVIEW(In millions, except per share and operational data)
2006 2005 2004 2003 2002
Financial PerformanceRevenues:
Contract drilling . . . . . . . . . . . . . . . . . . . . . . . . . . . . $2,540.2 $1,640.2 $1,176.9 $1,263.9 $1,458.8Drilling management services . . . . . . . . . . . . . . . . . . 718.8 566.6 515.2 523.4 400.6Oil and gas . . . . . . . . . . . . . . . . . . . . . . . . . . . . . . . . . 53.6 56.7 31.6 20.9 10.6
Total revenues . . . . . . . . . . . . . . . . . . . . . . . . . . $3,312.6 $2,263.5 $1,723.7 $1,808.2 $1,870.0
Operating income:Contract drilling . . . . . . . . . . . . . . . . . . . . . . . . . . . . $1,046.4 $ 445.3 $ 119.1 $ 138.0 $ 334.7Drilling management services . . . . . . . . . . . . . . . . . . 11.6 31.3 6.7 31.7 28.6Oil and gas . . . . . . . . . . . . . . . . . . . . . . . . . . . . . . . . . 27.2 33.9 19.4 12.0 4.8Gain (loss) on involuntary conversion of long-lived
assets, net of related insurance recoveries and lossof hire recoveries (1) . . . . . . . . . . . . . . . . . . . . . . . 116.5 (6.2) 24.0 — —
Gain on sale of assets (2) . . . . . . . . . . . . . . . . . . . . . . — 28.0 27.8 — —Impairment loss on long-lived asset (3) . . . . . . . . . . — — (1.2) — —Restructuring costs (4) . . . . . . . . . . . . . . . . . . . . . . . — — — (3.4) —Corporate expenses . . . . . . . . . . . . . . . . . . . . . . . . . . (91.9) (67.9) (62.0) (52.7) (61.8)
Total operating income . . . . . . . . . . . . . . . . . . . 1,109.8 464.4 133.8 125.6 306.3
Other income (expense):Interest expense . . . . . . . . . . . . . . . . . . . . . . . . . . . . . (37.0) (41.3) (55.5) (67.5) (57.1)Interest capitalized . . . . . . . . . . . . . . . . . . . . . . . . . . 20.5 38.1 41.0 34.9 20.5Interest income . . . . . . . . . . . . . . . . . . . . . . . . . . . . . 23.5 22.7 12.3 11.2 15.1Loss on retirement of long-term debt (5) . . . . . . . . . — — (32.4) — —Other (6) . . . . . . . . . . . . . . . . . . . . . . . . . . . . . . . . . . 1.1 2.1 (1.2) 25.0 2.3
Total other income (expense) . . . . . . . . . . . . . . 8.1 21.6 (35.8) 3.6 (19.2)
Income before income taxes . . . . . . . . . . . . . . . 1,117.9 486.0 98.0 129.2 287.1
Provision for income taxes:Current income tax provision . . . . . . . . . . . . . . . . . . 88.1 57.1 52.6 26.7 45.9Deferred income tax provision (benefit) . . . . . . . . . . 23.4 5.8 14.0 (11.7) (20.3)
Total provision for income taxes (7) . . . . . . . . . 111.5 62.9 66.6 15.0 25.6
Income from continuing operations . . . . . . . . . 1,006.4 423.1 31.4 114.2 261.5Income from discontinued operations, net of tax
effect (8) . . . . . . . . . . . . . . . . . . . . . . . . . . . . . . . . . . . . — — 112.3 15.2 16.4
Net income . . . . . . . . . . . . . . . . . . . . . . . . . . . . $1,006.4 $ 423.1 $ 143.7 $ 129.4 $ 277.9
33
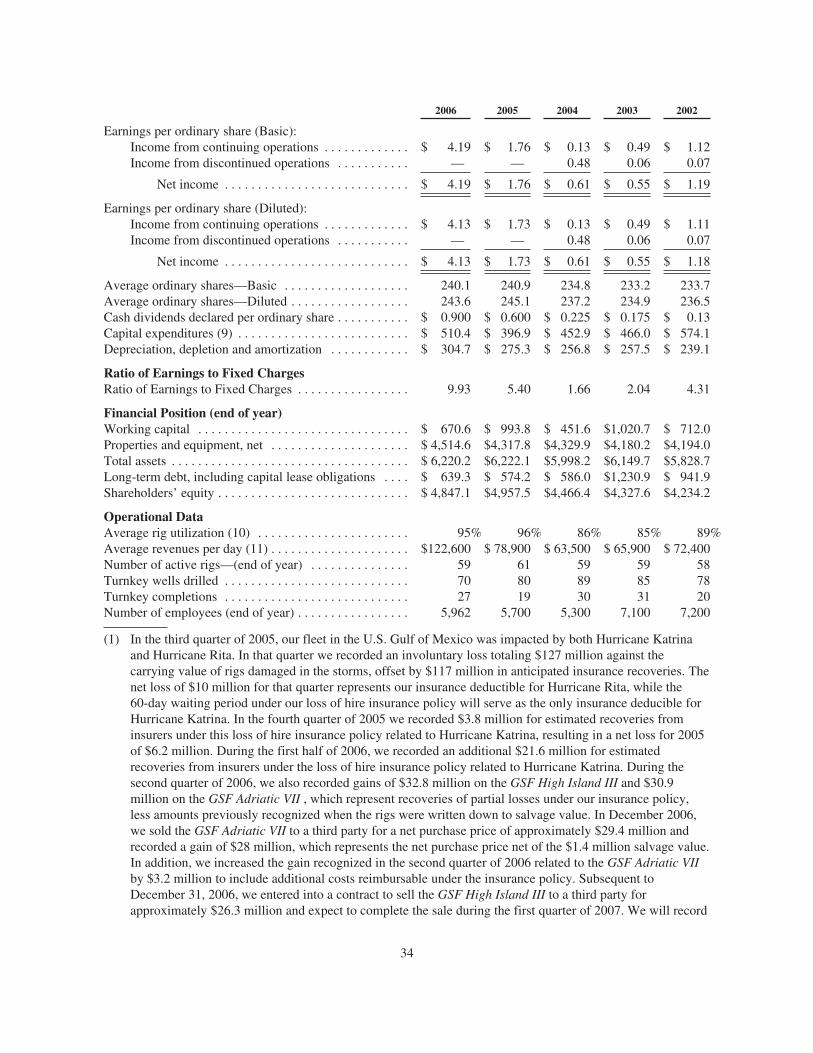
2006 2005 2004 2003 2002
Earnings per ordinary share (Basic):Income from continuing operations . . . . . . . . . . . . . $ 4.19 $ 1.76 $ 0.13 $ 0.49 $ 1.12Income from discontinued operations . . . . . . . . . . . — — 0.48 0.06 0.07
Net income . . . . . . . . . . . . . . . . . . . . . . . . . . . . $ 4.19 $ 1.76 $ 0.61 $ 0.55 $ 1.19
Earnings per ordinary share (Diluted):Income from continuing operations . . . . . . . . . . . . . $ 4.13 $ 1.73 $ 0.13 $ 0.49 $ 1.11Income from discontinued operations . . . . . . . . . . . — — 0.48 0.06 0.07
Net income . . . . . . . . . . . . . . . . . . . . . . . . . . . . $ 4.13 $ 1.73 $ 0.61 $ 0.55 $ 1.18
Average ordinary shares—Basic . . . . . . . . . . . . . . . . . . . 240.1 240.9 234.8 233.2 233.7Average ordinary shares—Diluted . . . . . . . . . . . . . . . . . . 243.6 245.1 237.2 234.9 236.5Cash dividends declared per ordinary share . . . . . . . . . . . $ 0.900 $ 0.600 $ 0.225 $ 0.175 $ 0.13Capital expenditures (9) . . . . . . . . . . . . . . . . . . . . . . . . . . $ 510.4 $ 396.9 $ 452.9 $ 466.0 $ 574.1Depreciation, depletion and amortization . . . . . . . . . . . . $ 304.7 $ 275.3 $ 256.8 $ 257.5 $ 239.1
Ratio of Earnings to Fixed ChargesRatio of Earnings to Fixed Charges . . . . . . . . . . . . . . . . . 9.93 5.40 1.66 2.04 4.31
Financial Position (end of year)Working capital . . . . . . . . . . . . . . . . . . . . . . . . . . . . . . . . $ 670.6 $ 993.8 $ 451.6 $1,020.7 $ 712.0Properties and equipment, net . . . . . . . . . . . . . . . . . . . . . $ 4,514.6 $4,317.8 $4,329.9 $4,180.2 $4,194.0Total assets . . . . . . . . . . . . . . . . . . . . . . . . . . . . . . . . . . . . $ 6,220.2 $6,222.1 $5,998.2 $6,149.7 $5,828.7Long-term debt, including capital lease obligations . . . . $ 639.3 $ 574.2 $ 586.0 $1,230.9 $ 941.9Shareholders’ equity . . . . . . . . . . . . . . . . . . . . . . . . . . . . . $ 4,847.1 $4,957.5 $4,466.4 $4,327.6 $4,234.2
Operational DataAverage rig utilization (10) . . . . . . . . . . . . . . . . . . . . . . . 95% 96% 86% 85% 89%Average revenues per day (11) . . . . . . . . . . . . . . . . . . . . . $122,600 $ 78,900 $ 63,500 $ 65,900 $ 72,400Number of active rigs—(end of year) . . . . . . . . . . . . . . . 59 61 59 59 58Turnkey wells drilled . . . . . . . . . . . . . . . . . . . . . . . . . . . . 70 80 89 85 78Turnkey completions . . . . . . . . . . . . . . . . . . . . . . . . . . . . 27 19 30 31 20Number of employees (end of year) . . . . . . . . . . . . . . . . . 5,962 5,700 5,300 7,100 7,200
(1) In the third quarter of 2005, our fleet in the U.S. Gulf of Mexico was impacted by both Hurricane Katrinaand Hurricane Rita. In that quarter we recorded an involuntary loss totaling $127 million against thecarrying value of rigs damaged in the storms, offset by $117 million in anticipated insurance recoveries. Thenet loss of $10 million for that quarter represents our insurance deductible for Hurricane Rita, while the60-day waiting period under our loss of hire insurance policy will serve as the only insurance deducible forHurricane Katrina. In the fourth quarter of 2005 we recorded $3.8 million for estimated recoveries frominsurers under this loss of hire insurance policy related to Hurricane Katrina, resulting in a net loss for 2005of $6.2 million. During the first half of 2006, we recorded an additional $21.6 million for estimatedrecoveries from insurers under the loss of hire insurance policy related to Hurricane Katrina. During thesecond quarter of 2006, we also recorded gains of $32.8 million on the GSF High Island III and $30.9million on the GSF Adriatic VII , which represent recoveries of partial losses under our insurance policy,less amounts previously recognized when the rigs were written down to salvage value. In December 2006,we sold the GSF Adriatic VII to a third party for a net purchase price of approximately $29.4 million andrecorded a gain of $28 million, which represents the net purchase price net of the $1.4 million salvage value.In addition, we increased the gain recognized in the second quarter of 2006 related to the GSF Adriatic VIIby $3.2 million to include additional costs reimbursable under the insurance policy. Subsequent toDecember 31, 2006, we entered into a contract to sell the GSF High Island III to a third party forapproximately $26.3 million and expect to complete the sale during the first quarter of 2007. We will record
34
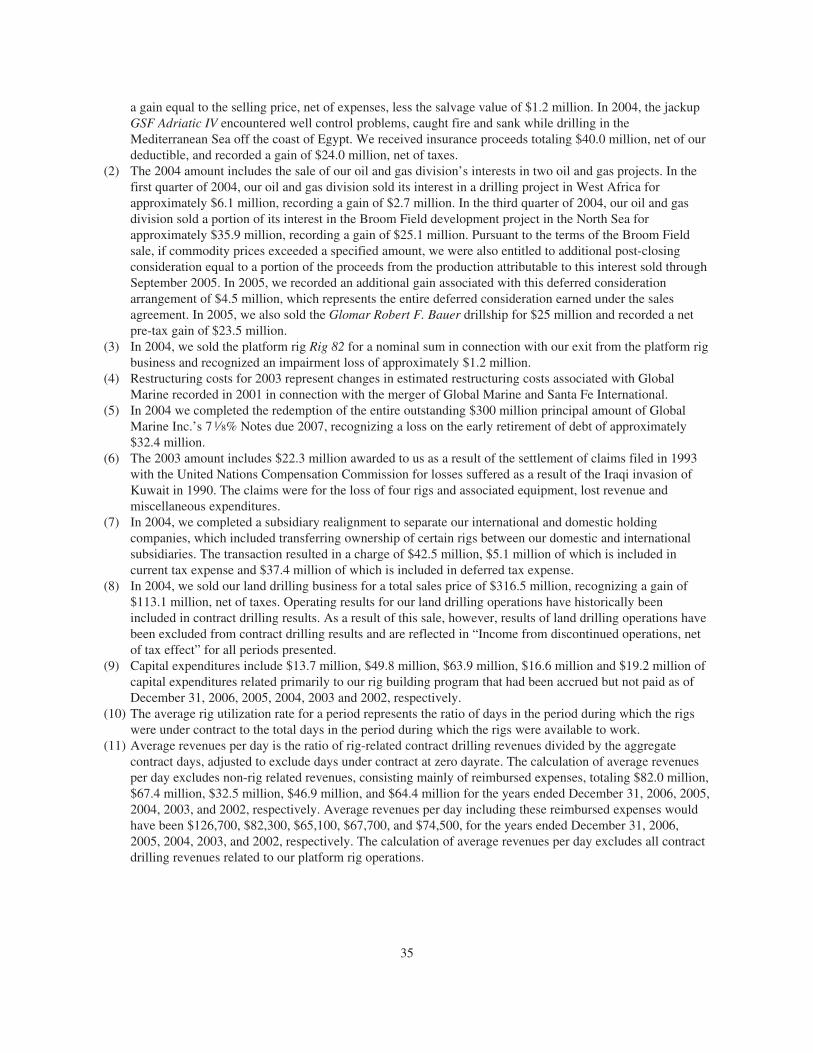
a gain equal to the selling price, net of expenses, less the salvage value of $1.2 million. In 2004, the jackupGSF Adriatic IV encountered well control problems, caught fire and sank while drilling in theMediterranean Sea off the coast of Egypt. We received insurance proceeds totaling $40.0 million, net of ourdeductible, and recorded a gain of $24.0 million, net of taxes.
(2) The 2004 amount includes the sale of our oil and gas division’s interests in two oil and gas projects. In thefirst quarter of 2004, our oil and gas division sold its interest in a drilling project in West Africa forapproximately $6.1 million, recording a gain of $2.7 million. In the third quarter of 2004, our oil and gasdivision sold a portion of its interest in the Broom Field development project in the North Sea forapproximately $35.9 million, recording a gain of $25.1 million. Pursuant to the terms of the Broom Fieldsale, if commodity prices exceeded a specified amount, we were also entitled to additional post-closingconsideration equal to a portion of the proceeds from the production attributable to this interest sold throughSeptember 2005. In 2005, we recorded an additional gain associated with this deferred considerationarrangement of $4.5 million, which represents the entire deferred consideration earned under the salesagreement. In 2005, we also sold the Glomar Robert F. Bauer drillship for $25 million and recorded a netpre-tax gain of $23.5 million.
(3) In 2004, we sold the platform rig Rig 82 for a nominal sum in connection with our exit from the platform rigbusiness and recognized an impairment loss of approximately $1.2 million.
(4) Restructuring costs for 2003 represent changes in estimated restructuring costs associated with GlobalMarine recorded in 2001 in connection with the merger of Global Marine and Santa Fe International.
(5) In 2004 we completed the redemption of the entire outstanding $300 million principal amount of GlobalMarine Inc.’s 71⁄8% Notes due 2007, recognizing a loss on the early retirement of debt of approximately$32.4 million.
(6) The 2003 amount includes $22.3 million awarded to us as a result of the settlement of claims filed in 1993with the United Nations Compensation Commission for losses suffered as a result of the Iraqi invasion ofKuwait in 1990. The claims were for the loss of four rigs and associated equipment, lost revenue andmiscellaneous expenditures.
(7) In 2004, we completed a subsidiary realignment to separate our international and domestic holdingcompanies, which included transferring ownership of certain rigs between our domestic and internationalsubsidiaries. The transaction resulted in a charge of $42.5 million, $5.1 million of which is included incurrent tax expense and $37.4 million of which is included in deferred tax expense.
(8) In 2004, we sold our land drilling business for a total sales price of $316.5 million, recognizing a gain of$113.1 million, net of taxes. Operating results for our land drilling operations have historically beenincluded in contract drilling results. As a result of this sale, however, results of land drilling operations havebeen excluded from contract drilling results and are reflected in “Income from discontinued operations, netof tax effect” for all periods presented.
(9) Capital expenditures include $13.7 million, $49.8 million, $63.9 million, $16.6 million and $19.2 million ofcapital expenditures related primarily to our rig building program that had been accrued but not paid as ofDecember 31, 2006, 2005, 2004, 2003 and 2002, respectively.
(10) The average rig utilization rate for a period represents the ratio of days in the period during which the rigswere under contract to the total days in the period during which the rigs were available to work.
(11) Average revenues per day is the ratio of rig-related contract drilling revenues divided by the aggregatecontract days, adjusted to exclude days under contract at zero dayrate. The calculation of average revenuesper day excludes non-rig related revenues, consisting mainly of reimbursed expenses, totaling $82.0 million,$67.4 million, $32.5 million, $46.9 million, and $64.4 million for the years ended December 31, 2006, 2005,2004, 2003, and 2002, respectively. Average revenues per day including these reimbursed expenses wouldhave been $126,700, $82,300, $65,100, $67,700, and $74,500, for the years ended December 31, 2006,2005, 2004, 2003, and 2002, respectively. The calculation of average revenues per day excludes all contractdrilling revenues related to our platform rig operations.
35
ITEM 7. MANAGEMENT’S DISCUSSION AND ANALYSIS OF FINANCIAL CONDITION ANDRESULTS OF OPERATIONS
We are an offshore oil and gas drilling contractor, owning or operating a fleet of 59 marine drilling rigs. Asof December 31, 2006, our fleet included 43 cantilevered jackup rigs, 11 semisubmersible rigs, three drillshipsand two additional semisubmersible rigs we operate for third parties under a joint venture agreement (see “Item 1and 2. Business and Properties—Joint Venture, Agency and Sponsorship Relationships and Other Investments”).During the first quarter of 2006, we commenced construction of an additional semisubmersible, to be named theGSF Development Driller III. We also have a jackup rig, the GSF High Island III, that is currently not capable ofperforming drilling operations due to damage arising as a result of Hurricane Rita. Subsequent to December 31,2006, we entered into a contract to sell the rig to a third party and expect to complete the sale during the firstquarter of 2007. (See “—Involuntary Conversion of Long-Lived Assets and Related Recoveries.”).
We provide offshore oil and gas contract drilling services to the oil and gas industry worldwide on a dailyrate (“dayrate”) basis. We also provide oil and gas drilling management services on either a dayrate orcompleted-project, fixed-price (“turnkey”) basis, as well as drilling engineering and drilling project managementservices, and we participate in oil and gas exploration and production activities, principally in order to facilitatethe acquisition of turnkey contracts for our drilling management services operations.
We derive substantially all of our revenues from our contract drilling and drilling management servicesoperations, which depend on the level of drilling activity in offshore oil and natural gas exploration anddevelopment markets worldwide. These operations are subject to a number of risks, many of which are outsideour control. For a discussion of these risks, see “Item 1A. Risk Factors.”
On May 21, 2004, we completed the sale of our land drilling business to Precision Drilling Corporation for atotal sales price of $316.5 million in an all-cash transaction. Our land drilling fleet consisted of 31 rigs, 12 ofwhich were located in Kuwait, eight in Venezuela, four in Saudi Arabia, four in Egypt and three in Oman.Operating results for our land drilling operations had historically been included in contract drilling results. As aresult of this sale, however, results of land drilling operations have been excluded from contract drilling resultsand are reflected in “Income from discontinued operations, net of tax effect” in the consolidated statement ofincome for the year ended December 31, 2004. For further information regarding our land drilling operations, see“Operating Results—Sale of Land Drilling Fleet (Discontinued Operations).”
Critical Accounting Estimates
Our consolidated financial statements are impacted by the accounting policies used and the estimates andassumptions made by management during their preparation. These estimates and assumptions used in connectionwith some of these policies affect the carrying values of assets and liabilities and disclosures of contingent assetsand liabilities at the balance sheet date and the amounts of revenues and expenses recognized during the period.Actual results could differ from such estimates and assumptions. We consider our accounting estimates to becritical in areas where both: (1) the nature of the estimates and assumptions used are material due to the levels ofsubjectivity and judgment necessary to account for highly uncertain matters or the susceptibility of such mattersto change, and (2) the impact of the estimates and assumptions is material to our operating results or financialcondition. Following is a discussion of our critical accounting estimates in the areas of pension costs, propertiesand depreciation, impairment, income taxes and turnkey drilling costs.
PENSION AND POSTRETIREMENT BENEFIT COSTS
Our pension and postretirement benefit costs and liabilities are actuarially determined based on certainassumptions including expected long-term rates of return on plan assets, rate of increase in future compensationlevels and the discount rate used to compute future benefit obligations. Actual results could differ materiallyfrom these actuarially determined amounts.
36
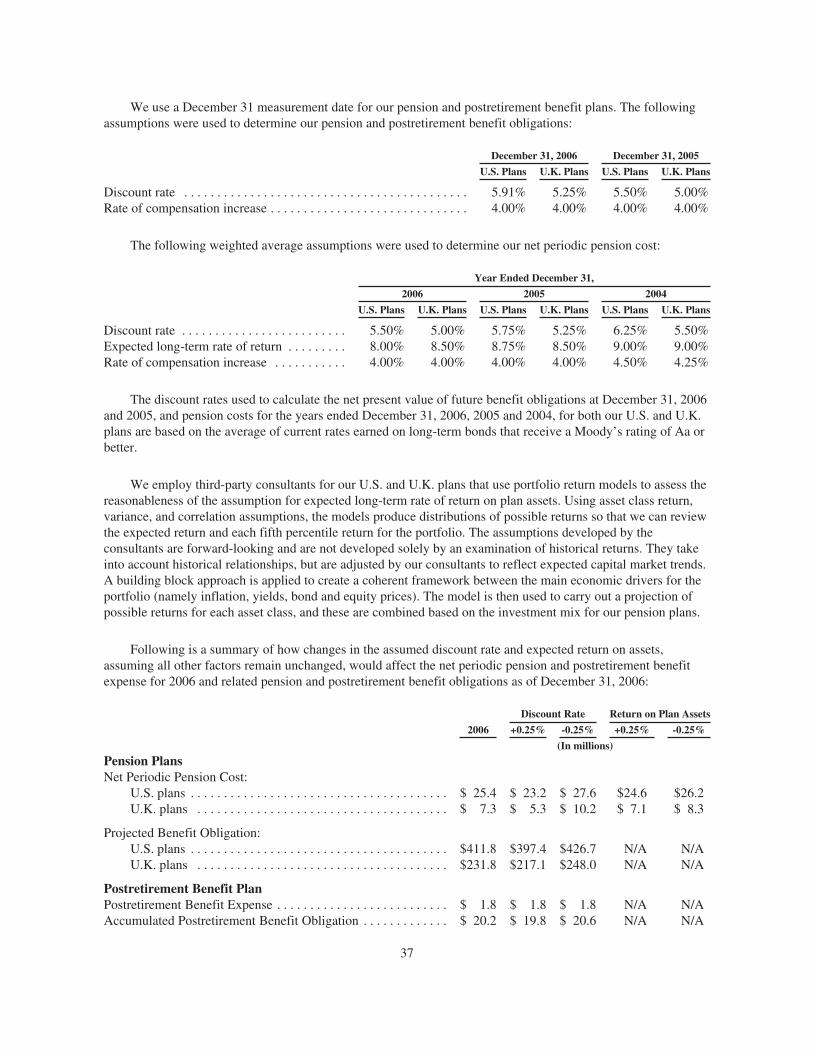
We use a December 31 measurement date for our pension and postretirement benefit plans. The followingassumptions were used to determine our pension and postretirement benefit obligations:
December 31, 2006 December 31, 2005
U.S. Plans U.K. Plans U.S. Plans U.K. Plans
Discount rate . . . . . . . . . . . . . . . . . . . . . . . . . . . . . . . . . . . . . . . . . . . 5.91% 5.25% 5.50% 5.00%Rate of compensation increase . . . . . . . . . . . . . . . . . . . . . . . . . . . . . . 4.00% 4.00% 4.00% 4.00%
The following weighted average assumptions were used to determine our net periodic pension cost:
Year Ended December 31,
2006 2005 2004
U.S. Plans U.K. Plans U.S. Plans U.K. Plans U.S. Plans U.K. Plans
Discount rate . . . . . . . . . . . . . . . . . . . . . . . . . 5.50% 5.00% 5.75% 5.25% 6.25% 5.50%Expected long-term rate of return . . . . . . . . . 8.00% 8.50% 8.75% 8.50% 9.00% 9.00%Rate of compensation increase . . . . . . . . . . . 4.00% 4.00% 4.00% 4.00% 4.50% 4.25%
The discount rates used to calculate the net present value of future benefit obligations at December 31, 2006and 2005, and pension costs for the years ended December 31, 2006, 2005 and 2004, for both our U.S. and U.K.plans are based on the average of current rates earned on long-term bonds that receive a Moody’s rating of Aa orbetter.
We employ third-party consultants for our U.S. and U.K. plans that use portfolio return models to assess thereasonableness of the assumption for expected long-term rate of return on plan assets. Using asset class return,variance, and correlation assumptions, the models produce distributions of possible returns so that we can reviewthe expected return and each fifth percentile return for the portfolio. The assumptions developed by theconsultants are forward-looking and are not developed solely by an examination of historical returns. They takeinto account historical relationships, but are adjusted by our consultants to reflect expected capital market trends.A building block approach is applied to create a coherent framework between the main economic drivers for theportfolio (namely inflation, yields, bond and equity prices). The model is then used to carry out a projection ofpossible returns for each asset class, and these are combined based on the investment mix for our pension plans.
Following is a summary of how changes in the assumed discount rate and expected return on assets,assuming all other factors remain unchanged, would affect the net periodic pension and postretirement benefitexpense for 2006 and related pension and postretirement benefit obligations as of December 31, 2006:
Discount Rate Return on Plan Assets
2006 +0.25% -0.25% +0.25% -0.25%
(In millions)
Pension PlansNet Periodic Pension Cost:
U.S. plans . . . . . . . . . . . . . . . . . . . . . . . . . . . . . . . . . . . . . . . $ 25.4 $ 23.2 $ 27.6 $24.6 $26.2U.K. plans . . . . . . . . . . . . . . . . . . . . . . . . . . . . . . . . . . . . . . $ 7.3 $ 5.3 $ 10.2 $ 7.1 $ 8.3
Projected Benefit Obligation:U.S. plans . . . . . . . . . . . . . . . . . . . . . . . . . . . . . . . . . . . . . . . $411.8 $397.4 $426.7 N/A N/AU.K. plans . . . . . . . . . . . . . . . . . . . . . . . . . . . . . . . . . . . . . . $231.8 $217.1 $248.0 N/A N/A
Postretirement Benefit PlanPostretirement Benefit Expense . . . . . . . . . . . . . . . . . . . . . . . . . . $ 1.8 $ 1.8 $ 1.8 N/A N/AAccumulated Postretirement Benefit Obligation . . . . . . . . . . . . . $ 20.2 $ 19.8 $ 20.6 N/A N/A
37

As of December 31, 2006, we had an unrecognized actuarial loss totaling $129.3 million and prior servicecost totaling $7.0 million for our U.S. and U.K. pension plans. These amounts will be recognized in net periodicpension cost over the estimated remaining service lives of the active participants in the plans. Approximately$8.4 million of the actuarial loss and $2.8 million of the prior service costs are expected to be recognized in2007.
As of December 31, 2006, we had an unrecognized actuarial loss totaling $4.7 million and a prior servicecredit totaling $0.7 million for our other postretirement benefit plan. These amounts will be recognized in netperiodic pension cost over the estimated remaining service lives of the active participants in the plan.Approximately $0.2 million of the actuarial loss and $0.1 million of the prior service credit are expected to berecognized in 2007. The calculation of our other postretirement benefits costs and liabilities includes theweighted-average annual assumed rate of increase in the per capita cost of covered medical benefits. Thisassumption is based on data available to management at the time the assumption is made. Actual results coulddiffer materially from estimated amounts.
For further discussion of the components of our net periodic pension cost and postretirement benefitexpense and funded status of our pension plans and postretirement benefit plan, see Note 10 of Notes toConsolidated Financial Statements.
PROPERTIES AND DEPRECIATION
Rigs and Drilling Equipment. Capitalized costs of rigs and drilling equipment include all costs incurred inthe acquisition of capital assets including allocations of interest costs incurred during periods that assets areunder construction and while they are being readied for their initial contract. Expenditures that improve or extendthe lives of rigs and drilling equipment are capitalized. Expenditures for maintenance and repairs are charged toexpense as incurred. Costs of property sold or retired and the related accumulated depreciation are removed fromthe accounts; resulting gains or losses are included in income.
Depreciation and amortization. We depreciate our rigs and equipment over their remaining estimated usefullives. Our estimates of these remaining useful lives may be affected by such factors as changing marketconditions, technological advances in the industry or changes in regulations governing the industry, among otherthings. We rely primarily on external sources of information as well as our own internal market data in assessingthe impact of these factors on estimates of remaining useful lives. Estimates of remaining useful lives are alsoimpacted by mechanical and structural factors. We review engineering data, operating history, maintenancehistory and third party inspections to assess useful lives from a structural and mechanical perspective. Indetermining estimated salvage values, we look primarily to external sources of information as well as our owninternal data regarding the values of scrap metal and salvaged equipment. Changes in any of the assumptionsmade in estimating remaining useful lives and salvage values of our properties and equipment could result notonly in increases or decreases in annual depreciation expense, but also could impact our criteria for analyzingproperties and equipment for impairment.
We periodically evaluate the remaining useful lives and salvage values of our rigs, giving effect to operatingand market conditions and upgrades performed on these rigs. As a result of analyses performed on our drillingfleet, effective January 1, 2004, we increased the remaining lives on certain rigs in our jackup fleet to 13 yearsfrom a range of 5.6 to 10.1 years, increased salvage values of these and other rigs in our jackup fleet from $0.5million per rig to amounts ranging from $1.2 to $3.0 million per rig, and increased the salvage values of oursemisubmersibles and certain of our drillships from $1.0 million per rig to amounts ranging from $2.5 to $4.0million per rig. The effect of these changes in estimates was a reduction to depreciation expense for the yearended December 31, 2004, of approximately $18.3 million.
Impairment of Rigs and Drilling Equipment. We review our long-term assets for impairment when changesin circumstances indicate that the carrying amount of the asset may not be recoverable, in accordance withStatement of Financial Accounting Standards (“SFAS”) No. 144, “Accounting for the Impairment or Disposal of
38

Long-lived Assets.” SFAS No. 144, among other things, requires that long-lived assets and certain intangibles tobe held and used be reported at the lower of carrying amount or fair value and establishes criteria to determinewhen a long-lived asset is classified as available for sale. Assets to be disposed of and assets not expected toprovide any future service potential are recorded at the lower of carrying amount or fair value less cost to sell.We did not incur any impairment charges in 2006 and 2005. We recorded an impairment charge ofapproximately $1.2 million in the first quarter of 2004 related to the sale of the platform rig Rig 82 for a nominalsum in connection with our exit from the platform rig business.
Our determination of impairment of rigs and drilling equipment, if any, requires estimates of undiscountedfuture cash flows. Actual impairment charges, if any, are recorded using an estimate of discounted future cashflows. The determination of future cash flows related to our rigs and drilling equipment requires us to estimatedayrates and utilization in future periods, and such estimates can change based on market conditions,technological advances in the industry or changes in regulations governing the industry. Significant changes tothe assumptions underlying our current estimates of cash flows could require a provision for impairment in afuture period.
INCOME TAXES
We are a Cayman Islands company and we operate through our various subsidiaries in numerous countriesthroughout the world including the United States. Consequently, our tax provision is based upon the tax laws andrates in effect in the countries in which our operations are conducted and income is earned. The income tax ratesimposed and methods of computing taxable income in these jurisdictions vary substantially. Our effective taxrate for financial statement purposes will continue to fluctuate from year to year as our operations are conductedin different taxing jurisdictions. Current income tax expense represents either liabilities expected to be reflectedon our income tax returns for the current year, nonresident withholding taxes, or changes in prior year taxestimates which may result from tax audit adjustments. Our deferred tax expense or benefit represents the changein the balance of deferred tax assets or liabilities as reported on the balance sheet. Valuation allowances areestablished to reduce deferred tax assets when it is more likely than not that some portion or all of the deferredtax assets will not be realized. In order to determine the amount of deferred tax assets and liabilities, as well as ofvaluation allowances, we must make estimates and assumptions regarding future taxable income, where rigs willbe deployed and other matters. Changes in these estimates and assumptions, as well as changes in tax laws, couldrequire us to adjust the deferred tax assets and liabilities or valuation allowances, including as discussed below.
Our ability to realize the benefit of our deferred tax assets requires that we achieve certain future earningslevels prior to the expiration of our NOL carryforwards. We have established a valuation allowance against thefuture tax benefit of a portion of our NOL carryforwards and could be required to record an additional valuationallowance if market conditions deteriorate and future earnings are below, or are projected to be below, ourcurrent estimates.
As of December 31, 2004, $71.6 million of a $76.1 million U.S. NOL was expected to expire unutilized atthe end of 2005. As a result, we carried a $71.6 million valuation allowance against the 2005 expiring NOL. Overthe course of 2005, U.S. taxable income increased significantly as compared to the 2004 estimate to the extentthat only $6.3 million of the 2005 expiring NOL was estimated to expire unutilized at the end of the year. As aconsequence, $69.8 million of the U.S. valuation allowance was released which resulted in a $24.9 million U.S.tax benefit in 2005. As of December 31, 2006, all of the remaining valuation allowance related to foreign NOLcarryforwards.
We have not provided for U.S. deferred taxes on the unremitted earnings of our U.S. subsidiaries that arepermanently reinvested. Should a distribution be made to us from the unremitted earnings of these U.S.subsidiaries, we could be required to record additional U.S. current and deferred taxes.
39
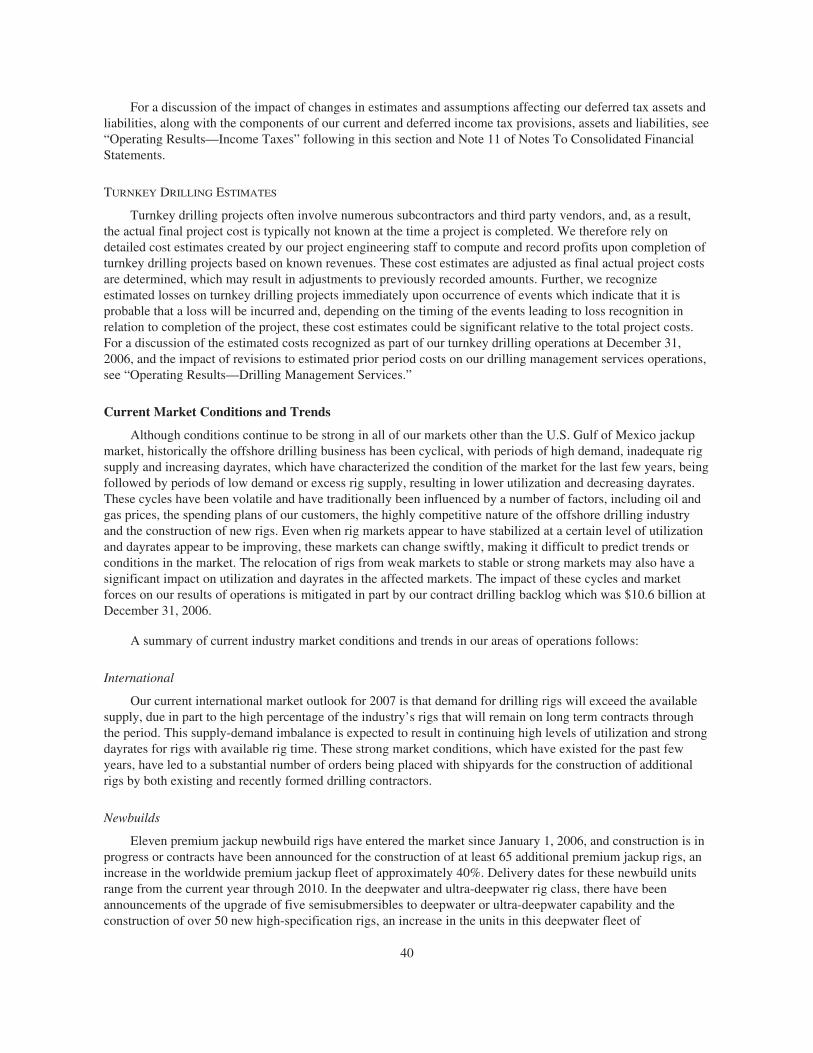
For a discussion of the impact of changes in estimates and assumptions affecting our deferred tax assets andliabilities, along with the components of our current and deferred income tax provisions, assets and liabilities, see“Operating Results—Income Taxes” following in this section and Note 11 of Notes To Consolidated FinancialStatements.
TURNKEY DRILLING ESTIMATES
Turnkey drilling projects often involve numerous subcontractors and third party vendors, and, as a result,the actual final project cost is typically not known at the time a project is completed. We therefore rely ondetailed cost estimates created by our project engineering staff to compute and record profits upon completion ofturnkey drilling projects based on known revenues. These cost estimates are adjusted as final actual project costsare determined, which may result in adjustments to previously recorded amounts. Further, we recognizeestimated losses on turnkey drilling projects immediately upon occurrence of events which indicate that it isprobable that a loss will be incurred and, depending on the timing of the events leading to loss recognition inrelation to completion of the project, these cost estimates could be significant relative to the total project costs.For a discussion of the estimated costs recognized as part of our turnkey drilling operations at December 31,2006, and the impact of revisions to estimated prior period costs on our drilling management services operations,see “Operating Results—Drilling Management Services.”
Current Market Conditions and Trends
Although conditions continue to be strong in all of our markets other than the U.S. Gulf of Mexico jackupmarket, historically the offshore drilling business has been cyclical, with periods of high demand, inadequate rigsupply and increasing dayrates, which have characterized the condition of the market for the last few years, beingfollowed by periods of low demand or excess rig supply, resulting in lower utilization and decreasing dayrates.These cycles have been volatile and have traditionally been influenced by a number of factors, including oil andgas prices, the spending plans of our customers, the highly competitive nature of the offshore drilling industryand the construction of new rigs. Even when rig markets appear to have stabilized at a certain level of utilizationand dayrates appear to be improving, these markets can change swiftly, making it difficult to predict trends orconditions in the market. The relocation of rigs from weak markets to stable or strong markets may also have asignificant impact on utilization and dayrates in the affected markets. The impact of these cycles and marketforces on our results of operations is mitigated in part by our contract drilling backlog which was $10.6 billion atDecember 31, 2006.
A summary of current industry market conditions and trends in our areas of operations follows:
International
Our current international market outlook for 2007 is that demand for drilling rigs will exceed the availablesupply, due in part to the high percentage of the industry’s rigs that will remain on long term contracts throughthe period. This supply-demand imbalance is expected to result in continuing high levels of utilization and strongdayrates for rigs with available rig time. These strong market conditions, which have existed for the past fewyears, have led to a substantial number of orders being placed with shipyards for the construction of additionalrigs by both existing and recently formed drilling contractors.
Newbuilds
Eleven premium jackup newbuild rigs have entered the market since January 1, 2006, and construction is inprogress or contracts have been announced for the construction of at least 65 additional premium jackup rigs, anincrease in the worldwide premium jackup fleet of approximately 40%. Delivery dates for these newbuild unitsrange from the current year through 2010. In the deepwater and ultra-deepwater rig class, there have beenannouncements of the upgrade of five semisubmersibles to deepwater or ultra-deepwater capability and theconstruction of over 50 new high-specification rigs, an increase in the units in this deepwater fleet of
40
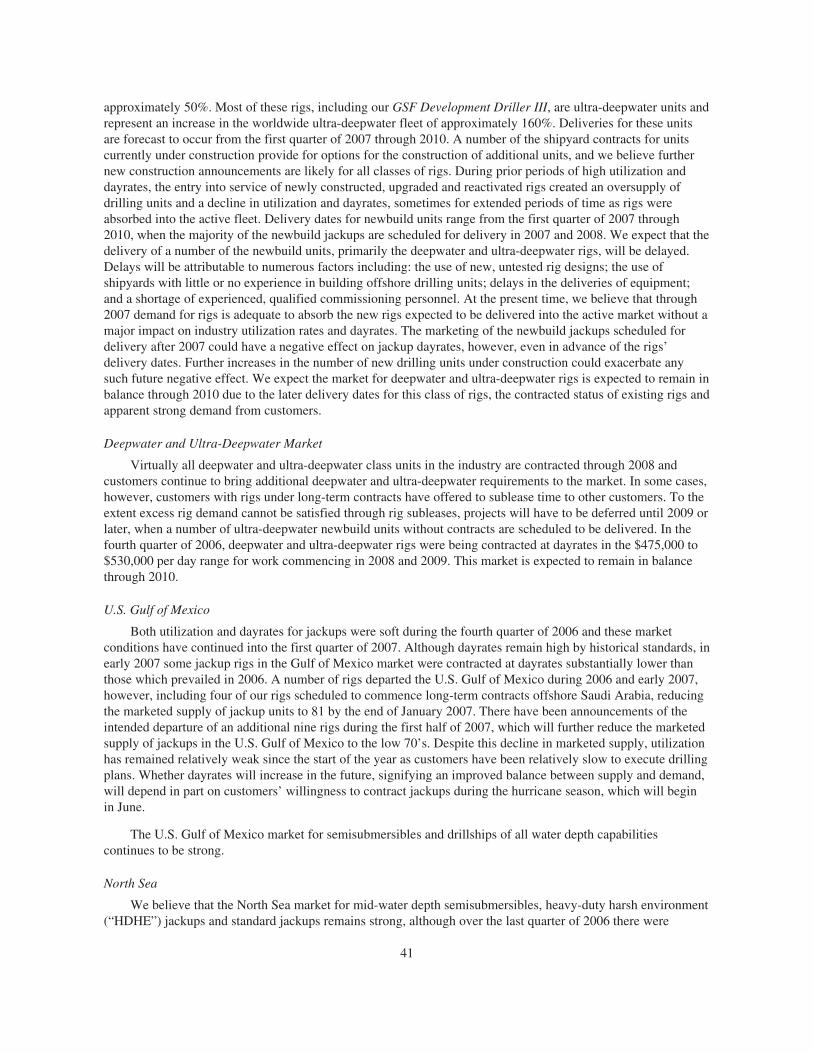
approximately 50%. Most of these rigs, including our GSF Development Driller III, are ultra-deepwater units andrepresent an increase in the worldwide ultra-deepwater fleet of approximately 160%. Deliveries for these unitsare forecast to occur from the first quarter of 2007 through 2010. A number of the shipyard contracts for unitscurrently under construction provide for options for the construction of additional units, and we believe furthernew construction announcements are likely for all classes of rigs. During prior periods of high utilization anddayrates, the entry into service of newly constructed, upgraded and reactivated rigs created an oversupply ofdrilling units and a decline in utilization and dayrates, sometimes for extended periods of time as rigs wereabsorbed into the active fleet. Delivery dates for newbuild units range from the first quarter of 2007 through2010, when the majority of the newbuild jackups are scheduled for delivery in 2007 and 2008. We expect that thedelivery of a number of the newbuild units, primarily the deepwater and ultra-deepwater rigs, will be delayed.Delays will be attributable to numerous factors including: the use of new, untested rig designs; the use ofshipyards with little or no experience in building offshore drilling units; delays in the deliveries of equipment;and a shortage of experienced, qualified commissioning personnel. At the present time, we believe that through2007 demand for rigs is adequate to absorb the new rigs expected to be delivered into the active market without amajor impact on industry utilization rates and dayrates. The marketing of the newbuild jackups scheduled fordelivery after 2007 could have a negative effect on jackup dayrates, however, even in advance of the rigs’delivery dates. Further increases in the number of new drilling units under construction could exacerbate anysuch future negative effect. We expect the market for deepwater and ultra-deepwater rigs is expected to remain inbalance through 2010 due to the later delivery dates for this class of rigs, the contracted status of existing rigs andapparent strong demand from customers.
Deepwater and Ultra-Deepwater Market
Virtually all deepwater and ultra-deepwater class units in the industry are contracted through 2008 andcustomers continue to bring additional deepwater and ultra-deepwater requirements to the market. In some cases,however, customers with rigs under long-term contracts have offered to sublease time to other customers. To theextent excess rig demand cannot be satisfied through rig subleases, projects will have to be deferred until 2009 orlater, when a number of ultra-deepwater newbuild units without contracts are scheduled to be delivered. In thefourth quarter of 2006, deepwater and ultra-deepwater rigs were being contracted at dayrates in the $475,000 to$530,000 per day range for work commencing in 2008 and 2009. This market is expected to remain in balancethrough 2010.
U.S. Gulf of Mexico
Both utilization and dayrates for jackups were soft during the fourth quarter of 2006 and these marketconditions have continued into the first quarter of 2007. Although dayrates remain high by historical standards, inearly 2007 some jackup rigs in the Gulf of Mexico market were contracted at dayrates substantially lower thanthose which prevailed in 2006. A number of rigs departed the U.S. Gulf of Mexico during 2006 and early 2007,however, including four of our rigs scheduled to commence long-term contracts offshore Saudi Arabia, reducingthe marketed supply of jackup units to 81 by the end of January 2007. There have been announcements of theintended departure of an additional nine rigs during the first half of 2007, which will further reduce the marketedsupply of jackups in the U.S. Gulf of Mexico to the low 70’s. Despite this decline in marketed supply, utilizationhas remained relatively weak since the start of the year as customers have been relatively slow to execute drillingplans. Whether dayrates will increase in the future, signifying an improved balance between supply and demand,will depend in part on customers’ willingness to contract jackups during the hurricane season, which will beginin June.
The U.S. Gulf of Mexico market for semisubmersibles and drillships of all water depth capabilitiescontinues to be strong.
North Sea
We believe that the North Sea market for mid-water depth semisubmersibles, heavy-duty harsh environment(“HDHE”) jackups and standard jackups remains strong, although over the last quarter of 2006 there were
41
relatively few new contracts awarded due to the lack of available rigs. Some customers have offered to subleaserig time to other customers during 2007, particularly semisubmersibles, which may indicate that these customersdo not have sufficient work to utilize all of their contracted rig days. Some subleases have already been enteredinto and there appears to be sufficient near term demand from customers to fill these gaps in other customers’contracts. We have not observed any negative impact on market rates as a result of this subleasing activity. Weexpect that customers will begin to source rigs for 2008 and beyond during the second and third quarters of 2007and we believe markets for all classes of rigs will remain strong through 2007.
West Africa
The market for all types of drilling units in West Africa remains tight, with customers continuing to delaysome of their programs due to the lack of available drilling units. We expect the West Africa jackup fleet toremain at or above 95% utilization throughout 2007 with dayrates anticipated to remain near or above recentrates.
Deepwater and ultra-deepwater rigs in this market are all fully contracted through 2008, with severalprojects slated for 2008 and beyond still in need of drilling units. This inadequate supply is expected to lead tomobilization of several of the newbuild ultra-deepwater units to West Africa over the next two to four years.Mid-water depth semisubmersible demand remains strong in the region with all units under contract except forone or two units with available rig time at the end of 2007.
Southeast Asia
The market for jackups in Southeast Asia remains strong. We are forecasting demand to exceed supply forthe majority of 2007, supporting current high dayrates. Although there are a large number of jackups underconstruction in the region, the newbuild units have yet to have a significant impact on the supply – demandimbalance. Recently, however, we have observed an increase in the number of rigs responding to requests forbids from customers which could be an indicator of an imbalance in the future. In view of the relatively lownumber of heavy-lift vessels available to transport jackups from the shipyards to other areas, we expect that thisregion will be forced to absorb a high number of the newbuild jackups due to be delivered in 2007 and 2008.This increase in the available units in the region could have a negative effect on dayrates. The deepwater marketin the Southeast Asia region, although relatively minor compared to the major deepwater markets in the Gulf ofMexico, West Africa and Brazil, is expected to continue to be strong as customers have announced multipleprojects for deepwater units in 2008 and beyond.
Middle East and Mediterranean
Recent contract extensions for jackups in the Mediterranean have created a shortage of rigs in 2007 resultingin a movement of rigs into the area. The deepwater market is also expected to be undersupplied in 2007, due inpart to announced development projects in Libya. The Gulf of Suez jackup market continues to be stable. In theArabian Gulf, we continue to observe strong demand for jackups and stable dayrates.
Canada and South America
Drilling activity in Northeastern Canada will remain constrained by rig supply in 2007, especially in view ofthe strength of markets elsewhere. In early 2007, we moved our HDHE jackup in the region to the North Sea tofulfill commitments in that market. Our deepwater unit in the region remains under contract into 2008.
We currently have two jackups in the South America market and we will be mobilizing two of oursemisubmersible units into the area in 2007 to fulfill contracts in the market. We expect the South Americajackup market to remain tight throughout 2007 and the market for deepwater and ultra-deepwater units isexpected to continue to strengthen due to the Brazilian national oil company’s aggressive five-year drillingcampaign.
42
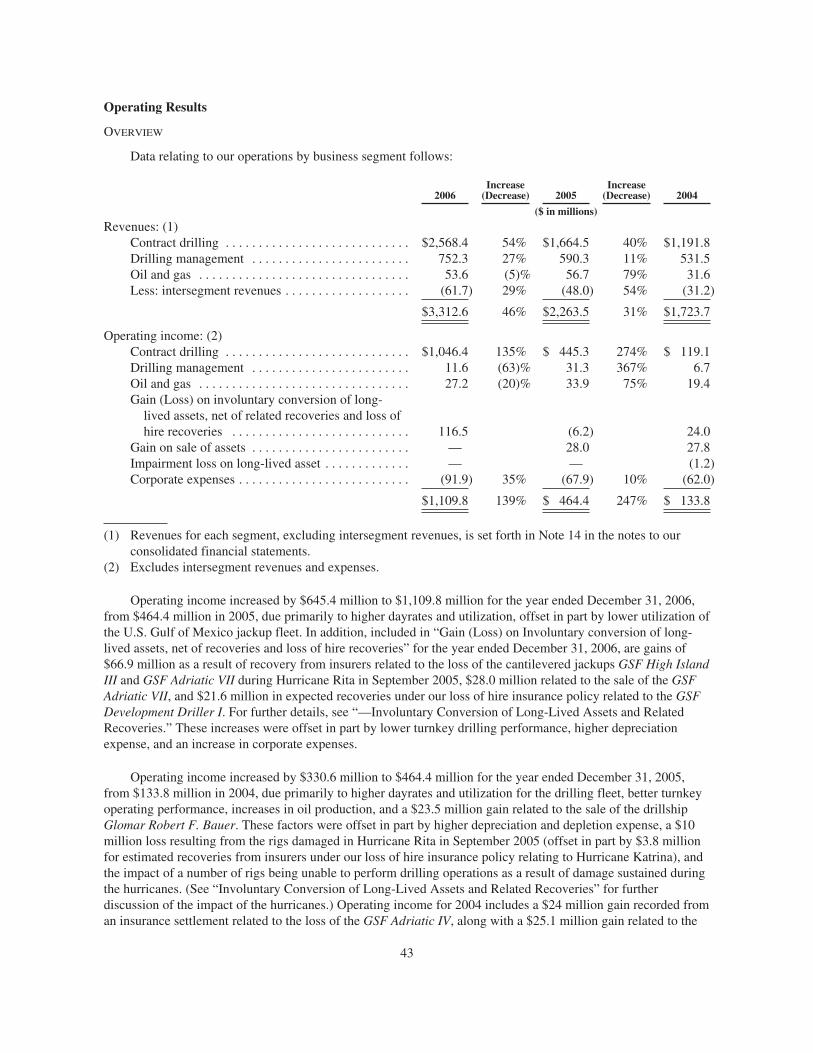
Operating Results
OVERVIEW
Data relating to our operations by business segment follows:
2006Increase
(Decrease) 2005Increase
(Decrease) 2004
($ in millions)
Revenues: (1)Contract drilling . . . . . . . . . . . . . . . . . . . . . . . . . . . . $2,568.4 54% $1,664.5 40% $1,191.8Drilling management . . . . . . . . . . . . . . . . . . . . . . . . 752.3 27% 590.3 11% 531.5Oil and gas . . . . . . . . . . . . . . . . . . . . . . . . . . . . . . . . 53.6 (5)% 56.7 79% 31.6Less: intersegment revenues . . . . . . . . . . . . . . . . . . . (61.7) 29% (48.0) 54% (31.2)
$3,312.6 46% $2,263.5 31% $1,723.7
Operating income: (2)Contract drilling . . . . . . . . . . . . . . . . . . . . . . . . . . . . $1,046.4 135% $ 445.3 274% $ 119.1Drilling management . . . . . . . . . . . . . . . . . . . . . . . . 11.6 (63)% 31.3 367% 6.7Oil and gas . . . . . . . . . . . . . . . . . . . . . . . . . . . . . . . . 27.2 (20)% 33.9 75% 19.4Gain (Loss) on involuntary conversion of long-
lived assets, net of related recoveries and loss ofhire recoveries . . . . . . . . . . . . . . . . . . . . . . . . . . . 116.5 (6.2) 24.0
Gain on sale of assets . . . . . . . . . . . . . . . . . . . . . . . . — 28.0 27.8Impairment loss on long-lived asset . . . . . . . . . . . . . — — (1.2)Corporate expenses . . . . . . . . . . . . . . . . . . . . . . . . . . (91.9) 35% (67.9) 10% (62.0)
$1,109.8 139% $ 464.4 247% $ 133.8
(1) Revenues for each segment, excluding intersegment revenues, is set forth in Note 14 in the notes to ourconsolidated financial statements.
(2) Excludes intersegment revenues and expenses.
Operating income increased by $645.4 million to $1,109.8 million for the year ended December 31, 2006,from $464.4 million in 2005, due primarily to higher dayrates and utilization, offset in part by lower utilization ofthe U.S. Gulf of Mexico jackup fleet. In addition, included in “Gain (Loss) on Involuntary conversion of long-lived assets, net of recoveries and loss of hire recoveries” for the year ended December 31, 2006, are gains of$66.9 million as a result of recovery from insurers related to the loss of the cantilevered jackups GSF High IslandIII and GSF Adriatic VII during Hurricane Rita in September 2005, $28.0 million related to the sale of the GSFAdriatic VII, and $21.6 million in expected recoveries under our loss of hire insurance policy related to the GSFDevelopment Driller I. For further details, see “—Involuntary Conversion of Long-Lived Assets and RelatedRecoveries.” These increases were offset in part by lower turnkey drilling performance, higher depreciationexpense, and an increase in corporate expenses.
Operating income increased by $330.6 million to $464.4 million for the year ended December 31, 2005,from $133.8 million in 2004, due primarily to higher dayrates and utilization for the drilling fleet, better turnkeyoperating performance, increases in oil production, and a $23.5 million gain related to the sale of the drillshipGlomar Robert F. Bauer. These factors were offset in part by higher depreciation and depletion expense, a $10million loss resulting from the rigs damaged in Hurricane Rita in September 2005 (offset in part by $3.8 millionfor estimated recoveries from insurers under our loss of hire insurance policy relating to Hurricane Katrina), andthe impact of a number of rigs being unable to perform drilling operations as a result of damage sustained duringthe hurricanes. (See “Involuntary Conversion of Long-Lived Assets and Related Recoveries” for furtherdiscussion of the impact of the hurricanes.) Operating income for 2004 includes a $24 million gain recorded froman insurance settlement related to the loss of the GSF Adriatic IV, along with a $25.1 million gain related to the
43

sale of a portion of a working interest in the Broom Field development project in the North Sea by our oil and gasdivision. Operating income for 2005 includes a $4.5 million gain related to deferred consideration earned underthat sales agreement.
Sale of Land Drilling Business (Discontinued Operations)
On May 21, 2004, we completed the sale of our land drilling business to Precision Drilling Corporation for atotal sales price of $316.5 million in an all-cash transaction. Our land drilling business consisted of a fleet of 31rigs, 12 of which were located in Kuwait, eight in Venezuela, four in Saudi Arabia, four in Egypt, and three inOman. As a result of this sale, we recognized a gain of $113.1 million, including a net tax benefit of $1.1 million,in the second quarter of 2004.
The following table lists the contribution of our land rig fleet to our consolidated operating results for theyear ended December 31, 2004:
Year EndedDecember 31,
2004
(In millions)
Revenues . . . . . . . . . . . . . . . . . . . . . . . . . . . . . . . . . . . . . . . . . . . . . . . . . . . . . . . $ 43.9
Expenses (income):Direct operating expenses . . . . . . . . . . . . . . . . . . . . . . . . . . . . . . . . . . . . . . 27.9Depreciation . . . . . . . . . . . . . . . . . . . . . . . . . . . . . . . . . . . . . . . . . . . . . . . . 4.0Exit costs . . . . . . . . . . . . . . . . . . . . . . . . . . . . . . . . . . . . . . . . . . . . . . . . . . . 6.8Gain on sale of assets . . . . . . . . . . . . . . . . . . . . . . . . . . . . . . . . . . . . . . . . . (112.0)
117.2Provision for income taxes, including a net tax benefit of $1.1 in 2004 related
to the gain on sale of assets . . . . . . . . . . . . . . . . . . . . . . . . . . . . . . . . . . . . . . 4.9
Income from discontinued operations, net of tax effect . . . . . . . . . . . . . . . . . . . $ 112.3
Gains on Sales of Assets
During the first quarter of 2004, we retired the drillship Glomar Robert F. Bauer from active service. As aresult, we accelerated the remaining depreciation on the rig, which resulted in a $1.5 million charge todepreciation expense in the first quarter of 2004. As a result of continued improvements in the offshore drillingmarkets, we sold this rig in the fourth quarter of 2005 for $25 million and recorded a net gain of $23.5 million.There was no tax impact related to this transaction.
In the first quarter of 2004 we sold our interest in a drilling project in West Africa for approximately $6.1million and recorded a gain of $2.7 million ($2.0 million net of taxes) in connection with this sale in the firstquarter of 2004.
In September 2004, our oil and gas division completed the sale of 50% of its interest in the Broom Field, adevelopment project in the North Sea. We received net proceeds of $35.9 million in connection with the sale andrecorded a gain of $25.1 million ($13.3 million net of taxes) in 2004. We retained an eight percent workinginterest in this project. Pursuant to the terms of the sale, if commodity prices exceeded a specified amount, wewere also entitled to additional post-closing consideration equal to a portion of the proceeds from the productionattributable to this interest sold through September 2005. In 2005 we recorded an additional gain associated withthis deferred consideration arrangement of $4.5 million ($2.7 million net of taxes), which represents the entiredeferred consideration earned under the sales agreement.
44
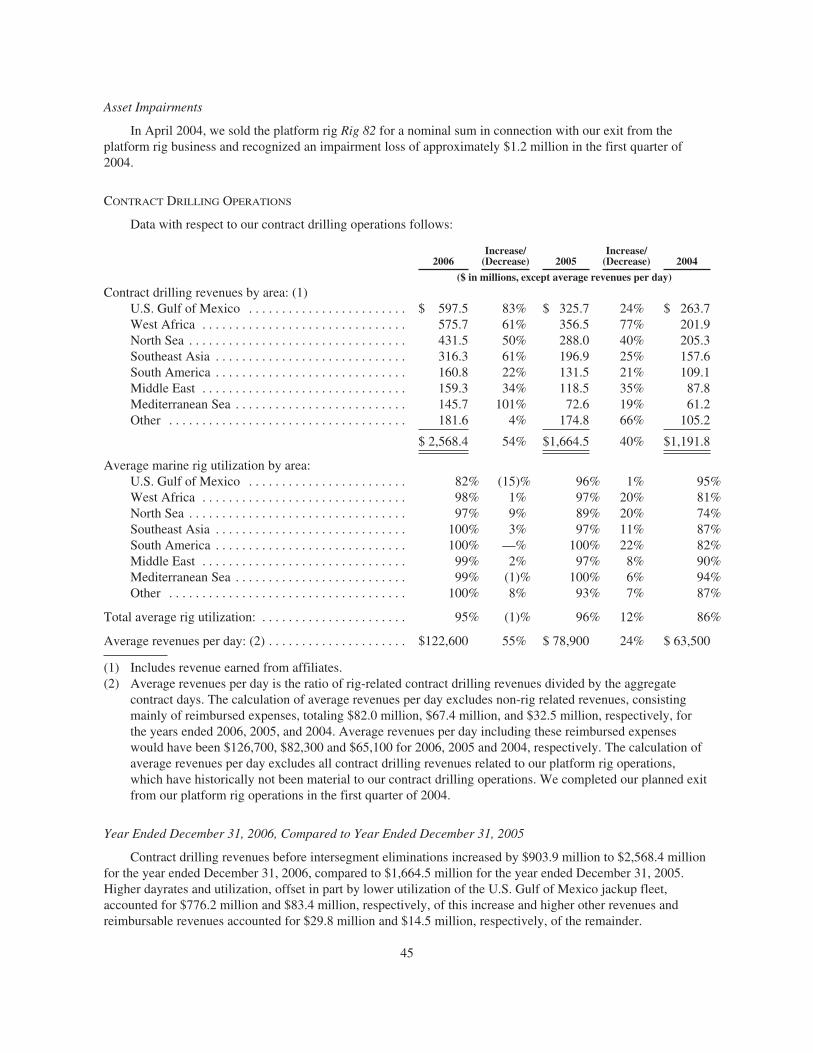
Asset Impairments
In April 2004, we sold the platform rig Rig 82 for a nominal sum in connection with our exit from theplatform rig business and recognized an impairment loss of approximately $1.2 million in the first quarter of2004.
CONTRACT DRILLING OPERATIONS
Data with respect to our contract drilling operations follows:
2006Increase/
(Decrease) 2005Increase/
(Decrease) 2004
($ in millions, except average revenues per day)
Contract drilling revenues by area: (1)U.S. Gulf of Mexico . . . . . . . . . . . . . . . . . . . . . . . . $ 597.5 83% $ 325.7 24% $ 263.7West Africa . . . . . . . . . . . . . . . . . . . . . . . . . . . . . . . 575.7 61% 356.5 77% 201.9North Sea . . . . . . . . . . . . . . . . . . . . . . . . . . . . . . . . . 431.5 50% 288.0 40% 205.3Southeast Asia . . . . . . . . . . . . . . . . . . . . . . . . . . . . . 316.3 61% 196.9 25% 157.6South America . . . . . . . . . . . . . . . . . . . . . . . . . . . . . 160.8 22% 131.5 21% 109.1Middle East . . . . . . . . . . . . . . . . . . . . . . . . . . . . . . . 159.3 34% 118.5 35% 87.8Mediterranean Sea . . . . . . . . . . . . . . . . . . . . . . . . . . 145.7 101% 72.6 19% 61.2Other . . . . . . . . . . . . . . . . . . . . . . . . . . . . . . . . . . . . 181.6 4% 174.8 66% 105.2
$ 2,568.4 54% $1,664.5 40% $1,191.8
Average marine rig utilization by area:U.S. Gulf of Mexico . . . . . . . . . . . . . . . . . . . . . . . . 82% (15)% 96% 1% 95%West Africa . . . . . . . . . . . . . . . . . . . . . . . . . . . . . . . 98% 1% 97% 20% 81%North Sea . . . . . . . . . . . . . . . . . . . . . . . . . . . . . . . . . 97% 9% 89% 20% 74%Southeast Asia . . . . . . . . . . . . . . . . . . . . . . . . . . . . . 100% 3% 97% 11% 87%South America . . . . . . . . . . . . . . . . . . . . . . . . . . . . . 100% —% 100% 22% 82%Middle East . . . . . . . . . . . . . . . . . . . . . . . . . . . . . . . 99% 2% 97% 8% 90%Mediterranean Sea . . . . . . . . . . . . . . . . . . . . . . . . . . 99% (1)% 100% 6% 94%Other . . . . . . . . . . . . . . . . . . . . . . . . . . . . . . . . . . . . 100% 8% 93% 7% 87%
Total average rig utilization: . . . . . . . . . . . . . . . . . . . . . . 95% (1)% 96% 12% 86%
Average revenues per day: (2) . . . . . . . . . . . . . . . . . . . . . $122,600 55% $ 78,900 24% $ 63,500
(1) Includes revenue earned from affiliates.(2) Average revenues per day is the ratio of rig-related contract drilling revenues divided by the aggregate
contract days. The calculation of average revenues per day excludes non-rig related revenues, consistingmainly of reimbursed expenses, totaling $82.0 million, $67.4 million, and $32.5 million, respectively, forthe years ended 2006, 2005, and 2004. Average revenues per day including these reimbursed expenseswould have been $126,700, $82,300 and $65,100 for 2006, 2005 and 2004, respectively. The calculation ofaverage revenues per day excludes all contract drilling revenues related to our platform rig operations,which have historically not been material to our contract drilling operations. We completed our planned exitfrom our platform rig operations in the first quarter of 2004.
Year Ended December 31, 2006, Compared to Year Ended December 31, 2005
Contract drilling revenues before intersegment eliminations increased by $903.9 million to $2,568.4 millionfor the year ended December 31, 2006, compared to $1,664.5 million for the year ended December 31, 2005.Higher dayrates and utilization, offset in part by lower utilization of the U.S. Gulf of Mexico jackup fleet,accounted for $776.2 million and $83.4 million, respectively, of this increase and higher other revenues andreimbursable revenues accounted for $29.8 million and $14.5 million, respectively, of the remainder.
45
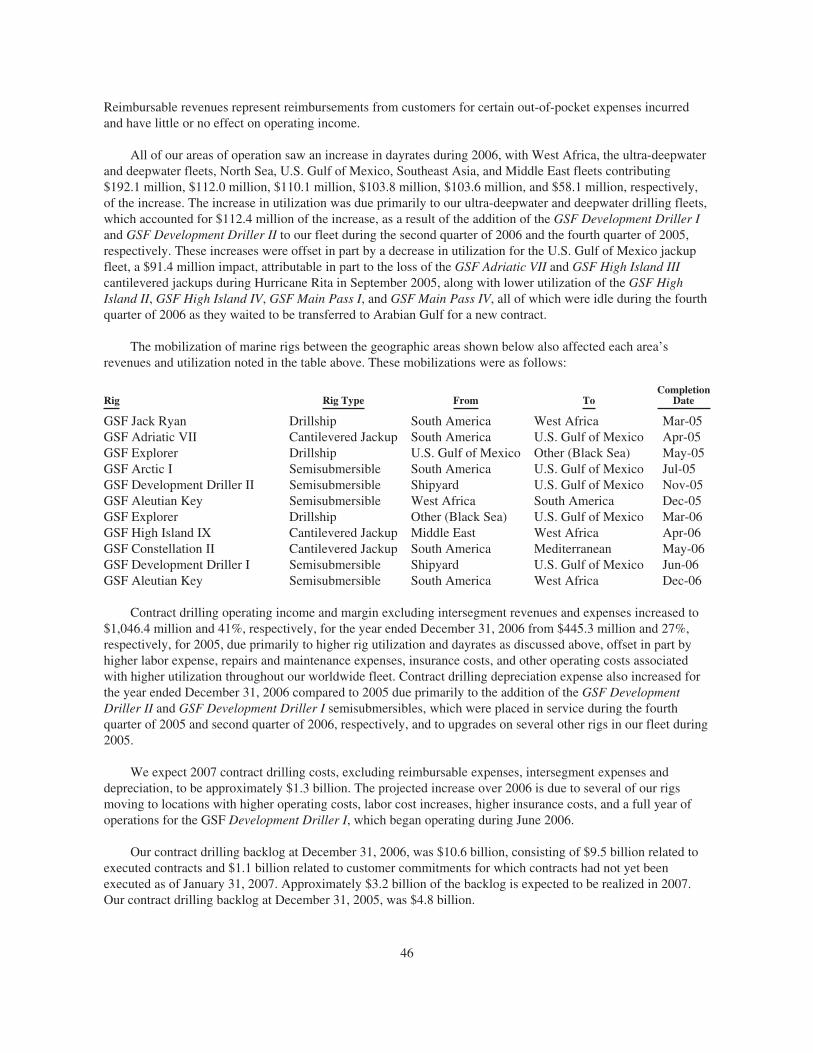
Reimbursable revenues represent reimbursements from customers for certain out-of-pocket expenses incurredand have little or no effect on operating income.
All of our areas of operation saw an increase in dayrates during 2006, with West Africa, the ultra-deepwaterand deepwater fleets, North Sea, U.S. Gulf of Mexico, Southeast Asia, and Middle East fleets contributing$192.1 million, $112.0 million, $110.1 million, $103.8 million, $103.6 million, and $58.1 million, respectively,of the increase. The increase in utilization was due primarily to our ultra-deepwater and deepwater drilling fleets,which accounted for $112.4 million of the increase, as a result of the addition of the GSF Development Driller Iand GSF Development Driller II to our fleet during the second quarter of 2006 and the fourth quarter of 2005,respectively. These increases were offset in part by a decrease in utilization for the U.S. Gulf of Mexico jackupfleet, a $91.4 million impact, attributable in part to the loss of the GSF Adriatic VII and GSF High Island IIIcantilevered jackups during Hurricane Rita in September 2005, along with lower utilization of the GSF HighIsland II, GSF High Island IV, GSF Main Pass I, and GSF Main Pass IV, all of which were idle during the fourthquarter of 2006 as they waited to be transferred to Arabian Gulf for a new contract.
The mobilization of marine rigs between the geographic areas shown below also affected each area’srevenues and utilization noted in the table above. These mobilizations were as follows:
Rig Rig Type From ToCompletion
Date
GSF Jack Ryan Drillship South America West Africa Mar-05GSF Adriatic VII Cantilevered Jackup South America U.S. Gulf of Mexico Apr-05GSF Explorer Drillship U.S. Gulf of Mexico Other (Black Sea) May-05GSF Arctic I Semisubmersible South America U.S. Gulf of Mexico Jul-05GSF Development Driller II Semisubmersible Shipyard U.S. Gulf of Mexico Nov-05GSF Aleutian Key Semisubmersible West Africa South America Dec-05GSF Explorer Drillship Other (Black Sea) U.S. Gulf of Mexico Mar-06GSF High Island IX Cantilevered Jackup Middle East West Africa Apr-06GSF Constellation II Cantilevered Jackup South America Mediterranean May-06GSF Development Driller I Semisubmersible Shipyard U.S. Gulf of Mexico Jun-06GSF Aleutian Key Semisubmersible South America West Africa Dec-06
Contract drilling operating income and margin excluding intersegment revenues and expenses increased to$1,046.4 million and 41%, respectively, for the year ended December 31, 2006 from $445.3 million and 27%,respectively, for 2005, due primarily to higher rig utilization and dayrates as discussed above, offset in part byhigher labor expense, repairs and maintenance expenses, insurance costs, and other operating costs associatedwith higher utilization throughout our worldwide fleet. Contract drilling depreciation expense also increased forthe year ended December 31, 2006 compared to 2005 due primarily to the addition of the GSF DevelopmentDriller II and GSF Development Driller I semisubmersibles, which were placed in service during the fourthquarter of 2005 and second quarter of 2006, respectively, and to upgrades on several other rigs in our fleet during2005.
We expect 2007 contract drilling costs, excluding reimbursable expenses, intersegment expenses anddepreciation, to be approximately $1.3 billion. The projected increase over 2006 is due to several of our rigsmoving to locations with higher operating costs, labor cost increases, higher insurance costs, and a full year ofoperations for the GSF Development Driller I, which began operating during June 2006.
Our contract drilling backlog at December 31, 2006, was $10.6 billion, consisting of $9.5 billion related toexecuted contracts and $1.1 billion related to customer commitments for which contracts had not yet beenexecuted as of January 31, 2007. Approximately $3.2 billion of the backlog is expected to be realized in 2007.Our contract drilling backlog at December 31, 2005, was $4.8 billion.
46
Year Ended December 31, 2005, Compared to Year Ended December 31, 2004
Contract drilling revenues before intersegment eliminations increased by $472.7 million to $1,664.5 millionfor the year ended December 31, 2005, compared to $1,191.8 million for the year ended December 31, 2004.Higher dayrates and utilization for our drilling fleet accounted for $250.5 million and $170.5 million,respectively, of this increase and higher reimbursable and other revenues accounted for $35.0 million and $16.7million, respectively, of the remainder.
We experienced increases in both dayrates and utilization for most of our fleet with the exception of theGSF Adriatic IV cantilevered jackup which sank offshore Egypt in the third quarter of 2004, the cantileveredjackups GSF High Island II, GSF High Island III and GSF Adriatic VII, all U.S. Gulf of Mexico, which were idlein the fourth quarter of 2005 due to damage sustained from Hurricane Rita, lower utilization for the GSFExplorer drillship, which was in a shipyard during the second quarter of 2005, and the mobilization of the GSFAdriatic VII cantilevered jackup from Trinidad to the U.S. Gulf of Mexico during the second quarter of 2005.
Contract drilling operating income and margin excluding intersegment revenues and expenses increased to$445.3 million and 27%, respectively, for the year ended December 31, 2005 from $119.1 million and 10%,respectively, for 2004, due primarily to higher rig utilization and dayrates as discussed above, offset by higherreimbursable expenses, repairs and maintenance expenses, labor expenses and other operating costs associatedwith higher utilization throughout our worldwide fleet. Repairs and maintenance expense for 2005 includesapproximately $18.7 million related to the reactivation of the GSF Arctic II semisubmersible which had beencold-stacked in the North Sea prior to resumption of operations in September 2005. Contract drilling depreciationexpense also increased for the year ended December 31, 2005 compared to 2004 due primarily to the addition ofthe GSF Constellation II cantilevered jackup, which was placed in service during the third quarter of 2004, and toupgrades on several other rigs in our fleet during 2004.
DRILLING MANAGEMENT SERVICES
Results of operations from our drilling management services segment may be limited by certain factors,including our ability to find and retain qualified personnel, to hire suitable rigs at acceptable rates, and to obtainand successfully perform turnkey drilling contracts based on competitive bids. Our ability to obtain turnkeydrilling contracts is largely dependent on the number of such contracts available for bid, which in turn isinfluenced by market prices for oil and gas, among other factors. Furthermore, our ability to enter into turnkeydrilling contracts may be constrained from time to time by the availability of GlobalSantaFe or third-partydrilling rigs. The market for drilling rigs was constrained during 2006 due to increased drilling activityworldwide and the number of rigs which have been mobilized to other markets. Drilling management servicesresults are also affected by the required deferral of turnkey drilling profit related to wells in which our oil and gasdivision is either the operator or holds a working interest. This turnkey profit is credited to our full-cost pool ofoil and gas properties and is recognized over future periods through a lower depletion rate as reserves areproduced. Accordingly, results of our drilling management service operations may vary widely from quarter toquarter and from year to year.
Year Ended December 31, 2006, Compared to Year Ended December 31, 2005
Drilling management services revenues before intersegment eliminations increased by $162.0 million to$752.3 million for the year ended December 31, 2006, from $590.3 million for 2005. Approximately $117.9million of this increase was attributable to higher average revenues per turnkey project, $40.2 million wasattributable to an increase in daywork and other revenues and $16.3 million was attributed to an increase inreimbursable revenues, offset in part by a $12.4 million decrease due to a decrease in the number of turnkeyprojects completed. Reimbursable revenues represent reimbursements received from the client for certainout-of-pocket expenses and have little or no effect on operating income. The increase in average revenues perturnkey project is primarily a result of higher contract prices due to increases in dayrates and other drilling costs,
47
which have increased due to higher demand for rigs and services in the offshore drilling rig market. Wecompleted 97 turnkey projects in 2006 (70 wells drilled and 27 well completions), compared to 99 turnkeyprojects in 2005 (80 wells drilled and 19 well completions).
Drilling management services operating income and margin, excluding intersegment revenues and expenses,decreased to $11.6 million and 1.6%, respectively, for the year ended December 31, 2006, from $31.3 millionand 5.5%, respectively, in 2005. The decrease in operating results was due primarily to the deferral of $30.4million of turnkey profit on wells in which our oil and gas division was the operator or had a working interestcompared to the deferral of $17.1 million in 2005, along with a decrease in the number of turnkey projectsperformed in the North Sea during 2006 as a result of less rig availability. Also contributing to the reduction inoperation margin were losses totaling approximately $19.7 million on 6 turnkey wells during 2006, including a$14.4 million loss related to one well drilled in 2006. In 2005 we incurred losses totaling approximately $4.3million on 3 of the 99 turnkey projects completed during 2005.
Subsequent to December 31, 2006, we encountered unforeseen difficulties on one additional turnkey projectunderway at December 31, 2006. We estimate that we will incur a loss of approximately $2.9 million on thisproject in the first quarter of 2007.
Turnkey drilling projects often involve numerous subcontractors and third party vendors and, as a result, theactual final project cost is typically not known at the time a project is completed (see “Critical AccountingPolicies and Estimates—Turnkey Drilling Estimates”). Results for the years ended December 31, 2006 and 2005,were favorably affected by downward revisions to cost estimates of wells completed in prior years totaling $1.5million and $2.7 million, respectively, which represented less than 1.0% of drilling management servicesexpenses for each of 2005 and 2004. The effect of these revisions was more than offset, however, by the deferralof turnkey profit totaling $30.4 million in 2006 and $17.1 million in 2005, as noted above, related to wells inwhich our oil and gas division was either the operator or held a working interest. This turnkey profit has beencredited to our full cost pool of oil and gas properties and will be recognized through a lower depletion rate asreserves are produced. Estimated costs included in 2006 drilling management services operating results totaledapproximately $68.4 million at December 31, 2006. To the extent that actual costs differ from estimated costs,results in future periods will be affected by revisions to this amount.
As of December 31, 2006, our drilling management services backlog was approximately $114.1 million, allof which is expected to be realized in 2007. Our drilling management services backlog was approximately $23.5million at December 31, 2005.
Year Ended December 31, 2005, Compared to Year Ended December 31, 2004
Drilling management services revenues before intersegment eliminations increased by $58.8 million to$590.3 million for the year ended December 31, 2005, from $531.5 million for 2004. Approximately $157.5million of this increase was attributable to higher average revenues per turnkey project and $4.8 million wasattributable to an increase in daywork and other revenues, offset in part by an $86.1 million decrease due to adecrease in the number of turnkey projects completed and a $17.4 million decrease in reimbursable revenues.The increase in average revenues per turnkey project is a result of obtaining higher contract prices due toincreases in drilling costs, primarily dayrates, which increased due to higher demand in the offshore drilling rigmarket. This higher demand also limited the availability of drilling rigs, contributing to a decrease in the numberof turnkey projects completed compared to prior year. The offshore drilling rig market was further constrained bythe number of rigs damaged and destroyed during Hurricane Katrina and Hurricane Rita. The decrease inreimbursable revenues is due primarily to a decrease in project management operations in 2005. As noted above,however, reimbursable revenues represent reimbursements received from the client for certain out-of-pocketexpenses and have little or no effect on operating income. We completed 99 turnkey projects in 2005 (80 wellsdrilled and 19 well completions), compared to 119 turnkey projects in 2004 (89 wells drilled and 30 wellcompletions).
48
Drilling management services operating income and margin, excluding intersegment revenues and expenses,increased to $31.3 million and 5.5%, respectively, for the year ended December 31, 2005, from $6.7 million and1.3%, respectively, in 2004, due primarily to better turnkey performance in 2005. Our turnkey operating resultsfor 2005 included losses totaling $4.3 million on 3 of the 99 turnkey projects completed compared to lossestotaling approximately $21.1 million on 14 of our 119 projects completed during the year ended December 31,2004. We also incurred a loss of $0.9 million in connection with our project management operations during thefirst quarter of 2004.
Results for the years ended December 31, 2005 and 2004, were favorably affected by downward revisions tocost estimates of wells completed in prior years totaling $2.7 million and $3.3 million, respectively, whichrepresented less than 1.0% of drilling management services expenses for each of 2004 and 2003. The effect ofthese revisions was more than offset, however, by the deferral of turnkey profit totaling $17.1 million in 2005and $17.6 million in 2004 related to wells in which our oil and gas division was either the operator or held aworking interest. Estimated costs included in 2005 drilling management services operating results totaledapproximately $33.7 million at December 31, 2005.
OIL AND GAS OPERATIONS
We acquire interests in oil and gas properties principally in order to facilitate the acquisition of turnkeycontracts for our drilling management services operations.
Year Ended December 31, 2006, Compared to Year Ended December 31, 2005
Oil and gas revenues decreased by $3.1 million to $53.6 million for the year ended December 31, 2006 from$56.7 million for 2005. Decreases in oil production, along with a decrease in gas prices accounted for $11.4million and $0.9 million, respectively, of this decrease, offset in part by an increase of $7.8 million due to higheroil prices and $1.4 million due to higher gas production.
Operating income from our oil and gas operations decreased by $6.7 million to $27.2 million in 2006 from$33.9 million in 2005, due primarily to the decreased revenues discussed above, along with an increase inrecognition of stock-based compensation expense as required by SFAS 123(R).
Year Ended December 31, 2005, Compared to Year Ended December 31, 2004
Oil and gas revenues increased by $25.1 million to $56.7 million for the year ended December 31, 2005from $31.6 million for 2004. Increases in oil production and prices, along with an increase in gas pricesaccounted for $23.2 million, $3.4 million, and $4.6 million, respectively, of this increase, offset in part by adecrease of $6.1 million due to lower gas volumes produced.
Operating income from our oil and gas operations increased by $14.5 million to $33.9 million in 2005 from$19.4 million in 2004, due primarily to the increased revenues discussed above, offset in part by an increase indepletion and lease operating expenses resulting from increases in oil production.
INVOLUNTARY CONVERSION OF LONG-LIVED ASSETS AND RELATED RECOVERIES
During the third quarter of 2005, a number of our rigs were damaged as a result of hurricanes Katrina andRita. All these rigs returned to work with the exception of the GSF High Island III and the GSF Adriatic VII.During the second quarter of 2006, we recorded gains of $32.8 million on the GSF High Island III and $30.9million on the GSF Adriatic VII, which represent expected recoveries of partial losses under our insurance policy,less amounts previously recognized when the rigs were written down to salvage value. These amounts werecollected in the third quarter of 2006. In December 2006, we sold the GSF Adriatic VII to a third party for a netpurchase price of approximately $29.4 million, net of selling costs, and recorded a gain of $28 million, which
49
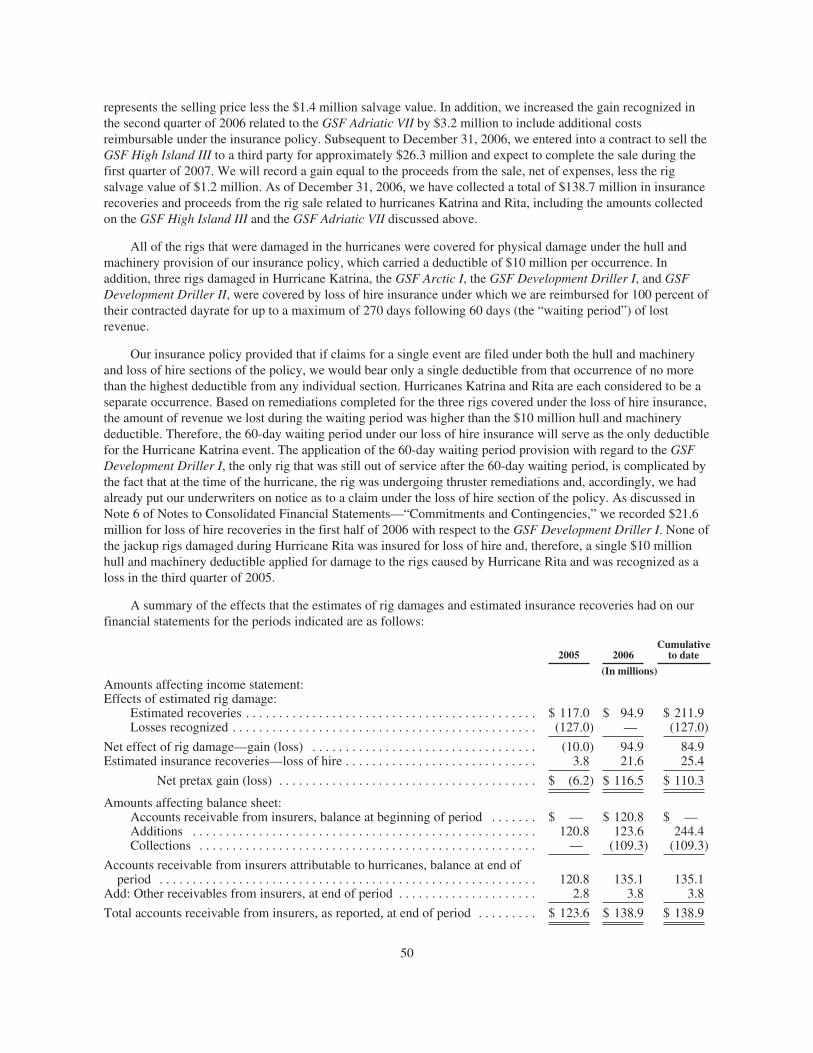
represents the selling price less the $1.4 million salvage value. In addition, we increased the gain recognized inthe second quarter of 2006 related to the GSF Adriatic VII by $3.2 million to include additional costsreimbursable under the insurance policy. Subsequent to December 31, 2006, we entered into a contract to sell theGSF High Island III to a third party for approximately $26.3 million and expect to complete the sale during thefirst quarter of 2007. We will record a gain equal to the proceeds from the sale, net of expenses, less the rigsalvage value of $1.2 million. As of December 31, 2006, we have collected a total of $138.7 million in insurancerecoveries and proceeds from the rig sale related to hurricanes Katrina and Rita, including the amounts collectedon the GSF High Island III and the GSF Adriatic VII discussed above.
All of the rigs that were damaged in the hurricanes were covered for physical damage under the hull andmachinery provision of our insurance policy, which carried a deductible of $10 million per occurrence. Inaddition, three rigs damaged in Hurricane Katrina, the GSF Arctic I, the GSF Development Driller I, and GSFDevelopment Driller II, were covered by loss of hire insurance under which we are reimbursed for 100 percent oftheir contracted dayrate for up to a maximum of 270 days following 60 days (the “waiting period”) of lostrevenue.
Our insurance policy provided that if claims for a single event are filed under both the hull and machineryand loss of hire sections of the policy, we would bear only a single deductible from that occurrence of no morethan the highest deductible from any individual section. Hurricanes Katrina and Rita are each considered to be aseparate occurrence. Based on remediations completed for the three rigs covered under the loss of hire insurance,the amount of revenue we lost during the waiting period was higher than the $10 million hull and machinerydeductible. Therefore, the 60-day waiting period under our loss of hire insurance will serve as the only deductiblefor the Hurricane Katrina event. The application of the 60-day waiting period provision with regard to the GSFDevelopment Driller I, the only rig that was still out of service after the 60-day waiting period, is complicated bythe fact that at the time of the hurricane, the rig was undergoing thruster remediations and, accordingly, we hadalready put our underwriters on notice as to a claim under the loss of hire section of the policy. As discussed inNote 6 of Notes to Consolidated Financial Statements—“Commitments and Contingencies,” we recorded $21.6million for loss of hire recoveries in the first half of 2006 with respect to the GSF Development Driller I. None ofthe jackup rigs damaged during Hurricane Rita was insured for loss of hire and, therefore, a single $10 millionhull and machinery deductible applied for damage to the rigs caused by Hurricane Rita and was recognized as aloss in the third quarter of 2005.
A summary of the effects that the estimates of rig damages and estimated insurance recoveries had on ourfinancial statements for the periods indicated are as follows:
2005 2006Cumulative
to date
(In millions)Amounts affecting income statement:Effects of estimated rig damage:
Estimated recoveries . . . . . . . . . . . . . . . . . . . . . . . . . . . . . . . . . . . . . . . . . . . . $ 117.0 $ 94.9 $ 211.9Losses recognized . . . . . . . . . . . . . . . . . . . . . . . . . . . . . . . . . . . . . . . . . . . . . . (127.0) — (127.0)
Net effect of rig damage—gain (loss) . . . . . . . . . . . . . . . . . . . . . . . . . . . . . . . . . . (10.0) 94.9 84.9Estimated insurance recoveries—loss of hire . . . . . . . . . . . . . . . . . . . . . . . . . . . . . 3.8 21.6 25.4
Net pretax gain (loss) . . . . . . . . . . . . . . . . . . . . . . . . . . . . . . . . . . . . . . . $ (6.2) $ 116.5 $ 110.3
Amounts affecting balance sheet:Accounts receivable from insurers, balance at beginning of period . . . . . . . $ — $ 120.8 $ —Additions . . . . . . . . . . . . . . . . . . . . . . . . . . . . . . . . . . . . . . . . . . . . . . . . . . . . 120.8 123.6 244.4Collections . . . . . . . . . . . . . . . . . . . . . . . . . . . . . . . . . . . . . . . . . . . . . . . . . . . — (109.3) (109.3)
Accounts receivable from insurers attributable to hurricanes, balance at end ofperiod . . . . . . . . . . . . . . . . . . . . . . . . . . . . . . . . . . . . . . . . . . . . . . . . . . . . . . . . . 120.8 135.1 135.1
Add: Other receivables from insurers, at end of period . . . . . . . . . . . . . . . . . . . . . 2.8 3.8 3.8
Total accounts receivable from insurers, as reported, at end of period . . . . . . . . . $ 123.6 $ 138.9 $ 138.9
50
Additions to accounts receivable from insurers in the table above include additions due to revised estimatesof rig damages and anticipated loss of hire recoveries, both of which affected pretax income as shown in thetable. Capital costs incurred to remediate damage to the rigs were added to the capitalized value of the rigs. Alsoincluded in additions to accounts receivable from insurers for 2006 in the table above are anticipatedreimbursements for cash outlays to salvage the GSF High Island III and the GSF Adriatic VII, necessitated by thesignificant damage suffered by those rigs during Hurricane Rita, which did not affect pretax income, totaling$35.2 million for 2006.
In August 2004, the jackup GSF Adriatic IV encountered well control problems, caught fire and sank whiledrilling in the Mediterranean Sea off the coast of Egypt. All of our personnel on board the rig were evacuatedsafely, although the rig was a total loss. We received insurance proceeds totaling $40.0 million, net of ourdeductible, and recorded a gain of $24.0 million, net of taxes, in the third quarter of 2004.
GENERAL AND ADMINISTRATIVE EXPENSES
General and administrative expenses for the year ended December 31, 2006, increased by $23.8 million to$84.0 million, or 2.5% of revenues, from $60.2 million, or 2.7% of revenues, for 2005. The increase in generaland administrative expenses was due primarily due to an increase of $20.0 million in stock-based compensationexpense, including the recognition of $15.4 million of stock-based compensation expense as required by theadoption of SFAS 123(R).
General and administrative expenses for the year ended December 31, 2005, increased by $3.7 million to$60.2 million, or 2.7% of revenues, from $56.5 million, or 3.3% of revenues, for 2004. The increase in generaland administrative expenses was due primarily to pension expense for two retiring executives, amortization ofrestricted stock, which was granted to employees in February 2005 and is expensed over a three-year period, andcosts associated with training and support for our new enterprise resource management software system, whichwas placed into service on January 1, 2005, along with costs incurred in connection with the implementation ofthis system in our foreign offices.
OTHER INCOME AND EXPENSE
Interest expense was $37.0 million for 2006, $41.3 million for 2005 and $55.5 million for 2004. Thedecrease in interest expense for 2006 was due primarily to the repurchase of the Zero Coupon ConvertibleDebentures during the second and third quarters of 2005, as discussed below in “Liquidity and CapitalResources—Investing and Financing Activities.” The decrease in interest expense for 2005 was due primarily tothe retirement of Global Marine’s 71⁄8% Notes due 2007 in the second quarter of 2004 and the repurchase of theZero Coupon Convertible Debentures during the second and third quarters of 2005.
We capitalized $20.5 million, $38.1 million and $41.0 million of interest costs in 2006, 2005 and 2004,respectively, primarily in connection with our rig expansion program discussed in “Liquidity and CapitalResources—Investing and Financing Activities.”
Interest income increased to $23.5 million for the year ended December 31, 2006, from $22.7 million in2005, due primarily to an increase in our average rate of return on our investments. Interest income increased to$22.7 million for the year ended December 31, 2005, from $12.3 million in 2004, due primarily to an increase inour average rate of return on our investments.
On June 30, 2004, we completed the redemption of the entire outstanding $300 million principal amount ofGlobal Marine Inc.’s 71⁄8% Notes due 2007, for a total redemption price of $331.7 million, plus accrued andunpaid interest of $7.1 million. We recognized a loss on the early retirement of debt of approximately $21.0million, net of a tax benefit of $11.4 million, in the second quarter of 2004. We funded the redemption price fromour existing cash, cash equivalents and marketable securities balances.
51
Other income of $1.1 million for the year ended December 31, 2006, consists primarily of earnings in ourequity investment in Caspian Drilling Company (see “Items 1. and 2. Joint Venture, Agency and SponsorshipRelationships and Other Investments”). Other income of $2.1 million for the year ended December 31, 2005,consists of realized gains on marketable securities related to our nonqualified pension plans, offset by costsincurred to settle a Canadian tax audit for the years 1998-2001 and expenses incurred to support our employeesafter hurricanes Katrina and Rita. Other expense of $1.2 million for the year ended December 31, 2004, includesa loss of $3.8 million on a commodity derivative entered into in the first quarter of 2004, offset in part byrealized gains of $1.6 million on the sale of marketable securities related to one of our nonqualified pensionplans.
INCOME TAXES
Our effective income tax rates for financial reporting purposes were approximately 10%, 13% and 68% forthe years ended December 31, 2006, 2005 and 2004, respectively. The effective tax rate for 2006 compared to2005 decreased due in part to the recognition of a net gain of $94.9 million on the recovery of partial losses underour insurance policy attributable to the GSF Adriatic VII and GSF High Island III and the sale of the GSFAdriatic VII to a third party with no corresponding tax expense for financial reporting purposes. The 2006effective tax rate also benefited from certain changes in our legal structure. Our drilling rigs operating in Egyptare now owned and operated by a subsidiary licensed by the Egyptian Free-Zone authority that is subject to azero percent corporate income tax rate. Additionally, a subsidiary restructuring completed in the fourth quarter of2006 resulted in additional tax benefits related to interest expense deductions on intercompany debt. The newcorporate structure eventually should facilitate the movement of cash out of some of our significant operatingsubsidiaries at a lower tax cost.
The 2005 effective tax of 13% is lower than 2004 due primarily to a change in our mix of earnings betweendomestic earnings and foreign earnings with foreign earnings in low tax jurisdictions increasingdisproportionably higher than the increase in domestic earnings. Foreign earnings included a $23.5 million bookgain in the sale of the drilling rig Glomar Robert F. Bauer that was subject to a zero percent tax rate. Theincrease in U.S. taxable income in 2005 resulted in the utilization of $71.6 million of an expiring U.S. NOL. Theutilization of this portion of the NOL triggered the release of a previously recorded valuation allowance and therecognition of a $24.9 million tax benefit. The 2005 effective tax rate was further reduced due to lower statutorytax rates in various foreign jurisdictions and a net tax benefit from the resolution of tax audits and tax returnfilings at amounts lower than had been previously estimated. The effective rate for 2004 includes the effect of a$42.5 million charge related to the subsidiary realignment discussed below. Excluding the $42.5 million charge,our income tax expense would have been $24.1 million, which when compared to our pretax income fromcontinuing operations of $98.0 million, yields an effective tax rate of 25% for 2004.
In December 2004, we completed a realignment of our subsidiaries to separate our international anddomestic holding companies to improve operational and financial efficiencies within our organization. Thisrealignment included the redemption of a minority interest in a foreign subsidiary held by one of our U.S.subsidiaries, along with the intercompany sale of certain rigs between U.S. and foreign subsidiaries based uponcurrent projections of the long-term geographic areas of operations of these rigs. These transactions generated aU.S. taxable gain which resulted in a total tax expense of approximately $135.0 million. This expense wasreduced in part by the recognition of $77.4 million of tax benefits resulting from the release of valuationallowances previously recorded against a portion of our U.S. NOL carryforwards, the recognition of a $6.8million tax benefit from the release of deferred tax liabilities and the deferral of $8.3 million of tax expenserelated to the gain on the intercompany rig sales. This net deferred tax benefit will be recognized for financialreporting purposes over the remaining useful lives of the rigs. The total tax expense recognized for financialreporting purposes was $42.5 million, comprised of $37.4 million of deferred tax expense and $5.1 million ofcurrent tax expense.
In connection with an audit of the 2002 and 2003 United States federal income tax returns of our UnitedStates subsidiaries, the Internal Revenue Service (“IRS”) has proposed that interest payments made from one of
52
our domestic subsidiaries to one of our foreign subsidiaries with respect to certain notes issued in connectionwith the business combination of Global Marine Inc. and Santa Fe International Corporation were subject towithholding of United States federal income tax at a 30% rate and that, as a result, the domestic subsidiary owesadditional tax of approximately $50.6 million plus interest. The IRS may also raise the same issue for interestpayments made pursuant to such notes in 2004 through 2006, which would result in proposed adjustments ofadditional tax of approximately $25.3 million, plus interest, per year. We believe that a 0% withholding tax rateapplies to such interest payments. We have protested the adjustment proposed in the revenue agent’s report andare awaiting an appeal conference. We intend to vigorously defend our position. We believe that we shouldprevail on this issue; consequently, we have made no accrual for this proposed adjustment.
We intend to permanently reinvest all of the unremitted earnings of our U.S. subsidiaries in their businesses.As a result, we have not provided for U.S. deferred taxes on $722.3 million of cumulative unremitted earnings atDecember 31, 2006. Should a distribution be made to us from the unremitted earnings of our U.S. subsidiaries,we could be required to record additional U.S. current and deferred taxes. It is not practicable to estimate theamount of deferred tax liability associated with these unremitted earnings.
In July 2006, the FASB issued Interpretation No. 48, “Accounting for Uncertainty in Income Taxes”(“FIN 48”), an interpretation of SFAS 109, “Accounting for Income Taxes.” FIN 48 prescribes a comprehensivemodel for how companies should recognize, measure, present, and disclose in their financial statements uncertaintax positions taken or expected to be taken on a tax return. Tax law is subject to varied interpretation, andwhether a tax position will ultimately be sustained may be uncertain. Under FIN 48, tax positions shall initiallybe recognized in the financial statements when it is more likely than not the position will be sustained uponexamination by the tax authorities. Such tax positions shall initially and subsequently be measured as the largestamount of tax benefit that is greater than 50% likely of being realized upon ultimate settlement with the taxauthority assuming full knowledge of the position and all relevant facts. FIN 48 also requires additionaldisclosures about unrecognized tax benefits associated with uncertain income tax positions and a reconciliationof the change in the unrecognized benefit. In addition, FIN 48 requires interest to be recognized on the fullamount of deferred benefits for uncertain tax positions. An income tax penalty is recognized as expense when thetax position does not meet the minimum statutory threshold to avoid the imposition of a penalty. The provisionsof this interpretation are required to be adopted for fiscal periods beginning after December 15, 2006. We will berequired to apply the provisions of FIN 48 to all tax positions upon initial adoption with any cumulative effectadjustment to be recognized as an adjustment to retained earnings. Upon adoption, management estimates that acumulative effect adjustment of approximately $8 million to $17 million will be charged to retained earnings toincrease reserves for uncertain tax positions. This range is subject to revision as management completes itsanalysis.
TRANSACTIONS WITH AFFILIATES
Until December 2005, Kuwait Petroleum Corporation, through its wholly owned subsidiary, SFIC Holdings(Cayman), Inc., owned a portion of our outstanding shares. At December 31, 2004, Kuwait PetroleumCorporation held 43,500,000 ordinary shares, approximately 18.4% of our ordinary shares. During 2005, werepurchased all 43,500,000 ordinary shares from Kuwait Petroleum Corporation with the net proceeds of publicofferings of an equal number of ordinary shares, as described under “Liquidity and Capital Resources—Investingand Financing Activities.” Kuwait Petroleum Corporation’s ownership interest had entitled it to certain rightspursuant to an intercompany agreement entered into with Santa Fe International in connection with the initialpublic offering of Santa Fe International and amended in connection with the merger of Global Marine with awholly-owned subsidiary of Santa Fe International.
During 2006 we terminated our agency agreement with a subsidiary of Kuwait Petroleum Corporation thatobligated us to pay certain agency fees in return for their sponsorship that allowed us to operate in Kuwait.During the years ended December 31, 2006 and 2005, we paid $17,000 and $34,000, respectively, in feespursuant to the agency agreement. We did not earn any revenues from Kuwait Oil Company, K.S.C. (“KOC”), anaffiliate of Kuwait Petroleum Corporation, or its affiliate during 2006 and 2005. During the year ended
53
December 31, 2004, we earned revenues from KOC and its affiliate for performing land contract drilling servicesin the ordinary course of business totaling $20.5 million and paid $211,000 of agency fees pursuant to the agencyagreement. At December 31, 2005, we had accounts receivable from affiliates of Kuwait Petroleum Corporationof $0.1 million. There were no outstanding receivables as of December 31, 2006.
Liquidity and Capital Resources
SOURCES OF LIQUIDITY
Our primary sources of liquidity are our cash and cash equivalents, marketable securities and cash generatedfrom operations. As of December 31, 2006, we had $348.9 million of cash, cash equivalents and marketablesecurities, all of which were unrestricted. We had $837.3 million in cash, cash equivalents and marketablesecurities at December 31, 2005, all of which were unrestricted. Cash generated from operating activities totaled$985.4 million, $591.2 million and $224.8 million for the years ended December 31, 2006, 2005 and 2004,respectively.
During the third quarter of 2005, the GSF High Island III and the GSF Adriatic VII were damaged as a resultof Hurricane Rita. During the second quarter of 2006, we declared both rigs as partial losses under our insurancepolicy and collected $86.5 million from out underwriters during the third quarter of 2006. In December 2006, wesold the GSF Adriatic VII to a third party for a net selling price of approximately $29.4 million. The net proceedsfrom this sale were collected in December 2006.
Subsequent to December 31, 2006, we entered into a contract to sell the GSF High Island III forapproximately $26.3 million. The sale is expected to be completed during the first quarter of 2007.
We do not expect the loss of these rigs to have a material adverse effect on our results of operations infuture periods (see—“Involuntary Conversion of Long-lived Assets and Related Recoveries”).
During the second quarter of 2006, we executed a contract with a major oil and gas company for a seven-year contract for the GSF Development Driller III, providing for expected revenues of approximately $1 billion.
We also entered into a contract with Saudi Aramco to provide four cantilevered jackup rigs for four-yearterms commencing in the first half of 2007. The four rigs, the GSF Main Pass I, GSF Main Pass IV, GSF HighIsland II and GSF High Island IV, began mobilizing in the fourth quarter of 2006 from the U.S. Gulf of Mexicoto a Middle East shipyard for approximately 60 days of upgrades. The rigs will then move to their drillinglocations offshore Saudi Arabia, with contract commencement expected in March and April 2007. This contractprovides for expected revenues of approximately $1 billion.
INVESTING AND FINANCING ACTIVITIES
In the first quarter of 2006, we entered into a contract with Keppel FELS, a shipyard located in Singapore,for construction of a new ultra-deepwater semisubmersible, to be named the GSF Development Driller III.Construction costs for the GSF Development Driller III are expected to total approximately $590 million,excluding capital spares, startup costs, capitalized interest, customer-required modifications and mobilizationcosts. We have incurred a total of approximately $220 million of capitalized costs related to the GSFDevelopment Driller III, excluding capitalized interest, as of December 31, 2006. We expect to fund allconstruction and startup costs of the GSF Development Driller III from our existing cash and cash equivalentsbalances and future cash flow from operations.
During the second quarter of 2005, we discovered a defect and resulting damage in the thruster nozzles onour two new ultra-deepwater semisubmersibles, the GSF Development Driller I and GSF Development Driller II.We currently expect that the cost to remediate the thruster equipment for both rigs will be approximately $54million. Both rigs were being remediated for the thruster defect and resulting damage when they sustainedadditional damage as a result of Hurricane Katrina. This additional damage further delayed the start of the initialdrilling contracts for the GSF Development Driller I and the GSF Development Driller II. Remediations of the
54
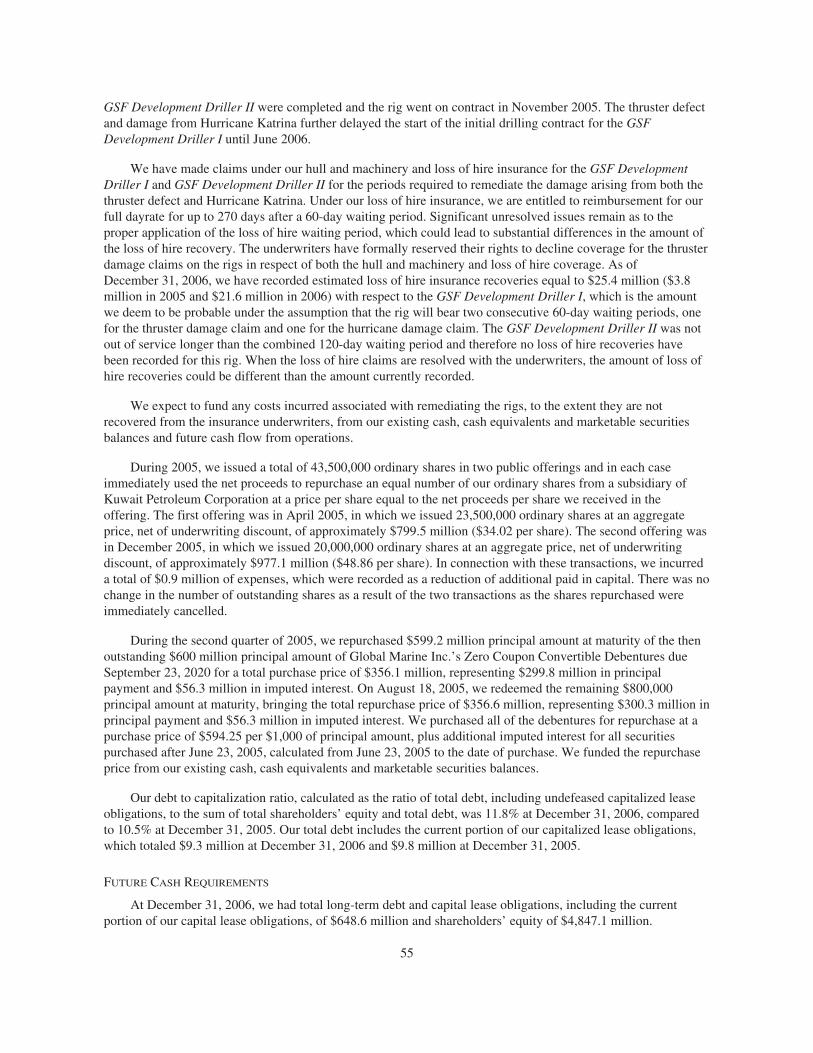
GSF Development Driller II were completed and the rig went on contract in November 2005. The thruster defectand damage from Hurricane Katrina further delayed the start of the initial drilling contract for the GSFDevelopment Driller I until June 2006.
We have made claims under our hull and machinery and loss of hire insurance for the GSF DevelopmentDriller I and GSF Development Driller II for the periods required to remediate the damage arising from both thethruster defect and Hurricane Katrina. Under our loss of hire insurance, we are entitled to reimbursement for ourfull dayrate for up to 270 days after a 60-day waiting period. Significant unresolved issues remain as to theproper application of the loss of hire waiting period, which could lead to substantial differences in the amount ofthe loss of hire recovery. The underwriters have formally reserved their rights to decline coverage for the thrusterdamage claims on the rigs in respect of both the hull and machinery and loss of hire coverage. As ofDecember 31, 2006, we have recorded estimated loss of hire insurance recoveries equal to $25.4 million ($3.8million in 2005 and $21.6 million in 2006) with respect to the GSF Development Driller I, which is the amountwe deem to be probable under the assumption that the rig will bear two consecutive 60-day waiting periods, onefor the thruster damage claim and one for the hurricane damage claim. The GSF Development Driller II was notout of service longer than the combined 120-day waiting period and therefore no loss of hire recoveries havebeen recorded for this rig. When the loss of hire claims are resolved with the underwriters, the amount of loss ofhire recoveries could be different than the amount currently recorded.
We expect to fund any costs incurred associated with remediating the rigs, to the extent they are notrecovered from the insurance underwriters, from our existing cash, cash equivalents and marketable securitiesbalances and future cash flow from operations.
During 2005, we issued a total of 43,500,000 ordinary shares in two public offerings and in each caseimmediately used the net proceeds to repurchase an equal number of our ordinary shares from a subsidiary ofKuwait Petroleum Corporation at a price per share equal to the net proceeds per share we received in theoffering. The first offering was in April 2005, in which we issued 23,500,000 ordinary shares at an aggregateprice, net of underwriting discount, of approximately $799.5 million ($34.02 per share). The second offering wasin December 2005, in which we issued 20,000,000 ordinary shares at an aggregate price, net of underwritingdiscount, of approximately $977.1 million ($48.86 per share). In connection with these transactions, we incurreda total of $0.9 million of expenses, which were recorded as a reduction of additional paid in capital. There was nochange in the number of outstanding shares as a result of the two transactions as the shares repurchased wereimmediately cancelled.
During the second quarter of 2005, we repurchased $599.2 million principal amount at maturity of the thenoutstanding $600 million principal amount of Global Marine Inc.’s Zero Coupon Convertible Debentures dueSeptember 23, 2020 for a total purchase price of $356.1 million, representing $299.8 million in principalpayment and $56.3 million in imputed interest. On August 18, 2005, we redeemed the remaining $800,000principal amount at maturity, bringing the total repurchase price of $356.6 million, representing $300.3 million inprincipal payment and $56.3 million in imputed interest. We purchased all of the debentures for repurchase at apurchase price of $594.25 per $1,000 of principal amount, plus additional imputed interest for all securitiespurchased after June 23, 2005, calculated from June 23, 2005 to the date of purchase. We funded the repurchaseprice from our existing cash, cash equivalents and marketable securities balances.
Our debt to capitalization ratio, calculated as the ratio of total debt, including undefeased capitalized leaseobligations, to the sum of total shareholders’ equity and total debt, was 11.8% at December 31, 2006, comparedto 10.5% at December 31, 2005. Our total debt includes the current portion of our capitalized lease obligations,which totaled $9.3 million at December 31, 2006 and $9.8 million at December 31, 2005.
FUTURE CASH REQUIREMENTS
At December 31, 2006, we had total long-term debt and capital lease obligations, including the currentportion of our capital lease obligations, of $648.6 million and shareholders’ equity of $4,847.1 million.
55
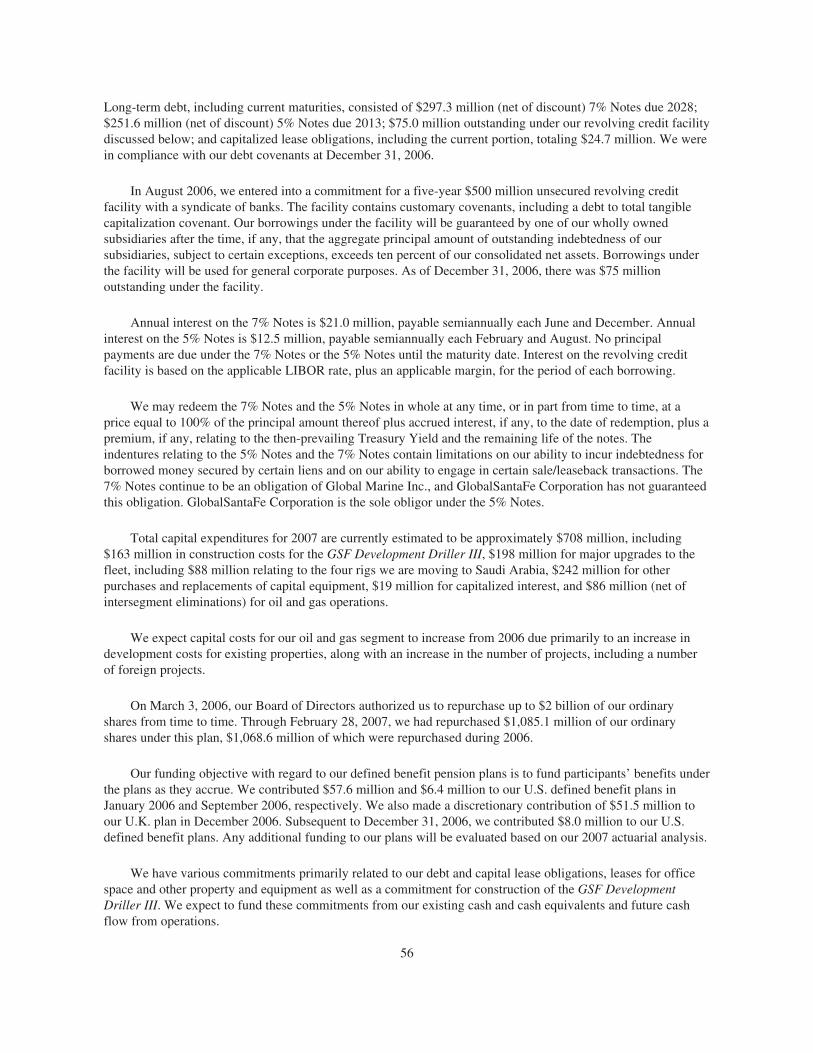
Long-term debt, including current maturities, consisted of $297.3 million (net of discount) 7% Notes due 2028;$251.6 million (net of discount) 5% Notes due 2013; $75.0 million outstanding under our revolving credit facilitydiscussed below; and capitalized lease obligations, including the current portion, totaling $24.7 million. We werein compliance with our debt covenants at December 31, 2006.
In August 2006, we entered into a commitment for a five-year $500 million unsecured revolving creditfacility with a syndicate of banks. The facility contains customary covenants, including a debt to total tangiblecapitalization covenant. Our borrowings under the facility will be guaranteed by one of our wholly ownedsubsidiaries after the time, if any, that the aggregate principal amount of outstanding indebtedness of oursubsidiaries, subject to certain exceptions, exceeds ten percent of our consolidated net assets. Borrowings underthe facility will be used for general corporate purposes. As of December 31, 2006, there was $75 millionoutstanding under the facility.
Annual interest on the 7% Notes is $21.0 million, payable semiannually each June and December. Annualinterest on the 5% Notes is $12.5 million, payable semiannually each February and August. No principalpayments are due under the 7% Notes or the 5% Notes until the maturity date. Interest on the revolving creditfacility is based on the applicable LIBOR rate, plus an applicable margin, for the period of each borrowing.
We may redeem the 7% Notes and the 5% Notes in whole at any time, or in part from time to time, at aprice equal to 100% of the principal amount thereof plus accrued interest, if any, to the date of redemption, plus apremium, if any, relating to the then-prevailing Treasury Yield and the remaining life of the notes. Theindentures relating to the 5% Notes and the 7% Notes contain limitations on our ability to incur indebtedness forborrowed money secured by certain liens and on our ability to engage in certain sale/leaseback transactions. The7% Notes continue to be an obligation of Global Marine Inc., and GlobalSantaFe Corporation has not guaranteedthis obligation. GlobalSantaFe Corporation is the sole obligor under the 5% Notes.
Total capital expenditures for 2007 are currently estimated to be approximately $708 million, including$163 million in construction costs for the GSF Development Driller III, $198 million for major upgrades to thefleet, including $88 million relating to the four rigs we are moving to Saudi Arabia, $242 million for otherpurchases and replacements of capital equipment, $19 million for capitalized interest, and $86 million (net ofintersegment eliminations) for oil and gas operations.
We expect capital costs for our oil and gas segment to increase from 2006 due primarily to an increase indevelopment costs for existing properties, along with an increase in the number of projects, including a numberof foreign projects.
On March 3, 2006, our Board of Directors authorized us to repurchase up to $2 billion of our ordinaryshares from time to time. Through February 28, 2007, we had repurchased $1,085.1 million of our ordinaryshares under this plan, $1,068.6 million of which were repurchased during 2006.
Our funding objective with regard to our defined benefit pension plans is to fund participants’ benefits underthe plans as they accrue. We contributed $57.6 million and $6.4 million to our U.S. defined benefit plans inJanuary 2006 and September 2006, respectively. We also made a discretionary contribution of $51.5 million toour U.K. plan in December 2006. Subsequent to December 31, 2006, we contributed $8.0 million to our U.S.defined benefit plans. Any additional funding to our plans will be evaluated based on our 2007 actuarial analysis.
We have various commitments primarily related to our debt and capital lease obligations, leases for officespace and other property and equipment as well as a commitment for construction of the GSF DevelopmentDriller III. We expect to fund these commitments from our existing cash and cash equivalents and future cashflow from operations.
56
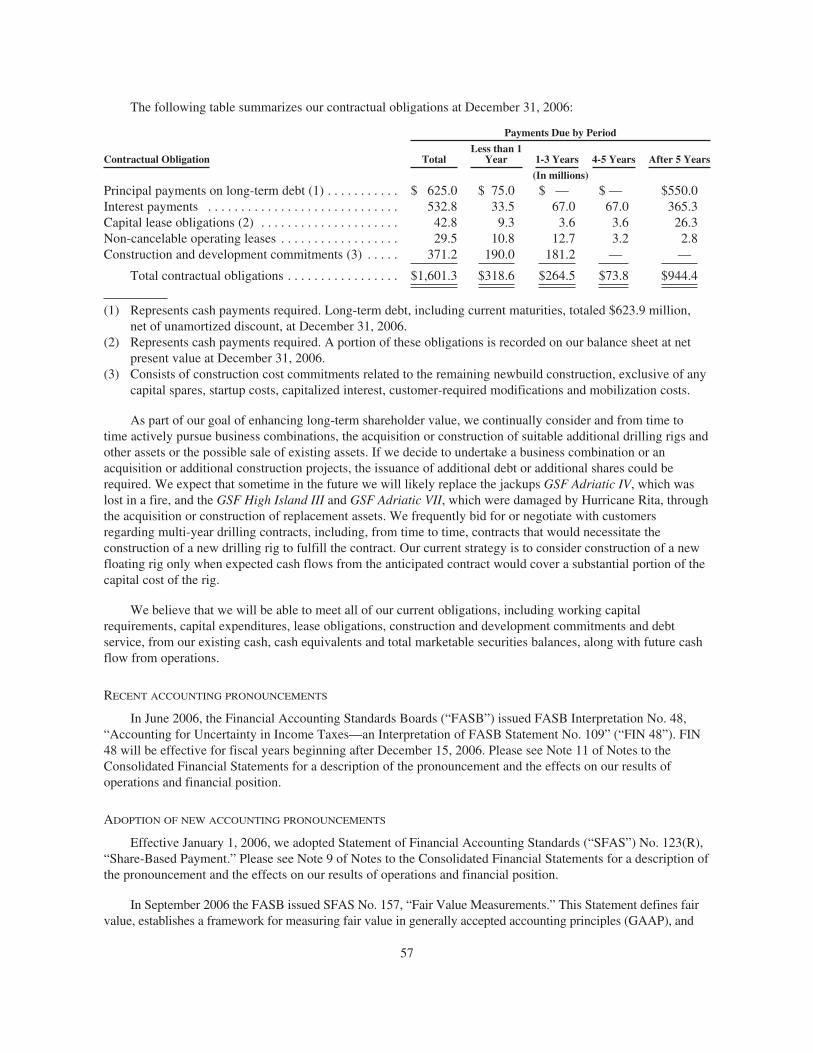
The following table summarizes our contractual obligations at December 31, 2006:
Payments Due by Period
Contractual Obligation TotalLess than 1
Year 1-3 Years 4-5 Years After 5 Years
(In millions)
Principal payments on long-term debt (1) . . . . . . . . . . . $ 625.0 $ 75.0 $ — $ — $550.0Interest payments . . . . . . . . . . . . . . . . . . . . . . . . . . . . . 532.8 33.5 67.0 67.0 365.3Capital lease obligations (2) . . . . . . . . . . . . . . . . . . . . . 42.8 9.3 3.6 3.6 26.3Non-cancelable operating leases . . . . . . . . . . . . . . . . . . 29.5 10.8 12.7 3.2 2.8Construction and development commitments (3) . . . . . 371.2 190.0 181.2 — —
Total contractual obligations . . . . . . . . . . . . . . . . . $1,601.3 $318.6 $264.5 $73.8 $944.4
(1) Represents cash payments required. Long-term debt, including current maturities, totaled $623.9 million,net of unamortized discount, at December 31, 2006.
(2) Represents cash payments required. A portion of these obligations is recorded on our balance sheet at netpresent value at December 31, 2006.
(3) Consists of construction cost commitments related to the remaining newbuild construction, exclusive of anycapital spares, startup costs, capitalized interest, customer-required modifications and mobilization costs.
As part of our goal of enhancing long-term shareholder value, we continually consider and from time totime actively pursue business combinations, the acquisition or construction of suitable additional drilling rigs andother assets or the possible sale of existing assets. If we decide to undertake a business combination or anacquisition or additional construction projects, the issuance of additional debt or additional shares could berequired. We expect that sometime in the future we will likely replace the jackups GSF Adriatic IV, which waslost in a fire, and the GSF High Island III and GSF Adriatic VII, which were damaged by Hurricane Rita, throughthe acquisition or construction of replacement assets. We frequently bid for or negotiate with customersregarding multi-year drilling contracts, including, from time to time, contracts that would necessitate theconstruction of a new drilling rig to fulfill the contract. Our current strategy is to consider construction of a newfloating rig only when expected cash flows from the anticipated contract would cover a substantial portion of thecapital cost of the rig.
We believe that we will be able to meet all of our current obligations, including working capitalrequirements, capital expenditures, lease obligations, construction and development commitments and debtservice, from our existing cash, cash equivalents and total marketable securities balances, along with future cashflow from operations.
RECENT ACCOUNTING PRONOUNCEMENTS
In June 2006, the Financial Accounting Standards Boards (“FASB”) issued FASB Interpretation No. 48,“Accounting for Uncertainty in Income Taxes—an Interpretation of FASB Statement No. 109” (“FIN 48”). FIN48 will be effective for fiscal years beginning after December 15, 2006. Please see Note 11 of Notes to theConsolidated Financial Statements for a description of the pronouncement and the effects on our results ofoperations and financial position.
ADOPTION OF NEW ACCOUNTING PRONOUNCEMENTS
Effective January 1, 2006, we adopted Statement of Financial Accounting Standards (“SFAS”) No. 123(R),“Share-Based Payment.” Please see Note 9 of Notes to the Consolidated Financial Statements for a description ofthe pronouncement and the effects on our results of operations and financial position.
In September 2006 the FASB issued SFAS No. 157, “Fair Value Measurements.” This Statement defines fairvalue, establishes a framework for measuring fair value in generally accepted accounting principles (GAAP), and
57

expands disclosures about fair value measurements. This statement applies under other accountingpronouncements that require or permit fair value measurements and, accordingly, this statement does not requireany new fair value measurements. We do not expect the adoption of this statement to have a material impact onour results of operations, financial position or cash flows.
In September 2006, the FASB also issued Statement SFAS No. 158, “Employers’ Accounting for DefinedBenefit Pension and Other Postretirement Plans.” This statement amends SFAS No. 87, “Employers’ Accountingfor Pensions,” SFAS No. 88, “Employers’ Accounting for Settlements and Curtailments of Defined BenefitPension Plans and For Termination Benefits,” SFAS No. 106, “Employers’ Accounting for PostretirementBenefits Other Than Pensions,” SFAS No. 132(R), “Employers’ Disclosures about Pensions and OtherPostretirement Benefits,” and other related accounting literature. We adopted SFAS No. 158 effectiveDecember 31, 2006. Please see Note 10 of Notes to the Consolidated Financial Statements for a description ofthe pronouncement and the effects on our results of operations and financial position.
58
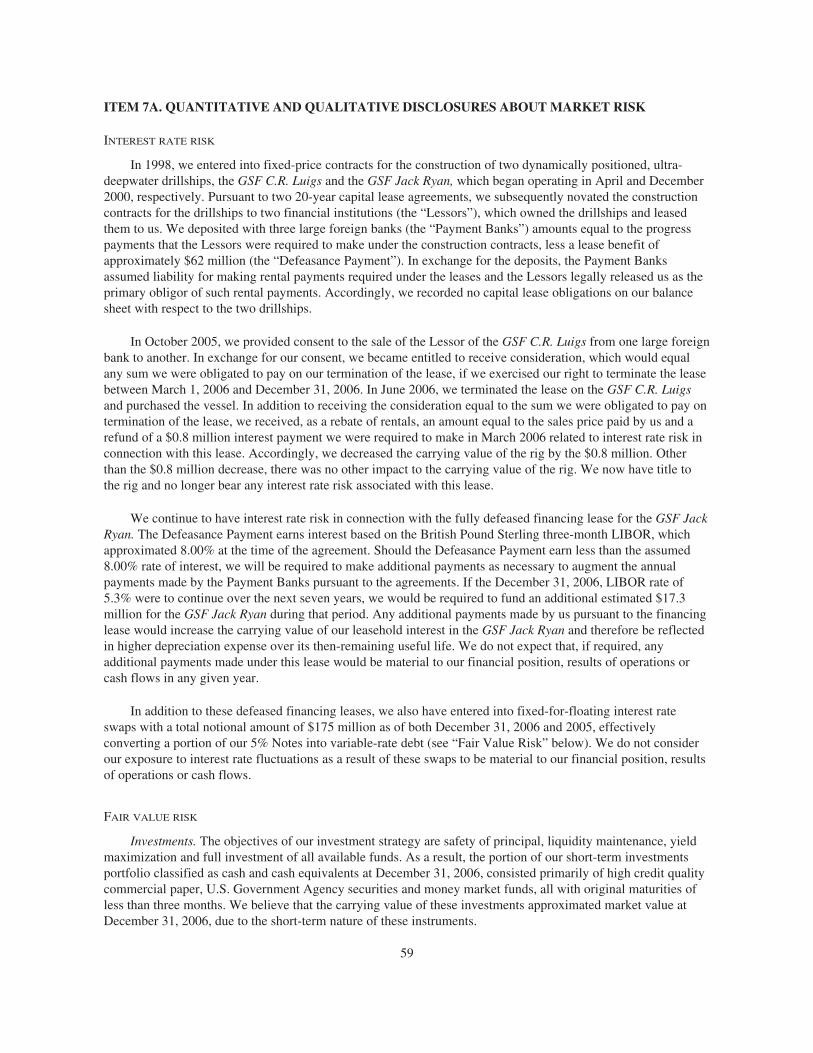
ITEM 7A. QUANTITATIVE AND QUALITATIVE DISCLOSURES ABOUT MARKET RISK
INTEREST RATE RISK
In 1998, we entered into fixed-price contracts for the construction of two dynamically positioned, ultra-deepwater drillships, the GSF C.R. Luigs and the GSF Jack Ryan, which began operating in April and December2000, respectively. Pursuant to two 20-year capital lease agreements, we subsequently novated the constructioncontracts for the drillships to two financial institutions (the “Lessors”), which owned the drillships and leasedthem to us. We deposited with three large foreign banks (the “Payment Banks”) amounts equal to the progresspayments that the Lessors were required to make under the construction contracts, less a lease benefit ofapproximately $62 million (the “Defeasance Payment”). In exchange for the deposits, the Payment Banksassumed liability for making rental payments required under the leases and the Lessors legally released us as theprimary obligor of such rental payments. Accordingly, we recorded no capital lease obligations on our balancesheet with respect to the two drillships.
In October 2005, we provided consent to the sale of the Lessor of the GSF C.R. Luigs from one large foreignbank to another. In exchange for our consent, we became entitled to receive consideration, which would equalany sum we were obligated to pay on our termination of the lease, if we exercised our right to terminate the leasebetween March 1, 2006 and December 31, 2006. In June 2006, we terminated the lease on the GSF C.R. Luigsand purchased the vessel. In addition to receiving the consideration equal to the sum we were obligated to pay ontermination of the lease, we received, as a rebate of rentals, an amount equal to the sales price paid by us and arefund of a $0.8 million interest payment we were required to make in March 2006 related to interest rate risk inconnection with this lease. Accordingly, we decreased the carrying value of the rig by the $0.8 million. Otherthan the $0.8 million decrease, there was no other impact to the carrying value of the rig. We now have title tothe rig and no longer bear any interest rate risk associated with this lease.
We continue to have interest rate risk in connection with the fully defeased financing lease for the GSF JackRyan. The Defeasance Payment earns interest based on the British Pound Sterling three-month LIBOR, whichapproximated 8.00% at the time of the agreement. Should the Defeasance Payment earn less than the assumed8.00% rate of interest, we will be required to make additional payments as necessary to augment the annualpayments made by the Payment Banks pursuant to the agreements. If the December 31, 2006, LIBOR rate of5.3% were to continue over the next seven years, we would be required to fund an additional estimated $17.3million for the GSF Jack Ryan during that period. Any additional payments made by us pursuant to the financinglease would increase the carrying value of our leasehold interest in the GSF Jack Ryan and therefore be reflectedin higher depreciation expense over its then-remaining useful life. We do not expect that, if required, anyadditional payments made under this lease would be material to our financial position, results of operations orcash flows in any given year.
In addition to these defeased financing leases, we also have entered into fixed-for-floating interest rateswaps with a total notional amount of $175 million as of both December 31, 2006 and 2005, effectivelyconverting a portion of our 5% Notes into variable-rate debt (see “Fair Value Risk” below). We do not considerour exposure to interest rate fluctuations as a result of these swaps to be material to our financial position, resultsof operations or cash flows.
FAIR VALUE RISK
Investments. The objectives of our investment strategy are safety of principal, liquidity maintenance, yieldmaximization and full investment of all available funds. As a result, the portion of our short-term investmentsportfolio classified as cash and cash equivalents at December 31, 2006, consisted primarily of high credit qualitycommercial paper, U.S. Government Agency securities and money market funds, all with original maturities ofless than three months. We believe that the carrying value of these investments approximated market value atDecember 31, 2006, due to the short-term nature of these instruments.
59
We have outsourced the management of portions of our marketable securities portfolio to third partyinvestment firms. These firms manage the investment of these securities with the goal of optimizing returns onthese investments while investing within guidelines set forth by our management. Pursuant to the requirements ofStatement of Financial Accounting Standards No. 115, “Accounting for Certain Investments in Debt and EquitySecurities,” we have classified our marketable securities portfolio as available-for-sale, and have recorded thesemarketable securities at fair value on our Consolidated Balance Sheet at December 31, 2006 and 2005. Inaddition, in connection with certain nonqualified pension plans, we held other investments in debt and equitysecurities also classified as available-for-sale, which were included in “Other assets” at December 31, 2006 and2005. Unrealized gains included in Accumulated Other Comprehensive Income on the Consolidated BalanceSheet at December 31, 2006 and 2005, related to our total marketable securities portfolio totaled approximately$1.5 million and $0.5 million, respectively. Due to the short-term maturities of our investments in our marketablesecurities portfolio, we do not believe that we have a material fair value risk associated with changes in interestrates.
Long-term debt. Our long-term debt is subject to fair value risk due to changes in market interest rates.
The estimated fair value of our $300 million principal amount 7% Notes due 2028, based on quoted marketprices, was $327.4 million at December 31, 2006, compared to the carrying amount of $297.3 million (net ofdiscount). The estimated fair value of our $250 million principal amount 5% Notes due 2013, based on quotedmarket prices, was $238.0 million at December 31, 2006, compared to the carrying amount of $251.6 million (netof discount). The carrying value of our 5% Notes due 2013 includes a mark-to-market adjustment of $2.1 millionat December 31, 2006, related to fixed-for-floating interest rate swaps discussed below. Due to the short-termnature of our borrowings under our $500 million unsecured revolving credit facility, the estimated fair value ofour outstanding borrowings at December 31, 2006 equaled the carrying amount of $75 million.
The estimated fair value of our 7% Notes due 2028, based on quoted market prices, was $351.1 million atDecember 31, 2005, compared to the carrying amount of $297.1 million (net of discount). The estimated fairmarket value of our 5% Notes due 2013, based on quoted market prices, was $248.3 million at December 31,2005, compared to the carrying amount of $253.5 million (net of discount). The carrying value of our 5% Notesdue 2013 included a mark-to-market adjustment of $4.0 million at December 31, 2005, related tofixed-for-floating interest rate swaps discussed below.
We have engaged third-party consultants to assess the impact of changes in interest rates on the fair valuesof our long-term debt based on a hypothetical ten-percent increase in market interest rates. Market interest ratevolatility is dependent on many factors that are impossible to forecast, and actual interest rate increases could bemore severe than the hypothetical ten-percent change.
Based upon these sensitivity analyses, if prevailing market interest rates had been ten percent higher atDecember 31, 2006, and all other factors affecting our debt remained the same, the fair value of our 7% Notesdue 2028, as determined on a present-value basis using prevailing market interest rates, would have decreased by$17.3 million or 5.3% and the fair value of the 5% Notes due 2013 would have decreased by $7.2 million or3.0%. Under comparable sensitivity analysis as of December 31, 2005, the fair value of the 7% Notes due 2028would have decreased by $22.6 million or 6.4% and the fair value of the 5% Notes due 2013 would havedecreased by $7.3 million or 2.9%.
We manage our fair value risk related to our long-term debt by using interest rate swaps to convert a portionof our fixed-rate debt into variable-rate debt. Under these interest rate swaps, we agree with other parties toexchange, at specified intervals, the difference between the fixed-rate and floating-rate amounts, calculated byreference to an agreed-upon notional amount.
As of December 31, 2006 and 2005, we had outstanding fixed-for-floating interest rate swaps with anaggregate notional amount of $175 million, through February 2013. These interest rate swaps are intended to
60
manage a portion of the fair value risk related to our 5% Notes due 2013 (the “5% Notes”). Under the terms ofthese swaps, we have agreed to pay the counterparties an interest rate equal to the six-month LIBOR rate less0.247% to 0.5175% on the notional amounts and we will receive the fixed 5.00% rate. The total estimatedaggregate fair value of these swaps at December 31, 2006 and 2005 was an asset of $2.1 million and $4.0million, respectively.
The change in the estimated fair values of our long-term debt from 2005 to 2006 is a result of changes in themarket interest rate for new bonds with similar risk ratings. The change in the corresponding interest rate swapsfrom 2005 to 2006 is a result of changes in the 6 month LIBOR and 10-year Treasury bond rates.
In connection with the sensitivity analyses performed relative to the fair values of our long-term debtdiscussed above, similar analyses were performed to assess the impact of market interest rate movements on thefair values of the fixed-for-floating swaps related to the 5% Notes. Based upon these analyses, if prevailingmarket interest rates had been ten percent higher at December 31, 2006, and all other factors affecting theseswaps had remained the same, the aggregate fair value of the fixed-for-floating interest rate swaps, as determinedon a present-value basis using prevailing market interest rates, would have decreased by $4.6 million or 225%.Under comparable sensitivity analysis as of December 31, 2005, the fair value would have decreased by $5.5million or 120%.
FOREIGN CURRENCY RISK
We are subject to foreign currency risk throughout our international operations (see “Item 1A. RiskFactors—We May Suffer Losses as a Result of Foreign Exchange Restrictions, Foreign Currency Fluctuationsand Limitations on Our Ability to Repatriate Income or Capital to the U.S.”). In certain cases we attempt tominimize this currency risk by seeking international drilling contracts payable in local currency in amounts thatapproximate our estimated local currency-based operating costs and in U.S. dollars for the balance of thecontract. We incurred foreign currency exchange losses totaling approximately $0.9 million in 2006, $2.3 millionin 2005 and $6.1 million in 2004. Due to the multiple foreign currencies impacting our various areas ofoperations, we cannot accurately quantify through a sensitivity analysis the impact of changes in thesecurrencies. We have not historically entered into financial hedging transactions to manage risks relating tofluctuations in currency exchange rates. We may, however, enter into such transactions in the future.
CREDIT RISK
The market for our services and products is the offshore oil and gas industry, and our customers consistprimarily of major integrated international oil companies and independent oil and gas producers. We performongoing credit evaluations of our customers and have not historically required material collateral. We maintainreserves for potential credit losses, and such losses have been within management’s expectations.
Our cash deposits were distributed among various banks in our areas of operations throughout the world asof December 31, 2006 and 2005. In addition, we utilize external money managers to invest excess cash inaccordance with our investment guidelines. These managers have invested our funds in commercial paper,money market funds, asset-backed securities, government issues and corporate obligations. Each of theseinvestments complies with our investment guidelines in terms of security type, credit rating, duration, portfolioand issuer exposure limits. As a result, we believe that credit risk in such instruments is minimal.
61
ITEM 8. FINANCIAL STATEMENTS AND SUPPLEMENTARY DATA
REPORT OF INDEPENDENT REGISTERED PUBLIC ACCOUNTING FIRM
To the Board of Directors and Shareholders of GlobalSantaFe Corporation
We have completed integrated audits of GlobalSantaFe Corporation’s 2006, 2005 and 2004 consolidatedfinancial statements and of its internal control over financial reporting as of December 31, 2006 in accordancewith the standards of the Public Company Accounting Oversight Board (United States). Our opinions, based onour audits, are presented below.
Consolidated financial statements
In our opinion, the accompanying consolidated balance sheets and the related consolidated statements ofincome and other comprehensive income, shareholders’ equity and cash flows present fairly, in all materialrespects, the financial position of GlobalSantaFe Corporation and its subsidiaries at December 31, 2006 and2005, and the results of their operations and their cash flows for each of the three years in the period endedDecember 31, 2006 in conformity with accounting principles generally accepted in the United States of America.These financial statements are the responsibility of the Company’s management. Our responsibility is to expressan opinion on these financial statements based on our audits. We conducted our audits of these statements inaccordance with the standards of the Public Company Accounting Oversight Board (United States). Thosestandards require that we plan and perform the audit to obtain reasonable assurance about whether the financialstatements are free of material misstatement. An audit of financial statements includes examining, on a test basis,evidence supporting the amounts and disclosures in the financial statements, assessing the accounting principlesused and significant estimates made by management, and evaluating the overall financial statement presentation.We believe that our audits provide a reasonable basis for our opinion.
As discussed in Note 9 to the consolidated financial statements, the Company changed the method in whichit accounts for share-based compensation effective January 1, 2006. As discussed in Note 10 to the consolidatedfinancial statements, the Company changed the method in which it accounts for defined benefit pension and otherpostretirement plans effective December 31, 2006.
Internal control over financial reporting
Also, in our opinion, management’s assessment, included in “Management’s Report on Internal ControlOver Financial Reporting” appearing under Item 9A, that the Company maintained effective internal control overfinancial reporting as of December 31, 2006 based on criteria established in Internal Control—IntegratedFramework issued by the Committee of Sponsoring Organizations of the Treadway Commission (COSO), isfairly stated, in all material respects, based on those criteria. Furthermore, in our opinion, the Companymaintained, in all material respects, effective internal control over financial reporting as of December 31, 2006,based on criteria established in Internal Control—Integrated Framework issued by the COSO. The Company’smanagement is responsible for maintaining effective internal control over financial reporting and for itsassessment of the effectiveness of internal control over financial reporting. Our responsibility is to expressopinions on management’s assessment and on the effectiveness of the Company’s internal control over financialreporting based on our audit. We conducted our audit of internal control over financial reporting in accordancewith the standards of the Public Company Accounting Oversight Board (United States). Those standards requirethat we plan and perform the audit to obtain reasonable assurance about whether effective internal control overfinancial reporting was maintained in all material respects. An audit of internal control over financial reportingincludes obtaining an understanding of internal control over financial reporting, evaluating management’sassessment, testing and evaluating the design and operating effectiveness of internal control, and performing suchother procedures as we consider necessary in the circumstances. We believe that our audit provides a reasonablebasis for our opinions.
A company’s internal control over financial reporting is a process designed to provide reasonable assuranceregarding the reliability of financial reporting and the preparation of financial statements for external purposes in
62
accordance with generally accepted accounting principles. A company’s internal control over financial reportingincludes those policies and procedures that (i) pertain to the maintenance of records that, in reasonable detail,accurately and fairly reflect the transactions and dispositions of the assets of the company; (ii) provide reasonableassurance that transactions are recorded as necessary to permit preparation of financial statements in accordancewith generally accepted accounting principles, and that receipts and expenditures of the company are being madeonly in accordance with authorizations of management and directors of the company; and (iii) provide reasonableassurance regarding prevention or timely detection of unauthorized acquisition, use, or disposition of thecompany’s assets that could have a material effect on the financial statements.
Because of its inherent limitations, internal control over financial reporting may not prevent or detectmisstatements. Also, projections of any evaluation of effectiveness to future periods are subject to the risk thatcontrols may become inadequate because of changes in conditions, or that the degree of compliance with thepolicies or procedures may deteriorate.
/s/ PricewaterhouseCoopers LLP
Houston, TexasFebruary 28, 2007
63
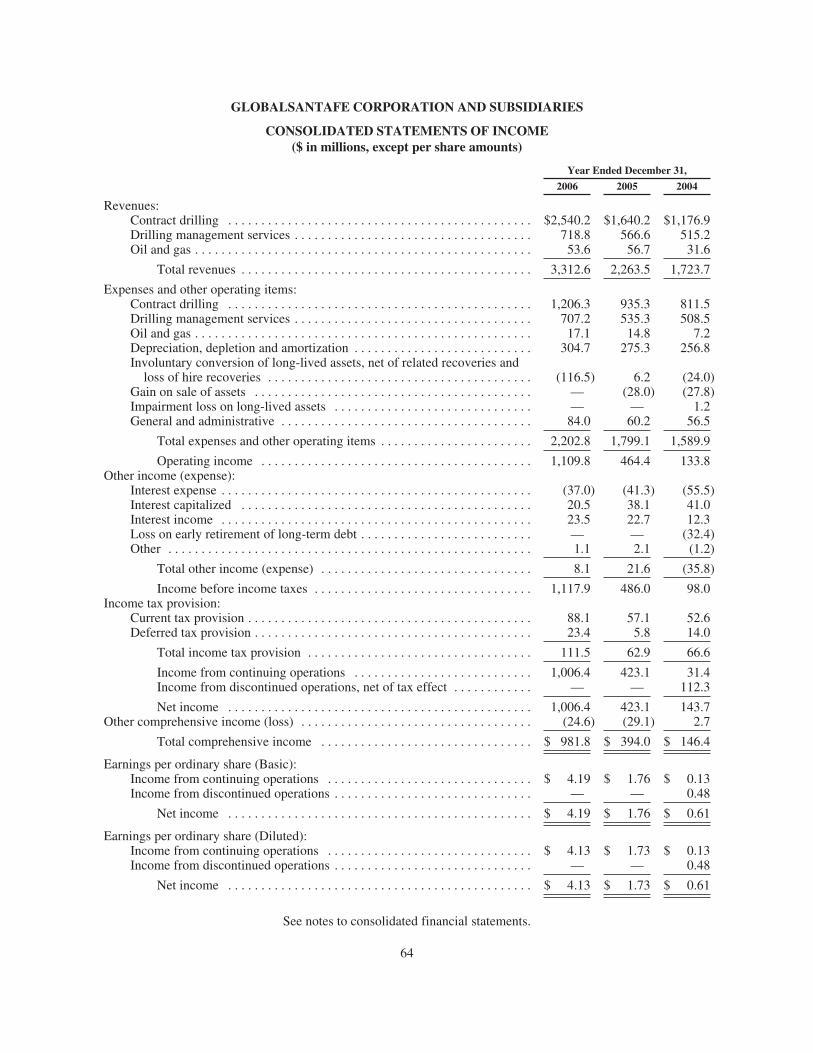
GLOBALSANTAFE CORPORATION AND SUBSIDIARIES
CONSOLIDATED STATEMENTS OF INCOME($ in millions, except per share amounts)
Year Ended December 31,
2006 2005 2004
Revenues:Contract drilling . . . . . . . . . . . . . . . . . . . . . . . . . . . . . . . . . . . . . . . . . . . . . . $2,540.2 $1,640.2 $1,176.9Drilling management services . . . . . . . . . . . . . . . . . . . . . . . . . . . . . . . . . . . . 718.8 566.6 515.2Oil and gas . . . . . . . . . . . . . . . . . . . . . . . . . . . . . . . . . . . . . . . . . . . . . . . . . . . 53.6 56.7 31.6
Total revenues . . . . . . . . . . . . . . . . . . . . . . . . . . . . . . . . . . . . . . . . . . . . 3,312.6 2,263.5 1,723.7
Expenses and other operating items:Contract drilling . . . . . . . . . . . . . . . . . . . . . . . . . . . . . . . . . . . . . . . . . . . . . . 1,206.3 935.3 811.5Drilling management services . . . . . . . . . . . . . . . . . . . . . . . . . . . . . . . . . . . . 707.2 535.3 508.5Oil and gas . . . . . . . . . . . . . . . . . . . . . . . . . . . . . . . . . . . . . . . . . . . . . . . . . . . 17.1 14.8 7.2Depreciation, depletion and amortization . . . . . . . . . . . . . . . . . . . . . . . . . . . 304.7 275.3 256.8Involuntary conversion of long-lived assets, net of related recoveries and
loss of hire recoveries . . . . . . . . . . . . . . . . . . . . . . . . . . . . . . . . . . . . . . . . (116.5) 6.2 (24.0)Gain on sale of assets . . . . . . . . . . . . . . . . . . . . . . . . . . . . . . . . . . . . . . . . . . — (28.0) (27.8)Impairment loss on long-lived assets . . . . . . . . . . . . . . . . . . . . . . . . . . . . . . — — 1.2General and administrative . . . . . . . . . . . . . . . . . . . . . . . . . . . . . . . . . . . . . . 84.0 60.2 56.5
Total expenses and other operating items . . . . . . . . . . . . . . . . . . . . . . . 2,202.8 1,799.1 1,589.9
Operating income . . . . . . . . . . . . . . . . . . . . . . . . . . . . . . . . . . . . . . . . . 1,109.8 464.4 133.8Other income (expense):
Interest expense . . . . . . . . . . . . . . . . . . . . . . . . . . . . . . . . . . . . . . . . . . . . . . . (37.0) (41.3) (55.5)Interest capitalized . . . . . . . . . . . . . . . . . . . . . . . . . . . . . . . . . . . . . . . . . . . . 20.5 38.1 41.0Interest income . . . . . . . . . . . . . . . . . . . . . . . . . . . . . . . . . . . . . . . . . . . . . . . 23.5 22.7 12.3Loss on early retirement of long-term debt . . . . . . . . . . . . . . . . . . . . . . . . . . — — (32.4)Other . . . . . . . . . . . . . . . . . . . . . . . . . . . . . . . . . . . . . . . . . . . . . . . . . . . . . . . 1.1 2.1 (1.2)
Total other income (expense) . . . . . . . . . . . . . . . . . . . . . . . . . . . . . . . . 8.1 21.6 (35.8)
Income before income taxes . . . . . . . . . . . . . . . . . . . . . . . . . . . . . . . . . 1,117.9 486.0 98.0Income tax provision:
Current tax provision . . . . . . . . . . . . . . . . . . . . . . . . . . . . . . . . . . . . . . . . . . . 88.1 57.1 52.6Deferred tax provision . . . . . . . . . . . . . . . . . . . . . . . . . . . . . . . . . . . . . . . . . . 23.4 5.8 14.0
Total income tax provision . . . . . . . . . . . . . . . . . . . . . . . . . . . . . . . . . . 111.5 62.9 66.6
Income from continuing operations . . . . . . . . . . . . . . . . . . . . . . . . . . . 1,006.4 423.1 31.4Income from discontinued operations, net of tax effect . . . . . . . . . . . . — — 112.3
Net income . . . . . . . . . . . . . . . . . . . . . . . . . . . . . . . . . . . . . . . . . . . . . . 1,006.4 423.1 143.7Other comprehensive income (loss) . . . . . . . . . . . . . . . . . . . . . . . . . . . . . . . . . . . (24.6) (29.1) 2.7
Total comprehensive income . . . . . . . . . . . . . . . . . . . . . . . . . . . . . . . . $ 981.8 $ 394.0 $ 146.4
Earnings per ordinary share (Basic):Income from continuing operations . . . . . . . . . . . . . . . . . . . . . . . . . . . . . . . $ 4.19 $ 1.76 $ 0.13Income from discontinued operations . . . . . . . . . . . . . . . . . . . . . . . . . . . . . . — — 0.48
Net income . . . . . . . . . . . . . . . . . . . . . . . . . . . . . . . . . . . . . . . . . . . . . . $ 4.19 $ 1.76 $ 0.61
Earnings per ordinary share (Diluted):Income from continuing operations . . . . . . . . . . . . . . . . . . . . . . . . . . . . . . . $ 4.13 $ 1.73 $ 0.13Income from discontinued operations . . . . . . . . . . . . . . . . . . . . . . . . . . . . . . — — 0.48
Net income . . . . . . . . . . . . . . . . . . . . . . . . . . . . . . . . . . . . . . . . . . . . . . $ 4.13 $ 1.73 $ 0.61
See notes to consolidated financial statements.
64
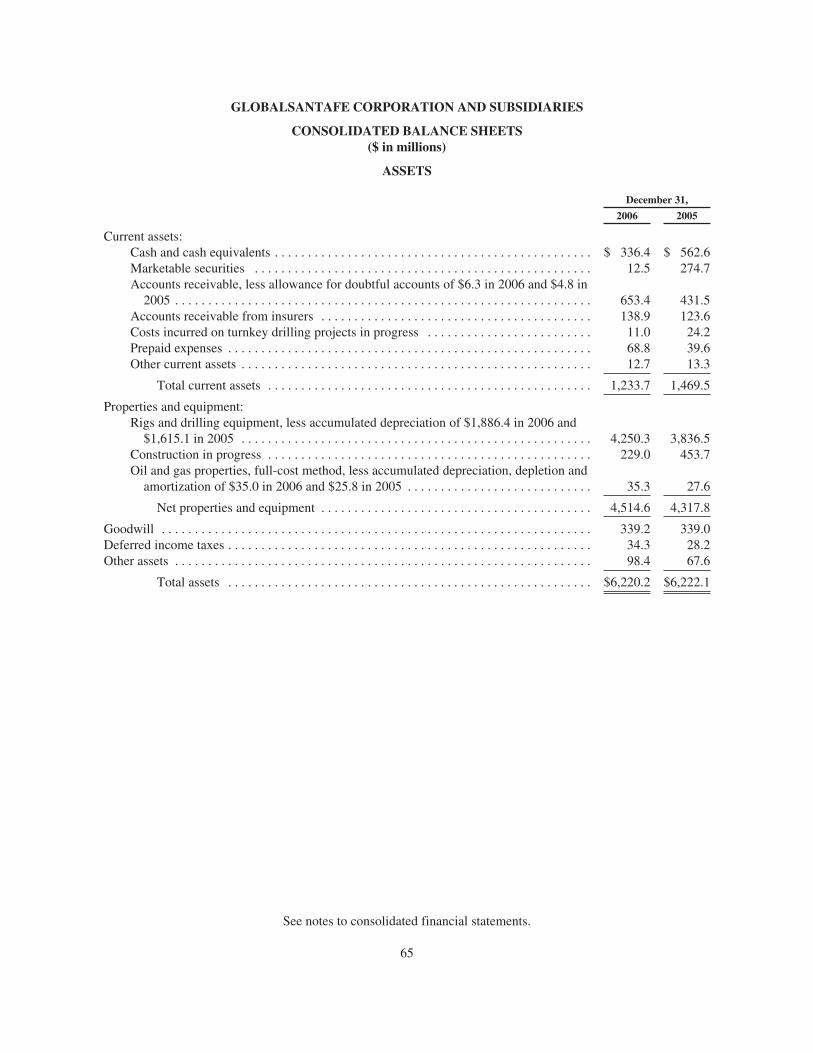
GLOBALSANTAFE CORPORATION AND SUBSIDIARIES
CONSOLIDATED BALANCE SHEETS($ in millions)
ASSETS
December 31,
2006 2005
Current assets:Cash and cash equivalents . . . . . . . . . . . . . . . . . . . . . . . . . . . . . . . . . . . . . . . . . . . . . . . . $ 336.4 $ 562.6Marketable securities . . . . . . . . . . . . . . . . . . . . . . . . . . . . . . . . . . . . . . . . . . . . . . . . . . . 12.5 274.7Accounts receivable, less allowance for doubtful accounts of $6.3 in 2006 and $4.8 in
2005 . . . . . . . . . . . . . . . . . . . . . . . . . . . . . . . . . . . . . . . . . . . . . . . . . . . . . . . . . . . . . . . 653.4 431.5Accounts receivable from insurers . . . . . . . . . . . . . . . . . . . . . . . . . . . . . . . . . . . . . . . . . 138.9 123.6Costs incurred on turnkey drilling projects in progress . . . . . . . . . . . . . . . . . . . . . . . . . 11.0 24.2Prepaid expenses . . . . . . . . . . . . . . . . . . . . . . . . . . . . . . . . . . . . . . . . . . . . . . . . . . . . . . . 68.8 39.6Other current assets . . . . . . . . . . . . . . . . . . . . . . . . . . . . . . . . . . . . . . . . . . . . . . . . . . . . . 12.7 13.3
Total current assets . . . . . . . . . . . . . . . . . . . . . . . . . . . . . . . . . . . . . . . . . . . . . . . . . 1,233.7 1,469.5
Properties and equipment:Rigs and drilling equipment, less accumulated depreciation of $1,886.4 in 2006 and
$1,615.1 in 2005 . . . . . . . . . . . . . . . . . . . . . . . . . . . . . . . . . . . . . . . . . . . . . . . . . . . . . 4,250.3 3,836.5Construction in progress . . . . . . . . . . . . . . . . . . . . . . . . . . . . . . . . . . . . . . . . . . . . . . . . . 229.0 453.7Oil and gas properties, full-cost method, less accumulated depreciation, depletion and
amortization of $35.0 in 2006 and $25.8 in 2005 . . . . . . . . . . . . . . . . . . . . . . . . . . . . 35.3 27.6
Net properties and equipment . . . . . . . . . . . . . . . . . . . . . . . . . . . . . . . . . . . . . . . . . 4,514.6 4,317.8
Goodwill . . . . . . . . . . . . . . . . . . . . . . . . . . . . . . . . . . . . . . . . . . . . . . . . . . . . . . . . . . . . . . . . . 339.2 339.0Deferred income taxes . . . . . . . . . . . . . . . . . . . . . . . . . . . . . . . . . . . . . . . . . . . . . . . . . . . . . . . 34.3 28.2Other assets . . . . . . . . . . . . . . . . . . . . . . . . . . . . . . . . . . . . . . . . . . . . . . . . . . . . . . . . . . . . . . . 98.4 67.6
Total assets . . . . . . . . . . . . . . . . . . . . . . . . . . . . . . . . . . . . . . . . . . . . . . . . . . . . . . . $6,220.2 $6,222.1
See notes to consolidated financial statements.
65
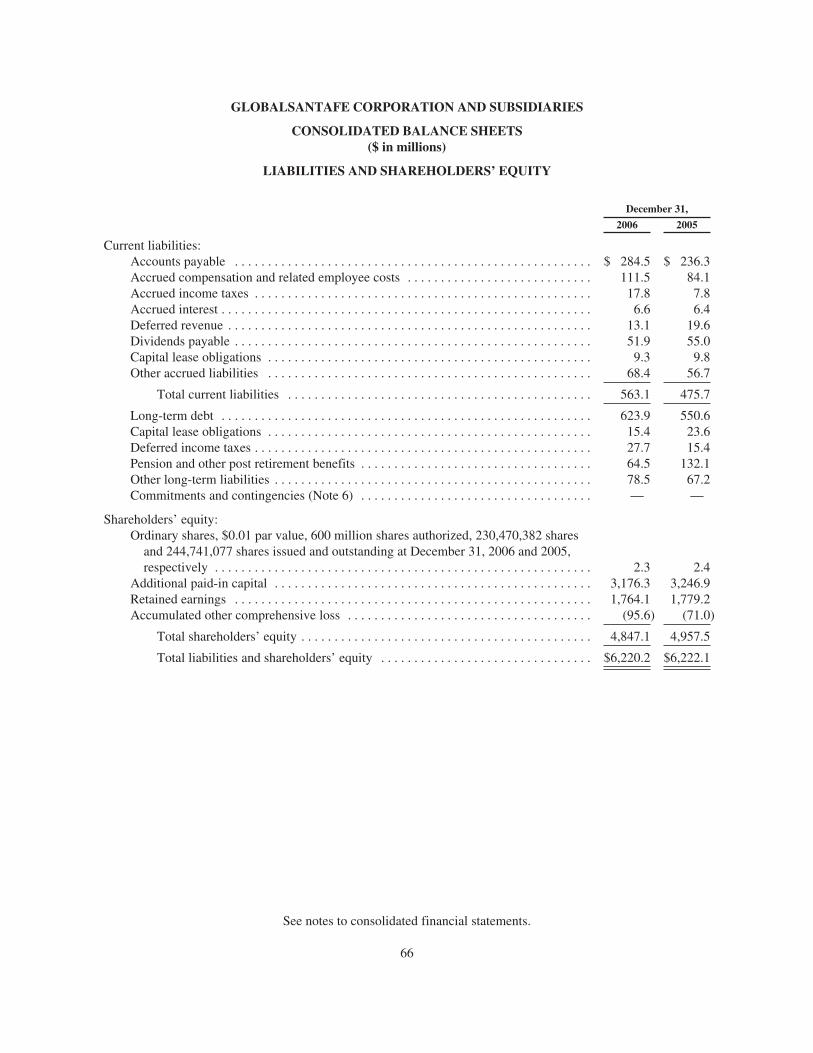
GLOBALSANTAFE CORPORATION AND SUBSIDIARIES
CONSOLIDATED BALANCE SHEETS($ in millions)
LIABILITIES AND SHAREHOLDERS’ EQUITY
December 31,
2006 2005
Current liabilities:Accounts payable . . . . . . . . . . . . . . . . . . . . . . . . . . . . . . . . . . . . . . . . . . . . . . . . . . . . . . $ 284.5 $ 236.3Accrued compensation and related employee costs . . . . . . . . . . . . . . . . . . . . . . . . . . . . 111.5 84.1Accrued income taxes . . . . . . . . . . . . . . . . . . . . . . . . . . . . . . . . . . . . . . . . . . . . . . . . . . . 17.8 7.8Accrued interest . . . . . . . . . . . . . . . . . . . . . . . . . . . . . . . . . . . . . . . . . . . . . . . . . . . . . . . . 6.6 6.4Deferred revenue . . . . . . . . . . . . . . . . . . . . . . . . . . . . . . . . . . . . . . . . . . . . . . . . . . . . . . . 13.1 19.6Dividends payable . . . . . . . . . . . . . . . . . . . . . . . . . . . . . . . . . . . . . . . . . . . . . . . . . . . . . . 51.9 55.0Capital lease obligations . . . . . . . . . . . . . . . . . . . . . . . . . . . . . . . . . . . . . . . . . . . . . . . . . 9.3 9.8Other accrued liabilities . . . . . . . . . . . . . . . . . . . . . . . . . . . . . . . . . . . . . . . . . . . . . . . . . 68.4 56.7
Total current liabilities . . . . . . . . . . . . . . . . . . . . . . . . . . . . . . . . . . . . . . . . . . . . . . 563.1 475.7
Long-term debt . . . . . . . . . . . . . . . . . . . . . . . . . . . . . . . . . . . . . . . . . . . . . . . . . . . . . . . . 623.9 550.6Capital lease obligations . . . . . . . . . . . . . . . . . . . . . . . . . . . . . . . . . . . . . . . . . . . . . . . . . 15.4 23.6Deferred income taxes . . . . . . . . . . . . . . . . . . . . . . . . . . . . . . . . . . . . . . . . . . . . . . . . . . . 27.7 15.4Pension and other post retirement benefits . . . . . . . . . . . . . . . . . . . . . . . . . . . . . . . . . . . 64.5 132.1Other long-term liabilities . . . . . . . . . . . . . . . . . . . . . . . . . . . . . . . . . . . . . . . . . . . . . . . . 78.5 67.2Commitments and contingencies (Note 6) . . . . . . . . . . . . . . . . . . . . . . . . . . . . . . . . . . . — —
Shareholders’ equity:Ordinary shares, $0.01 par value, 600 million shares authorized, 230,470,382 shares
and 244,741,077 shares issued and outstanding at December 31, 2006 and 2005,respectively . . . . . . . . . . . . . . . . . . . . . . . . . . . . . . . . . . . . . . . . . . . . . . . . . . . . . . . . . 2.3 2.4
Additional paid-in capital . . . . . . . . . . . . . . . . . . . . . . . . . . . . . . . . . . . . . . . . . . . . . . . . 3,176.3 3,246.9Retained earnings . . . . . . . . . . . . . . . . . . . . . . . . . . . . . . . . . . . . . . . . . . . . . . . . . . . . . . 1,764.1 1,779.2Accumulated other comprehensive loss . . . . . . . . . . . . . . . . . . . . . . . . . . . . . . . . . . . . . (95.6) (71.0)
Total shareholders’ equity . . . . . . . . . . . . . . . . . . . . . . . . . . . . . . . . . . . . . . . . . . . . 4,847.1 4,957.5
Total liabilities and shareholders’ equity . . . . . . . . . . . . . . . . . . . . . . . . . . . . . . . . $6,220.2 $6,222.1
See notes to consolidated financial statements.
66
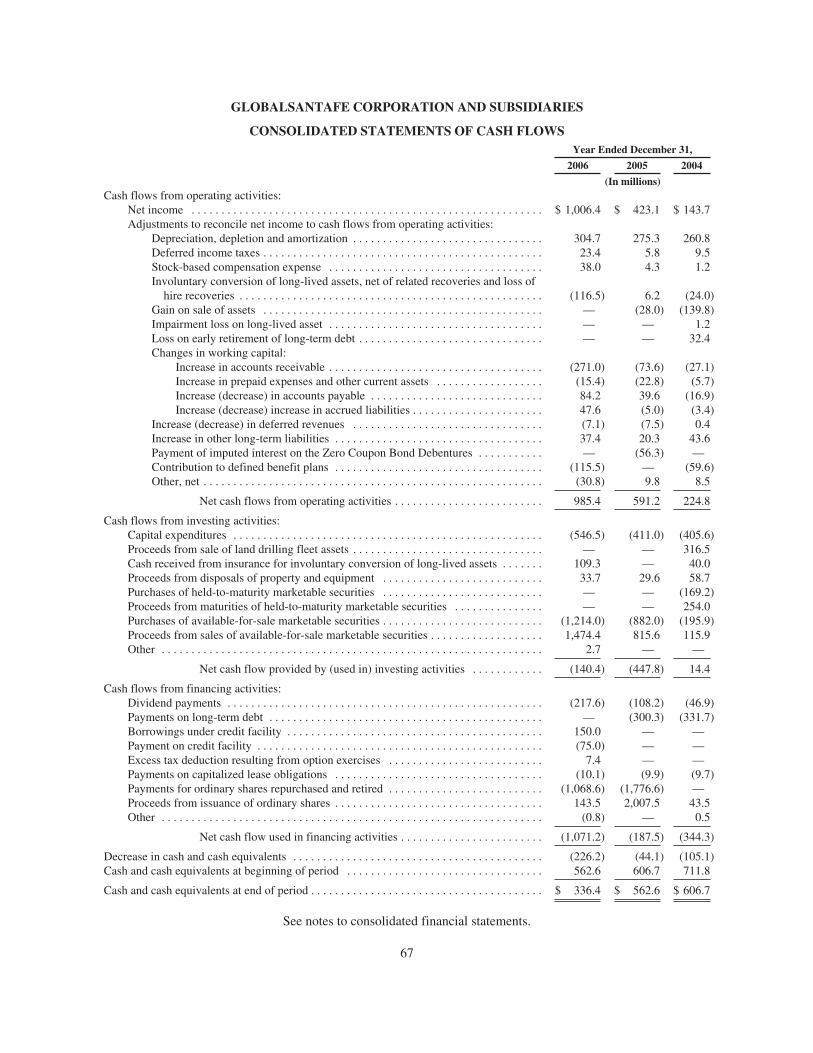
GLOBALSANTAFE CORPORATION AND SUBSIDIARIES
CONSOLIDATED STATEMENTS OF CASH FLOWSYear Ended December 31,
2006 2005 2004
(In millions)Cash flows from operating activities:
Net income . . . . . . . . . . . . . . . . . . . . . . . . . . . . . . . . . . . . . . . . . . . . . . . . . . . . . . . . . . . $ 1,006.4 $ 423.1 $ 143.7Adjustments to reconcile net income to cash flows from operating activities:
Depreciation, depletion and amortization . . . . . . . . . . . . . . . . . . . . . . . . . . . . . . . . 304.7 275.3 260.8Deferred income taxes . . . . . . . . . . . . . . . . . . . . . . . . . . . . . . . . . . . . . . . . . . . . . . . 23.4 5.8 9.5Stock-based compensation expense . . . . . . . . . . . . . . . . . . . . . . . . . . . . . . . . . . . . 38.0 4.3 1.2Involuntary conversion of long-lived assets, net of related recoveries and loss of
hire recoveries . . . . . . . . . . . . . . . . . . . . . . . . . . . . . . . . . . . . . . . . . . . . . . . . . . . (116.5) 6.2 (24.0)Gain on sale of assets . . . . . . . . . . . . . . . . . . . . . . . . . . . . . . . . . . . . . . . . . . . . . . . — (28.0) (139.8)Impairment loss on long-lived asset . . . . . . . . . . . . . . . . . . . . . . . . . . . . . . . . . . . . — — 1.2Loss on early retirement of long-term debt . . . . . . . . . . . . . . . . . . . . . . . . . . . . . . . — — 32.4Changes in working capital:
Increase in accounts receivable . . . . . . . . . . . . . . . . . . . . . . . . . . . . . . . . . . . . (271.0) (73.6) (27.1)Increase in prepaid expenses and other current assets . . . . . . . . . . . . . . . . . . (15.4) (22.8) (5.7)Increase (decrease) in accounts payable . . . . . . . . . . . . . . . . . . . . . . . . . . . . . 84.2 39.6 (16.9)Increase (decrease) increase in accrued liabilities . . . . . . . . . . . . . . . . . . . . . . 47.6 (5.0) (3.4)
Increase (decrease) in deferred revenues . . . . . . . . . . . . . . . . . . . . . . . . . . . . . . . . (7.1) (7.5) 0.4Increase in other long-term liabilities . . . . . . . . . . . . . . . . . . . . . . . . . . . . . . . . . . . 37.4 20.3 43.6Payment of imputed interest on the Zero Coupon Bond Debentures . . . . . . . . . . . — (56.3) —Contribution to defined benefit plans . . . . . . . . . . . . . . . . . . . . . . . . . . . . . . . . . . . (115.5) — (59.6)Other, net . . . . . . . . . . . . . . . . . . . . . . . . . . . . . . . . . . . . . . . . . . . . . . . . . . . . . . . . . (30.8) 9.8 8.5
Net cash flows from operating activities . . . . . . . . . . . . . . . . . . . . . . . . . 985.4 591.2 224.8
Cash flows from investing activities:Capital expenditures . . . . . . . . . . . . . . . . . . . . . . . . . . . . . . . . . . . . . . . . . . . . . . . . . . . . (546.5) (411.0) (405.6)Proceeds from sale of land drilling fleet assets . . . . . . . . . . . . . . . . . . . . . . . . . . . . . . . . — — 316.5Cash received from insurance for involuntary conversion of long-lived assets . . . . . . . 109.3 — 40.0Proceeds from disposals of property and equipment . . . . . . . . . . . . . . . . . . . . . . . . . . . 33.7 29.6 58.7Purchases of held-to-maturity marketable securities . . . . . . . . . . . . . . . . . . . . . . . . . . . — — (169.2)Proceeds from maturities of held-to-maturity marketable securities . . . . . . . . . . . . . . . — — 254.0Purchases of available-for-sale marketable securities . . . . . . . . . . . . . . . . . . . . . . . . . . . (1,214.0) (882.0) (195.9)Proceeds from sales of available-for-sale marketable securities . . . . . . . . . . . . . . . . . . . 1,474.4 815.6 115.9Other . . . . . . . . . . . . . . . . . . . . . . . . . . . . . . . . . . . . . . . . . . . . . . . . . . . . . . . . . . . . . . . . 2.7 — —
Net cash flow provided by (used in) investing activities . . . . . . . . . . . . (140.4) (447.8) 14.4
Cash flows from financing activities:Dividend payments . . . . . . . . . . . . . . . . . . . . . . . . . . . . . . . . . . . . . . . . . . . . . . . . . . . . . (217.6) (108.2) (46.9)Payments on long-term debt . . . . . . . . . . . . . . . . . . . . . . . . . . . . . . . . . . . . . . . . . . . . . . — (300.3) (331.7)Borrowings under credit facility . . . . . . . . . . . . . . . . . . . . . . . . . . . . . . . . . . . . . . . . . . . 150.0 — —Payment on credit facility . . . . . . . . . . . . . . . . . . . . . . . . . . . . . . . . . . . . . . . . . . . . . . . . (75.0) — —Excess tax deduction resulting from option exercises . . . . . . . . . . . . . . . . . . . . . . . . . . 7.4 — —Payments on capitalized lease obligations . . . . . . . . . . . . . . . . . . . . . . . . . . . . . . . . . . . (10.1) (9.9) (9.7)Payments for ordinary shares repurchased and retired . . . . . . . . . . . . . . . . . . . . . . . . . . (1,068.6) (1,776.6) —Proceeds from issuance of ordinary shares . . . . . . . . . . . . . . . . . . . . . . . . . . . . . . . . . . . 143.5 2,007.5 43.5Other . . . . . . . . . . . . . . . . . . . . . . . . . . . . . . . . . . . . . . . . . . . . . . . . . . . . . . . . . . . . . . . . (0.8) — 0.5
Net cash flow used in financing activities . . . . . . . . . . . . . . . . . . . . . . . . (1,071.2) (187.5) (344.3)
Decrease in cash and cash equivalents . . . . . . . . . . . . . . . . . . . . . . . . . . . . . . . . . . . . . . . . . . (226.2) (44.1) (105.1)Cash and cash equivalents at beginning of period . . . . . . . . . . . . . . . . . . . . . . . . . . . . . . . . . 562.6 606.7 711.8
Cash and cash equivalents at end of period . . . . . . . . . . . . . . . . . . . . . . . . . . . . . . . . . . . . . . . $ 336.4 $ 562.6 $ 606.7
See notes to consolidated financial statements.
67
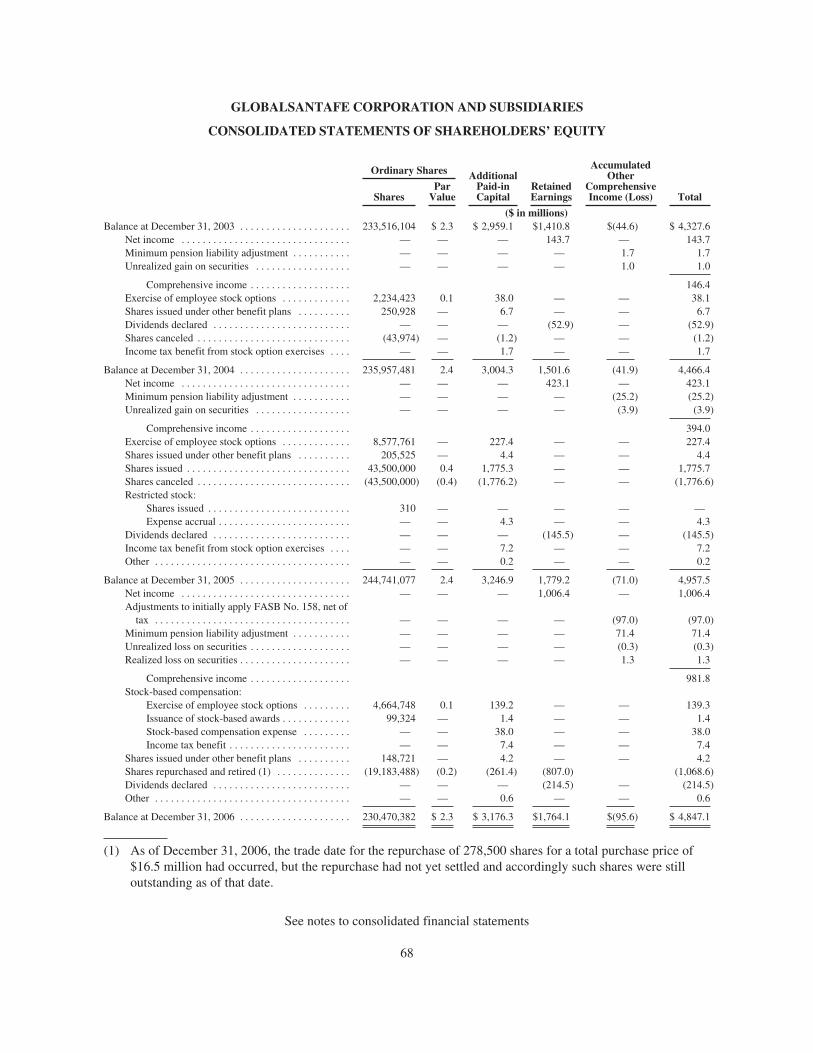
GLOBALSANTAFE CORPORATION AND SUBSIDIARIES
CONSOLIDATED STATEMENTS OF SHAREHOLDERS’ EQUITY
Ordinary Shares AdditionalPaid-inCapital
RetainedEarnings
AccumulatedOther
ComprehensiveIncome (Loss) TotalShares
ParValue
($ in millions)Balance at December 31, 2003 . . . . . . . . . . . . . . . . . . . . . 233,516,104 $ 2.3 $ 2,959.1 $1,410.8 $(44.6) $ 4,327.6
Net income . . . . . . . . . . . . . . . . . . . . . . . . . . . . . . . . — — — 143.7 — 143.7Minimum pension liability adjustment . . . . . . . . . . . — — — — 1.7 1.7Unrealized gain on securities . . . . . . . . . . . . . . . . . . — — — — 1.0 1.0
Comprehensive income . . . . . . . . . . . . . . . . . . . 146.4Exercise of employee stock options . . . . . . . . . . . . . 2,234,423 0.1 38.0 — — 38.1Shares issued under other benefit plans . . . . . . . . . . 250,928 — 6.7 — — 6.7Dividends declared . . . . . . . . . . . . . . . . . . . . . . . . . . — — — (52.9) — (52.9)Shares canceled . . . . . . . . . . . . . . . . . . . . . . . . . . . . . (43,974) — (1.2) — — (1.2)Income tax benefit from stock option exercises . . . . — — 1.7 — — 1.7
Balance at December 31, 2004 . . . . . . . . . . . . . . . . . . . . . 235,957,481 2.4 3,004.3 1,501.6 (41.9) 4,466.4Net income . . . . . . . . . . . . . . . . . . . . . . . . . . . . . . . . — — — 423.1 — 423.1Minimum pension liability adjustment . . . . . . . . . . . — — — — (25.2) (25.2)Unrealized gain on securities . . . . . . . . . . . . . . . . . . — — — — (3.9) (3.9)
Comprehensive income . . . . . . . . . . . . . . . . . . . 394.0Exercise of employee stock options . . . . . . . . . . . . . 8,577,761 — 227.4 — — 227.4Shares issued under other benefit plans . . . . . . . . . . 205,525 — 4.4 — — 4.4Shares issued . . . . . . . . . . . . . . . . . . . . . . . . . . . . . . . 43,500,000 0.4 1,775.3 — — 1,775.7Shares canceled . . . . . . . . . . . . . . . . . . . . . . . . . . . . . (43,500,000) (0.4) (1,776.2) — — (1,776.6)Restricted stock:
Shares issued . . . . . . . . . . . . . . . . . . . . . . . . . . . 310 — — — — —Expense accrual . . . . . . . . . . . . . . . . . . . . . . . . . — — 4.3 — — 4.3
Dividends declared . . . . . . . . . . . . . . . . . . . . . . . . . . — — — (145.5) — (145.5)Income tax benefit from stock option exercises . . . . — — 7.2 — — 7.2Other . . . . . . . . . . . . . . . . . . . . . . . . . . . . . . . . . . . . . — — 0.2 — — 0.2
Balance at December 31, 2005 . . . . . . . . . . . . . . . . . . . . . 244,741,077 2.4 3,246.9 1,779.2 (71.0) 4,957.5Net income . . . . . . . . . . . . . . . . . . . . . . . . . . . . . . . . — — — 1,006.4 — 1,006.4Adjustments to initially apply FASB No. 158, net of
tax . . . . . . . . . . . . . . . . . . . . . . . . . . . . . . . . . . . . . — — — — (97.0) (97.0)Minimum pension liability adjustment . . . . . . . . . . . — — — — 71.4 71.4Unrealized loss on securities . . . . . . . . . . . . . . . . . . . — — — — (0.3) (0.3)Realized loss on securities . . . . . . . . . . . . . . . . . . . . . — — — — 1.3 1.3
Comprehensive income . . . . . . . . . . . . . . . . . . . 981.8Stock-based compensation:
Exercise of employee stock options . . . . . . . . . 4,664,748 0.1 139.2 — — 139.3Issuance of stock-based awards . . . . . . . . . . . . . 99,324 — 1.4 — — 1.4Stock-based compensation expense . . . . . . . . . — — 38.0 — — 38.0Income tax benefit . . . . . . . . . . . . . . . . . . . . . . . — — 7.4 — — 7.4
Shares issued under other benefit plans . . . . . . . . . . 148,721 — 4.2 — — 4.2Shares repurchased and retired (1) . . . . . . . . . . . . . . (19,183,488) (0.2) (261.4) (807.0) (1,068.6)Dividends declared . . . . . . . . . . . . . . . . . . . . . . . . . . — — — (214.5) — (214.5)Other . . . . . . . . . . . . . . . . . . . . . . . . . . . . . . . . . . . . . — — 0.6 — — 0.6
Balance at December 31, 2006 . . . . . . . . . . . . . . . . . . . . . 230,470,382 $ 2.3 $ 3,176.3 $1,764.1 $(95.6) $ 4,847.1
(1) As of December 31, 2006, the trade date for the repurchase of 278,500 shares for a total purchase price of$16.5 million had occurred, but the repurchase had not yet settled and accordingly such shares were stilloutstanding as of that date.
See notes to consolidated financial statements
68
GLOBALSANTAFE CORPORATION AND SUBSIDIARIES
NOTES TO CONSOLIDATED FINANCIAL STATEMENTS
Note 1—Basis of Presentation and Description of Business
GlobalSantaFe Corporation is an offshore oil and gas drilling contractor, owning or operating a fleet of 59marine drilling rigs. As of December 31, 2006, our fleet included 43 cantilevered jackup rigs, 11semisubmersible rigs, three drillships, and two additional semisubmersible rigs we operate for third parties undera joint venture agreement. During the first quarter of 2006, we commenced construction of an additionalsemisubmersible, to be named the GSF Development Driller III. We also have a jackup rig, the GSF HighIsland III, that is currently not capable of performing drilling operations due to damage arising in 2005 as a resultof Hurricane Rita. Subsequent to December 31, 2006, we entered into a contract to sell the rig to a third party andexpect to complete the sale during the first quarter of 2007 We provide offshore oil and gas contract drillingservices to the oil and gas industry worldwide on a daily rate (“dayrate”) basis. We also provide oil and gasdrilling management services on either a dayrate or completed-project, fixed-price (“turnkey”) basis, as well asdrilling engineering and drilling project management services, and we participate in oil and gas exploration andproduction activities.
BASIS OF PRESENTATION
The accompanying consolidated financial statements include the accounts of GlobalSantaFe Corporationand its consolidated subsidiaries. Unless the context otherwise requires, the terms “we,” “us” and “our” refer toGlobalSantaFe Corporation and its consolidated subsidiaries. The consolidated financial statements and relatedfootnotes are presented in U.S. dollars and in accordance with accounting principles generally accepted in theUnited States of America. Certain prior period amounts have been reclassified to conform to the currentpresentation.
DIVIDENDS
Holders of GlobalSantaFe Ordinary Shares are entitled to participate in the payment of dividends inproportion to their holdings. Under Cayman Islands law, we may pay dividends or make other distributions to ourshareholders, in such amounts as the Board of Directors deems appropriate from our profits or out of our sharepremium account (equivalent to additional paid-in capital) provided we thereafter have the ability to pay ourdebts as they come due. Cash dividends, if any, will be declared and paid in U.S. dollars. We declared cashdividends of $51.9 million that were unpaid as of December 31, 2006.
SALE OF LAND DRILLING BUSINESS (DISCONTINUED OPERATIONS)
On May 21, 2004, we completed the sale of our land drilling business to Precision Drilling Corporation for atotal sales price of $316.5 million in an all-cash transaction. As a result of this sale, we recognized a gain of$113.1 million, including a net tax benefit of $1.1 million.
69
GLOBALSANTAFE CORPORATION AND SUBSIDIARIES
NOTES TO CONSOLIDATED FINANCIAL STATEMENTS—(Continued)
The following table lists the contribution of our land rig fleet to our consolidated operating results for theyear ended December 31, 2004.
Year EndedDecember 31,
2004
(In millions)
Revenues . . . . . . . . . . . . . . . . . . . . . . . . . . . . . . . . . . . . . . . . . . . . . . . . . . . . . . . $ 43.9
Expenses (income):Direct operating expenses . . . . . . . . . . . . . . . . . . . . . . . . . . . . . . . . . . . . . . 27.9Depreciation . . . . . . . . . . . . . . . . . . . . . . . . . . . . . . . . . . . . . . . . . . . . . . . . 4.0Exit costs . . . . . . . . . . . . . . . . . . . . . . . . . . . . . . . . . . . . . . . . . . . . . . . . . . . 6.8Gain on sale of assets . . . . . . . . . . . . . . . . . . . . . . . . . . . . . . . . . . . . . . . . . (112.0)
117.2Provision for income taxes, including a net tax benefit of $1.1 in 2004 related
to the gain on sale of assets . . . . . . . . . . . . . . . . . . . . . . . . . . . . . . . . . . . . . . 4.9
Income from discontinued operations, net of tax effect . . . . . . . . . . . . . . . . . . . $ 112.3
Note 2—Summary of Significant Accounting Policies
PRINCIPLES OF CONSOLIDATION
We consolidate all of our majority-owned subsidiaries and joint ventures over which we exercise controlthrough either the joint venture agreement or related operating and financing agreements. We account for ourinterest in other joint ventures using the equity method. All material intercompany accounts and transactions areeliminated in consolidation.
CASH EQUIVALENTS AND MARKETABLE SECURITIES
Cash equivalents include highly liquid debt instruments with remaining maturities of three months or less atthe time of purchase. Our marketable securities portfolio is classified as available-for-sale and, as such, thesemarketable securities are recorded at fair value in our Consolidated Balance Sheet at December 31, 2006 and2005. Realized and unrealized gains and losses related to these marketable securities are calculated using thespecific identification method. Unrealized gains and losses are included in Accumulated Other ComprehensiveLoss in the Consolidated Balance Sheet at December 31, 2006 and 2005. In addition, we hold securities inconnection with certain nonqualified pension plans, which are also classified as available-for-sale (see Note 3).We recorded $0.4 million of realized gains and $2.6 million of realized losses related to our marketable securitiesportfolio in 2006 and we recorded $0.6 million of realized gains and $0.2 million of realized losses related to ourmarketable securities portfolio in 2005. With respect to available-for-sale securities held in connection withcertain nonqualified pension plans, we recorded realized gains of $2.4 million in 2006, $3.1 million in 2005 and$1.6 million in 2004.
PROPERTIES AND DEPRECIATION
Rigs and Drilling Equipment. Capitalized costs of rigs and drilling equipment include all costs incurred inthe acquisition of capital assets including allocations of interest costs incurred during periods that assets areunder construction or while the they are being readied for their initial contract. Expenditures that improve orextend the lives of rigs and drilling equipment are capitalized. Expenditures for maintenance and repairs are
70
GLOBALSANTAFE CORPORATION AND SUBSIDIARIES
NOTES TO CONSOLIDATED FINANCIAL STATEMENTS—(Continued)
charged to expense as incurred. Costs of property sold or retired and the related accumulated depreciation areremoved from the accounts; resulting gains or losses are included in income.
We periodically evaluate the remaining useful lives and salvage values of our rigs, giving effect to operatingand market conditions and upgrades performed on these rigs. As a result of analyses performed on our drillingfleet, effective January 1, 2004, we increased the remaining lives on certain rigs in our jackup fleet to 13 yearsfrom a range of 5.6 to 10.1 years, increased salvage values of these and other rigs in our jackup fleet from $0.5million per rig to amounts ranging from $1.2 to $3.0 million per rig, and increased the salvage values of oursemisubmersibles and certain of our drillships from $1.0 million per rig to amounts ranging from $2.5 to $4.0million per rig. The effect of these changes in useful lives was a reduction to depreciation expense for the yearended December 31, 2004, of approximately $18.3 million.
During the third quarter of 2005, the GSF High Island III and the GSF Adriatic VII were damaged as a resultof Hurricane Rita. During the second quarter of 2006, we recorded gains of $32.8 million on the GSF HighIsland III and $30.9 million on the GSF Adriatic VII, which represent recoveries of partial losses under ourinsurance policy, less amounts previously recognized when the rigs were written down to salvage value. InDecember 2006, we sold the GSF Adriatic VII to a third party for approximately $29.4 million, net of sellingcosts, and recorded a gain of $28 million, which represents the selling price less the $1.4 million salvage value.In addition, we increased the gain recognized in the second quarter of 2006 related to the GSF Adriatic VII by$3.2 million to include additional costs reimbursable under the insurance policy. There was no tax impact relatedto these transactions. Subsequent to December 31, 2006, we entered into an agreement to sell the GSF HighIsland III to a third party for approximately $26.3 million and expect to complete the sale during the first quarterof 2007. We will record a gain equal to the selling price, net of expenses, less the salvage value of $1.2 million.
During the first quarter of 2004, we retired the drillship Glomar Robert F. Bauer from active service. As aresult, we accelerated the remaining depreciation on the rig, which resulted in a $1.5 million charge todepreciation expense in the first quarter of 2004. As a result of continued improvements in the offshore drillingmarkets, we sold this rig in the fourth quarter of 2005 for $25 million and recorded a net gain of $23.5 million.There was no tax impact related to this transaction.
Rigs and drilling equipment included $689.8 million and $1.1 billion of assets recorded under capital leasesat December 31, 2006 and 2005, respectively. Accumulated amortization of assets under capital leases totaled$204.0 million and $288.2 million at December 31, 2006 and 2005, respectively.
We review our long-term assets for impairment when changes in circumstances indicate that the carryingamount of the asset may not be recoverable. Long-lived assets and certain intangibles to be held and used arereported at the lower of carrying amount or fair value. Assets to be disposed of and assets not expected to provideany future service potential are recorded at the lower of carrying amount or fair value less cost to sell. We did notrecord any impairment charges during the years ended December 31, 2006 and 2005. In April 2004, we sold theplatform rig Rig 82 for a nominal sum in connection with our exit from the platform rig business and recognizedan impairment loss of approximately $1.2 million in the first quarter of 2004.
Oil and Gas Properties. We use the full-cost method of accounting for oil and gas exploration anddevelopment costs. Under this method of accounting, we capitalize all costs incurred in the acquisition,exploration and development of oil and gas properties and amortize such costs, together with estimated futuredevelopment and dismantlement costs, using the units-of-production method.
Costs of offshore unproved properties and development projects are not amortized until they are fullyevaluated. Unproved oil and gas properties totaled approximately $1.2 million and $1.4 million at December 31,
71
GLOBALSANTAFE CORPORATION AND SUBSIDIARIES
NOTES TO CONSOLIDATED FINANCIAL STATEMENTS—(Continued)
2006 and 2005, respectively. All unproved properties are reviewed periodically to ascertain if impairment hasoccurred. If the results of an assessment indicate that the properties are impaired, the amount of the impairment isadded to the capitalized costs to be amortized. Costs of proved oil and gas properties that exceed the presentvalue of estimated future net revenues are charged to expense.
Sales of proved and unproved properties are accounted for as adjustments of capitalized costs with no gainor loss recognized, unless such adjustments would significantly alter the relationship between capitalized costsand proved reserves of oil and gas attributable to a cost center, in which case the gain or loss is recognized inincome. Abandonments of properties are accounted for as adjustments of capitalized costs with no lossrecognized.
In December 2003, our oil and gas division participated in a drilling project in West Africa off the coast ofMauritania. Our share of the costs incurred in connection with this project totaled approximately $3.4 million,$2.9 million of which was classified as unproved oil and gas properties at December 31, 2003. In March 2004,we sold our interest in this project for approximately $6.1 million and as a result of this being the only project inour African cost center we recorded a gain of $2.7 million ($2.0 million net of taxes) in the first quarter of 2004.
In September 2004, our oil and gas division completed the sale of 50% of its interest in the Broom Field, adevelopment project in the North Sea. We received net proceeds of $35.9 million and, because we sold 50% ofour reserve base, causing a significant alteration in the relationship between our capitalized cost and provedreserves in our North Sea cost center, we recorded a gain of $25.1 million ($13.3 million net of taxes) inconnection with this sale. We retained an eight percent working interest in this project. Pursuant to the terms ofthe sale, if commodity prices exceeded a specified amount, we were also entitled to additional post-closingconsideration equal to a portion of the proceeds from the production attributable to this interest sold throughSeptember 2005. In 2005 we recorded an additional gain associated with this deferred consideration arrangementof $4.5 million ($2.7 million net of taxes), which represents the entire deferred consideration earned under thesales agreement.
INTERSEGMENT TURNKEY DRILLING PROFITS
We defer all turnkey drilling profit related to wells in which one of our oil and gas subsidiaries was theoperator and defer turnkey profit up to the share of our oil and gas subsidiaries’ costs in properties in which ouroil and gas division holds a non-operating working interest. This turnkey profit is credited to our full cost pool ofoil and gas properties and is generally recognized through a lower depletion rate as reserves are produced.
GOODWILL
We test goodwill annually for impairment (and in interim periods if certain events occur indicating that thecarrying value of goodwill and/or indefinite-lived intangible assets may be impaired).
We have defined reporting units within our contract drilling segment based upon economic and marketcharacteristics of these units. All of the goodwill recorded in connection with the merger of Santa FeInternational Corporation and Global Marine Inc. has been allocated to the jackup drilling fleet reporting unit.The estimated fair value of this reporting unit for purposes of our annual goodwill impairment testing is basedupon the present value of its estimated future net cash flows, utilizing a discount rate based upon our cost ofcapital. We have completed our goodwill impairment testing for 2006 and were not required to record a goodwillimpairment loss.
72

GLOBALSANTAFE CORPORATION AND SUBSIDIARIES
NOTES TO CONSOLIDATED FINANCIAL STATEMENTS—(Continued)
REVENUE RECOGNITION
Our contract drilling business provides crewed rigs to customers on a dayrate basis. Dayrate contracts can befor a specified period of time or the time required to drill a specified well or number of wells. Revenues andexpenses from dayrate drilling operations, which are classified under contract drilling services, are recognized ona per-day basis as the work progresses. Lump-sum fees received as compensation for the cost of relocatingdrilling rigs from one major operating area to another, whether received up-front or upon termination of thedrilling contract, are recognized as earned, which is generally over the primary term of the related drillingcontract.
We also design and execute specific offshore drilling or well-completion programs for customers at fixedprices under short-term “turnkey” contracts. Revenues and expenses from turnkey contracts, which are classifiedunder drilling management services, are earned and recognized upon completion of each contract.
We recognize revenue from oil and gas production at the time title transfers.
We recognize reimbursements received from customers for out-of-pocket expenses incurred as revenues.
DERIVATIVE FINANCIAL INSTRUMENTS
From time to time, we may make use of derivative financial instruments to manage our exposure tofluctuations in cash flows, interest rates or foreign currency exchange rates. We account for our derivativefinancial instruments pursuant to SFAS No. 133, “Accounting for Derivative Instruments and HedgingActivities,” as amended by SFAS No. 138, “Accounting for Derivative Instruments and Hedging Activities—anamendment of FASB Statement No. 133,” and SFAS No. 149, “Amendment of Statement 133 on DerivativeInstruments and Hedging Activities.” Derivative instruments held by us at December 31, 2006, consisted ofcertain fixed-for-floating interest rate swaps related to a portion of our long-term debt (see Note 8).
FOREIGN CURRENCY TRANSACTIONS
The United States dollar is the functional currency for all of our operations. Realized and unrealized foreigncurrency transaction gains and losses are recorded in income.
We may be exposed to the risk of foreign currency exchange losses in connection with our foreignoperations. Such losses are the result of holding net monetary assets (cash and receivables in excess of payables)or liabilities (payables in excess of cash and receivables) denominated in foreign currencies during periods of astrengthening (or, in the case of net monetary liabilities, weakening) U.S. dollar. We incurred foreign currencyexchange losses totaling approximately $0.9 million, $2.3 million and $6.1 million in 2006, 2005 and 2004,respectively. We attempt to lessen the impact of exchange rate changes by requiring customer payments to beprimarily in U.S. dollars, by keeping foreign cash balances at minimal levels and by not speculating in foreigncurrencies.
INCOME TAXES
We are a Cayman Islands company and we operate through our various subsidiaries in numerous countriesthroughout the world including the United States. Consequently, our tax provision is based upon the tax laws andrates in effect in the countries in which our operations are conducted and income is earned. The income tax ratesimposed and methods of computing taxable income in these jurisdictions vary substantially. Our effective taxrate for financial statement purposes will continue to fluctuate from year to year as our operations are conductedin different taxing jurisdictions. Current income tax expense represents either liabilities expected to be reflected
73
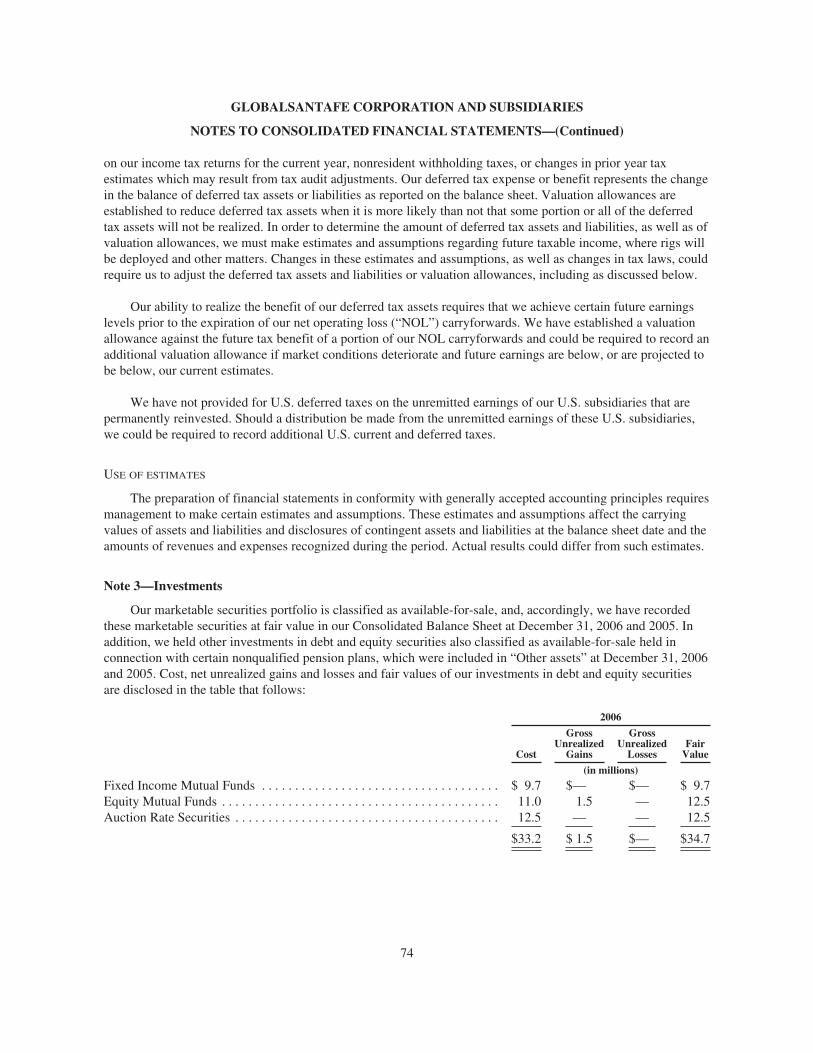
GLOBALSANTAFE CORPORATION AND SUBSIDIARIES
NOTES TO CONSOLIDATED FINANCIAL STATEMENTS—(Continued)
on our income tax returns for the current year, nonresident withholding taxes, or changes in prior year taxestimates which may result from tax audit adjustments. Our deferred tax expense or benefit represents the changein the balance of deferred tax assets or liabilities as reported on the balance sheet. Valuation allowances areestablished to reduce deferred tax assets when it is more likely than not that some portion or all of the deferredtax assets will not be realized. In order to determine the amount of deferred tax assets and liabilities, as well as ofvaluation allowances, we must make estimates and assumptions regarding future taxable income, where rigs willbe deployed and other matters. Changes in these estimates and assumptions, as well as changes in tax laws, couldrequire us to adjust the deferred tax assets and liabilities or valuation allowances, including as discussed below.
Our ability to realize the benefit of our deferred tax assets requires that we achieve certain future earningslevels prior to the expiration of our net operating loss (“NOL”) carryforwards. We have established a valuationallowance against the future tax benefit of a portion of our NOL carryforwards and could be required to record anadditional valuation allowance if market conditions deteriorate and future earnings are below, or are projected tobe below, our current estimates.
We have not provided for U.S. deferred taxes on the unremitted earnings of our U.S. subsidiaries that arepermanently reinvested. Should a distribution be made from the unremitted earnings of these U.S. subsidiaries,we could be required to record additional U.S. current and deferred taxes.
USE OF ESTIMATES
The preparation of financial statements in conformity with generally accepted accounting principles requiresmanagement to make certain estimates and assumptions. These estimates and assumptions affect the carryingvalues of assets and liabilities and disclosures of contingent assets and liabilities at the balance sheet date and theamounts of revenues and expenses recognized during the period. Actual results could differ from such estimates.
Note 3—Investments
Our marketable securities portfolio is classified as available-for-sale, and, accordingly, we have recordedthese marketable securities at fair value in our Consolidated Balance Sheet at December 31, 2006 and 2005. Inaddition, we held other investments in debt and equity securities also classified as available-for-sale held inconnection with certain nonqualified pension plans, which were included in “Other assets” at December 31, 2006and 2005. Cost, net unrealized gains and losses and fair values of our investments in debt and equity securitiesare disclosed in the table that follows:
2006
Cost
GrossUnrealized
Gains
GrossUnrealized
LossesFair
Value
(in millions)
Fixed Income Mutual Funds . . . . . . . . . . . . . . . . . . . . . . . . . . . . . . . . . . . . $ 9.7 $— $— $ 9.7Equity Mutual Funds . . . . . . . . . . . . . . . . . . . . . . . . . . . . . . . . . . . . . . . . . . 11.0 1.5 — 12.5Auction Rate Securities . . . . . . . . . . . . . . . . . . . . . . . . . . . . . . . . . . . . . . . . 12.5 — — 12.5
$33.2 $ 1.5 $— $34.7
74
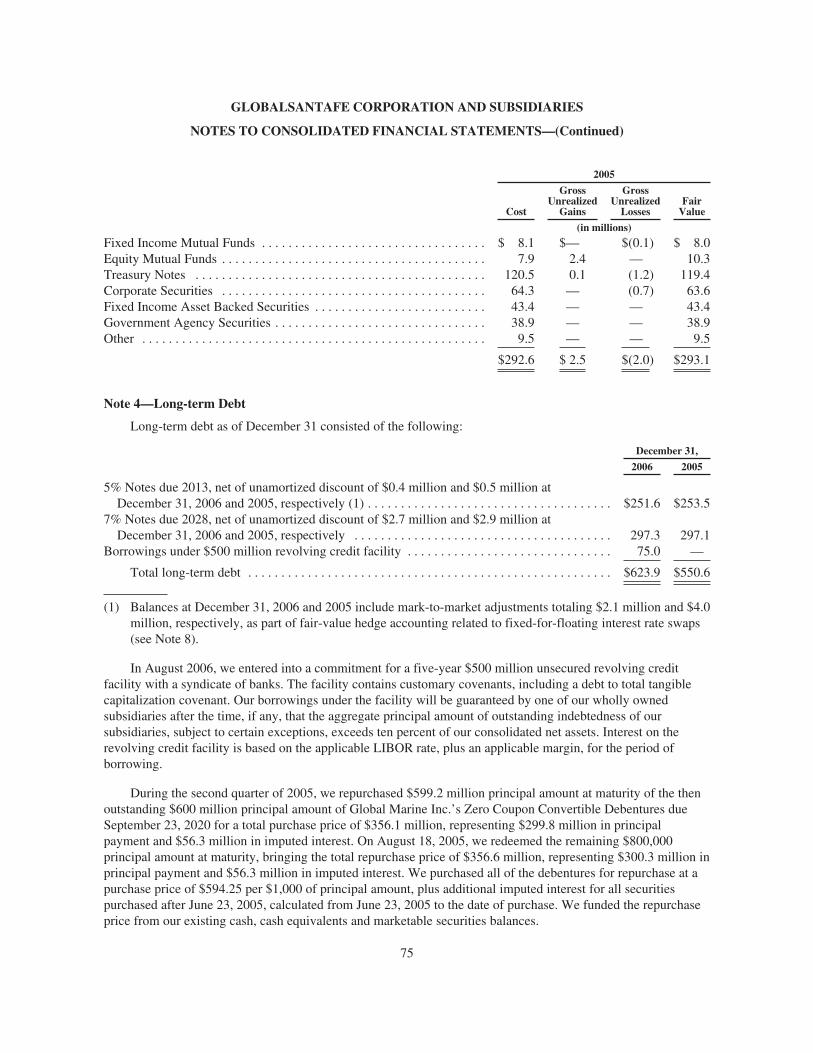
GLOBALSANTAFE CORPORATION AND SUBSIDIARIES
NOTES TO CONSOLIDATED FINANCIAL STATEMENTS—(Continued)
2005
Cost
GrossUnrealized
Gains
GrossUnrealized
LossesFair
Value
(in millions)
Fixed Income Mutual Funds . . . . . . . . . . . . . . . . . . . . . . . . . . . . . . . . . . $ 8.1 $— $(0.1) $ 8.0Equity Mutual Funds . . . . . . . . . . . . . . . . . . . . . . . . . . . . . . . . . . . . . . . . 7.9 2.4 — 10.3Treasury Notes . . . . . . . . . . . . . . . . . . . . . . . . . . . . . . . . . . . . . . . . . . . . 120.5 0.1 (1.2) 119.4Corporate Securities . . . . . . . . . . . . . . . . . . . . . . . . . . . . . . . . . . . . . . . . 64.3 — (0.7) 63.6Fixed Income Asset Backed Securities . . . . . . . . . . . . . . . . . . . . . . . . . . 43.4 — — 43.4Government Agency Securities . . . . . . . . . . . . . . . . . . . . . . . . . . . . . . . . 38.9 — — 38.9Other . . . . . . . . . . . . . . . . . . . . . . . . . . . . . . . . . . . . . . . . . . . . . . . . . . . . 9.5 — — 9.5
$292.6 $ 2.5 $(2.0) $293.1
Note 4—Long-term Debt
Long-term debt as of December 31 consisted of the following:
December 31,
2006 2005
5% Notes due 2013, net of unamortized discount of $0.4 million and $0.5 million atDecember 31, 2006 and 2005, respectively (1) . . . . . . . . . . . . . . . . . . . . . . . . . . . . . . . . . . . . . $251.6 $253.5
7% Notes due 2028, net of unamortized discount of $2.7 million and $2.9 million atDecember 31, 2006 and 2005, respectively . . . . . . . . . . . . . . . . . . . . . . . . . . . . . . . . . . . . . . . 297.3 297.1
Borrowings under $500 million revolving credit facility . . . . . . . . . . . . . . . . . . . . . . . . . . . . . . . 75.0 —
Total long-term debt . . . . . . . . . . . . . . . . . . . . . . . . . . . . . . . . . . . . . . . . . . . . . . . . . . . . . . . $623.9 $550.6
(1) Balances at December 31, 2006 and 2005 include mark-to-market adjustments totaling $2.1 million and $4.0million, respectively, as part of fair-value hedge accounting related to fixed-for-floating interest rate swaps(see Note 8).
In August 2006, we entered into a commitment for a five-year $500 million unsecured revolving creditfacility with a syndicate of banks. The facility contains customary covenants, including a debt to total tangiblecapitalization covenant. Our borrowings under the facility will be guaranteed by one of our wholly ownedsubsidiaries after the time, if any, that the aggregate principal amount of outstanding indebtedness of oursubsidiaries, subject to certain exceptions, exceeds ten percent of our consolidated net assets. Interest on therevolving credit facility is based on the applicable LIBOR rate, plus an applicable margin, for the period ofborrowing.
During the second quarter of 2005, we repurchased $599.2 million principal amount at maturity of the thenoutstanding $600 million principal amount of Global Marine Inc.’s Zero Coupon Convertible Debentures dueSeptember 23, 2020 for a total purchase price of $356.1 million, representing $299.8 million in principalpayment and $56.3 million in imputed interest. On August 18, 2005, we redeemed the remaining $800,000principal amount at maturity, bringing the total repurchase price of $356.6 million, representing $300.3 million inprincipal payment and $56.3 million in imputed interest. We purchased all of the debentures for repurchase at apurchase price of $594.25 per $1,000 of principal amount, plus additional imputed interest for all securitiespurchased after June 23, 2005, calculated from June 23, 2005 to the date of purchase. We funded the repurchaseprice from our existing cash, cash equivalents and marketable securities balances.
75
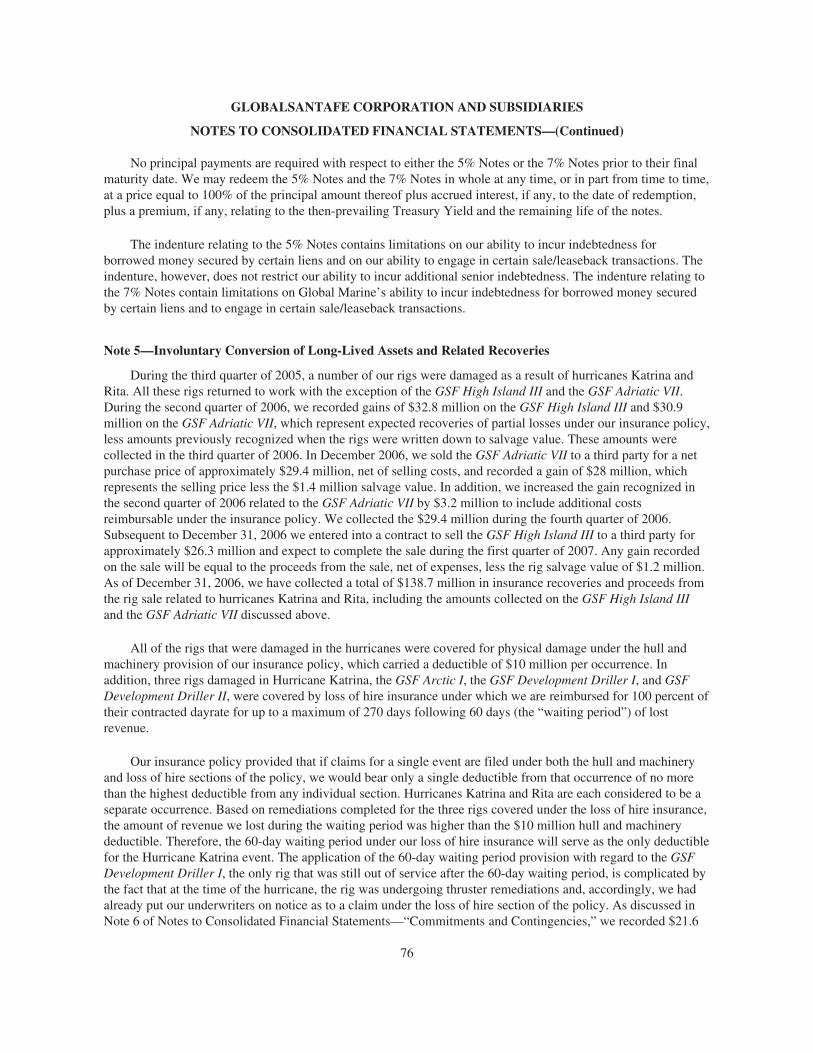
GLOBALSANTAFE CORPORATION AND SUBSIDIARIES
NOTES TO CONSOLIDATED FINANCIAL STATEMENTS—(Continued)
No principal payments are required with respect to either the 5% Notes or the 7% Notes prior to their finalmaturity date. We may redeem the 5% Notes and the 7% Notes in whole at any time, or in part from time to time,at a price equal to 100% of the principal amount thereof plus accrued interest, if any, to the date of redemption,plus a premium, if any, relating to the then-prevailing Treasury Yield and the remaining life of the notes.
The indenture relating to the 5% Notes contains limitations on our ability to incur indebtedness forborrowed money secured by certain liens and on our ability to engage in certain sale/leaseback transactions. Theindenture, however, does not restrict our ability to incur additional senior indebtedness. The indenture relating tothe 7% Notes contain limitations on Global Marine’s ability to incur indebtedness for borrowed money securedby certain liens and to engage in certain sale/leaseback transactions.
Note 5—Involuntary Conversion of Long-Lived Assets and Related Recoveries
During the third quarter of 2005, a number of our rigs were damaged as a result of hurricanes Katrina andRita. All these rigs returned to work with the exception of the GSF High Island III and the GSF Adriatic VII.During the second quarter of 2006, we recorded gains of $32.8 million on the GSF High Island III and $30.9million on the GSF Adriatic VII, which represent expected recoveries of partial losses under our insurance policy,less amounts previously recognized when the rigs were written down to salvage value. These amounts werecollected in the third quarter of 2006. In December 2006, we sold the GSF Adriatic VII to a third party for a netpurchase price of approximately $29.4 million, net of selling costs, and recorded a gain of $28 million, whichrepresents the selling price less the $1.4 million salvage value. In addition, we increased the gain recognized inthe second quarter of 2006 related to the GSF Adriatic VII by $3.2 million to include additional costsreimbursable under the insurance policy. We collected the $29.4 million during the fourth quarter of 2006.Subsequent to December 31, 2006 we entered into a contract to sell the GSF High Island III to a third party forapproximately $26.3 million and expect to complete the sale during the first quarter of 2007. Any gain recordedon the sale will be equal to the proceeds from the sale, net of expenses, less the rig salvage value of $1.2 million.As of December 31, 2006, we have collected a total of $138.7 million in insurance recoveries and proceeds fromthe rig sale related to hurricanes Katrina and Rita, including the amounts collected on the GSF High Island IIIand the GSF Adriatic VII discussed above.
All of the rigs that were damaged in the hurricanes were covered for physical damage under the hull andmachinery provision of our insurance policy, which carried a deductible of $10 million per occurrence. Inaddition, three rigs damaged in Hurricane Katrina, the GSF Arctic I, the GSF Development Driller I, and GSFDevelopment Driller II, were covered by loss of hire insurance under which we are reimbursed for 100 percent oftheir contracted dayrate for up to a maximum of 270 days following 60 days (the “waiting period”) of lostrevenue.
Our insurance policy provided that if claims for a single event are filed under both the hull and machineryand loss of hire sections of the policy, we would bear only a single deductible from that occurrence of no morethan the highest deductible from any individual section. Hurricanes Katrina and Rita are each considered to be aseparate occurrence. Based on remediations completed for the three rigs covered under the loss of hire insurance,the amount of revenue we lost during the waiting period was higher than the $10 million hull and machinerydeductible. Therefore, the 60-day waiting period under our loss of hire insurance will serve as the only deductiblefor the Hurricane Katrina event. The application of the 60-day waiting period provision with regard to the GSFDevelopment Driller I, the only rig that was still out of service after the 60-day waiting period, is complicated bythe fact that at the time of the hurricane, the rig was undergoing thruster remediations and, accordingly, we hadalready put our underwriters on notice as to a claim under the loss of hire section of the policy. As discussed inNote 6 of Notes to Consolidated Financial Statements—“Commitments and Contingencies,” we recorded $21.6
76
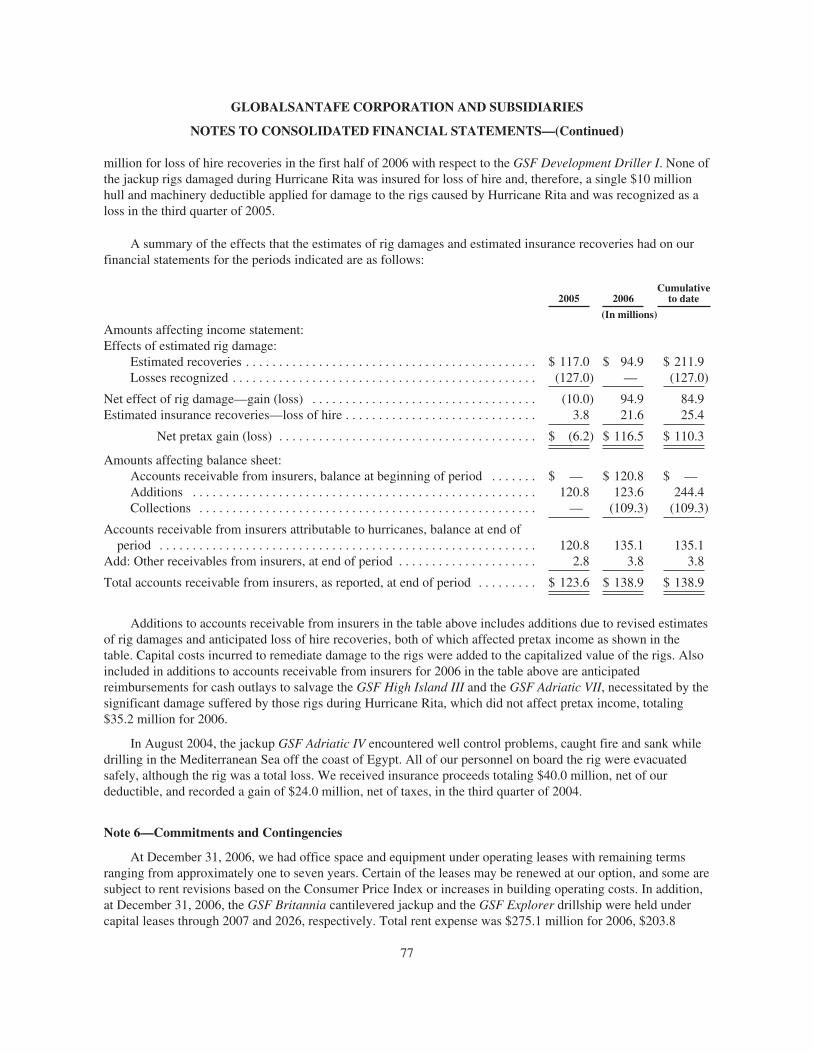
GLOBALSANTAFE CORPORATION AND SUBSIDIARIES
NOTES TO CONSOLIDATED FINANCIAL STATEMENTS—(Continued)
million for loss of hire recoveries in the first half of 2006 with respect to the GSF Development Driller I. None ofthe jackup rigs damaged during Hurricane Rita was insured for loss of hire and, therefore, a single $10 millionhull and machinery deductible applied for damage to the rigs caused by Hurricane Rita and was recognized as aloss in the third quarter of 2005.
A summary of the effects that the estimates of rig damages and estimated insurance recoveries had on ourfinancial statements for the periods indicated are as follows:
2005 2006Cumulative
to date
(In millions)
Amounts affecting income statement:Effects of estimated rig damage:
Estimated recoveries . . . . . . . . . . . . . . . . . . . . . . . . . . . . . . . . . . . . . . . . . . . . $ 117.0 $ 94.9 $ 211.9Losses recognized . . . . . . . . . . . . . . . . . . . . . . . . . . . . . . . . . . . . . . . . . . . . . . (127.0) — (127.0)
Net effect of rig damage—gain (loss) . . . . . . . . . . . . . . . . . . . . . . . . . . . . . . . . . . (10.0) 94.9 84.9Estimated insurance recoveries—loss of hire . . . . . . . . . . . . . . . . . . . . . . . . . . . . . 3.8 21.6 25.4
Net pretax gain (loss) . . . . . . . . . . . . . . . . . . . . . . . . . . . . . . . . . . . . . . . $ (6.2) $ 116.5 $ 110.3
Amounts affecting balance sheet:Accounts receivable from insurers, balance at beginning of period . . . . . . . $ — $ 120.8 $ —Additions . . . . . . . . . . . . . . . . . . . . . . . . . . . . . . . . . . . . . . . . . . . . . . . . . . . . 120.8 123.6 244.4Collections . . . . . . . . . . . . . . . . . . . . . . . . . . . . . . . . . . . . . . . . . . . . . . . . . . . — (109.3) (109.3)
Accounts receivable from insurers attributable to hurricanes, balance at end ofperiod . . . . . . . . . . . . . . . . . . . . . . . . . . . . . . . . . . . . . . . . . . . . . . . . . . . . . . . . . 120.8 135.1 135.1
Add: Other receivables from insurers, at end of period . . . . . . . . . . . . . . . . . . . . . 2.8 3.8 3.8
Total accounts receivable from insurers, as reported, at end of period . . . . . . . . . $ 123.6 $ 138.9 $ 138.9
Additions to accounts receivable from insurers in the table above includes additions due to revised estimatesof rig damages and anticipated loss of hire recoveries, both of which affected pretax income as shown in thetable. Capital costs incurred to remediate damage to the rigs were added to the capitalized value of the rigs. Alsoincluded in additions to accounts receivable from insurers for 2006 in the table above are anticipatedreimbursements for cash outlays to salvage the GSF High Island III and the GSF Adriatic VII, necessitated by thesignificant damage suffered by those rigs during Hurricane Rita, which did not affect pretax income, totaling$35.2 million for 2006.
In August 2004, the jackup GSF Adriatic IV encountered well control problems, caught fire and sank whiledrilling in the Mediterranean Sea off the coast of Egypt. All of our personnel on board the rig were evacuatedsafely, although the rig was a total loss. We received insurance proceeds totaling $40.0 million, net of ourdeductible, and recorded a gain of $24.0 million, net of taxes, in the third quarter of 2004.
Note 6—Commitments and Contingencies
At December 31, 2006, we had office space and equipment under operating leases with remaining termsranging from approximately one to seven years. Certain of the leases may be renewed at our option, and some aresubject to rent revisions based on the Consumer Price Index or increases in building operating costs. In addition,at December 31, 2006, the GSF Britannia cantilevered jackup and the GSF Explorer drillship were held undercapital leases through 2007 and 2026, respectively. Total rent expense was $275.1 million for 2006, $203.8
77
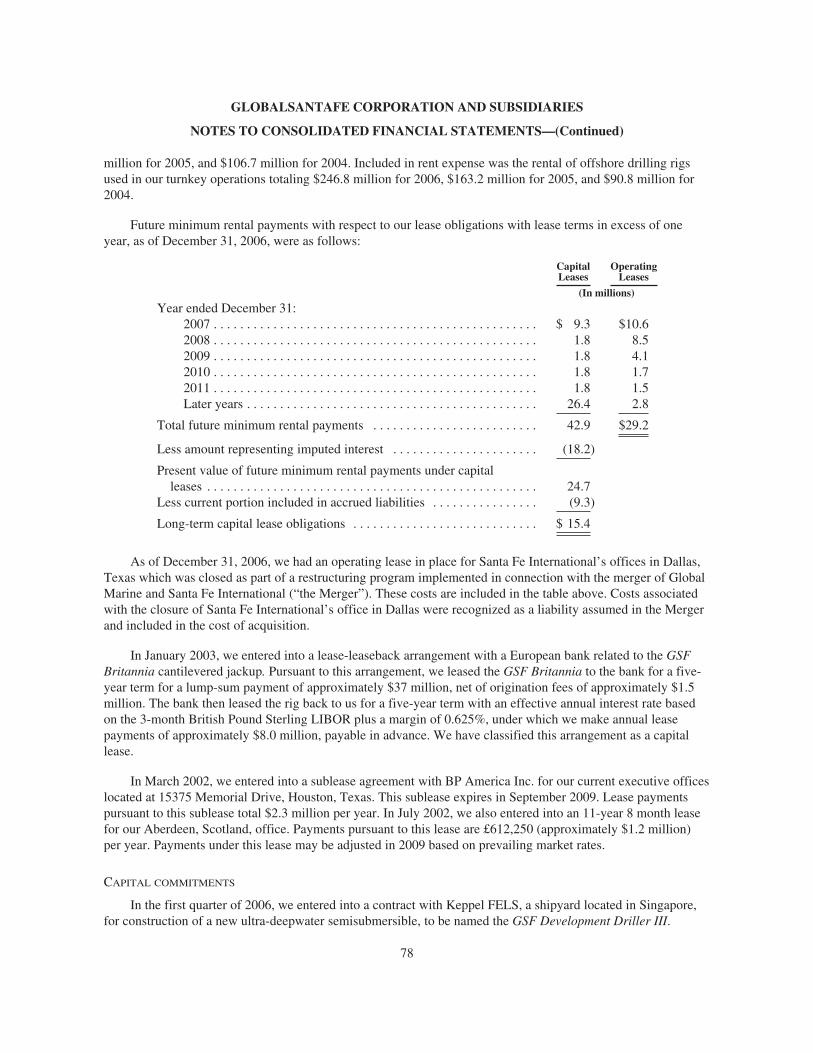
GLOBALSANTAFE CORPORATION AND SUBSIDIARIES
NOTES TO CONSOLIDATED FINANCIAL STATEMENTS—(Continued)
million for 2005, and $106.7 million for 2004. Included in rent expense was the rental of offshore drilling rigsused in our turnkey operations totaling $246.8 million for 2006, $163.2 million for 2005, and $90.8 million for2004.
Future minimum rental payments with respect to our lease obligations with lease terms in excess of oneyear, as of December 31, 2006, were as follows:
CapitalLeases
OperatingLeases
(In millions)
Year ended December 31:2007 . . . . . . . . . . . . . . . . . . . . . . . . . . . . . . . . . . . . . . . . . . . . . . . . . $ 9.3 $10.62008 . . . . . . . . . . . . . . . . . . . . . . . . . . . . . . . . . . . . . . . . . . . . . . . . . 1.8 8.52009 . . . . . . . . . . . . . . . . . . . . . . . . . . . . . . . . . . . . . . . . . . . . . . . . . 1.8 4.12010 . . . . . . . . . . . . . . . . . . . . . . . . . . . . . . . . . . . . . . . . . . . . . . . . . 1.8 1.72011 . . . . . . . . . . . . . . . . . . . . . . . . . . . . . . . . . . . . . . . . . . . . . . . . . 1.8 1.5Later years . . . . . . . . . . . . . . . . . . . . . . . . . . . . . . . . . . . . . . . . . . . . 26.4 2.8
Total future minimum rental payments . . . . . . . . . . . . . . . . . . . . . . . . . 42.9 $29.2
Less amount representing imputed interest . . . . . . . . . . . . . . . . . . . . . . (18.2)
Present value of future minimum rental payments under capitalleases . . . . . . . . . . . . . . . . . . . . . . . . . . . . . . . . . . . . . . . . . . . . . . . . . . 24.7
Less current portion included in accrued liabilities . . . . . . . . . . . . . . . . (9.3)
Long-term capital lease obligations . . . . . . . . . . . . . . . . . . . . . . . . . . . . $ 15.4
As of December 31, 2006, we had an operating lease in place for Santa Fe International’s offices in Dallas,Texas which was closed as part of a restructuring program implemented in connection with the merger of GlobalMarine and Santa Fe International (“the Merger”). These costs are included in the table above. Costs associatedwith the closure of Santa Fe International’s office in Dallas were recognized as a liability assumed in the Mergerand included in the cost of acquisition.
In January 2003, we entered into a lease-leaseback arrangement with a European bank related to the GSFBritannia cantilevered jackup. Pursuant to this arrangement, we leased the GSF Britannia to the bank for a five-year term for a lump-sum payment of approximately $37 million, net of origination fees of approximately $1.5million. The bank then leased the rig back to us for a five-year term with an effective annual interest rate basedon the 3-month British Pound Sterling LIBOR plus a margin of 0.625%, under which we make annual leasepayments of approximately $8.0 million, payable in advance. We have classified this arrangement as a capitallease.
In March 2002, we entered into a sublease agreement with BP America Inc. for our current executive officeslocated at 15375 Memorial Drive, Houston, Texas. This sublease expires in September 2009. Lease paymentspursuant to this sublease total $2.3 million per year. In July 2002, we also entered into an 11-year 8 month leasefor our Aberdeen, Scotland, office. Payments pursuant to this lease are £612,250 (approximately $1.2 million)per year. Payments under this lease may be adjusted in 2009 based on prevailing market rates.
CAPITAL COMMITMENTS
In the first quarter of 2006, we entered into a contract with Keppel FELS, a shipyard located in Singapore,for construction of a new ultra-deepwater semisubmersible, to be named the GSF Development Driller III.
78
GLOBALSANTAFE CORPORATION AND SUBSIDIARIES
NOTES TO CONSOLIDATED FINANCIAL STATEMENTS—(Continued)
Construction costs for the GSF Development Driller III are expected to total approximately $590 million,excluding capital spares, startup costs, capitalized interest, customer-required modifications and mobilizationcosts. We have incurred a total of approximately $220 million of capitalized costs related to the GSFDevelopment Driller III, excluding capitalized interest, as of December 31, 2006.
During the second quarter of 2005, we discovered a defect and resulting damage in the thruster nozzles onour two new ultra-deepwater semisubmersibles, the GSF Development Driller I and GSF Development Driller II.Both rigs were being remediated for the thruster defect and resulting damage when they sustained additionaldamage as a result of Hurricane Katrina. This additional damage further delayed the start of the initial drillingcontracts for the GSF Development Driller I and the GSF Development Driller II. Remediations of the GSFDevelopment Driller II were completed and the rig went on contract in November 2005. The thruster defect anddamage from Hurricane Katrina further delayed the start of the initial drilling contract for the GSF DevelopmentDriller I until June 2006.
We have made claims under our hull and machinery and loss of hire insurance for the GSF DevelopmentDriller I and GSF Development Driller II for the periods required to remediate the damage arising from both thethruster defect and Hurricane Katrina. Under our loss of hire insurance, we are entitled to reimbursement for ourfull dayrate for up to 270 days after a 60-day waiting period. Significant unresolved issues remain as to theproper application of the loss of hire waiting period, which could lead to substantial differences in the amount ofthe loss of hire recovery. The underwriters have formally reserved their rights to decline coverage for the thrusterdamage claims on the rigs in respect of both the hull and machinery and loss of hire coverage. As ofDecember 31, 2006, we have recorded estimated loss of hire insurance recoveries equal to $25.4 million ($3.8million in 2005 and $21.6 million in 2006) with respect to the GSF Development Driller I, which is the amountwe deem to be probable under the assumption that the rig will bear two consecutive 60-day waiting periods, onefor the thruster damage claim and one for the hurricane damage claim. The GSF Development Driller II was notout of service longer than the combined 120-day waiting period and therefore no loss of hire recoveries havebeen recorded for this rig. When the loss of hire claims are resolved with the underwriters, the amount of loss ofhire recoveries could be different than the amount currently recorded.
LEGAL PROCEEDINGS
In August 2004, certain of our subsidiaries were named as defendants in six lawsuits filed in Mississippi,five of which are pending in the Circuit Court of Jones County and one of which is pending in the Circuit Courtof Jasper County, Mississippi, alleging that certain individuals aboard our offshore drilling rigs had been exposedto asbestos. These six lawsuits are part of a group of twenty-three lawsuits filed on behalf of approximately 800plaintiffs against a large number of defendants, most of which are not affiliated with us. Our subsidiaries havenot been named as defendants in any of the other seventeen lawsuits. The lawsuits assert claims based on theoriesof unseaworthiness, negligence, strict liability and our subsidiaries’ status as Jones Act employers; and seekunspecified compensatory and punitive damages. In general, the defendants are alleged to have manufactured,distributed or utilized products containing asbestos. In the case of our named subsidiaries and that of severalother offshore drilling companies named as defendants, the lawsuits allege those defendants allowed suchproducts to be utilized aboard offshore drilling rigs. We have not been provided with sufficient information todetermine the number of plaintiffs who claim to have been exposed to asbestos aboard our rigs, whether theywere employees nor their period of employment, the period of their alleged exposure to asbestos, nor theirmedical condition. Accordingly, we are unable to estimate our potential exposure to these lawsuits. Wehistorically have maintained insurance which we believe will be available to address any liability arising fromthese claims. We intend to defend these lawsuits vigorously, but there can be no assurance as to their ultimateoutcome.
79
GLOBALSANTAFE CORPORATION AND SUBSIDIARIES
NOTES TO CONSOLIDATED FINANCIAL STATEMENTS—(Continued)
We and two of our subsidiaries were defendants in a lawsuit filed on July 28, 2003, by Transocean Inc.(“Transocean”) in the United States District Court for the Southern District of Texas, Houston Division. Thelawsuit alleged that the dual drilling structure and method utilized by the GSF Development Driller I and theGSF Development Driller II semisubmersibles infringe on United States patents granted to Transocean. OnAugust 31, 2006, the jury returned a verdict upholding the validity of certain of the Transocean apparatus claims,awarding past damages of approximately $3.6 million, and finding that we had willfully infringed the patents.The judge subsequently entered a ruling overturning the jury’s finding of willful infringement. Transocean hassimilar patents in most other jurisdictions in which ultra-deepwater semisubmersibles are likely to operate,excluding certain parts of West Africa. It also has patents in Singapore, where the GSF Development Driller Iand GSF Development Driller II were constructed and where the similarly designed GSF Development Driller IIIis being constructed, and in most other jurisdictions in which dual activity rigs are likely to be constructed. Wehad joined with other parties in proceedings in Europe and Brazil contesting the issuance of patents toTransocean for dual activity methods and structures. The patents that Transocean obtained in those jurisdictionswere substantially the same as those granted in the U.S. and Singapore. In June 2006, the European Patent Officeinvalidated the patent claims that were the subject of the proceedings, and the Brazilian Patent Office hasrecently entered a preliminary ruling invalidating the patents in that jurisdiction.
We entered into a settlement agreement with Transocean, effective February 14, 2007, in which we weregranted a personal, worldwide, royalty bearing and non-exclusive license to operate dual activity rigs under theTransocean patents. The primary terms of the settlement are as follows:
• We will pay approximately $3,000,000 to Transocean for the past use of dual activity by the GSFDevelopment Driller I and GSF Development Driller II;
• At any time we operate in a jurisdiction in which Transocean has a valid, non-expired patent for dualactivity, we will pay a royalty of 3% of the basic dayrate of the GSF Development Driller I, GSFDevelopment Driller II and GSF Development Driller III, or 5% of the basic dayrate of any dual activityrigs that we hereafter acquire or construct. The Transocean patents are set to expire in 2016;
• We will pay $12,000,000 to Transocean on behalf of ourselves and the shipyards that constructed theGSF Development Driller I and GSF Development Driller II, and the shipyard that is currentlyconstructing the GSF Development Driller III and we and the shipyards will be relieved of any liabilityfor the alleged infringement arising from the construction of those rigs; and
• We will withdraw from the proceedings opposing the issuance of patents in Europe and Brazil, and wehave agreed not to challenge the validity of the Transocean patents in any jurisdiction.
One of our subsidiaries filed suit in February 2004 against its insurance underwriters in the Superior Courtof San Francisco County, California, seeking a declaration as to its rights to insurance coverage and the properallocation among its insurers of liability for claims payments in order to assist in the future management anddisposition of certain claims described below. The subsidiary’s three primary insurers have historically beenpaying settlement and defense costs for the subsidiary. One of these insurers was nearing insolvency and claimedexhaustion of its coverage limits, but following negotiations has agreed to make a cash payment in exchange fora release of all further liability for the subsidiary’s asbestos liabilities. Both of the subsidiary’s other primaryinsurers have entered into settlement agreements with the subsidiary that will provide for limited additionalfunding of asbestos liabilities and attorneys’ fees and costs associated therewith. The subsidiary also intends toenter into discussions with its excess insurers. We believe that the subsidiary will continue to have funds from itsinsurers sufficient to meet its settlement and defense obligations for the foreseeable future.
The insurance coverage in question relates to lawsuits filed against the subsidiary arising out of itsinvolvement in the design, construction and refurbishment of major industrial complexes. The operating assets of
80
GLOBALSANTAFE CORPORATION AND SUBSIDIARIES
NOTES TO CONSOLIDATED FINANCIAL STATEMENTS—(Continued)
the subsidiary were sold and its operations discontinued in 1989, and the subsidiary has no remaining assets otherthan the insurance policies involved in the litigation and funds received from the cancellation of certain insurancepolicies. The subsidiary has been named as a defendant, along with numerous other companies, in lawsuitsalleging personal injury as a result of exposure to asbestos. As of January 1, 2007, the subsidiary had been namedas a defendant in approximately 4,200 lawsuits, the first of which was filed in 1990, and a substantial number ofwhich are currently pending. We believe that as of January 1, 2007, from $35 million to $40 million had beenexpended to resolve claims (including both attorney fees and expenses, and settlement costs), with the subsidiaryhaving expended $4 million of that amount due to insurance deductible obligations, all of which have now beensatisfied. Because we rely on information from the insurers of our subsidiary for information regarding theamounts expended in settlement and defense of these lawsuits and are not able to verify or confirm theinformation, the amount expended by the insurers is not known with precision. The subsidiary continues to benamed as a defendant in additional lawsuits and we cannot predict the number of additional cases in which it maybe named a defendant nor can we predict the potential costs to resolve such additional cases or to resolve thepending cases. However, the subsidiary has in excess of $1 billion in insurance limits. Although not all of thatwill be available due to the insolvency of certain insurers, we believe that the subsidiary will have sufficientinsurance available to respond to these claims. We do not believe that these claims will have a material impact onour consolidated financial position, results of operations or cash flows.
The same subsidiary is a defendant in a lawsuit filed against it by Union Oil Company of California(“Union”) in the Circuit Court of Cook County, Illinois. That lawsuit arises out of claims alleging personal injurycaused by exposure to asbestos at a refinery owned by Union and constructed by our subsidiary. Union hasalleged that the subsidiary is required to defend and indemnify it pursuant to the terms of contracts entered intofor the construction of the refinery. GlobalSantaFe Corporation has also been named as a defendant in thepending litigation. Union intends to attempt to establish liability against GlobalSantaFe Corporation as the alterego of, and successor in interest to, its subsidiary and on the basis of a fraudulent conveyance of the subsidiary’sassets, and seeks to pierce the corporate veil between the subsidiary and GlobalSantaFe Corporation. We believethat the allegations of the lawsuit are without merit and intend to vigorously defend against the lawsuit, butcannot provide any assurance as to its ultimate outcome.
We and a number of our subsidiaries were named as defendants in two lawsuits claiming that the GSFAdriatic VII caused damage to a platform in the South Marsh Island area of the Gulf of Mexico when the rigbroke free from its location during Hurricane Rita. On September 20, 2006, Devon Energy Corporation and PogoProducing Company filed suit in the United States District Court for the Southern District of Texas, HoustonDivision, claiming that the defendants caused damage in an amount exceeding $75 million. On the same dayApache Corporation, as successor in interest to BP p.l.c., filed suit against the defendants in the United StatesDistrict Court for the Western District of Louisiana, Lafayette Division, claiming damage in an unspecifiedamount. We have not been presented with evidence indicating that the GSF Adriatic VII caused the damage, ifany, claimed by plaintiffs. In any event, we believe that we will be entitled to the benefits of the Act of Goddefense. Any liability arising therefrom, including legal fees and expenses, will be paid by our insuranceunderwriters.
We and our subsidiaries are defendants or otherwise involved in a number of lawsuits in the ordinary courseof business. In the opinion of management, our ultimate liability with respect to these pending lawsuits is notexpected to have a material adverse effect on our consolidated financial position, results of operations or cashflows.
81
GLOBALSANTAFE CORPORATION AND SUBSIDIARIES
NOTES TO CONSOLIDATED FINANCIAL STATEMENTS—(Continued)
ENVIRONMENTAL MATTERS
We have certain potential liabilities under the Comprehensive Environmental Response, Compensation andLiability Act (“CERCLA”) and similar state acts regulating cleanup of various hazardous waste disposal sites,including those described below. CERCLA is intended to expedite the remediation of hazardous substanceswithout regard to fault. Potentially responsible parties (“PRPs”) for each site include present and former ownersand operators of, transporters to and generators of the substances at the site. Liability is strict and can be joint andseveral.
We have been named as a PRP in connection with a site located in Santa Fe Springs, California, known asthe Waste Disposal, Inc. site. We and other PRPs have agreed with the U.S. Environmental Protection Agency(“EPA”) and the U.S. Department of Justice (“DOJ”) to settle our potential liabilities for this site by agreeing toperform the remaining remediation required by the EPA. The form of the agreement is a consent decree, whichhas now been entered by the court. The parties to the settlement have entered into a participation agreement,which makes us liable for approximately 8% of the remediation and related costs. The remediation is complete,but our share of the future operation and maintenance costs of the site is estimated to have a present value ofapproximately $900,000. There are additional potential liabilities related to the site, but these cannot bequantified, and we have no reason at this time to believe that they will be material.
We have also been named as a PRP in connection with a site in California known as the Casmalia ResourcesSite. We and other PRPs have entered into an agreement with the EPA and the DOJ to resolve potentialliabilities. Under the settlement, we are not likely to owe any substantial additional amounts for this site beyondwhat we have already paid. There are additional potential liabilities related to this site, but these cannot bequantified at this time, and we have no reason at this time to believe that they will be material.
We have been named as one of many PRPs in connection with a site located in Carson, California, formerlymaintained by Cal Compact Landfill. On February 15, 2002, we were served with a required 90-day notificationthat eight California cities, on behalf of themselves and other PRPs, intend to commence an action against usunder the Resource Conservation and Recovery Act (“RCRA”). On April 1, 2002, a complaint was filed by thecities against us and others alleging that we have liabilities in connection with the site. However, the complainthas not been served. The site was closed in or around 1965, and we do not have sufficient information to enableus to assess our potential liability, if any, for this site.
One of our subsidiaries has recently been ordered by the California Regional Water Quality Control Boardto develop a testing plan for a site known as Campus 1000 Fremont in Alhambra, California. This site wasformerly owned and operated by certain of our subsidiaries. It is presently owned by an unrelated party, whichhas also received an order to develop a testing plan for the property. Although the testing plan has not yet beendeveloped and approved, testing costs are expected to be in the range of $200,000. We have also been advisedthat another subsidiary is likely to be named by the EPA as a PRP for the San Gabriel Valley, Area 3, Superfundsite, which includes this property. We have no knowledge at this time of the potential cost of any remediation,who else will be named as PRPs, and whether in fact any of our subsidiaries is a liable party. The subsidiaries inquestion do not own any operating assets and have limited ability to respond to any liabilities.
Resolutions of other claims by the EPA, the involved state agency and/or PRPs are at various stages ofinvestigation. These investigations involve determinations of:
• the actual responsibility attributed to us and the other PRPs at the site;
• appropriate investigatory and/or remedial actions; and
82
GLOBALSANTAFE CORPORATION AND SUBSIDIARIES
NOTES TO CONSOLIDATED FINANCIAL STATEMENTS—(Continued)
• allocation of the costs of such activities among the PRPs and other site users.
Our ultimate financial responsibility in connection with those sites may depend on many factors, including:
• the volume and nature of material, if any, contributed to the site for which we are responsible;
• the numbers of other PRPs and their financial viability; and
• the remediation methods and technology to be used.
It is difficult to quantify with certainty the potential cost of these environmental matters, particularly inrespect of remediation obligations. Nevertheless, based upon the information currently available, we believe thatour ultimate liability arising from all environmental matters, including the liability for all other related pendinglegal proceedings, asserted legal claims and known potential legal claims which are likely to be asserted, isadequately accrued and should not have a material effect on our financial position or ongoing results ofoperations. Estimated costs of future expenditures for environmental remediation obligations are not discountedto their present value.
On July 11, 2005, one of our subsidiaries, Santa Fe Minerals, Inc., was served with a lawsuit filed on behalfof three landowners in Louisiana in the 12th Judicial District Court for the Parish of Avoyelles, State ofLouisiana. The lawsuit names nineteen other defendants, all of which are alleged to have contaminated theplaintiffs’ property with naturally occurring radioactive material, produced water, drilling fluids, chlorides,hydrocarbons, heavy metals and other contaminants as a result of oil and gas exploration activities. The lawsuitspecifies 95 wells drilled on the property in question beginning in 1939, and alleges that our subsidiary, which isa dissolved corporation and no longer conducts operations or holds assets, was the operator or non-operatingpartner in 13 of the wells during certain periods of time. The plaintiffs allege that the defendants are liable on thebasis of strict liability, breach of contract, breach of the mineral leases, negligence, nuisance, trespass, andimproper handling of toxic or hazardous substances, that their storage and disposal of toxic and hazardoussubstances constituted an ultra-hazardous activity, and that they violated various state statutes. The lawsuit seeksunspecified amounts of compensatory and punitive damages, payment of funds sufficient to conduct anenvironmental assessment of the property in question, damages for diminution of property value and injunctiverelief requiring that defendants restore the property to its prior condition and prevent the migration of toxic andhazardous substances. Experts retained by the plaintiffs have issued a report suggesting significant contaminationin the area operated by the subsidiary and another codefendant, and claiming that over $300 million will berequired to properly remediate the contamination. The experts retained by the defendants conducted their owninvestigation and concluded that the remediation costs will amount to no more than a few million dollars. TheLouisiana Department of Environmental Quality is in the process of conducting its own investigation in thatregard. We believe that our subsidiary has meritorious defenses to the allegations contained in the lawsuit, andthat if liability is established against it that the judgment will be far lower than that being demanded by theplaintiffs. The plaintiffs and the codefendant threatened to add GlobalSantaFe Corporation as a defendant in thelawsuit under the “single business enterprise” doctrine contained in Louisiana law. The single business enterprisedoctrine is an equitable construct created and applied by the judiciary to impose liability against the parentcompany or a different subsidiary or affiliated companies where more than one company represents precisely thesame single interests. The single business enterprise doctrine is similar to corporate veil piercing doctrines. OnAugust 16, 2006, Santa Fe Minerals, Inc. and its immediate parent company, 15375 Memorial Corporation,which is also an entity that no longer conducts operations or holds assets, filed voluntary petitions for relief underChapter 11 of the U.S. Bankruptcy Code in the United States Bankruptcy Court for the District of Delaware.Later that day, the plaintiffs dismissed Santa Fe Minerals, Inc. from the lawsuit. Subsequently, the codefendantfiled various motions in the lawsuit and in the Delaware bankruptcies attempting to assert alter ego and singlebusiness enterprise claims against GlobalSantaFe Corporation and two other subsidiaries in the lawsuit. We
83
GLOBALSANTAFE CORPORATION AND SUBSIDIARIES
NOTES TO CONSOLIDATED FINANCIAL STATEMENTS—(Continued)
believe that these legal theories should not be applied against GlobalSantaFe Corporation or these other twosubsidiaries, and that in any event the manner in which the parent and its subsidiaries conducted their businessesdoes not meet the requirements of these theories for imposition of liability. The codefendant also seeks to dismissthe bankruptcies. To date, the efforts to assert alter ego and single business enterprise theory claims againstGlobalSantaFe Corporation have been rejected by the Court in Avoyelles Parish and we have filed an action withthe Delaware Court asking that any such claims be heard there. We intend to continue to vigorously defendagainst any action taken in an attempt to impose liability against us under these theories or otherwise.
CONTINGENCIES AND OTHER LEGAL MATTERS
In 1998, we entered into fixed-price contracts for the construction of two dynamically positioned, ultra-deepwater drillships, the GSF C.R. Luigs and the GSF Jack Ryan, which began operating in April and December2000, respectively. Pursuant to two 20-year capital lease agreements, we subsequently novated the constructioncontracts for the drillships to two financial institutions (the “Lessors”), which owned the drillships and leasedthem to us. We deposited with three large foreign banks (the “Payment Banks”) amounts equal to the progresspayments that the Lessors were required to make under the construction contracts, less a lease benefit ofapproximately $62 million (the “Defeasance Payment”). In exchange for the deposits, the Payment Banksassumed liability for making rental payments required under the leases and the Lessors legally released us as theprimary obligor of such rental payments. Accordingly, we recorded no capital lease obligations on our balancesheet with respect to the two drillships.
In October 2005, we provided consent to the sale of the Lessor of the GSF C.R. Luigs from one large foreignbank to another. In exchange for our consent, we became entitled to receive consideration, which would equalany sum we were obligated to pay on our termination of the lease, if we exercised our right to terminate the leasebetween March 1, 2006 and December 31, 2006. In June 2006, we terminated the lease on the GSF C.R. Luigsand purchased the vessel. In addition to receiving the consideration equal to the sum we were obligated to pay ontermination of the lease, we received, as a rebate of rentals, an amount equal to the sales price paid by us and arefund of a $0.8 million interest payment we were required to make in March 2006 related to interest rate risk inconnection with this lease. Accordingly, we decreased the carrying value of the rig by the $0.8 million. Otherthan the $0.8 million decrease, there was no other impact to the carrying value of the rig. We now have title tothe rig and no longer bear any interest rate risk associated with this lease.
We continue to have interest rate risk in connection with the fully defeased financing lease for the GSF JackRyan. The Defeasance Payment earns interest based on the British Pound Sterling three-month LIBOR, whichapproximated 8.00% at the time of the agreement. Should the Defeasance Payment earn less than the assumed8.00% rate of interest, we will be required to make additional payments as necessary to augment the annualpayments made by the Payment Banks pursuant to the agreements. If the December 31, 2006, LIBOR rate of5.3% were to continue over the next six years, we would be required to fund an additional estimated $17.3million for the GSF Jack Ryan during that period. Any additional payments made by us pursuant to the financinglease would increase the carrying value of our leasehold interest in the GSF Jack Ryan and therefore be reflectedin higher depreciation expense over its then-remaining useful life. We do not expect that, if required, anyadditional payments made under this lease would be material to our financial position, results of operations orcash flows in any given year.
We and our subsidiaries are defendants or otherwise involved in a number of lawsuits in the ordinary courseof business. In the opinion of management, our ultimate liability with respect to these pending lawsuits is notexpected to have a material adverse effect on our consolidated financial position, results of operations or cashflows.
84
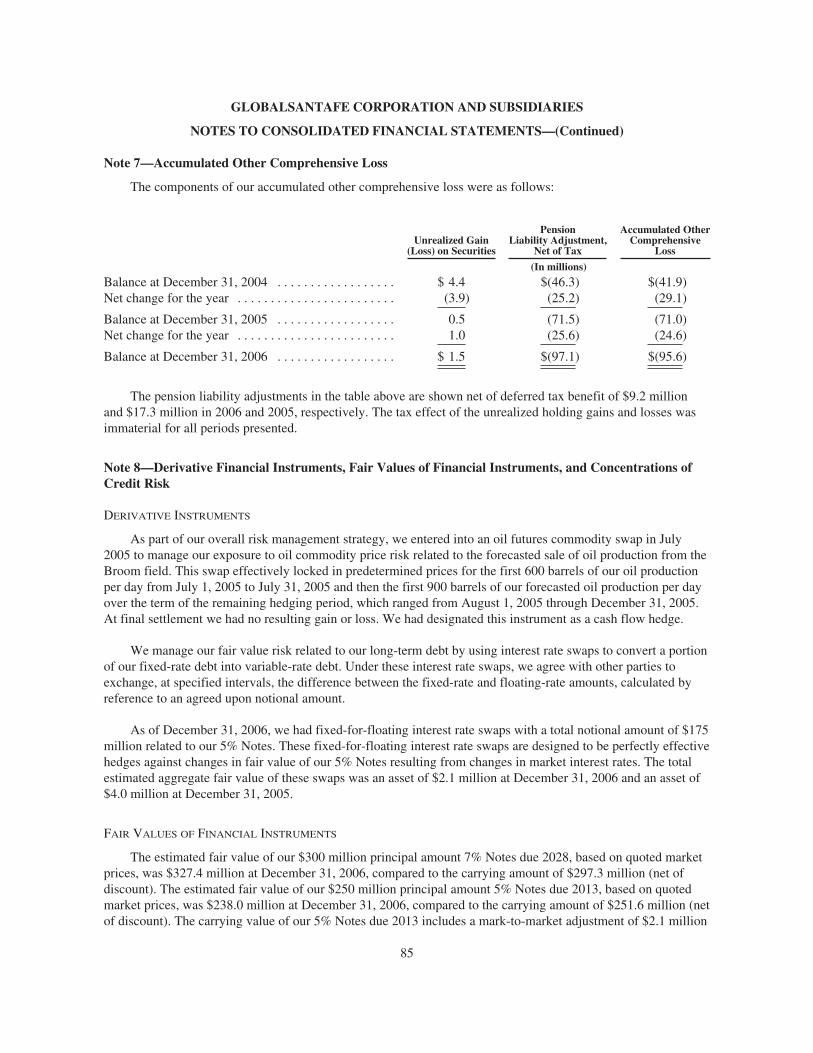
GLOBALSANTAFE CORPORATION AND SUBSIDIARIES
NOTES TO CONSOLIDATED FINANCIAL STATEMENTS—(Continued)
Note 7—Accumulated Other Comprehensive Loss
The components of our accumulated other comprehensive loss were as follows:
Unrealized Gain(Loss) on Securities
PensionLiability Adjustment,
Net of Tax
Accumulated OtherComprehensive
Loss
(In millions)
Balance at December 31, 2004 . . . . . . . . . . . . . . . . . . $ 4.4 $(46.3) $(41.9)Net change for the year . . . . . . . . . . . . . . . . . . . . . . . . (3.9) (25.2) (29.1)
Balance at December 31, 2005 . . . . . . . . . . . . . . . . . . 0.5 (71.5) (71.0)Net change for the year . . . . . . . . . . . . . . . . . . . . . . . . 1.0 (25.6) (24.6)
Balance at December 31, 2006 . . . . . . . . . . . . . . . . . . $ 1.5 $(97.1) $(95.6)
The pension liability adjustments in the table above are shown net of deferred tax benefit of $9.2 millionand $17.3 million in 2006 and 2005, respectively. The tax effect of the unrealized holding gains and losses wasimmaterial for all periods presented.
Note 8—Derivative Financial Instruments, Fair Values of Financial Instruments, and Concentrations ofCredit Risk
DERIVATIVE INSTRUMENTS
As part of our overall risk management strategy, we entered into an oil futures commodity swap in July2005 to manage our exposure to oil commodity price risk related to the forecasted sale of oil production from theBroom field. This swap effectively locked in predetermined prices for the first 600 barrels of our oil productionper day from July 1, 2005 to July 31, 2005 and then the first 900 barrels of our forecasted oil production per dayover the term of the remaining hedging period, which ranged from August 1, 2005 through December 31, 2005.At final settlement we had no resulting gain or loss. We had designated this instrument as a cash flow hedge.
We manage our fair value risk related to our long-term debt by using interest rate swaps to convert a portionof our fixed-rate debt into variable-rate debt. Under these interest rate swaps, we agree with other parties toexchange, at specified intervals, the difference between the fixed-rate and floating-rate amounts, calculated byreference to an agreed upon notional amount.
As of December 31, 2006, we had fixed-for-floating interest rate swaps with a total notional amount of $175million related to our 5% Notes. These fixed-for-floating interest rate swaps are designed to be perfectly effectivehedges against changes in fair value of our 5% Notes resulting from changes in market interest rates. The totalestimated aggregate fair value of these swaps was an asset of $2.1 million at December 31, 2006 and an asset of$4.0 million at December 31, 2005.
FAIR VALUES OF FINANCIAL INSTRUMENTS
The estimated fair value of our $300 million principal amount 7% Notes due 2028, based on quoted marketprices, was $327.4 million at December 31, 2006, compared to the carrying amount of $297.3 million (net ofdiscount). The estimated fair value of our $250 million principal amount 5% Notes due 2013, based on quotedmarket prices, was $238.0 million at December 31, 2006, compared to the carrying amount of $251.6 million (netof discount). The carrying value of our 5% Notes due 2013 includes a mark-to-market adjustment of $2.1 million
85
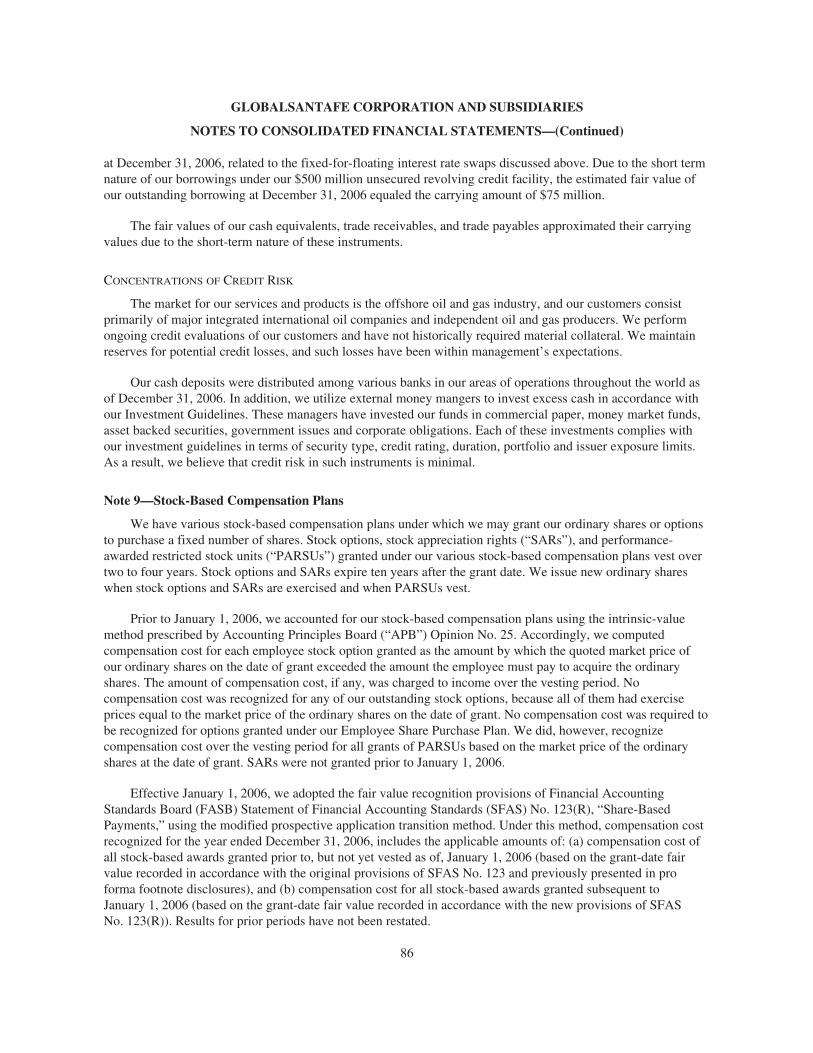
GLOBALSANTAFE CORPORATION AND SUBSIDIARIES
NOTES TO CONSOLIDATED FINANCIAL STATEMENTS—(Continued)
at December 31, 2006, related to the fixed-for-floating interest rate swaps discussed above. Due to the short termnature of our borrowings under our $500 million unsecured revolving credit facility, the estimated fair value ofour outstanding borrowing at December 31, 2006 equaled the carrying amount of $75 million.
The fair values of our cash equivalents, trade receivables, and trade payables approximated their carryingvalues due to the short-term nature of these instruments.
CONCENTRATIONS OF CREDIT RISK
The market for our services and products is the offshore oil and gas industry, and our customers consistprimarily of major integrated international oil companies and independent oil and gas producers. We performongoing credit evaluations of our customers and have not historically required material collateral. We maintainreserves for potential credit losses, and such losses have been within management’s expectations.
Our cash deposits were distributed among various banks in our areas of operations throughout the world asof December 31, 2006. In addition, we utilize external money mangers to invest excess cash in accordance withour Investment Guidelines. These managers have invested our funds in commercial paper, money market funds,asset backed securities, government issues and corporate obligations. Each of these investments complies withour investment guidelines in terms of security type, credit rating, duration, portfolio and issuer exposure limits.As a result, we believe that credit risk in such instruments is minimal.
Note 9—Stock-Based Compensation Plans
We have various stock-based compensation plans under which we may grant our ordinary shares or optionsto purchase a fixed number of shares. Stock options, stock appreciation rights (“SARs”), and performance-awarded restricted stock units (“PARSUs”) granted under our various stock-based compensation plans vest overtwo to four years. Stock options and SARs expire ten years after the grant date. We issue new ordinary shareswhen stock options and SARs are exercised and when PARSUs vest.
Prior to January 1, 2006, we accounted for our stock-based compensation plans using the intrinsic-valuemethod prescribed by Accounting Principles Board (“APB”) Opinion No. 25. Accordingly, we computedcompensation cost for each employee stock option granted as the amount by which the quoted market price ofour ordinary shares on the date of grant exceeded the amount the employee must pay to acquire the ordinaryshares. The amount of compensation cost, if any, was charged to income over the vesting period. Nocompensation cost was recognized for any of our outstanding stock options, because all of them had exerciseprices equal to the market price of the ordinary shares on the date of grant. No compensation cost was required tobe recognized for options granted under our Employee Share Purchase Plan. We did, however, recognizecompensation cost over the vesting period for all grants of PARSUs based on the market price of the ordinaryshares at the date of grant. SARs were not granted prior to January 1, 2006.
Effective January 1, 2006, we adopted the fair value recognition provisions of Financial AccountingStandards Board (FASB) Statement of Financial Accounting Standards (SFAS) No. 123(R), “Share-BasedPayments,” using the modified prospective application transition method. Under this method, compensation costrecognized for the year ended December 31, 2006, includes the applicable amounts of: (a) compensation cost ofall stock-based awards granted prior to, but not yet vested as of, January 1, 2006 (based on the grant-date fairvalue recorded in accordance with the original provisions of SFAS No. 123 and previously presented in proforma footnote disclosures), and (b) compensation cost for all stock-based awards granted subsequent toJanuary 1, 2006 (based on the grant-date fair value recorded in accordance with the new provisions of SFASNo. 123(R)). Results for prior periods have not been restated.
86
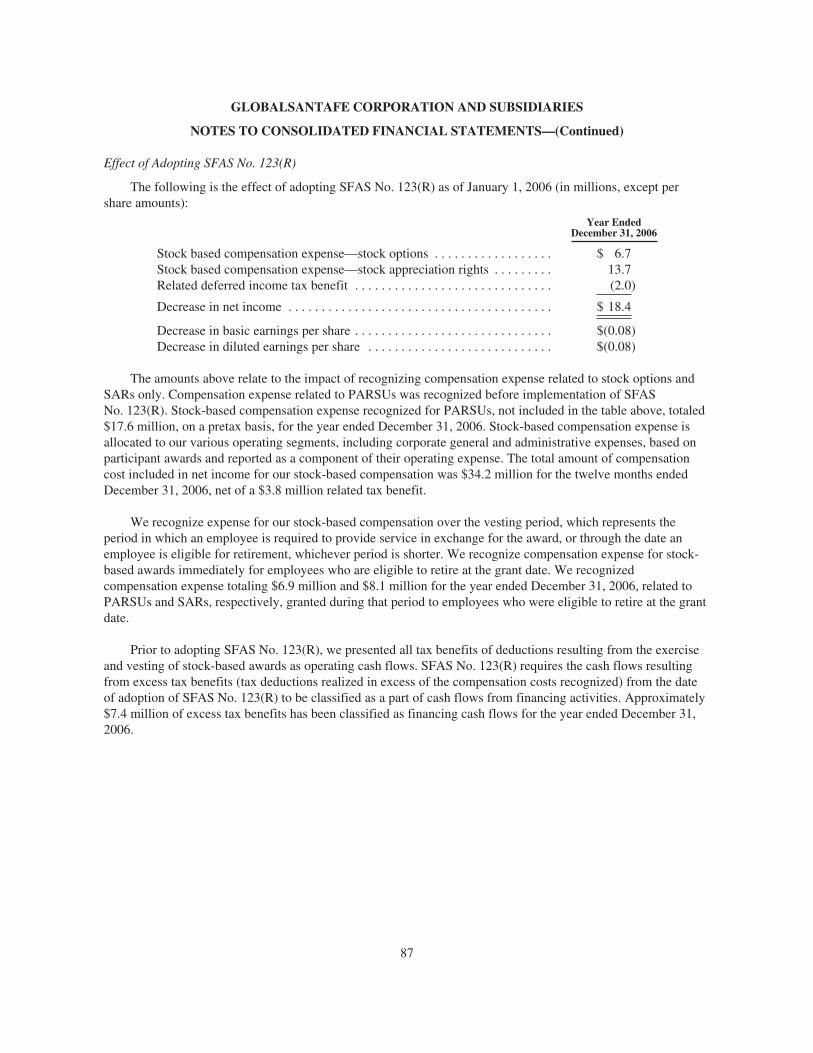
GLOBALSANTAFE CORPORATION AND SUBSIDIARIES
NOTES TO CONSOLIDATED FINANCIAL STATEMENTS—(Continued)
Effect of Adopting SFAS No. 123(R)
The following is the effect of adopting SFAS No. 123(R) as of January 1, 2006 (in millions, except pershare amounts):
Year EndedDecember 31, 2006
Stock based compensation expense—stock options . . . . . . . . . . . . . . . . . . $ 6.7Stock based compensation expense—stock appreciation rights . . . . . . . . . 13.7Related deferred income tax benefit . . . . . . . . . . . . . . . . . . . . . . . . . . . . . . (2.0)
Decrease in net income . . . . . . . . . . . . . . . . . . . . . . . . . . . . . . . . . . . . . . . . $ 18.4
Decrease in basic earnings per share . . . . . . . . . . . . . . . . . . . . . . . . . . . . . . $(0.08)Decrease in diluted earnings per share . . . . . . . . . . . . . . . . . . . . . . . . . . . . $(0.08)
The amounts above relate to the impact of recognizing compensation expense related to stock options andSARs only. Compensation expense related to PARSUs was recognized before implementation of SFASNo. 123(R). Stock-based compensation expense recognized for PARSUs, not included in the table above, totaled$17.6 million, on a pretax basis, for the year ended December 31, 2006. Stock-based compensation expense isallocated to our various operating segments, including corporate general and administrative expenses, based onparticipant awards and reported as a component of their operating expense. The total amount of compensationcost included in net income for our stock-based compensation was $34.2 million for the twelve months endedDecember 31, 2006, net of a $3.8 million related tax benefit.
We recognize expense for our stock-based compensation over the vesting period, which represents theperiod in which an employee is required to provide service in exchange for the award, or through the date anemployee is eligible for retirement, whichever period is shorter. We recognize compensation expense for stock-based awards immediately for employees who are eligible to retire at the grant date. We recognizedcompensation expense totaling $6.9 million and $8.1 million for the year ended December 31, 2006, related toPARSUs and SARs, respectively, granted during that period to employees who were eligible to retire at the grantdate.
Prior to adopting SFAS No. 123(R), we presented all tax benefits of deductions resulting from the exerciseand vesting of stock-based awards as operating cash flows. SFAS No. 123(R) requires the cash flows resultingfrom excess tax benefits (tax deductions realized in excess of the compensation costs recognized) from the dateof adoption of SFAS No. 123(R) to be classified as a part of cash flows from financing activities. Approximately$7.4 million of excess tax benefits has been classified as financing cash flows for the year ended December 31,2006.
87
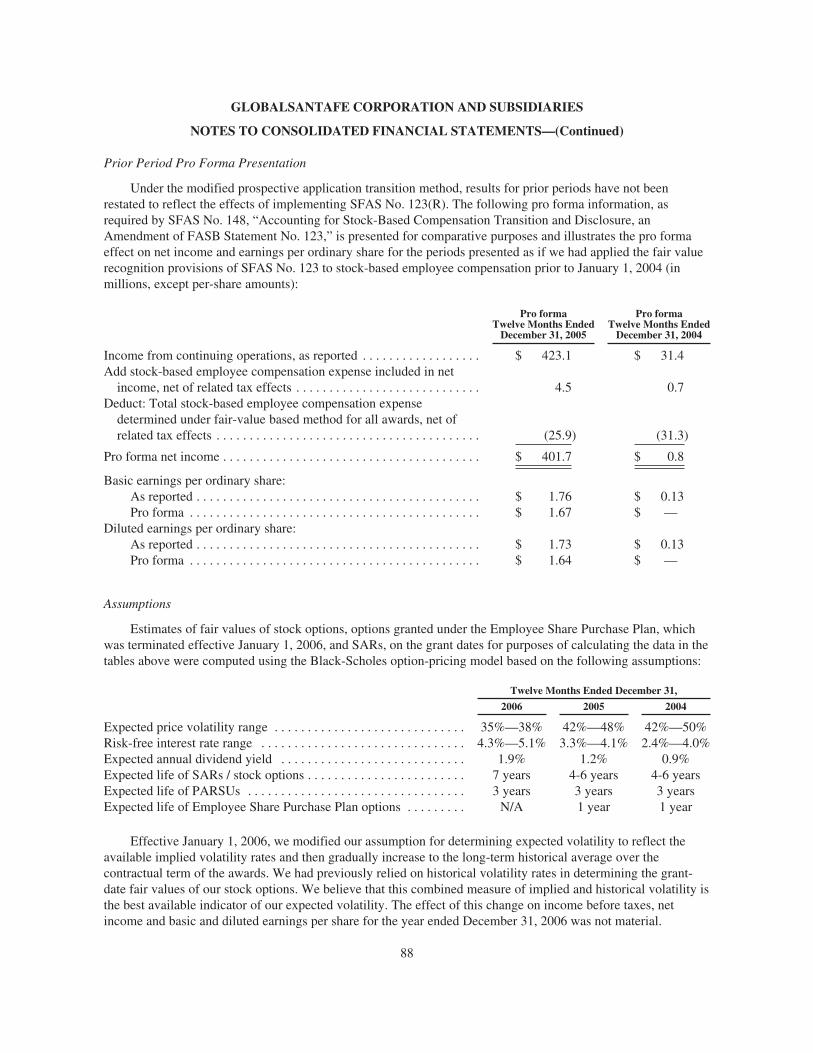
GLOBALSANTAFE CORPORATION AND SUBSIDIARIES
NOTES TO CONSOLIDATED FINANCIAL STATEMENTS—(Continued)
Prior Period Pro Forma Presentation
Under the modified prospective application transition method, results for prior periods have not beenrestated to reflect the effects of implementing SFAS No. 123(R). The following pro forma information, asrequired by SFAS No. 148, “Accounting for Stock-Based Compensation Transition and Disclosure, anAmendment of FASB Statement No. 123,” is presented for comparative purposes and illustrates the pro formaeffect on net income and earnings per ordinary share for the periods presented as if we had applied the fair valuerecognition provisions of SFAS No. 123 to stock-based employee compensation prior to January 1, 2004 (inmillions, except per-share amounts):
Pro formaTwelve Months Ended
December 31, 2005
Pro formaTwelve Months Ended
December 31, 2004
Income from continuing operations, as reported . . . . . . . . . . . . . . . . . . $ 423.1 $ 31.4Add stock-based employee compensation expense included in net
income, net of related tax effects . . . . . . . . . . . . . . . . . . . . . . . . . . . . 4.5 0.7Deduct: Total stock-based employee compensation expense
determined under fair-value based method for all awards, net ofrelated tax effects . . . . . . . . . . . . . . . . . . . . . . . . . . . . . . . . . . . . . . . . (25.9) (31.3)
Pro forma net income . . . . . . . . . . . . . . . . . . . . . . . . . . . . . . . . . . . . . . . $ 401.7 $ 0.8
Basic earnings per ordinary share:As reported . . . . . . . . . . . . . . . . . . . . . . . . . . . . . . . . . . . . . . . . . . . $ 1.76 $ 0.13Pro forma . . . . . . . . . . . . . . . . . . . . . . . . . . . . . . . . . . . . . . . . . . . . $ 1.67 $ —
Diluted earnings per ordinary share:As reported . . . . . . . . . . . . . . . . . . . . . . . . . . . . . . . . . . . . . . . . . . . $ 1.73 $ 0.13Pro forma . . . . . . . . . . . . . . . . . . . . . . . . . . . . . . . . . . . . . . . . . . . . $ 1.64 $ —
Assumptions
Estimates of fair values of stock options, options granted under the Employee Share Purchase Plan, whichwas terminated effective January 1, 2006, and SARs, on the grant dates for purposes of calculating the data in thetables above were computed using the Black-Scholes option-pricing model based on the following assumptions:
Twelve Months Ended December 31,
2006 2005 2004
Expected price volatility range . . . . . . . . . . . . . . . . . . . . . . . . . . . . . 35%—38% 42%—48% 42%—50%Risk-free interest rate range . . . . . . . . . . . . . . . . . . . . . . . . . . . . . . . 4.3%—5.1% 3.3%—4.1% 2.4%—4.0%Expected annual dividend yield . . . . . . . . . . . . . . . . . . . . . . . . . . . . 1.9% 1.2% 0.9%Expected life of SARs / stock options . . . . . . . . . . . . . . . . . . . . . . . . 7 years 4-6 years 4-6 yearsExpected life of PARSUs . . . . . . . . . . . . . . . . . . . . . . . . . . . . . . . . . 3 years 3 years 3 yearsExpected life of Employee Share Purchase Plan options . . . . . . . . . N/A 1 year 1 year
Effective January 1, 2006, we modified our assumption for determining expected volatility to reflect theavailable implied volatility rates and then gradually increase to the long-term historical average over thecontractual term of the awards. We had previously relied on historical volatility rates in determining the grant-date fair values of our stock options. We believe that this combined measure of implied and historical volatility isthe best available indicator of our expected volatility. The effect of this change on income before taxes, netincome and basic and diluted earnings per share for the year ended December 31, 2006 was not material.
88

GLOBALSANTAFE CORPORATION AND SUBSIDIARIES
NOTES TO CONSOLIDATED FINANCIAL STATEMENTS—(Continued)
Expected lives of SARs granted during 2006 are determined based on the accounting guidance under StaffAccounting Bulletin No. 107 (“SAB 107”) and our plan provisions. The increase in expected life from previousstock option grants is due primarily to a change in the population of employees who receive SARs. We believethis method is the best estimate of future exercise patterns currently available.
Risk-free interest rates are determined using the implied yield currently available for zero-coupon U.S.government issues with a remaining term equal to the expected life of the options and stock appreciation rights.
Expected dividend yields are based on the approved annual dividend rate in effect and the current marketprice of our ordinary shares at the time of grant. No assumption for a future dividend rate change has beenincluded unless there is an approved plan to change the dividend in the near term.
Estimated forfeiture rates are derived from historical forfeiture patterns. We believe the historicalexperience method is the best estimate of forfeitures currently available.
At December 31, 2006, there were a total of 3,016,825 shares available for future grants under our stock-based compensation plans.
Stock Options
A summary of the status of stock options granted is presented below:
Number ofShares Under
OptionWeighted Average
Exercise Price
Shares under option at December 31, 2003 . . . . . . . . . . . . . . . . . . . . . . . . . . . . . . 19,144,874 $27.76Granted . . . . . . . . . . . . . . . . . . . . . . . . . . . . . . . . . . . . . . . . . . . . . . . . . . . . . . 3,306,000 $25.49Exercised . . . . . . . . . . . . . . . . . . . . . . . . . . . . . . . . . . . . . . . . . . . . . . . . . . . . . (2,234,423) $17.05Canceled . . . . . . . . . . . . . . . . . . . . . . . . . . . . . . . . . . . . . . . . . . . . . . . . . . . . . (1,122,390) $31.04
Shares under option at December 31, 2004 . . . . . . . . . . . . . . . . . . . . . . . . . . . . . . 19,094,061 $28.38Granted . . . . . . . . . . . . . . . . . . . . . . . . . . . . . . . . . . . . . . . . . . . . . . . . . . . . . . 348,031 $37.53Exercised . . . . . . . . . . . . . . . . . . . . . . . . . . . . . . . . . . . . . . . . . . . . . . . . . . . . . (8,577,761) $26.50Canceled . . . . . . . . . . . . . . . . . . . . . . . . . . . . . . . . . . . . . . . . . . . . . . . . . . . . . (389,134) $31.26
Shares under option at December 31, 2005 . . . . . . . . . . . . . . . . . . . . . . . . . . . . . . 10,475,197 $30.12Granted . . . . . . . . . . . . . . . . . . . . . . . . . . . . . . . . . . . . . . . . . . . . . . . . . . . . . . — —Exercised . . . . . . . . . . . . . . . . . . . . . . . . . . . . . . . . . . . . . . . . . . . . . . . . . . . . . (4,664,748) $29.85Canceled . . . . . . . . . . . . . . . . . . . . . . . . . . . . . . . . . . . . . . . . . . . . . . . . . . . . . (131,944) $31.45
Shares under option at December 31, 2006 . . . . . . . . . . . . . . . . . . . . . . . . . . . . . . 5,678,505 $30.32
Options exercisable at December 31,2004 . . . . . . . . . . . . . . . . . . . . . . . . . . . . . . . . . . . . . . . . . . . . . . . . . . . . . . . . . 12,534,408 $29.742005 . . . . . . . . . . . . . . . . . . . . . . . . . . . . . . . . . . . . . . . . . . . . . . . . . . . . . . . . . 7,217,838 $31.762006 . . . . . . . . . . . . . . . . . . . . . . . . . . . . . . . . . . . . . . . . . . . . . . . . . . . . . . . . . 4,556,244 $30.93
All stock options granted during 2005 and 2004 had exercise prices equal to the market price of our ordinaryshares on the date of grant. We did not grant any stock options during 2006. The weighted average per share fairvalue of options as of the grant date was $16.29 in 2005 and $11.19 in 2004. As of December 31, 2006, there wasapproximately $1.0 million of total unrecognized compensation cost related to the nonvested portion of the 2005and 2004 stock option grants. This cost is expected to be recognized over a weighted-average period of 0.8 years.We issue new shares when stock options are exercised.
89
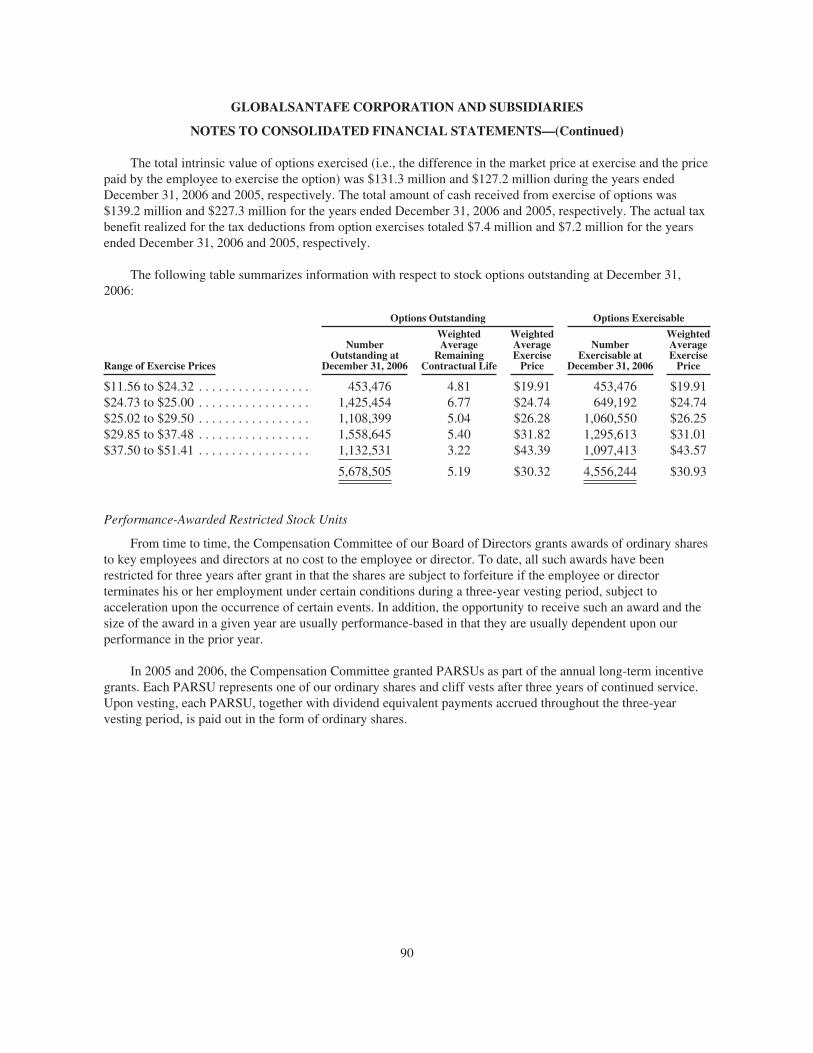
GLOBALSANTAFE CORPORATION AND SUBSIDIARIES
NOTES TO CONSOLIDATED FINANCIAL STATEMENTS—(Continued)
The total intrinsic value of options exercised (i.e., the difference in the market price at exercise and the pricepaid by the employee to exercise the option) was $131.3 million and $127.2 million during the years endedDecember 31, 2006 and 2005, respectively. The total amount of cash received from exercise of options was$139.2 million and $227.3 million for the years ended December 31, 2006 and 2005, respectively. The actual taxbenefit realized for the tax deductions from option exercises totaled $7.4 million and $7.2 million for the yearsended December 31, 2006 and 2005, respectively.
The following table summarizes information with respect to stock options outstanding at December 31,2006:
Options Outstanding Options Exercisable
Range of Exercise Prices
NumberOutstanding at
December 31, 2006
WeightedAverage
RemainingContractual Life
WeightedAverageExercise
Price
NumberExercisable at
December 31, 2006
WeightedAverageExercise
Price
$11.56 to $24.32 . . . . . . . . . . . . . . . . . 453,476 4.81 $19.91 453,476 $19.91$24.73 to $25.00 . . . . . . . . . . . . . . . . . 1,425,454 6.77 $24.74 649,192 $24.74$25.02 to $29.50 . . . . . . . . . . . . . . . . . 1,108,399 5.04 $26.28 1,060,550 $26.25$29.85 to $37.48 . . . . . . . . . . . . . . . . . 1,558,645 5.40 $31.82 1,295,613 $31.01$37.50 to $51.41 . . . . . . . . . . . . . . . . . 1,132,531 3.22 $43.39 1,097,413 $43.57
5,678,505 5.19 $30.32 4,556,244 $30.93
Performance-Awarded Restricted Stock Units
From time to time, the Compensation Committee of our Board of Directors grants awards of ordinary sharesto key employees and directors at no cost to the employee or director. To date, all such awards have beenrestricted for three years after grant in that the shares are subject to forfeiture if the employee or directorterminates his or her employment under certain conditions during a three-year vesting period, subject toacceleration upon the occurrence of certain events. In addition, the opportunity to receive such an award and thesize of the award in a given year are usually performance-based in that they are usually dependent upon ourperformance in the prior year.
In 2005 and 2006, the Compensation Committee granted PARSUs as part of the annual long-term incentivegrants. Each PARSU represents one of our ordinary shares and cliff vests after three years of continued service.Upon vesting, each PARSU, together with dividend equivalent payments accrued throughout the three-yearvesting period, is paid out in the form of ordinary shares.
90
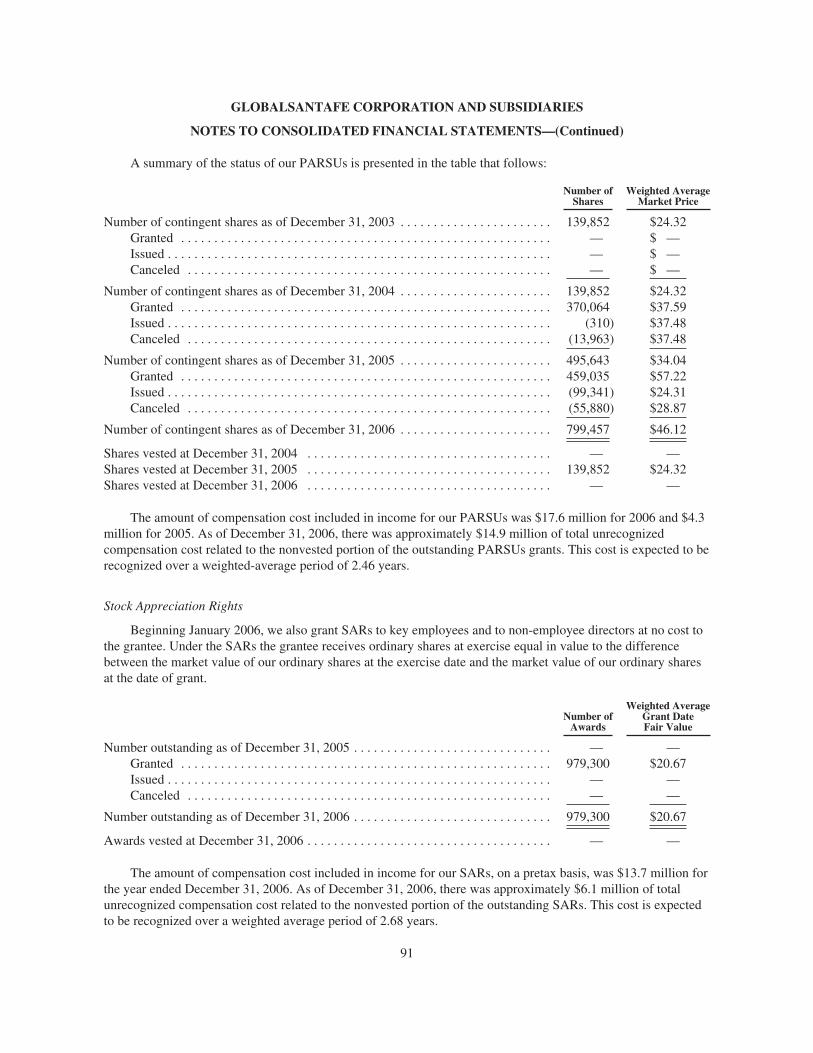
GLOBALSANTAFE CORPORATION AND SUBSIDIARIES
NOTES TO CONSOLIDATED FINANCIAL STATEMENTS—(Continued)
A summary of the status of our PARSUs is presented in the table that follows:
Number ofShares
Weighted AverageMarket Price
Number of contingent shares as of December 31, 2003 . . . . . . . . . . . . . . . . . . . . . . . 139,852 $24.32Granted . . . . . . . . . . . . . . . . . . . . . . . . . . . . . . . . . . . . . . . . . . . . . . . . . . . . . . . . — $ —Issued . . . . . . . . . . . . . . . . . . . . . . . . . . . . . . . . . . . . . . . . . . . . . . . . . . . . . . . . . . — $ —Canceled . . . . . . . . . . . . . . . . . . . . . . . . . . . . . . . . . . . . . . . . . . . . . . . . . . . . . . . — $ —
Number of contingent shares as of December 31, 2004 . . . . . . . . . . . . . . . . . . . . . . . 139,852 $24.32Granted . . . . . . . . . . . . . . . . . . . . . . . . . . . . . . . . . . . . . . . . . . . . . . . . . . . . . . . . 370,064 $37.59Issued . . . . . . . . . . . . . . . . . . . . . . . . . . . . . . . . . . . . . . . . . . . . . . . . . . . . . . . . . . (310) $37.48Canceled . . . . . . . . . . . . . . . . . . . . . . . . . . . . . . . . . . . . . . . . . . . . . . . . . . . . . . . (13,963) $37.48
Number of contingent shares as of December 31, 2005 . . . . . . . . . . . . . . . . . . . . . . . 495,643 $34.04Granted . . . . . . . . . . . . . . . . . . . . . . . . . . . . . . . . . . . . . . . . . . . . . . . . . . . . . . . . 459,035 $57.22Issued . . . . . . . . . . . . . . . . . . . . . . . . . . . . . . . . . . . . . . . . . . . . . . . . . . . . . . . . . . (99,341) $24.31Canceled . . . . . . . . . . . . . . . . . . . . . . . . . . . . . . . . . . . . . . . . . . . . . . . . . . . . . . . (55,880) $28.87
Number of contingent shares as of December 31, 2006 . . . . . . . . . . . . . . . . . . . . . . . 799,457 $46.12
Shares vested at December 31, 2004 . . . . . . . . . . . . . . . . . . . . . . . . . . . . . . . . . . . . . — —Shares vested at December 31, 2005 . . . . . . . . . . . . . . . . . . . . . . . . . . . . . . . . . . . . . 139,852 $24.32Shares vested at December 31, 2006 . . . . . . . . . . . . . . . . . . . . . . . . . . . . . . . . . . . . . — —
The amount of compensation cost included in income for our PARSUs was $17.6 million for 2006 and $4.3million for 2005. As of December 31, 2006, there was approximately $14.9 million of total unrecognizedcompensation cost related to the nonvested portion of the outstanding PARSUs grants. This cost is expected to berecognized over a weighted-average period of 2.46 years.
Stock Appreciation Rights
Beginning January 2006, we also grant SARs to key employees and to non-employee directors at no cost tothe grantee. Under the SARs the grantee receives ordinary shares at exercise equal in value to the differencebetween the market value of our ordinary shares at the exercise date and the market value of our ordinary sharesat the date of grant.
Number ofAwards
Weighted AverageGrant DateFair Value
Number outstanding as of December 31, 2005 . . . . . . . . . . . . . . . . . . . . . . . . . . . . . . — —Granted . . . . . . . . . . . . . . . . . . . . . . . . . . . . . . . . . . . . . . . . . . . . . . . . . . . . . . . . 979,300 $20.67Issued . . . . . . . . . . . . . . . . . . . . . . . . . . . . . . . . . . . . . . . . . . . . . . . . . . . . . . . . . . — —Canceled . . . . . . . . . . . . . . . . . . . . . . . . . . . . . . . . . . . . . . . . . . . . . . . . . . . . . . . — —
Number outstanding as of December 31, 2006 . . . . . . . . . . . . . . . . . . . . . . . . . . . . . . 979,300 $20.67
Awards vested at December 31, 2006 . . . . . . . . . . . . . . . . . . . . . . . . . . . . . . . . . . . . . — —
The amount of compensation cost included in income for our SARs, on a pretax basis, was $13.7 million forthe year ended December 31, 2006. As of December 31, 2006, there was approximately $6.1 million of totalunrecognized compensation cost related to the nonvested portion of the outstanding SARs. This cost is expectedto be recognized over a weighted average period of 2.68 years.
91
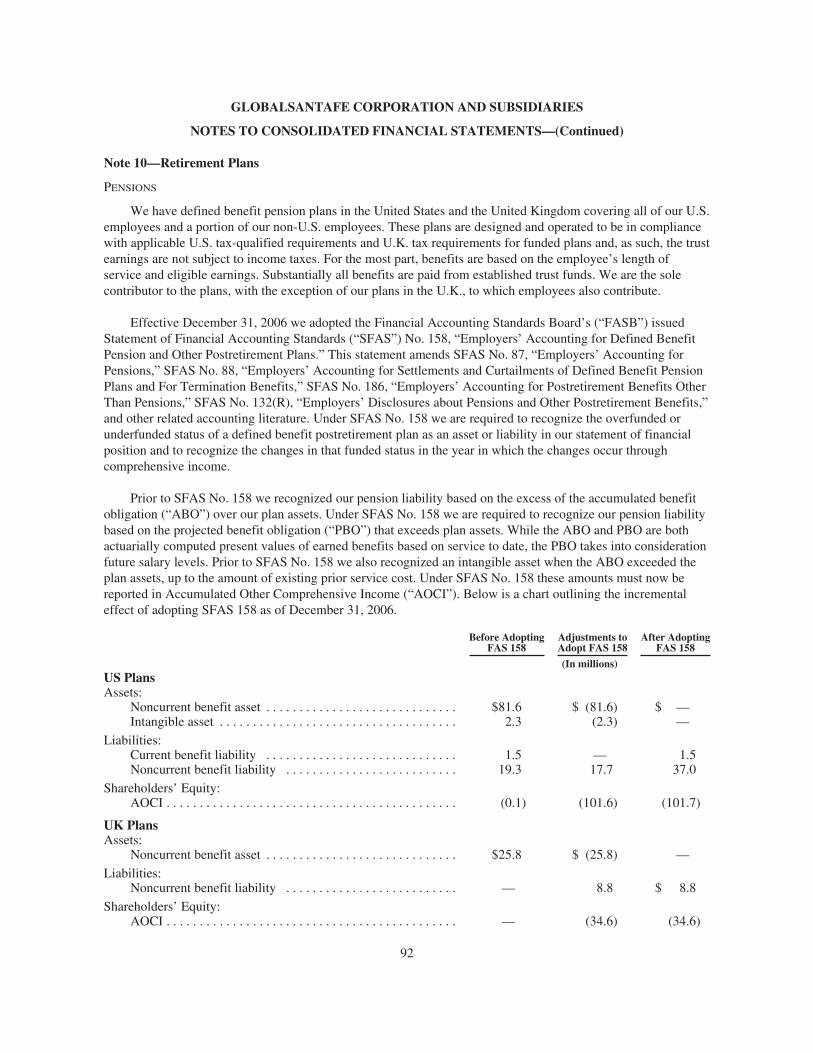
GLOBALSANTAFE CORPORATION AND SUBSIDIARIES
NOTES TO CONSOLIDATED FINANCIAL STATEMENTS—(Continued)
Note 10—Retirement Plans
PENSIONS
We have defined benefit pension plans in the United States and the United Kingdom covering all of our U.S.employees and a portion of our non-U.S. employees. These plans are designed and operated to be in compliancewith applicable U.S. tax-qualified requirements and U.K. tax requirements for funded plans and, as such, the trustearnings are not subject to income taxes. For the most part, benefits are based on the employee’s length ofservice and eligible earnings. Substantially all benefits are paid from established trust funds. We are the solecontributor to the plans, with the exception of our plans in the U.K., to which employees also contribute.
Effective December 31, 2006 we adopted the Financial Accounting Standards Board’s (“FASB”) issuedStatement of Financial Accounting Standards (“SFAS”) No. 158, “Employers’ Accounting for Defined BenefitPension and Other Postretirement Plans.” This statement amends SFAS No. 87, “Employers’ Accounting forPensions,” SFAS No. 88, “Employers’ Accounting for Settlements and Curtailments of Defined Benefit PensionPlans and For Termination Benefits,” SFAS No. 186, “Employers’ Accounting for Postretirement Benefits OtherThan Pensions,” SFAS No. 132(R), “Employers’ Disclosures about Pensions and Other Postretirement Benefits,”and other related accounting literature. Under SFAS No. 158 we are required to recognize the overfunded orunderfunded status of a defined benefit postretirement plan as an asset or liability in our statement of financialposition and to recognize the changes in that funded status in the year in which the changes occur throughcomprehensive income.
Prior to SFAS No. 158 we recognized our pension liability based on the excess of the accumulated benefitobligation (“ABO”) over our plan assets. Under SFAS No. 158 we are required to recognize our pension liabilitybased on the projected benefit obligation (“PBO”) that exceeds plan assets. While the ABO and PBO are bothactuarially computed present values of earned benefits based on service to date, the PBO takes into considerationfuture salary levels. Prior to SFAS No. 158 we also recognized an intangible asset when the ABO exceeded theplan assets, up to the amount of existing prior service cost. Under SFAS No. 158 these amounts must now bereported in Accumulated Other Comprehensive Income (“AOCI”). Below is a chart outlining the incrementaleffect of adopting SFAS 158 as of December 31, 2006.
Before AdoptingFAS 158
Adjustments toAdopt FAS 158
After AdoptingFAS 158
(In millions)US PlansAssets:
Noncurrent benefit asset . . . . . . . . . . . . . . . . . . . . . . . . . . . . . $81.6 $ (81.6) $ —Intangible asset . . . . . . . . . . . . . . . . . . . . . . . . . . . . . . . . . . . . 2.3 (2.3) —
Liabilities:Current benefit liability . . . . . . . . . . . . . . . . . . . . . . . . . . . . . 1.5 — 1.5Noncurrent benefit liability . . . . . . . . . . . . . . . . . . . . . . . . . . 19.3 17.7 37.0
Shareholders’ Equity:AOCI . . . . . . . . . . . . . . . . . . . . . . . . . . . . . . . . . . . . . . . . . . . . (0.1) (101.6) (101.7)
UK PlansAssets:
Noncurrent benefit asset . . . . . . . . . . . . . . . . . . . . . . . . . . . . . $25.8 $ (25.8) —
Liabilities:Noncurrent benefit liability . . . . . . . . . . . . . . . . . . . . . . . . . . — 8.8 $ 8.8
Shareholders’ Equity:AOCI . . . . . . . . . . . . . . . . . . . . . . . . . . . . . . . . . . . . . . . . . . . . — (34.6) (34.6)
92
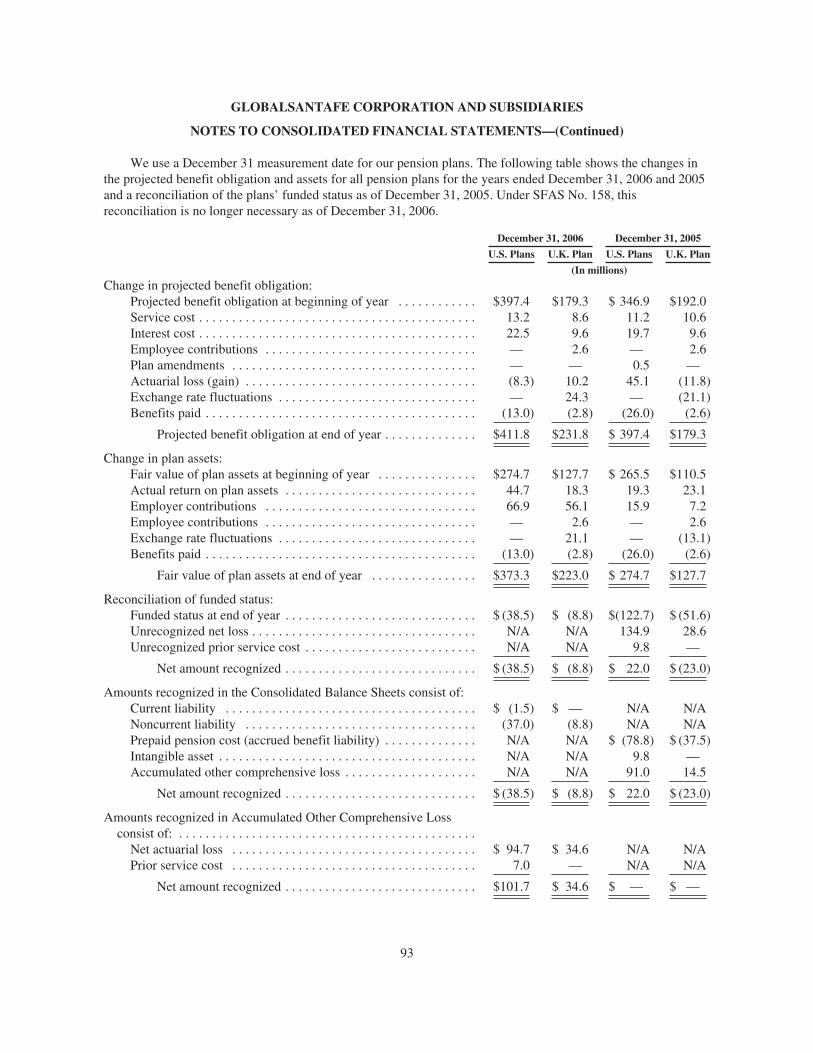
GLOBALSANTAFE CORPORATION AND SUBSIDIARIES
NOTES TO CONSOLIDATED FINANCIAL STATEMENTS—(Continued)
We use a December 31 measurement date for our pension plans. The following table shows the changes inthe projected benefit obligation and assets for all pension plans for the years ended December 31, 2006 and 2005and a reconciliation of the plans’ funded status as of December 31, 2005. Under SFAS No. 158, thisreconciliation is no longer necessary as of December 31, 2006.
December 31, 2006 December 31, 2005
U.S. Plans U.K. Plan U.S. Plans U.K. Plan
(In millions)
Change in projected benefit obligation:Projected benefit obligation at beginning of year . . . . . . . . . . . . $397.4 $179.3 $ 346.9 $192.0Service cost . . . . . . . . . . . . . . . . . . . . . . . . . . . . . . . . . . . . . . . . . . 13.2 8.6 11.2 10.6Interest cost . . . . . . . . . . . . . . . . . . . . . . . . . . . . . . . . . . . . . . . . . . 22.5 9.6 19.7 9.6Employee contributions . . . . . . . . . . . . . . . . . . . . . . . . . . . . . . . . — 2.6 — 2.6Plan amendments . . . . . . . . . . . . . . . . . . . . . . . . . . . . . . . . . . . . . — — 0.5 —Actuarial loss (gain) . . . . . . . . . . . . . . . . . . . . . . . . . . . . . . . . . . . (8.3) 10.2 45.1 (11.8)Exchange rate fluctuations . . . . . . . . . . . . . . . . . . . . . . . . . . . . . . — 24.3 — (21.1)Benefits paid . . . . . . . . . . . . . . . . . . . . . . . . . . . . . . . . . . . . . . . . . (13.0) (2.8) (26.0) (2.6)
Projected benefit obligation at end of year . . . . . . . . . . . . . . $411.8 $231.8 $ 397.4 $179.3
Change in plan assets:Fair value of plan assets at beginning of year . . . . . . . . . . . . . . . $274.7 $127.7 $ 265.5 $110.5Actual return on plan assets . . . . . . . . . . . . . . . . . . . . . . . . . . . . . 44.7 18.3 19.3 23.1Employer contributions . . . . . . . . . . . . . . . . . . . . . . . . . . . . . . . . 66.9 56.1 15.9 7.2Employee contributions . . . . . . . . . . . . . . . . . . . . . . . . . . . . . . . . — 2.6 — 2.6Exchange rate fluctuations . . . . . . . . . . . . . . . . . . . . . . . . . . . . . . — 21.1 — (13.1)Benefits paid . . . . . . . . . . . . . . . . . . . . . . . . . . . . . . . . . . . . . . . . . (13.0) (2.8) (26.0) (2.6)
Fair value of plan assets at end of year . . . . . . . . . . . . . . . . $373.3 $223.0 $ 274.7 $127.7
Reconciliation of funded status:Funded status at end of year . . . . . . . . . . . . . . . . . . . . . . . . . . . . . $ (38.5) $ (8.8) $(122.7) $ (51.6)Unrecognized net loss . . . . . . . . . . . . . . . . . . . . . . . . . . . . . . . . . . N/A N/A 134.9 28.6Unrecognized prior service cost . . . . . . . . . . . . . . . . . . . . . . . . . . N/A N/A 9.8 —
Net amount recognized . . . . . . . . . . . . . . . . . . . . . . . . . . . . . $ (38.5) $ (8.8) $ 22.0 $ (23.0)
Amounts recognized in the Consolidated Balance Sheets consist of:Current liability . . . . . . . . . . . . . . . . . . . . . . . . . . . . . . . . . . . . . . $ (1.5) $ — N/A N/ANoncurrent liability . . . . . . . . . . . . . . . . . . . . . . . . . . . . . . . . . . . (37.0) (8.8) N/A N/APrepaid pension cost (accrued benefit liability) . . . . . . . . . . . . . . N/A N/A $ (78.8) $ (37.5)Intangible asset . . . . . . . . . . . . . . . . . . . . . . . . . . . . . . . . . . . . . . . N/A N/A 9.8 —Accumulated other comprehensive loss . . . . . . . . . . . . . . . . . . . . N/A N/A 91.0 14.5
Net amount recognized . . . . . . . . . . . . . . . . . . . . . . . . . . . . . $ (38.5) $ (8.8) $ 22.0 $ (23.0)
Amounts recognized in Accumulated Other Comprehensive Lossconsist of: . . . . . . . . . . . . . . . . . . . . . . . . . . . . . . . . . . . . . . . . . . . . .
Net actuarial loss . . . . . . . . . . . . . . . . . . . . . . . . . . . . . . . . . . . . . $ 94.7 $ 34.6 N/A N/APrior service cost . . . . . . . . . . . . . . . . . . . . . . . . . . . . . . . . . . . . . 7.0 — N/A N/A
Net amount recognized . . . . . . . . . . . . . . . . . . . . . . . . . . . . . $101.7 $ 34.6 $ — $ —
93
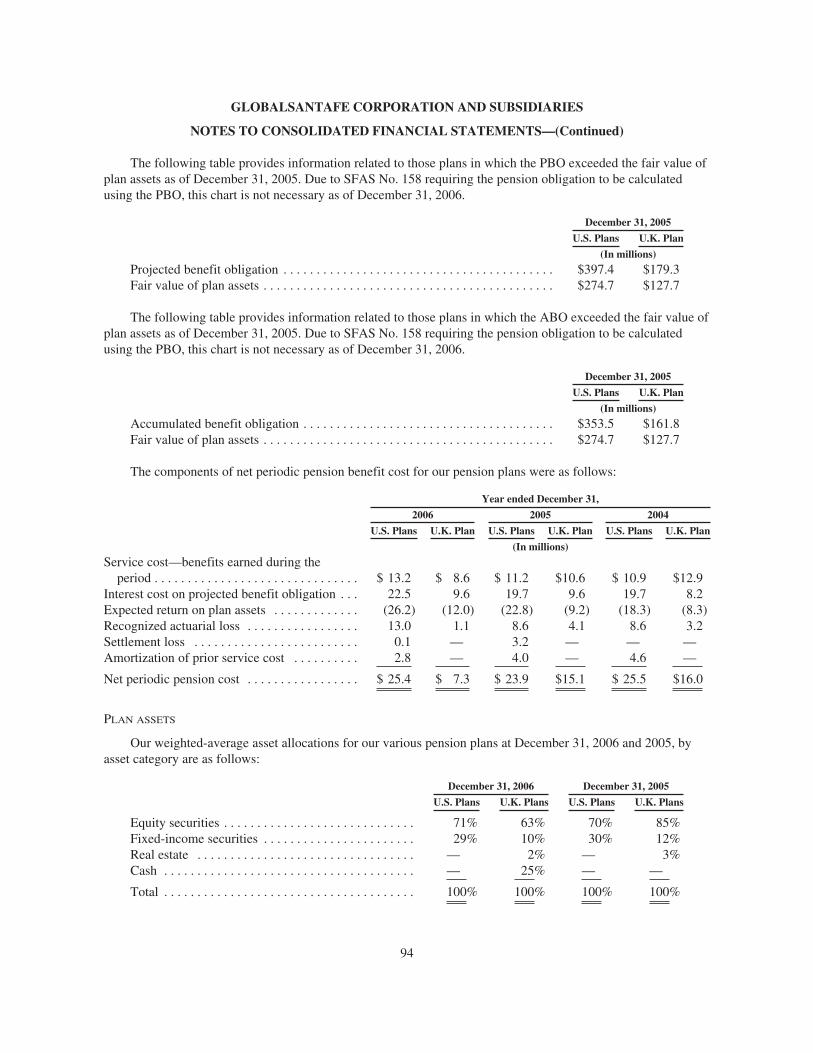
GLOBALSANTAFE CORPORATION AND SUBSIDIARIES
NOTES TO CONSOLIDATED FINANCIAL STATEMENTS—(Continued)
The following table provides information related to those plans in which the PBO exceeded the fair value ofplan assets as of December 31, 2005. Due to SFAS No. 158 requiring the pension obligation to be calculatedusing the PBO, this chart is not necessary as of December 31, 2006.
December 31, 2005
U.S. Plans U.K. Plan
(In millions)
Projected benefit obligation . . . . . . . . . . . . . . . . . . . . . . . . . . . . . . . . . . . . . . . . . $397.4 $179.3Fair value of plan assets . . . . . . . . . . . . . . . . . . . . . . . . . . . . . . . . . . . . . . . . . . . . $274.7 $127.7
The following table provides information related to those plans in which the ABO exceeded the fair value ofplan assets as of December 31, 2005. Due to SFAS No. 158 requiring the pension obligation to be calculatedusing the PBO, this chart is not necessary as of December 31, 2006.
December 31, 2005
U.S. Plans U.K. Plan
(In millions)
Accumulated benefit obligation . . . . . . . . . . . . . . . . . . . . . . . . . . . . . . . . . . . . . . $353.5 $161.8Fair value of plan assets . . . . . . . . . . . . . . . . . . . . . . . . . . . . . . . . . . . . . . . . . . . . $274.7 $127.7
The components of net periodic pension benefit cost for our pension plans were as follows:
Year ended December 31,
2006 2005 2004
U.S. Plans U.K. Plan U.S. Plans U.K. Plan U.S. Plans U.K. Plan
(In millions)
Service cost—benefits earned during theperiod . . . . . . . . . . . . . . . . . . . . . . . . . . . . . . . $ 13.2 $ 8.6 $ 11.2 $10.6 $ 10.9 $12.9
Interest cost on projected benefit obligation . . . 22.5 9.6 19.7 9.6 19.7 8.2Expected return on plan assets . . . . . . . . . . . . . (26.2) (12.0) (22.8) (9.2) (18.3) (8.3)Recognized actuarial loss . . . . . . . . . . . . . . . . . 13.0 1.1 8.6 4.1 8.6 3.2Settlement loss . . . . . . . . . . . . . . . . . . . . . . . . . 0.1 — 3.2 — — —Amortization of prior service cost . . . . . . . . . . 2.8 — 4.0 — 4.6 —
Net periodic pension cost . . . . . . . . . . . . . . . . . $ 25.4 $ 7.3 $ 23.9 $15.1 $ 25.5 $16.0
PLAN ASSETS
Our weighted-average asset allocations for our various pension plans at December 31, 2006 and 2005, byasset category are as follows:
December 31, 2006 December 31, 2005
U.S. Plans U.K. Plans U.S. Plans U.K. Plans
Equity securities . . . . . . . . . . . . . . . . . . . . . . . . . . . . . 71% 63% 70% 85%Fixed-income securities . . . . . . . . . . . . . . . . . . . . . . . 29% 10% 30% 12%Real estate . . . . . . . . . . . . . . . . . . . . . . . . . . . . . . . . . — 2% — 3%Cash . . . . . . . . . . . . . . . . . . . . . . . . . . . . . . . . . . . . . . — 25% — —
Total . . . . . . . . . . . . . . . . . . . . . . . . . . . . . . . . . . . . . . 100% 100% 100% 100%
94
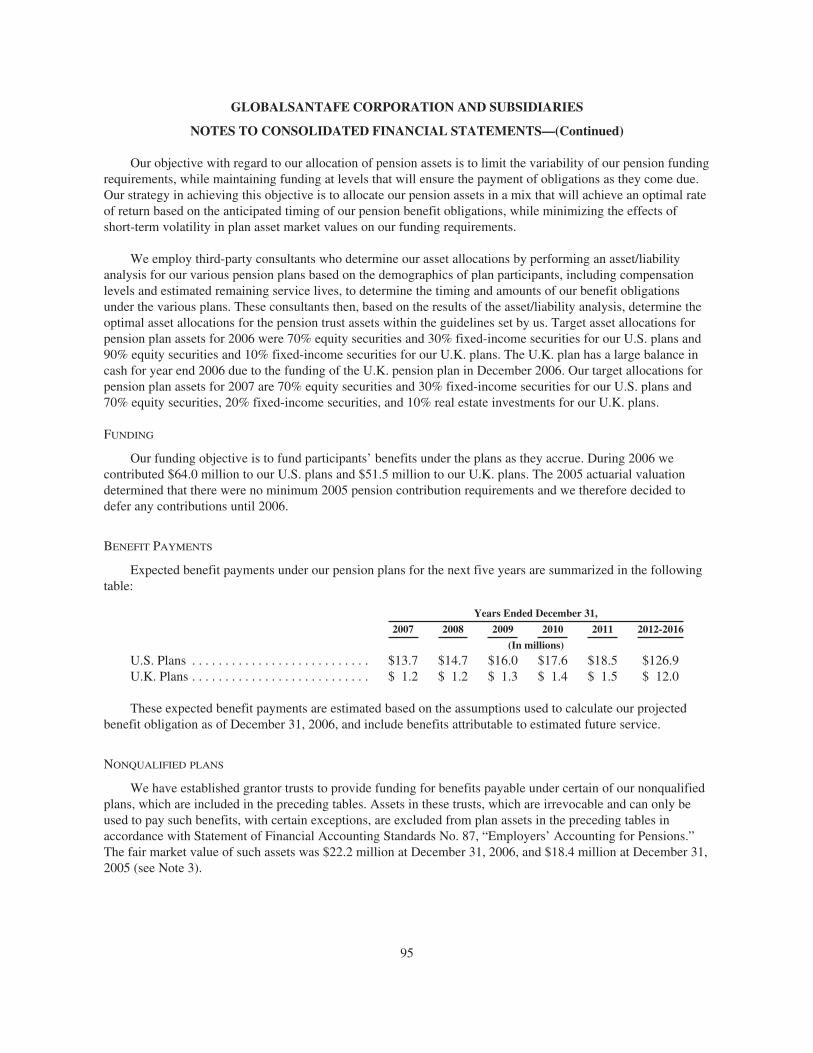
GLOBALSANTAFE CORPORATION AND SUBSIDIARIES
NOTES TO CONSOLIDATED FINANCIAL STATEMENTS—(Continued)
Our objective with regard to our allocation of pension assets is to limit the variability of our pension fundingrequirements, while maintaining funding at levels that will ensure the payment of obligations as they come due.Our strategy in achieving this objective is to allocate our pension assets in a mix that will achieve an optimal rateof return based on the anticipated timing of our pension benefit obligations, while minimizing the effects ofshort-term volatility in plan asset market values on our funding requirements.
We employ third-party consultants who determine our asset allocations by performing an asset/liabilityanalysis for our various pension plans based on the demographics of plan participants, including compensationlevels and estimated remaining service lives, to determine the timing and amounts of our benefit obligationsunder the various plans. These consultants then, based on the results of the asset/liability analysis, determine theoptimal asset allocations for the pension trust assets within the guidelines set by us. Target asset allocations forpension plan assets for 2006 were 70% equity securities and 30% fixed-income securities for our U.S. plans and90% equity securities and 10% fixed-income securities for our U.K. plans. The U.K. plan has a large balance incash for year end 2006 due to the funding of the U.K. pension plan in December 2006. Our target allocations forpension plan assets for 2007 are 70% equity securities and 30% fixed-income securities for our U.S. plans and70% equity securities, 20% fixed-income securities, and 10% real estate investments for our U.K. plans.
FUNDING
Our funding objective is to fund participants’ benefits under the plans as they accrue. During 2006 wecontributed $64.0 million to our U.S. plans and $51.5 million to our U.K. plans. The 2005 actuarial valuationdetermined that there were no minimum 2005 pension contribution requirements and we therefore decided todefer any contributions until 2006.
BENEFIT PAYMENTS
Expected benefit payments under our pension plans for the next five years are summarized in the followingtable:
Years Ended December 31,
2007 2008 2009 2010 2011 2012-2016
(In millions)
U.S. Plans . . . . . . . . . . . . . . . . . . . . . . . . . . . $13.7 $14.7 $16.0 $17.6 $18.5 $126.9U.K. Plans . . . . . . . . . . . . . . . . . . . . . . . . . . . $ 1.2 $ 1.2 $ 1.3 $ 1.4 $ 1.5 $ 12.0
These expected benefit payments are estimated based on the assumptions used to calculate our projectedbenefit obligation as of December 31, 2006, and include benefits attributable to estimated future service.
NONQUALIFIED PLANS
We have established grantor trusts to provide funding for benefits payable under certain of our nonqualifiedplans, which are included in the preceding tables. Assets in these trusts, which are irrevocable and can only beused to pay such benefits, with certain exceptions, are excluded from plan assets in the preceding tables inaccordance with Statement of Financial Accounting Standards No. 87, “Employers’ Accounting for Pensions.”The fair market value of such assets was $22.2 million at December 31, 2006, and $18.4 million at December 31,2005 (see Note 3).
95
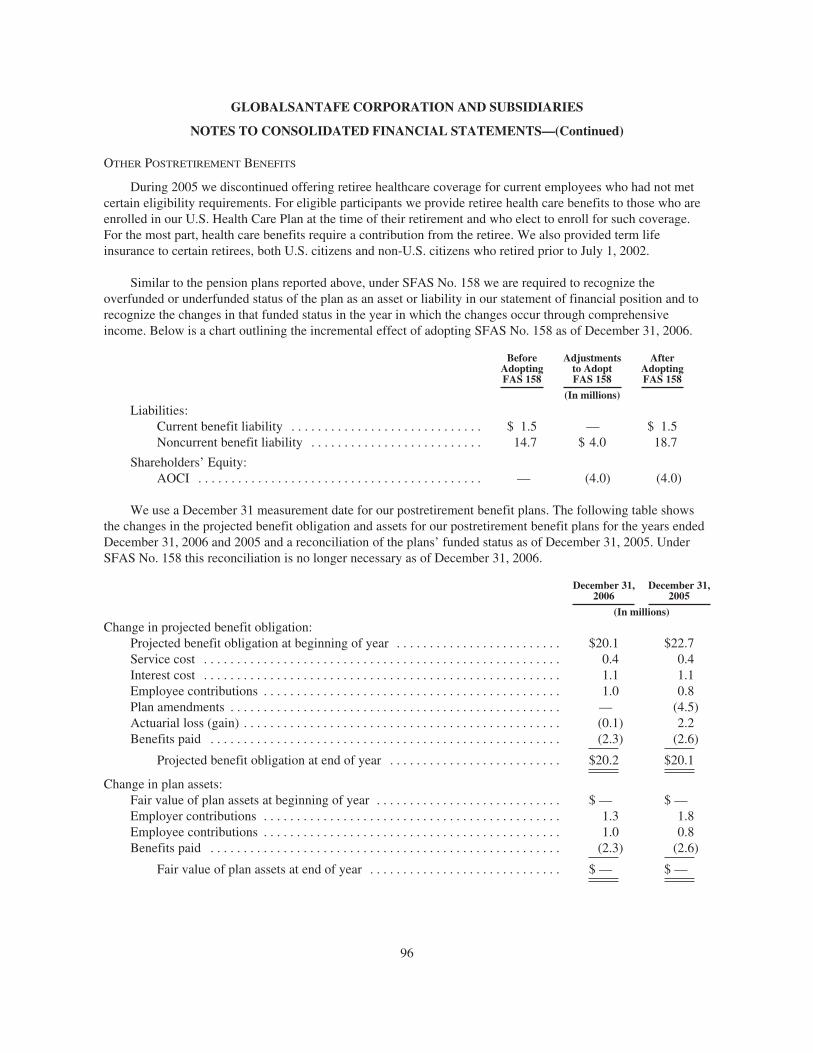
GLOBALSANTAFE CORPORATION AND SUBSIDIARIES
NOTES TO CONSOLIDATED FINANCIAL STATEMENTS—(Continued)
OTHER POSTRETIREMENT BENEFITS
During 2005 we discontinued offering retiree healthcare coverage for current employees who had not metcertain eligibility requirements. For eligible participants we provide retiree health care benefits to those who areenrolled in our U.S. Health Care Plan at the time of their retirement and who elect to enroll for such coverage.For the most part, health care benefits require a contribution from the retiree. We also provided term lifeinsurance to certain retirees, both U.S. citizens and non-U.S. citizens who retired prior to July 1, 2002.
Similar to the pension plans reported above, under SFAS No. 158 we are required to recognize theoverfunded or underfunded status of the plan as an asset or liability in our statement of financial position and torecognize the changes in that funded status in the year in which the changes occur through comprehensiveincome. Below is a chart outlining the incremental effect of adopting SFAS No. 158 as of December 31, 2006.
BeforeAdoptingFAS 158
Adjustmentsto AdoptFAS 158
AfterAdoptingFAS 158
(In millions)
Liabilities:Current benefit liability . . . . . . . . . . . . . . . . . . . . . . . . . . . . . $ 1.5 — $ 1.5Noncurrent benefit liability . . . . . . . . . . . . . . . . . . . . . . . . . . 14.7 $ 4.0 18.7
Shareholders’ Equity:AOCI . . . . . . . . . . . . . . . . . . . . . . . . . . . . . . . . . . . . . . . . . . . — (4.0) (4.0)
We use a December 31 measurement date for our postretirement benefit plans. The following table showsthe changes in the projected benefit obligation and assets for our postretirement benefit plans for the years endedDecember 31, 2006 and 2005 and a reconciliation of the plans’ funded status as of December 31, 2005. UnderSFAS No. 158 this reconciliation is no longer necessary as of December 31, 2006.
December 31,2006
December 31,2005
(In millions)
Change in projected benefit obligation:Projected benefit obligation at beginning of year . . . . . . . . . . . . . . . . . . . . . . . . . $20.1 $22.7Service cost . . . . . . . . . . . . . . . . . . . . . . . . . . . . . . . . . . . . . . . . . . . . . . . . . . . . . . 0.4 0.4Interest cost . . . . . . . . . . . . . . . . . . . . . . . . . . . . . . . . . . . . . . . . . . . . . . . . . . . . . . 1.1 1.1Employee contributions . . . . . . . . . . . . . . . . . . . . . . . . . . . . . . . . . . . . . . . . . . . . . 1.0 0.8Plan amendments . . . . . . . . . . . . . . . . . . . . . . . . . . . . . . . . . . . . . . . . . . . . . . . . . . — (4.5)Actuarial loss (gain) . . . . . . . . . . . . . . . . . . . . . . . . . . . . . . . . . . . . . . . . . . . . . . . . (0.1) 2.2Benefits paid . . . . . . . . . . . . . . . . . . . . . . . . . . . . . . . . . . . . . . . . . . . . . . . . . . . . . (2.3) (2.6)
Projected benefit obligation at end of year . . . . . . . . . . . . . . . . . . . . . . . . . . $20.2 $20.1
Change in plan assets:Fair value of plan assets at beginning of year . . . . . . . . . . . . . . . . . . . . . . . . . . . . $ — $ —Employer contributions . . . . . . . . . . . . . . . . . . . . . . . . . . . . . . . . . . . . . . . . . . . . . 1.3 1.8Employee contributions . . . . . . . . . . . . . . . . . . . . . . . . . . . . . . . . . . . . . . . . . . . . . 1.0 0.8Benefits paid . . . . . . . . . . . . . . . . . . . . . . . . . . . . . . . . . . . . . . . . . . . . . . . . . . . . . (2.3) (2.6)
Fair value of plan assets at end of year . . . . . . . . . . . . . . . . . . . . . . . . . . . . . $ — $ —
96
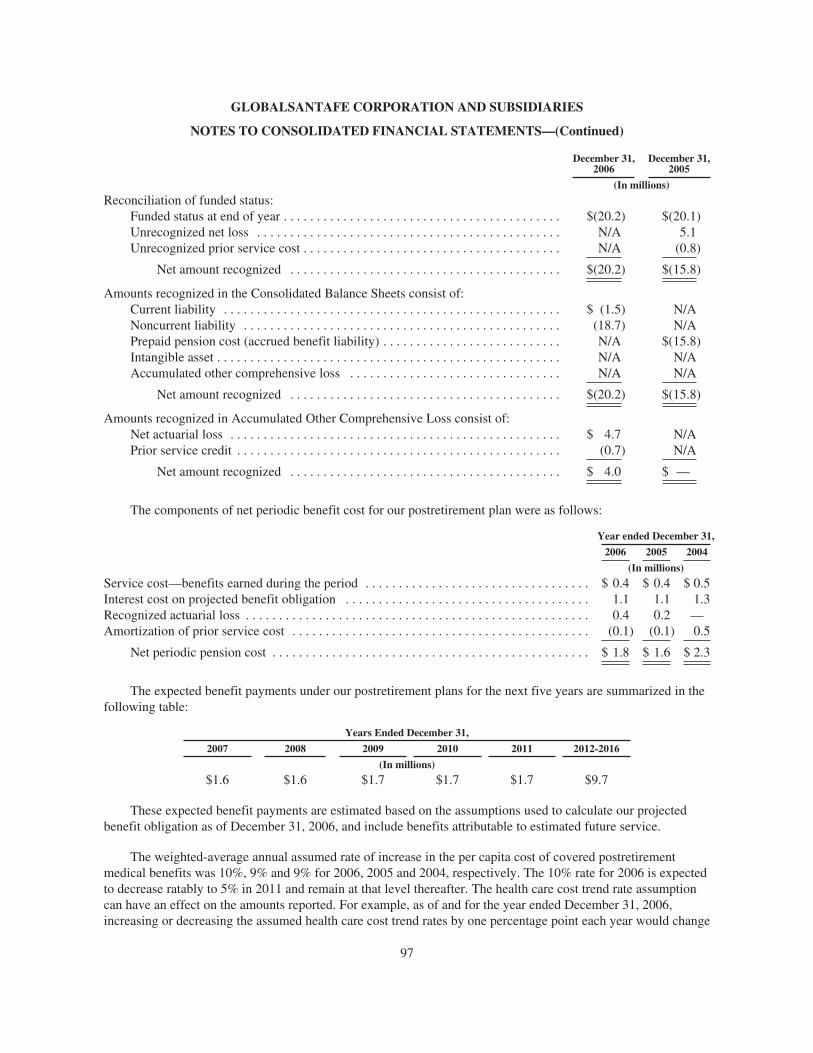
GLOBALSANTAFE CORPORATION AND SUBSIDIARIES
NOTES TO CONSOLIDATED FINANCIAL STATEMENTS—(Continued)
December 31,2006
December 31,2005
(In millions)
Reconciliation of funded status:Funded status at end of year . . . . . . . . . . . . . . . . . . . . . . . . . . . . . . . . . . . . . . . . . . $(20.2) $(20.1)Unrecognized net loss . . . . . . . . . . . . . . . . . . . . . . . . . . . . . . . . . . . . . . . . . . . . . . N/A 5.1Unrecognized prior service cost . . . . . . . . . . . . . . . . . . . . . . . . . . . . . . . . . . . . . . . N/A (0.8)
Net amount recognized . . . . . . . . . . . . . . . . . . . . . . . . . . . . . . . . . . . . . . . . . $(20.2) $(15.8)
Amounts recognized in the Consolidated Balance Sheets consist of:Current liability . . . . . . . . . . . . . . . . . . . . . . . . . . . . . . . . . . . . . . . . . . . . . . . . . . . $ (1.5) N/ANoncurrent liability . . . . . . . . . . . . . . . . . . . . . . . . . . . . . . . . . . . . . . . . . . . . . . . . (18.7) N/APrepaid pension cost (accrued benefit liability) . . . . . . . . . . . . . . . . . . . . . . . . . . . N/A $(15.8)Intangible asset . . . . . . . . . . . . . . . . . . . . . . . . . . . . . . . . . . . . . . . . . . . . . . . . . . . . N/A N/AAccumulated other comprehensive loss . . . . . . . . . . . . . . . . . . . . . . . . . . . . . . . . N/A N/A
Net amount recognized . . . . . . . . . . . . . . . . . . . . . . . . . . . . . . . . . . . . . . . . . $(20.2) $(15.8)
Amounts recognized in Accumulated Other Comprehensive Loss consist of:Net actuarial loss . . . . . . . . . . . . . . . . . . . . . . . . . . . . . . . . . . . . . . . . . . . . . . . . . . $ 4.7 N/APrior service credit . . . . . . . . . . . . . . . . . . . . . . . . . . . . . . . . . . . . . . . . . . . . . . . . . (0.7) N/A
Net amount recognized . . . . . . . . . . . . . . . . . . . . . . . . . . . . . . . . . . . . . . . . . $ 4.0 $ —
The components of net periodic benefit cost for our postretirement plan were as follows:
Year ended December 31,
2006 2005 2004
(In millions)
Service cost—benefits earned during the period . . . . . . . . . . . . . . . . . . . . . . . . . . . . . . . . . . $ 0.4 $ 0.4 $ 0.5Interest cost on projected benefit obligation . . . . . . . . . . . . . . . . . . . . . . . . . . . . . . . . . . . . . 1.1 1.1 1.3Recognized actuarial loss . . . . . . . . . . . . . . . . . . . . . . . . . . . . . . . . . . . . . . . . . . . . . . . . . . . . 0.4 0.2 —Amortization of prior service cost . . . . . . . . . . . . . . . . . . . . . . . . . . . . . . . . . . . . . . . . . . . . . (0.1) (0.1) 0.5
Net periodic pension cost . . . . . . . . . . . . . . . . . . . . . . . . . . . . . . . . . . . . . . . . . . . . . . . . $ 1.8 $ 1.6 $ 2.3
The expected benefit payments under our postretirement plans for the next five years are summarized in thefollowing table:
Years Ended December 31,
2007 2008 2009 2010 2011 2012-2016
(In millions)
$1.6 $1.6 $1.7 $1.7 $1.7 $9.7
These expected benefit payments are estimated based on the assumptions used to calculate our projectedbenefit obligation as of December 31, 2006, and include benefits attributable to estimated future service.
The weighted-average annual assumed rate of increase in the per capita cost of covered postretirementmedical benefits was 10%, 9% and 9% for 2006, 2005 and 2004, respectively. The 10% rate for 2006 is expectedto decrease ratably to 5% in 2011 and remain at that level thereafter. The health care cost trend rate assumptioncan have an effect on the amounts reported. For example, as of and for the year ended December 31, 2006,increasing or decreasing the assumed health care cost trend rates by one percentage point each year would change
97
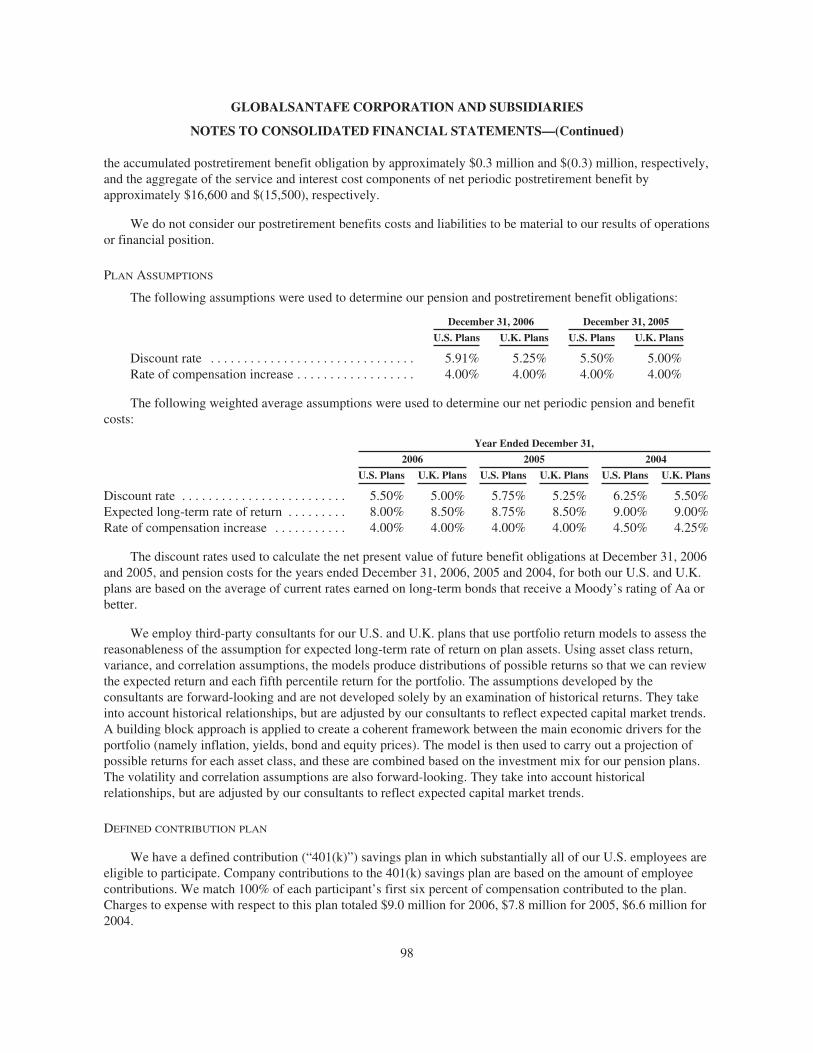
GLOBALSANTAFE CORPORATION AND SUBSIDIARIES
NOTES TO CONSOLIDATED FINANCIAL STATEMENTS—(Continued)
the accumulated postretirement benefit obligation by approximately $0.3 million and $(0.3) million, respectively,and the aggregate of the service and interest cost components of net periodic postretirement benefit byapproximately $16,600 and $(15,500), respectively.
We do not consider our postretirement benefits costs and liabilities to be material to our results of operationsor financial position.
PLAN ASSUMPTIONS
The following assumptions were used to determine our pension and postretirement benefit obligations:
December 31, 2006 December 31, 2005
U.S. Plans U.K. Plans U.S. Plans U.K. Plans
Discount rate . . . . . . . . . . . . . . . . . . . . . . . . . . . . . . . 5.91% 5.25% 5.50% 5.00%Rate of compensation increase . . . . . . . . . . . . . . . . . . 4.00% 4.00% 4.00% 4.00%
The following weighted average assumptions were used to determine our net periodic pension and benefitcosts:
Year Ended December 31,
2006 2005 2004
U.S. Plans U.K. Plans U.S. Plans U.K. Plans U.S. Plans U.K. Plans
Discount rate . . . . . . . . . . . . . . . . . . . . . . . . . 5.50% 5.00% 5.75% 5.25% 6.25% 5.50%Expected long-term rate of return . . . . . . . . . 8.00% 8.50% 8.75% 8.50% 9.00% 9.00%Rate of compensation increase . . . . . . . . . . . 4.00% 4.00% 4.00% 4.00% 4.50% 4.25%
The discount rates used to calculate the net present value of future benefit obligations at December 31, 2006and 2005, and pension costs for the years ended December 31, 2006, 2005 and 2004, for both our U.S. and U.K.plans are based on the average of current rates earned on long-term bonds that receive a Moody’s rating of Aa orbetter.
We employ third-party consultants for our U.S. and U.K. plans that use portfolio return models to assess thereasonableness of the assumption for expected long-term rate of return on plan assets. Using asset class return,variance, and correlation assumptions, the models produce distributions of possible returns so that we can reviewthe expected return and each fifth percentile return for the portfolio. The assumptions developed by theconsultants are forward-looking and are not developed solely by an examination of historical returns. They takeinto account historical relationships, but are adjusted by our consultants to reflect expected capital market trends.A building block approach is applied to create a coherent framework between the main economic drivers for theportfolio (namely inflation, yields, bond and equity prices). The model is then used to carry out a projection ofpossible returns for each asset class, and these are combined based on the investment mix for our pension plans.The volatility and correlation assumptions are also forward-looking. They take into account historicalrelationships, but are adjusted by our consultants to reflect expected capital market trends.
DEFINED CONTRIBUTION PLAN
We have a defined contribution (“401(k)”) savings plan in which substantially all of our U.S. employees areeligible to participate. Company contributions to the 401(k) savings plan are based on the amount of employeecontributions. We match 100% of each participant’s first six percent of compensation contributed to the plan.Charges to expense with respect to this plan totaled $9.0 million for 2006, $7.8 million for 2005, $6.6 million for2004.
98
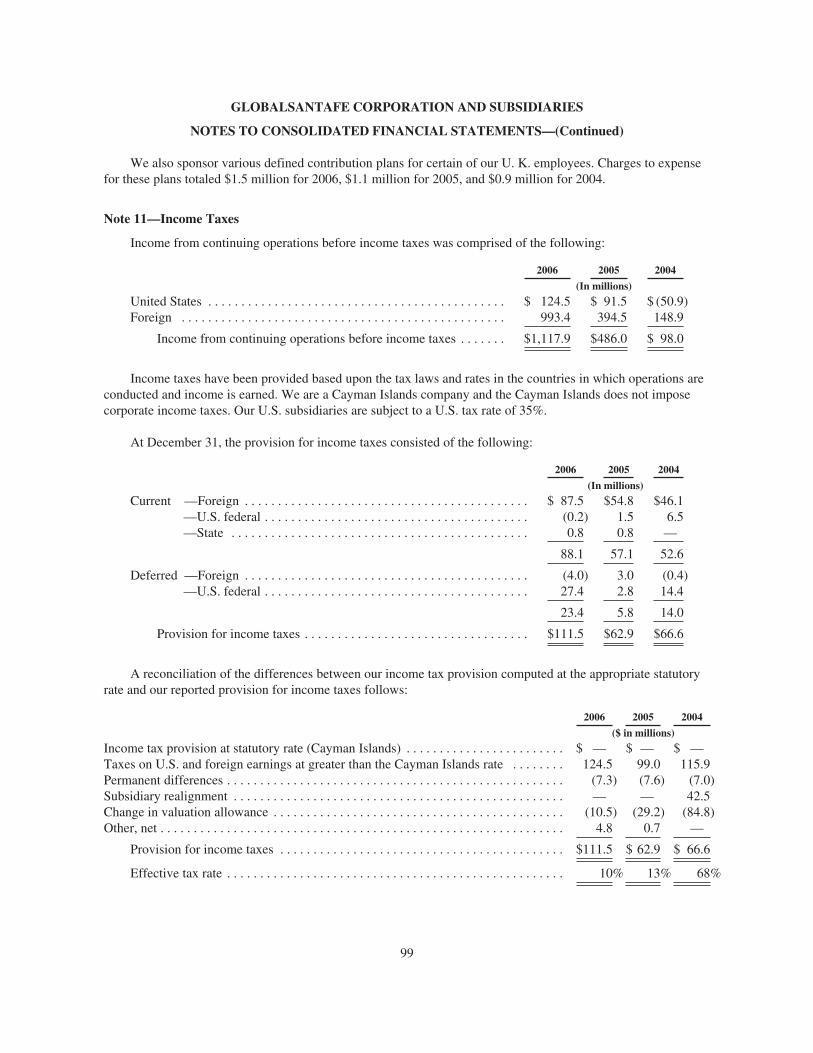
GLOBALSANTAFE CORPORATION AND SUBSIDIARIES
NOTES TO CONSOLIDATED FINANCIAL STATEMENTS—(Continued)
We also sponsor various defined contribution plans for certain of our U. K. employees. Charges to expensefor these plans totaled $1.5 million for 2006, $1.1 million for 2005, and $0.9 million for 2004.
Note 11—Income Taxes
Income from continuing operations before income taxes was comprised of the following:
2006 2005 2004
(In millions)
United States . . . . . . . . . . . . . . . . . . . . . . . . . . . . . . . . . . . . . . . . . . . . . $ 124.5 $ 91.5 $ (50.9)Foreign . . . . . . . . . . . . . . . . . . . . . . . . . . . . . . . . . . . . . . . . . . . . . . . . . 993.4 394.5 148.9
Income from continuing operations before income taxes . . . . . . . $1,117.9 $486.0 $ 98.0
Income taxes have been provided based upon the tax laws and rates in the countries in which operations areconducted and income is earned. We are a Cayman Islands company and the Cayman Islands does not imposecorporate income taxes. Our U.S. subsidiaries are subject to a U.S. tax rate of 35%.
At December 31, the provision for income taxes consisted of the following:
2006 2005 2004
(In millions)
Current —Foreign . . . . . . . . . . . . . . . . . . . . . . . . . . . . . . . . . . . . . . . . . . . $ 87.5 $54.8 $46.1—U.S. federal . . . . . . . . . . . . . . . . . . . . . . . . . . . . . . . . . . . . . . . . (0.2) 1.5 6.5—State . . . . . . . . . . . . . . . . . . . . . . . . . . . . . . . . . . . . . . . . . . . . . 0.8 0.8 —
88.1 57.1 52.6
Deferred —Foreign . . . . . . . . . . . . . . . . . . . . . . . . . . . . . . . . . . . . . . . . . . . (4.0) 3.0 (0.4)—U.S. federal . . . . . . . . . . . . . . . . . . . . . . . . . . . . . . . . . . . . . . . . 27.4 2.8 14.4
23.4 5.8 14.0
Provision for income taxes . . . . . . . . . . . . . . . . . . . . . . . . . . . . . . . . . . $111.5 $62.9 $66.6
A reconciliation of the differences between our income tax provision computed at the appropriate statutoryrate and our reported provision for income taxes follows:
2006 2005 2004
($ in millions)
Income tax provision at statutory rate (Cayman Islands) . . . . . . . . . . . . . . . . . . . . . . . . $ — $ — $ —Taxes on U.S. and foreign earnings at greater than the Cayman Islands rate . . . . . . . . 124.5 99.0 115.9Permanent differences . . . . . . . . . . . . . . . . . . . . . . . . . . . . . . . . . . . . . . . . . . . . . . . . . . . (7.3) (7.6) (7.0)Subsidiary realignment . . . . . . . . . . . . . . . . . . . . . . . . . . . . . . . . . . . . . . . . . . . . . . . . . . — — 42.5Change in valuation allowance . . . . . . . . . . . . . . . . . . . . . . . . . . . . . . . . . . . . . . . . . . . . (10.5) (29.2) (84.8)Other, net . . . . . . . . . . . . . . . . . . . . . . . . . . . . . . . . . . . . . . . . . . . . . . . . . . . . . . . . . . . . . 4.8 0.7 —
Provision for income taxes . . . . . . . . . . . . . . . . . . . . . . . . . . . . . . . . . . . . . . . . . . . $111.5 $ 62.9 $ 66.6
Effective tax rate . . . . . . . . . . . . . . . . . . . . . . . . . . . . . . . . . . . . . . . . . . . . . . . . . . . 10% 13% 68%
99
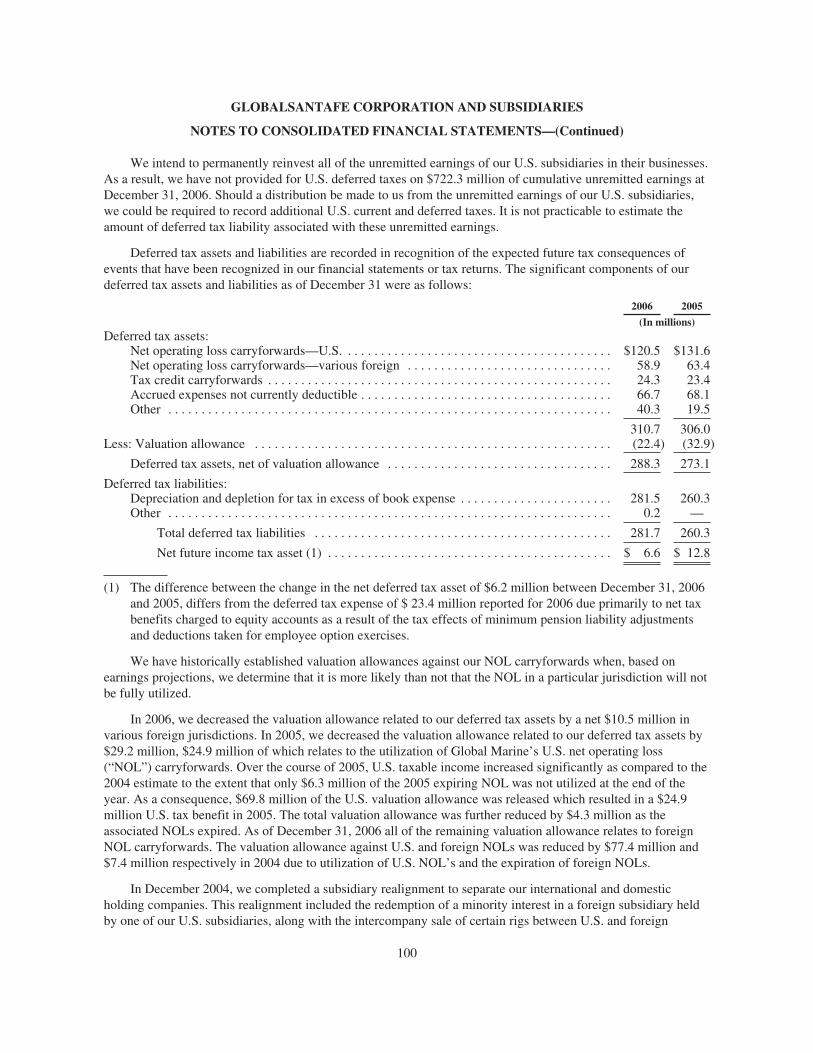
GLOBALSANTAFE CORPORATION AND SUBSIDIARIES
NOTES TO CONSOLIDATED FINANCIAL STATEMENTS—(Continued)
We intend to permanently reinvest all of the unremitted earnings of our U.S. subsidiaries in their businesses.As a result, we have not provided for U.S. deferred taxes on $722.3 million of cumulative unremitted earnings atDecember 31, 2006. Should a distribution be made to us from the unremitted earnings of our U.S. subsidiaries,we could be required to record additional U.S. current and deferred taxes. It is not practicable to estimate theamount of deferred tax liability associated with these unremitted earnings.
Deferred tax assets and liabilities are recorded in recognition of the expected future tax consequences ofevents that have been recognized in our financial statements or tax returns. The significant components of ourdeferred tax assets and liabilities as of December 31 were as follows:
2006 2005
(In millions)Deferred tax assets:
Net operating loss carryforwards—U.S. . . . . . . . . . . . . . . . . . . . . . . . . . . . . . . . . . . . . . . . . $120.5 $131.6Net operating loss carryforwards—various foreign . . . . . . . . . . . . . . . . . . . . . . . . . . . . . . . 58.9 63.4Tax credit carryforwards . . . . . . . . . . . . . . . . . . . . . . . . . . . . . . . . . . . . . . . . . . . . . . . . . . . . 24.3 23.4Accrued expenses not currently deductible . . . . . . . . . . . . . . . . . . . . . . . . . . . . . . . . . . . . . . 66.7 68.1Other . . . . . . . . . . . . . . . . . . . . . . . . . . . . . . . . . . . . . . . . . . . . . . . . . . . . . . . . . . . . . . . . . . . 40.3 19.5
310.7 306.0Less: Valuation allowance . . . . . . . . . . . . . . . . . . . . . . . . . . . . . . . . . . . . . . . . . . . . . . . . . . . . . . (22.4) (32.9)
Deferred tax assets, net of valuation allowance . . . . . . . . . . . . . . . . . . . . . . . . . . . . . . . . . . 288.3 273.1
Deferred tax liabilities:Depreciation and depletion for tax in excess of book expense . . . . . . . . . . . . . . . . . . . . . . . 281.5 260.3Other . . . . . . . . . . . . . . . . . . . . . . . . . . . . . . . . . . . . . . . . . . . . . . . . . . . . . . . . . . . . . . . . . . . 0.2 —
Total deferred tax liabilities . . . . . . . . . . . . . . . . . . . . . . . . . . . . . . . . . . . . . . . . . . . . . 281.7 260.3
Net future income tax asset (1) . . . . . . . . . . . . . . . . . . . . . . . . . . . . . . . . . . . . . . . . . . . $ 6.6 $ 12.8
(1) The difference between the change in the net deferred tax asset of $6.2 million between December 31, 2006and 2005, differs from the deferred tax expense of $ 23.4 million reported for 2006 due primarily to net taxbenefits charged to equity accounts as a result of the tax effects of minimum pension liability adjustmentsand deductions taken for employee option exercises.
We have historically established valuation allowances against our NOL carryforwards when, based onearnings projections, we determine that it is more likely than not that the NOL in a particular jurisdiction will notbe fully utilized.
In 2006, we decreased the valuation allowance related to our deferred tax assets by a net $10.5 million invarious foreign jurisdictions. In 2005, we decreased the valuation allowance related to our deferred tax assets by$29.2 million, $24.9 million of which relates to the utilization of Global Marine’s U.S. net operating loss(“NOL”) carryforwards. Over the course of 2005, U.S. taxable income increased significantly as compared to the2004 estimate to the extent that only $6.3 million of the 2005 expiring NOL was not utilized at the end of theyear. As a consequence, $69.8 million of the U.S. valuation allowance was released which resulted in a $24.9million U.S. tax benefit in 2005. The total valuation allowance was further reduced by $4.3 million as theassociated NOLs expired. As of December 31, 2006 all of the remaining valuation allowance relates to foreignNOL carryforwards. The valuation allowance against U.S. and foreign NOLs was reduced by $77.4 million and$7.4 million respectively in 2004 due to utilization of U.S. NOL’s and the expiration of foreign NOLs.
In December 2004, we completed a subsidiary realignment to separate our international and domesticholding companies. This realignment included the redemption of a minority interest in a foreign subsidiary heldby one of our U.S. subsidiaries, along with the intercompany sale of certain rigs between U.S. and foreign
100
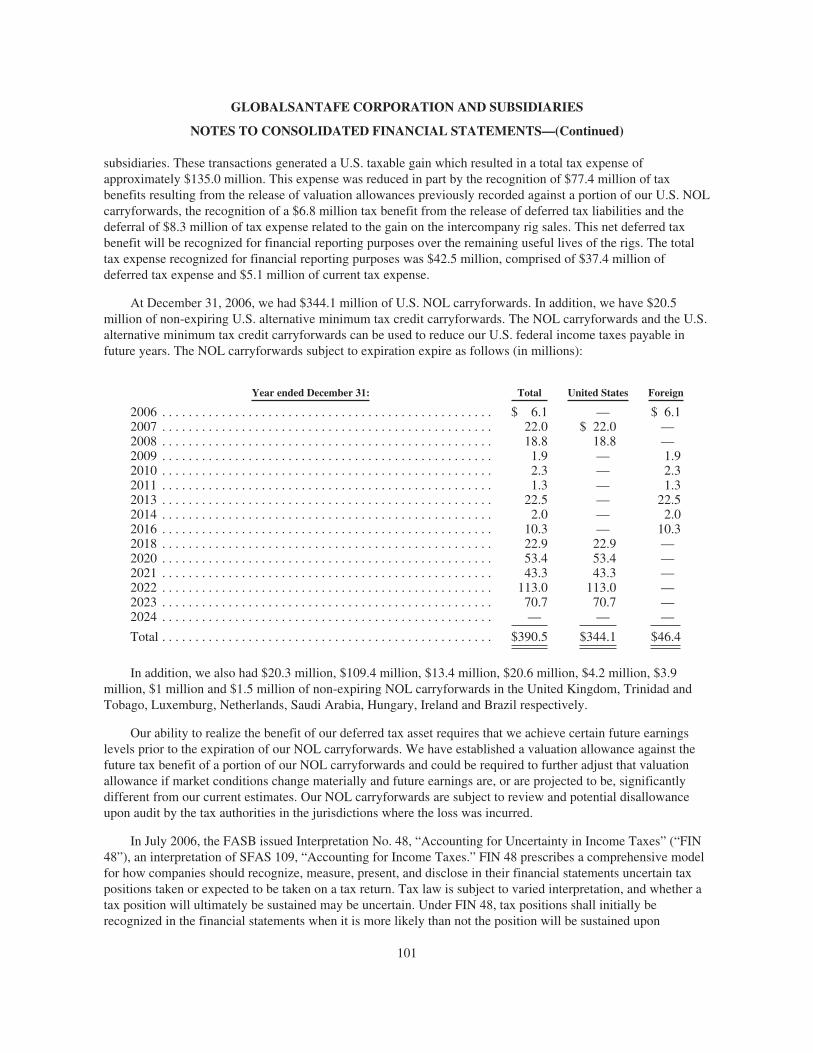
GLOBALSANTAFE CORPORATION AND SUBSIDIARIES
NOTES TO CONSOLIDATED FINANCIAL STATEMENTS—(Continued)
subsidiaries. These transactions generated a U.S. taxable gain which resulted in a total tax expense ofapproximately $135.0 million. This expense was reduced in part by the recognition of $77.4 million of taxbenefits resulting from the release of valuation allowances previously recorded against a portion of our U.S. NOLcarryforwards, the recognition of a $6.8 million tax benefit from the release of deferred tax liabilities and thedeferral of $8.3 million of tax expense related to the gain on the intercompany rig sales. This net deferred taxbenefit will be recognized for financial reporting purposes over the remaining useful lives of the rigs. The totaltax expense recognized for financial reporting purposes was $42.5 million, comprised of $37.4 million ofdeferred tax expense and $5.1 million of current tax expense.
At December 31, 2006, we had $344.1 million of U.S. NOL carryforwards. In addition, we have $20.5million of non-expiring U.S. alternative minimum tax credit carryforwards. The NOL carryforwards and the U.S.alternative minimum tax credit carryforwards can be used to reduce our U.S. federal income taxes payable infuture years. The NOL carryforwards subject to expiration expire as follows (in millions):
Year ended December 31: Total United States Foreign
2006 . . . . . . . . . . . . . . . . . . . . . . . . . . . . . . . . . . . . . . . . . . . . . . . . . . $ 6.1 — $ 6.12007 . . . . . . . . . . . . . . . . . . . . . . . . . . . . . . . . . . . . . . . . . . . . . . . . . . 22.0 $ 22.0 —2008 . . . . . . . . . . . . . . . . . . . . . . . . . . . . . . . . . . . . . . . . . . . . . . . . . . 18.8 18.8 —2009 . . . . . . . . . . . . . . . . . . . . . . . . . . . . . . . . . . . . . . . . . . . . . . . . . . 1.9 — 1.92010 . . . . . . . . . . . . . . . . . . . . . . . . . . . . . . . . . . . . . . . . . . . . . . . . . . 2.3 — 2.32011 . . . . . . . . . . . . . . . . . . . . . . . . . . . . . . . . . . . . . . . . . . . . . . . . . . 1.3 — 1.32013 . . . . . . . . . . . . . . . . . . . . . . . . . . . . . . . . . . . . . . . . . . . . . . . . . . 22.5 — 22.52014 . . . . . . . . . . . . . . . . . . . . . . . . . . . . . . . . . . . . . . . . . . . . . . . . . . 2.0 — 2.02016 . . . . . . . . . . . . . . . . . . . . . . . . . . . . . . . . . . . . . . . . . . . . . . . . . . 10.3 — 10.32018 . . . . . . . . . . . . . . . . . . . . . . . . . . . . . . . . . . . . . . . . . . . . . . . . . . 22.9 22.9 —2020 . . . . . . . . . . . . . . . . . . . . . . . . . . . . . . . . . . . . . . . . . . . . . . . . . . 53.4 53.4 —2021 . . . . . . . . . . . . . . . . . . . . . . . . . . . . . . . . . . . . . . . . . . . . . . . . . . 43.3 43.3 —2022 . . . . . . . . . . . . . . . . . . . . . . . . . . . . . . . . . . . . . . . . . . . . . . . . . . 113.0 113.0 —2023 . . . . . . . . . . . . . . . . . . . . . . . . . . . . . . . . . . . . . . . . . . . . . . . . . . 70.7 70.7 —2024 . . . . . . . . . . . . . . . . . . . . . . . . . . . . . . . . . . . . . . . . . . . . . . . . . . — — —
Total . . . . . . . . . . . . . . . . . . . . . . . . . . . . . . . . . . . . . . . . . . . . . . . . . . $390.5 $344.1 $46.4
In addition, we also had $20.3 million, $109.4 million, $13.4 million, $20.6 million, $4.2 million, $3.9million, $1 million and $1.5 million of non-expiring NOL carryforwards in the United Kingdom, Trinidad andTobago, Luxemburg, Netherlands, Saudi Arabia, Hungary, Ireland and Brazil respectively.
Our ability to realize the benefit of our deferred tax asset requires that we achieve certain future earningslevels prior to the expiration of our NOL carryforwards. We have established a valuation allowance against thefuture tax benefit of a portion of our NOL carryforwards and could be required to further adjust that valuationallowance if market conditions change materially and future earnings are, or are projected to be, significantlydifferent from our current estimates. Our NOL carryforwards are subject to review and potential disallowanceupon audit by the tax authorities in the jurisdictions where the loss was incurred.
In July 2006, the FASB issued Interpretation No. 48, “Accounting for Uncertainty in Income Taxes” (“FIN48”), an interpretation of SFAS 109, “Accounting for Income Taxes.” FIN 48 prescribes a comprehensive modelfor how companies should recognize, measure, present, and disclose in their financial statements uncertain taxpositions taken or expected to be taken on a tax return. Tax law is subject to varied interpretation, and whether atax position will ultimately be sustained may be uncertain. Under FIN 48, tax positions shall initially berecognized in the financial statements when it is more likely than not the position will be sustained upon
101
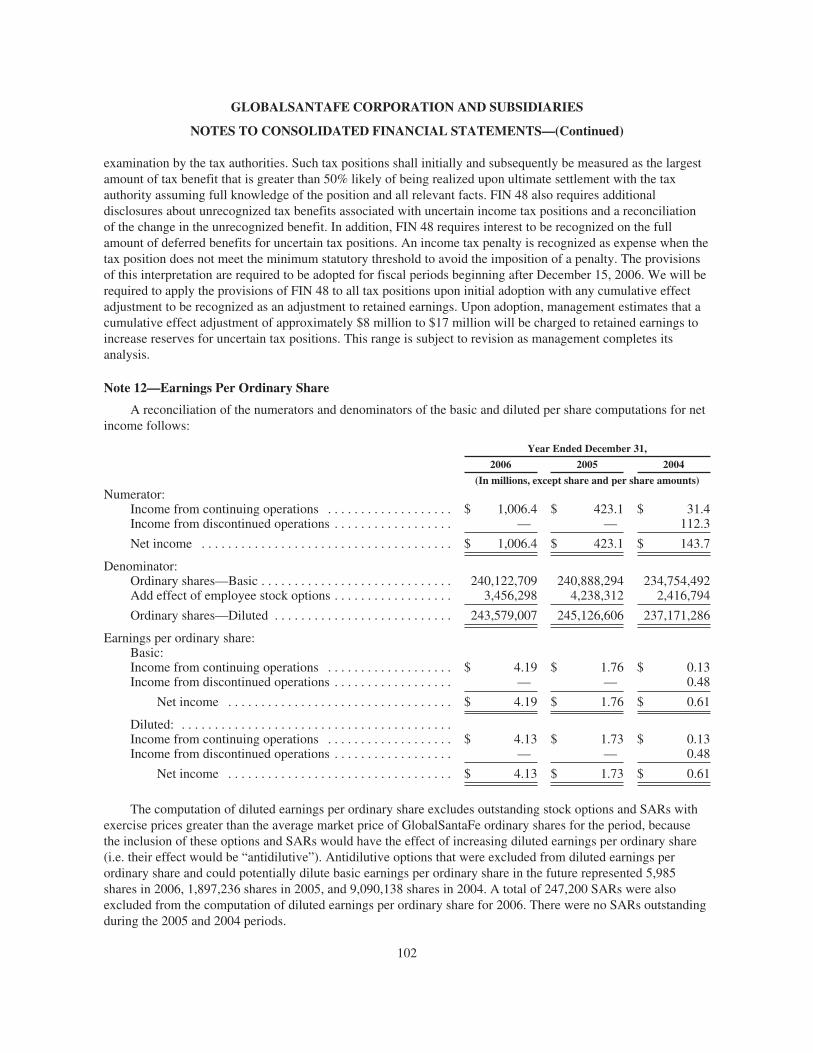
GLOBALSANTAFE CORPORATION AND SUBSIDIARIES
NOTES TO CONSOLIDATED FINANCIAL STATEMENTS—(Continued)
examination by the tax authorities. Such tax positions shall initially and subsequently be measured as the largestamount of tax benefit that is greater than 50% likely of being realized upon ultimate settlement with the taxauthority assuming full knowledge of the position and all relevant facts. FIN 48 also requires additionaldisclosures about unrecognized tax benefits associated with uncertain income tax positions and a reconciliationof the change in the unrecognized benefit. In addition, FIN 48 requires interest to be recognized on the fullamount of deferred benefits for uncertain tax positions. An income tax penalty is recognized as expense when thetax position does not meet the minimum statutory threshold to avoid the imposition of a penalty. The provisionsof this interpretation are required to be adopted for fiscal periods beginning after December 15, 2006. We will berequired to apply the provisions of FIN 48 to all tax positions upon initial adoption with any cumulative effectadjustment to be recognized as an adjustment to retained earnings. Upon adoption, management estimates that acumulative effect adjustment of approximately $8 million to $17 million will be charged to retained earnings toincrease reserves for uncertain tax positions. This range is subject to revision as management completes itsanalysis.
Note 12—Earnings Per Ordinary Share
A reconciliation of the numerators and denominators of the basic and diluted per share computations for netincome follows:
Year Ended December 31,
2006 2005 2004
(In millions, except share and per share amounts)Numerator:
Income from continuing operations . . . . . . . . . . . . . . . . . . . $ 1,006.4 $ 423.1 $ 31.4Income from discontinued operations . . . . . . . . . . . . . . . . . . — — 112.3
Net income . . . . . . . . . . . . . . . . . . . . . . . . . . . . . . . . . . . . . . $ 1,006.4 $ 423.1 $ 143.7
Denominator:Ordinary shares—Basic . . . . . . . . . . . . . . . . . . . . . . . . . . . . . 240,122,709 240,888,294 234,754,492Add effect of employee stock options . . . . . . . . . . . . . . . . . . 3,456,298 4,238,312 2,416,794
Ordinary shares—Diluted . . . . . . . . . . . . . . . . . . . . . . . . . . . 243,579,007 245,126,606 237,171,286
Earnings per ordinary share:Basic:Income from continuing operations . . . . . . . . . . . . . . . . . . . $ 4.19 $ 1.76 $ 0.13Income from discontinued operations . . . . . . . . . . . . . . . . . . — — 0.48
Net income . . . . . . . . . . . . . . . . . . . . . . . . . . . . . . . . . . $ 4.19 $ 1.76 $ 0.61
Diluted: . . . . . . . . . . . . . . . . . . . . . . . . . . . . . . . . . . . . . . . . .Income from continuing operations . . . . . . . . . . . . . . . . . . . $ 4.13 $ 1.73 $ 0.13Income from discontinued operations . . . . . . . . . . . . . . . . . . — — 0.48
Net income . . . . . . . . . . . . . . . . . . . . . . . . . . . . . . . . . . $ 4.13 $ 1.73 $ 0.61
The computation of diluted earnings per ordinary share excludes outstanding stock options and SARs withexercise prices greater than the average market price of GlobalSantaFe ordinary shares for the period, becausethe inclusion of these options and SARs would have the effect of increasing diluted earnings per ordinary share(i.e. their effect would be “antidilutive”). Antidilutive options that were excluded from diluted earnings perordinary share and could potentially dilute basic earnings per ordinary share in the future represented 5,985shares in 2006, 1,897,236 shares in 2005, and 9,090,138 shares in 2004. A total of 247,200 SARs were alsoexcluded from the computation of diluted earnings per ordinary share for 2006. There were no SARs outstandingduring the 2005 and 2004 periods.
102
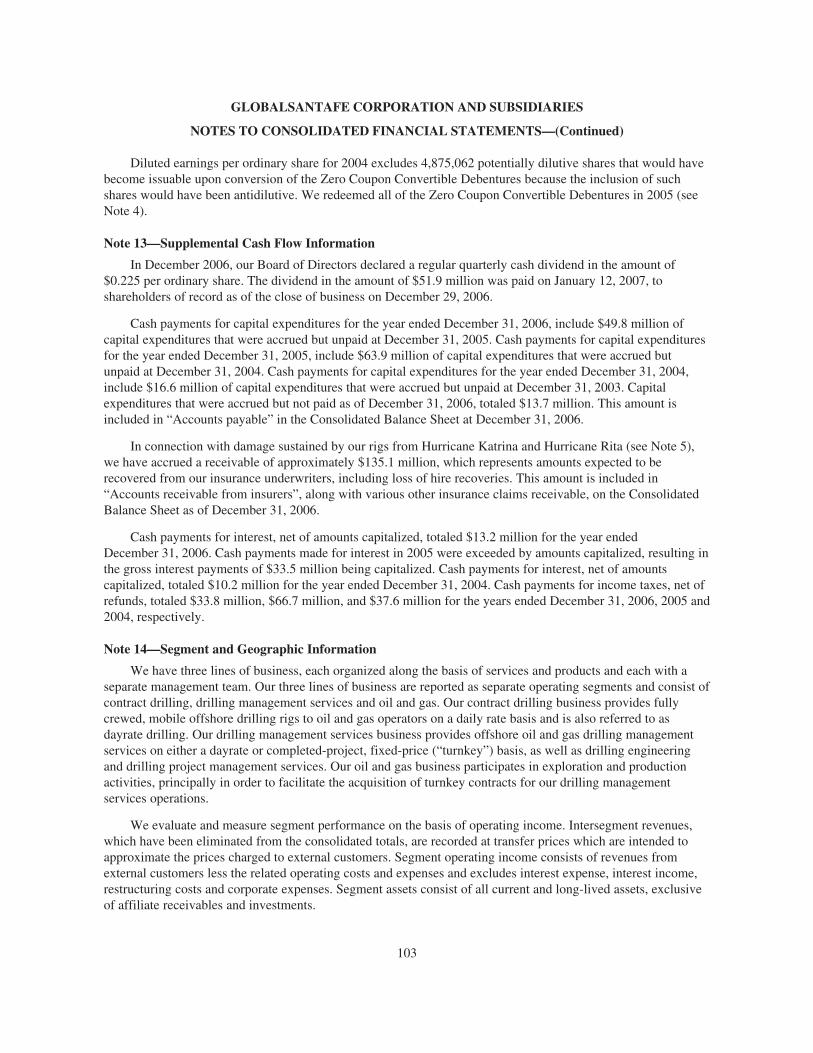
GLOBALSANTAFE CORPORATION AND SUBSIDIARIES
NOTES TO CONSOLIDATED FINANCIAL STATEMENTS—(Continued)
Diluted earnings per ordinary share for 2004 excludes 4,875,062 potentially dilutive shares that would havebecome issuable upon conversion of the Zero Coupon Convertible Debentures because the inclusion of suchshares would have been antidilutive. We redeemed all of the Zero Coupon Convertible Debentures in 2005 (seeNote 4).
Note 13—Supplemental Cash Flow Information
In December 2006, our Board of Directors declared a regular quarterly cash dividend in the amount of$0.225 per ordinary share. The dividend in the amount of $51.9 million was paid on January 12, 2007, toshareholders of record as of the close of business on December 29, 2006.
Cash payments for capital expenditures for the year ended December 31, 2006, include $49.8 million ofcapital expenditures that were accrued but unpaid at December 31, 2005. Cash payments for capital expendituresfor the year ended December 31, 2005, include $63.9 million of capital expenditures that were accrued butunpaid at December 31, 2004. Cash payments for capital expenditures for the year ended December 31, 2004,include $16.6 million of capital expenditures that were accrued but unpaid at December 31, 2003. Capitalexpenditures that were accrued but not paid as of December 31, 2006, totaled $13.7 million. This amount isincluded in “Accounts payable” in the Consolidated Balance Sheet at December 31, 2006.
In connection with damage sustained by our rigs from Hurricane Katrina and Hurricane Rita (see Note 5),we have accrued a receivable of approximately $135.1 million, which represents amounts expected to berecovered from our insurance underwriters, including loss of hire recoveries. This amount is included in“Accounts receivable from insurers”, along with various other insurance claims receivable, on the ConsolidatedBalance Sheet as of December 31, 2006.
Cash payments for interest, net of amounts capitalized, totaled $13.2 million for the year endedDecember 31, 2006. Cash payments made for interest in 2005 were exceeded by amounts capitalized, resulting inthe gross interest payments of $33.5 million being capitalized. Cash payments for interest, net of amountscapitalized, totaled $10.2 million for the year ended December 31, 2004. Cash payments for income taxes, net ofrefunds, totaled $33.8 million, $66.7 million, and $37.6 million for the years ended December 31, 2006, 2005 and2004, respectively.
Note 14—Segment and Geographic Information
We have three lines of business, each organized along the basis of services and products and each with aseparate management team. Our three lines of business are reported as separate operating segments and consist ofcontract drilling, drilling management services and oil and gas. Our contract drilling business provides fullycrewed, mobile offshore drilling rigs to oil and gas operators on a daily rate basis and is also referred to asdayrate drilling. Our drilling management services business provides offshore oil and gas drilling managementservices on either a dayrate or completed-project, fixed-price (“turnkey”) basis, as well as drilling engineeringand drilling project management services. Our oil and gas business participates in exploration and productionactivities, principally in order to facilitate the acquisition of turnkey contracts for our drilling managementservices operations.
We evaluate and measure segment performance on the basis of operating income. Intersegment revenues,which have been eliminated from the consolidated totals, are recorded at transfer prices which are intended toapproximate the prices charged to external customers. Segment operating income consists of revenues fromexternal customers less the related operating costs and expenses and excludes interest expense, interest income,restructuring costs and corporate expenses. Segment assets consist of all current and long-lived assets, exclusiveof affiliate receivables and investments.
103
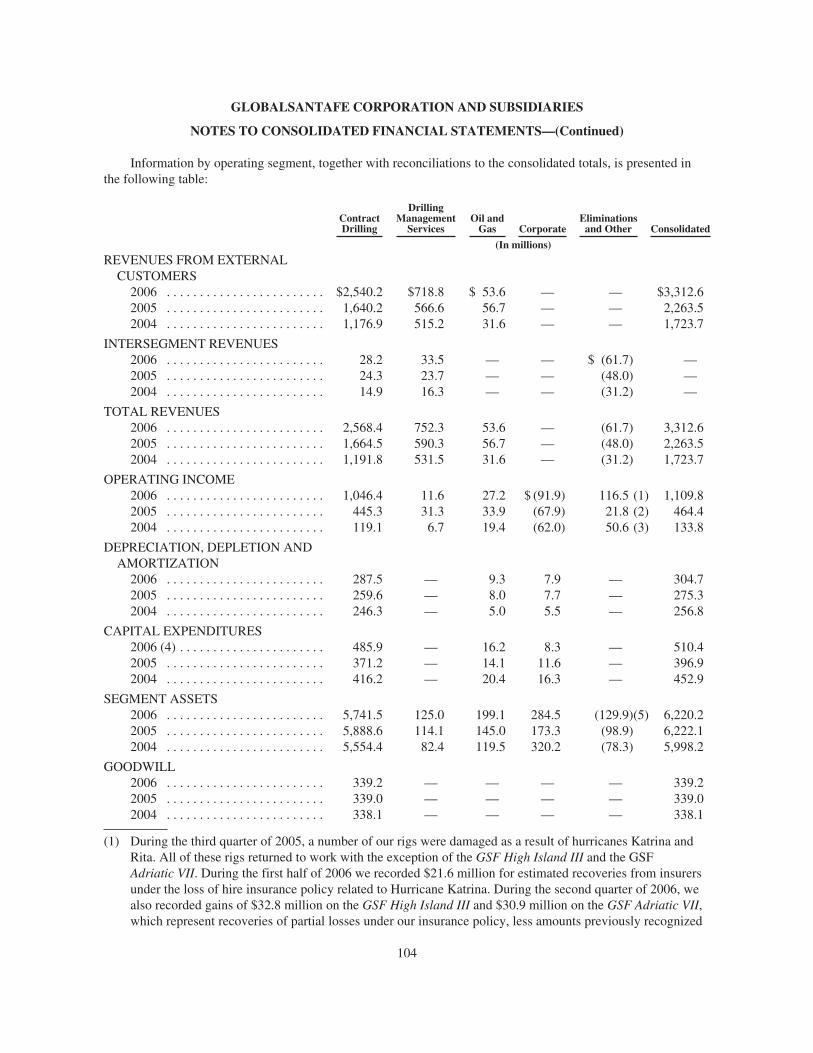
GLOBALSANTAFE CORPORATION AND SUBSIDIARIES
NOTES TO CONSOLIDATED FINANCIAL STATEMENTS—(Continued)
Information by operating segment, together with reconciliations to the consolidated totals, is presented inthe following table:
ContractDrilling
DrillingManagement
ServicesOil and
Gas CorporateEliminations
and Other Consolidated
(In millions)
REVENUES FROM EXTERNALCUSTOMERS
2006 . . . . . . . . . . . . . . . . . . . . . . . . $2,540.2 $718.8 $ 53.6 — — $3,312.62005 . . . . . . . . . . . . . . . . . . . . . . . . 1,640.2 566.6 56.7 — — 2,263.52004 . . . . . . . . . . . . . . . . . . . . . . . . 1,176.9 515.2 31.6 — — 1,723.7
INTERSEGMENT REVENUES2006 . . . . . . . . . . . . . . . . . . . . . . . . 28.2 33.5 — — $ (61.7) —2005 . . . . . . . . . . . . . . . . . . . . . . . . 24.3 23.7 — — (48.0) —2004 . . . . . . . . . . . . . . . . . . . . . . . . 14.9 16.3 — — (31.2) —
TOTAL REVENUES2006 . . . . . . . . . . . . . . . . . . . . . . . . 2,568.4 752.3 53.6 — (61.7) 3,312.62005 . . . . . . . . . . . . . . . . . . . . . . . . 1,664.5 590.3 56.7 — (48.0) 2,263.52004 . . . . . . . . . . . . . . . . . . . . . . . . 1,191.8 531.5 31.6 — (31.2) 1,723.7
OPERATING INCOME2006 . . . . . . . . . . . . . . . . . . . . . . . . 1,046.4 11.6 27.2 $ (91.9) 116.5 (1) 1,109.82005 . . . . . . . . . . . . . . . . . . . . . . . . 445.3 31.3 33.9 (67.9) 21.8 (2) 464.42004 . . . . . . . . . . . . . . . . . . . . . . . . 119.1 6.7 19.4 (62.0) 50.6 (3) 133.8
DEPRECIATION, DEPLETION ANDAMORTIZATION
2006 . . . . . . . . . . . . . . . . . . . . . . . . 287.5 — 9.3 7.9 — 304.72005 . . . . . . . . . . . . . . . . . . . . . . . . 259.6 — 8.0 7.7 — 275.32004 . . . . . . . . . . . . . . . . . . . . . . . . 246.3 — 5.0 5.5 — 256.8
CAPITAL EXPENDITURES2006 (4) . . . . . . . . . . . . . . . . . . . . . . 485.9 — 16.2 8.3 — 510.42005 . . . . . . . . . . . . . . . . . . . . . . . . 371.2 — 14.1 11.6 — 396.92004 . . . . . . . . . . . . . . . . . . . . . . . . 416.2 — 20.4 16.3 — 452.9
SEGMENT ASSETS2006 . . . . . . . . . . . . . . . . . . . . . . . . 5,741.5 125.0 199.1 284.5 (129.9)(5) 6,220.22005 . . . . . . . . . . . . . . . . . . . . . . . . 5,888.6 114.1 145.0 173.3 (98.9) 6,222.12004 . . . . . . . . . . . . . . . . . . . . . . . . 5,554.4 82.4 119.5 320.2 (78.3) 5,998.2
GOODWILL2006 . . . . . . . . . . . . . . . . . . . . . . . . 339.2 — — — — 339.22005 . . . . . . . . . . . . . . . . . . . . . . . . 339.0 — — — — 339.02004 . . . . . . . . . . . . . . . . . . . . . . . . 338.1 — — — — 338.1
(1) During the third quarter of 2005, a number of our rigs were damaged as a result of hurricanes Katrina andRita. All of these rigs returned to work with the exception of the GSF High Island III and the GSFAdriatic VII. During the first half of 2006 we recorded $21.6 million for estimated recoveries from insurersunder the loss of hire insurance policy related to Hurricane Katrina. During the second quarter of 2006, wealso recorded gains of $32.8 million on the GSF High Island III and $30.9 million on the GSF Adriatic VII,which represent recoveries of partial losses under our insurance policy, less amounts previously recognized
104
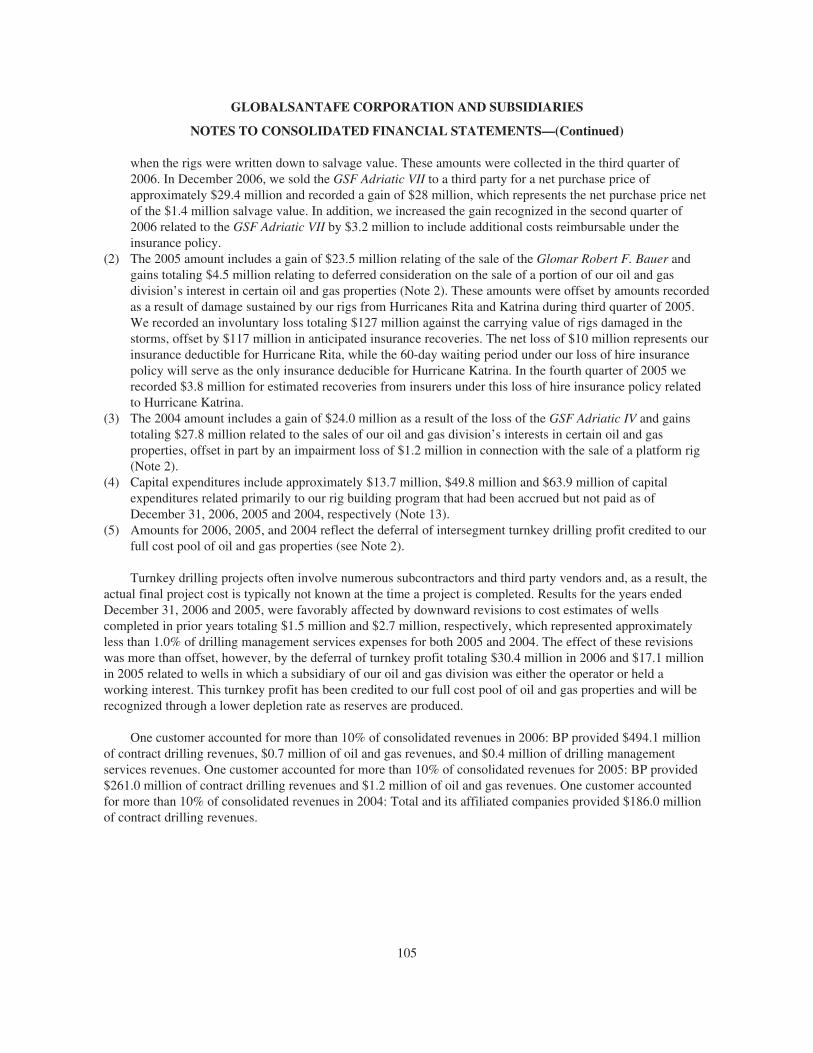
GLOBALSANTAFE CORPORATION AND SUBSIDIARIES
NOTES TO CONSOLIDATED FINANCIAL STATEMENTS—(Continued)
when the rigs were written down to salvage value. These amounts were collected in the third quarter of2006. In December 2006, we sold the GSF Adriatic VII to a third party for a net purchase price ofapproximately $29.4 million and recorded a gain of $28 million, which represents the net purchase price netof the $1.4 million salvage value. In addition, we increased the gain recognized in the second quarter of2006 related to the GSF Adriatic VII by $3.2 million to include additional costs reimbursable under theinsurance policy.
(2) The 2005 amount includes a gain of $23.5 million relating of the sale of the Glomar Robert F. Bauer andgains totaling $4.5 million relating to deferred consideration on the sale of a portion of our oil and gasdivision’s interest in certain oil and gas properties (Note 2). These amounts were offset by amounts recordedas a result of damage sustained by our rigs from Hurricanes Rita and Katrina during third quarter of 2005.We recorded an involuntary loss totaling $127 million against the carrying value of rigs damaged in thestorms, offset by $117 million in anticipated insurance recoveries. The net loss of $10 million represents ourinsurance deductible for Hurricane Rita, while the 60-day waiting period under our loss of hire insurancepolicy will serve as the only insurance deducible for Hurricane Katrina. In the fourth quarter of 2005 werecorded $3.8 million for estimated recoveries from insurers under this loss of hire insurance policy relatedto Hurricane Katrina.
(3) The 2004 amount includes a gain of $24.0 million as a result of the loss of the GSF Adriatic IV and gainstotaling $27.8 million related to the sales of our oil and gas division’s interests in certain oil and gasproperties, offset in part by an impairment loss of $1.2 million in connection with the sale of a platform rig(Note 2).
(4) Capital expenditures include approximately $13.7 million, $49.8 million and $63.9 million of capitalexpenditures related primarily to our rig building program that had been accrued but not paid as ofDecember 31, 2006, 2005 and 2004, respectively (Note 13).
(5) Amounts for 2006, 2005, and 2004 reflect the deferral of intersegment turnkey drilling profit credited to ourfull cost pool of oil and gas properties (see Note 2).
Turnkey drilling projects often involve numerous subcontractors and third party vendors and, as a result, theactual final project cost is typically not known at the time a project is completed. Results for the years endedDecember 31, 2006 and 2005, were favorably affected by downward revisions to cost estimates of wellscompleted in prior years totaling $1.5 million and $2.7 million, respectively, which represented approximatelyless than 1.0% of drilling management services expenses for both 2005 and 2004. The effect of these revisionswas more than offset, however, by the deferral of turnkey profit totaling $30.4 million in 2006 and $17.1 millionin 2005 related to wells in which a subsidiary of our oil and gas division was either the operator or held aworking interest. This turnkey profit has been credited to our full cost pool of oil and gas properties and will berecognized through a lower depletion rate as reserves are produced.
One customer accounted for more than 10% of consolidated revenues in 2006: BP provided $494.1 millionof contract drilling revenues, $0.7 million of oil and gas revenues, and $0.4 million of drilling managementservices revenues. One customer accounted for more than 10% of consolidated revenues for 2005: BP provided$261.0 million of contract drilling revenues and $1.2 million of oil and gas revenues. One customer accountedfor more than 10% of consolidated revenues in 2004: Total and its affiliated companies provided $186.0 millionof contract drilling revenues.
105
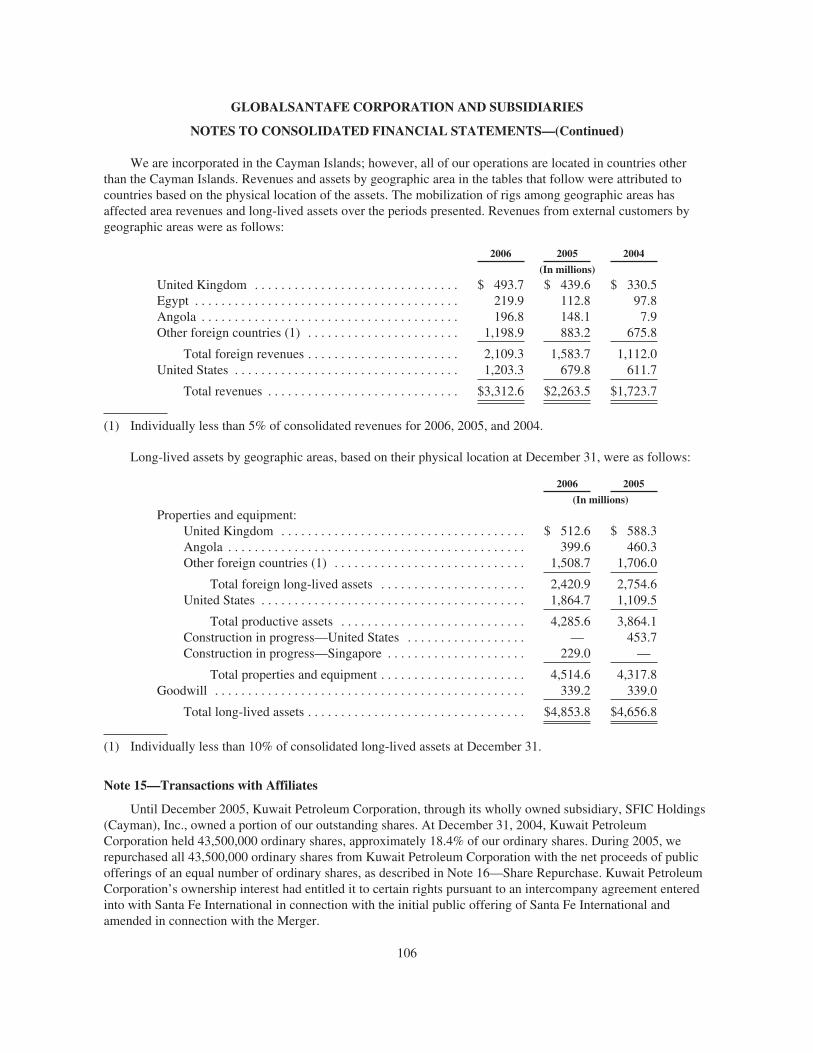
GLOBALSANTAFE CORPORATION AND SUBSIDIARIES
NOTES TO CONSOLIDATED FINANCIAL STATEMENTS—(Continued)
We are incorporated in the Cayman Islands; however, all of our operations are located in countries otherthan the Cayman Islands. Revenues and assets by geographic area in the tables that follow were attributed tocountries based on the physical location of the assets. The mobilization of rigs among geographic areas hasaffected area revenues and long-lived assets over the periods presented. Revenues from external customers bygeographic areas were as follows:
2006 2005 2004
(In millions)
United Kingdom . . . . . . . . . . . . . . . . . . . . . . . . . . . . . . . $ 493.7 $ 439.6 $ 330.5Egypt . . . . . . . . . . . . . . . . . . . . . . . . . . . . . . . . . . . . . . . . 219.9 112.8 97.8Angola . . . . . . . . . . . . . . . . . . . . . . . . . . . . . . . . . . . . . . . 196.8 148.1 7.9Other foreign countries (1) . . . . . . . . . . . . . . . . . . . . . . . 1,198.9 883.2 675.8
Total foreign revenues . . . . . . . . . . . . . . . . . . . . . . . 2,109.3 1,583.7 1,112.0United States . . . . . . . . . . . . . . . . . . . . . . . . . . . . . . . . . . 1,203.3 679.8 611.7
Total revenues . . . . . . . . . . . . . . . . . . . . . . . . . . . . . $3,312.6 $2,263.5 $1,723.7
(1) Individually less than 5% of consolidated revenues for 2006, 2005, and 2004.
Long-lived assets by geographic areas, based on their physical location at December 31, were as follows:
2006 2005
(In millions)
Properties and equipment:United Kingdom . . . . . . . . . . . . . . . . . . . . . . . . . . . . . . . . . . . . . $ 512.6 $ 588.3Angola . . . . . . . . . . . . . . . . . . . . . . . . . . . . . . . . . . . . . . . . . . . . . 399.6 460.3Other foreign countries (1) . . . . . . . . . . . . . . . . . . . . . . . . . . . . . 1,508.7 1,706.0
Total foreign long-lived assets . . . . . . . . . . . . . . . . . . . . . . 2,420.9 2,754.6United States . . . . . . . . . . . . . . . . . . . . . . . . . . . . . . . . . . . . . . . . 1,864.7 1,109.5
Total productive assets . . . . . . . . . . . . . . . . . . . . . . . . . . . . 4,285.6 3,864.1Construction in progress—United States . . . . . . . . . . . . . . . . . . — 453.7Construction in progress—Singapore . . . . . . . . . . . . . . . . . . . . . 229.0 —
Total properties and equipment . . . . . . . . . . . . . . . . . . . . . . 4,514.6 4,317.8Goodwill . . . . . . . . . . . . . . . . . . . . . . . . . . . . . . . . . . . . . . . . . . . . . . . 339.2 339.0
Total long-lived assets . . . . . . . . . . . . . . . . . . . . . . . . . . . . . . . . . $4,853.8 $4,656.8
(1) Individually less than 10% of consolidated long-lived assets at December 31.
Note 15—Transactions with Affiliates
Until December 2005, Kuwait Petroleum Corporation, through its wholly owned subsidiary, SFIC Holdings(Cayman), Inc., owned a portion of our outstanding shares. At December 31, 2004, Kuwait PetroleumCorporation held 43,500,000 ordinary shares, approximately 18.4% of our ordinary shares. During 2005, werepurchased all 43,500,000 ordinary shares from Kuwait Petroleum Corporation with the net proceeds of publicofferings of an equal number of ordinary shares, as described in Note 16—Share Repurchase. Kuwait PetroleumCorporation’s ownership interest had entitled it to certain rights pursuant to an intercompany agreement enteredinto with Santa Fe International in connection with the initial public offering of Santa Fe International andamended in connection with the Merger.
106
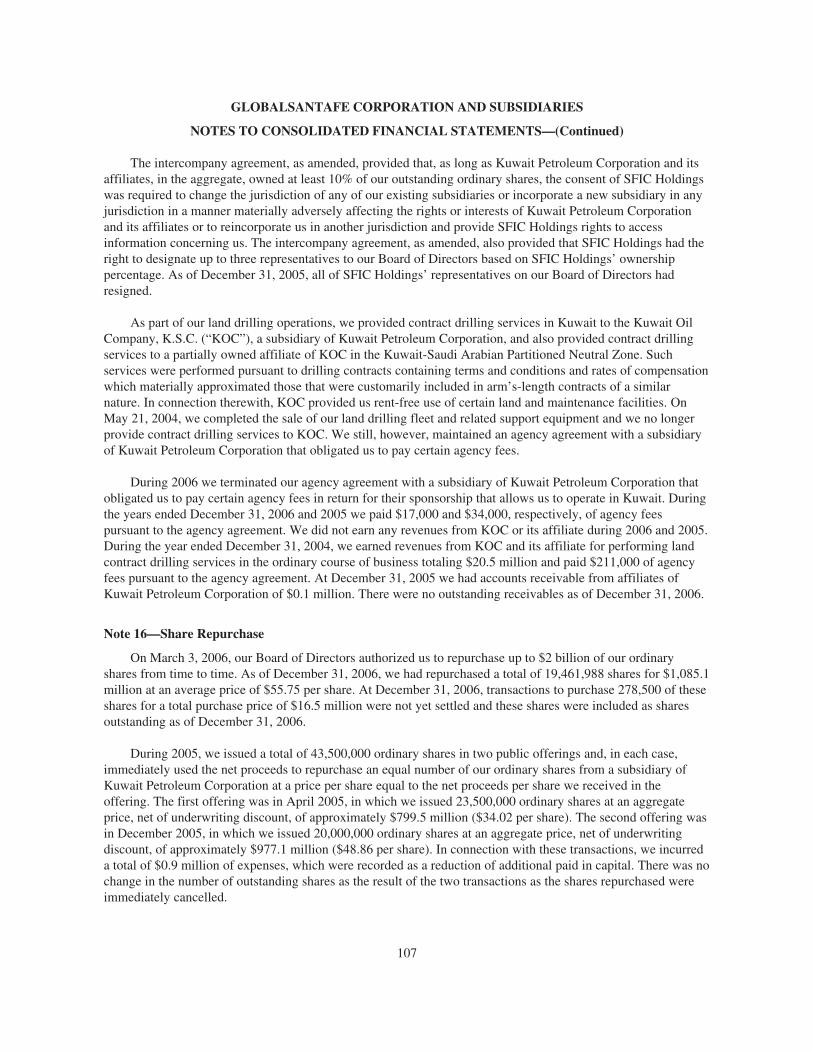
GLOBALSANTAFE CORPORATION AND SUBSIDIARIES
NOTES TO CONSOLIDATED FINANCIAL STATEMENTS—(Continued)
The intercompany agreement, as amended, provided that, as long as Kuwait Petroleum Corporation and itsaffiliates, in the aggregate, owned at least 10% of our outstanding ordinary shares, the consent of SFIC Holdingswas required to change the jurisdiction of any of our existing subsidiaries or incorporate a new subsidiary in anyjurisdiction in a manner materially adversely affecting the rights or interests of Kuwait Petroleum Corporationand its affiliates or to reincorporate us in another jurisdiction and provide SFIC Holdings rights to accessinformation concerning us. The intercompany agreement, as amended, also provided that SFIC Holdings had theright to designate up to three representatives to our Board of Directors based on SFIC Holdings’ ownershippercentage. As of December 31, 2005, all of SFIC Holdings’ representatives on our Board of Directors hadresigned.
As part of our land drilling operations, we provided contract drilling services in Kuwait to the Kuwait OilCompany, K.S.C. (“KOC”), a subsidiary of Kuwait Petroleum Corporation, and also provided contract drillingservices to a partially owned affiliate of KOC in the Kuwait-Saudi Arabian Partitioned Neutral Zone. Suchservices were performed pursuant to drilling contracts containing terms and conditions and rates of compensationwhich materially approximated those that were customarily included in arm’s-length contracts of a similarnature. In connection therewith, KOC provided us rent-free use of certain land and maintenance facilities. OnMay 21, 2004, we completed the sale of our land drilling fleet and related support equipment and we no longerprovide contract drilling services to KOC. We still, however, maintained an agency agreement with a subsidiaryof Kuwait Petroleum Corporation that obligated us to pay certain agency fees.
During 2006 we terminated our agency agreement with a subsidiary of Kuwait Petroleum Corporation thatobligated us to pay certain agency fees in return for their sponsorship that allows us to operate in Kuwait. Duringthe years ended December 31, 2006 and 2005 we paid $17,000 and $34,000, respectively, of agency feespursuant to the agency agreement. We did not earn any revenues from KOC or its affiliate during 2006 and 2005.During the year ended December 31, 2004, we earned revenues from KOC and its affiliate for performing landcontract drilling services in the ordinary course of business totaling $20.5 million and paid $211,000 of agencyfees pursuant to the agency agreement. At December 31, 2005 we had accounts receivable from affiliates ofKuwait Petroleum Corporation of $0.1 million. There were no outstanding receivables as of December 31, 2006.
Note 16—Share Repurchase
On March 3, 2006, our Board of Directors authorized us to repurchase up to $2 billion of our ordinaryshares from time to time. As of December 31, 2006, we had repurchased a total of 19,461,988 shares for $1,085.1million at an average price of $55.75 per share. At December 31, 2006, transactions to purchase 278,500 of theseshares for a total purchase price of $16.5 million were not yet settled and these shares were included as sharesoutstanding as of December 31, 2006.
During 2005, we issued a total of 43,500,000 ordinary shares in two public offerings and, in each case,immediately used the net proceeds to repurchase an equal number of our ordinary shares from a subsidiary ofKuwait Petroleum Corporation at a price per share equal to the net proceeds per share we received in theoffering. The first offering was in April 2005, in which we issued 23,500,000 ordinary shares at an aggregateprice, net of underwriting discount, of approximately $799.5 million ($34.02 per share). The second offering wasin December 2005, in which we issued 20,000,000 ordinary shares at an aggregate price, net of underwritingdiscount, of approximately $977.1 million ($48.86 per share). In connection with these transactions, we incurreda total of $0.9 million of expenses, which were recorded as a reduction of additional paid in capital. There was nochange in the number of outstanding shares as the result of the two transactions as the shares repurchased wereimmediately cancelled.
107
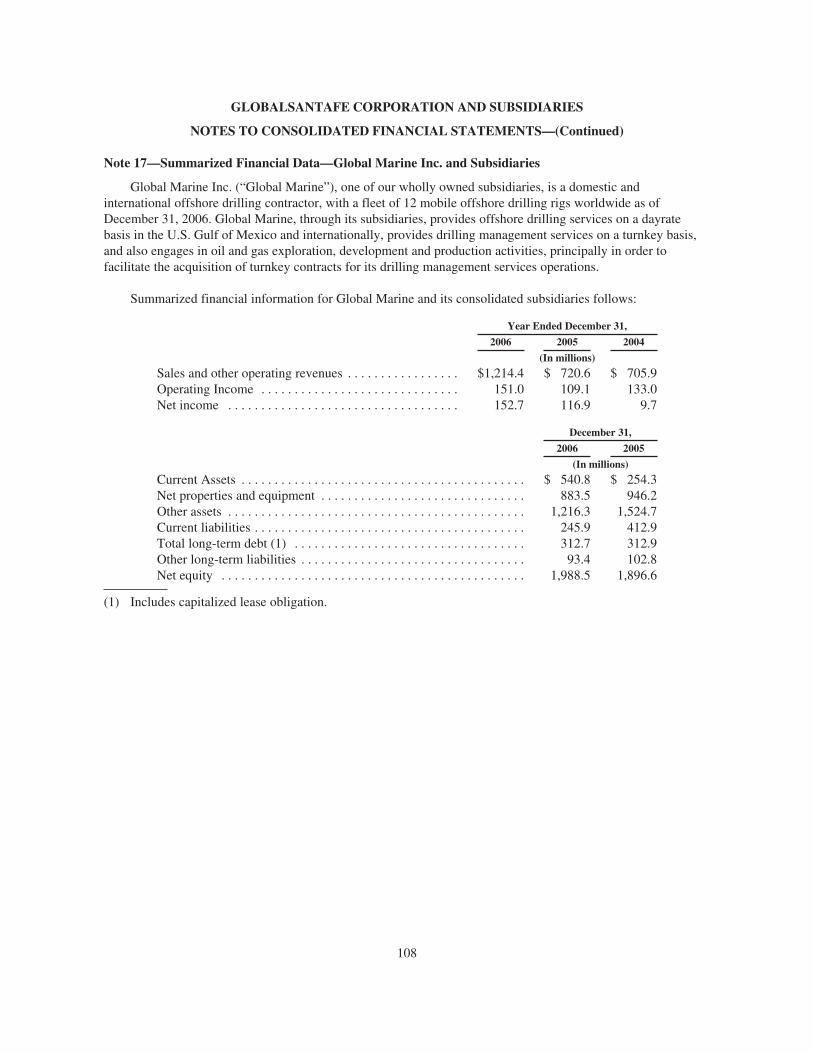
GLOBALSANTAFE CORPORATION AND SUBSIDIARIES
NOTES TO CONSOLIDATED FINANCIAL STATEMENTS—(Continued)
Note 17—Summarized Financial Data—Global Marine Inc. and Subsidiaries
Global Marine Inc. (“Global Marine”), one of our wholly owned subsidiaries, is a domestic andinternational offshore drilling contractor, with a fleet of 12 mobile offshore drilling rigs worldwide as ofDecember 31, 2006. Global Marine, through its subsidiaries, provides offshore drilling services on a dayratebasis in the U.S. Gulf of Mexico and internationally, provides drilling management services on a turnkey basis,and also engages in oil and gas exploration, development and production activities, principally in order tofacilitate the acquisition of turnkey contracts for its drilling management services operations.
Summarized financial information for Global Marine and its consolidated subsidiaries follows:
Year Ended December 31,
2006 2005 2004
(In millions)
Sales and other operating revenues . . . . . . . . . . . . . . . . . $1,214.4 $ 720.6 $ 705.9Operating Income . . . . . . . . . . . . . . . . . . . . . . . . . . . . . . 151.0 109.1 133.0Net income . . . . . . . . . . . . . . . . . . . . . . . . . . . . . . . . . . . 152.7 116.9 9.7
December 31,
2006 2005
(In millions)
Current Assets . . . . . . . . . . . . . . . . . . . . . . . . . . . . . . . . . . . . . . . . . . . $ 540.8 $ 254.3Net properties and equipment . . . . . . . . . . . . . . . . . . . . . . . . . . . . . . . 883.5 946.2Other assets . . . . . . . . . . . . . . . . . . . . . . . . . . . . . . . . . . . . . . . . . . . . . 1,216.3 1,524.7Current liabilities . . . . . . . . . . . . . . . . . . . . . . . . . . . . . . . . . . . . . . . . . 245.9 412.9Total long-term debt (1) . . . . . . . . . . . . . . . . . . . . . . . . . . . . . . . . . . . 312.7 312.9Other long-term liabilities . . . . . . . . . . . . . . . . . . . . . . . . . . . . . . . . . . 93.4 102.8Net equity . . . . . . . . . . . . . . . . . . . . . . . . . . . . . . . . . . . . . . . . . . . . . . 1,988.5 1,896.6
(1) Includes capitalized lease obligation.
108

SUPPLEMENTAL OIL AND GAS DISCLOSURE (Unaudited)
Pursuant to Statement of Financial Accounting Standards No. 69, “Disclosures about Oil and Gas ProducingActivities” (“SFAS 69”), we are required to provide supplemental oil and gas disclosures if our oil and gassubsidiaries are considered significant. In 2006 and 2005, our oil and gas operations were not consideredsignificant under the provisions in SFAS 69. Our estimated 2004 net proved reserves and proved developedreserves of crude oil, natural gas and natural gas liquids are shown in the table below.
2004
Gas Oil
Millions ofCubic feet
Thousands ofBarrels
United States:Proved Reserves:
Balance, January 1 . . . . . . . . . . . . . . . . . . . . . . . . . . . . . . . . . . . . . . . . . . . . . . . 5,906 287Increase (decrease) during the year attributable to:
Revisions of previous estimates . . . . . . . . . . . . . . . . . . . . . . . . . . . . . . . . . 181 56Extensions, discoveries and other additions . . . . . . . . . . . . . . . . . . . . . . . . 1,377 18Production . . . . . . . . . . . . . . . . . . . . . . . . . . . . . . . . . . . . . . . . . . . . . . . . . (2,752) (85)Sales of minerals in place . . . . . . . . . . . . . . . . . . . . . . . . . . . . . . . . . . . . . . 402 1
Balance, December 31 . . . . . . . . . . . . . . . . . . . . . . . . . . . . . . . . . . . . . . . . . . . . 5,114 277
Proved Developed Reserves:January 1 . . . . . . . . . . . . . . . . . . . . . . . . . . . . . . . . . . . . . . . . . . . . . . . . . . . . . . 5,906 287
December 31 . . . . . . . . . . . . . . . . . . . . . . . . . . . . . . . . . . . . . . . . . . . . . . . . . . . 5,081 277
United Kingdom:Proved Reserves:
Balance, January 1 . . . . . . . . . . . . . . . . . . . . . . . . . . . . . . . . . . . . . . . . . . . . . . . — 4,188Increase (decrease) during the year attributable to:
Revisions of previous estimates . . . . . . . . . . . . . . . . . . . . . . . . . . . . . . . . . — 146Extensions, discoveries and other additions . . . . . . . . . . . . . . . . . . . . . . . . — 586Production . . . . . . . . . . . . . . . . . . . . . . . . . . . . . . . . . . . . . . . . . . . . . . . . . — (263)Sales of minerals in place . . . . . . . . . . . . . . . . . . . . . . . . . . . . . . . . . . . . . . — (2,094)
Balance, December 31 . . . . . . . . . . . . . . . . . . . . . . . . . . . . . . . . . . . . . . . . . . . . — 2,563
Proved Developed Reserves:January 1 . . . . . . . . . . . . . . . . . . . . . . . . . . . . . . . . . . . . . . . . . . . . . . . . . . . . . . — —
December 31 . . . . . . . . . . . . . . . . . . . . . . . . . . . . . . . . . . . . . . . . . . . . . . . . . . . — 2,563
Total:Proved Reserves:
Balance, January 1 . . . . . . . . . . . . . . . . . . . . . . . . . . . . . . . . . . . . . . . . . . . . . . . 5,906 4,475Increase (decrease) during the year attributable to:
Revisions of previous estimates . . . . . . . . . . . . . . . . . . . . . . . . . . . . . . . . . 181 202Extensions, discoveries and other additions . . . . . . . . . . . . . . . . . . . . . . . . 1,377 604Production . . . . . . . . . . . . . . . . . . . . . . . . . . . . . . . . . . . . . . . . . . . . . . . . . (2,752) (348)Sales of minerals in place . . . . . . . . . . . . . . . . . . . . . . . . . . . . . . . . . . . . . . 402 (2,093)
Balance, December 31 . . . . . . . . . . . . . . . . . . . . . . . . . . . . . . . . . . . . . . . . . . . . 5,114 2,840
Proved Developed Reserves:January 1 . . . . . . . . . . . . . . . . . . . . . . . . . . . . . . . . . . . . . . . . . . . . . . . . . . . . . . 5,906 287
December 31 . . . . . . . . . . . . . . . . . . . . . . . . . . . . . . . . . . . . . . . . . . . . . . . . . . . 5,081 2,840
109
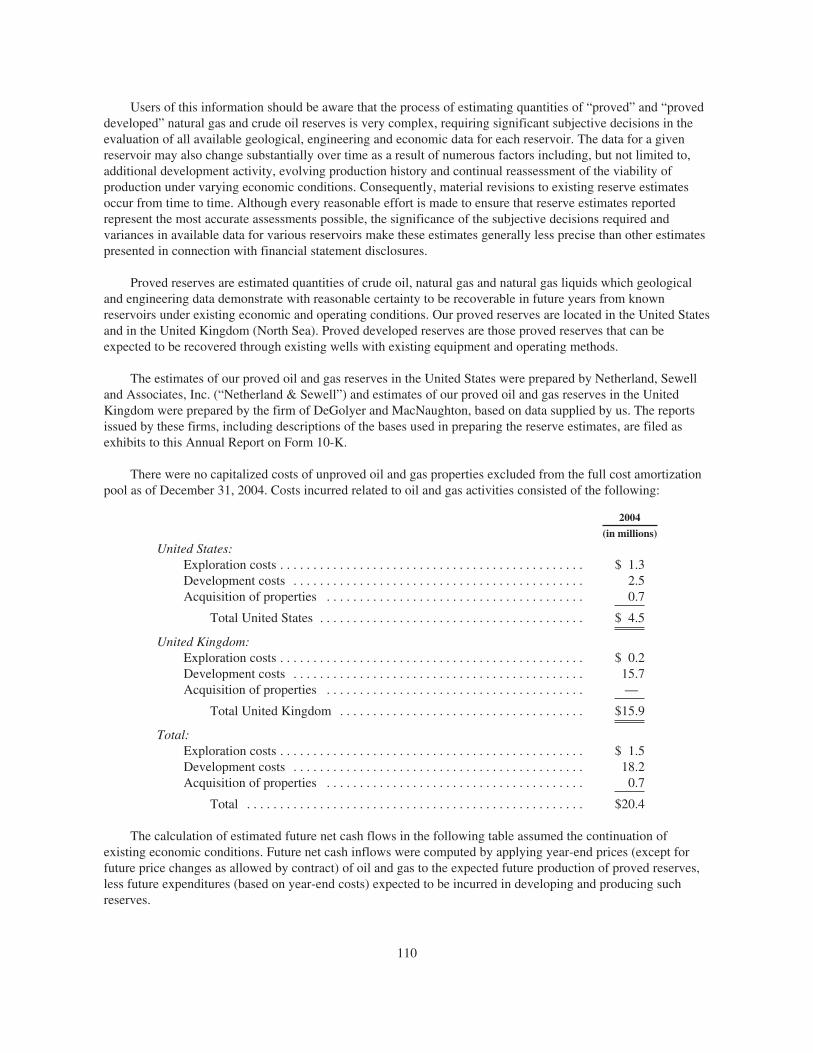
Users of this information should be aware that the process of estimating quantities of “proved” and “proveddeveloped” natural gas and crude oil reserves is very complex, requiring significant subjective decisions in theevaluation of all available geological, engineering and economic data for each reservoir. The data for a givenreservoir may also change substantially over time as a result of numerous factors including, but not limited to,additional development activity, evolving production history and continual reassessment of the viability ofproduction under varying economic conditions. Consequently, material revisions to existing reserve estimatesoccur from time to time. Although every reasonable effort is made to ensure that reserve estimates reportedrepresent the most accurate assessments possible, the significance of the subjective decisions required andvariances in available data for various reservoirs make these estimates generally less precise than other estimatespresented in connection with financial statement disclosures.
Proved reserves are estimated quantities of crude oil, natural gas and natural gas liquids which geologicaland engineering data demonstrate with reasonable certainty to be recoverable in future years from knownreservoirs under existing economic and operating conditions. Our proved reserves are located in the United Statesand in the United Kingdom (North Sea). Proved developed reserves are those proved reserves that can beexpected to be recovered through existing wells with existing equipment and operating methods.
The estimates of our proved oil and gas reserves in the United States were prepared by Netherland, Sewelland Associates, Inc. (“Netherland & Sewell”) and estimates of our proved oil and gas reserves in the UnitedKingdom were prepared by the firm of DeGolyer and MacNaughton, based on data supplied by us. The reportsissued by these firms, including descriptions of the bases used in preparing the reserve estimates, are filed asexhibits to this Annual Report on Form 10-K.
There were no capitalized costs of unproved oil and gas properties excluded from the full cost amortizationpool as of December 31, 2004. Costs incurred related to oil and gas activities consisted of the following:
2004
(in millions)
United States:Exploration costs . . . . . . . . . . . . . . . . . . . . . . . . . . . . . . . . . . . . . . . . . . . . . . $ 1.3Development costs . . . . . . . . . . . . . . . . . . . . . . . . . . . . . . . . . . . . . . . . . . . . 2.5Acquisition of properties . . . . . . . . . . . . . . . . . . . . . . . . . . . . . . . . . . . . . . . 0.7
Total United States . . . . . . . . . . . . . . . . . . . . . . . . . . . . . . . . . . . . . . . . $ 4.5
United Kingdom:Exploration costs . . . . . . . . . . . . . . . . . . . . . . . . . . . . . . . . . . . . . . . . . . . . . . $ 0.2Development costs . . . . . . . . . . . . . . . . . . . . . . . . . . . . . . . . . . . . . . . . . . . . 15.7Acquisition of properties . . . . . . . . . . . . . . . . . . . . . . . . . . . . . . . . . . . . . . . —
Total United Kingdom . . . . . . . . . . . . . . . . . . . . . . . . . . . . . . . . . . . . . $15.9
Total:Exploration costs . . . . . . . . . . . . . . . . . . . . . . . . . . . . . . . . . . . . . . . . . . . . . . $ 1.5Development costs . . . . . . . . . . . . . . . . . . . . . . . . . . . . . . . . . . . . . . . . . . . . 18.2Acquisition of properties . . . . . . . . . . . . . . . . . . . . . . . . . . . . . . . . . . . . . . . 0.7
Total . . . . . . . . . . . . . . . . . . . . . . . . . . . . . . . . . . . . . . . . . . . . . . . . . . . $20.4
The calculation of estimated future net cash flows in the following table assumed the continuation ofexisting economic conditions. Future net cash inflows were computed by applying year-end prices (except forfuture price changes as allowed by contract) of oil and gas to the expected future production of proved reserves,less future expenditures (based on year-end costs) expected to be incurred in developing and producing suchreserves.
110
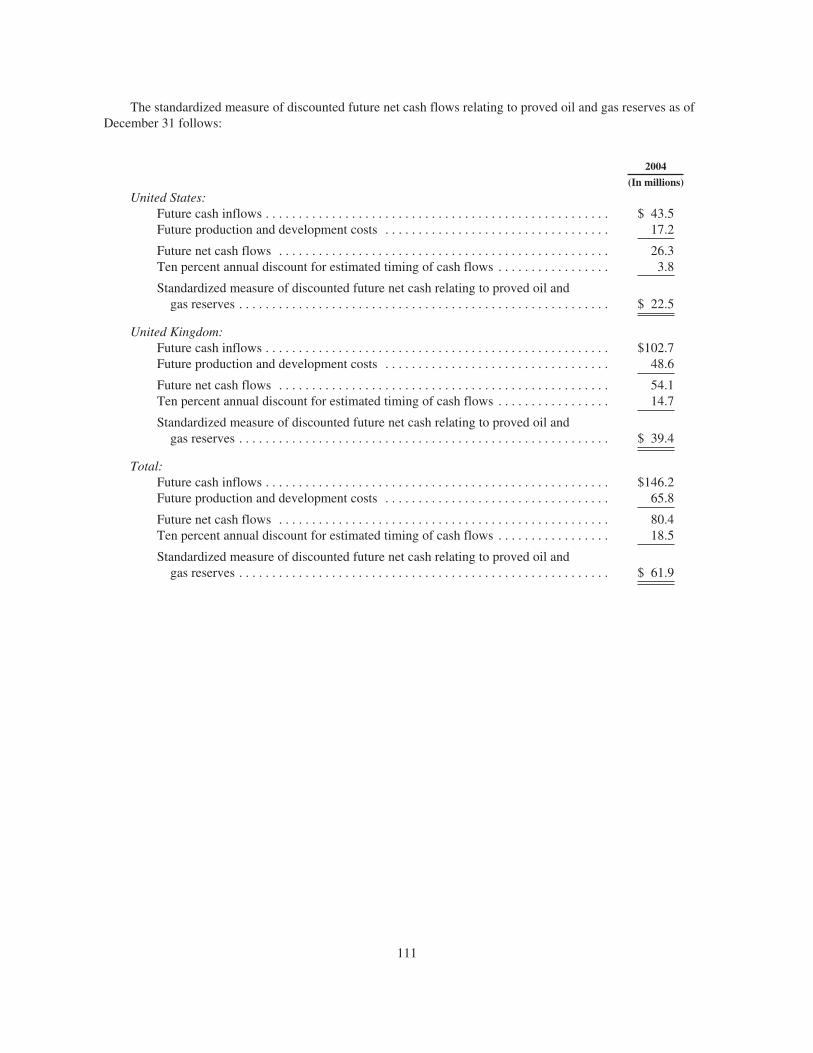
The standardized measure of discounted future net cash flows relating to proved oil and gas reserves as ofDecember 31 follows:
2004
(In millions)
United States:Future cash inflows . . . . . . . . . . . . . . . . . . . . . . . . . . . . . . . . . . . . . . . . . . . . . . . . . . . . $ 43.5Future production and development costs . . . . . . . . . . . . . . . . . . . . . . . . . . . . . . . . . . 17.2
Future net cash flows . . . . . . . . . . . . . . . . . . . . . . . . . . . . . . . . . . . . . . . . . . . . . . . . . . 26.3Ten percent annual discount for estimated timing of cash flows . . . . . . . . . . . . . . . . . 3.8
Standardized measure of discounted future net cash relating to proved oil andgas reserves . . . . . . . . . . . . . . . . . . . . . . . . . . . . . . . . . . . . . . . . . . . . . . . . . . . . . . . . $ 22.5
United Kingdom:Future cash inflows . . . . . . . . . . . . . . . . . . . . . . . . . . . . . . . . . . . . . . . . . . . . . . . . . . . . $102.7Future production and development costs . . . . . . . . . . . . . . . . . . . . . . . . . . . . . . . . . . 48.6
Future net cash flows . . . . . . . . . . . . . . . . . . . . . . . . . . . . . . . . . . . . . . . . . . . . . . . . . . 54.1Ten percent annual discount for estimated timing of cash flows . . . . . . . . . . . . . . . . . 14.7
Standardized measure of discounted future net cash relating to proved oil andgas reserves . . . . . . . . . . . . . . . . . . . . . . . . . . . . . . . . . . . . . . . . . . . . . . . . . . . . . . . . $ 39.4
Total:Future cash inflows . . . . . . . . . . . . . . . . . . . . . . . . . . . . . . . . . . . . . . . . . . . . . . . . . . . . $146.2Future production and development costs . . . . . . . . . . . . . . . . . . . . . . . . . . . . . . . . . . 65.8
Future net cash flows . . . . . . . . . . . . . . . . . . . . . . . . . . . . . . . . . . . . . . . . . . . . . . . . . . 80.4Ten percent annual discount for estimated timing of cash flows . . . . . . . . . . . . . . . . . 18.5
Standardized measure of discounted future net cash relating to proved oil andgas reserves . . . . . . . . . . . . . . . . . . . . . . . . . . . . . . . . . . . . . . . . . . . . . . . . . . . . . . . . $ 61.9
111
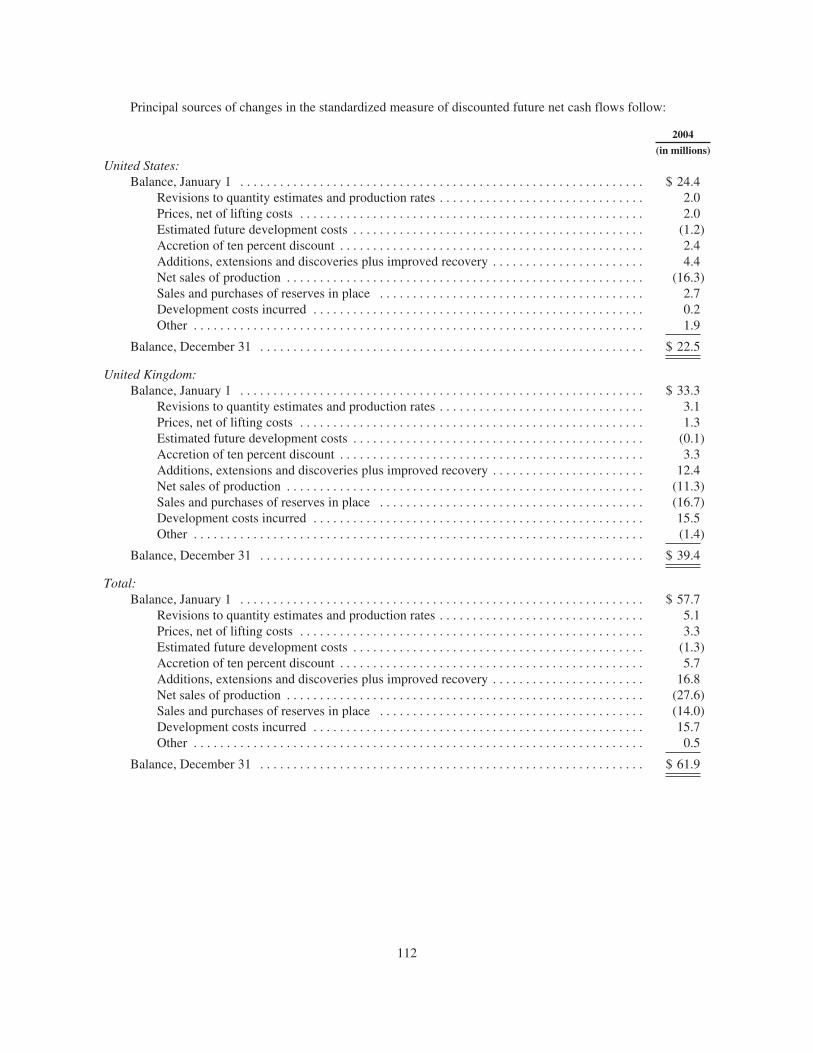
Principal sources of changes in the standardized measure of discounted future net cash flows follow:
2004
(in millions)
United States:Balance, January 1 . . . . . . . . . . . . . . . . . . . . . . . . . . . . . . . . . . . . . . . . . . . . . . . . . . . . . . . . . . . . . $ 24.4
Revisions to quantity estimates and production rates . . . . . . . . . . . . . . . . . . . . . . . . . . . . . . . 2.0Prices, net of lifting costs . . . . . . . . . . . . . . . . . . . . . . . . . . . . . . . . . . . . . . . . . . . . . . . . . . . . 2.0Estimated future development costs . . . . . . . . . . . . . . . . . . . . . . . . . . . . . . . . . . . . . . . . . . . . (1.2)Accretion of ten percent discount . . . . . . . . . . . . . . . . . . . . . . . . . . . . . . . . . . . . . . . . . . . . . . 2.4Additions, extensions and discoveries plus improved recovery . . . . . . . . . . . . . . . . . . . . . . . 4.4Net sales of production . . . . . . . . . . . . . . . . . . . . . . . . . . . . . . . . . . . . . . . . . . . . . . . . . . . . . . (16.3)Sales and purchases of reserves in place . . . . . . . . . . . . . . . . . . . . . . . . . . . . . . . . . . . . . . . . 2.7Development costs incurred . . . . . . . . . . . . . . . . . . . . . . . . . . . . . . . . . . . . . . . . . . . . . . . . . . 0.2Other . . . . . . . . . . . . . . . . . . . . . . . . . . . . . . . . . . . . . . . . . . . . . . . . . . . . . . . . . . . . . . . . . . . . 1.9
Balance, December 31 . . . . . . . . . . . . . . . . . . . . . . . . . . . . . . . . . . . . . . . . . . . . . . . . . . . . . . . . . . $ 22.5
United Kingdom:Balance, January 1 . . . . . . . . . . . . . . . . . . . . . . . . . . . . . . . . . . . . . . . . . . . . . . . . . . . . . . . . . . . . . $ 33.3
Revisions to quantity estimates and production rates . . . . . . . . . . . . . . . . . . . . . . . . . . . . . . . 3.1Prices, net of lifting costs . . . . . . . . . . . . . . . . . . . . . . . . . . . . . . . . . . . . . . . . . . . . . . . . . . . . 1.3Estimated future development costs . . . . . . . . . . . . . . . . . . . . . . . . . . . . . . . . . . . . . . . . . . . . (0.1)Accretion of ten percent discount . . . . . . . . . . . . . . . . . . . . . . . . . . . . . . . . . . . . . . . . . . . . . . 3.3Additions, extensions and discoveries plus improved recovery . . . . . . . . . . . . . . . . . . . . . . . 12.4Net sales of production . . . . . . . . . . . . . . . . . . . . . . . . . . . . . . . . . . . . . . . . . . . . . . . . . . . . . . (11.3)Sales and purchases of reserves in place . . . . . . . . . . . . . . . . . . . . . . . . . . . . . . . . . . . . . . . . (16.7)Development costs incurred . . . . . . . . . . . . . . . . . . . . . . . . . . . . . . . . . . . . . . . . . . . . . . . . . . 15.5Other . . . . . . . . . . . . . . . . . . . . . . . . . . . . . . . . . . . . . . . . . . . . . . . . . . . . . . . . . . . . . . . . . . . . (1.4)
Balance, December 31 . . . . . . . . . . . . . . . . . . . . . . . . . . . . . . . . . . . . . . . . . . . . . . . . . . . . . . . . . . $ 39.4
Total:Balance, January 1 . . . . . . . . . . . . . . . . . . . . . . . . . . . . . . . . . . . . . . . . . . . . . . . . . . . . . . . . . . . . . $ 57.7
Revisions to quantity estimates and production rates . . . . . . . . . . . . . . . . . . . . . . . . . . . . . . . 5.1Prices, net of lifting costs . . . . . . . . . . . . . . . . . . . . . . . . . . . . . . . . . . . . . . . . . . . . . . . . . . . . 3.3Estimated future development costs . . . . . . . . . . . . . . . . . . . . . . . . . . . . . . . . . . . . . . . . . . . . (1.3)Accretion of ten percent discount . . . . . . . . . . . . . . . . . . . . . . . . . . . . . . . . . . . . . . . . . . . . . . 5.7Additions, extensions and discoveries plus improved recovery . . . . . . . . . . . . . . . . . . . . . . . 16.8Net sales of production . . . . . . . . . . . . . . . . . . . . . . . . . . . . . . . . . . . . . . . . . . . . . . . . . . . . . . (27.6)Sales and purchases of reserves in place . . . . . . . . . . . . . . . . . . . . . . . . . . . . . . . . . . . . . . . . (14.0)Development costs incurred . . . . . . . . . . . . . . . . . . . . . . . . . . . . . . . . . . . . . . . . . . . . . . . . . . 15.7Other . . . . . . . . . . . . . . . . . . . . . . . . . . . . . . . . . . . . . . . . . . . . . . . . . . . . . . . . . . . . . . . . . . . . 0.5
Balance, December 31 . . . . . . . . . . . . . . . . . . . . . . . . . . . . . . . . . . . . . . . . . . . . . . . . . . . . . . . . . . $ 61.9
112
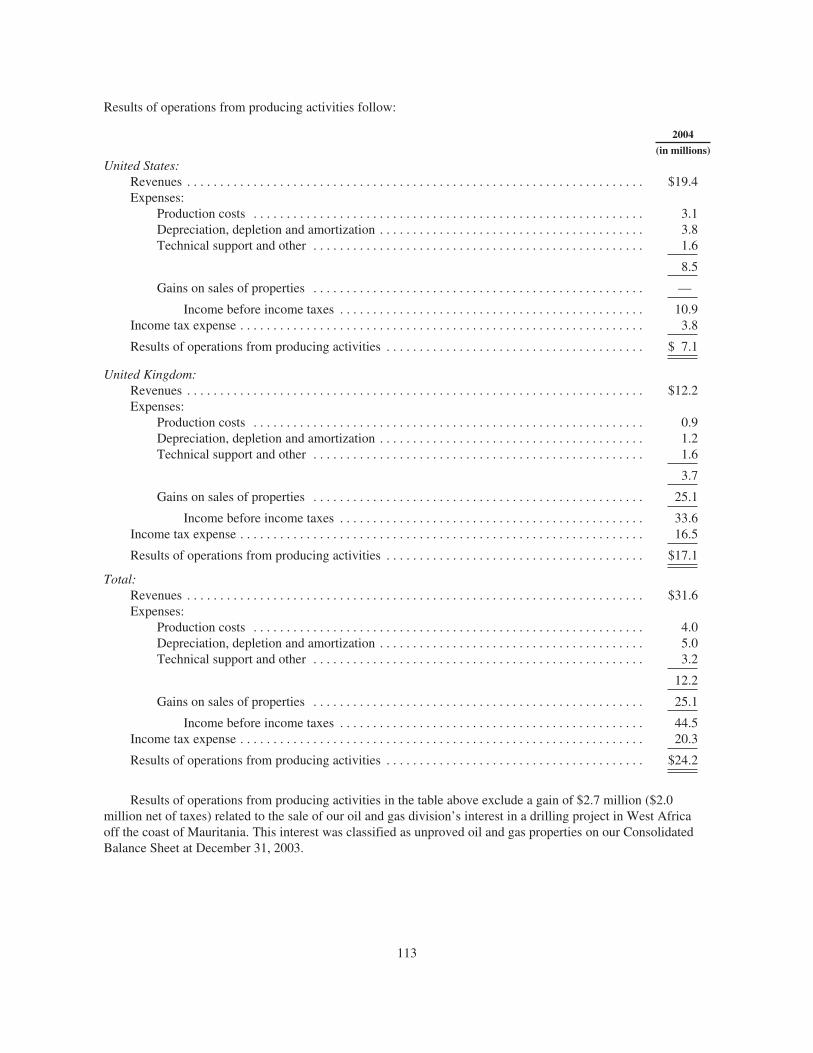
Results of operations from producing activities follow:
2004
(in millions)
United States:Revenues . . . . . . . . . . . . . . . . . . . . . . . . . . . . . . . . . . . . . . . . . . . . . . . . . . . . . . . . . . . . . . . . . . . . . $19.4Expenses:
Production costs . . . . . . . . . . . . . . . . . . . . . . . . . . . . . . . . . . . . . . . . . . . . . . . . . . . . . . . . . . . 3.1Depreciation, depletion and amortization . . . . . . . . . . . . . . . . . . . . . . . . . . . . . . . . . . . . . . . . 3.8Technical support and other . . . . . . . . . . . . . . . . . . . . . . . . . . . . . . . . . . . . . . . . . . . . . . . . . . 1.6
8.5
Gains on sales of properties . . . . . . . . . . . . . . . . . . . . . . . . . . . . . . . . . . . . . . . . . . . . . . . . . . —
Income before income taxes . . . . . . . . . . . . . . . . . . . . . . . . . . . . . . . . . . . . . . . . . . . . . . 10.9Income tax expense . . . . . . . . . . . . . . . . . . . . . . . . . . . . . . . . . . . . . . . . . . . . . . . . . . . . . . . . . . . . . 3.8
Results of operations from producing activities . . . . . . . . . . . . . . . . . . . . . . . . . . . . . . . . . . . . . . . $ 7.1
United Kingdom:Revenues . . . . . . . . . . . . . . . . . . . . . . . . . . . . . . . . . . . . . . . . . . . . . . . . . . . . . . . . . . . . . . . . . . . . . $12.2Expenses:
Production costs . . . . . . . . . . . . . . . . . . . . . . . . . . . . . . . . . . . . . . . . . . . . . . . . . . . . . . . . . . . 0.9Depreciation, depletion and amortization . . . . . . . . . . . . . . . . . . . . . . . . . . . . . . . . . . . . . . . . 1.2Technical support and other . . . . . . . . . . . . . . . . . . . . . . . . . . . . . . . . . . . . . . . . . . . . . . . . . . 1.6
3.7
Gains on sales of properties . . . . . . . . . . . . . . . . . . . . . . . . . . . . . . . . . . . . . . . . . . . . . . . . . . 25.1
Income before income taxes . . . . . . . . . . . . . . . . . . . . . . . . . . . . . . . . . . . . . . . . . . . . . . 33.6Income tax expense . . . . . . . . . . . . . . . . . . . . . . . . . . . . . . . . . . . . . . . . . . . . . . . . . . . . . . . . . . . . . 16.5
Results of operations from producing activities . . . . . . . . . . . . . . . . . . . . . . . . . . . . . . . . . . . . . . . $17.1
Total:Revenues . . . . . . . . . . . . . . . . . . . . . . . . . . . . . . . . . . . . . . . . . . . . . . . . . . . . . . . . . . . . . . . . . . . . . $31.6Expenses:
Production costs . . . . . . . . . . . . . . . . . . . . . . . . . . . . . . . . . . . . . . . . . . . . . . . . . . . . . . . . . . . 4.0Depreciation, depletion and amortization . . . . . . . . . . . . . . . . . . . . . . . . . . . . . . . . . . . . . . . . 5.0Technical support and other . . . . . . . . . . . . . . . . . . . . . . . . . . . . . . . . . . . . . . . . . . . . . . . . . . 3.2
12.2
Gains on sales of properties . . . . . . . . . . . . . . . . . . . . . . . . . . . . . . . . . . . . . . . . . . . . . . . . . . 25.1
Income before income taxes . . . . . . . . . . . . . . . . . . . . . . . . . . . . . . . . . . . . . . . . . . . . . . 44.5Income tax expense . . . . . . . . . . . . . . . . . . . . . . . . . . . . . . . . . . . . . . . . . . . . . . . . . . . . . . . . . . . . . 20.3
Results of operations from producing activities . . . . . . . . . . . . . . . . . . . . . . . . . . . . . . . . . . . . . . . $24.2
Results of operations from producing activities in the table above exclude a gain of $2.7 million ($2.0million net of taxes) related to the sale of our oil and gas division’s interest in a drilling project in West Africaoff the coast of Mauritania. This interest was classified as unproved oil and gas properties on our ConsolidatedBalance Sheet at December 31, 2003.
113
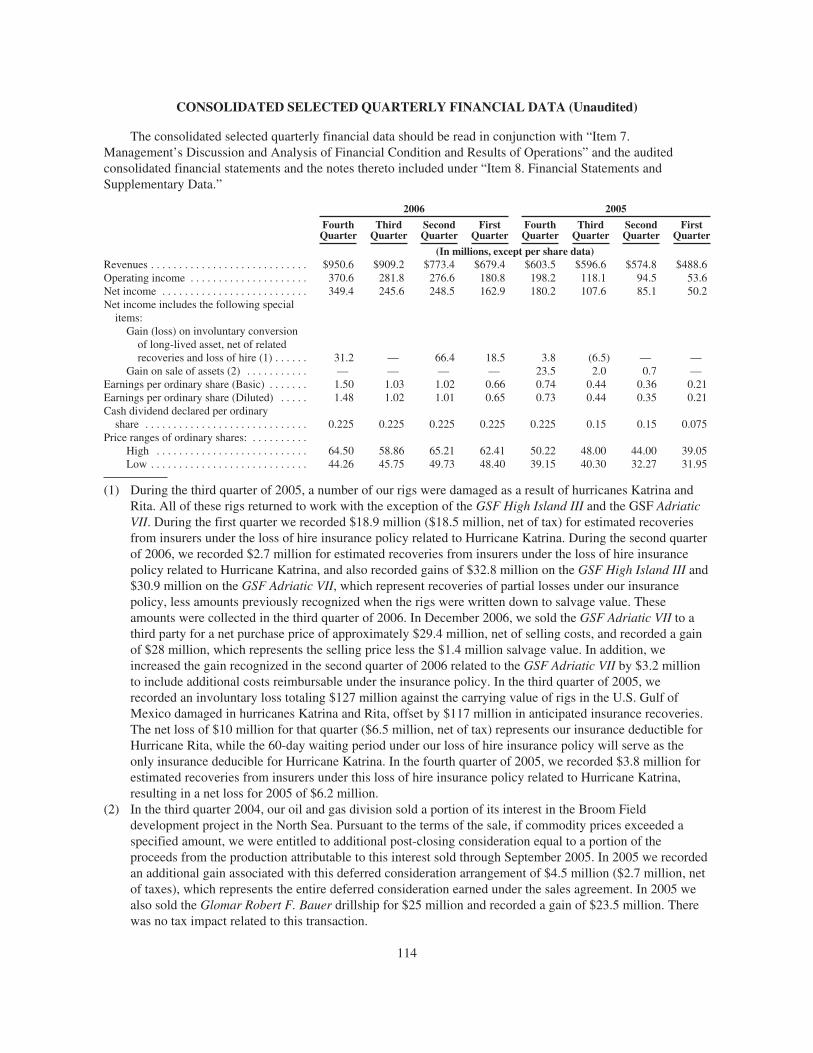
CONSOLIDATED SELECTED QUARTERLY FINANCIAL DATA (Unaudited)
The consolidated selected quarterly financial data should be read in conjunction with “Item 7.Management’s Discussion and Analysis of Financial Condition and Results of Operations” and the auditedconsolidated financial statements and the notes thereto included under “Item 8. Financial Statements andSupplementary Data.”
2006 2005
FourthQuarter
ThirdQuarter
SecondQuarter
FirstQuarter
FourthQuarter
ThirdQuarter
SecondQuarter
FirstQuarter
(In millions, except per share data)Revenues . . . . . . . . . . . . . . . . . . . . . . . . . . . . $950.6 $909.2 $773.4 $679.4 $603.5 $596.6 $574.8 $488.6Operating income . . . . . . . . . . . . . . . . . . . . . 370.6 281.8 276.6 180.8 198.2 118.1 94.5 53.6Net income . . . . . . . . . . . . . . . . . . . . . . . . . . 349.4 245.6 248.5 162.9 180.2 107.6 85.1 50.2Net income includes the following special
items:Gain (loss) on involuntary conversion
of long-lived asset, net of relatedrecoveries and loss of hire (1) . . . . . . 31.2 — 66.4 18.5 3.8 (6.5) — —
Gain on sale of assets (2) . . . . . . . . . . . — — — — 23.5 2.0 0.7 —Earnings per ordinary share (Basic) . . . . . . . 1.50 1.03 1.02 0.66 0.74 0.44 0.36 0.21Earnings per ordinary share (Diluted) . . . . . 1.48 1.02 1.01 0.65 0.73 0.44 0.35 0.21Cash dividend declared per ordinary
share . . . . . . . . . . . . . . . . . . . . . . . . . . . . . 0.225 0.225 0.225 0.225 0.225 0.15 0.15 0.075Price ranges of ordinary shares: . . . . . . . . . .
High . . . . . . . . . . . . . . . . . . . . . . . . . . . 64.50 58.86 65.21 62.41 50.22 48.00 44.00 39.05Low . . . . . . . . . . . . . . . . . . . . . . . . . . . . 44.26 45.75 49.73 48.40 39.15 40.30 32.27 31.95
(1) During the third quarter of 2005, a number of our rigs were damaged as a result of hurricanes Katrina andRita. All of these rigs returned to work with the exception of the GSF High Island III and the GSF AdriaticVII. During the first quarter we recorded $18.9 million ($18.5 million, net of tax) for estimated recoveriesfrom insurers under the loss of hire insurance policy related to Hurricane Katrina. During the second quarterof 2006, we recorded $2.7 million for estimated recoveries from insurers under the loss of hire insurancepolicy related to Hurricane Katrina, and also recorded gains of $32.8 million on the GSF High Island III and$30.9 million on the GSF Adriatic VII, which represent recoveries of partial losses under our insurancepolicy, less amounts previously recognized when the rigs were written down to salvage value. Theseamounts were collected in the third quarter of 2006. In December 2006, we sold the GSF Adriatic VII to athird party for a net purchase price of approximately $29.4 million, net of selling costs, and recorded a gainof $28 million, which represents the selling price less the $1.4 million salvage value. In addition, weincreased the gain recognized in the second quarter of 2006 related to the GSF Adriatic VII by $3.2 millionto include additional costs reimbursable under the insurance policy. In the third quarter of 2005, werecorded an involuntary loss totaling $127 million against the carrying value of rigs in the U.S. Gulf ofMexico damaged in hurricanes Katrina and Rita, offset by $117 million in anticipated insurance recoveries.The net loss of $10 million for that quarter ($6.5 million, net of tax) represents our insurance deductible forHurricane Rita, while the 60-day waiting period under our loss of hire insurance policy will serve as theonly insurance deducible for Hurricane Katrina. In the fourth quarter of 2005, we recorded $3.8 million forestimated recoveries from insurers under this loss of hire insurance policy related to Hurricane Katrina,resulting in a net loss for 2005 of $6.2 million.
(2) In the third quarter 2004, our oil and gas division sold a portion of its interest in the Broom Fielddevelopment project in the North Sea. Pursuant to the terms of the sale, if commodity prices exceeded aspecified amount, we were entitled to additional post-closing consideration equal to a portion of theproceeds from the production attributable to this interest sold through September 2005. In 2005 we recordedan additional gain associated with this deferred consideration arrangement of $4.5 million ($2.7 million, netof taxes), which represents the entire deferred consideration earned under the sales agreement. In 2005 wealso sold the Glomar Robert F. Bauer drillship for $25 million and recorded a gain of $23.5 million. Therewas no tax impact related to this transaction.
114
REPORT OF INDEPENDENT REGISTERED PUBLIC ACCOUNTING FIRMON FINANCIAL STATEMENT SCHEDULE
To the Board of Directors and Shareholders of GlobalSantaFe Corporation:
Our audits of the consolidated financial statements, of management’s assessment of the effectiveness ofinternal control over financial reporting and of the effectiveness of internal control over financial reportingreferred to in our report dated February 28, 2007 appearing in the 2006 Annual Report to Shareholders ofGlobalSantaFe Corporation (which report, consolidated financial statements and assessment are included in thisAnnual Report on Form 10-K) also included an audit of the financial statement schedule listed in Item 15(a)(2) ofthis Form 10-K. In our opinion, this financial statement schedule presents fairly, in all material respects, theinformation set forth therein when read in conjunction with the related consolidated financial statements.
/s/ PricewaterhouseCoopers LLP
Houston, TexasFebruary 28, 2007
115
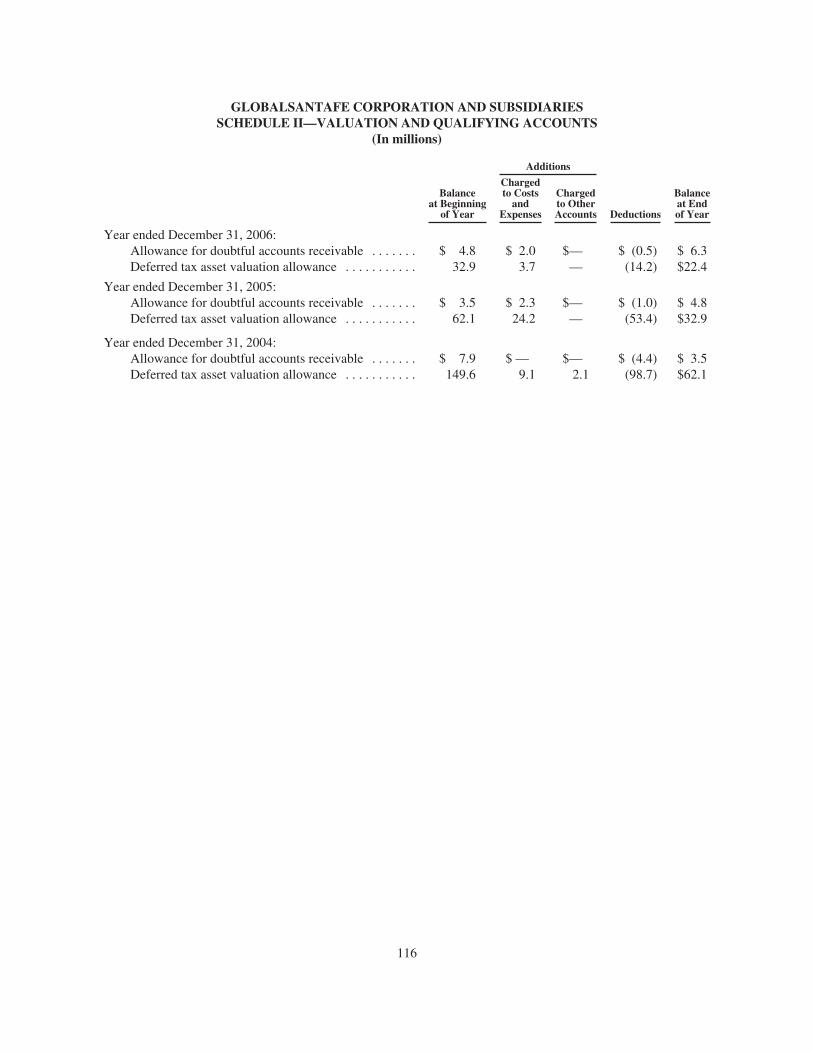
GLOBALSANTAFE CORPORATION AND SUBSIDIARIESSCHEDULE II—VALUATION AND QUALIFYING ACCOUNTS
(In millions)
Balanceat Beginning
of Year
Additions
Deductions
Balanceat Endof Year
Chargedto Costs
andExpenses
Chargedto OtherAccounts
Year ended December 31, 2006:Allowance for doubtful accounts receivable . . . . . . . $ 4.8 $ 2.0 $— $ (0.5) $ 6.3Deferred tax asset valuation allowance . . . . . . . . . . . 32.9 3.7 — (14.2) $22.4
Year ended December 31, 2005:Allowance for doubtful accounts receivable . . . . . . . $ 3.5 $ 2.3 $— $ (1.0) $ 4.8Deferred tax asset valuation allowance . . . . . . . . . . . 62.1 24.2 — (53.4) $32.9
Year ended December 31, 2004:Allowance for doubtful accounts receivable . . . . . . . $ 7.9 $ — $— $ (4.4) $ 3.5Deferred tax asset valuation allowance . . . . . . . . . . . 149.6 9.1 2.1 (98.7) $62.1
116
ITEM 9. CHANGES IN AND DISAGREEMENTS WITH ACCOUNTANTS ON ACCOUNTING ANDFINANCIAL DISCLOSURE
Not applicable.
ITEM 9A. CONTROLS AND PROCEDURES
We carried out an evaluation, under the supervision and with the participation of our management, includingour Chief Executive Officer and Chief Financial Officer, of the effectiveness of our disclosure controls andprocedures as of December 31, 2006, pursuant to Rule 13a-15(b) of the Securities Exchange Act of 1934 (the“Act”. Based upon that evaluation, the Chief Executive Officer and Chief Financial Officer concluded that ourdisclosure controls and procedures were effective as of December 31, 2006, in ensuring that information requiredto be disclosed by us in the reports that we file or submit under the Act is recorded, processed, summarized andreported within the time periods specified in the Securities and Exchange Commission’s rules and forms,including ensuring that such information is accumulated and communicated to our management, including ourChief Executive Officer and Chief Financial Officer, as appropriate, to allow timely decisions regarding requireddisclosure. There were no changes in our internal control over financial reporting for the fourth quarter of 2006that have materially affected, or are reasonably likely to materially affect, our internal control over financialreporting.
MANAGEMENT’S REPORT ON INTERNAL CONTROL OVER FINANCIAL REPORTING
Management of GlobalSantaFe Corporation is responsible for establishing and maintaining adequateinternal control over financial reporting as defined in Rules 13a-15(f) and 15d-15(f) under the SecuritiesExchange Act of 1934. GlobalSantaFe Corporation’s internal control over financial reporting is a processdesigned to provide reasonable assurance regarding the reliability of financial reporting and the preparation offinancial statements for external purposes in accordance with accounting principles generally accepted in theUnited States of America. Internal control over financial reporting includes those written policies and proceduresthat:
• pertain to the maintenance of records that, in reasonable detail, accurately and fairly reflect thetransactions and dispositions of the assets of GlobalSantaFe Corporation;
• provide reasonable assurance that transactions are recorded as necessary to permit preparation offinancial statements in accordance with accounting principles generally accepted in the United States ofAmerica and that receipts and expenditures of GlobalSantaFe Corporation are being made only inaccordance with authorization of management and directors of GlobalSantaFe Corporation; and
• provide reasonable assurance regarding prevention or timely detection of unauthorized acquisition, useor disposition of assets that could have a material effect on the consolidated financial statements.
Internal control over financial reporting includes the controls themselves, monitoring (including internalauditing practices) and actions taken to correct deficiencies as identified.
Because of its inherent limitations, internal control over financial reporting may not prevent or detectmisstatements. Also, projections of any evaluation of effectiveness to future periods are subject to the risk thatcontrols may become inadequate because of changes in conditions, or that the degree of compliance with thepolicies or procedures may deteriorate.
Management assessed the effectiveness of GlobalSantaFe Corporation’s internal control over financialreporting as of December 31, 2006. Management based this assessment on criteria for effective internal controlover financial reporting described in “Internal Control—Integrated Framework” issued by the Committee ofSponsoring Organizations of the Treadway Commission. Management’s assessment included an evaluation of thedesign of GlobalSantaFe Corporation’s internal control over financial reporting and testing of the operating
117
effectiveness of its internal control over financial reporting. Management reviewed the results of its assessmentwith the Audit Committee of our Board of Directors.
Based on this assessment, management determined that, as of December 31, 2006, GlobalSantaFeCorporation maintained effective internal control over financial reporting.
Our management’s assessment of the effectiveness of our internal control over financial reporting as ofDecember 31, 2006 has been audited by PricewaterhouseCoopers LLP, an independent registered publicaccounting firm, as stated in their report appearing elsewhere in this report, which expresses unqualified opinionson our management’s assessment and on the effectiveness of our internal control over financial reporting as ofDecember 31, 2006.
ITEM 9B. OTHER INFORMATION
During the fourth quarter of 2006, various individuals adopted written plans pursuant to Rule 10b5-1 underthe U.S. Securities Exchange Act of 1934. Each plan provides for the exercise of specified stock options and/orstock-settled stock appreciation rights (“SARs”) granted by us and the sale of the underlying GlobalSantaFeordinary shares at specified per share market price targets, and/or provides for the sale of GlobalSantaFe ordinaryshares already owned by the individual at specified per share market price targets. In addition, the 10b5-1 plansgenerally provide for the exercise of any in-the-money stock options and/or SARs granted by us, to the extent notpreviously exercised, and the sale of the underlying ordinary shares two business days before the options orSARs are due to terminate or expire. Among the individuals who adopted 10b5-1 plans during the fourth quarterare:
Thomas W. Cason DirectorMichael R. Dawson Senior Vice President and Chief Financial OfficerRoger B. Hunt Senior Vice President, MarketingJames L. McCulloch Senior Vice President and General CounselMyrtle L. Penelton Vice President, TaxW. Matt Ralls Executive Vice President, OperationsCheryl D. Richard Senior Vice President, Human ResourcesAnil B. Shah Vice President and TreasurerR. Blake Simmons President, Applied Drilling Technology Inc
118
PART III
ITEM 10. DIRECTORS, EXECUTIVE OFFICERS AND CORPORATE GOVERNANCE
Information relating to our directors and Section16(a) beneficial ownership reporting compliance isincorporated herein by reference to the Sections entitled “Election of Directors,” “Board Committees” and“Other Matters—Section16(a) Beneficial Ownership Reporting Compliance” of our definitive proxy statementwhich will be filed no later than 120 days after December 31, 2006.
Information related to our audit committee and the designation of our audit committee financial expert isincorporated herein by reference to the section entitled “Board Committees and Other Board Matters” of ourdefinitive proxy statement which will be filed no later than 120 days after December 31, 2006.
Information with respect to our executive officers required by Item 401 of Regulation S-K is set forth inPart I of this Annual Report on Form 10-K under the caption “Executive Officers of the Registrant.”
We have adopted a code of ethics that applies to the Chief Executive Officer, the Chief Financial Officer,the Treasurer, and the Controller. We have posted a copy of the code on our Internet website at:http://www.globalsantafe.com under the caption “Corporate Governance.” Copies of the code may be obtainedfree of charge from our website or by requesting a copy in writing from our Secretary at 15375 Memorial Drive,Houston, Texas 77079. We intend to disclose any amendments to, or waivers from, a provision of the code ofethics that applies to the Chief Executive Officer, the Chief Financial Officer or the Controller by posting suchinformation on our website.
ITEM 11. EXECUTIVE COMPENSATION
Information required by Item 11 is incorporated herein by reference to the Sections entitled “DirectorCompensation” and “Executive Compensation” of our definitive proxy statement which will be filed no later than120 days after December 31, 2006.
ITEM 12. SECURITY OWNERSHIP OF CERTAIN BENEFICIAL OWNERS AND MANAGEMENTAND RELATED STOCKHOLDER MATTERS
Information related to security ownership required by Item 12 is incorporated herein by reference to theSection entitled “Security Ownership of Certain Beneficial Owners,” “Security Ownership of Directors andExecutive Officers,” and “Equity Compensation Plan Information” of our definitive proxy statement which willbe filed no later than 120 days after December 31, 2006.
ITEM 13. CERTAIN RELATIONSHIPS AND RELATED TRANSACTIONS, AND DIRECTORINDEPENDENCE
Information required by Item 13 is incorporated herein by reference to the Sections entitled “BoardIndependence,” “Board Committees and Other Board Matters” and, if applicable, “Certain Relationships andRelated Transactions” of our definitive proxy statement which will be filed no later than 120 days afterDecember 31, 2006.
ITEM 14. PRINCIPAL ACCOUNTING FEES AND SERVICES
Information required by Item 14 is incorporated herein by reference to the Section entitled “AuditCommittee Report” of our definitive proxy statement which will be filed no later than 120 days afterDecember 31, 2006.
119
PART IV
ITEM 15. EXHIBITS AND FINANCIAL STATEMENT SCHEDULES
The following are included as exhibits to this Annual Report on Form 10-K (Commission FileNo. 1-14634). Exhibits filed herewith are so indicated “+”. Exhibit incorporated by reference are so indicated byparenthetical information.
2.1 Agreement and Plan of Merger, dated as of August 31, 2001, among the Company, Silver Sub, Inc.,Gold Merger Sub, Inc. and Global Marine Inc. (incorporated herein by this reference to the Company’sCurrent Report on Form 8-K filed September 4, 2001).
2.2 Purchase Agreement between GlobalSantaFe Corporation, GlobalSantaFe Drilling Venezuela, C.A.,GlobalSantaFe Drilling Operations Inc., and Saudi Drilling Company Limited as Seller Parties andPrecision Drilling Corporation, P. D. Technical Services Inc., Precision Drilling De Venezuela C.A.,Precision Drilling Services Saudi Arabia Ltd., Muscat Overseas Oil & Gas Drilling Co. LLC, andPrecision Drilling (Cyprus) Limited as Buyer Parties dated as of April 1, 2004 (incorporated herein bythis reference to Exhibit 99.1 to the Company’s Current Report on 8-K filed April 2, 2004).
3.1 Amended and Restated Memorandum of Association of the Company, adopted by Special Resolutionof the members effective May 23, 2006 (incorporated herein by this reference to Exhibit 3.1 to theCompany’s Current Report on Form 8-K filed with the Commission on May 25, 2006).
3.2 Amended and Restated Articles of Association of the Company, adopted by Special Resolution of themembers effective May 23, 2006 (incorporated herein by this reference to Exhibit 3.2 to theCompany’s Current Report on Form 8-K filed with the Commission on May 25, 2006).
4.1 Indenture dated as of September 1, 1997, between Global Marine Inc. and Wilmington TrustCompany, as Trustee, relating to Debt Securities of Global Marine Inc. (incorporated herein by thisreference to Exhibit 4.1 of Global Marine Inc.’s Registration Statement on Form S-4 (No. 333-39033)filed with the Commission on October 30, 1997); First Supplemental Indenture dated as of June 23,2000 (incorporated herein by this reference to Exhibit 4.2 of Global Marine Inc.’s Quarterly Report onForm 10-Q (Commission File No. 1-5471) for the quarter ended June 30, 2000); Second SupplementalIndenture dated as of November 20, 2001 (incorporated herein by this reference to Exhibit 4.2 to theCompany’s Annual Report on Form 10-K for the year ended December 31, 2004).
4.2a Form of 7% Note Due 2028 (incorporated herein by this reference to Exhibit 4.2 of Global MarineInc.’s Current Report on Form 8-K (Commission File No. 1-5471) dated May 20, 1998).
4.2b Terms of 7% Note Due 2028 (incorporated herein by this reference to Exhibit 4.1 of Global MarineInc.’s Current Report on Form 8-K (Commission File No. 1-5471) dated May 20, 1998).
4.3 Indenture dated as of February 1, 2003, between GlobalSantaFe Corporation and Wilmington TrustCompany, as Trustee, relating to Debt Securities of GlobalSantaFe Corporation (incorporated hereinby this reference to Exhibit 4.9 to the Company’s Annual Report on Form 10-K for the year endedDecember 31, 2002).
4.4a Form of 5% Note due 2013 (incorporated herein by this reference to Exhibit 4.10 to the Company’sAnnual Report on Form 10-K for the year ended December 31, 2002).
4.4b Terms of 5% Note due 2013 (incorporated herein by this reference to Exhibit 4.11 to the Company’sAnnual Report on Form 10-K for the year ended December 31, 2002).
10.1 Bareboat Charter Agreement, dated July 2, 1996, between the United States of America and GlobalMarine Capital Investments Inc. (incorporated herein by this reference to Exhibit 10.1 of GlobalMarine Inc.’s Current Report on Form 8-K (Commission File No. 1-5471) dated August 1, 1996).
120
10.2a Head Lease Agreement dated 8th December 1998 by and between BMBF (No. 12) Limited, as lessor,and Global Marine International Drilling Corporation, as lessee, relating to one double hulled,dynamically positioned ultra-deepwater Glomar class 456 drillship to be constructed by Harland andWolff Shipbuilding and Heavy Industries Ltd. with hull number 1740 (incorporated herein by thisreference to Exhibit 10.14 of Global Marine Inc.’s Annual Report on Form 10-K (Commission FileNo. 1-5471) for the year ended December 31, 1998).
10.2b Deed of Guarantee and Indemnity dated 8th December 1998 by and between Global Marine Inc., asGuarantor, and BMBF (No. 12) Limited, as Lessor (incorporated herein by this reference to Exhibit10.15 of Global Marine Inc.’s Annual Report on Form 10-K (Commission File No. 1-5471) for theyear ended December 31, 1998).
10.3a Head-lease Agreement dated January 30, 2003 between GlobalSantaFe Drilling Company (NorthSea) Limited, as lessor, and Sogelease B.V., as lessee, in respect of the jack-up drilling unit known as“Britannia” (incorporated herein by this reference to Exhibit 10.17 of the Company’s Annual Reporton Form 10-K for the year ended December 31, 2002).
10.3b Sub-lease Agreement dated January 30, 2003 between Sogelease B.V., as sub-lessor, andGlobalSantaFe Drilling Company (North Sea) Limited, as sub-lessee, in respect of the jack-updrilling unit known as “Britannia” (incorporated herein by this reference to Exhibit 10.18 of theCompany’s Annual Report on Form 10-K for the year ended December 31, 2002).
10.3c Guarantee and Indemnity dated January 30, 2003 between GlobalSantaFe Corporation, as guarantor,and Sogelease B.V. relating to the jack-up drilling unit known as “Britannia” (incorporated herein bythis reference to Exhibit 10.19 of the Company’s Annual Report on Form 10-K for the year endedDecember 31, 2002).
10.4 Revolving Credit Agreement dated as of August 15, 2006, among GlobalSantaFe Corporation, thelenders from time to time parties thereto, Citibank, N.A., Wells Fargo Bank, N.A., HSBC Bank USA,National Association and the Royal Bank of Scotland PLC (incorporated herein by this reference toExhibit 10.1 of the Company’s Current Report on Form 8-K filed with the Commission onAugust 18, 2006).
*10.5 Schedule of Compensation for Non-Employee Directors (incorporated herein by this reference toExhibit 10.1 of the Company’s Current Report on Form 8-K filed with the Commission onSeptember 21, 2006).
*10.6 Base Salaries and Annual Incentive Targets for Certain Executive Officers (incorporated herein bythis reference to Exhibit 10.2 of the Company’s Current Report on Form 8-K filed with theCommission on December 13, 2006).
*10.7a 2006 Annual Incentive Plan (incorporated herein by this reference to Exhibit 10.1 of the Company’sCurrent Report on Form 8-K filed December 20, 2005).
*10.7b 2007 Annual Incentive Plan (incorporated herein by this reference to Exhibit 10.1 of the Company’sCurrent Report on Form 8-K filed with the Commission on February 1, 2007).
*10.8a Global Marine Inc. 1989 Stock Option and Incentive Plan (incorporated herein by this reference toExhibit 10.6 of Global Marine Inc.’s Annual Report on Form 10-K (Commission File No. 1-5471) forthe year ended December 31, 1988); First Amendment (incorporated herein by this reference toExhibit 10.6 of Global Marine Inc.’s Annual Report on Form 10-K (Commission File No. 1-5471) forthe year ended December 31, 1990); Second Amendment (incorporated herein by this reference toExhibit 10.7 of Global Marine Inc.’s Annual Report on Form 10-K (Commission File No. 1-5471) forthe year ended December 31, 1991); Third Amendment (incorporated herein by this reference toExhibit 10.19 of Global Marine Inc.’s Annual Report on Form 10-K (Commission File No. 1-5471)for the year ended December 31, 1993.); Fourth Amendment (incorporated herein by this reference toExhibit 10.16 of Global Marine Inc.’s Annual Report on Form 10-K (Commission File No. 1-5471)for the year ended December 31, 1994.); Fifth Amendment (incorporated herein by this reference toExhibit 10.1 of Global Marine Inc.’s Quarterly Report on Form 10-Q (Commission File No. 1-5471)for the quarter ended June 30, 1996.); Sixth Amendment (incorporated herein by this reference toExhibit 10.18 of Global Marine Inc.’s Annual Report on Form 10-K (Commission File No. 1-5471)for the year ended December 31, 1996).
121
*10.8b Global Marine Inc. 1990 Non-Employee Director Stock Option Plan (incorporated herein by thisreference to Exhibit 10.18 of Global Marine Inc.’s Annual Report on Form 10-K (Commission FileNo. 1-5471) for the year ended December 31, 1991); First Amendment (incorporated herein by thisreference to Exhibit 10.1 of Global Marine Inc.’s Quarterly Report on Form 10-Q (Commission FileNo. 1-5471) for the quarter ended June 30, 1995); Second Amendment (incorporated herein by thisreference to Exhibit 10.37 of Global Marine Inc.’s Annual Report on Form 10-K (Commission FileNo. 1-5471) for the year ended December 31, 1996).
*10.8c 1997 Non-Employee Director Stock Option Plan (incorporated herein by this reference to theCompany’s Registration Statement on Form S-8 (No. 333-7070) filed June 13, 1997); Amendment to1997 Non-Employee Director Stock Option Plan (incorporated herein by this reference to theCompany’s Annual Report on Form 20-F for the calendar year ended December 31, 1998);Amendment to 1997 Non-Employee Director Stock Option Plan (incorporated herein by thisreference to the Company’s Annual Report on Form 20-F for the calendar year ended December 31,1998); Amendment to 1997 Non-Employee Director Stock Option Plan dated March 23, 1999(incorporated herein by this reference to the Company’s Annual Report on Form 20-F for thecalendar year ended December 31, 1999); Amendment to Non-Employee Director Stock Option Plandated December 1, 1999 (incorporated herein by this reference to the Company’s Annual Report onForm 20-F for the calendar year ended December 31, 1999).
*10.8d 1997 Long-Term Incentive Plan (incorporated herein by this reference to the Company’s RegistrationStatement on Form S-8 (No. 333-7070) filed June 13, 1997); Amendment to 1997 Long TermIncentive Plan (incorporated herein by this reference to the Company’s Annual Report on Form 20-Ffor the calendar year ended December 31, 1998); Amendment to 1997 Long Term Incentive Plandated December 1, 1999 (incorporated herein by this reference to the Company’s Annual Report onForm 20-F for the calendar year ended December 31, 1999).
*10.8e GlobalSantaFe Corporation 1998 Stock Option and Incentive Plan (incorporated herein by thisreference to Exhibit 10.1 of Global Marine Inc.’s Quarterly Report on Form 10-Q (Commission FileNo. 1-5471) for the quarter ended March 31, 1998); First Amendment (incorporated herein by thisreference to Exhibit 10.2 of Global Marine Inc.’s Quarterly Report on Form 10-Q (Commission FileNo. 1-5471) for the quarter ended June 30, 2000).
*10.8e(1) Memorandum dated November 20, 2001, Regarding Grant of Restricted Stock under theGlobalSantaFe Corporation 1998 Stock Option and Incentive Plan, including Terms and Conditionsof Restricted Stock (incorporated herein by this reference to Exhibit 10.39 to the Company’s AnnualReport on Form 10-K for the year ended December 31, 2001).
*10.8e(2) Form of Notice of Grant of Stock Options used for stock option grants under the GlobalSantaFeCorporation 1998 Stock Option and Incentive Plan (incorporated herein by this reference to Exhibit10.41 to the Company’s Annual Report on Form 10-K for the year ended December 31, 2001).
*10.8e(3) Form of Memorandum dated March 4, 2002, Regarding Grant of Performance-Based RestrictedUnits under the GlobalSantaFe Corporation 1998 Stock Option and Incentive Plan to certainexecutive officers of the Company, respectively, including Terms and Conditions of Performance-Based Restricted Units (incorporated herein by this reference to Exhibit 10.40 to the Company’sAnnual Report on Form 10-K for the year ended December 31, 2001).
*10.8f GlobalSantaFe Corporation 2001 Non-Employee Director Stock Option and Incentive Plan(incorporated herein by this reference to the Company’s Registration Statement on Form S-8(No. 333-73878) filed November 21, 2001).
*10.8g GlobalSantaFe Corporation 2001 Long-Term Incentive Plan (incorporated herein by this reference toExhibit 10.1 to the Company’s Quarterly Report on Form 10-Q for the quarter ended June 30, 2001).
*10.8g(1) Form of Notice of Grant of Stock Options used for stock option grants under the GlobalSantaFeCorporation 2001 Long-Term Incentive Plan (incorporated herein by this reference to Exhibit 10.41to the Company’s Annual Report on Form 10-K for the year ended December 31, 2001).
122
*10.8g(2) Form of Memorandum dated March 4, 2002, Regarding Grant of Performance-Based RestrictedUnits under the GlobalSantaFe Corporation 2001 Long-Term Incentive Plan to certain executiveofficers of the Company, respectively, including Terms and Conditions of Performance-BasedRestricted Units (incorporated herein by this reference to Exhibit 10.40 to the Company’s AnnualReport on Form 10-K for the year ended December 31, 2001).
*10.8g(3) Form of Notice of Stock Option Grant to Non-Employee Directors under the GlobalSantaFeCorporation 2001 Long-Term Incentive Plan (incorporated herein by this reference toExhibit 10.10g(3) to the Company’s Annual Report on Form 10-K for the year endedDecember 31, 2005).
*10.8h GlobalSantaFe 2003 Long-Term Incentive Plan (as Amended and Restated Effective June 7,2005) (incorporated herein by this reference to Exhibit 10.4 to the Company Quarterly Report onForm 10-Q for the quarter ended June 30, 2005).
*10.8h(1) Forms of Memoranda Regarding Grant of Performance Units under the GlobalSantaFe 2003Long-Term Incentive Plan to certain executive officers of the Company, including terms andconditions for 2003-2005 and 2004-2006 performance cycles (incorporated herein by thisreference to Exhibit 10.35 to the Company’s Annual Report on Form 10-K for the year endedDecember 31, 2003).
*10.8h(2) Form of Notice of Grant of Stock Options for stock option grants under the GlobalSantaFe 2003Long-Term Incentive Plan (incorporated herein by this reference to Exhibit 10.37 to theCompany’s Annual Report on Form 10-K for the year ended December 31, 2003).
*10.8h(3) Form of Notice of Stock Option Grant used for new stock option grants to non-employeedirectors under the GlobalSantaFe 2003 Long-Term Incentive Plan (incorporated herein by thisreference to Exhibit 10.38 to the Company’s Annual Report on Form 10-K for the year endedDecember 31, 2003).
*10.8h(4) Form of Notice of Grant for Non-Employee Director Restricted Stock Units under theGlobalSantaFe 2003 Long-Term Incentive Plan (incorporated herein by this reference toExhibit 10.1 to the Company’s Quarterly Report on Form 10-Q for the quarter ended June 30,2004).
*10.8h(5) Form of the Notice of Grant of Stock Options under the GlobalSantaFe 2003 Long-TermIncentive Plan (incorporated herein by this reference to Exhibit 10.3 to the Company’s CurrentReport on Form 8-K filed with the Commission on March 2, 2005).
*10.8h(6) Form of the Notice of Grant of Performance Units under the GlobalSantaFe 2003 Long-TermIncentive Plan (incorporated herein by this reference to Exhibit 10.2 to the Company’s CurrentReport on Form 8-K filed with the Commission on March 2, 2005).
*10.8h(7) Form of the Notice of Grant of Performance-Awarded Restricted Stock Units under theGlobalSantaFe 2003 Long-Term Incentive Plan (incorporated herein by this reference toExhibit 10.1 to the Company’s Current Report on Form 8-K filed with the Commission onMarch 2, 2005).
*10.8h(8) Form of Notice of Grant of Non-Employee Director Restricted Stock Units under theGlobalSantaFe 2003 Long-Term Incentive Plan (incorporated herein by this reference toExhibit 10.10h(8) to the Company’s Annual Report on Form 10-K for the year endedDecember 31, 2005).
*10.8h(9) Form of Notice of Grant of Stock-Settled Stock Appreciation Rights under the GlobalSantaFe2003 Long-Term Incentive Plan (incorporated herein by this reference to Exhibit 10.2 of theCompany’s Current Report on Form 8-K filed with the Commission on December 20, 2005).
*10.8h(10) Form of the Notice of Grant and Specification of the Terms and Conditions of Non-EmployeeDirector Stock-Settled Stock Appreciation Rights under the GlobalSantaFe 2003 Long-TermIncentive Plan (incorporated herein by this reference to Exhibit 10.1 to the Company’s QuarterlyReport on Form 10-Q for the quarter ended June 30, 2006).
123
+*10.8h(11) Form of Notice of Grant of Stock-Settled Stock Appreciation Rights under the GlobalSantaFe2003 Long-Term Incentive Plan.
*10.9a GlobalSantaFe Corporation Key Employee Deferred Compensation Plan effective January 1,2001; and Amendment to GlobalSantaFe Corporation Key Employee Deferred CompensationPlan effective November 20, 2001 (incorporated herein by this reference Exhibit 10.33 to theCompany’s Annual Report on Form 10-K for the year ended December 31, 2004).
*10.9b Trust Agreement between GlobalSantaFe Corporate Services Inc. and Fidelity ManagementTrust Company for the GlobalSantaFe Key Employee Deferred Compensation Trust dated as ofJuly 12, 2002 (incorporated herein by this reference Exhibit 10.34 to the Company’s AnnualReport on Form 10-K for the year ended December 31, 2004).
*10.10a GlobalSantaFe Retention Program (As Amended and Restated Effective December 20, 2005)(incorporated herein by this reference Exhibit 10.12a to the Company’s Annual Report on Form10-K for the year ended December 31, 2005).
*10.10b Retention Notice Under GlobalSantaFe Retention Program (incorporated herein by thisreference Exhibit 10.12b to the Company’s Annual Report on Form 10-K for the year endedDecember 31, 2005).
*10.11a Employee Severance Protection Plan adopted May 2, 1997 (incorporated herein by thisreference to the Company’s Annual Report on Form 20-F for the fiscal year ended June 30,1997); Form of Executive Severance Protection Agreement thereunder, effective October 18,1999, between the Company and fourteen officers, respectively (incorporated herein by thisreference to the Company’s Annual Report on Form 20-F for the calendar year ended December31, 1999); Amendments to Executive Severance Protection Agreements, dated October 25,2001, between the Company and three executive officers, respectively (incorporated herein bythis reference to Exhibit 10.1 of the Company’s Quarterly Report on Form 10-Q for the quarterended March 31, 2002).
*10.11b Form of Severance Agreement dated August 16, 2001, between Global Marine Inc. and sixexecutive officers, respectively (subsequently assumed by the Company) (incorporated hereinby this reference to Exhibit 10.4 of Global Marine Inc.’s Quarterly Report on Form 10-Q(Commission File No. 1-5471) for the quarter ended September 30, 2001); SupplementalAgreement to Severance Agreement dated January 20, 2003 by and between Global MarineInc., GlobalSantaFe Corporation and W. Matt Ralls (incorporated herein by this reference toExhibit 10.25 of the Company’s Annual Report on Form 10-K for the year ended December 31,2002).
*10.11c Form of Severance Agreement dated July 29, 2003, between the Company and three executiveofficers, respectively (incorporated herein by this reference to Exhibit 10.2 of the Company’sQuarterly Report on Form 10-Q for the quarter ended September 30, 2003).
*10.11d Form Severance Agreement with Executive Officers (incorporated herein by this reference toExhibit 10.1 to the Company’s Current Report on Form 8-K/A filed with the Commission onJuly 26, 2005).
*10.11e GlobalSantaFe Severance Program for Shorebased Staff Personnel effective January 1, 2006,through December 31, 2006 (incorporated herein by this reference to Exhibit 10.13e to theCompany’s Annual Report on Form 10-K for the year ended December 31, 2005).
+*10.11f GlobalSantaFe Severance Program for Shorebased Staff Personnel effective January 1, 2007,through December 31, 2007.
*10.12 Group Life and Accident and Health Insurance Policy between Aetna Life Insurance Companyand GlobalSantaFe effective January 1, 2004 (incorporated herein by this reference toExhibit 10.42 of GlobalSantaFe Corporation’s Annual Report on Form 10-K for the year endedDecember 31, 2004).
124
*10.13 Form of GlobalSantaFe Indemnity Agreement (incorporated herein by this reference toExhibit 10.51 to the Company’s Annual Report on Form 10-K for the year ended December 31,2002).
*10.14a GlobalSantaFe Personal Financial Planning Assistance Program for Senior Executive Officers(incorporated herein by this reference to Exhibit 10.44 of GlobalSantaFe Corporation’s AnnualReport on Form 10-K for the year ended December 31, 2004).
*10.14b GlobalSantaFe Personal Financial Planning Assistance Program for Key Employees (incorporatedherein by this reference to Exhibit 10.45 of GlobalSantaFe Corporation’s Annual Report onForm 10-K for the year ended December 31, 2004).
*10.15a GlobalSantaFe Supplemental Executive Retirement Plan (incorporated herein by this reference toExhibit 10.1 to the Company’s Quarterly Report on Form 10-Q for the quarter endedSeptember 30, 2002).
+*10.15b Grantor Trust Agreement under the GlobalSantaFe Supplemental Executive Retirement Plan,effective December 30, 2005.
*10.15c GlobalSantaFe Pension Equalization Plan effective as of July 1, 2002 (incorporated herein by thisreference Exhibit 10.35 to the Company’s Annual Report on Form 10-K for the year endedDecember 31, 2004).
+*10.15d Grantor Trust Agreement under the GlobalSantaFe Pension Equalization Plan, effectiveDecember 30, 2005.
+12.1 Statement setting forth detail of Computation of Ratios of Earnings to Fixed Charges.
+21.1 List of Subsidiaries.
+23.1 Consent of PricewaterhouseCoopers LLP, Independent Registered Public Accounting Firm.
+23.2 Consent of Netherland, Sewell & Associates, Inc.
+23.3 Consent of DeGolyer and MacNaughton.
+31.1 Chief Executive Officer’s Certification pursuant to Rule 13a—14(a) of the Securities ExchangeAct of 1934.
+31.2 Chief Financial Officer’s Certification pursuant to Rule 13a—14(a) of the Securities Exchange Actof 1934.
+32.1 Chief Executive Officer’s Certification pursuant to Section 906 of the Sarbanes-Oxley Act of2002.
+32.2 Chief Financial Officer’s Certification pursuant to Section 906 of the Sarbanes-Oxley Act of 2002.
99.1 Report regarding estimates of the Company’s proved oil and gas reserves in the United Statesprepared by Netherland, Sewell & Associates, Inc. (incorporated herein by this reference toExhibit 99.2 to the Company’s Form 10-K/A amendment to Annual Report on Form 10-K for theyear ended December 31, 2004).
99.2 Report regarding estimates of the Company’s proved oil and gas reserves in the United Kingdomprepared by DeGolyer and MacNaughton (incorporated herein by this reference to Exhibit 99.3 tothe Company’s Form 10-K/A amendment to Annual Report on Form 10-K for the year endedDecember 31, 2004).
+ Filed herewith.* Indicates management contract or compensatory plan or arrangement.
125
SIGNATURES
Pursuant to the requirements of Section 13 or 15(d) of the Securities Exchange Act of 1934, the registranthas duly caused this report to be signed on its behalf by the undersigned, thereunto duly authorized.
GLOBALSANTAFE CORPORATION(REGISTRANT)
Date: February 28, 2007 By: /S/ MICHAEL R. DAWSON
(Michael R. Dawson)Senior Vice President and Chief Financial Officer
Pursuant to the requirements of the Securities Exchange Act of 1934, this report has been signed below bythe following persons on behalf of the registrant and in the capacities and on the dates indicated.
Signature Title Date
/S/ JON A. MARSHALL
(Jon A. Marshall)
President, Chief Executive Officer andDirector (Principal ExecutiveOfficer)
February 28, 2007
/S/ MICHAEL R. DAWSON
(Michael R. Dawson)
Senior Vice President and ChiefFinancial Officer (Principal FinancialOfficer)
February 28, 2007
/S/ ROBERT L. HERRIN, JR.(Robert L. Herrin, Jr.)
Vice President and Controller (PrincipalAccounting Officer)
February 28, 2007
/S/ W. RICHARD ANDERSON
(W. Richard Anderson)
Director February 28, 2007
/S/ FERDINAND A. BERGER
(Ferdinand A. Berger)
Director February 28, 2007
/S/ THOMAS W. CASON
(Thomas W. Cason)
Director February 28, 2007
/S/ RICHARD L. GEORGE
(Richard L. George)
Director February 28, 2007
/S/ EDWARD R. MULLER
(Edward R. Muller)
Director February 28, 2007
/S/ PAUL J. POWERS
(Paul J. Powers)
Director February 28, 2007
/S/ ROBERT E. ROSE
(Robert E. Rose)
Director February 28, 2007
/S/ STEPHEN J. SOLARZ
(Stephen J. Solarz)
Director February 28, 2007
/S/ CARROLL W. SUGGS
(Carroll W. Suggs)
Director February 28, 2007
/S/ JOHN L. WHITMIRE
(John L. Whitmire)
Director February 28, 2007
126
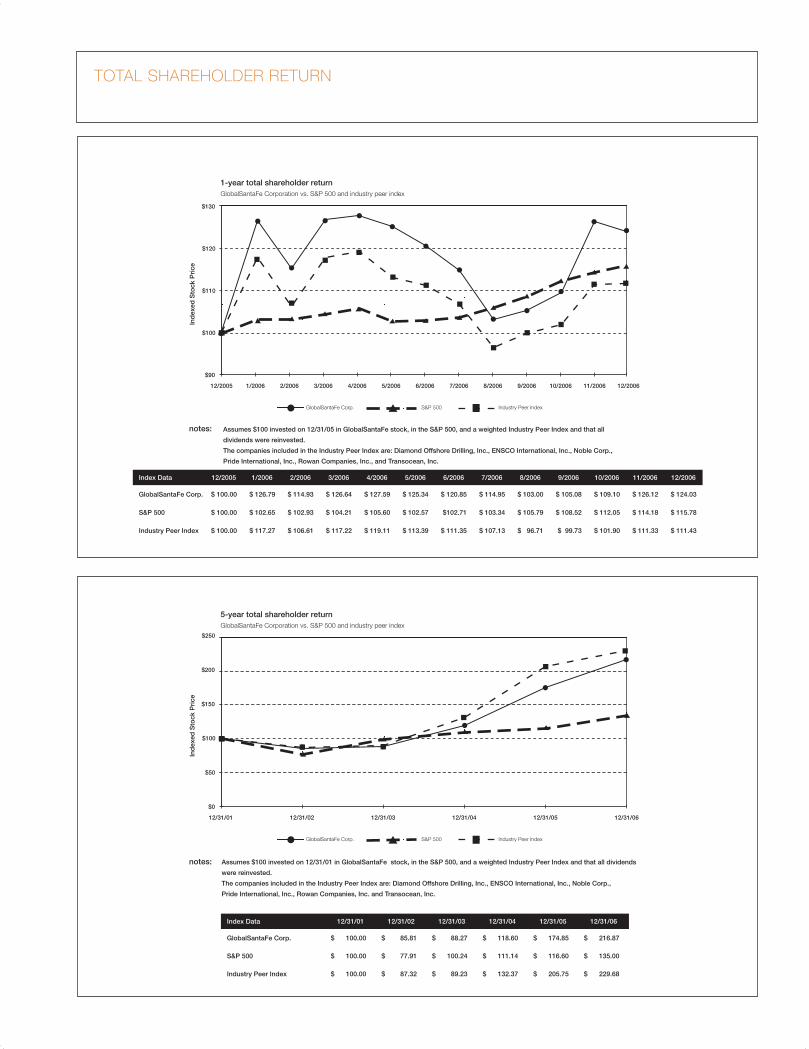
total shareholder return
$0
$50
$100
$150
$200
$250
12/31/01 12/31/02 12/31/03 12/31/04 12/31/05 12/31/06
Ind
exed
Sto
ck P
rice
GlobalSantaFe Corp. S&P 500 Industry Peer Index
5-year total shareholder returnGlobalSantaFe Corporation vs. S&P 500 and industry peer index
notes:
notes:
Assumes $100 invested on 12/31/01 in GlobalSantaFe stock, in the S&P 500, and a weighted Industry Peer Index and that all dividends
were reinvested.
The companies included in the Industry Peer Index are: Diamond Offshore Drilling, Inc., ENSCO International, Inc., Noble Corp.,
Pride International, Inc., Rowan Companies, Inc. and Transocean, Inc.
Index Data 12/31/01 12/31/02 12/31/03 12/31/04 12/31/05 12/31/06
GlobalSantaFe Corp. $ 100.00 $ 85.81 $ 88.27 $ 118.60 $ 174.85 $ 216.87
S&P 500 $ 100.00 $ 77.91 $ 100.24 $ 111.14 $ 116.60 $ 135.00
Industry Peer Index $ 100.00 $ 87.32 $ 89.23 $ 132.37 $ 205.75 $ 229.68
$90
$110
$120
$100
$130
12/2005 1/2006 2/2006 3/2006 4/2006 5/2006 6/2006 7/2006 8/2006 9/2006 10/2006 11/2006 12/2006
Ind
exed
Sto
ck P
rice
GlobalSantaFe Corp. S&P 500 Industry Peer Index
1-year total shareholder returnGlobalSantaFe Corporation vs. S&P 500 and industry peer index
Assumes $100 invested on 12/31/05 in GlobalSantaFe stock, in the S&P 500, and a weighted Industry Peer Index and that all
dividends were reinvested.
The companies included in the Industry Peer Index are: Diamond Offshore Drilling, Inc., ENSCO International, Inc., Noble Corp.,
Pride International, Inc., Rowan Companies, Inc., and Transocean, Inc.
Index Data 12/2005 1/2006 2/2006 3/2006 4/2006 5/2006 6/2006 7/2006 8/2006 9/2006 10/2006 11/2006 12/2006
GlobalSantaFe Corp. $ 100.00 $ 126.79 $ 114.93 $ 126.64 $ 127.59 $ 125.34 $ 120.85 $ 114.95 $ 103.00 $ 105.08 $ 109.10 $ 126.12 $ 124.03
S&P 500 $ 100.00 $ 102.65 $ 102.93 $ 104.21 $ 105.60 $ 102.57 $102.71 $ 103.34 $ 105.79 $ 108.52 $ 112.05 $ 114.18 $ 115.78
Industry Peer Index $ 100.00 $ 117.27 $ 106.61 $ 117.22 $ 119.11 $ 113.39 $ 111.35 $ 107.13 $ 96.71 $ 99.73 $ 101.90 $ 111.33 $ 111.43
GSF2006AR_4.4.indd 7 4/10/07 10:43:09 AM
Corporate GovernanCe
BOARD OF DIRECTORS
Robert E. Rose
Chairman of the Board
of GlobalSantaFe Corporation
W. Richard Anderson
President and Chief Executive
Officer of Prime Natural Resources,
Inc., an oil and natural gas exploration
and production company
Ferdinand A. Berger
Retired Director of Shell
International Petroleum
Company Limited
Thomas W. Cason
Retired Owner and Manager of
Equipment Dealerships,
primarily in support of the
agricultural industry
Richard L. George
President and Chief Executive
Officer of Suncor Energy Inc., an
integrated oil and gas company
Jon A. Marshall
President and Chief Executive
Officer of GlobalSantaFe
Corporation
Edward R. Muller
Chairman, President and Chief Executive
Officer of Mirant Corporation, an energy
company that produces and sells electricity
Paul J. Powers
Retired Chairman of the Board
and Chief Executive Officer of
Commercial Intertech Corp., a
manufacturer of hydraulic systems,
pre-engineered buildings
and metal products
Stephen J. Solarz
President of Solarz Associates,
an international consulting firm
Carroll W. Suggs
Retired Chairman and Chief
Executive Officer of Petroleum
Helicopters, Inc., a provider of
helicopter transportation services
John L. Whitmire
Chairman of the Board of
CONSOL Energy Inc., a producer
of coal and natural gas
OFFICERS
Jon A. Marshall
President and
Chief Executive Officer
W. Matt Ralls
Executive Vice President and
Chief Operating Officer
Michael R. Dawson
Senior Vice President and
Chief Financial Officer
Roger B. Hunt
Senior Vice President,
Marketing
James L. McCulloch
Senior Vice President and
General Counsel
Cheryl D. Richard
Senior Vice President,
Human Resources
R. Blake Simmons
Senior Vice President,
Operations
Robert L. Herrin
Vice President and Controller
Richard J. Hoffman
Vice President,
Investor Relations
Alexander A. Krezel
Vice President, Secretary and
Associate General Counsel
Myrtle L. Penelton
Vice President, Tax
Anil B. Shah
Vice President and Treasurer
John L. Truschinger
Vice President and
Chief Information Officer
CORPORATE GOvERnAnCE
CERTIFICATIOn
GlobalSantaFe Corporation has filed the
certification of its Chief Executive Officer
and Chief Financial Officer pursuant to
Section 302 of the Sarbanes-Oxley Act as
exhibits to its Annual Report on Form 10-K
for the year ended December 31, 2006.
On June 22, 2006, our Chief Executive
Officer, as required by Section 303A.12(a)
of the New York Stock Exchange
Corporate Governance Listing Standards,
submitted his certification to the New York
Stock Exchange that he was not aware
of any violation by GlobalSantaFe of the
Exchange’s corporate governance listing
standards.
GSF2006AR_4.4.indd 8 4/10/07 10:43:09 AM
4
17 35
5
2
436
1
25
3
13
12
9
33
10
31
20
30
29
5556
7
8
1819
14 15
16
2122
23
28
37
41
39
4226
40
49
48
53
58
60
34 3611
4546 44
47 5759
50
51
52
54
as of and for the years ended December 31,
(Dollars in millions) 2006 2005 2004
Revenues $ 3,312.6 $ 2,263.5 $ 1,723.7
Operating Income $ 1,109.8 $ 464.4 $ 133.8
Income From Continuing Operations
$ 1,006.4 $ 423.1 $ 31.4
Income From Discontinued Operations, Net of Tax Effect
$ — $ — $ 112.3
Net Income $ 1,006.4 $ 423.1 $ 143.7
Capital Expenditures $ 510.4 $ 396.9 $ 452.9
Marine Rig Utilization 95% 96% 86%
Turnkey Wells Drilled 70 80 89
Turnkey Well Completions 27 19 30
Cash and Cash Equivalents and Marketable Securities
$ 348.9 $ 837.3 $ 808.6
Net Properties and Equipment
$ 4,514.6 $ 4,317.8 $ 4,329.9
Total Assets $ 6,220.2 $ 6,222.1 $ 5,998.2
Long-term Debt Including Current Maturities
$ 623.9 $ 550.6 $ 905.1
Shareholders’ Equity $ 4,847.1 $ 4,957.5 $ 4,466.4
About GlobAlSAntAFe
GlobalSantaFe Corporation is one of the world’s largest providers
of offshore oil and gas drilling and drilling management services. We
own or operate 59 marine drilling rigs, including 37 premium jackup
rigs; 6 heavy-duty, harsh-environment jackups; 11 semisubmersibles;
3 dynamically positioned, ultra-deepwater drillships; and 2
semisubmersibles owned by third parties and operated under
a joint venture agreement. In addition, a new ultra-deepwater
semisubmersible is under construction and scheduled for delivery
in early 2009. GlobalSantaFe stock trades on the New York Stock
Exchange under the symbol GSF.
FinAnciAl HiGHliGHtS
2006 contrAct DrillinG revenueS
West Africa22.4%
U.S. Gulf of Mexico
23.3%
North Sea 16.8%
Southeast Asia - 12.3%
Other7%
South America - 6.3%
Middle East - 6.2%
Mediterranean Sea - 5.7%
Super Majors60.1%
Independents27.9
Majors12
Super Majors % of Total
BP 19.2%
Total 9.6%
Eni 8.4%
ExxonMobil 7.7%
Chevron 6.6%
Shell 6.5%
ConocoPhillips 2.1%
By Area
By Customer
WorlDWiDe Fleet
JACkUPS
Heavy-Duty Harsh Environment 1 GSF Galaxy I 400' 2 GSF Galaxy II 400' 3 GSF Galaxy III 400' 4 GSF Magellan 350' 5 GSF Monitor 350' 6 GSF Monarch 350'
Cantilevered 7 GSF Constellation I 400' 8 GSF Constellation II 400' 9 GSF Baltic 375' 10 GSF Adriatic II 350' 11 GSF Adriatic III 350' 12 GSF Adriatic IX 350' 13 GSF Adriatic X 350' 14 GSF Key Manhattan 350' 15 GSF Key Singapore 350' 16 GSF Adriatic VI 328' 17 GSF Adriatic VIII 328' 18 GSF Adriatic I 300' 19 GSF Adriatic V 300' 20 GSF Adriatic XI 300' 21 GSF Compact Driller 300'
22 GSF Galveston Key 300' 23 GSF Key Gibraltar 300' 24 GSF Key Hawaii 300' 25 GSF Labrador 300' 26 GSF Main Pass I 300' 27 GSF Main Pass IV 300' 28 GSF Parameswara 300' 29 GSF Rig 134 300' 30 GSF Rig 136 300' 31 GSF High Island II 270' 32 GSF High Island IV 270' 33 GSF High Island V 270' 34 GSF High Island I 250' 35 GSF High Island VII 250' 36 GSF High Island VIII 250' 37 GSF High Island IX 250' 38 GSF Rig 103 250' 39 GSF Rig 105 250' 40 GSF Rig 124 250' 41 GSF Rig 127 250' 42 GSF Rig 141 250' 43 GSF Britannia 230'
SEMISUBMErSIBlES 44 GSF Development Driller I 7,500' 45 GSF Development Driller II 7,500' 46 GSF Celtic Sea 5,750' 47 GSF Arctic I 3,400' 48 GSF Rig 135 2,800' 49 GSF Rig 140 2,400' 50 GSF Aleutian Key 2,300' 51 GSF Arctic III 1,800' 52 GSF Arctic IV 1,500' 53 GSF Grand Banks 1,500' 54 GSF Arctic II 1,200'
Third-Party Owned 55 Dada Gorgud 1,558' 56 Istiglal 1,558'
DrIllShIPS 57 GSF C.R. Luigs 10,000' 58 GSF Jack Ryan 10,000' 59 GSF Explorer 7,800'
UNDEr CONSTrUCTION 60 GSF Development Driller III 7,500'
† Units in transit on Feb. 28 shown at destinations
Maximum Water Depths Maximum Water Depths Maximum Water Depths
JACkUPSNamed for the elevating systems that extend their legs to the sea bottom and provide a stable platform for drilling, jackup rigs generally operate in water depths up to 400 feet. We own one of the world’s largest HDHE jackup fleets, and all of our jackups are cantilevered to extend their drill floors over fixed platforms.
SEMISUBMErSIBlESSemisubmersible rigs are notable for their pontoons and columns, which are flooded to partially submerge these floating drilling units to a predetermined depth. Our semisubmersible fleet operates in depths from midwater to ultra-deepwater.
DrIllShIPSThe mobility and load-carrying capabilities of drillships make them ideal for deepwater drilling in remote locations with moderate weather environments. Our ultra-deepwater drillships use dynamic positioning and can drill in water depths up to 10,000 feet.
location as of February 28, 2007†
24323827
Printed on Recycled Paper. FSC Certified.
corporAte inFormAtion
Executive Office
GlobalSantaFe Corporation
15375 Memorial Drive
Houston, Texas 77079-4101
Telephone: 281.925.6000
www.globalsantafe.com
regional Offices
GlobalSantaFe Aberdeen
Langlands House
Huntly Street
Aberdeen AB10 1SH, Scotland
GlobalSantaFe Angola
Travessa Nicolau Castelo Branco, No. 22/24
Bairro Maculusso
Municipo da Ingombota
Luanda, Angola
GlobalSantaFe Egypt
Kilometer No. 11
Kattameya – Ein Soukhna
Desert Road
P.O. Box 341
Cairo, Egypt
GlobalSantaFe France
16 Rue Clement Marot
75008 Paris, France
GlobalSantaFe Jakarta
Jalan Melawai IX / 2
P.O. Box 2351
Jakarta, Selatan, Indonesia
GlobalSantaFe Malaysia
9th Floor, Angkasa Raya Building
Jalan Ampang
50450 Kuala Lumpur
Malaysia
Investor relations Inquiries
Richard J. Hoffman
Vice President,
Investor Relations
Telephone: 281.925.6444
Subsidiary Offices
Applied Drilling Technology Inc.
Stephen E. Morrison, President
15375 Memorial Drive
Houston, Texas 77079-4101
Telephone: 281.925.7100
Challenger Minerals Inc.
Charles B. Hauf, President
15375 Memorial Drive
Houston, Texas 77079-4101
Telephone: 281.925.7200
registered Office
GlobalSantaFe Corporation
P.O. Box 309GT, Ugland House
South Church Street
George Town, Grand Cayman
Cayman Islands
Stock listing
New York Stock Exchange
Symbol: GSF
Stock Transfer Agent
and registrar
Computershare
P. O. Box 43078
Providence, RI 02940-3078
Toll Free: 1.877.273.7879
Auditors
PricewaterhouseCoopers LLP
Houston, Texas
Annual General Meeting
of Shareholders
June 7, 2007, 8:00 A.M. CDT
GlobalSantaFe Auditorium
15375 Memorial Drive
Houston, Texas 77079
Form 10-k
A copy of our 2006 Annual Report on
Form 10-K, as filed with the Securities and
Exchange Commission, will be furnished
without charge upon written request to:
Investor Relations, GlobalSantaFe
Corporation, 15375 Memorial
Drive, Houston, Texas, 77079-4101,
281.925.6444. Our 2006 Annual Report
on Form 10-K also is available on our Web
site at www.globalsantafe.com or from the
SEC’s EDGAR filings at www.sec.gov
Financial Information and
News releases
Information updates about us, including
quarterly financial results and current news
releases, are available to the public on our
Web site at www.globalsantafe.com or upon
request from the Company’s Investor Rela-
tions Department.
Forward looking Statements
The disclaimer regarding Forward Looking
Statements contained in the attached Form
10-K is incorporated herein by this reference.

GlobalSantaFe corporation AnnuAl report 2006
letter to SHAreHolDerS
During 2006, our people worked safer and our
operations were more profitable than they have ever
been. It was the most successful year in GlobalSan-
taFe’s history by almost any measure, and we have
every reason to expect even better results in 2007.
Robust demand for offshore contract drilling
services outstripped the supply of rigs, creating a
market imbalance throughout 2006 that produced
continued high utilization and record-high dayrates
for every class of equipment in our worldwide
fleet. We reported net income of more than $1
billion and more than doubled our contract drilling
revenue backlog to nearly $11 billion during the
year, as we secured more long-term contracts at
leading-edge rates.
This strong financial performance resulted in a
2006 total shareholder return of 24 percent – the
best in our peer group – aided by share repur-
chases during the year in excess of $1 billion
and dividends in excess of $200 million. While
our preference is to grow our earnings capability
through acquisition or construction of additional
rigs, to the extent we are unable to prudently rein-
vest our capital, we remain committed to returning
excess cash to our shareholders through share
repurchases and regular quarterly dividends.
Our contract drilling operations have continued
to benefit in early 2007 from strong demand and
high dayrates for jackup and floating rigs in every
market except the U.S. Gulf of Mexico jackup
market, where we have reduced our jackup fleet
to only three rigs. While we remain cautious about
the impact of future jackup capacity increases,
our outlook remains strong for the remainder of
this year, and we’re optimistic beyond that, given
that it will take an annualized demand increase of
only about 6 percent to balance jackup markets
through 2009. The continued strong demand for
deepwater semisubmersibles and drillships gives
us confidence in the long-term outlook for this
market, despite the industry’s planned newbuild
deliveries through 2010.
The greatest immediate challenge we face during
this period of worldwide fleet expansion is to retain,
attract and develop our people while managing
costs and continuing to improve customer service
and safety performance. We have made significant
investments in, and remain focused on, these critical
areas, and I am confident of our continued success.
The fundamental economic and political drivers that
created this very positive market environment are
still in place. Sustained world economic growth,
particularly in the developing economies, contin-
ues to drive hydrocarbon demand, while oil and
gas producers are struggling to add incremental
production in the face of accelerated depletion of
existing reservoirs and growing geopolitical tensions.
As a consequence, we anticipate our customer
base will be compelled to increase capital spending
to meet the growing world energy demand.
We were pleased to add W. Richard Anderson to
our board last September and look forward to his
continued contributions; however, we will miss the
talents and wise counsel of directors Ferdinand A.
Berger and Paul J. Powers, whose many years of
valuable service to our company will end when their
terms expire in June 2007. GlobalSantaFe’s future
remains very bright, and I am confident that we have
the people, the resolve and the financial strength to
capitalize on the opportunities ahead.
On behalf of our board of directors and the 7,600
men and women of GlobalSantaFe, I thank you for
your continued support.
Jon A. MarshallPresident and CEO12 March 2007
GlobalSantaFe Corporation
15375 Memorial Drive
Houston, Texas 77079-4101
www.globalsantafe.com
Glo
balS
antaFe Co
rpo
ration A
NN
UA
L RE
PO
RT 2
00
6
C
M
Y
CM
MY
CY
CMY
K
GSF 2006AR_Spine Art.pdf 4/13/07 5:27:52 PM