globaliz(s)ation and its impacts. what is globalization? is it new phenomenon? what are...
TRANSCRIPT
Globaliz(s)ation and its impacts
• What is globalization? Is it new phenomenon?
• What are characteristics of the contemporary wave of globalization?
• What is the impact on the world economy?

Table of contents
A. definition of globalization
B. specifics of contemporary
globalization
C. impact of globalization
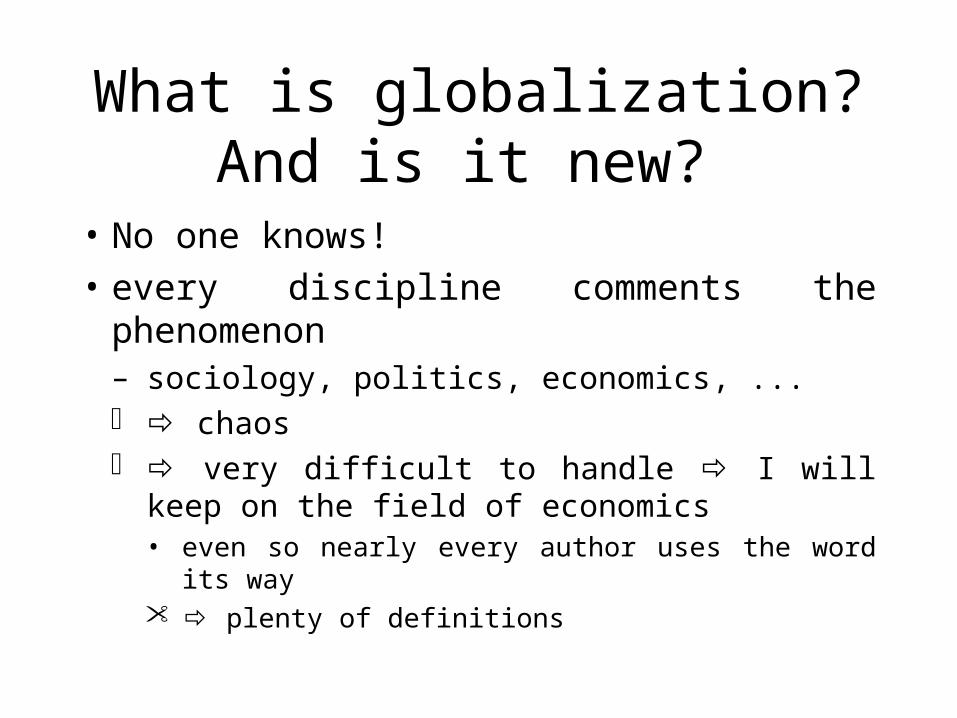
What is globalization? And is it new?
• No one knows!
• every discipline comments the phenomenon– sociology, politics, economics, ... chaos very difficult to handle I will keep on the
field of economics• even so nearly every author uses the word its way plenty of definitions

integration X st. completely new• integration
• the range – from integration of a single market
• for example capital markets
– up to overall integration
• and the time period?– from prehistoric times
– up to only last twenty years
– strong stream that reminds the last wave of integration at the end of the 19th century

• something completely new– prominent Dicken (Global Shift)
• Internationalization processes involve the simple extension of economic activities across national boundaries. It is, essentially, a quantitative process which leads to a more extensive geographical pattern of economic activity.
• X Globalization processes are qualitatively different from internalization processes. They involve not merely the geographical extension of economic activity but also – and more importantly – the functional integration of such international dispersed activities.

SO? it is matter of understanding or believe
– I don’t find anything so “qualitatively different” that we would need a new word for it
I don’t think that it is anything completely new and I deem the processes as part of long run integration• integration – in the form of trade – has prehistoric roots
• is the world more integrated now? – it depends – generally ...

• we already had period of deep integration – before the First World War
• integration of all markets - goods, capital and labour
• EX and IM/GDP (in %) between 1913-1987 1913 1950 1973 1987 France 30,9 21,4 29,2 34,8 Germany 36,1 20,1 35,3 46,8 Japan 30,1 16,4 18,2 16,1 Holland 100 70,9 74,8 86,5 Britain 47,2 37,1 37,6 42 USA 11,2 6,9 10,8 15,2 arithmetic average 42,6 28,8 34,3 40,2
Maddison, Dynamic Forces in Capitalist Development: A Long-Run Comparative view
• BUT every historic period has its specific

so globalization (in my point of view) is integration with a few new features– otherwise it is very old phenomenon and in fact
everything penetrating• (popular) example with pencil
• and it is spontaneous – releasing creative powers in the world economy– nobody invented it and nobody steers it
• the question is: „what are the specifics of the contemporary wave of globalization?“
Table of contents
A. definition of globalization
B. specifics of contemporary
globalization
C. impact of globalization
Specifics of contemporary G.
1. degree of integration of the markets
number of states
3. growing population of the World
4. democratisation
5. strong role of governments
6. technological development
7. supranational organizations
8. pressure groups
9. structure of national economies
10. international monetary system
11. changes in economic theory

1. degree of integration of the markets
• goods and capital markets are probably the most integrated in the history– but the labour market is not
• capital– dismantling barriers after the WW2– dramatic, relatively easy the most integrated
market– SR capital X FDI

• goods– export of goods and services as a percentage of
world output 8.7% in 1913 12.1% in 1973 23.6% in 1996
– total trade (EX +IM)/output 28% in 1970 45% in 1998 - Sullivan (2000)
barriers after the WW2 BUT different forms of protection (H)
• antidumping
– almost 2/3 of trade within 500 kilometres and more than ¾ within 1000 kilometres
of trade b/c growth of transaction within the supranational companies
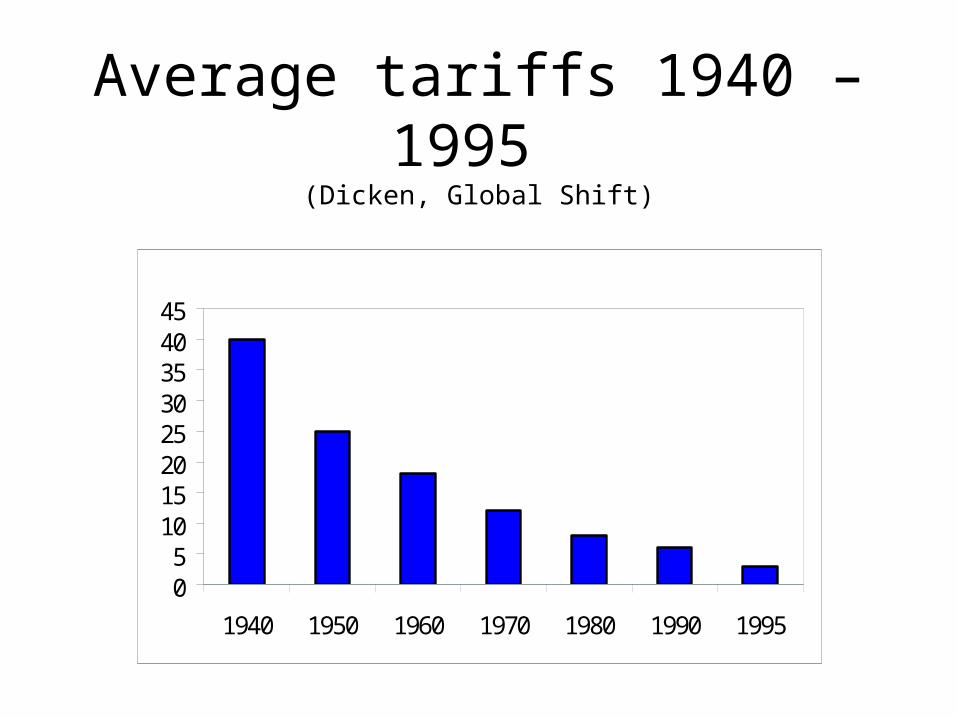
Average tariffs 1940 – 1995 (Dicken, Global Shift)
05
1015202530354045
1940 1950 1960 1970 1980 1990 1995

World export and GDP

• services– outsourcing
• labour force– the least integrated market – creating barriers in
the developed countries– at the end of the 19th century the markets more
integrated• no trouble to move and start new life abroad
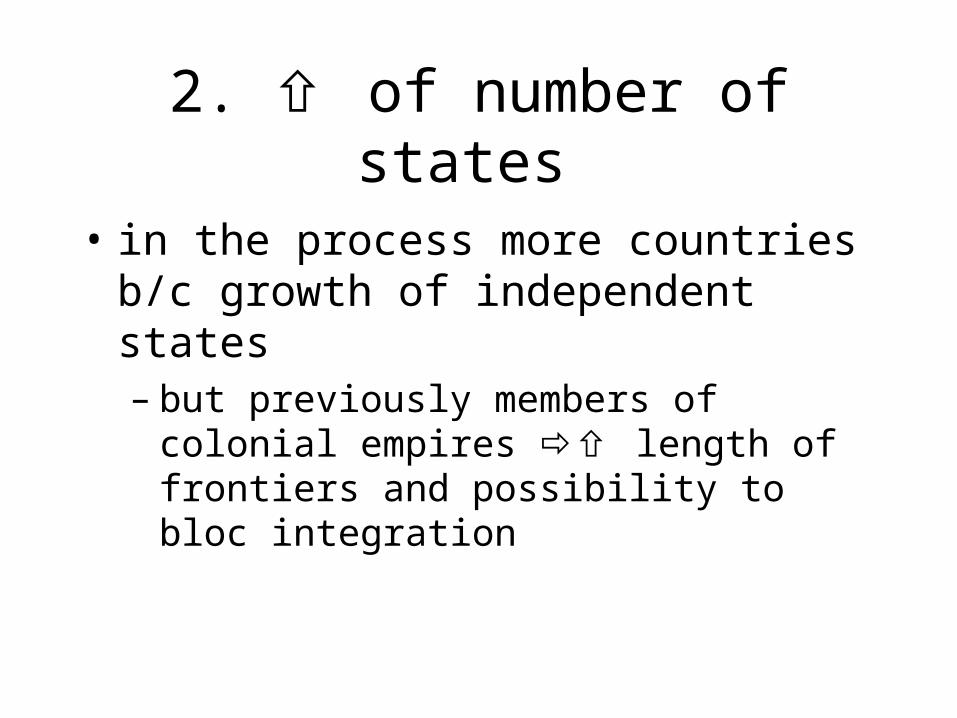
2. of number of states
• in the process more countries b/c growth of independent states – but previously members of colonial empires
length of frontiers and possibility to bloc integration

Membership in the UN
020406080
100120140160180200
1945
1948
1955
1960
1963
1966
1970
1974
1977
1981
1983
1992
1999
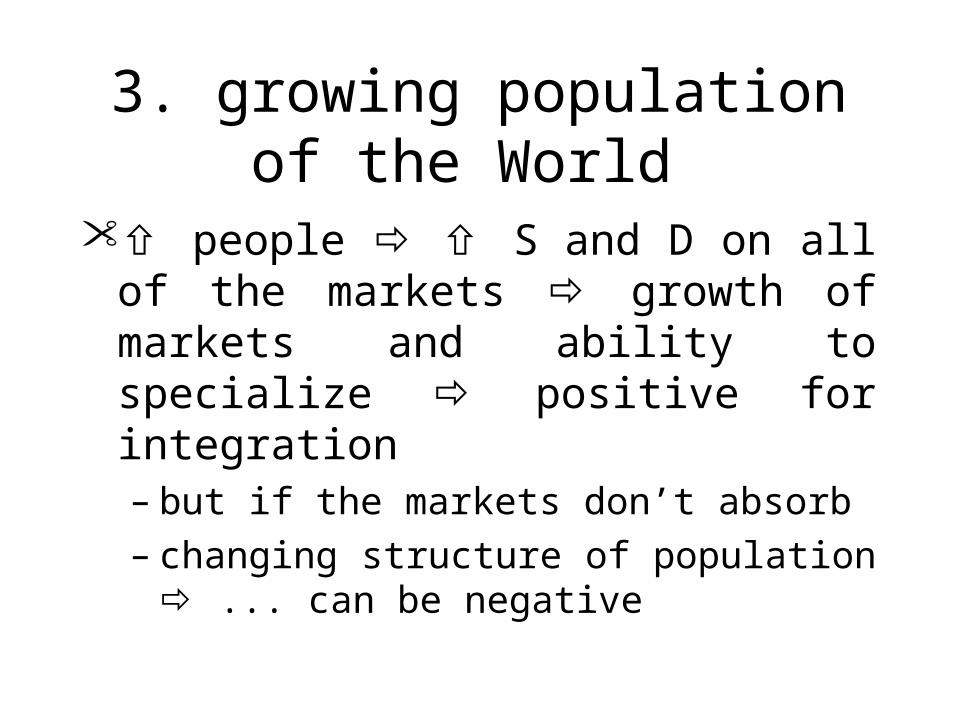
3. growing population of the World
people S and D on all of the markets growth of markets and ability to specialize positive for integration – but if the markets don’t absorb– changing structure of population ... can be
negative

4. democratisation • democracy becomes the dominant form of the
political system – 1900 kind of democracy (women excluded) only 6 of
43 of the national states democracies after 1945 (GER, JAP, Italy and some
developing countries India).
– but 1980 only 37 countries from 121 democratic government (35% world population)
after 1989 1998 already 117 from 193 (54% world population)

• impact on integration questionable in international conflicts – democracies dont
fight each other and start international conflict only in rare (extreme) cases the most important point for international integration
– X – politicians orientate on specific (pressure) groups in society – these are (mostly) against integration
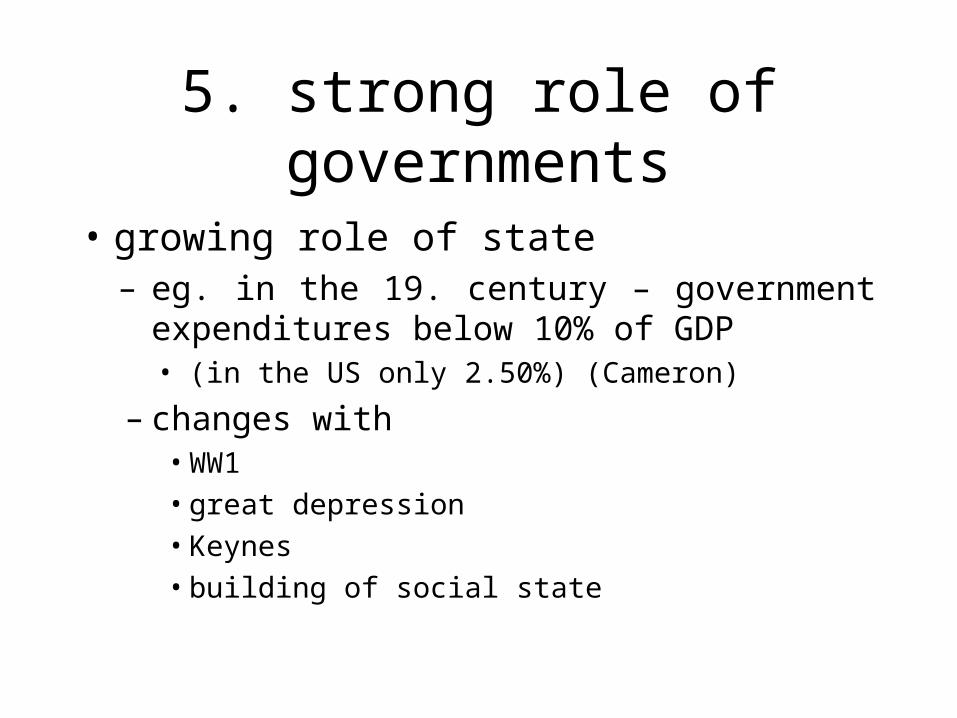
5. strong role of governments
• growing role of state– eg. in the 19. century – government
expenditures below 10% of GDP • (in the US only 2.50%) (Cameron)
– changes with• WW1
• great depression
• Keynes
• building of social state

Development of public expenditures (in % GDP) 1870 – 1994
Country 1870 1913 1920 1937 1960 1980 1994 USA 3,9 1,8 7 8,6 27 31,8 33,5 France 12,6 17 27,6 29 34,6 46,1 54,9 Germany 10 14,8 25 42,4 32,4 47,9 49 Italy 11,9 11,1 22,5 24,5 30,1 41,9 53,9 Holland 9,1 9 13,5 19 33,7 55,2 54,4 Japan 8,8 8,3 14,8 25,4 17,5 32 35,8 Britain 9,4 12,7 26,2 30 32,2 43 42,9 Average (17 industrial countries)
8,3 9,1 15,4 20,7 27,9 42,6 47,2

• if globalizace spontaneous process G against it and block it
• if more money in the treasury for redistribution more power to intervene at the markets
• states can easily block all three markets – eg labour markets– but situation used to be worse G relaxed its policy and enable integration
• eg the capital markets

6. technological development
• driving force of integration – X previous periods (obviously) new forms
(electronics, telecommunications, IT and transport)
– within the last 30 years in prices of computer processing by 99.999%

Decline in real prices during technological
revolutions, annual average

transport and transaction costs specialization + division of labour integration on the markets of goods, services and capital
• + impact on labour market – it is cheaper to move – even groups that could not afford it previously
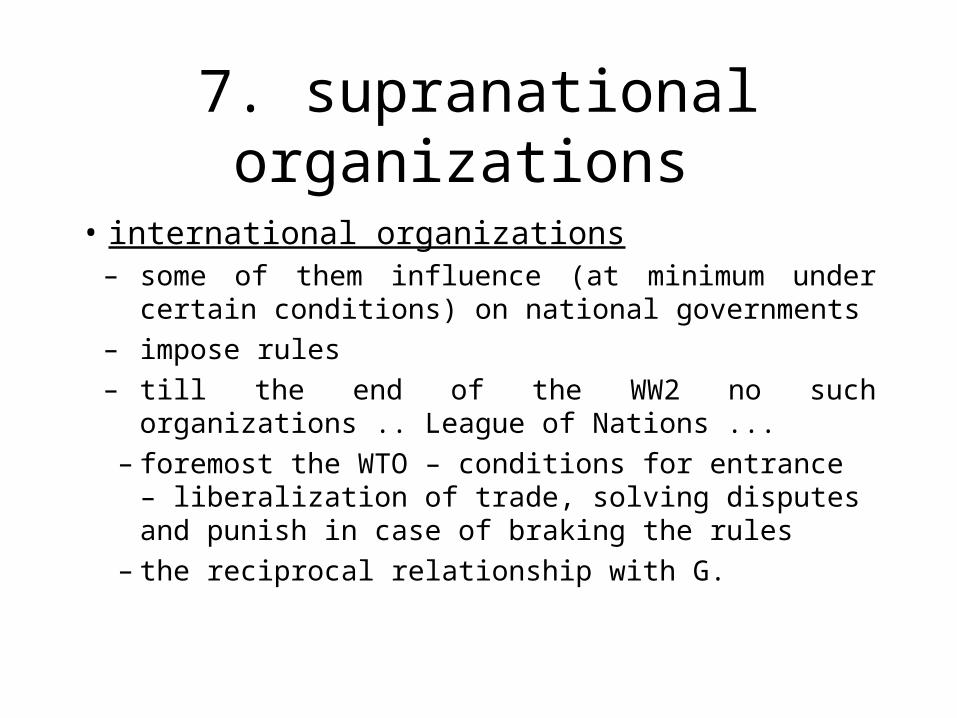
7. supranational organizations
• international organizations– some of them influence (at minimum under certain
conditions) on national governments– impose rules– till the end of the WW2 no such organizations .. League
of Nations ...– foremost the WTO – conditions for entrance –
liberalization of trade, solving disputes and punish in case of braking the rules
– the reciprocal relationship with G.
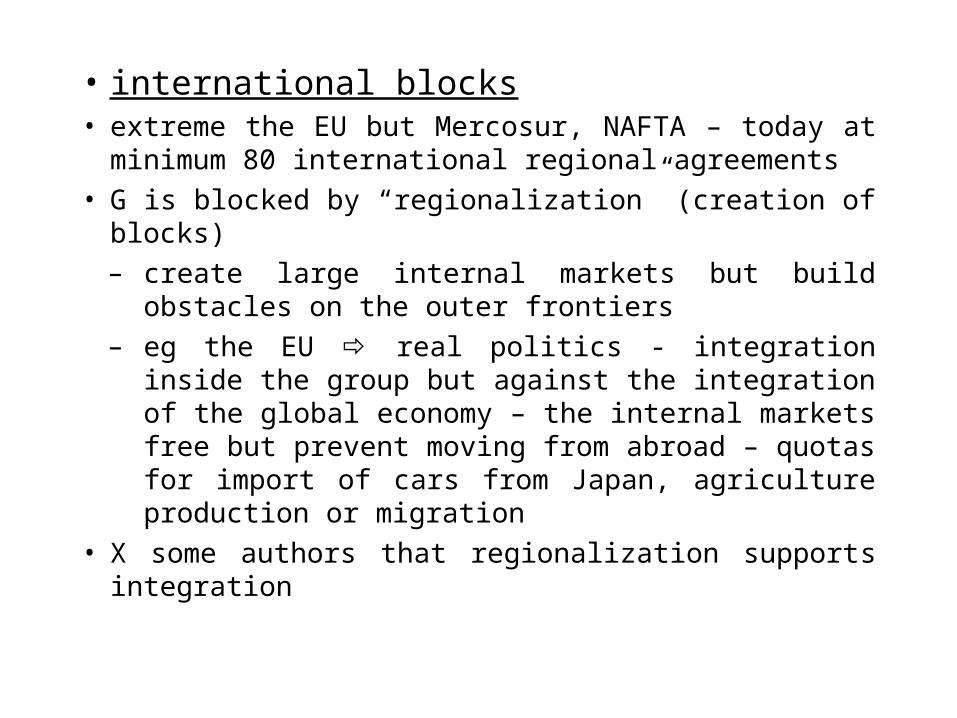
• international blocks• extreme the EU but Mercosur, NAFTA – today at
minimum 80 international regional agreements
• G is blocked by “regionalization” (creation of blocks)
– create large internal markets but build obstacles on the outer frontiers
– eg the EU real politics - integration inside the group but against the integration of the global economy – the internal markets free but prevent moving from abroad – quotas for import of cars from Japan, agriculture production or migration
• X some authors that regionalization supports integration

8. strong pressure groups • plenty of different groups (including supranational
companies)– development after the WW2– most of them against integration (exceptions Cato Institute
or Adam Smith Institute)– the obvious cases demonstrations against globalization
Seattle (1999), Prague (2000) or Stockholm (2001) + agricultural lobby against liberalization in the EU
– their goals are often crossing – support for developing countries X protection of agriculture markets in developed countries

9. changing structure of national economies
in proportion of agriculture and in services (H)
• in the world GDP S= 62%, I=33% and A= 5%
• impact unambiguous the proportion of A peasant very strong
pressure group– X some of the services like traveling
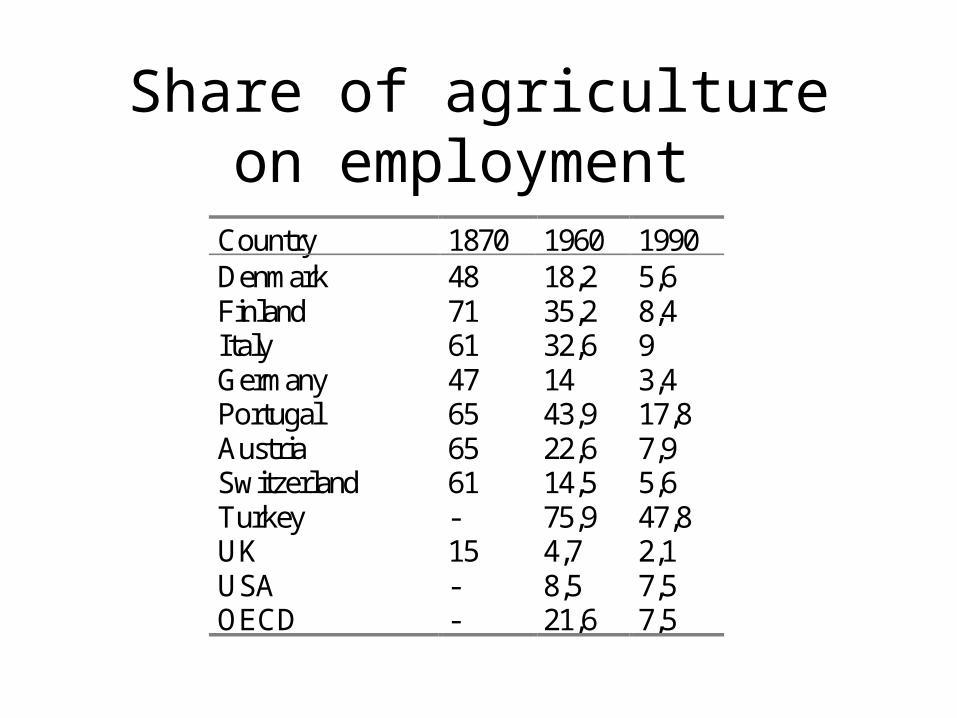
Share of agriculture on employment
Country 1870 1960 1990 Denmark 48 18,2 5,6 Finland 71 35,2 8,4 Italy 61 32,6 9 Germany 47 14 3,4 Portugal 65 43,9 17,8 Austria 65 22,6 7,9 Switzerland 61 14,5 5,6 Turkey - 75,9 47,8 UK 15 4,7 2,1 USA - 8,5 7,5 OECD - 21,6 7,5

Number of overnight stays in Finland by foreigners at
accommodation establishments Country of domicile
1997 1998 1999 2000 2001 2002 *2003 *2003
Sweden 626 451 570 640 581 477 643 000 628 473 613 494 595 039 -3,0 Germany 453 953 458 235 483 507 477 924 489 066 514 796 525 998 2,2 Russia 549 104 540 337 388 556 450 984 520 671 531 556 461 459 -13,2 United Kingdom
248 470 290 572 319 925 364 819 370 643 378 732 408 567 7,9
Norway 164 280 168 803 195 169 201 834 230 710 235 756 214 549 -9,0 Netherlands 122 308 142 637 149 449 150 821 158 808 196 896 209 747 6,5 USA 198 754 201 037 222 854 225 722 220 826 205 559 192 328 -6,4 France 118 523 122 914 140 498 140 906 152 253 164 687 188 243 14,3 Italy 103 971 119 736 140 764 141 115 135 337 139 158 150 793 8,4 Japan 132 385 120 541 129 002 142 226 143 643 136 247 131 002 -3,8 Other 927 655 964 944 1 022 758 1 126 620 1 132 776 1 173 407 1 172 383 -0,1 Total 3 645 854 3 700 396 3 773 959 4 065 971 4 183 206 4 290 288 4 250 108 -0,9 Travel account, € million Income 1 436,0 1 465,3 1 433,7 1 528,5 1 608,9 1 663,7 1 679,0 Expenses 1 818,5 1 853,8 1 909,5 2 009,2 2 070,3 2 118,5 2 129,1 Net -382,5 -388,5 -475,8 -480,7 -461,4 -454,8 -450,1 * preliminary data
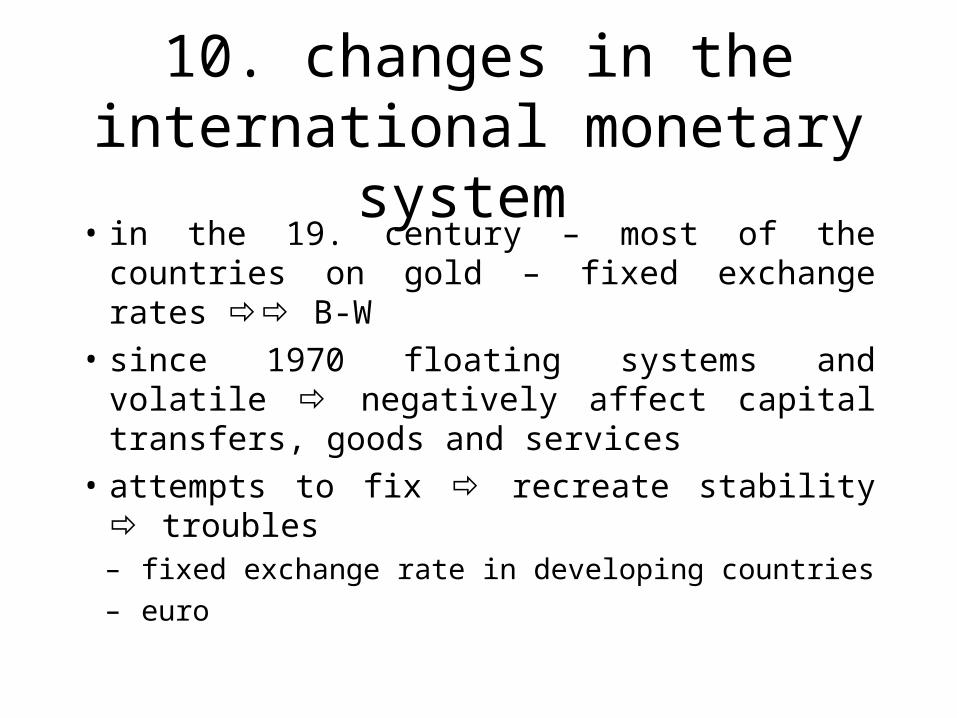
10. changes in the international monetary system
• in the 19. century – most of the countries on gold – fixed exchange rates B-W
• since 1970 floating systems and volatile negatively affect capital transfers, goods and services
• attempts to fix recreate stability troubles– fixed exchange rate in developing countries
– euro

Exchange rate systems in developing countries between 1976 and 1996 The Economist, 20.9.1997
0%
10%
20%
30%
40%
50%
60%
70%
80%
90%
100%
1976 1986 1996
Pevný kurz
Ostatní
Řízený f loating
Floating
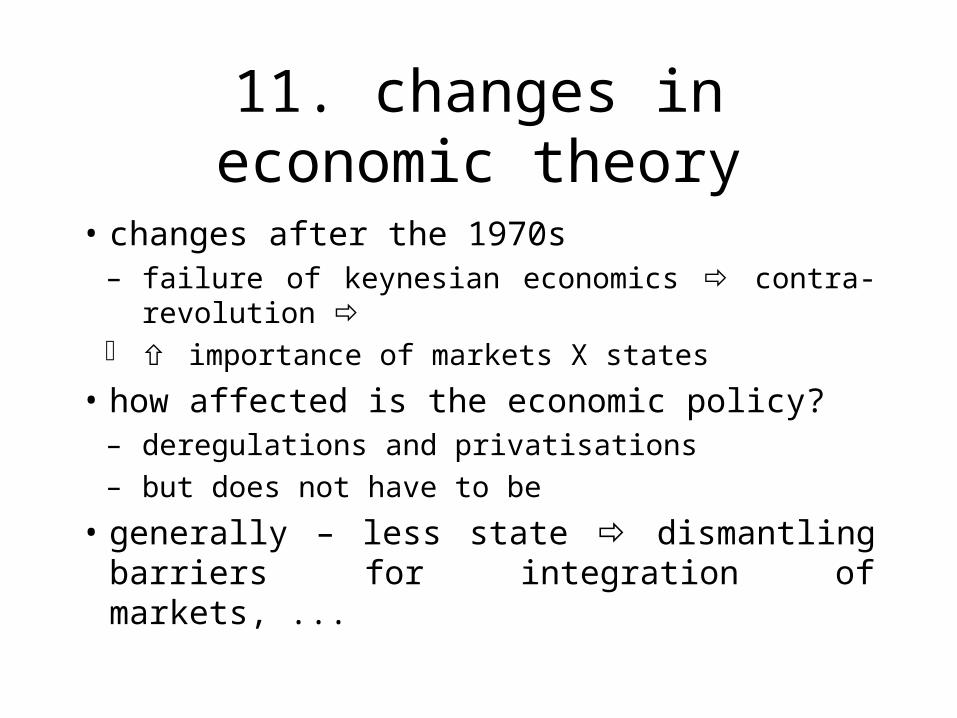
11. changes in economic theory
• changes after the 1970s– failure of keynesian economics contra-revolution
importance of markets X states
• how affected is the economic policy?– deregulations and privatisations
– but does not have to be
• generally – less state dismantling barriers for integration of markets, ...

Table of contents
A. definition of globalization
B. specifics of contemporary
globalization
C. impact of globalization

General impacts on the world economy
• pros– G = of subjects with different connections abroad
of international tension among the countries – in popular form two countries with McDonalds dont fight each other
• growth of interdependence (H)
– G in the form of integration movement of goods, services, capital and labour specialization, competition and division of labour productivity and better using of scarce sources
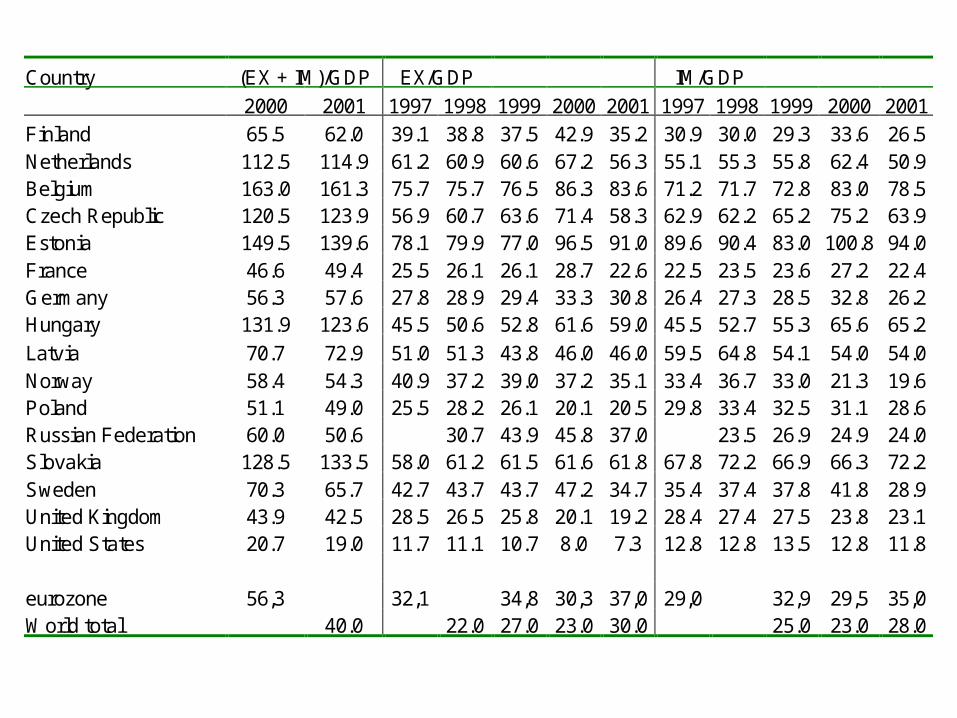
Country (EX + IM)/GDP EX/GDP IM/GDP
2000 2001 1997 1998 1999 2000 2001 1997 1998 1999 2000 2001 Finland 65.5 62.0 39.1 38.8 37.5 42.9 35.2 30.9 30.0 29.3 33.6 26.5 Netherlands 112.5 114.9 61.2 60.9 60.6 67.2 56.3 55.1 55.3 55.8 62.4 50.9 Belgium 163.0 161.3 75.7 75.7 76.5 86.3 83.6 71.2 71.7 72.8 83.0 78.5 Czech Republic 120.5 123.9 56.9 60.7 63.6 71.4 58.3 62.9 62.2 65.2 75.2 63.9 Estonia 149.5 139.6 78.1 79.9 77.0 96.5 91.0 89.6 90.4 83.0 100.8 94.0 France 46.6 49.4 25.5 26.1 26.1 28.7 22.6 22.5 23.5 23.6 27.2 22.4 Germany 56.3 57.6 27.8 28.9 29.4 33.3 30.8 26.4 27.3 28.5 32.8 26.2 Hungary 131.9 123.6 45.5 50.6 52.8 61.6 59.0 45.5 52.7 55.3 65.6 65.2
Latvia 70.7 72.9 51.0 51.3 43.8 46.0 46.0 59.5 64.8 54.1 54.0 54.0 Norway 58.4 54.3 40.9 37.2 39.0 37.2 35.1 33.4 36.7 33.0 21.3 19.6 Poland 51.1 49.0 25.5 28.2 26.1 20.1 20.5 29.8 33.4 32.5 31.1 28.6 Russian Federation 60.0 50.6 30.7 43.9 45.8 37.0 23.5 26.9 24.9 24.0 Slovakia 128.5 133.5 58.0 61.2 61.5 61.6 61.8 67.8 72.2 66.9 66.3 72.2 Sweden 70.3 65.7 42.7 43.7 43.7 47.2 34.7 35.4 37.4 37.8 41.8 28.9 United Kingdom 43.9 42.5 28.5 26.5 25.8 20.1 19.2 28.4 27.4 27.5 23.8 23.1 United States 20.7 19.0 11.7 11.1 10.7 8.0 7.3 12.8 12.8 13.5 12.8 11.8 eurozone 56,3 32,1 34,8 30,3 37,0 29,0 32,9 29,5 35,0 World total 40.0 22.0 27.0 23.0 30.0 25.0 23.0 28.0
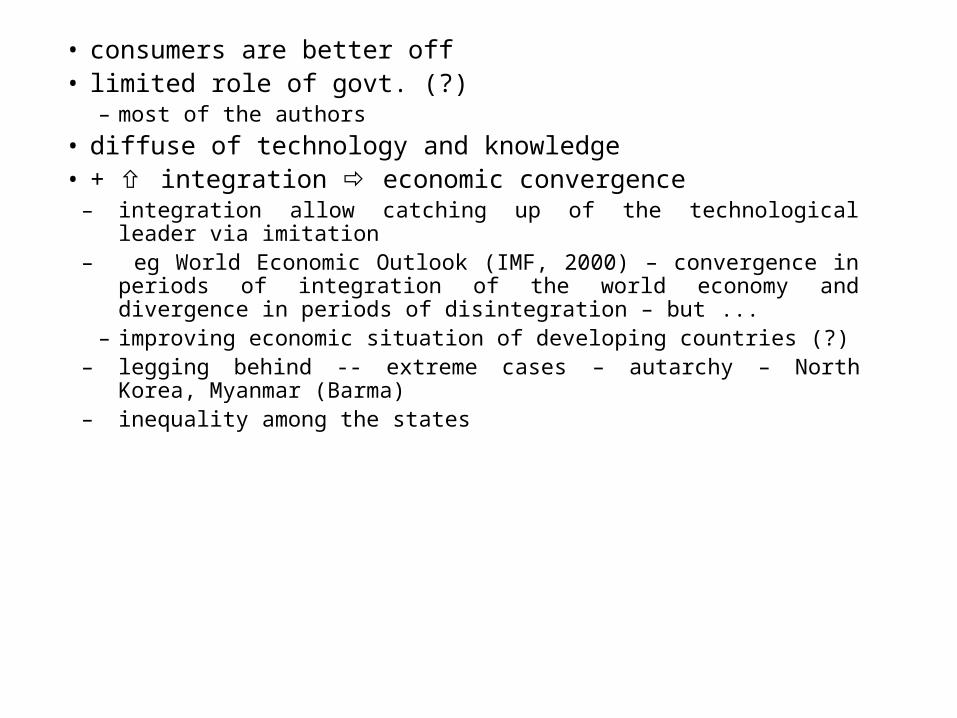
• consumers are better off • limited role of govt. (?)
– most of the authors
• diffuse of technology and knowledge• + integration economic convergence
– integration allow catching up of the technological leader via imitation – eg World Economic Outlook (IMF, 2000) – convergence in periods of
integration of the world economy and divergence in periods of disintegration – but ...
– improving economic situation of developing countries (?)– legging behind -- extreme cases – autarchy – North Korea, Myanmar
(Barma)– inequality among the states

• cons interdependence (H)
• shocks
– loss of national identity (?)

Czech trade 1-12/2000 turnover exports imports balance
mil. Kč % mil. Kč % mil. Kč % mil. Kč Germany 855 486 36.1 452 923 40.4 402 563 32.3 50 360 Slovakia 160 822 6.8 86 081 7.7 74 741 6.0 11 340 Austria 128 352 5.4 66 933 6.0 61 419 4.9 5 514 Italy 106 620 4.5 42 389 3.8 64 231 5.1 -21 842 Poland 105 318 4.4 60 935 5.4 44 383 3.6 16 552 France 106 775 4.5 45 108 4.0 61 667 4.9 -16 559 UK 99 471 4.2 48 055 4.3 51 416 4.1 -3 361 Russia 95 160 4.0 14 920 1.3 80 240 6.4 -65 320 USA 86 510 3.7 31 560 2.8 54 950 4.4 -23 390 Holand 54 840 2.3 25 780 2.3 29 060 2.3 -3 280 Belgium 51 835 2.2 24 435 2.2 27 400 2.2 -2 965 Spain 40 870 1.7 18 098 1.6 22 772 1.8 -4 674 Slovinia 16 118 0.7 9 109 0.8 7 009 0.6 2 100 Norway 15 993 0.7 4 431 0.4 11 562 0.9 -7 131

• limited role of govt. (?)– some authors “limits abilities of governments to
improve functioning of markets and reduce the negative aspects of the process” (Cerny, 1996)
generally the view depends on the personal perception of the state ... trust or distrust; believe or disbelieve

• Amin a Thrift (1994) globalizace monopolization of the world economy– popular idea but without proof (H)
in my opinion monopolization is not threat X G = international competition

The Economist (11. 9. 1999)

– tough impacts on some groups of people competition and specialization shift of production activity
from less effective to more effective and better allocation of sources
– impact especially on unskilled LF in developed countries
• Lingle: – Most of the losers will be workers or owners of
previously protected industries whose privileges cost consumers in the form of higher prices and robbed jobs from newcomers to the labor market. It is only just that the few who imposed so many costs on so many should be the ones to bear the greatest burden.
– can be of inequality inside the states

Procentní změny v zaměstnanosti v USA v důsledku zahraničního
obchodu mezi lety 1970-80 Průmysl Procentní změna Obuvní průmysl -15,9 Motorová vozidla -11,1 Elektrické součástky a příslušenství -7,8 Kožené produkty -6,3 Oděvy -6,3 Rádia a televize -5,7 Různé další výrobky -5 Nábytek -4,5 Vybavení pro služby 5,7 Různé elektrické stroje 6,6 Elektrické a průmyslové vybavení 7,1 Různé stroje 8 Letadla a jejich části 12,8 Úřednické, počítačové a účetní stroje 16,1 Motory a turbíny 17,8 Stavební a důlní stroje 19,9

should we fear?
• NO
• natural process
• releasing creative powers – let markets work
• enable developing countries develop