globalization, international trade, and outsourcing: understanding economic growth and polarization...
TRANSCRIPT

Globalization, International Trade, Globalization, International Trade, and Outsourcing: Understanding and Outsourcing: Understanding
Economic Growth and Polarization in Economic Growth and Polarization in AmericaAmerica
25th Anniversary Montana Arbitration and Labor 25th Anniversary Montana Arbitration and Labor Relations ConferenceRelations Conference
Barry BluestoneBarry Bluestone
Northeastern UniversityNortheastern University
Bozeman, MTBozeman, MT
September 23, 2004September 23, 2004

0.0%
1.0%
2.0%
3.0%
4.0%
5.0%
6.0%A
vera
ge A
nnual G
row
th
1800-18401840-1870
1870-18901890-1913
1913-19291929-1939
1939-19491949-1959
1959-19691969-1979
1979-19891989-1995
4.2%
5.1%
4.5%
4.1%
2.9%
0.1%
4.5%
3.9%
4.4%
3.2%3.0%
2.3%
Long-Term Real GDP Growth in theUnited States 1800-1995
Sources: David (1800-1840); Gallman (1840-1870); Maddison (1870-1929); CEA 1987 (1929-59); CEA 1997 (1959-1989); "EconomicIndicators" (1989-2000)
DEPRESSION
WW II
Glory Days

The Post-War Glory Days1947-1973
Rapid Rapid GDP GrowthGDP Growth in the U.S.: in the U.S.: 1950s: 1950s: 3.9%3.9% 1960s: 1960s: 4.4%4.4% 1970s: 1970s: 3.2%3.2%
Real Real Family IncomeFamily Income doubles doubles (+104%)(+104%) Declining UnemploymentDeclining Unemployment
Unemployment Rate declines to Unemployment Rate declines to 3.8%3.8% -- --
1966-19691966-1969 Rising Incomes for Rising Incomes for Most FamiliesMost Families
$6.50
$7.00
$7.50
$8.00
$8.50
$9.00
59 64 69 74 79 84 89 94 99 4
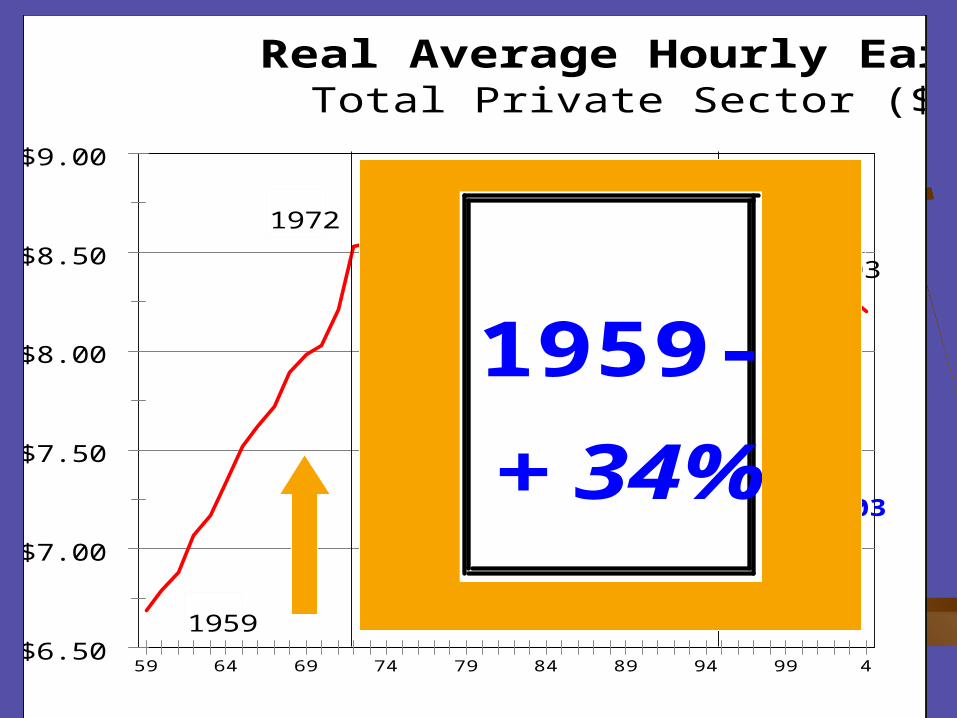
Real Average Hourly EarningsTotal Private Sector ($1982)
1972
1982
1993
2003
1959
1972-93 - 16%
1993-03
+ 10%
1959-72
+ 34%

0%
1%
2%
3%
4%
Annual P
erc
ent C
hange
Lowest 20%Lower Middle
MiddleUpper Middle
Top 20%
3.0%
2.6% 2.7% 2.7%2.4%
How U.S. Family Income Grew1947-1973

Why the U.S. Grew So Fast
1947-1973

Y= C+I+G+X-M Consumer BoomConsumer Boom
Pent up Savings & Pent up DemandPent up Savings & Pent up Demand Union collective bargaining gainsUnion collective bargaining gains
Investment BoomInvestment Boom Conversion to Civilian ProductionConversion to Civilian Production
Government Spending BoomGovernment Spending Boom State & Local Spending on Urban Renewal, State & Local Spending on Urban Renewal,
New Suburbs, New RegionsNew Suburbs, New Regions Cold WarCold War
Export BoomExport Boom - Marshall Plan - Marshall Plan Import ImplosionImport Implosion - Legacy of WWII - Legacy of WWII

Wage & Security-Led Growth
Rise of Collective Bargaining 36% of American Workforce Unionized36% of American Workforce Unionized Another 1/3 or so benefit from Another 1/3 or so benefit from
“sympathetic” pressure“sympathetic” pressure Traditional Workplace Contract
AIF/COLA Wage FormulaAIF/COLA Wage Formula ““Fringe” BenefitsFringe” Benefits Seniority SystemSeniority System Grievance SystemGrievance System Work Rules/Job ClassificationsWork Rules/Job Classifications Union Security ClauseUnion Security Clause Management Rights ClauseManagement Rights Clause

Consumption
PublicSector
DemandStimulus
Pent-upDemand
Pent-upSavings
Investment
ProductivityGrowth
OutputGrowth
Wage &BenefitGrowth
VirtuousCycle
UnionCollective
BargainingGains
TechnologicalInnovation
The Post World War IIVirtuous Cycle
Growth inLabor Supply
FederalR&D
Spending

The End of Affluence …..
An Age of Diminished
Expectations
0%
1%
2%
3%
4%
5%
Ave
rag
e A
nn
ua
l G
row
th R
ate
1959-1969 1969-1979 1979-1989 1989-1995
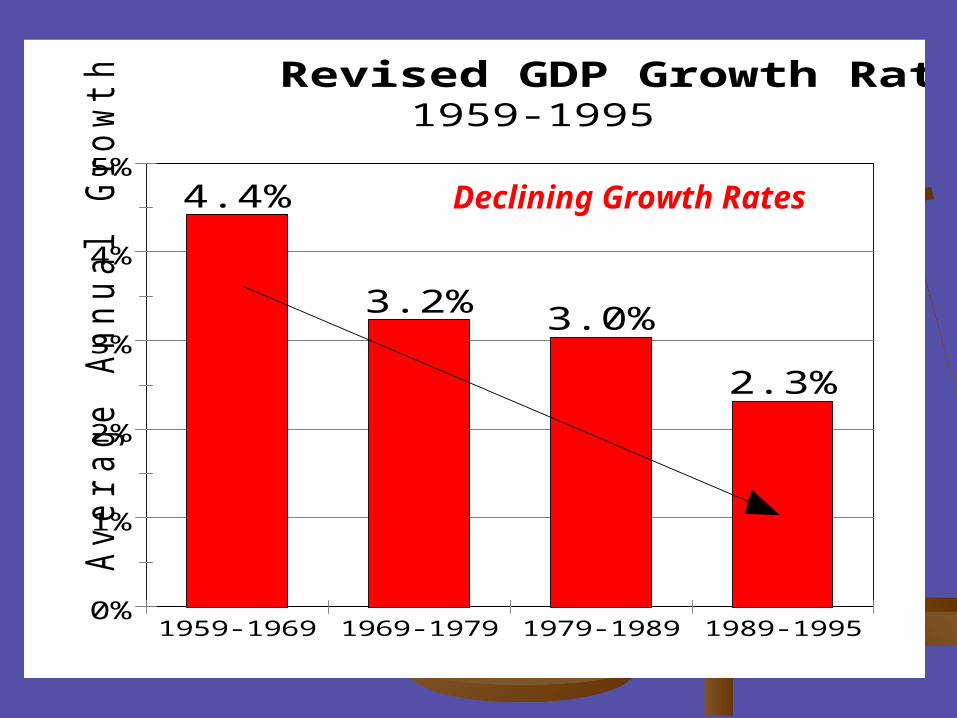
4.4%
3.2% 3.0%
2.3%
Revised GDP Growth Rates1959-1995
Declining Growth Rates

3.0%
4.0%
5.0%
6.0%
7.0%
8.0%
Annual U
nem
plo
ym
ent R
ate
1960s 1970's 1980's
5.3%
6.2%
7.3%
Average Unemployment RateUnited States 1960-1989
Source: Bureau of Labor Statistics, Handbook of U.S. Labor Statistics
Rising Unemployment

$6.50
$7.00
$7.50
$8.00
$8.50
$9.00
59 64 69 74 79 84 89 94 99 4
Real Average Hourly EarningsTotal Private Sector ($1982)
1972
1982
1993
2003
1959
1993-03
1972-93 - 16%

-1%
0%
1%
2%
Annual P
erc
ent C
hange
Lowest 20%Lower Middle
MiddleUpper Middle
Top 20%
-0.6%
-0.2%
0.2%
0.5%
1.3%
How Family Income Grew1973-1995
Source: U.S. Department of Labor
Increasing Income Inequality

So Why Did the U.S. Growth Engine Sputter in the 1970s?
Oil CrisisOil Crisis in the 1970s in the 1970s Business forced to focus on Business forced to focus on energy energy
efficiencyefficiency, not new products or new , not new products or new technologiestechnologies
Corporate Myopia Corporate Myopia andand Arrogance Arrogance in face of in face of new competitionnew competition
Little emphasis onLittle emphasis on productivity, quality, and productivity, quality, and innovationinnovation
Global Competitors Global Competitors stepped instepped in Imports Imports clobbered the economyclobbered the economy

0.0%
0.5%
1.0%
1.5%
2.0%
2.5%
3.0%
3.5%
Ave
rag
e A
nn
ua
l G
row
th
1949-1959 1959-1969 1969-1973 1973-1979 1979-1989 1989-1995
3.4%
3.1% 3.1%
1.3%1.2% 1.1%
Labor Productivity Growth1949-1995
1949-1973 1973-1995
Plummeting Productivity

TrumanEisenhower KennedyJohnson Nixon FordCarter
2%
4%
6%
8%
10%
12%
14%
16%
Perc
ent
4748
4950
5152
5354
5556
5758
5960
6162
6364
6566
6768
6970
7172
7374
7576
7778
7980
8182
8384
8586
8788
8990
9192
9394
9596
9798
9900
0102
0304
Imports as % of GDP
Reagan BushClinton
1929 Import/GDP Ratio
Bush W.

TrumanEisenhower KennedyJohnson Nixon FordCarter
-500
-400
-300
-200
-100
0
100
$ b
illions
4749515355575961636567697173757779818385878991939597990103YEAR
U.S. Trade BalanceExports - Imports (Goods)
Reagan BushClintonBush W.

So Why Did Inequality Explode?
Skilled-Biased Technological Change Rise of Service-based Economy Industry Deregulation Declining Unionization Lean Production & Destruction of Job Ladders “Winner-Take-All” Labor Markets Growing International Trade Outsourcing & Capital Mobility Immigration Trade Deficits

Surprise, Surprise!
Prosperity Regained …1995-2000

0%
1%
2%
3%
4%
5%
Ave
rag
e A
nn
ua
l G
row
th R
ate
1959-19691969-19791979-19891989-19951995-1999
4.4%
3.2% 3.0%
2.3%
4.5%
Revised GDP Growth Rates1959-1999:III

2.0%
3.0%
4.0%
5.0%
6.0%
7.0%
8.0%
Annual U
nem
plo
ym
ent R
ate
1960s 1970's 1980's 1990-95 1996-98
5.3%
6.2%
7.3%
6.4%
4.9%
Average Unemployment RateUnited States 1960-1998(II)
Source: Bureau of Labor Statistics, Handbook of U.S. Labor Statistics

$6.50
$7.00
$7.50
$8.00
$8.50
$9.00
59 64 69 74 79 84 89 94 99 4
Real Average Hourly EarningsTotal Private Sector ($1982)
1972
1982
1993
2003
1959
1959-72
1972-93 - 16%
1993-03
+ 10%

So Why did the U.S. Grow Again?
The New Conventional The New Conventional Wisdom:Wisdom:
The Wall Street ModelThe Wall Street Model

Wall Street ModelWall Street Model Weak Trade UnionsWeak Trade Unions kept wages and prices down kept wages and prices down Welfare ReformWelfare Reform increased labor supply, keeping increased labor supply, keeping
wages and prices lowwages and prices low Tight monetary policyTight monetary policy kept inflation under control kept inflation under control
and interest rates lowand interest rates low Deficit Reduction/Surplus GenerationDeficit Reduction/Surplus Generation raised raised
aggregate savings rate, lowering interest ratesaggregate savings rate, lowering interest rates Free TradeFree Trade depressed wages, forced prices down, depressed wages, forced prices down,
and kept inflation under controland kept inflation under control >>>>>>>>>>>>
All leading to a stock market boom All leading to a stock market boom and new investmentand new investment

RisingStockPrices
SubduedInflation
IncreasedWealth
IncreasedSpending
OutputGrowth
IncreasedCorporate
Profit
VirtuousCycle
TechnologicalInnovation
Wall StreetVirtuous Cycle
IncreasedCapital
Investment
ImprovedProductivity
SubduedInflation
FallingInterestRates
FallingInterestRates
IncreasedSavings
IncreasedSavings

So Who’s responsible for the new economic boom?
Was it Was it BillBill ClintonClinton … who got the deficit under … who got the deficit under control?control?
Was itWas it Alan Greenspan Alan Greenspan … who got inflation under … who got inflation under control?control?
Was itWas it Ronald Reagan Ronald Reagan … who got government under … who got government under control?control?
Answer:Answer:
None of the above ....
Despite all the ballyhoo, the Wall Street Model does NOT explain the U.S. boom in the late 1990s

It takes a little bit of history to understand
America’s new prosperity...
Long Lags in Long Lags in Technology/Productivity CycleTechnology/Productivity Cycle

0%
1%
1%
2%
2%
3%
3%
4%
Avera
ge A
nnual G
row
th R
ate
1949-19591959-19691969-19731973-19771977-19811981-19891989-19931993-1999
3.4%
3.1% 3.1%
1.5%
0.8%
1.6%1.7%
2.1%
Revised Productivity Growth Statistics1949-1999:III
Productivity Rebound began in the 1980s

1
1.5
2
2.5
3
3.5
4
4.5
Pro
ductivity
1 8 15 22 29 36 43 50 57 64 71 78
Time
"Learning Curves"Introduction of New Technologies
TechnologyRelease 1.0
TechnologyRelease 2.0
TechnologyRelease 3.0
Actual Productivity Trend- - - - - - - - - - -

0
0.1
0.2
0.3
0.4
0.5
0.6
0.7
0.8
0.9
1
1.1
1.2
La
bo
r P
rod
uctivity G
row
th in
%
1660 1680 1700 1720 1740 1760 1780 1800 1820 1840 1860 1880
Productivity Growth during theBritish Industrial Revolution
0.4%
0.2%
0.5%
1.1%
"Initial" Phase
"Diffusion/Learning"Phase
"Mature"Phase
"Pre-Revolution" Phase
Source: Adapted from Jeremy Greenwood, 'The Third Industrial Revolution"
Figure 3.4

0.2
0.4
0.6
0.8
1
1.2
1.4
1.6
La
bo
r P
rod
uctivity G
row
th in %
180018051810181518201825183018351840184518501855186018651870
Productivity Growthduring the U.S. Antebellum Period
0.63%
0.30%
1.40%
"Diffusion/Learning"
Source: Adapted from Jeremy Greenwood, "The Third Industrial Revolution"

New Technologies that spurred New Technologies that spurred Economic GrowthEconomic Growth
Steam EngineSteam Engine …. 19th C. …. 19th C. ElectrificationElectrification …. Early 20th C. …. Early 20th C. Integrated CircuitIntegrated Circuit …. Late 20th C. …. Late 20th C.
Computer HardwareComputer Hardware Computer SoftwareComputer Software InternetInternet e-commercee-commerce
But each takes decades to But each takes decades to impact productivity and growthimpact productivity and growth

Where did the new technology come from for the 1990s
Boom? The Missile RaceThe Missile Race following Sputnik (‘50s/’60s) following Sputnik (‘50s/’60s) The The Space RaceSpace Race with Russia (‘60s/’70s) with Russia (‘60s/’70s) From From Government Spending onGovernment Spending on Defense to the Private Defense to the Private
SectorSector in a Quarter Century in a Quarter Century It was hideously expensive, terribly wasteful, but in a It was hideously expensive, terribly wasteful, but in a
peculiar way it paid off decades laterpeculiar way it paid off decades laterSo who’s most responsible for U.S. Economic Boom?
Nikita Khrushchev

Public Sector + Private SectorWorking Together
Federal GovernmentFederal Government provided Basic provided Basic Research fundsResearch funds
Local, State, and Federal GovernmentLocal, State, and Federal Government educated and trained a labor force to educated and trained a labor force to effectively use the new technologyeffectively use the new technology
Private sectorPrivate sector converted basic research converted basic research to applied developmentto applied development
.... and productivity .... and productivity soaredsoared

Public Investment in the 1960s, 1970s, and early
1980s ... ... Basic ResearchBasic Research Education (after Sputnik)Education (after Sputnik) Public Infrastructure (Interstate Public Infrastructure (Interstate
highways, airports, internet)highways, airports, internet)
............PAID OFF IN THE LATE PAID OFF IN THE LATE 1990s1990s

Since 2000 .....

-200
-100
0
100
200
300
(in thousands)
HooverRoosevelt-Truman
EisenhowerKennedy-Johnson
Nixon-FordCarter
Reagan-BushClinton
Bush W.
-177.3
89.5
33.5
168.1
117.6
210.6196.5
235.4
-93.6
Monthly Net Job Growthfrom Truman to George W. Bush

0
5
10
15
20
25
30
Month
s
1953-541957-581960-611970-711974-751981-821990-91 2001-
Months of Continous LossMonths of Year-over-Year Loss
Duration of Job LossRecession Years 1947-2003
?

-2
0
2
4
6
8
10
Perc
ent C
hange
2001 2002 2003:I 2003:II 2003:III
0.3
2.4
1.4
3.3
7.2
1.9
5.4
2.1
7.0
8.1
-1.3
-0.4-0.1 -0.1
0.1
Real GDP ProductivityEmployment
Growth, Productivity, & Employment2001-2003:III

0%
1%
2%
3%
4%
5%
6%
7%
Early 1980s' RecessionEarly 1990s' Recession
Early 2000s' Recession
6.0%
3.2%
2.0%
4.6%
1.9%2.1%
3.3%
1.9%
2.3%
1.5%
1.0%
1.4%
Less than High School GradHigh School Grads Some College College Grads
Percentage Point Changein Unemployment Rate
“Democratizing” Unemployment

Federal Outlays for Physical Capital, Research and Development, and Education and Training: As a % of GDP
1.5
1.75
2
2.25
2.5
2.7519
62
1964
1966
1968
1970
1972
1974
1976
1978
1980
1982
1984
1986
1988
1990
1992
1994
1996
1998
2000
2002
2004
Year
% o
f G
DP
2.7%
1.75%

Federal Outlays For Research and DevelopmentAs a % of GDP
0.5
0.75
1
1.25
1.5
1.75
2
2.2519
62
1964
1966
1968
1970
1972
1974
1976
1978
1980
1982
1984
1986
1988
1990
1992
1994
1996
1998
2000
2002
2004
Year
% o
f G
DP
2%
1%

Federal Outlays for Non-Defense R&DAs a % of GDP
0.20%
0.40%
0.60%
0.80%
1.00%
1.20%
1962
1965
1968
1971
1974
1977
1980
1983
1986
1989
1992
1995
1998
2001
2004
Year
% o
f G
DP
1%
0.4%

Federal Outlays for Research and Development in National DefenseAs a % of GDP
0.40%
0.60%
0.80%
1.00%
1.20%
1.40%
1962
1965
1968
1971
1974
1977
1980
1983
1986
1989
1992
1995
1998
2001
2004
Year
% o
f G
DP
Reagan “Boomlet”

Federal Outlays For General Science R&DAs a % of GDP
0.00%
0.10%
0.20%
0.30%
0.40%
0.50%
0.60%
0.70%
0.80%
1962
1965
1968
1971
1974
1977
1980
1983
1986
1989
1992
1995
1998
2001
2004
Year
% o
f G
DP
.75%
.10%

Federal Outlays for Energy R&DAs a % of GDP
0.00%
0.02%
0.04%
0.06%
0.08%
0.10%
0.12%
0.14%
1962
1965
1968
1971
1974
1977
1980
1983
1986
1989
1992
1995
1998
2001
2004
Year
% o
f G
DP
Energy Crisis.12%
.015%

Federal Outlays for Transportation R&DAs a % of GDP
0.01%
0.02%
0.03%
0.04%
0.05%
0.06%
1962
1965
1968
1971
1974
1977
1980
1983
1986
1989
1992
1995
1998
2001
2004
Year
% o
f G
DP
.04%
.02%

Federal Outlays for Natural Resources and Environment R&DAs a % of GDP
0.01%
0.02%
0.03%
0.04%
0.05%
0.06%
1962
1965
1968
1971
1974
1977
1980
1983
1986
1989
1992
1995
1998
2001
2004
Year
% o
f G
DP
.02%
.05%

Federal Outlays for Health R&DAs a % of GDP
0.05%
0.10%
0.15%
0.20%
0.25%
1962
1965
1968
1971
1974
1977
1980
1983
1986
1989
1992
1995
1998
2001
2004
Year
% o
f G
DP
.25%
.10%

A Model of Growth for the
21st Century

Regaining and Sustaining Prosperity
Quick stimulus in short runQuick stimulus in short run
Public investment in basic Public investment in basic research, education, research, education, homeland security, and homeland security, and infrastructure in the long runinfrastructure in the long run

Restoring Social Equity
Higher Minimum WageHigher Minimum Wage Labor Law Reform to Foster Labor Law Reform to Foster
UnionizationUnionization Fair TradeFair Trade Invest in Public SchoolsInvest in Public Schools Universal Health Care CoverageUniversal Health Care Coverage Expand Public Goods (e.g. Expand Public Goods (e.g.
Transportation, Day Care, Elder Transportation, Day Care, Elder Care)Care)

Consumption
FederalReserve
Policy
Investment
ProductivityGrowth
OutputGrowth
Wage &BenefitGrowth
VirtuousCycle
UnionCollective
BargainingGains
TechnologicalInnovation
21st CenturyMain Street Model
Virtuous Cycle
Growth inEnhanced Labor
Supply
IncreasedMinimum
Wage
PublicInvestment in
R&D
PublicInvestment inInfrastructure
PublicInvestment inEducation &
Training
