globalization, industrialization and labour markets in china
TRANSCRIPT

This article was downloaded by: [Temple University Libraries]On: 05 December 2014, At: 17:02Publisher: RoutledgeInforma Ltd Registered in England and Wales Registered Number: 1072954 Registeredoffice: Mortimer House, 37-41 Mortimer Street, London W1T 3JH, UK
Journal of the Asia Pacific EconomyPublication details, including instructions for authors andsubscription information:http://www.tandfonline.com/loi/rjap20
Globalization, industrialization andlabour markets in ChinaMiao Zhanga & Rajah Rasiaha
a Department of Development Studies, University of Malaya, KualaLumpur, MalaysiaPublished online: 06 Nov 2014.
To cite this article: Miao Zhang & Rajah Rasiah (2014): Globalization, industrialization and labourmarkets in China, Journal of the Asia Pacific Economy, DOI: 10.1080/13547860.2014.974314
To link to this article: http://dx.doi.org/10.1080/13547860.2014.974314
PLEASE SCROLL DOWN FOR ARTICLE
Taylor & Francis makes every effort to ensure the accuracy of all the information (the“Content”) contained in the publications on our platform. However, Taylor & Francis,our agents, and our licensors make no representations or warranties whatsoever as tothe accuracy, completeness, or suitability for any purpose of the Content. Any opinionsand views expressed in this publication are the opinions and views of the authors,and are not the views of or endorsed by Taylor & Francis. The accuracy of the Contentshould not be relied upon and should be independently verified with primary sourcesof information. Taylor and Francis shall not be liable for any losses, actions, claims,proceedings, demands, costs, expenses, damages, and other liabilities whatsoever orhowsoever caused arising directly or indirectly in connection with, in relation to or arisingout of the use of the Content.
This article may be used for research, teaching, and private study purposes. Anysubstantial or systematic reproduction, redistribution, reselling, loan, sub-licensing,systematic supply, or distribution in any form to anyone is expressly forbidden. Terms &Conditions of access and use can be found at http://www.tandfonline.com/page/terms-and-conditions

Globalization, industrialization and labour markets in China
Miao Zhang* and Rajah Rasiah
Department of Development Studies, University of Malaya, Kuala Lumpur, Malaysia
China’s experience with globalization is still contested. This paper seeks to examinethe impact of global integration and industrialization on labour markets in China. Theevidence shows that rising trade and flows of foreign direct investment has not onlyquickened industrialization and structural change but it has also stimulated a rapid risein overall and manufacturing real wages. The government’s framework of absorbingmarketization while maintaining planning control through decentralization has beencritical in the development of technological capabilities in manufacturing. Althoughthe nature of economic development after reforms has also widened regionalinequalities with the Eastern coastal provinces enjoying higher growth and structuralchange than the Western and other inland provinces, rising wages suggest that thematerial conditions of the majority of workers in China have improved.
Keywords: globalization; industrialization; labour markets; China
JEL Classifications: J21; L60; 014; 018
1. Introduction
When China announced its reform plans in 1978, few could have anticipated the miracu-
lous growth that it will record, especially since 1992. Under the leadership of Mao, China
had built the elements of nationalism for the central government to direct economic
development, which helped a nationally united command economy to stimulate economic
development through the unleashing of market forces, private dwellers and rapid integra-
tion into the global economy. Trade and investment flows brought China closer to the
global economy. From specialization in light manufactured exports, China has undergone
considerable structural change to participate in heavy and knowledge-intensive manufac-
tured goods (Rasiah, Miao, and Xin, 2013). However, some economists have questioned
China’s rapid growth by either claiming that official statistics are not reliable or that it
has largely been propelled by agriculture, land use and labour-intensive industries (Young
2003).1 Even more so China’s labour markets remain under-examined from the stand-
point of whether rapid growth has been reflected in improvements to wages and working
conditions. The latter is important to determine if China is following the high road to
industrialization.
The historical precursor of industrialization in China can be traced to the Song
Dynasty (960�1279) when steel was invented and produced and used extensively by the
public. A series of pre-modern technological innovation and evolution of intellectual
thought during the Song Dynasty made China one of the most prosperous and advanced
economies in the medieval world.2 However, the weak succeeding regimes that followed
did not carry this forward. In fact, large parts of China were colonized by the Western
countries and Japan. After the establishment of People’s Republic of China (PRC), a real
*Corresponding author. Email: [email protected]
� 2014 Taylor & Francis
Journal of the Asia Pacific Economy, 2014
http://dx.doi.org/10.1080/13547860.2014.974314
Dow
nloa
ded
by [
Tem
ple
Uni
vers
ity L
ibra
ries
] at
17:
02 0
5 D
ecem
ber
2014

sense of industrialization did not happen until 1958 when the controversial campaign The
Great Leap Forward was advanced by Mao Zedong. His aim to transform the newly born
PRC from an agrarian economy to a modern communist society through state-led indus-
trialization eventually failed. GDP per capita fell from 200 yuan in 1958 to 173 yuan in
1960. Thanks to reforms, industrialization resumed rapidly under the Deng Xiaoping
Administration.
An assessment of globalization, industrialization and labour markets in China is
important not only because of its rising importance as a major economic power but also
because of its transformation from an agricultural economy to an industrial economy.
The analysis will not only offer an opportunity to examine the contrasting passion
scholars have on China. On the one hand, some accept the reality over the surge in
industrialization and Chinese exports as an example of a successful development model
in which the state has allowed market forces to operate within those social boundaries
(e.g. Rasiah, Miao, and Xin, 2013). On the other hand, critics claim that Chinese data is
fudged, and that the rapid growth is unsustainable owing to growing fuel deficits and
environment disasters.
Hence, this paper seeks to examine the impact of globalization and industrialization
on China’s labour market since reforms began. Specifically, the paper seeks to capture
the impact of industrial structural change on the domestic labour market. Unlike
neoliberal expositions of globalization, we will provide evidence to show that the
complex nature of government policy in China was structured to allow both the
provincialization, as well as, the localization of planning (Zhang and Rasiah 2014). Also,
industrialization was promoted by the government taking account of the specific
characteristics of the industries, the targets set for them, and provincial and municipal
endowments. The rest of the paper is organized as follows. Sections 2 and 3 examine
globalization and industrialization in China with a focus on structural change. Section 4
analyses the demand�supply model of labour market and discusses the impact of globali-
zation and industrialization on it. Section 5 concludes with policy implications.
2. Trade and investment flows
While the globalization concept has a wide meaning that includes qualitative exchange of
information and the forces shaping the process, for measurement purposes we confine the
assessment to quantitative flows of trade and investment. Hence, we discuss trade and
inward and outward foreign direct investment flows in this section. Although integration
into the global capitalist economy expanded since the launching of the Opening Door
Policy in 1978, global flows of trade and investment into China was marked by two major
waves, the first taking place in the mid-1980s followed by the early 1990s and
subsequently since 2001.
2.1. Trade
Between 1978 and 2000, the Chinese economy grew gently but began to switch gears to
rapidly expand since 2001 following its membership of the World Trade Organization.
Except for a decline in 2009 due to the global financial crisis, exports, imports and total
trade of goods grew from US$266.1 billion, US$243.5 billion and US$509.6 billion,
respectively in 2001 to US$1898.4 billion, US$1743.5 billion and US$3641.9 billion,
respectively in 2011 (Figure 1), which expanded the share of trade in GDP from 5% in
1979 to its peak of 70% in 2007 before falling to 59% in 2011 (Figure 2).
2 M. Zhang and R. Rasiah
Dow
nloa
ded
by [
Tem
ple
Uni
vers
ity L
ibra
ries
] at
17:
02 0
5 D
ecem
ber
2014

China’s share in world exports rose from 1.2% in 1983 to 11.4% in 2012 (Table 1).
Figure 3 shows that growth in exports from China exceeded growth in world exports in
the period 2001�2007. Although always less than exports the share of import in world
merchandise also recorded significant expansion from 1.1% in 1983 to 10% in 2012.
China ranked first in world exports of merchandise and second in trade (exports plus
imports) totaling US$3867 billion in 2012 (Figure 4). The trade surplus of China reached
US$230 billion in 2012 amounting to 2.8% of GDP.
Trade has played an important role in stimulating economic growth in China, but the
biggest beneficiaries have been the sea-fronted Eastern provinces. Proximity to the sea
has resulted in the proliferation of special economic zones (SEZs) in the coastal cities,
Figure 1. Import and export of goods and services, China, 1979�2012 (US$ billion).Source: Ministry of Commerce of China, various years.
Figure 2. Share of import and export in total GDP (Goods and Services), China, 1970�2011.Source: World Bank Institute (2012).
Journal of the Asia Pacific Economy 3
Dow
nloa
ded
by [
Tem
ple
Uni
vers
ity L
ibra
ries
] at
17:
02 0
5 D
ecem
ber
2014

such as Guangdong, which accounted for approximately one-third of China’s trade,
though it fell from 36% in 2000 to 26% in 2010 (Figure 5). Efforts by the central govern-
ment to reduce provincial inequality saw the rise of inland provinces so that Jiangsu and
Beijing recorded sizeable amount of trade in 2010. However, regional inequality has per-
sisted as the outlying provinces of Tibet, Xinjiang and Guizhou have remained poor.
2.2. Foreign direct investment
Aided by market reforms and accession to the WTO, China has become a major recipient of
FDI in the world. China has also begun investing abroad, especially in the South countries.
We examine China’s integration in the global economy through FDI flows in this section.
2.2.1. Inward foreign direct investment
China has also strongly integrated in the global economy through inward foreign direct
investment (FDI), which rose from US$20.7 billion in 2000 to US$193.3 billion in 2005
Table 1. Share of exports and imports in World Merchandise Trade, China, 1948�2012 (%).
1948 1953 1963 1973 1983 1993 2003 2012
Export 0.9 1.2 1.3 1.0 1.2 2.5 5.9 11.4
Import 0.6 1.6 0.9 0.9 1.1 2.7 5.4 10.0
Source: World Trade Organization (2012).
Figure 3. China’s share in world exports, 1980�2011.Source: China Foreign Economic Statistical Yearbook (2012).
4 M. Zhang and R. Rasiah
Dow
nloa
ded
by [
Tem
ple
Uni
vers
ity L
ibra
ries
] at
17:
02 0
5 D
ecem
ber
2014

and US$578.8 billion in 2010 (UNCTAD 2011, 193). Inward FDI as a share of GDP rose
from 1% in 1991 to over 6% in 1993 before falling as a consequence of the Asian Finan-
cial Crisis. The jump in FDI in 1993 was a direct result of Deng Xiaoping’s South Tour
in the summer of 1992, which was accompanied by the opening of four SEZs in the coun-
try. The campaign to realize China’s industrialization through joint ventures was
launched to ‘attract foreign technology in the industrial sector by leveraging on the
domestic market.’ FDI has not only helped modernize China’s backward industrial sector
by introducing cutting-edge technology, it has also quickened the shift in manufacturing
operations from labour-intensive to technology-intensive operations. Except for the finan-
cial-crisis affected year of 2009, inward FDI registered over 3% of GDP over the period
2005�2013 (Figure 6).
The sectoral distribution shows that export-oriented labour-intensive manufacturing
sector is the main destination of FDI, though its share fell from 71% in 2000 to 47% in
2010 (Table 2). However, despite falling shares, actual FDI into manufacturing experi-
enced grew slightly from US$44 billion in 2000 to US$49 billion in 2010. However,
except for equipment manufacturing � which enjoyed FDI shares rising from 4.3% in
2000 to 6.1% in 2010, the remaining sectors experienced falling FDI shares. Neverthe-
less, the growing real estate sector led by a price boom in 2003, began to attract strong
inflows of FDI so that its share in overall FDI rose from 8.4% in 2000 to 22.7%.
Any assessment of the impact of globalization on China will not be complete without
an account of FDI and its impact on International trade. Enjoying access to duty free
imports when exporting, foreign firms share in exports rose from 0.2% in 1981 to its peak
of 58.3% in 2005 before falling to 49.9% in 2012 (Table 3). Foreign firms’ share in
imports rose from 0.5% in 1981 to its peak of 59.7% in 2006 before falling to 47.9% in
2012. The export:import ratio improved in trend terms from 19.2 in 1981 to its peak of
124.3 in 2007. It has exceeded 100 over the period 1997�2012 demonstrating a positive
trade balance over that period.
Figure 4. Top five exporters and importers by trade value in the world, 2012 (US$ billion).Source: World Trade Organization (2012).
Journal of the Asia Pacific Economy 5
Dow
nloa
ded
by [
Tem
ple
Uni
vers
ity L
ibra
ries
] at
17:
02 0
5 D
ecem
ber
2014

Figure 5. Provincial trade, China, 2000�2010 (%).Source: China Statistical Bureau (various years).
6 M. Zhang and R. Rasiah
Dow
nloa
ded
by [
Tem
ple
Uni
vers
ity L
ibra
ries
] at
17:
02 0
5 D
ecem
ber
2014

2.2.2. Outward FDI
Chinese FDI outflows have also become important especially after new century. Between
2005 and 2010, Europe, the United States and Australia attracted US$43.2 billion,
US$30.4 billion and US$38.4 billion FDI, respectively from China (Figure 7). Region-
ally, China’s outward FDI has also flowed considerably to South America (US$72.3
billion), Sub-Saharan Africa (US$56.4 billion), West Asia (US$51.7 billion), the Arab
countries (US$43.7 billion) and East Asia (US$42.6 billion).
Sectorally, energy and power, especially in Sub-Saharan Africa, West Asia and the
Arab countries, have been the leading destination of China’s outward FDI, which
Figure 6. Share of foreign direct investment in GDP, Net Inflows and Outflows, China,1982�2013.Source: World Development Indicators (2012).
Table 2. FDI in manufacturing and real estate, China, 2000�2010.
Year 2010 2008 2005 2000
Item Valuea % Value % Value % Valueb %
Total 10,573,524 9,239,544 6,032,469 6,237,952
Manufacturing 4,959,058 46.9 4,989,483 54.0 4,245,291 70.37 4,425,430 70.94
Textile and clothing 160,250 1.52 182,336 1.97 210,404 3.49 198,833 3.19
Chemistry raw materialand chemical product
343,655 3.25 412,326 4.46 280,884 4.66 259,444 4.16
Medicine 102,847 0.97 65,753 0.71 55,549 0.92 91,153 1.46
General purposeequipment
345,762 3.27 350,809 3.80 203,213 3.37 163,003 2.61
Special purposeequipment
312,874 2.96 281,638 3.05 194,123 3.22 106,585 1.71
Computer and electronic 843,210 7.97 845,143 9.15 771,117 12.78 1,135,615 18.20
Real Estate 2,398,556 22.68 1,858,995 20.12 541,807 8.98 523,213 8.39
Note: aValue in 2005, 2008 and 2010 is actual use of FDI by US$10,000;bValue in 2000 is contractual value by US$10,000.Source: China Trade and External Economic Statistical Yearbook (various years).
Journal of the Asia Pacific Economy 7
Dow
nloa
ded
by [
Tem
ple
Uni
vers
ity L
ibra
ries
] at
17:
02 0
5 D
ecem
ber
2014

Table 3. Share of foreign-funded firms in imports and exports, China, 1981�2012.
Imports and exports Exports Imports
Year Valuea % in total Value % in total Value % in total Export/import (%)
1981 1.43 0.33 0.33 0.15 1.1 0.5 19.20
1986 30.12 4.08 5.82 1.88 24.3 5.66 38.69
1991 289.55 21.33 120.47 16.75 169.08 26.5 65.82
1996 1371.1 47.3 615.06 40.71 756.04 54.46 96.37
2001 2590.98 50.82 1332.35 50.05 1258.63 51.66 105.86
2006 10,364.51 58.87 5638.35 58.18 4726.16 59.7 119.30
2007 12,549.28 57.73 6955.2 57.1 5594.08 58.53 124.33
2008 14,105.76 55.07 7906.2 55.34 6199.56 54.71 127.53
2009 12,174.37 55.16 6722.3 55.94 5452.07 54.22 123.30
2010 16,003.07 53.83 8623.06 54.65 7380.01 52.91 116.84
2011 18,601.56 51.07 9953.3 52.42 8648.26 49.6 115.09
2012 18,939.97 48.98 10,227.48 49.92 8712.49 47.93 117.39
Note: aIn US$100 million.Source: Ministry of Commerce (various years).
Figure 7. Outward FDI, China, 2011.Source: China Global Investment Tracker (2011).
8 M. Zhang and R. Rasiah
Dow
nloa
ded
by [
Tem
ple
Uni
vers
ity L
ibra
ries
] at
17:
02 0
5 D
ecem
ber
2014
accounted for US$61.8 billion in 2011. In addition, large engineering and construction
contracts, such as railway, roads, bridges and stadiums have also been important. The
finance and real estate sectors attracted US$16.5 billion while agriculture received
US$6.4 billion in 2011. Hence, despite the well-known fact that China’s outward foreign
capital has mostly been confined to portfolio investments in American government bonds,
its non-bonds investment flows show strong sectoral and geographic diversification as a
consequence of its increasing integration into the world economy.
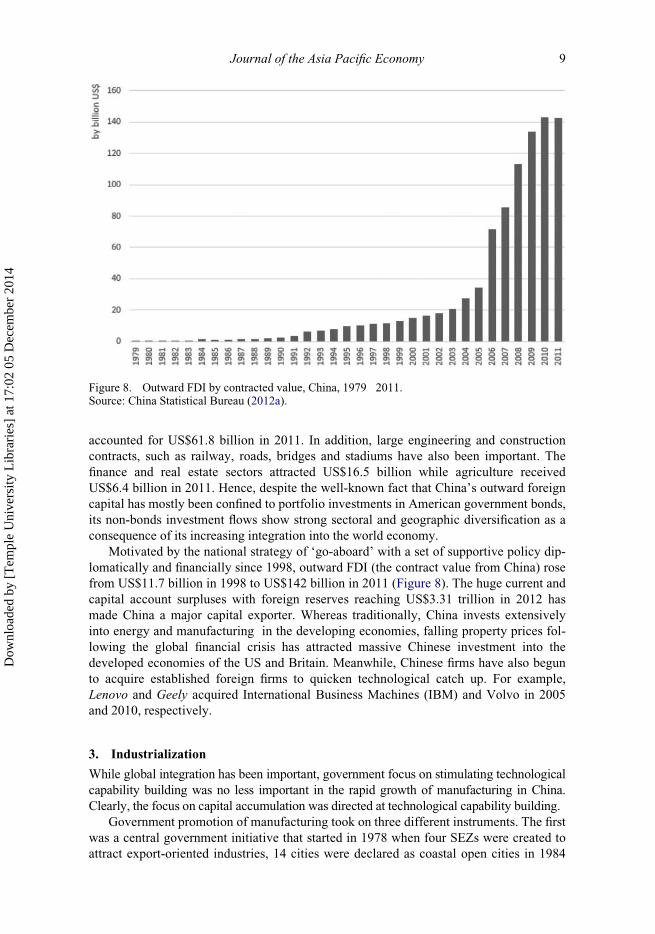
Motivated by the national strategy of ‘go-aboard’ with a set of supportive policy dip-
lomatically and financially since 1998, outward FDI (the contract value from China) rose
from US$11.7 billion in 1998 to US$142 billion in 2011 (Figure 8). The huge current and
capital account surpluses with foreign reserves reaching US$3.31 trillion in 2012 has
made China a major capital exporter. Whereas traditionally, China invests extensively
into energy and manufacturing in the developing economies, falling property prices fol-
lowing the global financial crisis has attracted massive Chinese investment into the
developed economies of the US and Britain. Meanwhile, Chinese firms have also begun
to acquire established foreign firms to quicken technological catch up. For example,
Lenovo and Geely acquired International Business Machines (IBM) and Volvo in 2005
and 2010, respectively.
3. Industrialization
While global integration has been important, government focus on stimulating technological
capability building was no less important in the rapid growth of manufacturing in China.
Clearly, the focus on capital accumulation was directed at technological capability building.
Government promotion of manufacturing took on three different instruments. The first
was a central government initiative that started in 1978 when four SEZs were created to
attract export-oriented industries, 14 cities were declared as coastal open cities in 1984
Figure 8. Outward FDI by contracted value, China, 1979�2011.Source: China Statistical Bureau (2012a).
Journal of the Asia Pacific Economy 9
Dow
nloa
ded
by [
Tem
ple
Uni
vers
ity L
ibra
ries
] at
17:
02 0
5 D
ecem
ber
2014
and regional development plans involving the three Delta schemes of Yangze River, Min
Jiang and Pearl River Valleys. Where the industries promoted were identified as
strategic, import controls (duties, quotas and licenses were used by the central govern-
ment to promote high technology industries, such as automobiles and electronics).
Government policies emphasized technology transfer to national firms when the domestic
market was important. This was the basis on which Volkswagen was approved to produce
and supply cars in the Chinese market.3 These controls were not used where production
was largely for foreign markets. The Chinese government also offered special incentives
by way of grants and tax breaks to promote high technology industries and technological
upgrading.
At the same time, local governments were given the autonomy to implement central
government initiatives (e.g. subsidized land lease rights and utilities, customs coordina-
tion), as well as, more importantly strategize to promote technological capability building
in industries where the focus is on technological upgrading. Examples of successful local
initiatives include efforts by the Shanghai government in the late 1980s to mandate that
the Santana, a car produced by the Shanghai Volkswagen joint venture, be the only legiti-
mate taxi to run in the city. Similarly, the Yongjia county and the Qiaotou municipality in
Zhejiang province played a critical role in establishing cluster links between the firms
and the designing and R&D centres with support from universities to stimulate
technological upgrading in the button industry (Rasiah, Kong, and Vinanchiarachi 2011).
Provincial governments also invested heavily into high-tech parks to stimulate
technological upgrading in the high technology industries.
Led by government initiatives, FDI and international trade, the manufacturing sector in
China has flourished since economic reforms began. As Zhang and Rasiah (2014) have
shown market reforms helped raise efficiency and coordination, the state has remained in
control of important decisions to stimulate technological upgrading and improvement of the
material conditions of the people. China’s share in world manufactured exports grew from
1.9% in 1990 to 4.7% in 2000 and to 16.8% in 2012. At the same time, manufacturing,
which accounted for 94% of China’s exports in 2012, saw a tremendous growth of its share
in export in the world from 1.9% in 1990 to 4.7% in 2000 before it reached 16.8% in 2012.
The share of manufacturing in total imports expanded sharply to 58% in 1987 after
bottoming to 26% in 1985 (Figure 9). However, manufacturing’s share in exports and
imports grew strongly in the 1990s to reach almost 80% each respectively in 1994.
Whereas export shares have continued to rise to reach 94%, import shares fell to 56% in
2012. A combination of rising fuel imports and stronger domestic manufacturing produc-
tion capabilities accounted for a fall in the share of manufactured imports in total imports
(Rasiah, Miao, and Xin, 2013).
Manufacturing is the key component of the industrial sector with construction
and utilities being the other components (Kaldor 1967). Although industrialization
reached its highest share in GDP during the Great Leap Forward campaign in 1958,
modern manufacturing did not seriously take off until the economic reforms. Its
contribution to GDP has hovered around 30%�35% in the period 1984�2010
(Figure 10). In addition, the contribution of industrial output in GDP has remained
strong to reach 47% in 2011. Although the contribution of manufacturing value
added in GDP fell in 2008�2010 owing to a crash in exports caused by contracting
imports from the developed economies, it grew in real prices from US$12 billion in
1965 to US$1243 billion in 2010 (Figure 11). Indeed, except for the steep growth
recorded in 1967 (because of its small starting base), manufacturing value added
grew strongest and in a sustained way in China since 1993.
10 M. Zhang and R. Rasiah
Dow
nloa
ded
by [
Tem
ple
Uni
vers
ity L
ibra
ries
] at
17:
02 0
5 D
ecem
ber
2014

China has enjoyed significant manufacturing structural change as the capital goods
industry of machinery and transport equipment recorded the highest share, which rose
from 18% in 1992 to 24% in 2007 (Table 4). The contribution of textiles and clothing fell
from 12.9% in 1992 to 10.0% in 2007. While growth in demand � both domestic and
Figure 9. Share of manufacturing in imports and exports, China, 1984�2012.Source: World Bank (2012).
Figure 10. Share of industrial and manufacturing sectors in GDP, China, 1970�2010.Source: China Statistical Bureau (2010a).
Journal of the Asia Pacific Economy 11
Dow
nloa
ded
by [
Tem
ple
Uni
vers
ity L
ibra
ries
] at
17:
02 0
5 D
ecem
ber
2014

foreign has been important, the role of the central, provincial and municipal governments
have also been critical in stimulating innovation and technological upgrading in
manufacturing.4
In short, it is clear that China has undergone significant globalization and structural
change with manufacturing showing a shift towards the higher value added activities of
machinery and transport equipment. It will be interesting to see if these developments
have translated into a high road to industrialization in the next section.
4. Labour markets
We discuss in this section the impact of internationalization and industrialization on
China’s labour market. In doing so, we analyse first the labour supply�demand patterns
followed by an evaluation of the uneven rural�urban flows, and wages and labour unions
in China. The analysis is to assess if globalization and industrialization has resulted in an
improvement in the material conditions of workers in China.
4.1. Supply�demand analysis
Labour supply and demand of China have increasingly been governed by a blend of
policy directives and market forces after economic reforms. On the supply side, major
changes in labour supply have taken place with the demographic restructuring, such as
the one-child policy has lowered the dependency ratio. On the demand side, China’s
insertion into the global economy increased the demand for high-quality labour as
government policies focused on transforming economic specialization in the country
from low to high value added activities.
Figure 11. Manufacturing value added, China, 1965�2011.Source: World Bank Institute (2012).
12 M. Zhang and R. Rasiah
Dow
nloa
ded
by [
Tem
ple
Uni
vers
ity L
ibra
ries
] at
17:
02 0
5 D
ecem
ber
2014

Table4.
Gross
output,manufacturingindustries,China,2000�2
011.
2000
2002
2004
2006
2008
2010
2011
Year
Actual
amount
%Actual
amount
%Actual
amount
%Actual
amount
%Actual
amount
%Actual
amount
%Actual
amount
%
Manufacturing
83,990.55
100
10,8701.2
100
206,122.2
100
293,172.7
100
473,830.8
100
652,203.1
1100
789,971.8
100
Miningandwashingof
Coal
1276.81
1.52
1980.76
1.82
4735.20
2.30
7207.61
2.46
14,625.92
3.09
22,109.27
3.39
28,919.81
3.66
Extractionofpetroleum
andnaturalgas
3130.11
3.73
2756.59
2.54
4630.17
2.25
7718.8
2.63
10,615.96
2.24
9917.84
1.52
12,888.76
1.63
Miningandprocessingof
ores
1048.25
1.25
1220.2
1.12
3056.34
1.48
4094.65
1.40
8368.33
1.77
12,923.59
1.98
16,803.38
2.13
Manufacture
offood,
beverages
andtobacco
8368.88
9.96
10,778.02
9.92
18,166.37
8.81
24,801.03
8.46
42,373.24
8.94
61,273.84
9.39
76,813.58
9.72
Manufacture
oftextile
5149.3
6.13
6370.79
5.86
11,655.12
5.65
15,315.5
5.22
21,393.12
4.51
28,507.92
4.37
32,652.99
4.13
Manufacture
oftextile
wearingapparel,
footwearandcaps
2291.16
2.73
2914.91
2.68
4668.52
2.26
6159.4
2.10
9435.76
1.99
12,331.24
1.89
13,538.12
1.71
Manufacture
ofleather,
furandfeather
1345.17
1.60
1801.46
1.66
3133.23
1.52
4150.04
1.42
5871.43
1.24
7897.5
1.21
8927.54
1.13
Manufacture
ofwoodand
furniture
3636.33
4.33
4716.37
4.34
7801.75
3.79
10,309.44
3.52
15,307.19
3.23
20,228.74
3.10
22,465.66
2.84
Manufacture
ofpaper
productand
publications
7272.66
8.66
9432.74
8.68
15,603.5
7.57
20,618.88
7.03
30,614.38
6.46
40,457.48
6.20
44,931.32
5.69
Processingofpetroleum,
coking,processingof
nuclearfuel
4429.19
5.27
4784.98
4.40
9088.84
4.41
15,149.04
5.17
22,628.68
4.78
29,238.79
4.48
36,889.17
4.67
Manufacture
ofchem
ical
products
5749.02
6.84
7220.05
6.64
14,027.74
6.81
20,448.69
6.97
33,955.07
7.17
47,920.02
7.35
60,825.06
7.70
(continued
)
Journal of the Asia Pacific Economy 13
Dow
nloa
ded
by [
Tem
ple
Uni
vers
ity L
ibra
ries
] at
17:
02 0
5 D
ecem
ber
2014

Table4.
(Continued
)
2000
2002
2004
2006
2008
2010
2011
Year
Actual
amount
%Actual
amount
%Actual
amount
%Actual
amount
%Actual
amount
%Actual
amount
%Actual
amount
%
Manufacture
ofmedicines
1781.37
2.12
2378.44
2.19
3365.85
1.63
5018.94
1.71
7874.98
1.66
11,741.31
1.80
14,941.99
1.89
Manufacture
ofchem
ical
fibber
1243.07
1.48
1121.82
1.03
1994.19
0.97
3205.63
1.09
3970.16
0.84
4953.99
0.76
6673.67
0.84
Manufacture
ofrubber
812.7
0.97
1064.6
0.98
2047.60
0.99
2731.85
0.93
4228.61
0.89
5906.67
0.91
7330.66
0.93
Manufacture
ofplastics
1899.7
2.26
2487.92
2.29
5253.29
2.55
6381.01
2.18
9897.17
2.09
13,872.22
2.13
15,579.54
1.97
Manufacture
ofnon-
metallicmineral
products
3692.85
4.40
4557.04
4.19
9951.20
4.83
11,721.52
4.00
20,943.45
4.42
32,057.26
4.92
40,180.26
5.09
Smeltingandmanufacture
ofmetalproducts
9452.89
11.25
12,386.72
11.40
29,913.55
14.51
46,869.74
15.99
80,706.31
17.03
10,0087.2
15.35
12,3324.6
15.61
Manufacture
ofmachinery
andtransport
equipment
23,856.73
28.40
33,946.39
31.23
67,673.54
32.83
96,853.36
33.04
151,920.3
32.06
216,861.4
33.25
253,248.1
32.06%
Manufacture
ofartwork
andothers
4611.39
5.49
5889.05
5.42
2119.76
1.03
2533.22
0.86
4088.63
0.86
5662.66
0.87
7189.51
0.91
Source:ChinaStatisticalBureau
(variousyears).
Note:Actualam
ountisby100millionyuan.
14 M. Zhang and R. Rasiah
Dow
nloa
ded
by [
Tem
ple
Uni
vers
ity L
ibra
ries
] at
17:
02 0
5 D
ecem
ber
2014

4.1.1. Labour supply
Ostensibly, labour supply did not seem to be a problem for a large country like China with
a population of over 1.3 billion in 2010. Industrialization drove large numbers of workers
from agriculture to industry and services so that in the initial stages the massive supply of
labour contributed to a low wage elasticity of economic growth5 in manufacturing in the
1990s. Rapid urbanization and industrialization helped raise the wage elasticity of growth
as the industrial reserve disappeared. These changes were influenced by both export
growth as well as demographic changes in China.
Demographic changes have contributed to a strong long-term shift in labour supply as
the one-child policy sharply reduced population growth, which over the long run has
eliminated the advantages of cheap labour. Labour-intensive industries have come under
pressure as population growth slowed down sharply following a steep fall in birth rates
from 1987 (Figure 12). Falling birth rates alongside a relatively stable death rate led to
decline in population growth, which fell dramatically from 1.6% in 1982 to 0.5% in 2011.
The impact of demographic changes has not only affected the quantity but also in the
age structure of labour supply. The disaggregation of population composition shows that
although the population aged between 15 and 64 increased from 0.7 billion in 1978 to
1.0 billion in 2011, the population aged 0�14 dropped from 0.3 billion in 1978 to 0.2
billion in 2011, which shows that China will be facing a problem of a small young popula-
tion in the long run. Hence, while the rapid expansion in human capital has improved job
opportunities (demand), the one-child family policy has been a major cause of sharply
contracting labour supply market in China.
4.1.2. Labour demand
Whereas labour supply in China is determined by endogenous demographic factors,
labour demand is sensitive to exogenous forces, such as globalization and industrializa-
tion. The transition of China from an agrarian to an industrial society has been driven by
reforms since 1978, which has been the primary engine of global integration and eco-
nomic structural change in the country. Since the focus here is on manufacturing, we
Figure 12. Birth, death and population growth rates, China, 1978�2011.Source: China Statistical Bureau (2012a).
Journal of the Asia Pacific Economy 15
Dow
nloa
ded
by [
Tem
ple
Uni
vers
ity L
ibra
ries
] at
17:
02 0
5 D
ecem
ber
2014

estimate employment elasticity figures over the period where data is available, i.e.
1998�20106. Employment elasticity refers to the growth in employment for every unit
output generated.
Annual industrial employment elasticities over the period 1998�2012, which is esti-
mated by dividing industrial employment growth by industrial output growth, is shown in
Table 5. Real output grew every year over the period 1998�2012, while employment fell
over the years 1999�2001 and 2009. Large scale retrenchments by state owned enter-
prises (SOEs) saw employment facing negative growth rates in 1999�2001, which
resulted in negative employment elasticities. The massive layoffs that followed painful
reforms targeted at SOEs in the late 1990s were absorbed by the emerging non-state sec-
tor.7 Except for 2009 (affected by the global financial crisis), positive industrial employ-
ment elasticities were recorded over the period 1999-2012.
The employment rate, the equilibrium point between labour supply and demand,
jumped three times from 207 million to 761 million over the period 1952�2010
(Figure 13). Gripped by low wages and disguised unemployment during the communist
rule, the social-market experiment following reforms boosted employment growth, which
grew 553 million in 1989 to 647 million in 1990, recording its highest annual average
growth rate of 17% in that period (Figure 14). The steady increase in labour force partici-
pation rate is a reflection of the nature of social market reforms China introduced to inte-
grate with the global economy.
As a consequence of rapid labour absorption, the unemployment rate8 fell from 4.9%
in 1980 to its trough of 1.8% in 1985 before a two-decade-long rise to 4.3% in 2003
Table 5. Annual industrial employment elasticity, China, 1998�2010.
YearNominal grossindustrial outputa
Constant2000 priceb
Outputgrowth Employmentc
Employmentgrowth
Industrialemploymentelasticityd
1998 67,737.14 68,266.55 N/A 6195.81 N/A N/A
1999 72,707.04 74,206.42 8.70% 5805.05 ¡6.31% (0.72)
2000 85,673.66 85,673.66 15.45% 5559.36 ¡4.23% (0.27)
2001 95,448.98 93,528.94 9.17% 5441.43 ¡2.12% (0.23)
2002 110,776.48 107,917.66 15.38% 5520.66 1.46% 0.09
2003 142,271.22 135,072.14 25.16% 5748.57 4.13% 0.16
2004 201,722.19 179,131.78 32.62% 6622.09 15.20% 0.47
2005 251,619.50 214,992.53 20.02% 6895.96 4.14% 0.21
2006 316,588.96 260,638.13 21.23% 7358.43 6.71% 0.32
2007 405,177.13 310,003.71 18.94% 7875.20 7.02% 0.37
2008 507,284.89 360,050.81 16.14% 8837.63 12.22% 0.76
2009 548,311.42 391,492.71 8.73% 8831.22 ¡0.07% (0.01)
2010 698,590.54 467,902.81 19.52% 9544.71 8.08% 0.41
Notes: aNominal Gross Industrial Output figures converted to constant 2000 prices using the GDP deflator ofChina from World Bank Institute (2011).bIn 10,000 yuan.cIn 10,000.dIndustrial Employment Elasticity is calculated by dividing growth rate of employment over growth rate of realgross output.Source: Calculated by authors based on China Statistical Bureau (2012a) & World Bank (2011).
16 M. Zhang and R. Rasiah
Dow
nloa
ded
by [
Tem
ple
Uni
vers
ity L
ibra
ries
] at
17:
02 0
5 D
ecem
ber
2014

(Figure 15). Reforms instituted on SOEs led to a rise in unemployment to 3.1% in 1989.
Despite labour absorption, unemployment rose steadily until 2003 owing to structural
unemployment caused partly by reforms faced by the SOEs. It has since either fallen or
kept steady in trend terms, reaching 4.1% in 2011.
Rapid industrialization transformed the sectoral labour force participation rates as the
share of employment in agricultural sector fell from 83.5% in 1952 to 34.8% in 2011,
while the commensurate shares in the industrial sector rose from 7.4% in 1952 to 29.5%
in 2011 (Figure 16). Employment by services grew from a share of 9.1% in 1952 to
35.7% in 2011. Economic reforms and the integration into the global economy trans-
formed China from an agricultural to an industrial economy. Labour migration into the
Figure 13. Population composition by age, China, 1982�2011.Source: China Statistical Bureau (2012a).
Figure 14. Employment, China, 1952�2010.Source: China Statistical Bureau (various years).
Journal of the Asia Pacific Economy 17
Dow
nloa
ded
by [
Tem
ple
Uni
vers
ity L
ibra
ries
] at
17:
02 0
5 D
ecem
ber
2014

booming industrial and service sectors was the major reason, the introduction of large-
scale agricultural production using high technology was also important.
Manufacturing employment grew rapidly over the first reform period of 1978�1988
(Figure 17). A declining share of manufacturing in total employment from 15.9% in 1988
to 13.3% in 1990 is due to the fact that other sectors grew faster than manufacturing. Both
employment, and the employment share of manufacturing in total employment grew in
1990�1996 as China enjoyed rapid growth similar to East Asia. Manufacturing employment
fell again in 1997�2001 as a consequence of the Asian financial crisis of 1997�1998, and
the relocation of labour-intensive manufacturing to Vietnam, Laos and Cambodia.
4.2. Uneven distribution of labour
Globalization and industrialization have also reproduced uneven regional distribution of
labour in China. The huge size of China, and its diverse geographical and socio-economic
Figure 15. Unemployment rate, China, 1980�2011.Source: World Bank Institute (2013).Note: Data for 2008 and 2009 not available.
Figure 16. Employment breakdown by sectors, China, 1952�2011.Source: China Statistical Bureau (2012b).
18 M. Zhang and R. Rasiah
Dow
nloa
ded
by [
Tem
ple
Uni
vers
ity L
ibra
ries
] at
17:
02 0
5 D
ecem
ber
2014

background has given the labour market multifarious development patterns. Global inte-
gration benefited the coastal provinces more than the inland provinces owing to both a
greater focus on the former than the latter in the initial reform period, as well as, the prox-
imity offered by the seafront. Hence, the Eastern coastal provinces have enjoyed struc-
tural change towards medium and high technology industries and higher wages than the
inland provinces. In the meanwhile, household registration system (hukou), as a popula-
tion control scheme, separated labour supply and demand geographically, so that labour
supply from rural and Western inland regions is institutionally constrained to fill up
strong labour demand generated by the urban and East coastal regions.
Until around 2000, government policy to promote trade and FDI favoured the East
coastal areas. After 2000, the significant improvement of trade conditions offered by
accession to the WTO resulted in the government extending trade and investment focus
to the whole of China. However, the importance of access to trade routes prevented the
movement of labour-intensive industries to the Western inland provinces. Hence, the
growth of export-driven industries drove massive movement of labor from the Western
inland provinces to the coastal Eastern provinces, aggravating regional inequality in
employment and wages. Compared to the middle and western provinces, the Eastern
coastal provinces account for around half of national employment in the period
2003�2011 (Figure 18). In 2010, 50.3% of national employment was created by 11 out
of 33 provinces/municipals in the Eastern China. The concentration in manufacturing
was even higher at around 60% of national employment.
4.3. Wages
From a country that seemed like a base for unlimited cheap labour supply, China has
transformed to experience rising real wages following a sustained rise in demand for
labour and skills. Industrial exports aided strongly by important contributions from
foreign capital, and foreign technology in particular has generated the demand for labour
Figure 17. Employment in manufacturing, China, 1978�2008.Source: China Statistical Bureau (various years).
Journal of the Asia Pacific Economy 19
Dow
nloa
ded
by [
Tem
ple
Uni
vers
ity L
ibra
ries
] at
17:
02 0
5 D
ecem
ber
2014

to record significant improvements in wages. The jump in real wage growth started in
around 1998 when it was clear that the Multi-Fibre Arrangement � which gave preferen-
tial market access in the developed countries to particular developing economies � will
be terminated by 2004 (Rasiah 2012). Although real wage growth fell below 7% in 2004,
both overall and manufacturing enjoyed a massive annual growth in real wages between
7% and 20% over the remaining 1998�2012 period (Table 6). Growth in manufacturing
wages exceeded growth in overall wages in 1995, 1998�2000 and 2003. The higher
growth in non-manufacturing real wages since 2005 is largely a case of catching up with
manufacturing.
Clearly, the rapid growth in real wages in the world’s most populous country demon-
strates that the infusion of market forces in a protracted manner with the state retaining
control to ensure that the interests of the poor are shielded is arguably a great example for
Figure 18. Share of employment by regions, China, 2003�2011.Source: National Statistical Bureau (various years).
Table 6. Wages, overall and manufacturing, China, 1994�2009.
Overall Manufacturing
Year Nominal Constant 2000 prices Growth rate Nominal Constant 2000 prices Growth rate
1995 5348 5773.44 4.51% 5199 5612.59 6.60%
1997 6444 6438.60 6.15% 5979 5973.99 3.82%
1999 8319 8490.55 13.14% 7874 8036.37 12.03%
2001 10,834 10,616.06 13.75% 9891 9692.03 9.69%
2003 13,969 13,262.15 10.03% 12,671 12,029.83 10.73%
2005 18,200 15,550.71 10.00% 15,934 13,614.56 7.58%
2007 24,721 18,914.20 10.16% 21,144 16,177.41 7.82%
2009 32,244 23,022.11 12.24% 26,810 19,142.25 10.51%
Source: China Statistical Bureau (2010b).
20 M. Zhang and R. Rasiah
Dow
nloa
ded
by [
Tem
ple
Uni
vers
ity L
ibra
ries
] at
17:
02 0
5 D
ecem
ber
2014

other economies to study. The high increase in real wages obviously also suggests that
China has managed to experience the high road to industrialization as defined by Piore
and Sabel (1984), and Pyke and Sengenberger (1992). Rapid economic growth led by
manufacturing has been accompanied by tangible improvements in the material condi-
tions of labour as wages have grown significantly over the years.
As shown in Table 7, all manufacturing industries recorded rapid average annual real
wage growth over the period 2001�2011. Overall (8.5%) wages grew faster than
manufacturing (8.1%) wages for the reasons explained earlier. Tobacco and special pur-
pose machinery recorded the highest wage growth in the manufacturing sector at 10.2%
per annum. Between these two industries, tobacco by far enjoyed a massive real wage
growth as mean wages 2000 prices in the industry reached 57,749 yuan compared to only
25,740 yuan in special purpose machinery. In addition, the manufacturing industries of
textile, timber, bamboo and straw, furniture, paper and paper products, chemicals, non-
metallic mineral products, and general purpose machinery also enjoyed higher real wage
growth than overall wage growth in China over the period 2001�2011.
In addition to rising wages caused by a greater rise in labour demand over labour sup-
ply and the rising premium for skilled and knowledge-based labour, the Chinese govern-
ment has also reviewed its minimum wages every two years to ensure that the formal
labour market is properly regulated. Minimum wages in China vary according to the
regional and provincial differences in socio-economic conditions, as well as the concen-
tration of labour across China. Although the national regulations, Regulations on Mini-
mum Wage, was enforced in 2004 as a guideline to protect employees being fairly
remunerated, the provincialization and decentralization processes following reforms
allow local governments the regulatory space to initiate their own regulations based on
specific socio-economic conditions. Moreover, the changing external economic environ-
ment caused by factors, such as, inflation,9 have often required the authorities to calibrate
minimum wages to reflect market conditions so as to protect the welfare of employees.
Following the law to encourage provincial authority to adjust the minimum wage once
every two years until it is lifted up to 40% of average wage of urban employees in 2015,
the national average annual growth rate of minimum wage was increased by 22% in 2011
and 20.5% in 2010. Among the provinces, Shanghai enjoyed the highest monthly and
hourly minimum wages of 1620 yuan and 14 yuan, respectively, while the landlocked
provinces/regions such as Guizhou and Chongqing recorded lower monthly and hourly
minimum wages (Table 8). The dynamic economic provinces of Guangdong, Shenzhen,
Jiangsu and Zhejiang also enjoyed relatively high minimum wages.
4.4. Female labour
We examine the gender issue in China’s labour market here because female labour is
attracting strong attention as they emerge from a background of subordination to
males. Because China’s early history has been dominated by men, the gender
inequality that persisted since the Han Dynasty had remained until the establishment
of People’s Republic in 1949 when the Communist Party announced that the liberal-
ization of women as a sign of modernization. Encouraged by Mao Zedong’s motto
of ‘woman can also hold up half sky,’ women were given equal rights to participate
in the social relations of production.
Women’s participation in the formal labour market became more pronounced since
market reforms were introduced in 1978. Attracted by the better urban incomes, young
migrant women left their homes from rural areas to seek employment in industrial areas
Journal of the Asia Pacific Economy 21
Dow
nloa
ded
by [
Tem
ple
Uni
vers
ity L
ibra
ries
] at
17:
02 0
5 D
ecem
ber
2014
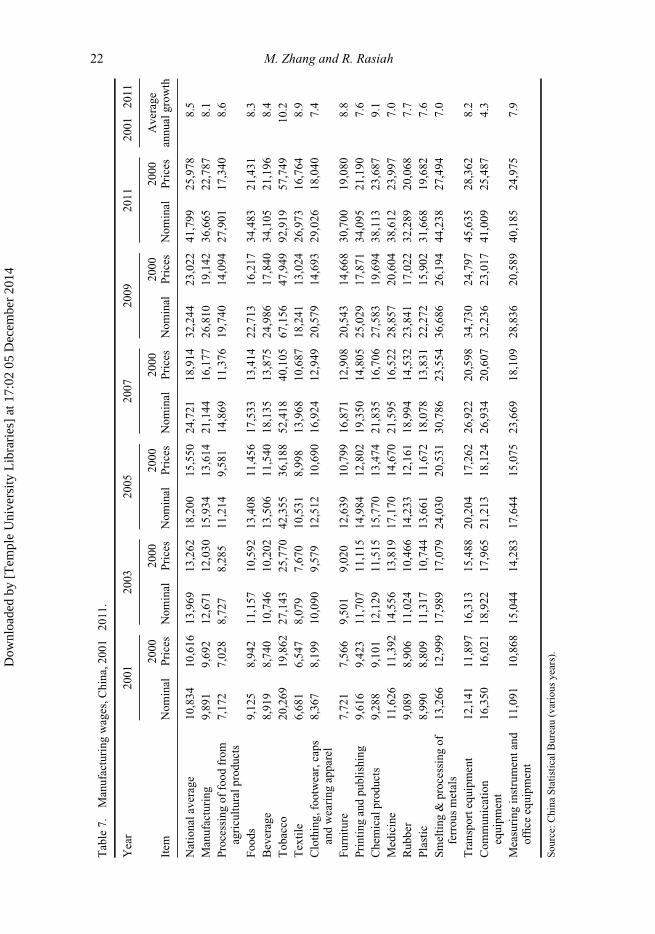
Table7.
Manufacturingwages,China,2001�2
011.
Year
2001
2003
2005
2007
2009
2011
2001�2
011
Item
Nominal
2000
Prices
Nominal
2000
Prices
Nominal
2000
Prices
Nominal
2000
Prices
Nominal
2000
Prices
Nominal
2000
Prices
Average
annualgrowth
Nationalaverage
10,834
10,616
13,969
13,262
18,200
15,550
24,721
18,914
32,244
23,022
41,799
25,978
8.5
Manufacturing
9,891
9,692
12,671
12,030
15,934
13,614
21,144
16,177
26,810
19,142
36,665
22,787
8.1
Processingoffoodfrom
agriculturalproducts
7,172
7,028
8,727
8,285
11,214
9,581
14,869
11,376
19,740
14,094
27,901
17,340
8.6
Foods
9,125
8,942
11,157
10,592
13,408
11,456
17,533
13,414
22,713
16,217
34,483
21,431
8.3
Beverage
8,919
8,740
10,746
10,202
13,506
11,540
18,135
13,875
24,986
17,840
34,105
21,196
8.4
Tobacco
20,269
19,862
27,143
25,770
42,355
36,188
52,418
40,105
67,156
47,949
92,919
57,749
10.2
Textile
6,681
6,547
8,079
7,670
10,531
8,998
13,968
10,687
18,241
13,024
26,973
16,764
8.9
Clothing,footwear,caps
andwearingapparel
8,367
8,199
10,090
9,579
12,512
10,690
16,924
12,949
20,579
14,693
29,026
18,040
7.4
Furniture
7,721
7,566
9,501
9,020
12,639
10,799
16,871
12,908
20,543
14,668
30,700
19,080
8.8
Printingandpublishing
9,616
9,423
11,707
11,115
14,984
12,802
19,350
14,805
25,029
17,871
34,095
21,190
7.6
Chem
icalproducts
9,288
9,101
12,129
11,515
15,770
13,474
21,835
16,706
27,583
19,694
38,113
23,687
9.1
Medicine
11,626
11,392
14,556
13,819
17,170
14,670
21,595
16,522
28,857
20,604
38,612
23,997
7.0
Rubber
9,089
8,906
11,024
10,466
14,233
12,161
18,994
14,532
23,841
17,022
32,289
20,068
7.7
Plastic
8,990
8,809
11,317
10,744
13,661
11,672
18,078
13,831
22,272
15,902
31,668
19,682
7.6
Smelting&
processingof
ferrousmetals
13,266
12,999
17,989
17,079
24,030
20,531
30,786
23,554
36,686
26,194
44,238
27,494
7.0
Transportequipment
12,141
11,897
16,313
15,488
20,204
17,262
26,922
20,598
34,730
24,797
45,635
28,362
8.2
Communication
equipment
16,350
16,021
18,922
17,965
21,213
18,124
26,934
20,607
32,236
23,017
41,009
25,487
4.3
Measuringinstrumentand
office
equipment
11,091
10,868
15,044
14,283
17,644
15,075
23,669
18,109
28,836
20,589
40,185
24,975
7.9
Source:ChinaStatisticalBureau
(variousyears).
22 M. Zhang and R. Rasiah
Dow
nloa
ded
by [
Tem
ple
Uni
vers
ity L
ibra
ries
] at
17:
02 0
5 D
ecem
ber
2014

to supplement household incomes or to support their male siblings to attend college. Sta-
tistics from Shenzhen General Labour Union (2003) show that 70% of the 5.5 million
migrant workers were females in the Shenzhen Special Economic Zone in 2003. In one of
its sub-districts, i.e. Nanshan, female labour accounted for 80% of the entire workforce
with an average age of 23. However, lacking the skills and knowledge of urban educated
woman, most rural female migrants are employed in segmented labour markets in the
informal and low-wage employment sectors. Young migrant workers, with minimal edu-
cation and awareness of labour-related rights found are largely exposed to low-wage
employment with weak labour protection and physical and psychological problems.
Table 8. Minimum wages by province, China, 2013.
January May June July
Monthly Hourly Monthly Hourly Monthly Hourly Monthly Hourly
Shenzhen 1500 13.3 1600 14.5 1600 14.5 1600 14.5
Zhejiang 1470 12 1470 12 1470 12 1470 12
Shanghai 1450 12.5 1620 14 1620 14 1620 14
Beijing 1400 15.2 1400 15.2 1400 15.2 1400 15.2
Xinjiang 1340 13.4 1340 13.4 1520 15.2 1520 15.2
Jiangsu 1320 11.5 1320 11.5 1320 11.5 1480 13
Hebei 1320 13 1320 13 1320 13 1320 13
Tianjin 1310 13.1 1500 15 1500 15 1500 15
Guangdong 1300 12.5 1550 15 1550 15 1550 15
Shandong 1240 13 1380 14.5 1380 14.5 1380 14.5
Fujian 1200 12.7 1200 12.7 1200 12.7 1200 12.7
Inner Mongolia 1200 10.2 1200 10.2 1200 10.2 1200 10.2
Hunan 1160 11.5 1160 11.5 1160 11.5 1160 11.5
Heilongjiang 1160 11 1160 11 1160 11 1160 11
Shaanxi 1150 11.5 1150 11.5 1150 11.5 1150 11.5
Tibet 1150 10.5 1150 10.5 1150 10.5 1150 10.5
Jilin 1150 10 1150 10 1150 10 1150 10
Shanxi 1125 12.3 1290 14 1290 14 1290 14
Hubei 1100 10 1100 10 1100 10 1100 10
Liaoning 1100 11 1100 11 1100 11 1300 12.5
Ningxia 1100 11 1300 12.5 1300 12.5 1300 12.5
Yunnan 1100 10 1265 11 1265 11 1265 11
Henan 1240 11.7 1240 11.7 1240 11.7 1240 11.7
Qinghai 1070 10.8 1070 10.8 1070 10.8 1070 10.8
Sichuan 1050 11 1050 11 1050 11 1200 12.7
Chongqing 1050 10.5 1050 10.5 1050 10.5 1050 10.5
Hainan 1050 9.2 1050 9.2 1050 9.2 1050 9.2
Anhui 1010 10.6 1010 10.6 1010 10.6 1010 10.6
Guangxi 1000 8.5 1200 10.5 1200 10.5 1200 10.5
Gansu 980 10.3 1200 12.7 1200 12.7 1200 12.7
Guizhou 1030 11 1030 11 1030 11 1030 11
Jiangxi 870 8.7 1230 12.3 1230 12.3 1230 12.3
Source: Bureau of Human Resource and Social Security, various provinces, (2013).
Journal of the Asia Pacific Economy 23
Dow
nloa
ded
by [
Tem
ple
Uni
vers
ity L
ibra
ries
] at
17:
02 0
5 D
ecem
ber
2014

The development of female employment since the Communist Party took over is asso-
ciated with the following: first, the modernization of household relations as women began
to enter education stream in large numbers, (including in technical fields), and second,
market reforms since 1978 provided massive demand for female labour. However, while
these two developments unleashed strong motivation for women to work, the gradual
withdrawal of the state from economic activities triggered a gradual fall in female labour
force participation rates, which dropped from 72.7% in 1990 to 63.8% in 2012
(Figure 19). The steep decline happened since 1998 until middle 2000s, which is believed
to be a consequence of large-scale SOE reforms as a massive number of employees were
retrenched. Rising incomes also led a number of females to stay home and take care of
household chores. Hence, females in the labour force stabilized at 36%�38% in the
period 1994�2011.
Overall and female employment in manufacturing has started to decline since 1994
before both of them experienced a rise after bottoming in 2003. The female composition
declined from its highest of 45% in 1995 to its lowest of 39% in 2011(Figure 20). The
declining trend in the female share of employment in manufacturing is a consequence of
industrial upgrading from low technology labour-intensive industries, such as, clothing
and tools manufacturing, to middle technology industries, such as, machinery
manufacturing. While the former is dominated by female workers, the latter is dominated
by male workers. Nevertheless, manufacturing alone accounted for 30.9%�42.4% of
overall female employment over the period 1994�2011 (Figure 21).
Although China has enjoyed a relatively high female labour participation rate compared
to most developing economic and the smallest rural-urban and gender wage gaps among
developing countries (World Bank Institute 2012), female labour in manufacturing shows
longer working hours than workers (including female) in the overall economy over the
period 2001�2011. This gap has narrowed since over the period 2007�2011. In general,
both male and female working hours in manufacturing is much longer compared to other
sectors (Table 9). However, there is no discernible difference in male�female working
hours over the period 2001�2011 to suggest that women work longer than men in
Figure 19. Female labour participation rate, China, 1990�2012 (%).Source: World Bank (2012).
24 M. Zhang and R. Rasiah
Dow
nloa
ded
by [
Tem
ple
Uni
vers
ity L
ibra
ries
] at
17:
02 0
5 D
ecem
ber
2014

manufacturing. The narrowing gap in working hours between manufacturing and other sec-
tors also shows a shift in economic activity away from manufacturing to the other sectors,
such as, services.
However, severe challenges still face China’s female workers. Although industrializa-
tion and globalization have improved wages, female workers earned less than 31% on
average the wages of man in 2011 for doing the same job. Also, gender discrimination
also affected female job seekers in the employment market with many employers prefer-
ring male employees owing to legal protection for maternity leave and other preferential
treatment given to women. In addition, urban migrant female workers often face serious
social problems. Given the special characteristic of unions in China, which are a subordi-
nate organ of government, female labour often lacks empowerment to seek their labour-
related rights. The government’s sanctioning of other forms of unionization denied the
All-China Federation of Trade Unions the legitimacy to fight for worker’s rights. As a
Figure 20. Manufacturing employment, China, 1994�2011.Source: China Statistical Bureau (various years).
Figure 21. Female manufacturing employment in total employment, China, 1994�2011.Source: China Statistical Bureau (various years).
Journal of the Asia Pacific Economy 25
Dow
nloa
ded
by [
Tem
ple
Uni
vers
ity L
ibra
ries
] at
17:
02 0
5 D
ecem
ber
2014

consequence, the collective bargaining power of migrant women workers is largely absent
to assist them to seek their rights from employers. Hence, unrests involving worker abuse
have continued to explode in China, such as, the notorious Foxconn suicide scandal.
5. Conclusions
Although we have not examined the state of freedom and happiness the people of China may
have enjoyed when the gates to global integration were opened in 1978, the evidence shows
that massive trade and investment flows have followed since reforms began, which has not
only stimulated rapid economic growth and structural change but it has also generated
significant improvement in real wages, especially from the 1990s. The advantages offered by
the seafront and an earlier focus by the government made the Eastern coastal provinces the
largest beneficiaries of globalization in China. Manufacturing value added and structural
change and wages have grown the fastest in these states. Nevertheless, the middle inland
provinces and federal territories of Jiangsu and Beijing have also benefited considerably
from the transformation. Although regional inequalities have widened as a consequence of
the faster development of the Eastern provinces compared to the Western provinces the
evidence shows that material progress has been felt by most provinces.
The evidence shows that global integration through the infusion of capitalist organiza-
tion under a socialist structure where the central government has increasingly
decentralized planning to absorb provincial and municipal participation in decision-
making has been successful in ensuring long run growth, structural change and
improvements in wages. The government’s focus on targeting technological capability
has been important in the structural transformation of manufacturing from lower to higher
value added activities. Elsewhere Mathews (2014) has offered convincing evidence to
show how China is driving Asia’s new great transformation through a focus on renewable
energy to power economic growth.
However, China’s massive industrial labour market has also been gripped by social
problems. Manufacturing workers on average still work longer than other workers in the
economy. While female labour force participation rates are high compared to other
developing countries, rising wages has also capped further increases since the 2000s as
Table 9. Urban female average weekly working hours, China, 2001�2011.
Year NationalMale
NationalFemaleNational Manufacturing
Male inmanufacturing
Female inmanufacturing
2001 44.9 45.2 44.5 44.7 44.8 44.7
2002 45.2 45.6 44.7 46.0 45.6 46.5
2003 45.4 45.8 44.9 46.4 46.2 46.6
2004 45.5 46.0 44.9 46.9 46.5 47.5
2005 47.8 48.7 46.1 51.1 51.0 51.3
2006 47.3 48.3 45.9 50.4 50.3 50.5
2007 45.5 46.8 44 49.4 49.6 49.2
2008 44.6 45.7 43.1 47.9 48.0 47.7
2009 44.7 45.9 43.2 48.5 48.6 48.4
2010 47.0 47.7 46.1 49.0 49.0 49.0
2011 46.2 47 45.2 48.1 48.2 47.9
Source: China Statistical Bureau (various years).
26 M. Zhang and R. Rasiah
Dow
nloa
ded
by [
Tem
ple
Uni
vers
ity L
ibra
ries
] at
17:
02 0
5 D
ecem
ber
2014

women have chosen to handle household chores more. However, not everything has been
rosy as vulnerable industrial rural migrant workers have also been exposed to abuse by
factories from time to time. Also, women on average still earn around one-third of men
for similar work done in China.
Acknowledgements
We are grateful to comments from two referees. The usual disclaimer applies.
Notes
1. In general, the collection and reporting of statistics raise a number of problems. Nevertheless,statistics from a large and rapidly growing economy like China will be superior to those back-ward countries.
2. Moroccan geographer Muhammad al-Idrisi had recorded the appearance of Chinese merchantships in the Indian Ocean in 1154, and their voyages extended as far as Yemen.
3. Interviews with a senior German engineer of Shanghai Volkswagen on 29 September 2000 inShanghai.
4. For an account of the role of the central, provincial and municipal governments in the growth ofbutton manufacturing in Qiaotou.
5. The low price elasticity may also be explained by the absence of a well-established marketmechanism.
6. The observation period extends from 1998 to 2010 in order to capture the industry developmentafter reforms and insertion of global economy, especially the entrance of WTO in 2000. Theperiod before 1998 was not taken into discussion, as the changes in elasticity was not significantenough to examine the impact of globalization and industrialization on labour market.
7. The aggregate number of laid-off workers was 27 million from 1998 to 2004. The number oflayoffs reached its peak of 6.6 million in 2000.
8. It indicates the share of unemployment on total labour force.9. According to the Law, the minimum wage is a function of a set of socio-economic factors,
which is expressed as follows:
M=f (C, S, A, U, E, a)
where M: Level of Minimum Wage; C: Urban Average of Life Expenses; S: Social SecurityFund and Housing Provident Fund by Employees; A: Average Wage of Employees; U: Unem-ployment Rate; E: Level of Economic Development; and a: adjustment factor.
Notes on contributors
Miao Zhang obtained her PhD in Economics from University of Malaya and currently is working asa Post-doc in University of Malaya, Malaysia.
Rajah Raisah is professor of economics and technology management at the Faculty of Economicsand Administration, University of Malaya. He is currently on sabbatical at Harvard University.
References
China Global Investment Tracker. 2011. American Enterprise Institute & The Heritage Foundation.Accessed October 21, 2014. http://www.heritage.org/research/projects/china-global-investment-tracker-interactive-map
China Statistical Bureau. 2010a. China Statistics Yearbook, edited by J.T. Ma. Beijing: State Statis-tical Bureau.
China Statistical Bureau. 2010b. China Labour Statistical Yearbook, edited by Z.B. Zhang. Beijing:Department of Population and Employment Statistics of the State Statistics Bureau & Depart-ment of Planning and Finance of the Ministry of Human Resources and Social Security.
Journal of the Asia Pacific Economy 27
Dow
nloa
ded
by [
Tem
ple
Uni
vers
ity L
ibra
ries
] at
17:
02 0
5 D
ecem
ber
2014

China Statistical Bureau. 2012a. China Statistics Yearbook, edited by J.T. Ma. Beijing: State Statis-tical Bureau.
China Statistical Bureau. 2012b. China Labour Statistical Yearbook, edited by Z.B. Zhang. Beijing:Department of Population and Employment Statistics of the State Statistics Bureau & Depart-ment of Planning and Finance of the Ministry of Human Resources and Social Security.
Kaldor, N. 1967. Strategic Factors in Economic Development. New York, NY: New York StateSchool of Industrial and Labor Relations, Cornell University.
Mathew, J.A. 2014. Greening Capitalism: How Asia is Driving the New Great Transformation.Stanford: Stanford University Press.
Piore, M.J., and C.F. Sabel. 1984. The Second Industrial Divide: Possibilities for Prosperity. NewYork, NY: Basic Books.
Pyke, F., and W. Sengenberger. 1992. Industrial Districts and Local Economic Regeneration.Geneva: International Labour Organization (ILO).
Rasiah, R. 2012. “Beyond the Multi-Fibre Agreement: How are Workers in East Asia Faring?.”Institutions and Economies 4 (3): 1�20.
Rasiah, R., X.-X. Kong, and J. Vinanchiarachi. 2011. “Moving Up in the Global Value Chain inButton Manufacturing in China.” Asia Pacific Business Review 17 (2): 161�174. doi:10.1080/13602381.2011.533508
Rasiah, R., Z. Miao, and K.X. Xin. 2013. “Can China’s Miraculous Economic Growth Continue?”Journal of Contemporary Asia 43 (2): 295�313. doi:10.1080/00472336.2012.740940
Shenzhen General Labour Union. 2003. “The Cooperative of Female Migrant in Shenzhen. 2014.”http://gd.news.sina.com.cn/local/2003-03-10/18107.html.
UNCTAD. 2011. World Investment Report. Geneva. http://unctad.org/en/PublicationsLibrary/wir2012_embargoed_en.pdf
World Bank. 2011. World Development Indicators. http://data.worldbank.org/country/china#cp_wdiWorld Bank. 2012. World Development Indicators. http://data.worldbank.org/country/china#cp_wdiWorld Bank Institute. 2011. World Development Indicators. Washington, DC: World Bank
Institute.World Bank Institute. 2012. World Development Indicators. Washington, DC: World Bank Institute.World Bank Institute. 2013. World Development Indicators. Washington, DC: World Bank
Institute.World Development Indicators. 2012. The World Bank. http://data.worldbank.org/country/china#cp_wdiWorld Trade Organization. 2012. International Trade Statistics. Geneva: World Trade Organization.Young, A. 2003. “Gold into Base Metals: Productivity Growth in the People’s Republic of China
During the Reform Period.” Journal of Political Economy 111: 1220�1261.Zhang, M., and R. Rasiah. 2014. “Institutional Change and State Owned Enterprises in China’s
Urban Housing Market.” Habitat International 41 (Jan.): 58�68.
28 M. Zhang and R. Rasiah
Dow
nloa
ded
by [
Tem
ple
Uni
vers
ity L
ibra
ries
] at
17:
02 0
5 D
ecem
ber
2014