globalization and labour-market adjustment: how fast and at what cost?
TRANSCRIPT

42 © 2000 OXFORD UNIVERSITY PRESS AND THE OXFORD REVIEW OF ECONOMIC POLICY LIMITED
GLOBALIZATION AND LABOUR-MARKET ADJUSTMENT: HOW FASTAND AT WHAT COST?
OXFORD REVIEW OF ECONOMIC POLICY, VOL. 16, NO. 3
CARL DAVIDSONSTEVEN J. MATUSZMichigan State University1
In this paper we argue that the flexibility of an economy’s labour market plays a role in determining thegains from trade liberalization, the level of short-run adjustment costs, and the relative value of these twomeasures. To do so, we describe the model introduced in Davidson and Matusz (2000) which allows us tosolve for adjustment costs when workers vary according to ability and jobs differ in terms of the skills thatthey require. We then report results based on simulations of this model. We find that economies with slug-gish labour markets have the least to gain from liberalization. The reason is that while the removal of tradebarriers creates large benefits, they are almost completely offset by large short-run adjustment costs. Incontrast, we find that with either very flexible or very slothful labour markets the gains from liberalizationare always significantly larger than the short-run adjustment costs.
I. INTRODUCTION
It would be difficult for the public and professionaldebates concerning trade policy to be more differentthan they are. In the profession, it seems to beuniversally accepted that trade liberalization gener-ates aggregate net benefits. While there may besome workers who are harmed by liberalization, thebenefits generated are always large enough fully to
compensate these workers for their losses. On theother hand, as recent protests against the WorldTrade Organization, International Monetary Fund,and World Bank in Seattle and Washington DCindicate, the public seems split on the benefits ofliberalization. Those in favour of an open tradepolicy tend to emphasize the benefits of expandingour export markets and lowering consumer prices.Those who favour a less open (or protectionist)
1 We would like to thank an anonymous referee for helping us to clarify some of the points in this paper. We are solely responsiblefor all remaining errors.

trade policy focus on the potential costs of reform.These costs include, among other things, the em-ployment and income losses encountered by work-ers who lose their jobs as the pattern of tradechanges, the loss of national sovereignty, and theimpact on the environment.2
This dichotomy between the public and the econom-ics profession is not hard to understand. Interna-tional trade economists have always relied on mod-els that assume the full employment of resources todraw conclusions about the impact of trade policy onthe distribution of income. Modelling unemploymentand its underlying causes is not easy, especially inthe type of general equilibrium setting required toanalyse trade-related issues. Moreover, it is widelybelieved that unemployment is largely independentof trade policy since it is a macroeconomic variablethat is tied to the overall level of economic activity,not a microeconomic variable that is tied to theallocation of resources across sectors.3 In the ab-sence of any strong empirical evidence that tradepolicy has an important impact on unemployment orthat short-run adjustment costs are significant, inter-national trade economists have chosen to continueto work with their full employment models and focuson the long-run benefits that are generated byreducing barriers to trade.4
In contrast, the public sees a world in which workerscycle between periods of employment and unem-ployment. Anything that changes the allocation ofresources across sectors (such as trade policy) isbound to influence the rates at which transitionsfrom employment to unemployment occur. As sec-
tors shrink in the face of international competition,workers lose their jobs and must seek re-employ-ment in new sectors. In some instances, this re-quires retraining, adding to the costs already im-posed on the dislocated worker. In other instances,workers with few skills, little formal education, and/or limited innate ability who are displaced by inter-national competition face bleak re-employment pros-pects and may be forced out of the labour marketaltogether. It is only natural to worry about themagnitude of these costs and to ask whether or notthe benefits of trade liberalization are really worth it.
Attempts to measure the short-run adjustment costsfrom trade liberalization have led to mixed results.On the one hand, the small number of attempts tomeasure aggregate adjustment costs all lead to theconclusion that these costs are small relative to thegains from liberalized trade5 (see Matusz and Tarr,2000, for a recent survey). It is difficult to placemuch weight on such estimates owing to the factthat they are typically born of conceptual modelsthat leave no room for unemployment. The reason,in turn, that the conceptual models do not allow forunemployment stems from an underlying belief thatresources can be maintained at full employmentalong the adjustment path by the pursuit of appropri-ate macroeconomic policies. On the other hand,attempts to measure the costs to a typical dislocatedworker tend to be quite carefully carried out andindicate that the personal costs of adjustment maybe quite high. For example, Jacobson et al. (1993a,b)report that the average dislocated worker sufferslifetime earnings losses totalling $80,000. The mag-nitude of these personal costs has recently led to a
2 In a recent paper, Baldwin and Magee (1999) examined congressional voting on trade legislation in the United States duringthe 1990s. They report that of those members voting against the North Atlantic Free Trade Area (NAFTA), 70 per cent cited a‘decrease in jobs and wages’ as their primary reason, 10 per cent cited ‘environmental and immigration concerns’, and 3 per centexpressed concern about ‘US sovereignty and national defense’. In contrast, of those members voting for NAFTA, 79 per centcited either ‘an increase in jobs and wages’ or ‘an expansion of US export markets’ or ‘an increase in living standards’ as their primaryreason.
3 For example, Krugman (1993) argues that ‘it should be possible to emphasize to students that the level of employment is amacroeconomic issue . . . depending in the long run on the natural rate of unemployment, with microeconomic policies like tariffshaving little net effects’. In addition, Mussa (1993) states that ‘economists . . . understand that the effect of protectionist policiesis not on the overall employment of domestic resources, but rather on the allocation of resources across productive activities’.
4 To underscore just how little attention has been paid to unemployment and adjustment costs in the traditional trade literature,we surveyed the index of the Handbook of International Economics to see how many entries were included under each subject.In volumes 1 and 3, which are devoted to pure trade theory, there are no entries under either ‘unemployment’ or ‘adjustment costs’,although there are two entries under ‘adjustment assistance mode’. In volume 2, which is devoted to international finance, thereare no entries under ‘adjustment costs’, while there are approximately a dozen entries under ‘employment’.
5 For example, see Baldwin et al. (1980) or Magee (1972). Matusz and Tarr (2000) piece together the available empirical evidenceand conclude that adjustment costs are likely to be a small fraction of gross benefits.
43
C. Davidson and S. J. Matusz
44
OXFORD REVIEW OF ECONOMIC POLICY, VOL. 16, NO. 3
clamour in the policy community for programmesaimed at easing the plight of those who bear theburden of these adjustment costs.6 Policies that arecurrently under consideration include wage subsi-dies paid to dislocated workers, bonus payments tounemployed workers who find re-employment rela-tively quickly, job-search assistance, and govern-ment-sponsored retraining programmes.
Given the fact that it is so difficult to measureadjustments costs, it is natural to ask whether thereis any way to judge a priori what type of economieswill face relatively high or low costs when comparedto the gains from liberalization. After all, the struc-tures of factor markets vary greatly across theworld. The United States has a flexible labourmarket with high turnover and relatively flexible realwages. In Europe and Japan, turnover is muchlower with relatively long durations of unemploy-ment and greater job security. A strong unionpresence in many European countries coupled withrelatively generous social programmes has alsocreated an environment in which wages appear tobe fairly rigid downward. Thus, European factormarkets are perceived to be much less flexible thantheir American counterparts.
There can be little doubt that the structure of thefactor market plays a role in determining how re-sources are allocated within an economy and thespeed with which that economy reacts to policychanges. This implies that the flexibility of an econo-my’s factor markets plays a role in determining thelevel of adjustment costs that arise from trade liber-alization as well as the level of the benefits that follow.
In a recent paper (Davidson and Matusz, 2000) weprovide a simple model that allows us to addressmany of the issues that the public and policy-makersseem to be concerned about. Briefly, we provide amodel in which heterogeneous workers must ac-quire skills in order to obtain jobs, job search requirestime and effort, and employed workers face job risk.Our workers therefore cycle between periods of
training, unemployment, and employment. The keyparameters that determine the types of jobs thatworkers are attracted to include the workers’ abilitylevels and the labour-market turnover rates. Weshow that the model is simple enough to solveexplicitly for the labour-market dynamics that takeplace as the economy adjusts across steady-stateequilibria. This allows us to calculate the adjustmentcosts associated with trade liberalization (or globali-zation) in a model with unemployment and training.In addition, in contrast with prior work in this area,we are able to relate adjustment costs and thebenefits of liberalization to a few empirically observ-able characteristics of the labour market.7 In par-ticular, the two key parameters of our model are theexpected duration of a spell of unemployment andthe expected length of job tenure. We assume thatthese parameters vary across sectors of the economy.Their values partially determine how labour is ini-tially allocated across sectors of the economy andalso the speed with which workers move betweensectors in response to some economic shock (suchas trade liberalization).
Our purpose in this paper is numerically to simulateour model to show how the costs and benefits oftrade reform vary according to the degree of labour-market flexibility. Our results are as follows. First,we find that short-run adjustment costs are alwayssmaller than long-run benefits.8 Second, if we lookat the difference between benefits and costs, wefind that the economies with the most to gain fromliberalization are at opposite ends of the spectrum.Our results suggest that a given tariff creates thelargest distortion in an economy with very sluggishlabour markets, as would be the case with highexpected durations of unemployment and job ten-ure. Even though adjustment costs are big for thissort of economy, the benefits of reform aresubstantially bigger. At the other end of thespectrum, economies with very dynamic labourmarkets benefit from reform because adjustmentoccurs swiftly. Economies with moderately dy-namic labour markets have the least to gain from
6 See, for example, Baily et al. (1993), Davidson and Woodbury (1993, 1995), Jacobson et al. (1993a,b), Parsons (1995), or thereport put out by the US Department of Labor (1993).
7 Prior work in this area includes Lapan (1976), Magee (1972), Baldwin et al. (1980), and Neary (1982). Winters and Takacs(1991) examine the likely impact on employment in the British footwear industry should trade restrictions be lifted. Their study,based upon the natural rate of voluntary separations observed in that industry, is similar in spirit to ours. However, they miss someimportant general equilibrium effects by focusing on a single industry.
8 We provide a formal proof of this in Davidson and Matusz (2000). We also note here that, in this regard, our results are consistentwith those surveyed by Matusz and Tarr (2000).

45
C. Davidson and S. J. Matusz
reform because the distorting effect of the tariffis not that large, while the period of adjustment isrelatively lengthy.
We provide an intuitive description of our model inthe next section.9 In section III we numericallysimulate the effects of removing a small importtariff, and in section IV show how the results varyaccording to the degree of labour-market flexibility.We discuss the intuition underlying our results insection V and conclude in section VI by pointing outsome of the weaknesses of our model and bysuggesting areas worthy of future research.
II. THE CONCEPTUAL FRAMEWORK.
(i) Worker Heterogeneity
To keep the framework simple and to focus onlabour-market dynamics, assume that labour is theonly input in the production process. However, wewant to capture the notion that not all workers areequally able. Thus, we assume that workers varyaccording to ability, with ability measured on a 0 to1 scale. The least able worker is assigned a produc-tivity index of zero, while the most able worker hasan ability index of 1. In our framework, ability isrelated to productivity. A worker with higher abilityproduces more output and therefore earns a higherwage than a worker with lesser ability. Further-more, the strength of the relationship between out-put and ability varies across sectors of the economy.In some sectors, output is largely insensitive toability, with a high-ability worker not much moreproductive than a low-ability worker. In other sec-tors, even a small increase in ability might yield largeincreases in output. These intersectoral differenceshelp determine how different workers choose amongalternative job opportunities.
(ii) Choosing a Career Path
For simplicity, we assume that there are only twosectors in the economy. We refer to the first sector
as the ‘low-tech’ sector. In this sector, the premiumpaid for higher ability is small. That is, substantiallyhigher ability yields only a small increase in outputand therefore a small increase in the wage. Inaddition, this sector requires little formal training andjobs are easy to find. By contrast, the second sector(which we refer to as the ‘high-tech’ sector) placesa large premium on ability, requires time-consumingand expensive training, and jobs are not instantlyavailable. Any unemployed worker has to decidewhether to invest a very small amount of time andresources to obtain a job in the low-tech sector, orwhether it is worthwhile to invest a larger amount oftime and resources to try to obtain a job in the high-tech sector.
The basic idea that we are trying to capture with thisset-up is that most workers face a clear-cut careerchoice at some point in life. They can opt to take alow-paying job in a sector in which jobs are tediousand not very complex. Or, they can choose to investin general skills that will enable them to land a morechallenging high-paying job after training has beencompleted. Low-paying jobs are not hard to find, butthey do not typically last very long either.10 High-paying jobs may take more time and effort to find(since the matching problem is harder to solve) butthey last a relatively long period of time. Since low-paying jobs do not require much skill, high-abilityworkers cannot really produce much more thantheir low-ability counterparts. In contrast, since jobsin the high-tech sector are more complex, abilityplays a large role in determining output. We summa-rize in Table 1 the assumptions that distinguish thetwo sectors.
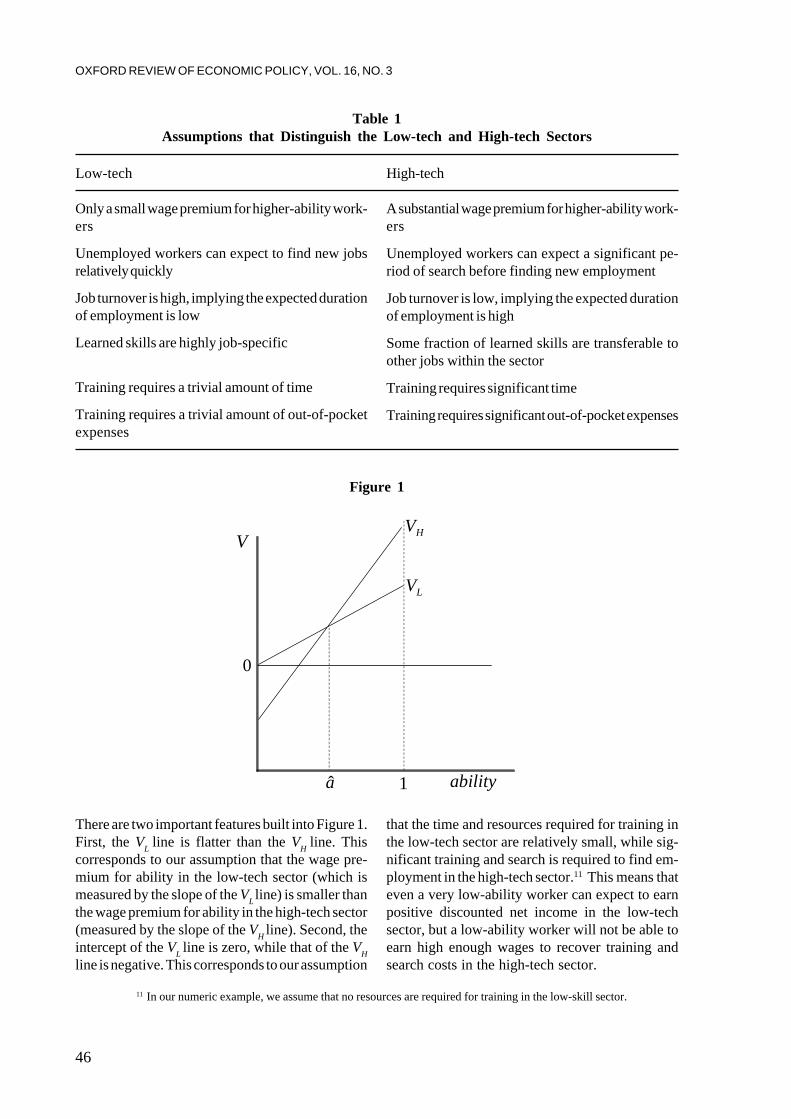
We illustrate the decision process facing a typicalunemployed worker in Figure 1, where ability ismeasured on the horizontal axis. The vertical axismeasures the discounted lifetime income that aworker expects to earn in either sector. The linelabelled VL represents the relationship betweenability and discounted lifetime income in the low-tech sector, while the line labelled VH represents thecounterpart for the high-tech sector.
9 We refer the interested reader to our earlier paper for the formal details of the model.10 Of course, many low-ability workers face difficulty finding any job whatsoever and therefore face a long expected duration
of unemployment whenever they lose their job. We believe that this is largely due to their work history and overall ability level.By assuming that low-tech jobs are plentiful (so that the expected duration of unemployment is low in the low-tech sector), weare trying to capture the notion that the marginal worker (who has the ability to train for high-tech jobs) would be able to findmenial employment quite easily if he chooses to do so.
46
OXFORD REVIEW OF ECONOMIC POLICY, VOL. 16, NO. 3
Table 1Assumptions that Distinguish the Low-tech and High-tech Sectors
Figure 1
Low-tech
Only a small wage premium for higher-ability work-ers
Unemployed workers can expect to find new jobsrelatively quickly
Job turnover is high, implying the expected durationof employment is low
Learned skills are highly job-specific
Training requires a trivial amount of time
Training requires a trivial amount of out-of-pocketexpenses
High-tech
A substantial wage premium for higher-ability work-ers
Unemployed workers can expect a significant pe-riod of search before finding new employment
Job turnover is low, implying the expected durationof employment is high
Some fraction of learned skills are transferable toother jobs within the sector
Training requires significant time
Training requires significant out-of-pocket expenses
V HV
LV
a 1 ability
0
There are two important features built into Figure 1.First, the VL line is flatter than the VH line. Thiscorresponds to our assumption that the wage pre-mium for ability in the low-tech sector (which ismeasured by the slope of the VL line) is smaller thanthe wage premium for ability in the high-tech sector(measured by the slope of the VH line). Second, theintercept of the VL line is zero, while that of the VHline is negative. This corresponds to our assumption
that the time and resources required for training inthe low-tech sector are relatively small, while sig-nificant training and search is required to find em-ployment in the high-tech sector.11 This means thateven a very low-ability worker can expect to earnpositive discounted net income in the low-techsector, but a low-ability worker will not be able toearn high enough wages to recover training andsearch costs in the high-tech sector.
11 In our numeric example, we assume that no resources are required for training in the low-skill sector.

47
C. Davidson and S. J. Matusz
In a long-run equilibrium, workers self-select intoeach sector according to ability. The two lines inFigure 1 cross at a critical level of ability, which wecall â. Rational workers with ability below â chooseto train for a career in the low-tech sector whileworkers with ability above â choose to train for acareer in the high-tech sector. A worker with abilityâ is indifferent between the two sectors.
(iii) Labour Market Dynamics
Once a worker chooses a career path, he or sheenters a sector and begins training. After the train-ing process is complete, he or she secures a job andbegins producing output and earning income. Atsome point, that worker may lose her job or chooseto switch careers. In either case, that worker mustmake another career decision, which may requireretraining or another significant period of job search.Thus, over time, a typical worker in our modelspends time cycling between periods of training,search, and employment, with job-market turnoverrates determining the amount of time spent in eachactivity.
The dynamics that occur within a given sector areillustrated in Figure 2. At any given moment, a
worker is either in the training process, searching fora job, or employed. As the training process iscompleted, the worker searches for a job. Once ajob is found, the worker becomes employed andstarts to earn income. When the job dissolves, theworker must either retrain, or, if her skills aregeneral enough to transfer across jobs, re-enter thesearch process.
The rate at which workers flow between training,search, and employment is determined by fourparameters. The expected duration of training de-termines the average rate at which workers flow outof training and into search.12 The expected durationof unemployment determines the average rate atwhich workers flow out of unemployment and intoemployment. The expected duration of a job deter-mines the rate at which workers lose their job.Finally, the share of skills that transfer from one jobto another within the sector determines how theoutflow of workers from employment is divided intothose who re-train and those who simply start thesearch process immediately upon separation. Sincethere are four parameters for each sector, the totalnumber of parameters necessary to simulate themodel is four times the number of assumedsectors.
Figure 2
Searching
Training
Employed
12 For example, suppose that a technical school offers a 3-month certification programme and enrols 100 students in every 3-month session. Then the size of the ‘training’ box in Figure 2 is always 100. The flow out of the training box is 400 per year. Inthis case, the duration of training is one-quarter of a year. The yearly flow out of the box is four times the size of the box. Technically,this inverse relationship between the flow and duration is a manifestation of our assumption in Davidson and Matusz (2000) thattransitions between one box and another follow a Poisson process.

48
OXFORD REVIEW OF ECONOMIC POLICY, VOL. 16, NO. 3
Keeping with our interpretation of the low-tech andhigh-tech sectors, the duration of unemployment isassumed to be zero in the low-tech sector, while itis significantly positive in the high-tech sector.13
Similarly, the duration of training is very small in thelow-tech sector, while it is much larger in the high-tech sector. In addition, we assume that high-techjobs last significantly longer than low-tech jobs. Wenow add one last assumption about job characteris-tics. We assume that the skills required for low-techjobs are job-specific, so workers must retrain uponseparation. In contrast, we assume some high-techskills are general, implying that only a fraction ofworkers who become separated in the high-techsector require re-training. This last assumption cap-tures the notion that working at one low-tech jobdoes nothing to help prepare you for another low-tech job (flipping hamburgers at McDonald’s willnot help you learn how to stock shelves in a grocerystore), while many skills required for high-techemployment transfer easily across jobs (a lawyerneed not re-enter law school if she switches lawfirms).
(iv) Labour-market Response to Policy Shocks
In a long-run equilibrium, the flow out of each box inFigure 2 equals the flow into the box, so that the sizeof the box does not change.14 However, for eachsector the combined size of the three boxes dependson the value of â. A reduction in â means that moreworkers choose the high-tech sector, with fewerchoosing the low-tech sector, eventually leading tomore workers in each of the three categories in thehigh-tech sector and fewer in the low-tech sector.
Why might â fall? One possible explanation startsfrom a premise that the economy under study is animporter of the good produced in the low-techsector. Suppose that there is initially a tariff restrict-ing imports of this good. Removal of the tariff wouldresult in a lower domestic price for this good and,ultimately, lower wages for those producing thisgood.15 This means that the curve labelled VL wouldshift down and â would fall.16 This is illustrated inFigure 3, where the critical value for ability becomesâ*.
13 This means that the box labelled ‘searching’ is empty for the low-tech sector.14 We are abstracting from the possibility of population or technology growth.15 We assume that the country under study is small relative to the rest of the world, so there are no terms-of-trade effects from
removing the tariff.16 If we deflate by a price index to measure real income, VH would increase as well, since real income for workers in the export
sector increases when the price of the importable falls.
Figure 3
V HV
LV
a 1
0
*a ability

49
C. Davidson and S. J. Matusz
However, the transition between equilibria is notimmediate. All workers with ability levels betweenâ* and â who had been training in the low-techsector will immediately switch to training in the high-tech sector. However, if the policy-induced changein prices (and therefore wages) is small enough, noworker who was actually employed in the low-techsector at the time of the policy change would chooseto quit and train for a job in the high-tech sector.Rather, those workers will wait until they are invol-untarily separated from their job before moving tothe high-tech sector.17 For the low-tech sector, thebox labelled ‘training’ in Figure 2 shrinks immedi-ately to its new equilibrium size, while the boxlabelled ‘employed’ only shrinks gradually.
New entrants to the high-tech sector begin astrainees, causing this box in Figure 2 to swell. Asthey gradually complete training, they become search-ers. The box labelled ‘training’ begins to shrinkagain, while that labelled ‘searching’ begins toexpand. Finally, as workers find jobs, the ‘em-ployed’ box expands while the ‘searching’ boxshrinks.
Immediately after the policy change, national in-come net of training costs (and evaluated at worldprices) is bound to fall, since fewer workers areactually employed and more workers are undertak-ing relatively costly training. In the long run, how-ever, national income net of training costs mustincrease because of the removal of the distortion.18
III. A NUMERIC ILLUSTRATION: THEBASE CASE
(i) Selecting the Parameters
In what follows, we present a numeric example inorder to illustrate the effects of removing a 5 percent import tariff on the low-tech good. To do so, we
solved the model formally developed in Davidsonand Matusz (2000) for a set of parameters chosento mimic real world labour markets. We present theresults of the base case in this section, then conductsome sensitivity analysis in the following section.
As noted earlier, there are eight key parameters thatdrive the model.19 We begin with the low-techsector. In this sector, we assume that jobs are foundimmediately, that training requires 1 week on aver-age, and that the average job lasts 1 year. Incontrast, we assume jobs in the high-tech sector last,on average, 10 years. The latter assumption aboutaverage job duration is consistent with evidencepresented by Davis et al. (1996) regarding theaverage duration of employment in US manufactur-ing. We assume that the average spell of unemploy-ment in the high-tech sector is 6 months. Thisnumber is a bit high for the USA (where the averageduration of unemployment is closer to 3 months), butreducing this value to something more realisticcauses the equilibrium unemployment rate for thebase-case economy to drop below 2 per cent.Finally, we assume that the average length of timespent in training for the high-tech sector is 3 months.
(ii) Results
The results of our numeric exercise are illustrated inFigures 4 and 5. Figure 4 shows that the unemploy-ment rate shoots up immediately following tradeliberalization, but begins to drop after 1 year. Itclosely approximates the new long-run level afterroughly 4 years.
Two features stand out in Figure 4. First, thelength of the adjustment period is neither trivial,nor does it appear to be excessive. Second, themagnitude of the short-run effect is noticeable. Theunemployment rate climbs nearly three-quarters ofa percentage point during the first year after liber-alization before returning to a level less than two-
17 Again, the only workers affected by the change are those with an ability index between â* and â.18 We show in Davidson and Matusz (2000) that the laissez-faire equilibrium in this economy is dynamically efficient. It therefore
follows that any short-run adjustment costs must be outweighed by the long-run gains from liberalization. See Davidson and Matusz(2000) for details.
19 There are a number of secondary parameters in the model as well. For example, we need to assume something about the resourcecost of training in each sector and we need to assume something about output per worker with a given ability. We also need to selecta discount rate. Regarding resource costs of training, we assume that there are none in the low-skill sector, but in the high-skill sectorresource costs are roughly 9–10 months of income for a worker of average ability employed in that sector. We assume values forthe productivity parameters such that a worker of average ability employed in the high-skill sector has a marginal product about8–9 times as high as a worker of average ability employed in the low-skill sector. Finally, we assume a discount rate of 3 per cent.

50
OXFORD REVIEW OF ECONOMIC POLICY, VOL. 16, NO. 3
Figure 4
Figure 5
3.50
3.75
4.00
4.25
4.50
4.75
5.00
0 1 2 3 4 5 6 7 8 9 10
Percent Unemployed
Number of Years After Liberalization
98.0
98.5
99.0
99.5
100.0
100.5
0 1 2 3 4 5 6 7 8 9 10
Number of Years After Liberalization
Income NetOf Training Costs
tenths of a percentage point higher than in theinitial long-run equilibrium.20
Figure 5 shows the path taken by net nationalincome. We have graphed net national income as a
20 Note that the economy-wide unemployment rate is a weighted average of the sector-specific unemployment rates. The long-run unemployment rate is slightly higher subsequent to liberalization because, in the current example, the unemployment rate isassumed to be zero in the low-tech sector, but it is positive in the expanding high-tech sector.
51
C. Davidson and S. J. Matusz
percentage of the long-run level of income at theinitial equilibrium. Net national income dips nearly 2per cent within 1 year after liberalization, but ex-ceeds the pre-liberalization level after approximately4 years. Discounting income through the infinitefuture, the present discounted value of income afterthe policy change is 0.02 per cent higher than thepresent discounted value of income would havebeen had there been no change.21 In other words, inthis example, adjustment costs are almost as largeas the gross benefits from liberalization.22
To provide some sense of comparison with ananalysis that ignores the short-run transition costs ofadjustment, the long-run value of net discountedincome is 0.15 per cent higher with free trade thanit is under distorted trade. This would be the welfaregain if the economy were able immediately to jumpto the new equilibrium. However, adjustment costs(discounted over the infinite future) are 0.125 percent of the value of net discounted income (evalu-ated at the distorted equilibrium).23 This resultunderscores the potential importance of adjustmentcosts and lends some credence to our argument thatthe adjustment process is worthy of more carefulconsideration than it has received by academictrade economists.
IV. VARYING THE SPEED OFADJUSTMENT
As we noted in the introduction, the speed withwhich labour markets adjust to shocks appears tovary across countries. The United States might liecloser to the fast end of the spectrum, with spells ofunemployment and job tenure both being relativelyshort-lived. The opposite appears to be the case
with European countries. Typical spells of Euro-pean unemployment are longer, but job tenure is alsolonger compared with the United States (see, forexample, Freeman, 1994). Labour and macro-economists recognize that this difference in labour-market flexibility has important implications for awide variety of issues such as job training andmacroeconomic performance (see, for example,Layard et al., 1991). In this section, our goal is toshow that the degree of labour-market flexibilityalso has important implications for the gains fromtrade liberalization, adjustment costs, and the rela-tive importance of the two measures. To do so, weexplore the sensitivity of our results to changes in thespeed with which labour markets adjust. We findthat the economies with the most to gain fromliberalization are those that adjust either very quicklyor very slowly. Economies in the mid-range have theleast to gain from liberalization. We provide theintuition for this result in section V.
To focus on the speed of adjustment, we create anew variable called ‘speed’. This variable can beused to scale up or down the speed of adjustmentassumed in the base case. Only three parametersare affected by ‘speed’—the expected duration ofa job in the low-tech sector, the expected duration ofa job in the high-tech sector, and the expectedduration of unemployment in the high-tech sector.24
When, for example, ‘speed’ equals one half, jobs inboth sectors are expected to last twice as long as inthe base case, and the duration of unemployment isexpected to be twice as long as in the base case.Likewise, for ‘speed’ in excess of one, the expectedjob duration falls in both sectors (relative to the basecase), as does the expected duration of unemploy-ment. By changing all duration variables proportion-ately, we hold constant the expected duration of a
21 In undertaking this calculation, we used the same 3 per cent discount rate that we assumed drove individual decision-making.Our results could be reversed if we assume that policy-makers have higher discount rates than workers.
22 As we noted in footnote 8, we have shown elsewhere that the gross benefits of liberalization always dominate the adjustmentcosts, albeit the magnitude of the difference may be tiny. The intuition for this result is that, other than the tariff, there are nodistortions in our model economy. As such, the equilibrium is dynamically efficient. That is, if we start from a steady stateequilibrium and think about moving a worker at the margin from one sector to the other, the discounted value of output (net ofadjustment costs) lost in the sector from which the worker is removed just matches the discounted value of output (net of adjustmentcosts) into which the worker is placed. Since the non-distorted equilibrium is efficient, removing the tariff necessarily raises thevalue of output net of adjustment costs.
23 We measure adjustment costs as follows. We calculate the present discounted value of income at the new long-run equilibrium.We then calculate the present discounted value of income along the actual transition to the new long-run equilibrium. The differencebetween the two values is the cost of adjustment. We measure this value relative to the present discounted value of the distortedlong-run equilibrium income. This method of measuring adjustment costs was suggested by Neary (1982).
24 We continue to assume that the expected duration of unemployment in the low-skill sector is zero.
52
OXFORD REVIEW OF ECONOMIC POLICY, VOL. 16, NO. 3
low-tech job relative to that of a high-tech job, andthe expected duration of employment in the high-tech sector relative to the expected duration ofunemployment in that sector. Note, however, thatwe do not change the expected duration of training.Therefore, as an economy adjusts faster, the ex-pected duration of training increases relative to theexpected durations of employment and unemploy-ment. We hold the length of training fixed becausewe believe that this value depends on the nature ofthe production process and the skills involved ineach sector, and that it has little to do with thestructure of the labour market.
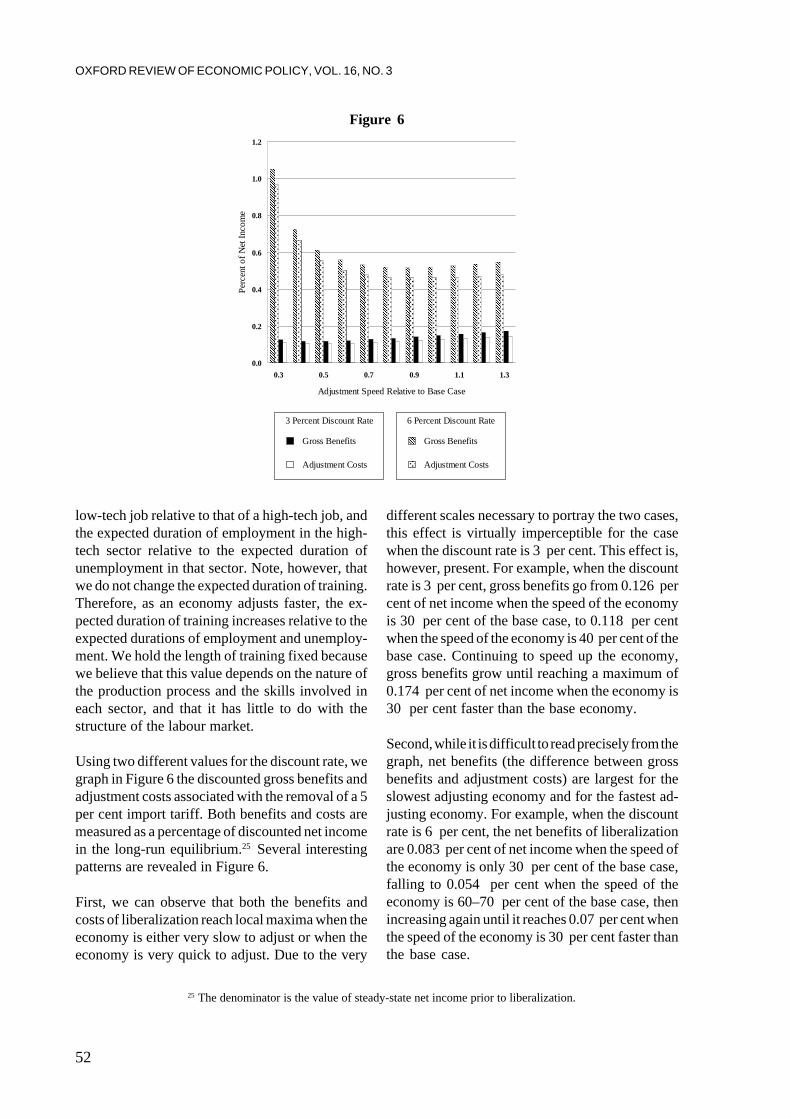
Using two different values for the discount rate, wegraph in Figure 6 the discounted gross benefits andadjustment costs associated with the removal of a 5per cent import tariff. Both benefits and costs aremeasured as a percentage of discounted net incomein the long-run equilibrium.25 Several interestingpatterns are revealed in Figure 6.
First, we can observe that both the benefits andcosts of liberalization reach local maxima when theeconomy is either very slow to adjust or when theeconomy is very quick to adjust. Due to the very
different scales necessary to portray the two cases,this effect is virtually imperceptible for the casewhen the discount rate is 3 per cent. This effect is,however, present. For example, when the discountrate is 3 per cent, gross benefits go from 0.126 percent of net income when the speed of the economyis 30 per cent of the base case, to 0.118 per centwhen the speed of the economy is 40 per cent of thebase case. Continuing to speed up the economy,gross benefits grow until reaching a maximum of0.174 per cent of net income when the economy is30 per cent faster than the base economy.
Second, while it is difficult to read precisely from thegraph, net benefits (the difference between grossbenefits and adjustment costs) are largest for theslowest adjusting economy and for the fastest ad-justing economy. For example, when the discountrate is 6 per cent, the net benefits of liberalizationare 0.083 per cent of net income when the speed ofthe economy is only 30 per cent of the base case,falling to 0.054 per cent when the speed of theeconomy is 60–70 per cent of the base case, thenincreasing again until it reaches 0.07 per cent whenthe speed of the economy is 30 per cent faster thanthe base case.
Figure 6
�����������������������������������������������������������������
���������������������������������������������
������������������������������������������������
���������������������
����������������������������
�����������������������������������
�����������������������������������
��������������
���������������������
����������������������������
�����������������������������������
������������������������
���������������������������
����������������������������
�����������������������������������
������������������������������
������������
������������������
������������������������
������������������������������
������������������������������������
������������
0.0
0.2
0.4
0.6
0.8
1.0
1.2
0.3 0.5 0.7 0.9 1.1 1.3
Adjustment Speed Relative to Base Case
Perc
ent o
f Net
Inco
me
Gross Benefits
Adjustment Costs
3 Percent Discount Rate ������������
Gross Benefits
Adjustment Costs
6 Percent Discount Rate
25 The denominator is the value of steady-state net income prior to liberalization.

53
C. Davidson and S. J. Matusz
Finally, the magnitudes of both costs and benefitsare fairly sensitive to the assumed discount rate.With a 6 per cent discount rate, the gross benefitsuniformly exceed 0.5 per cent of discounted netincome, and in some instances exceed 1 per cent ofdiscounted net income.
Why are these results important? In essence, theseresults indicate that economies that have very flex-ible labour markets (such as the USA) or veryslothful labour markets have the most to gain fromtrade liberalization. Sluggish economies that fallsomewhere between these two extremes have littleto gain from liberalization, since the long-term ben-efits are almost completely off-set by the short-runcosts of adjustment. In the next section, we providean intuitive explanation of these results.
V. EMPLOYMENT AS AN ASSET
Why are the gross benefits and adjustment costsassociated with liberalization U-shaped with respectto changes in the speed? Why do the gross benefitsand adjustment costs increase as the discount rateincreases?
The forces that drive these results can best beunderstood by thinking of a job as an asset thatgenerates a return. The value of the asset dependson four factors. The first, and most obvious factor isthe magnitude of the return (the wage). The higherthe wage rate the more valuable the asset. Theduration of the job is the second factor—the longerthe worker expects the job to last, the more valuableit is. The third factor is the expected duration of timeit takes to secure the job. In our framework, this isthe total time that it takes to complete the trainingand search processes. The return is pushed furtherinto the future as training and search times increase.As such, the asset becomes less valuable. Finally,the discount rate matters, with a higher discount ratereducing the value of the asset.
When workers choose a sector to train in, they takeinto account the asset value of the job that theywould eventually secure in either sector. When theadjustment process is slowed down, the returns forboth assets (high-tech and low-tech jobs) are pusheduniformly further into the future. As such, the twoassets become more nearly equal to each other in
value. In the limit, if the returns are pushed into theinfinite future, neither asset has any value. In termsof Figures 1 and 3, the curves representing thediscounted lifetime income expected from either jobflatten out. In essence, the premium for abilitydiminishes. Now, even a very small reduction in thewage paid in the low-tech sector will elicit a largeresponse in terms of the range of abilities that wouldnow be better suited to the high-tech sector. Thetariff is very distorting in this case and removing itgenerates a large benefit. Of course, moving a largenumber of workers slowly between sectors alsogenerates a large adjustment cost.
When the economy speeds up, workers spend alarger fraction of their life retraining, since employ-ment spells become so brief. And, since trainingcosts are independent of ability, this means that twoworkers with different ability levels start to evaluatethe assets in exactly the same manner. In otherwords, a worker’s evaluation of the two sectorsdepends less and less on that worker’s ability. Itfollows that a reduction in the wage paid in the low-tech sector (brought about by liberalization), whichhas a negative impact on the value of jobs in thissector, causes workers with a wide range of abilitylevels to leave that sector. So, again, a large rangeof ability is affected and the tariff is once again verydistorting. Adjustment costs, however, are not quiteas large as in the slothful economy. This followsbecause the time required to shift a given number ofworkers from the low-tech to the high-tech sector isshorter in the flexible economy.
In the intermediate range, relatively few abilitylevels are affected by the liberalization. This followsbecause the return from training is far enough intothe future that the negative impact on the value of alow-tech job is muted, but not so far into the futurethat the premium for ability is dramatically reduced.
The intuition provided in the preceding paragraphs issupported by a comparison of the results when thediscount rate is 3 per cent with the results when thediscount rate is 6 per cent. Raising the discount ratereduces the importance of the future. This has aneffect similar to that of pushing returns further intothe future while holding the discount rate constant.As expected, the distorting effect of the tariff isbigger when the discount rate is higher. This is theunderlying reason why the benefits of liberalization

54
OXFORD REVIEW OF ECONOMIC POLICY, VOL. 16, NO. 3
are uniformly higher when the discount rate is 6 percent compared with an economy where the discountrate is 3 per cent. But the bigger distortion meansthat more people need to make the transition fromthe low-tech to the high-tech sector, implying thatadjustment costs are also higher.
One final point is worth discussing before leavingthis section. It is natural to think that increases in thediscount rate would diminish the net benefits ofliberalization. One might even be tempted to believethat a sufficiently high interest rate could reverse theresults so that the discounted adjustment costsactually exceed the discounted gross benefits. Afterall, the adjustment costs occur early in the process,whereas the benefits do not occur until some pointin the future. This is clearly evident in Figure 5where national income net of training costs fallsbelow its initial steady-state value until sometimearound the third or fourth year after liberalization, atwhich point income finally exceeds the initial steady-state value. The key to understanding why higherdiscount rates do not necessarily diminish the netbenefit of liberalization is in understanding that theshape of Figure 5 is intimately tied to the discountrate. With a higher discount rate, jobs in the high-tech sector become relatively less enticing sinceincome is not earned until after a lengthy training andsearch process. As such, the equilibrium size of thelow-tech sector increases. The distorting effect ofthe tariff is larger since it applies to a larger share ofthe economy. Consequently, removal of the tariffyields larger gross benefits for an economy whenthe discount rate is higher. Increasing that rate willresult in greater losses early on but also greaterbenefits later. As we note in the introduction andagain in footnote 22, the discounted net benefits ofliberalization always exceed discounted adjustmentcosts in the context of our model.
VI. CONCLUSION
Workers face employment risk for a wide variety ofreasons, including changes in the pattern of trade;and, when workers lose their jobs, they often facesignificant financial losses. This means that a coun-try that attempts to increase its citizens’ standard of
living by liberalizing trade may impose significantcosts of adjustment on some of its workers. Inresponse to this dilemma, most developed countriesoffer some form of social safety net that is intendedto ease the transition from one job to another. Bynow, it is well documented that such social pro-grammes can have unintended consequences. Forexample, the public provision of unemploymentinsurance reduces the opportunity cost of unem-ployment. This causes workers to reduce theirsearch effort and increases the equilibrium level ofunemployment.26 A large literature has emerged inlabour economics devoted to an investigation of howpublicly provided social insurance affects labourmarket outcomes. One link that appears to be firmlyestablished is that policies aimed at increasing jobsecurity (such as firing costs imposed in manyEuropean economies) or reducing the losses fromunemployment (such as unemployment insurance)lead to less flexible labour markets (see, for exam-ple, Ljungqvist and Sargent, 1998).
In this paper, we have argued that the degree oflabour-market flexibility has important implicationsfor the gains from trade liberalization and the adjust-ment costs associated with changes in trade pat-terns. It follows that many social programmes aimedat the labour market may have unintended spillovereffects with respect to trade policy. In particular,economies with generous social programmes maymake their labour markets sluggish and this mayreduce the gains that such economies can attainfrom trade liberalization. The reason for this is thatby reducing labour-market flexibility, social pro-grammes greatly increase the length of time it takesfor the economy to adjust to changes in the patternof trade. As a consequence, the adjustment coststriggered by liberalization become so large thatthey eat away almost all of the gains from freertrade.
The results reported in this paper were derived bysimulating the model that was introduced in ourcompanion paper (Davidson and Matusz, 2000).The model contains many simplifying assumptionsthat are used to keep the model tractable. One of thekey assumptions is that a worker’s ability affectsonly the output produced by that worker. In reality,
26 See Davidson and Woodbury (1996) for a survey of the empirical evidence on the relationship between unemploymentinsurance and unemployment.
55
C. Davidson and S. J. Matusz
REFERENCES
Baily, M., Burtless, G., and Litan, R. (1993), Growth with Equity, Washington, DC, Brookings Institution.Baldwin, R., and Magee, C. (1999), ‘Explaining Congressional Voting on Trade Bill in the 1990s: From NAFTA Approval
to Fast-track Defeat’, University of Wisconsin Working Paper. — Mutti, J., and Richardson, J. D. (1980), ‘Welfare Effects on the United States of a Significant Multilateral Tariff
Reduction’, Journal of International Economics, 10, 405–23.Davidson, C., and Matusz, S. (2000), ‘Globalization, Employment, and Income: Analyzing the Adjustment Process,’
mimeo. — Woodbury, S. (1993), ‘The Displacement Effect of Reemployment Bonus Programs’, Journal of Labor
Economics, 11, 575–605. — — (1995), ‘Wage-rate Subsidies for Dislocated Workers’, in Advisory Council on Unemployment Compensa-
tion: Background Papers (Volume II), Washington, DC, US Department of Labor. — — (1996), ‘Unemployment Insurance and Unemployment: Implications of the Reemployment Bonus Experi-
ments’, W. E. Upjohn Institute for Employment Research Staff Working Paper 96–44.Davis, S., Haltiwanger, J., and Schuh, S. (1996), Job Creation and Destruction, Cambridge, MA, MIT Press.Freeman, R. (1994), ‘How Labor Fares in Advanced Economies’, in R. Freeman (ed.) Working Under Different Rules,
New York, Russell Sage Foundation.Handbook of International Economics: Volumes 1–3, North-Holland.Jacobson, L., LaLonde, R., and Sullivan, D. (1993a), The Cost of Worker Dislocation, W. E. Upjohn Institute for
Employment Research. — — — (1993b), ‘Earnings Losses of Displaced Workers’, American Economic Review, 83, 685–709.Krugman, P. (1993), ‘What Do Undergrads Need to Know about Trade?’, American Economic Review, 83(2), 23–6.Lapan, H. (1976), ‘International Trade, Factor Market Distortions, and the Optimal Dynamic Subsidy’, American
Economic Review, 66, 335–46.Layard, R., Nickell, S., and Jackman, R. (1991), Unemployment: Macroeconomic Performance and the Labor Market,
Oxford, Oxford University Press.Ljungqvist, L., and Sargent, T. (1998), ‘The European Unemployment Dilemma’, Journal of Political Economy, 106(3),
514–50.Magee, S. (1972), ‘The Welfare Effects of Restrictions on US Trade’, Brookings Papers on Economic Activity, 3, 645–
701.
we would expect ability to affect other variables aswell. For example, high-ability workers tend to learnquicker and probably enjoy learning more than theirlow-ability counterparts. This suggests that trainingcosts are probably lower for high-ability workers,regardless of the skills that must be learned. Inaddition, all else equal, lower-ability workers prob-ably have a harder time finding re-employment thantheir high-ability counterparts. This suggests that aworker’s average duration of unemployment isprobably also related to ability. A more generalmodel would include both of these features.
It is only natural to wonder whether or not our resultswould generalize to more complex settings thatallow ability to play a greater role in labour-marketoutcomes. There are two main results that we haveoffered. First, we have argued that the flexibility of
an economy’s labour market affects the gains fromtrade liberalization, the cost of adjustment, and therelative value of these two measures. Second, wehave shown that, in our model, the net gains fromtrade are largest for economies with labour marketsat the opposite ends of the flexibility scale. That is,the most slothful and the most flexible economieshave the most to gain from trade liberalization.Sluggish economies have the least to gain, becausethe long-run benefits are almost completely offsetby the short-run costs of adjustment. It should beclear that our first result would generalize to morecomplex settings. Labour-market flexibility matters,not only for the level of adjustment costs but for thegains from liberalization as well. However, whetheror not our second result generalizes is an openquestion and is one of the focuses of our currentresearch programme.

56
OXFORD REVIEW OF ECONOMIC POLICY, VOL. 16, NO. 3
Matusz, S., and Tarr, D. (2000), ‘Adjusting to Trade Policy Reform’, in A. Krueger (ed.), Economic Policy Reform: TheSecond Stage, University of Chicago Press, forthcoming.
Mussa, M. (1993), ‘Making the Practical Case for Freer Trade’, American Economic Review, 83(2), 372–76.Neary, J. P. (1982), ‘Intersectoral Capital Mobility, Wage Stickiness, and the Case for Adjustment Assistance’, in J.
Bhagwati (ed.), Import Competition and Response, Chicago, IL, University of Chicago Press.Parsons, D. (1995), ‘Wage Insurance: A Policy Review’, in Advisory Council on Unemployment Compensation:
Background Papers (Volume II), Washington, DC, US Department of Labor.US Department of Labor (1993), ‘The Changing Labor Market and the Need for a Reemployment Response’,
Washington, DC.Winters, L. A., and Takacs, W. E. (1991), ‘Labour Adjustment Costs and British Footwear Protection’, Oxford Economic
Papers, 43, 479–501.