globalization and investment in human...
TRANSCRIPT

Globalization and Investment in Human Capital
Daniel C. Hickman William W. Olney1
April 2010
Abstract
Workers are becoming increasingly concerned about the impact that globaliza-tion has on their domestic labor market. While existing research typically focuseson the effects on labor market outcomes such as wages and employment, we examinewhether American workers respond to globalization by increasing their investment inhuman capital. Specifically, we measure the extent to which offshoring and immigra-tion affect enrollment at institutions of higher education. The results indicate thatboth offshoring and immigration increase enrollment at community colleges, particu-larly among older students. We conclude that workers in the U.S. are responding tooffshoring and immigration by acquiring the skills necessary to compete in a globaleconomy.
Keywords: globalization, higher education, enrollment, offshoring, immigration
JEL Codes: F16, I2, J241Department of Economics, University of Colorado at Boulder, 256 UCB, Boulder, CO, 80309-256
(email: [email protected], [email protected]). We are grateful to FranciscaAntman, Terra McKinnish, and Jeffrey Zax for helpful comments and suggestions.
1 Introduction
Workers in the United States are increasingly competing in an integrated global labor
market. This has led to considerable anxiety among workers and sparked substantial
debate among politicians, the media, and the general public. This debate generally
focuses on how globalization affects domestic wages and employment levels. However,
relatively little is known about how globalization impacts investments in human cap-
ital. Are American workers responding to globalization by investing in the skills and
knowledge that will allow them to succeed in an increasingly global economy? This
paper uses a comprehensive dataset of U.S. higher education institutions to address
this question.
Globalization, particularly in the forms of immigration and offshoring, increases
the effective supply of low-skilled workers available to domestic firms.2 American
firms have a larger pool of low-skilled immigrant workers as well as an increased
ability to shift production facilities to low-skilled labor abundant countries. As a
result, labor market competition caused by globalization has predominantly affected
low-skilled native workers. A natural response is for native workers to acquire the
skills necessary in order to avoid direct competition with foreign workers. The extent
to which American workers have responded to this increased competition by returning
to school is the focus of this paper.
In this analysis, we measure investments in human capital using enrollment at in-
stitutions of higher education. While we expect that, in general, workers are respond-
ing rationally by increasing their level of human capital, it is likely that globalization
will have a heterogeneous effect on enrollments at different types of institutions. In
particular, globalization likely impacts community colleges more than four-year in-
stitutions. The marginal worker affected by globalization is likely to find the short,
2Offshoring refers to the relocation of domestic jobs to foreign countries. This includes movementsof jobs within a firm or to another foreign firm.
1

technical training of community colleges appealing. Furthermore, relative to four-
year institutions, community colleges have a greater ability to adjust admissions in
response to demand. We also examine whether the impact of offshoring and immigra-
tion on enrollment is sensitive to the location of the community college. We expect
that offshoring, which largely affects urban areas, will have a particularly strong im-
pact on enrollment at community colleges located in cities. Immigration, on the other
hand, likely affects enrollments at both urban and rural institutions.
We next examine whether offshoring and immigration have heterogeneous effects
on enrollments across different types of students. In particular, the impact of global-
ization on enrollment may differ depending on the age of the student. Older individ-
uals who face immediate and direct competition due to immigration and offshoring
likely return to school to acquire the skills that make them desirable in the labor
market. Furthermore, immigration and offshoring may have a different effect on en-
rollments of students of different races.
This paper combines data on enrollment with data on immigration and offshoring
to investigate how globalization affects investment in human capital. The data set
used in the analysis is appealing because it incorporates enrollment data from the
universe of higher education institutions in the U.S., it includes substantial variation
in globalization across states, and the years included span exogenous shocks to both
offshoring and immigration caused by China joining the World Trade Organization
in 2001 and changes in immigration policy following 9/11.
The results confirm our expectations. Both offshoring and immigration lead to
significant increases in enrollment at community colleges but have little impact at non-
degree and bachelor institutions. We find evidence that the impact of offshoring on
community college enrollment is particularly large for urban schools, while immigra-
tion increases enrollment at all types of community colleges. Furthermore, community
college enrollment increases primarily through the impact offshoring and immigration
2
have on older students (above 25 years old). We also find that the enrollments of
White, Hispanic, and Asian students all increase by a similar amount in response to
offshoring and immigration, while the enrollment of Black students remains relatively
unchanged. These results indicate that American workers respond to increases in
global competition by returning to school. Furthermore, these findings highlight the
importance of community colleges in retraining native workers.
Numerous authors have studied the impact of globalization on domestic labor
markets. For example, Feenstra and Hanson (1996, 1999) and Slaughter (2000) ex-
amine the effects that outsourcing and multinational activity have on the domestic
wage distribution. Harrison and McMillan (2006) analyze changes in U.S. manufac-
turing employment resulting from changes in foreign affi liate wages. The impact of
immigration on the domestic labor market has also been the focus of much research
over the past few decades. Research by Card (1990, 2005) has generally shown a small
effect on wages and employment of natives, while that of Borjas (2003) and Borjas et
al. (1997) find a larger, more adverse, impact.
In general, research on the relationship between globalization and the domestic
labor market focuses on the implications that global forces have on wages or employ-
ment. In this paper, we instead consider a more long-term implication of globalization
by examining how offshoring and immigration affect the domestic worker’s human
capital investment decision. This particular aspect of the relationship remains rela-
tively unexamined, yet plays a fundamental role in how the domestic labor market
and economy ultimately adjust to increased globalization.
This paper also contributes to the literature examining how enrollments respond
to local labor market conditions. Betts and McFarland (1995) and Kienzl et al.
(2007), for example, attempt to estimate the impact that labor market conditions,
such as unemployment, have on enrollment and attainment, respectively. However,
it is possible that changes in enrollment may affect local labor market conditions.
3
Specifically, increases in enrollment may reduce the unemployment rate or increase
wages. We view offshoring and immigration as an exogenous shock that allows us to
identify the causal effect of these global forces on local enrollment.3 Furthermore, local
labor market indicators may not adequately account for increases in globalization if
workers who are adversely affected by offshoring and immigration immediately return
to school. In particular, offshoring and immigration may directly affect enrollment
without leading to any changes in the unemployment rate.
The remainder of the paper is structured as follows. The anticipated impact of
globalization on enrollment is outlined in Section 2. Section 3 presents the estimation
strategy while Section 4 outlines the data used in this analysis. Section 5 discusses the
estimated impact of offshoring and immigration on enrollments at different institu-
tions and among different types of students. Section 6 presents additional robustness
checks and Section 7 concludes.
2 Conceptual Foundations
Offshoring and immigration are both factors that effectively increase the labor supply
available to domestic firms. As these factors have increased, domestic firms have ac-
cess to additional foreign workers who can be employed both in the home and foreign
country. Furthermore, offshoring and immigration have predominantly entailed relo-
cating low-skilled tasks abroad and the immigration of low-skilled workers.4 These
global forces are a labor supply shock that disproportionately affects low-skilled native
workers.
There is a natural incentive for low-skilled native workers to respond to this in-
creased competition by becoming more skilled. Native workers can avoid direct com-3Black et al. (2005) use fluctuations in coal prices to examine the impact of an exogenous local
shock on high school enrollment.4Card (2005) shows that immigrants are less skilled than natives. Offshoring, to date, largely
occurs in manufacturing industries (Blinder 2005, Amiti and Wei 2009, Olney 2009), and workers inthese industries tend to be less skilled (US Census Bureau 2000).
4
petition with foreign workers by acquiring the training and knowledge that move them
up the skill distribution. Thus, increases in offshoring and immigration will lead to
native workers returning to school. While this is an intuitively appealing result, there
is little empirical evidence supporting this hypothesis.
While we expect college enrollment to increase in response to offshoring and immi-
gration, the impact may be larger at particular types of institutions. The enrollment
response to offshoring and immigration is likely to be strongest at community college
institutions for a number of reasons. First, workers displaced due to globalization
will find the short time frame, the emphasis on technical skills, and the relatively low
cost appealing at community colleges.5 The marginal worker affected by offshoring
and immigration is unlikely to commit the time and money required to attend a
four-year institution. The opportunity costs of attending a four-year institution for
displaced workers are high. Kane and Rouse (1999), for example, discuss the fact
that the availability of night and weekend courses, the low costs of attendance, and
the neighborhood convenience of community colleges are particularly appealing for
many students.
Second, community colleges have the capacity to accommodate new students who
are displaced due to globalization. While many four-year institutions are constrained
by the available housing options, community colleges generally do not face these
supply constraints, and also tend to adopt an open admissions policy (Kane and
Rouse 1999). Community colleges have greater flexibility to add or subtract courses
in response to demand.
Finally, unlike four-year institutions which attract students from various states,
community colleges predominantly draw students from the local region. Thus, local
labor market conditions may have a more substantial effect on community college
enrollment. In contrast, local labor market conditions may affect enrollment at four-
5Jacobson et al. (2005) find that technical, vocation-oriented coursework at the communitycollege level can have a large impact on the long-term earnings of displaced workers.
5

year institutions in a number of different states due to the mobility of students. For all
of these reasons, we expect the response of enrollment to offshoring and immigration
to be more elastic at community colleges than at four-year institutions.
The impact of offshoring and immigration on community college enrollment may
differ depending on the location of the institution. Since community colleges pre-
dominantly serve students from the local region, the implications for enrollment may
differ based on the relative impact of offshoring and immigration in that area. As dis-
cussed previously, offshoring to date is most prevalent in the manufacturing industry
and the majority of manufacturing jobs are located in urban areas. Thus, we expect
offshoring to have a stronger impact on enrollment at community colleges that are
located in cities. On the other hand, immigrants compete for manufacturing jobs in
urban areas, but also for service and agricultural jobs in rural areas. Thus, we ex-
pect immigration to have a fairly homogeneous impact on enrollment at community
colleges in all types of locations.
In addition to heterogeneous institution effects, offshoring and immigration likely
differ in their impacts on various types of students. Specifically, we expect globaliza-
tion to affect enrollment of older students relatively more than enrollment of younger
students. In contrast to high school students, workers with established careers face
acute labor market competition or perhaps displacement due to offshoring and im-
migration. In response to this global competition, these workers return to school for
retraining. However, high school students are unlikely to respond to fluctuations in
offshoring and immigration in such an immediate manner. High school students are
less aware of increases in global competition and they may have diffi culty calculating
changes in the present discounted value of future income streams. Thus, we expect the
impact of globalization on community college enrollment should be stronger among
older cohorts of potential students.
Recent research has focused on the causes of educational attendance and attain-
6
ment differences across various minority groups.6 Globalization may be another,
relatively unexamined factor, affecting the educational investment decisions of par-
ticular racial groups. Therefore, we estimate how offshoring and immigration impact
enrollments of students of different races. We are particularly interested in how en-
rollment responses of minority students compare to the enrollment responses of White
students.
3 Estimation Strategy
We are interested in how globalization affects investment in human capital. Thus, we
estimate the impact of immigration and offshoring on enrollment using the following
equation:
Enrolli,s,t = β0 + β1 Im gs,t−1 + β2Offs,t−1 + Ci,t−1δ + Ls,t−1θ + λi + φt + εi,s,t
The dependent variable, Enrolli,s,t, represents the total undergraduate enrollment at
higher education institution i located in state s in year t. The independent vari-
ables of interest are our measures of globalization. We use two separate measures,
immigration and offshoring, to quantify the degree to which the area surrounding
an institution is affected by global forces.7 These variables are both measured at
the state level. One practical reason for this is that we are limited in our ability to
construct these variables, particularly our measure for offshoring, at a more disag-
gregated geographic level. However, it may well be that the state is the appropriate
level for these variables even if more localized data were available. A large major-
6See Cameron and Heckman (2001) and Card and Krueger (2005).7It is possible that immigration and offshoring may affect enrollments in neighboring states.
However, this type of spillover effect would attenuate our results and thus work against the findingsof this paper.
7
ity of college students, particularly those on the margin of attending, enroll in their
state of residence. Public institutions generally give preferential treatment to state
residents in terms of acceptance, financial aid, and tuition. Thus, most individuals
who would be induced to return to school would consider the choice set to be in-state
institutions.
Given that our globalization variables are measured at the state level, it may seem
natural to aggregate our dependent variable, Enroll, to the same level. We do not
proceed in this manner so that we can include institution-specific information such
as tuition and financial aid in our analysis. The C matrix in the equation above
represents these institutional level variables. We expect that an increase in tuition
will reduce enrollment while an increase in financial aid will increase enrollment.
The standard errors in all regressions that follow are clustered at the state-year
level. This corrects for any correlation in our standard errors that arises from the
fact that our globalization variables are measured at the state-year level while our
enrollment variables are at the institution-year level. Specifically, we are concerned
that there may be some unobserved shock in state s in year t that may be affecting
enrollment at all institutions in that state in a similar manner.
The L matrix includes variables measured at the state level that capture labor
market conditions other than globalization. In order to isolate and identify the ef-
fects of globalization, we include both state unemployment and median income to
account for general economic conditions. A higher unemployment rate, for example,
is an indication of poor labor market conditions and thus will lead to an increase in
enrollment. The final terms in our equation, λ and φ, represent institution and year
fixed effects respectively.
We also lag our independent variables to account for the fact that individual en-
rollment decisions generally take place during the first half of any given year. As a
result, it is more likely that current enrollment is impacted by the changes in off-
8
shoring and immigration from the previous year. In addition, when estimating this
equation, both dependent and independent variables are transformed using the nat-
ural logarithm. This facilitates a more straightforward interpretation of the results.
In particular, the log-log specification allows for more intuitive comparisons of the
magnitude of estimated coeffi cients across heterogeneous groups.
One might be concerned about endogeneity. However, there are a number of im-
portant features of our estimation strategy that minimize this potential bias. First,
offshoring and immigration are usually driven by factors, such as foreign economic
conditions or policy changes, that are exogenous to local labor market conditions.
Second, to the best of our knowledge, no studies have found that immigrantion or
offshoring respond to enrollment in community colleges. However, it may be possible
that immigration and offshoring respond to labor market conditions which might be
correlated with community college enrollment. To account for this, we include the la-
bor market characteristics such as the unemployment rate and the income level in our
regressions, as well as the institution level characteristics of tuition and aid.8 Third,
institution and year fixed effects are included in all regressions. Thus, any factors,
such as access to credit, trends in community college enrollment, or differences in
schools, that do not vary within years or institutions will be controlled for. Fourth,
community college enrollment is measured at the institution level while the globaliza-
tion variables are measured at the state level. It is diffi cult to argue that changes in
enrollment at a community college could substantially affect statewide immigration
and offshoring. Fifth, as discussed, all the independed variables are lagged one year.
It is highly unlikely that the globalization variables from the previous year depends on
current community college enrollment. Sixth, in the results that follow, we slice the
data in a number of ways. It is diffi cult to argue, that a potential endogeneity bias
only arises in the places in which we expect and do find significant results. Given all
8However, the results that follow are robust to the exclusion of these control variables.
9

of these factors, we are confident that a causal impact of offshoring and immigration
on community college enrollment has been identified. With that said, an additional
check for endogeneity is pursued in Section 6.4.
4 Data and Descriptive Statistics
4.1 Institution-Level Data
The data on college enrollment, the dependent variable, come from the National
Center for Education Statistics’ Integrated Postsecondary Education Data System
(IPEDS). This is a longitudinal dataset that provides information on the universe of
higher education institutions in the United States. This includes not only universities,
but also community colleges, vocational schools, and other types of institutions. For
the purposes of this study we collected information on total undergraduate enrollment
by institution. In addition, IPEDS also provides data on average in-state tuition and
average financial aid received by institution and enrollment by various institution
and student characteristics. The enrollment data span the years 2000-2007 and the
48 contiguous states. We restrict the sample to institutions that reported information
for all years, leaving us with a total of 3,475 institutions.
4.2 State-Level Data
We quantify globalization at the state level using measures of offshoring and immigra-
tion. Immigration, the unemployment rate, and the median income are constructed
using data from the 2000 1% sample of the U.S. Census, as well as the American
Community Survey (ACS) from 2001 to 2006.9 Specifically, immigration is defined
as the share of a state’s working age (18 to 65) population that is foreign born. We
9Data were obtained from the IPUMS project at the University of Minnesota Population Center,http://usa.ipums.org/usa/.
10
use the share to account for the fact that the same number of immigrants will have
a much stronger effect in a state with a smaller population. Based on the work by
Card and DiNardo(2000) and Card (2001), we are not concerned that outflows of
native workers in response to immigration could affect our measure. Thus, changes
in the share of foreign born residents will offer a good estimate of the relative size of
immigrant inflows.10
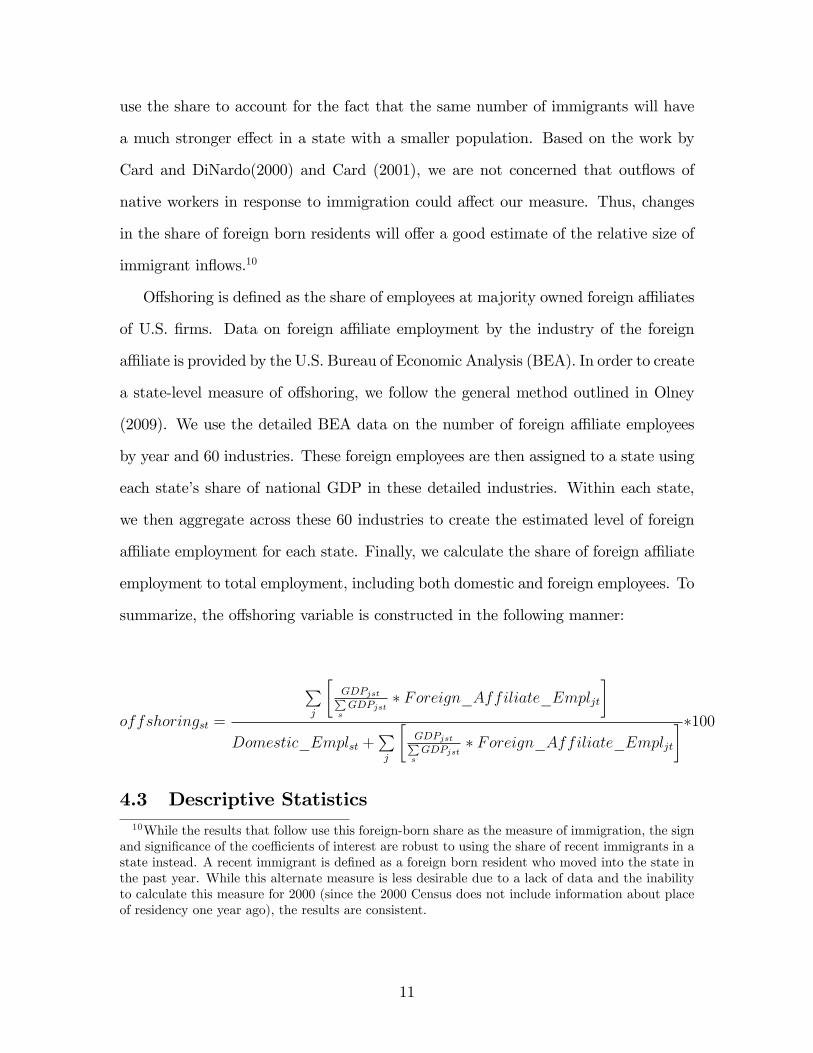
Offshoring is defined as the share of employees at majority owned foreign affi liates
of U.S. firms. Data on foreign affi liate employment by the industry of the foreign
affi liate is provided by the U.S. Bureau of Economic Analysis (BEA). In order to create
a state-level measure of offshoring, we follow the general method outlined in Olney
(2009). We use the detailed BEA data on the number of foreign affi liate employees
by year and 60 industries. These foreign employees are then assigned to a state using
each state’s share of national GDP in these detailed industries. Within each state,
we then aggregate across these 60 industries to create the estimated level of foreign
affi liate employment for each state. Finally, we calculate the share of foreign affi liate
employment to total employment, including both domestic and foreign employees. To
summarize, the offshoring variable is constructed in the following manner:
offshoringst =
∑j
[GDPjst∑sGDPjst
∗ Foreign_Affiliate_Empljt]
Domestic_Emplst +∑j
[GDPjst∑sGDPjst
∗ Foreign_Affiliate_Empljt]∗100
4.3 Descriptive Statistics10While the results that follow use this foreign-born share as the measure of immigration, the sign
and significance of the coeffi cients of interest are robust to using the share of recent immigrants in astate instead. A recent immigrant is defined as a foreign born resident who moved into the state inthe past year. While this alternate measure is less desirable due to a lack of data and the inabilityto calculate this measure for 2000 (since the 2000 Census does not include information about placeof residency one year ago), the results are consistent.
11
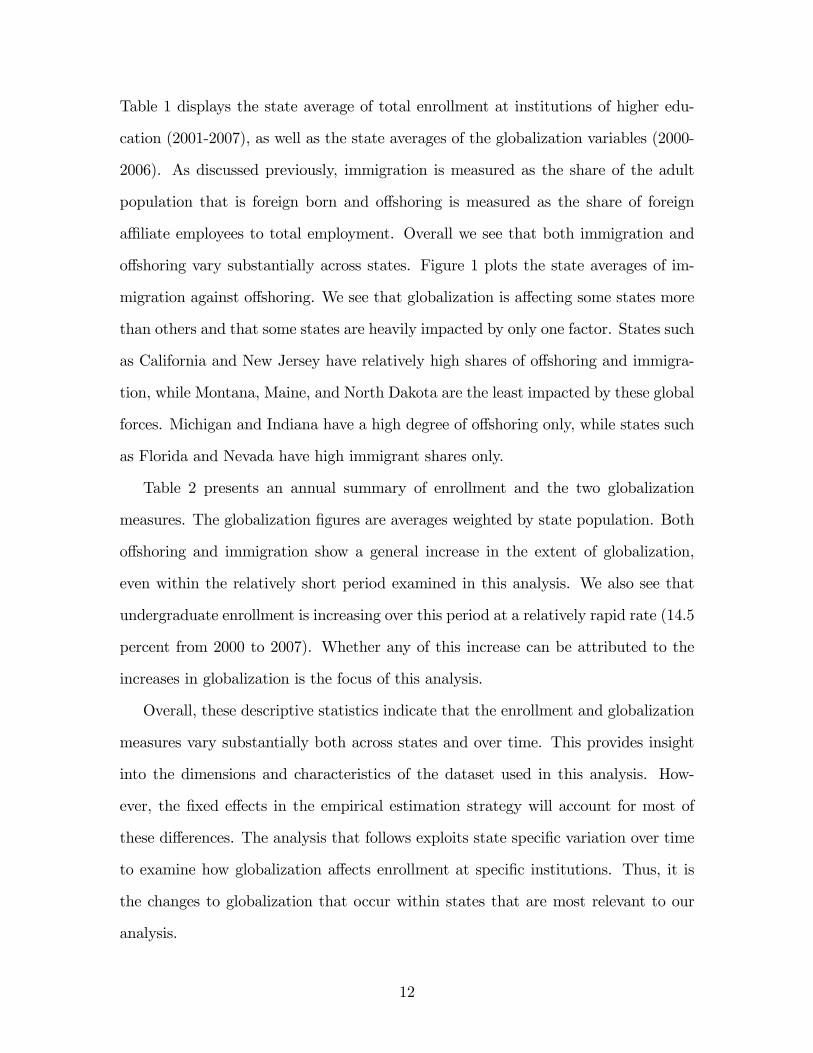
Table 1 displays the state average of total enrollment at institutions of higher edu-
cation (2001-2007), as well as the state averages of the globalization variables (2000-
2006). As discussed previously, immigration is measured as the share of the adult
population that is foreign born and offshoring is measured as the share of foreign
affi liate employees to total employment. Overall we see that both immigration and
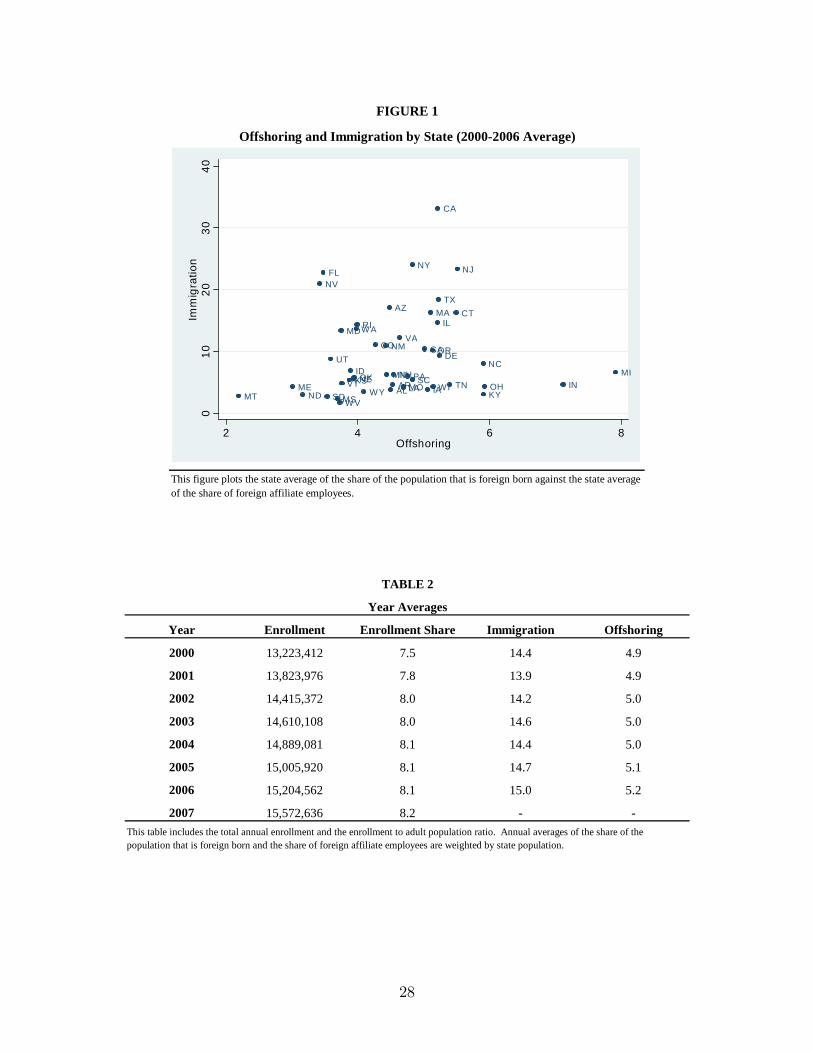
offshoring vary substantially across states. Figure 1 plots the state averages of im-
migration against offshoring. We see that globalization is affecting some states more
than others and that some states are heavily impacted by only one factor. States such
as California and New Jersey have relatively high shares of offshoring and immigra-
tion, while Montana, Maine, and North Dakota are the least impacted by these global
forces. Michigan and Indiana have a high degree of offshoring only, while states such
as Florida and Nevada have high immigrant shares only.
Table 2 presents an annual summary of enrollment and the two globalization
measures. The globalization figures are averages weighted by state population. Both
offshoring and immigration show a general increase in the extent of globalization,
even within the relatively short period examined in this analysis. We also see that
undergraduate enrollment is increasing over this period at a relatively rapid rate (14.5
percent from 2000 to 2007). Whether any of this increase can be attributed to the
increases in globalization is the focus of this analysis.
Overall, these descriptive statistics indicate that the enrollment and globalization
measures vary substantially both across states and over time. This provides insight
into the dimensions and characteristics of the dataset used in this analysis. How-
ever, the fixed effects in the empirical estimation strategy will account for most of
these differences. The analysis that follows exploits state specific variation over time
to examine how globalization affects enrollment at specific institutions. Thus, it is
the changes to globalization that occur within states that are most relevant to our
analysis.
12

Figure 2 presents the percentage changes from 2000 to 2006 for both measures of
globalization. While our regression analysis will exploit changes from year to year, the
long differences shown here are still useful for illustrating the general level of variation
across states. The plot shows that states varied greatly in how their economies were
impacted by globalization changes over the period. There are only a handful of
states for which the immigration and offshoring measures declined, but there are a
substantial number that experienced a decline in one measure and an increase in
the other. The fact that the percentage changes in the two measures are not highly
correlated (r = 0.303) indicates that we are able to separately identify the impacts
of the two main aspects of globalization. While globalization has had an increasing
impact on the U.S. labor market, this figure is an indication that this impact has not
been felt equally across states. We next present the results indicating the extent to
which the differential impacts on states has affected investment in higher education.
5 Results
The basic empirical estimation strategy presented in Section 3 is used to test a variety
of specifications. First, we examine the impact of globalization on enrollment by vari-
ous institutional characteristics, including the highest degree offered and the location
of the institution. Second, we investigate the impact of globalization on enrollments
of different types of students, examining how enrollment responses differ by age and
race.
5.1 Results by Type of Institution
We begin by examining the impact of globalization on all institutions that report total
undergraduate enrollment, average tuition, and average financial aid. The results are
presented in the first column of Table 3. As discussed in Section 3, both dependent
13

and independent variables are in natural log form, so the coeffi cients are interpreted
as elasticities. This means, for example, that a 10 percent increase in the foreign-born
share of the population in a state leads to a 0.5 percent increase in enrollment at each
higher education institution within that state. This result is significant at the 10
percent level. The offshoring coeffi cient is positive but insignificant. The coeffi cients
on unemployment and tuition are significant and of the expected sign, while those
for the financial aid and median income variables are insignificant. While we might
expect these controls to significantly contribute to enrollment fluctuations, they may
not be changing much over the period examined and thus would be captured by the
fixed effects.
Columns 2-4 of Table 3 present the results of the same estimation strategy, dis-
aggregated by type of institution. The breakdown is by highest degree offered by
the institution. Column 2 displays the results for “Non-Degree” institutions, which
are largely vocational, beauty, and technical schools. Compared to other types of
institutions, there are fewer Non-Degree institutions that report enrollment figures.11
The unemployment rate is the only factor that significantly contributes to fluctua-
tions in enrollment at these institutions. Globalization does not significantly impact
enrollment at Non-Degree institutions.
Column 3 presents results for community colleges that offer an Associate’s degree
and nothing higher. Here we see that both globalization measures are highly signifi-
cant. A 10 percent increase in the foreign-born share of the population in a state leads
to a 1.2 percent increase in enrollment at community colleges in the state, while a 10
percent increase in the share of jobs offshored leads to a 2.5 percent increase in com-
munity college enrollment. Again in this specification, coeffi cients for unemployment
and tuition are significant and of the expected sign.
11Institutions that receive any federal financial aid support, such as Pell Grants, are requiredby the Higher Education Act of 1965 to respond to IPEDS surveys. There are a large number of“Non-Degree”institutions that do not receive such support.
14
The final column of Table 3 presents the results for institutions that offer at least
a Bachelor’s degree. These coeffi cients indicate that globalization does not have a
significant impact on enrollment at these institutions. However, unemployment and
tuition are significant and have the expected sign.
Overall, Table 3 indicates that there is an increase in investment in human capital
at institutions located in states most affected by globalization. Specifically, we see
enrollment at community colleges increase in these states. This is consistent with the
intuition discussed in Section 2. Workers who are displaced likely find the short time
frame and the emphasis on technical skills appealing at community colleges; com-
munity colleges are less affected by capacity constraints; and less mobile community
college students are more likely to respond to local economic conditions. Thus, for
the rest of the analysis, we focus on enrollment at the community college level.
5.2 Results by Urbanization of Institution
It is possible that enrollment responses will differ by the level of urbanization in
the area around the institution. At the community college level, in particular, it is
common for individuals to attend schools not only in-state but also within their local
area of residence. If this is the case, then it is likely that an increase in offshoring
within a state should disproportionately increase enrollment at community colleges
located in more urban areas. Increases in immigration, on the other hand, may impact
enrollment in both urban and rural settings.
Table 4 presents the estimation results examining enrollment response by the
level of urbanization of the institution.12 The results indicate that immigration has
a significant positive effect on community college enrollment in all types of locations.
Offshoring, on the other hand, has a positive significant effect on enrollment in urban12The urbanization measure is constructed by IPEDS using information on an institution’s address.
The “large city”category captures MSAs with populations over 250,000, “small city”includes MSAswith populations less than 250,000, and “towns & rural” includes regions that are located outsideMSAs.
15
areas but no effect on enrollment in rural areas. These results confirm the notion
that different areas of a state may be impacted by globalization to different degrees.
Specifically, offshoring increases enrollment predominantly in urban areas while immi-
gration increases enrollment in all settings. Next, we examine whether globalization
has a heterogeneous effect on enrollments of different types of students.
5.3 Results by Age
This section examines whether the impact of globalization on enrollment differs across
age groups. Table 5 presents the results of regressing enrollments of various age
groups on the globalization and control variables. The specification allows for direct
comparisons of the magnitude of coeffi cients across groups. In general, increases in
globalization have a much stronger impact on community college enrollment among
older individuals. We see that for recent high school graduates (18 to 21-year-olds) an
increase in immigration has a significant positive effect on enrollment, while offshoring
has no effect. Offshoring has a significant positive impact on enrollment among those
25 to 39 years old. Immigration has a significant positive impact on enrollment for
all age categories above 30 years old.
These results are consistent with our predictions. Older individuals respond to di-
rect job displacement caused by globalization by returning to school. While younger
individuals have a higher net present value of future earnings resulting from an As-
sociates degree, these results indicate that high school graduates may have diffi culty
correctly calculating the gains from attending a community college. However, older
individuals enroll to replace a set of skills they now know to be obsolete. Overall
these results suggest that the increase in community college enrollment is driven by
older individuals returning to school.
16

5.4 Results by Race
This section focuses on the impact of globalization on the enrollments of different
races. As discussed previously, recent research has examined the causes and con-
sequences of differences in education across racial groups. We contribute to this
literature by determining the extent to which different racial groups are responding
to immigration and offshoring.
Table 6 presents the results of estimating the impact of globalization on com-
munity college enrollment by race. This analysis indicates that enrollments among
White, Hispanic, and Asian individuals have all responded in a similar manner to
globalization. The estimated coeffi cients on immigration and offshoring for these
groups are positive, significant, and of similar magnitude. However, globalization
does not have a significant impact on the community college enrollment of Black stu-
dents. It is not clear from the analysis whether this is a result of Blacks being less
affected by changes in globalization or being less responsive to these changes. While
an interesting question, this falls outside of the scope of this particular study and will
be explored further in future work.
6 Sensitivity Analysis
6.1 Additional Measures of Globalization
As a robustness check, we include two additional measures of globalization to our
baseline estimation strategy. We are concerned that immigration and offshoring may
be capturing variation in other types of globalization that are not adequately con-
trolled for. Specifically, we include the share of inshored workers and the share of
workers displaced due to import competition.
Data on inshoring, defined as the number of employees of majority owned U.S.
17
affi liates of foreign firms, is obtained from the BEA. It is more straightforward to
attribute foreign activity to the state in which it is conducted than it is to attribute
U.S. activity abroad to the state of origin. Thus, the BEA provides a direct measure
of inshoring, but only for the years 2002-2006. For 2000 and 2001, we attribute
inshoring across states in the same manner as offshoring. We expect that increases
in inshoring will increase job prospects and thus decrease enrollment.
Data on the number of workers displaced due to important competition is obtained
from the Trade Adjustment Assistance (TAA) program. Workers who lose their jobs
due to important competition may apply to the TAA program for training, job search
and relocation funds, income support and other reemployment benefits. This is not
a perfect proxy for imports, given the logistical process of applying and recieving
assistance. However, this is the best available data on imports at the state level.13 We
expect that an increase in the number of displaced workers due to import competition
will increase enrollment.
Regressions including the share of workers displaced due to import competition
and the share of inshoring are reported in Table 7. We see that the coeffi cients on
immigration and offshoring have remained virtually identical to those reported in
Table 3. Immigration and offshoring increase enrollment at community colleges and
have no effect on enrollment at other institutions. Including inshoring and import
competition does not change this result. Furthermore, import competition, measured
using data from the TAA, does not significantly impact enrollment at any type of
institution. While inshoring has no impact on enrollment at Non-Degree and Asso-
ciate granting institutions, it does have a slight negative effect on enrollment at four
year institutions. This coeffi cient is of the expected sign, and indicates that inshoring
increases the job prospects of people who would otherwise consider enrolling at four
13Accoding to trade.gov, "no OM statistics are available for state-level imports. The collectionof state import data presents enormous technical challenges, since it would require tracking foreigngoods through the U.S. wholesale and retail distribution systems. Consequently, it is not currentlypossible, using OM data or any other U.S. trade data, to calculate state trade balances."
18
year institutions. We conclude that the fundamental relationship between immigra-
tion, offshoring, and enrollment is robust to the inclusion of inshoring and import
competition.
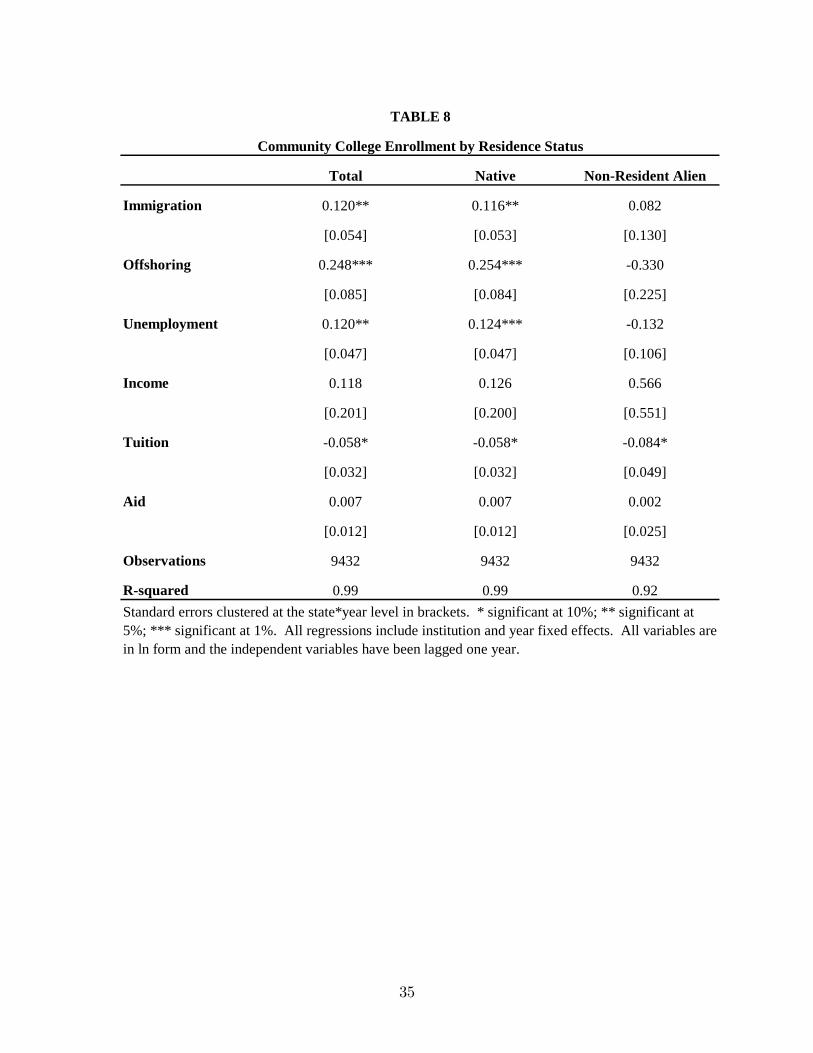
6.2 Enrollment by Residency Status
We have interpreted the positive coeffi cient on immigration as indicating that natives
respond to influxes of immigrants by returning to school. An alternate interpretation
is that the positive coeffi cient implies immigrants themselves are more likely to en-
roll at community colleges. However, if this were true we would expect immigration
to affect the elasticities of some racial groups more than others. Specifically, since
recent immigrants are predominantly Hispanic and Asian, immigration should have
a relatively stronger effect on Hispanic and Asian enrollments. The fact that immi-
gration affects White, Hispanic, and Asian enrollments in a similar manner, as seen
in Table 6, refutes this theory. Instead these results suggest that enrollment among
these different racial groups respond to immigration, rather than immigrants simply
being more likely to enroll at community college.
As an additional robustness check, we gathered IPEDS data on the enrollment
of non-resident aliens at community colleges. We then break total undergraduate
enrollment at these institutions into two categories: non-resident alien and native.
Table 8 presents the results of regressing these categories of enrollment separately on
the standard set of independent variables. The results in column 3 indicate that there
are not significant increases in enrollment among non-resident aliens in response to
increases in immigration. In contrast, column 2 shows that the estimated impact of
immigration on community college enrollment is driven by changes in the enrollment
of native residents. This provides further evidence that the positive coeffi cient on
immigration indicates a response in the human capital investment decision of native
residents.
19
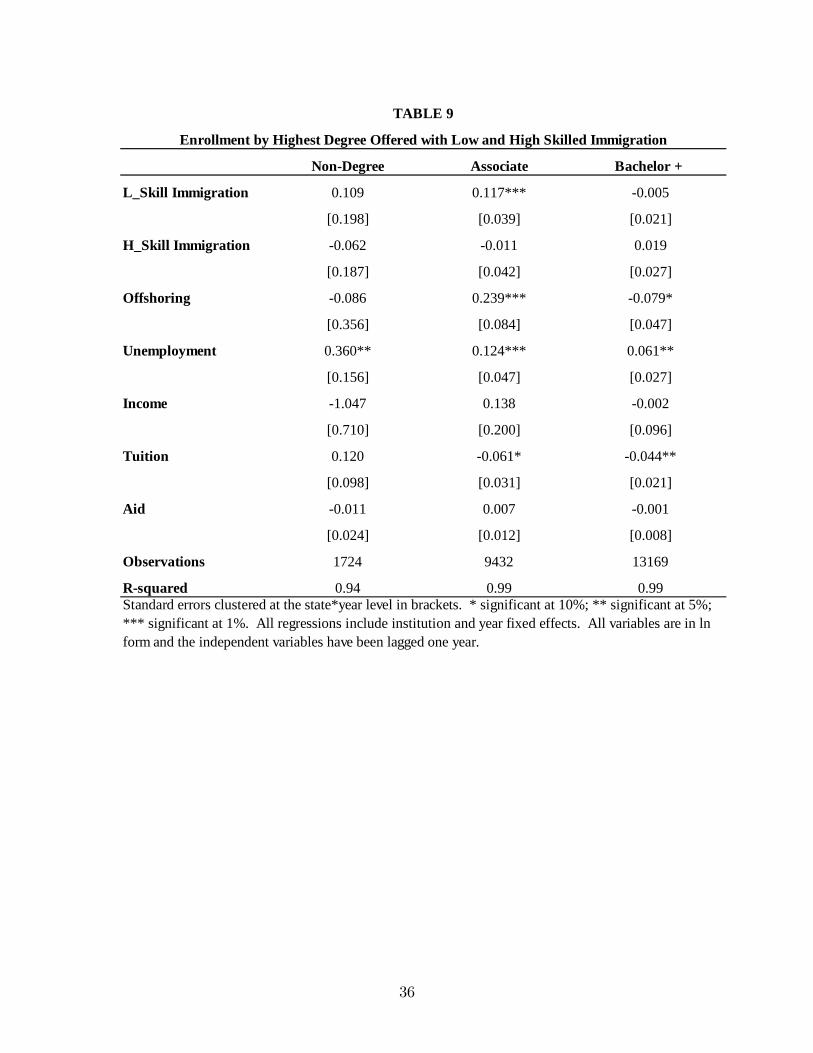
6.3 Low Skilled and High Skilled Immigration
While immigrants to the United States are on average less skilled than natives (Card
2005), there is substantial variation in the skill level of these immigrants. The results
so far show that community college enrollments increase in response to total immi-
gration. However, it is possible to more carefully examine how community college
enrollments respond to immigrants of different skill levels.14 Specifically, we expect
low-skilled immigration to lead to an increase in enrollment as low-skilled native work-
ers respond to this increase in competition by becoming more skilled. However, the
impact of high skilled immigration is less clear since an inflow of skilled workers may
put downward pressure on the returns to skill.
Table 9 reports the results where immigrantion is decomposed into a low-skilled
immigrant share and a high-skilled immigrant share. A low-skilled immigrant is de-
fined as a person with a high school degree or less and a high-skilled immigrant
is defined as a person with more than a high school degree. Consistent with our
previous results, we find that immigration only affects enrollments at community
colleges. In addition, the results in Table 9 indicate that only low-skilled immigra-
tion increases community college enrollments while high-skilled immigration has no
significant impact on enrollments. These results are consistent with the arguments
presented in Section 2 and they provide addditional evidence that low-skilled natives
are responding to an increase in competition from low-skilled immigrants by enrolling
at community colleges.
6.4 Endogeneity
As discussed in Section 3, potential endogeneity concerns are minimized due to our
estimation strategy which includes fixed effects, controls for labor market and institu-
tion characteristics, lagged indepedent variables, and different levels of aggregation.
14Unfortunately, a similar analysis for offshoring is impossible due to data limitations.
20
Furthermore, we view offshoring and immigration as predominently being determined
by factors that are exogenous to local labor market conditions. However, for the
sake of argument, suppose that enrollments are affecting offshoring and immigration
in that region in a manner that is not adequately contolled for with our labor market
and insitution variables. Specifically, one might worry that an increase in enrollments
may lead to a relatively limited supply of low-skilled workers in that region which
in turn may encourage immigration and offshoring. This form of endogeneity would
lead to a spurious positive bias in our coeffi cients.
As an additional robustness check, we estimate an alternate specification in which
this spurious positive bias will be more severe. Specifically, we regess lagged enroll-
ment on our contemporeneous independent variables. Given the time that it would
take for enrollments to impact immigration and offshoring, the potential endogeneity
bias would be larger in this specification than in our baseline estimation strategy
in which we regress current enrollment on our lagged independent variables. How-
ever, in this alternate specification we are unlikely to estimate a causal impact of
offshoring and immigration on enrollments. So significant positive coeffi cients on our
globalization variables would indicate that this endogeneity bias is problematic.
Table 10 reports the results from this placebo regression. The results indicate
that offshoring and immigration do not have a significant effect on enrollments at
any type of institution. This is consistent with the arguments presented in this
paper since it is unlikely that immigration and offshoring could effect enrollments
last year. However, if one was worried about endogeneity, then this spurious bias in
our globilazation variables would be even more severe in this specification. The fact
that the coeffi cients on immigration and offshoring are insignicant suggests that there
is little endogeniety bias and indicates that this paper has identified a causal impact
of immigration and offshoring on enrollments.15
15As a further robustness check, we tried instumenting for immigrantion using historical immigrantenclaves (Card 2005, Lewis 2003). However, this instrument does not work as well at the state as it
21

7 Conclusion
Workers in the United States have become increasingly concerned about the impact
globalization has on their domestic labor market. Recent research has focused on the
effect globalization has on labor market outcomes such as wages and unemployment.
We examine a dimension that has not yet been explored, the impact that globalization
has on human capital investment decisions.
Using data on college enrollment, immigration, and offshoring we analyze whether
states that are more exposed to globalization have seen differential changes in enroll-
ment. The results indicate that both immigration and offshoring have a positive effect
on enrollment. These enrollment responses are stronger among particular types of in-
stitutions and among particular groups of students. Globalization leads to increases
in enrollment at community colleges, but not at other types of institutions. The re-
sults also indicate that offshoring increases community college enrollment in urban
locations, while immigration increases community college enrollment in all types of
locations. Finally, we find that older individuals are more likely to be impacted by
globalization, and that Blacks are less affected.
These results indicate that individuals are reacting in a rational way to global-
ization. As the low-skilled labor force faces increasing competition due to immigra-
tion and offshoring, native workers are responding by increasing their human capital.
These results raise questions about the need for the government to fund the retrain-
ing programs of displaced workers, since American workers are returning to school
on their own. One possible alternative policy is for increased governmental support
for community colleges, as these institutions play a crucial role in retraining workers
displaced due to globalization. The findings of this paper support plans such as the
“American Graduation Initiative” announced in July 2009, which will invest more
does at the MSA level and the different levels of aggregation between the dependent and independentvariables complicate this type of analysis.
22

than $12 billion in community colleges over the next ten years.
We are encouraged by the fact that American workers are responding to increases
in offshoring and immigration by becoming better educated. This implies that the
U.S. labor force is acquiring the skills and knowledge necessary to compete in a global
economy.
23

References
Amiti, Mary and Shang-Jin Wei. 2009. “Service Offshoring and Productivity: Evi-
dence from the US.”World Economy, 32(2): 203-20.
Bartel, Ann P. 1989. “Where Do the New U.S. Immigrants Live?”Journal of Labor
Economics, 7(4): 371-91.
Betts, Julian R. and Laurel L. McFarland. 1995. “Safe Port in a Storm: The Impact of
Labor Market Conditions on Community College Enrollments.”Journal of Human
Resources, 30(4): 741-65.
Black, Dan A., Terra G. McKinnish, and Seth G. Sanders. 2005. “Tight Labor Mar-
kets and the Demand for Education: Evidence from the Coal Boom and Bust.”
Industrial and Labor Relations Review, 59(1): 3-16.
Blinder, Alan S. 2005. “Fear of Offshoring.” Working Paper No. 119, Center for
Economic Policy Studies.
Borjas, George J. 2003. “The Labor Demand Curve is Downward Sloping: Reex-
amining the Impacts of Immigration on the Labor Market.”Quarterly Journal of
Economics, 118(4): 1335-74.
Borjas, George J., Richard B. Freeman, and Lawrence F. Katz. 1997. “How Much
Do Immigration and Trade Affect Labor Market Outcomes?”Brookings Papers on
Economic Activity, 1997(1): 1-90.
Cameron, Stephen V., and James J. Heckman. 2001. “The Dynamics of Educational
Attainment for Black, White, and Hispanic Males.”Journal of Political Economy,
109(3): 455-99.
Card, David. 1990. “The Impact of the Mariel Boatlift on the Miami Labor Market.”
Industrial and Labor Relations Review, 43(2): 245-57.
24

Card, David. 2001. “Immigrant Inflows, Native Outflows, and the Local Market Im-
pacts of Higher Immigration.”Journal of Labor Economics, 19(1): 22-64.
Card, David. 2005. “Is the New Immigration Really so Bad?”The Economic Journal,
115(507): F300-23.
Card, David and John DiNardo. 2000. “Do Immigrant Inflows Lead to Native Out-
flows?”American Economic Review, 90(2): 360-7.
Card, David and Alan B. Krueger. 2005. “Would the Elimination of Affi rmative Ac-
tion Affect Highly Qualified Minority Applicants? Evidence from California and
Texas.”Industrial and Labor Relations Review, 58(3): 416-34.
Cragg, Michael and Matthew Kahn. 1997. “New Estimates of Climate Demand: Ev-
idence from Location Choice.”Journal of Urban Economics, 42(2): 261-84.
Feenstra, Robert C. and Gordon H. Hanson. 1996. “Globalization, Outsourcing, and
Wage Inequality.”A.E.R. Papers and Proceedings, 86 (2): 240—45.
Feenstra, Robert C. and Gordon H. Hanson. 1999. “The Impact of Outsourcing and
High-Technology Capital on Wages: Estimates for the United States, 1979-1990.”
The Quarterly Journal of Economics, 114(3): 907-40.
Hanson, Gordon H., Kenneth F. Sheve, Matthew J. Slaughter, and Antonio Spilim-
bergo. 2002. “Immigration and the U.S. Economy: Labor-Market Impacts, Illegal
Entry, and Policy Choices.” In Immigration Policy and the Welfare System, ed.
Tito Boeri, Gordon Hanson, and Barry McCormick, 169-279. Oxford University
Press.
Harrison, Ann E. and Margaret S. McMillan. 2006. “Outsourcing Jobs? Multination-
als and US Employment.”Working Paper No. 12372, National Bureau of Economic
Research.
25

Jacobson, Louis, Robert LaLonde, and Daniel G. Sullivan. 2005. “Estimating the Re-
turns to Community College Schooling for Displaced Workers.”Journal of Econo-
metrics, 125(1): 271-304.
Kane, Thomas J. and Cecilia B. Rouse. 1999. “The Community College: Educating
Students at the Margin between College and Work.”Journal of Economic Perspec-
tives, 13(1): 63-84.
Kienzl, Gregory S., Mariana Alfonso, and Tatiana Melguizo. 2007. “The Effect of
Local Labor Market Condition in the 1990s on the Likelihood of Community College
Students’Persistence and Attainment.”Research in Higher Education, 48(7): 751-
73.
Olney, William W. 2009. “Offshoring, Immigration, and the Native Wage Distribu-
tion.”Working Paper No. 1365288, Social Science Research Network (SSRN).
Ruggles, Steven, Matthew Sobek, Trent Alexander, Catherine A. Fitch, Ronald
Goeken, Patricia Kelly Hall, Miriam King, and Chad Ronnander. 2009. Integrated
Public Use Microdata Series: Version 4.0. Minneapolis, MN: Minnesota Population
Center.
Slaughter, Matthew J. 2000. “Production Transfer within Multinational Enterprises
and American Wages.”Journal of International Economics, 50(2): 449-72.
U.S. Census Bureau, Population Division. 2000. “Table 7: Educational Attain-
ment of Employed Civilians 18 to 64 Years, by Industry.” Available online:
http://www.census.gov/population/socdemo/education/p20-536/tab07.pdf
26

State Total Enrollment Enrollment Share Immigration OffshoringAlabama 214,473 7.5 3.7 4.6Arizona 417,485 11.6 17.1 4.5Arkansas 126,742 7.4 4.5 4.6California 2,195,971 9.7 33.2 5.2Colorado 253,005 8.3 11.0 4.3Connecticut 147,484 6.7 16.2 5.5Delaware 42,503 8.1 9.3 5.2Florida 776,948 7.3 22.7 3.5Georgia 366,512 6.4 10.3 5.0Idaho 68,001 7.9 6.8 3.9Illinois 665,780 8.3 14.6 5.2Indiana 309,056 7.9 4.6 7.2Iowa 197,449 10.8 3.8 5.1Kansas 170,285 10.0 5.3 3.9Kentucky 197,366 7.4 3.0 5.8Louisiana 203,212 7.3 4.1 4.7Maine 57,347 6.9 4.2 3.0Maryland 259,086 7.3 13.3 3.8Massachusetts 338,077 8.1 16.3 5.1Michigan 531,266 8.4 6.6 7.9Minnesota 279,585 8.7 6.2 4.5Mississippi 132,671 7.4 2.2 3.7Missouri 293,859 8.1 4.2 4.7Montana 42,536 7.3 2.7 2.2Nebraska 103,551 9.6 5.5 4.0Nevada 92,434 6.2 20.9 3.5New Hampshire 57,476 6.9 6.2 4.5New Jersey 331,073 6.1 23.3 5.5New Mexico 111,509 9.5 10.8 4.3New York 952,513 7.7 23.9 4.9North Carolina 415,114 7.5 8.0 5.9North Dakota 43,272 10.8 2.9 3.2Ohio 537,610 7.5 4.3 5.9Oklahoma 191,717 8.7 5.8 4.0Oregon 176,011 7.6 10.1 5.2Pennsylvania 579,629 7.5 6.0 4.8Rhode Island 71,316 10.5 14.3 4.0South Carolina 185,973 6.9 5.4 4.9South Dakota 41,868 8.9 2.7 3.6Tennessee 247,650 6.5 4.5 5.5Texas 1,070,523 7.6 18.4 5.3Utah 173,689 11.7 8.7 3.6Vermont 33,592 8.3 4.8 3.8Virginia 366,478 7.5 12.1 4.7Washington 314,454 7.8 13.6 4.0West Virginia 80,989 7.0 1.7 3.7Wisconsin 293,426 8.4 4.2 5.2Wyoming 30,245 9.3 3.4 4.2
State Averages
TABLE 1
This table includes the state average of total enrollment (20017), the enrollment to adult population ratio (20017), the share of thepopulation that is foreign born (20006), and the share of foreign affiliate employees (20006).
27
Offshoring and Immigration by State (20002006 Average)
FIGURE 1
This figure plots the state average of the share of the population that is foreign born against the state averageof the share of foreign affiliate employees.
AL
AZ
AR
CA
CO
CT
DE
FL
GA
ID
IL
INIAKS
KYLAME
MD
MA
MIMN
MSMO
MT
NE
NV
NH
NJ
NM
NY
NC
NDOH
OK
OR
PA
RI
SC
SDTN
TX
UT
VT
VAWA
WV
WIWY
010
2030
40Im
mig
ratio
n
2 4 6 8Offshoring
Year Enrollment Enrollment Share Immigration Offshoring
2000 13,223,412 7.5 14.4 4.9
2001 13,823,976 7.8 13.9 4.9
2002 14,415,372 8.0 14.2 5.0
2003 14,610,108 8.0 14.6 5.0
2004 14,889,081 8.1 14.4 5.0
2005 15,005,920 8.1 14.7 5.1
2006 15,204,562 8.1 15.0 5.2
2007 15,572,636 8.2
Year Averages
TABLE 2
This table includes the total annual enrollment and the enrollment to adult population ratio. Annual averages of the share of thepopulation that is foreign born and the share of foreign affiliate employees are weighted by state population.
28

FIGURE 2
Percentage Changes in Offshoring and Immigration by State (20002006)
This figute plots the percent change in the share of the population that is foreign born against the percentchange in the share of foreign affiliate employees.
AL
AZ
AR
CA CO CT
DE
FL
GA
IDIL
IN IA
KS
KY
LA
ME
MD
MA
MI MN
MS
MO MTNE NV
NH
NJ
NM
NY
NC
NDOH
OK
OR
PA
RI
SC
SD
TN
TXUT
VT
VA
W A
W V
W I
W Y
20
020
4060
Imm
igra
tion
10 0 10 20 30Offshoring
29

All
Inst
itutio
nsN
onD
egre
eA
ssoc
iate
Bac
helo
r +
Imm
igra
tion
0.04
8*0.
092
0.12
0**
0.00
1
[0.0
29]
[0.2
18]
[0.0
54]
[0.0
25]
Off
shor
ing
0.05
90
.072
0.24
8***
0.0
76
[0.0
48]
[0.3
56]
[0.0
85]
[0.0
48]
Une
mpl
oym
ent
0.10
5***
0.36
5**
0.12
0**
0.06
1**
[0.0
27]
[0.1
56]
[0.0
47]
[0.0
27]
Inco
me
0.00
71
.114
0.11
80.
016
[0.1
06]
[0.6
90]
[0.2
01]
[0.0
95]
Tui
tion
0.0
40*
0.11
90
.058
*0
.044
**
[0.0
21]
[0.0
98]
[0.0
32]
[0.0
21]
Aid
0.0
020
.012
0.00
70
.001
[0.0
07]
[0.0
24]
[0.0
12]
[0.0
08]
Obs
erva
tions
2432
517
2494
3213
169
Rs
quar
ed0.
990.
940.
990.
99
Stan
dard
err
ors c
lust
ered
at t
he st
ate*
year
leve
l in
brac
kets
. *
sign
ifica
nt a
t 10%
; **
sign
ifica
nt a
t 5%
; ***
sign
ifica
nt a
t 1%
.A
ll re
gres
sion
s inc
lude
inst
itutio
n an
d ye
ar fi
xed
effe
cts.
All
varia
bles
are
in ln
form
and
the
inde
pend
ent v
aria
bles
hav
ebe
en la
gged
one
yea
r.
Enr
ollm
ent b
y H
ighe
st D
egre
e O
ffer
ed
TA
BL
E 3
30

Tot
alL
arge
City
Smal
l City
Tow
ns &
Rur
al
Imm
igra
tion
0.12
0**
0.21
7*0.
124*
0.09
3**
[0.0
54]
[0.1
23]
[0.0
67]
[0.0
47]
Off
shor
ing
0.24
8***
0.46
5***
0.34
0***
0.10
0
[0.0
85]
[0.1
49]
[0.1
19]
[0.0
80]
Une
mpl
oym
ent
0.12
0**
0.27
2***
0.16
5***
0.01
4
[0.0
47]
[0.0
95]
[0.0
54]
[0.0
45]
Inco
me
0.11
80
.019
0.18
00.
133
[0.2
01]
[0.4
14]
[0.2
26]
[0.1
90]
Tui
tion
0.0
58*
0.0
280
.142
***
0.0
24
[0.0
32]
[0.0
36]
[0.0
53]
[0.0
28]
Aid
0.00
70.
008
0.0
080.
017
[0.0
12]
[0.0
26]
[0.0
17]
[0.0
16]
Obs
erva
tions
9432
2893
2447
4092
Rs
quar
ed0.
990.
990.
990.
98
Stan
dard
err
ors c
lust
ered
at t
he st
ate*
year
leve
l in
brac
kets
. *
sign
ifica
nt a
t 10%
; **
sign
ifica
nt a
t 5%
; ***
sign
ifica
nt a
t 1%
.A
ll re
gres
sion
s inc
lude
inst
itutio
n an
d ye
ar fi
xed
effe
cts.
All
varia
bles
are
in ln
form
and
the
inde
pend
ent v
aria
bles
hav
ebe
en la
gged
one
yea
r.
Com
mun
ity C
olle
ge E
nrol
lmen
t by
Urb
aniz
atio
n
TAB
LE 4
31

Tot
al18
to 2
122
to 2
425
to 2
930
to 3
435
to 3
940
to 4
950
to 6
4
Imm
igra
tion
0.12
0**
0.08
1*0.
032
0.08
00.
259*
**0.
274*
**0.
400*
**0.
368*
**
[0.0
54]
[0.0
46]
[0.0
65]
[0.0
67]
[0.0
68]
[0.0
74]
[0.0
80]
[0.1
02]
Off
shor
ing
0.24
8***
0.0
890.
020
0.28
1***
0.42
7***
0.29
5**
0.16
30.
006
[0.0
85]
[0.0
75]
[0.1
08]
[0.1
04]
[0.1
19]
[0.1
24]
[0.1
17]
[0.1
92]
Une
mpl
oym
ent
0.12
0**
0.04
10.
052
0.01
40.
108*
0.20
1***
0.18
4***
0.23
0***
[0.0
47]
[0.0
51]
[0.0
56]
[0.0
52]
[0.0
60]
[0.0
64]
[0.0
67]
[0.0
78]
Inco
me
0.11
80.
416*
*0.
086
0.13
20
.139
0.1
890
.163
0.1
34
[0.2
01]
[0.1
97]
[0.2
61]
[0.2
53]
[0.2
99]
[0.3
04]
[0.3
11]
[0.4
53]
Tui
tion
0.0
58*
0.0
40*
0.0
62*
0.0
610
.091
*0
.063
0.0
770
.128
*
[0.0
32]
[0.0
24]
[0.0
36]
[0.0
38]
[0.0
47]
[0.0
46]
[0.0
53]
[0.0
75]
Aid
0.00
70.
017
0.01
90.
006
0.00
80.
018
0.01
70.
015
[0.0
12]
[0.0
12]
[0.0
16]
[0.0
14]
[0.0
16]
[0.0
16]
[0.0
20]
[0.0
21]
Obs
erva
tions
9432
8485
8521
8495
8459
8424
8426
8231
Rs
quar
ed0.
990.
980.
980.
980.
970.
970.
970.
96St
anda
rd e
rror
s clu
stere
d at
the
stat
e*ye
ar le
vel i
n br
acke
ts.
* si
gnifi
cant
at 1
0%; *
* si
gnifi
cant
at 5
%; *
** si
gnifi
cant
at 1
%.
All
regr
essio
ns in
clud
e in
stitu
tion
and
year
fixe
d ef
fect
s. A
ll va
riabl
es a
re in
ln fo
rm a
nd th
e in
depe
nden
t var
iabl
es h
ave
been
lagg
ed o
ne y
ear.
Com
mun
ity C
olle
ge E
nrol
lmen
t by
Age
TA
BL
E 5
32

Tot
alW
hite
Bla
ckH
ispa
nic
Asi
an
Imm
igra
tion
0.12
0**
0.20
0**
0.04
30.
286*
**0.
199*
[0.0
54]
[0.0
77]
[0.1
07]
[0.0
91]
[0.1
07]
Off
shor
ing
0.24
8***
0.46
5***
0.12
10.
516*
**0.
270*
[0.0
85]
[0.1
29]
[0.1
44]
[0.1
56]
[0.1
55]
Une
mpl
oym
ent
0.12
0**
0.20
1***
0.21
3***
0.24
8***
0.16
6**
[0.0
47]
[0.0
64]
[0.0
73]
[0.0
78]
[0.0
75]
Inco
me
0.11
80.
233
0.24
80.
115
0.0
21
[0.2
01]
[0.2
61]
[0.3
18]
[0.3
14]
[0.3
19]
Tui
tion
0.0
58*
0.0
94**
0.0
98**
0.1
02**
0.02
1
[0.0
32]
[0.0
37]
[0.0
47]
[0.0
45]
[0.0
57]
Aid
0.00
70.
022
0.00
30.
017
0.02
7
[0.0
12]
[0.0
18]
[0.0
19]
[0.0
22]
[0.0
23]
Obs
erva
tions
9432
9432
9432
9432
9432
Rs
quar
ed0.
990.
970.
980.
980.
97
Stan
dard
err
ors c
lust
ered
at t
he st
ate*
year
leve
l in
brac
kets
. *
sign
ifica
nt a
t 10%
; **
sign
ifica
nt a
t 5%
; ***
sign
ifica
nt a
t 1%
. A
ll re
gres
sion
s inc
lude
insti
tutio
n an
d ye
ar fi
xed
effe
cts.
All
varia
bles
are
in ln
form
and
the
inde
pend
ent v
aria
bles
hav
e be
en la
gged
one
yea
r.
Com
mun
ity C
olle
ge E
nrol
lmen
t by
Rac
e
TA
BL
E 6
33

NonDegree Associate Bachelor +
Immigration 0.139 0.116** 0.002
[0.226] [0.054] [0.024]
Offshoring 0.101 0.242*** 0.075
[0.356] [0.085] [0.046]
Import Competition 0.042 0.003 0.003
[0.032] [0.005] [0.003]
Inshoring 0.199 0.037 0.046***
[0.161] [0.036] [0.016]
Unemployment 0.406** 0.117** 0.065**
[0.169] [0.047] [0.026]
Income 1.455** 0.110 0.041
[0.655] [0.202] [0.092]
Tuition 0.120 0.057* 0.045**
[0.099] [0.031] [0.021]
Aid 0.009 0.006 0.001
[0.025] [0.012] [0.008]
Observations 1724 9432 13169
Rsquared 0.94 0.99 0.99
TABLE 7
Enrollment by Highest Degree Offered (Including Import Competition and Inshoring)
Standard errors clustered at the state*year level in brackets. * significant at 10%; ** significant at5%; *** significant at 1%. All regressions include institution and year fixed effects. All variablesare in ln form and the independent variables have been lagged one year.
34
Total Native NonResident Alien
Immigration 0.120** 0.116** 0.082
[0.054] [0.053] [0.130]
Offshoring 0.248*** 0.254*** 0.330
[0.085] [0.084] [0.225]
Unemployment 0.120** 0.124*** 0.132
[0.047] [0.047] [0.106]
Income 0.118 0.126 0.566
[0.201] [0.200] [0.551]
Tuition 0.058* 0.058* 0.084*
[0.032] [0.032] [0.049]
Aid 0.007 0.007 0.002
[0.012] [0.012] [0.025]
Observations 9432 9432 9432
Rsquared 0.99 0.99 0.92Standard errors clustered at the state*year level in brackets. * significant at 10%; ** significant at5%; *** significant at 1%. All regressions include institution and year fixed effects. All variables arein ln form and the independent variables have been lagged one year.
Community College Enrollment by Residence Status
TABLE 8
35
NonDegree Associate Bachelor +
L_Skill Immigration 0.109 0.117*** 0.005
[0.198] [0.039] [0.021]
H_Skill Immigration 0.062 0.011 0.019
[0.187] [0.042] [0.027]
Offshoring 0.086 0.239*** 0.079*
[0.356] [0.084] [0.047]
Unemployment 0.360** 0.124*** 0.061**
[0.156] [0.047] [0.027]
Income 1.047 0.138 0.002
[0.710] [0.200] [0.096]
Tuition 0.120 0.061* 0.044**
[0.098] [0.031] [0.021]
Aid 0.011 0.007 0.001
[0.024] [0.012] [0.008]
Observations 1724 9432 13169
Rsquared 0.94 0.99 0.99
TABLE 9
Enrollment by Highest Degree Offered with Low and High Skilled Immigration
Standard errors clustered at the state*year level in brackets. * significant at 10%; ** significant at 5%;*** significant at 1%. All regressions include institution and year fixed effects. All variables are in lnform and the independent variables have been lagged one year.
36

NonDegree Associate Bachelor +
Immigration 0.420 0.100 0.022
[0.262] [0.063] [0.039]
Offshoring 0.547 0.118 0.106
[0.380] [0.111] [0.077]
Unemployment 0.094 0.142** 0.044
[0.150] [0.066] [0.043]
Income 0.280 0.094 0.100
[0.677] [0.250] [0.159]
Tuition 0.053 0.140*** 0.078***
[0.081] [0.030] [0.028]
Aid 0.010 0.023 0.011
[0.038] [0.019] [0.011]
Observations 1586 8291 11508
Rsquared 0.92 0.98 0.99
TABLE 10
Lagged Enrollment by Highest Degree Offered
Standard errors clustered at the state*year level in brackets. * significant at 10%; ** significant at 5%;*** significant at 1%. All regressions include institution and year fixed effects. All variables are in lnform and the dependent variable (enrollment) has been lagged one year while all the independentvariables are now in the current year.
37
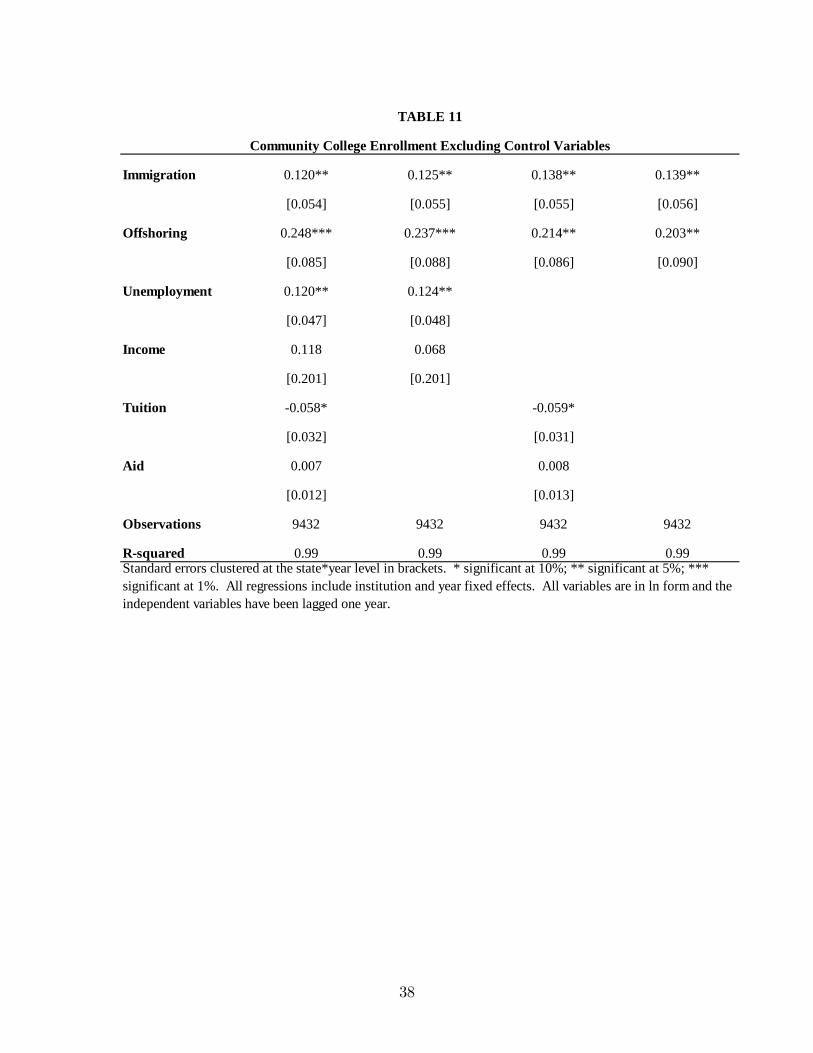
Immigration 0.120** 0.125** 0.138** 0.139**
[0.054] [0.055] [0.055] [0.056]
Offshoring 0.248*** 0.237*** 0.214** 0.203**
[0.085] [0.088] [0.086] [0.090]
Unemployment 0.120** 0.124**
[0.047] [0.048]
Income 0.118 0.068
[0.201] [0.201]
Tuition 0.058* 0.059*
[0.032] [0.031]
Aid 0.007 0.008
[0.012] [0.013]
Observations 9432 9432 9432 9432
Rsquared 0.99 0.99 0.99 0.99
TABLE 11
Community College Enrollment Excluding Control Variables
Standard errors clustered at the state*year level in brackets. * significant at 10%; ** significant at 5%; ***significant at 1%. All regressions include institution and year fixed effects. All variables are in ln form and theindependent variables have been lagged one year.
38