global warming - royal society of chemistrymedia.rsc.org/climate change/clch-pt1.pdf · a global...
TRANSCRIPT
2 Climate change
Global warmingTeacher’s notes
Objectives■ To understand the greenhouse effect.
■ To understand that global warming is a complex issue full of uncertainties andcontroversies. Science is not clear cut and it does have its limitations.
■ To collect data from different sources, to consider the evidence and evaluate theevidence. To understand that data collected from different sources does not alwayslead to the same results.
■ To give an introduction to computer simulated models of climate change.
OutlineThis resource includes a number of different types of activities and worksheets, whichcan be used to promote group discussion.
■ Introducing global warming and understanding the greenhouse effect.
■ A global warning – using data from the past to predict the climate of the future.
■ Methods of collecting climatic data.
■ The work and lifestyle of scientists collecting climatic information and data inAntarctica.
■ The Earth is getting warmer, or is it?
■ Addressing the ethical issues arising from global warming. What should we doabout it?
Teaching topicsThis material is suitable for students in the 11–16 year old age range. Withmodifications it could form the basis of a post-16 environmental science unit. Theactivities can be included when teaching about changes to the Earth and atmosphereand the effect of burning fossil fuels on the environment. It is an excellent context forteaching about the nature of scientific data and how to handle it.
Background informationGlobal warming is a very large area of scientific uncertainty. There are literallythousands of scientists working around the world, trying to understand and formulatingmodels that will predict the consequences of global warming. It is an extremelycomplex procedure and there are hundreds of variables that come into the model. Noone knows if the models being used are accurate. What will the climate will be like in50 or 100 years time? No one can know for certain. However, there are real fears thatrapid climate change will have a dramatic impact on life on Earth. Over the last10,000 years the Earth has experienced a very stable climate and life has adapted to it.Recently, however, the Earth has seen an increase in temperature change and manyscientists now believe that there is a direct link between this warming and emissions ofgreenhouse gases such as carbon dioxide (CO2) and nitrogen oxides (NOx) caused byhuman activities. In the past the greenhouse gases were in balance. It is feared that, at
Climate change 3
the present rate of increase of greenhouse gases, the natural balance will be upset. Ittakes millions of years for fossil fuels to form but only a few minutes for them to burn,releasing large quantities of CO2 in to the air. In the past fluctuations in CO2 levelshave been explained by natural causes such as volcanic eruptions and the number ofphytoplankton in the sea. There are currently several other theories about globalwarming such as positive and negative feedback systems of ocean currents and theposition of the Earth in space.
As a result of the warming, global sea levels are expected to rise by a further 15 to95 cm by the year 2100 because seawater expands when heated and some glacial icewill melt. Extreme events such as heavy rains and droughts are expected. There maybe more hurricanes, typhoons and cyclones. Most of the predictions are based onrather slow changes in temperature, but when you look back through history there hasbeen very sudden temperature changes which have had dramatic effects to life. TheAtlantic Ocean conveyor belt system is one of the present theories that is underinvestigation that could explain these rapid changes in temperature. At the moment theconveyor belt (commonly known as the Gulf Stream) is switched on, thus keepingBritain and Northern Europe warm. If the conveyor was to be switched off, the storywould be very different and without the Gulf Stream, there would be rapid cooling andwe would be plunged into the next ice age. Some scientists believe that the conveyorbelt could be switched off if large amounts of fresh water were to enter the AtlanticOcean at the critical point. This fresh water could come from continuous rainfall as aresult of a warmer, wetter climate and/or rapid melting of polar ice. Detailed datacollected from ice cores have shown that in the past some temperature changes haveoccurred very quickly (within a hundred years). The main worry of some scientists isthat the ever-increasing emissions of greenhouse gases that are causing a rapidincrease in global temperature may result in the Atlantic Ocean conveyer system beingswitched off.
The real problem for the scientist is that climate change is very difficult to predict.
Using oxygen isotopes as temperature indicatorsThis method is commonly used to indicate temperatures using seabed sediments andice cores. Students will need to understand the term isotopes and know the differencebetween oxygen-16 (16O) and oxygen-18 (18O).
Fossil shells are often made up of calcium carbonate. During its lifetime, the creaturethat inhabited the shell slowly extracted oxygen from water to build up its shell.Experiments have shown that the proportion of oxygen-16 and oxygen-18 in the shellis sensitive to the temperature. This is the temperature of the water the creature livedin. So scientists can estimate past ocean temperatures by determining the oxygenisotope ratios in the shell. Both surface temperatures and seabed temperatures can bedetermined by analysing the fossils of creatures that lived near the surface and on thebottom of the sea.
At high temperatures more of the lighter isotopes escape, thus a high 18O : 16O ratioindicates a higher temperature that a low ratio does. The idea is simple, but in practiceit is quite difficult to determine the individual layers of sediment.
Atmospheric temperatures can be measured by determining the ratio of oxygenisotopes in the layers of an ice core. Each year a new distinct layer of ice is formed, soit is easy to determine the age of the ice.
88
4 Climate change
Using leaves as thermometersPlants adapt to their environment. For example leaves which evolve in shaded, humidconditions are large and thin. If the same type of leaf is exposed to high levels of light,then it evolves to become small and thick with large cuticles. The conflicting demandsof water conservation, gas exchange and light capture are governed by the laws ofphysics (evaporation and gas diffusion). Plants solve these dilemmas by physicallyadapting to meet the needs of the immediate environment. Within certain limits theseadaptations are so constant that climatic comparisons can be made.
In 1915, two American botanists I.W. Bailey and E.W. Sinnott noted that leaves ofmodern woody ‘broadleaved’ flowering plants, eg fig and willow, tend to have smoothmargins in warm climates but toothed ‘jagged’ ones in cooler climates. In the late1970s, Jack Wolf, another American, by using modern species growing in drought freeenvironments of south east Asia, was able show that there was a linear relationshipbetween the mean annual temperature in degrees centigrade (°C) and the percentageof entire margined leaf species. The relationship breaks down if there is a limitedwater supply.
Today this method is used for estimating the climate millions of years ago.1,2 Analysisof fossilised leaves indicate the temperature. This method is however subject to largesources of error and a large volume of data is required to get meaningful results.
Sources of information■ The United Nations Environment Programme website is a place to visit if you are
interested in what the politicians are thinking. http://www.unep.ch/ (accessed September 2005)
■ You may like to get involved in the Science Across the World project on theGreenhouse effect. Go to http://www.scienceacross.org (accessed September2005) click on useful links and then choose global warming.
■ The Casino-21 experiment, a climate simulation of the 21st century. For theexperiment to work millions of people are needed to run a simulation on theircomputer. The idea is to predict the climate in 2050. Details of the project andhow to register can be found athttp://www.climateprediction.net/index.php (accessed September 2005).
■ http://www.exxon.mobil.com (accessed September 2005)
■ http://www.bp.com/home.do (accessed September 2005)
■ G. Best, Environmental Pollution Studies, Liverpool: Liverpool University Press,1999.
■ S. Lamb and D. Sington, Earth Story, The shaping of our world, London: BBCWorldwide Ltd., 1998.
■ Climate Change, scientific certainties and uncertainties, NERC, Polaris House,North Star Avenue, Swindon, SN1 1EU. Email [email protected] (This leafletalso gives a list of climate change contacts.)
■ C. O’Driscoll, Chemistry in Britain, 2000, 36(2), 28. (http://www.chemsoc.org/chembytes/ezine/2000/toolkit_feb00.htm) (accessedSeptember 2005)

Climate change 5
■ A. Jones, Chemistry in Britain, 2000, 36(2), 33.(http://www.chemsoc.org/chembytes/ezine/2000/jones_feb00.htm) (accessedSeptember 2005)
6 Climate change
A global warningTeaching tips
The student sheet, A global warning. Is the Earth getting warmer ? is intended tointroduce the theme of global warming as a controversial scientific issue. Using anOHT of the sheet to initiate a class discussion, find out what the class already knowabout global warming and if they have any strong views on the subject. For example,do they see global warming as a controversial subject or, in their minds, is it all clearcut? Do they understand what global warming and the greenhouse effect mean? Whatare the problems associated with global warming? Why are so many governmentsconcerned with it?
The sheet has been presented as a conversation between two young children. This isto try and get over the point that even though most people think that they understandglobal warming, the fact is that it is an extremely complex subject and many scientistsdisagree. The sheet aims to challenge existing ideas about global warming. This maycause cognitive conflict. The students should be encouraged to discuss their ideasbefore they go on to look at the data.
The newspaper headlines have been deliberately chosen to create an air of uncertaintyrelating to the scientific world and to introduce some of the vocabulary. For example,some students may wonder why there might be another ice age if the world iswarming up. Through discussion with the class, highlight some of the scientificproblems that face scientists eg data collection when there are so many variables, orthe use of models to predict future temperatures and levels of greenhouse gases. Stressthat all these factors and many more lead to scientists being uncertain about the futureof global warming.
The purpose of the introduction is to highlight some of the areas of uncertainty and notto try and answer all the questions. After looking at climate data there will anopportunity for the students to formulate their own opinions on the subject and todebate any future steps that should be taken by scientists and governments.
For this activity to be successful it must be introduced through discussion otherwisethe students will not appreciate the complexity of the problem, and they will not seethe point of interpreting different types of data.
Key words from the newspaper articles that may need introducing:
■ Greenhouse effect;
■ Global warming;
■ Modelling.
The greenhouse effect and global warming This sheet presents students with anopportunity to explore the greenhouse effect and global warming in more detail,through a ‘cut and stick’ approach. It should be used before going on to look at thedata, if the class are unfamiliar with the greenhouse effect.
Climate models are computer programmes that are used to try and reproduce climaticdata by feeding in lots of different variables such as wind speed and direction, rainfall,temperature, concentration of greenhouse gases etc. When the scientists believe thatthe model gives a good reproduction of what actually happens, they can use it topredict the future. For example, by feeding in different concentrations of greenhouse
Climate change 7
gases they can predict by how much the earth surface temperature will rise. Thisinformation could then be used by international governments to set future greenhousegas targets. (See note on Casino-21, page 4.)
Interpreting climatic dataThis phase of the lesson involves the interpretation of real climatic data. The data ispresented in the form of temperature – time graphs in the Looking at the dataworksheets. Each graph is followed up by specific questions. Questions 1–20 aresuitable to be used as individual class work or homework, as each question follows onfrom the last.
The International Panel of Climate Change (IPCC) temperature time data has beencalculated and presented relative to the 1961–1990 average. When you look at thegraphs, you will see that this average works out at zero. It is important to stress that it isnot necessary to present absolute temperatures, because we are interested in looking atthe temperature differences. The data file is found athttp://www.cru.uea.ac.uk/cru/data (accessed September 2005).
Finally students should compare and discuss their graphs predicting the temperaturechange over the next twenty years.
The extension question could be discussed in groups. It may cause some difficulty as itis really intended to act as a thought provoker for the next session. There are two keyideas to stress here:
■ In order to predict future temperature changes, a full picture of the past is required.
■ Data collected by different methods can be very different, so where possible,scientists try to use data from more than one source. Which data set is the mostaccurate or reliable?
Acknowledgements for student worksheetsNewspaper headlines – © Times Newspaper Limited, (27/7/1989, 11/9/1994,27/9/1995, 13/8/1998, 6/1/1999).
Data source for questions 1–10, Intergovernmental Panel on Climate Change.
Data source for questions 11–22, Central England Temperature data - Crowncopyright, The Meteorological Office, Hadley Centre for Climate Prediction andResearch.
Resources■ OHP
■ Student worksheets:– A global warning – is the Earth getting warmer? – OHT Master for introductorydiscussion– The greenhouse effect and global warming– Looking at the data – temperature changes over the last century– Looking at the data – temperature changes over several centuries– Looking at the data – extension sheet
TimingAllow 1 hour for basic coverage. Some classes will need longer if they do Thegreenhouse effect and global warming sheet or if they get very involved in thediscussions.

8 Climate change
Adapting materialsSome teachers may feel that the questions are repetitive, in which case they couldreduce the number of graphs that are analysed. However, care must be taken not todistort the overall aims of the material.
Methods of collecting temperature data In this section teachers are not expected to cover all the material, rather chooseactivities that are suitable for each class.
Introduce this lesson by discussing the answer to the extension question in theprevious session. Try to get as many ideas as possible before introducing the methodsthat are actually used by scientists gives factual information about how ice andsediment cores are drilled in the field and later analysed.
Resources■ Student worksheets
– Information sheet – collecting climatic data from ice and sediment cores– Collecting climatic data that is millions of years old.
Looking at real temperature and time data taken from North Atlantic sediment cores and ice cores in Greenland and Antarctica
This could be introduced by reminding the class that during the 20th century theEarth’s average temperature has increased by approximately 0.5 °C. However, it isdifficult to predict what will happen in the future when you are looking at a small timeperiod, because every so often there are temperature fluctuations, such as in the 18thcentury, just after the little ice age.
In this lesson the students analyse temperature data going back 220,000 years andthen look at the results of some temperature models that go back millions of years. Bylooking at levels of greenhouse gases, the students are asked to try and find patternsand links between the level of greenhouse gases and the Earth’s temperature. Thisleads naturally into the final section, namely, man’s influence on global warming. Thequestion is posed ‘what should we be doing about global warming?’
Resources■ Student worksheet
– Looking at climatic data from the past
Life as a scientist working in AntarcticaThis section aims to give an overview of life working in Antarctica.
The student worksheets include an interview with Dr Jane Francis of Leeds Universitywho has been part of past Antarctic expeditions. Some of the leaflets and videos listedin the resources section can also be used. The task at the end asks students to write anadvert for expedition scientists. The advert should focus on the type of personrequired, the qualifications needed and should include something about the scientificwork. This could be used in careers sessions.
Climate change 9
Resources■ Student worksheet:
– Life as a scientist in Antarctica
■ Internet access
■ The British Antarctic Survey, BAS, website http://www.Antarctica.ac.uk (accessedSeptember 2005). Contact Schools Liaison Officer, British Antarctic Survey, HighCross, Madingley Road, Cambridge CB3 0ET, UK. Telephone 01223-221400.Enquiries from schools and students: [email protected]
■ Antarctica The White Laboratory – a 25 minute video available from BAS
■ Living & Working in Antarctica – an information leaflet available from BAS
■ US Antarctic Resource Centre http://usarc.usgs.gov/ (accessed September 2005)
■ http://www.antarcticanz.govt.nz/education/1126 (accessed September 2005).
TimingIt is suggested that no more than 1 hour is spent on this section.
Opportunities for ICT■ Internet based research
■ Writing a job advert.
Opportunities for other key skills■ Communication – writing a job advert
■ Application of number – working out percentages and using the results todetermine temperatures from graphs
■ Working in groups.
10 Climate change
The Earth isgetting warmer
Teaching tipsThis activity should be introduced by a class discussion based on the information onthe student sheet, which can be used as an OHT.
The use of this section is threefold:
■ It presents an opportunity to recap on what has been achieved so far and to makesure that everyone is following the argument.
■ It introduces the possible causes of global warming; supporting the greenhouse gastheory with some real data.
■ It asks the questions ‘what will the effect of global warming be?’ and ‘should we bedoing anything about it?’
The aim of the final section of speech bubbles is to introduce the ideas about whatwill happen when the world warms up and what should we be doing about it? Itprovides a further focus for a class or group discussion.
The future climate activities page offers a choice of different activities.
It is not intended that all of the activities should be done by everyone. Some teachersmay give a free choice, whereas others might decide that only some are appropriatefor a particular class. You may wish to give the students some help by supplying themwith more information.
Other greenhouse gasesThe aim of this activity is to show that carbon dioxide is not the only greenhouse gasand the recent increase in global temperatures may be attributed to an increase in theamounts of CO2, CH4, CFCs and O3 in the atmosphere due to human activities.
Resources■ Student worksheets:
– A global warning – the Earth is getting warmer– Looking at the data – the Earth is getting warmer– Other greenhouse gases– Theories about global warming– Future climates – activity page
■ Internet access
TimingAllow 30 minutes for the discussion section. The other activities are research basedand are good for homework and/or another 1 hour lesson.
Adapting materialsSome teachers may wish not wish to offer all the activities on the Future climates –activity page and therefore wish to delete some of them.
Climate change 11
Opportunities for using ICT■ Internet research
■ Modelling
■ Writing a report, which may include downloaded photographs or graphs.
Opportunities for other key skills■ Communication – designing a questionnaire and letter writing
■ Working in groups.
12 Climate change
Answers The greenhouse effect and global warming
1. –18 °C
2. The surface temperature of the earth is slowly warming up.
3. Coal fired power stations, gas/ oil central heating, any type of fires, vehicles etc.
Looking at the data – temperature changes over the last century1. The general trend shows an increase in temperature. In the early 80s the
temperature was stable for about three years before it started to increase again.
2. The maximum temperature change is about 0.25 °C.
3. Most students will sketch a graph which shows another increase over the next 20years. Some students will copy the exact shape of the curve ie showing a plateauaround 2002–2005. Accept a bigger increase – as some students may alreadyknow the connection between CO2 level and temperature.
4. In the period 1960–1980 the overall temperature change was approximately zero.There was a steady decline in temperature (approximately 0.2 °C) between 1960and 1975, when it started to increase.
Whereas in the period 1940–1960, the temperature fluctuated raising to amaximum of about 0.05 °C and a minimum of about –0.05 °C.
5. Some students may chose to keep their 2000–2020 graph the same (based onprevious knowledge). Other students may redraw their graph showing a steadydecline in temperature by about 0.2 °C or they might show the graph fluctuating.
6. 1920–1940 saw a steady temperature increase from approximately –0.35 to + 0.00 °C, whereas between 1900–20 a decline in temperature was seen in thefirst decade followed by a steady increase in the second decade. The overalltemperature change was approximately –0.2 °C.
7. Accept any reasonable graph.
8. The overall temperature increase in the 20th century is approximately 0.5 °C.
9&10 It should be pointed out that there is no correct answer because so many variablesare involved. This data alone does not give enough evidence to make an accurateprediction of what will happen, but the overall temperature trend over the centuryhas been to increase, so this might favour a graph showing an increase intemperature.
11. Yes the overall trend is the same, but there are some differences in the smallertemperature fluctuations.
12. Approximately the same +0.5 °C.
13. Data has been collected using different instruments, at different times of the dayand night, in different places ie a fair test has not been carried out. Differentvariables are taken into account at different times.
Climate change 13
Looking at the data – temperature changes over several centuries1. Yes, it was cooler, the temperature change oscillated more.
2. 19th century.
3. Approximately 1699.
4. It took about 4 years to warm up by a degree.
5. Temperatures reach a similar maximum temperature and then in the late 1730s thetemperature fell again.
6. Similar temperatures.
7. Again, stress that the ‘correct’ answer is unknown, accept any reasonable attempt.
8, 9, 10. Teachers may wish each group to report back.
Looking at the data – extension sheetAt this point it may be appropriate to summarise the results so far.
1. Conclusion – the evidence considered so far indicates that the surface temperatureof the Earth has increased by about 0.5 °C during the 20th century, but theevidence is too limited to make firm predictions about future temperature changes.
2. In practice several different methods are used. Geologists look for fossilised /petrified plants and animals, in sediment cores from fresh water lakes and theseabed. Surface rocks can also be used to reveal clues. They use the temperaturesthat these animals lived in to determine the temperature. Ice cores are used todetermine the temperature by looking at the ratio of oxygen isotopes. Air pocketsare sampled to reveal CO2 levels from past climates. Accept any reasonableanswers.
Collecting climatic data that is millions of years old1. The main problem is that the ecology may have evolved and the plants are
different. The plants growing in the Southern hemisphere are not as welldocumented as the plants in the Northern hemisphere.
2. a) 40% smooth = 12 °Cb) 70% smooth = 22 °Cc) 20% smooth = 7 °Cd) 90% smooth = 28 °Ce) 30% smooth = 10 °Cf) 50% smooth = 16 °C
3. a) Photograph A, the tree rings are wide indicating a lot of growth during the season. This tree grew very well under a greenhouse climate with plenty of water and warm temperatures. It is 100 million years old.
b) Photograph B, some of the rings are closer together than others, indicating years when the tree did not grow much, due to lack of water.
c) Photograph B shows the occasional drought, most of the time it grew well. Note the round holes were formed by boring worms when the tree was driftwood. The holes were then filled with sea floor sediment. The wood is now petrified.

14 Climate change
Extension question – The answer should indicate some understanding that moderninstruments are much more sensitive than they were even fifty years ago. Also thereadings are now taken from all over the world, whilst early readings are limitedgeographically. Temperatures obtained from oxygen isotopes are measured using verysensitive equipment, but the method is built upon several assumptions. Temperaturescollected by fossil methods are much less accurate because it is much harder to getlarge enough sample sizes and some temperatures are estimated using the nearestliving relative! Exact measurements are not made.
Looking at climatic data from the past1. There has been a small temperature decrease before stabilising out.
2. 16,000 and 50,000 years ago.
3. 12000, 22000, 36000 years ago.
4. The last time the temperature was similar to that today, it was followed by agradual decrease over the next 10000 years. This could happen again.
5. It has not really varied but been stable.
6. Approx. 124–128000 years ago.
7. 5 °C lower than today.
8. 20–30000, 60–70000 and 140–150000 years ago.
9. 140–150000 years ago.
10. The temperature rose to reach the maximum recorded temperature (greater thantoday’s temperature). Over the next 200 years the temperature rapidly dropped totoday’s temperature, where is stabilised out over the next 400 years before itcontinued to drop further.
11. Temperatures continued to drop until they reached a minimum.
12. It may follow the pattern of 130000–100000 years ago, plunging us into the nextice age.
13. Last 10000 years have seen a stable temperature.
14. Sediment cores show temperature changes of 10 °C, whereas the ice cores showchanges of only 5 °C.
15. Yes, they follow the same general pattern.
16. Different methods of collection. Maybe harder to determine the timescale insediments as they take longer to form.
17. Problems – Which set of data is correct? Should we only look at patterns and notactual numbers? Question – Why should the temperature vary so much? Whatcauses the temperature trend to change direction?
18. a) Warmer that today. b) 3c) One every 100–200 million years.
19. Not really, but it does show that the Earth’s climate has changed many times in thepast and will change again.
Climate change 15
Looking at the data – the Earth is getting warmer1. The evidence strongly suggests that there is a firm link between the amount of CO2
in the air and the average surface temperature of the Earth.
Other greenhouse gases1. It increases.
2. Yes, because the data appears to show a link between the temperature and theamount of CH4 in the atmosphere.
3. 1800
4. It increased at a much faster rate.
5. 1950s
6. Around 1950
7. Yes, because the global temperature increase since 1950 corresponds to theincreased levels of these gases.
8. CH4 at 10 years
9. Accept N2O or CO2
10. If time permits teachers could give the opportunity for some pupils to present theirspeeches to the class. In which case, please specify how long the speech should be.You may need to make some of the other worksheets such as The greenhouseeffect and global warming available. This could be carried out as a group activity.

PHO
TOCOP
YP A Global Warning – Is the Earth getting warmer? – page 1 of 1
Ihave heard that scientists cant agree.
Global warming or cooling?
Yes, I think so but...
About what?
Dont be silly, they must.
They all use the same data.
Im not sure... my Dad says the Times is a good paper...
but when you look up global warming everything seems to
be confused. Just look at some of the headlines.
Oh, I see what you mean.
We will just have to look at the real data and
make up our own minds. But where should
we start?
Greenhouse Effect makes a come back
27/7/89 Met. Office says globalwarming is just a myth11/9/94
Ice age may be50000 years late.6/1/99
A climate of confusio
n
Can we rely on the climate models. Its really hard to
get good data to feed into the model.
27/9/95GlobalWarminganomalysolvedPosition of satellite probe
Then what s the problem?
A Global WarningIs the Earth getting warmer?

PHO
TOCOP
YPThe greenhouse effect and global warming – page 1 of 1
The greenhouse effect and global warmingA garden greenhouse keeps plants warmer than they would be outside. It does this because the glass traps some ofthe Sun’s radiation energy. The atmosphere keeps the Earth warm in a similar way. Without the greenhouse effectthe earth would be about 33 °C cooler than today’s pleasant average of 15 °C. Greenhouse gases include carbondioxide, oxides of nitrogen, methane, chlorofluorocarbons (CFCs) and water.
Show that you understand the greenhouse effect by cutting out the labels and sticking them on to the diagrambelow.
Questions1. If the greenhouse effect did not exist, what would the normal temperature of the
earth be?
2. What do you think is meant by global warming?
3. List all the things you can think of that give off greenhouse gases – eg cars.
Atmosphere Earth Sun Energy radiated Earth heats up
Some energyradiated back
into space
Greenhouseeffect
Greenhouse gasesabsorb some energy and
reflect it back to earth
PHO
TOCOP
YP Looking at the data – temperature changes over the last century – page 1 of 2
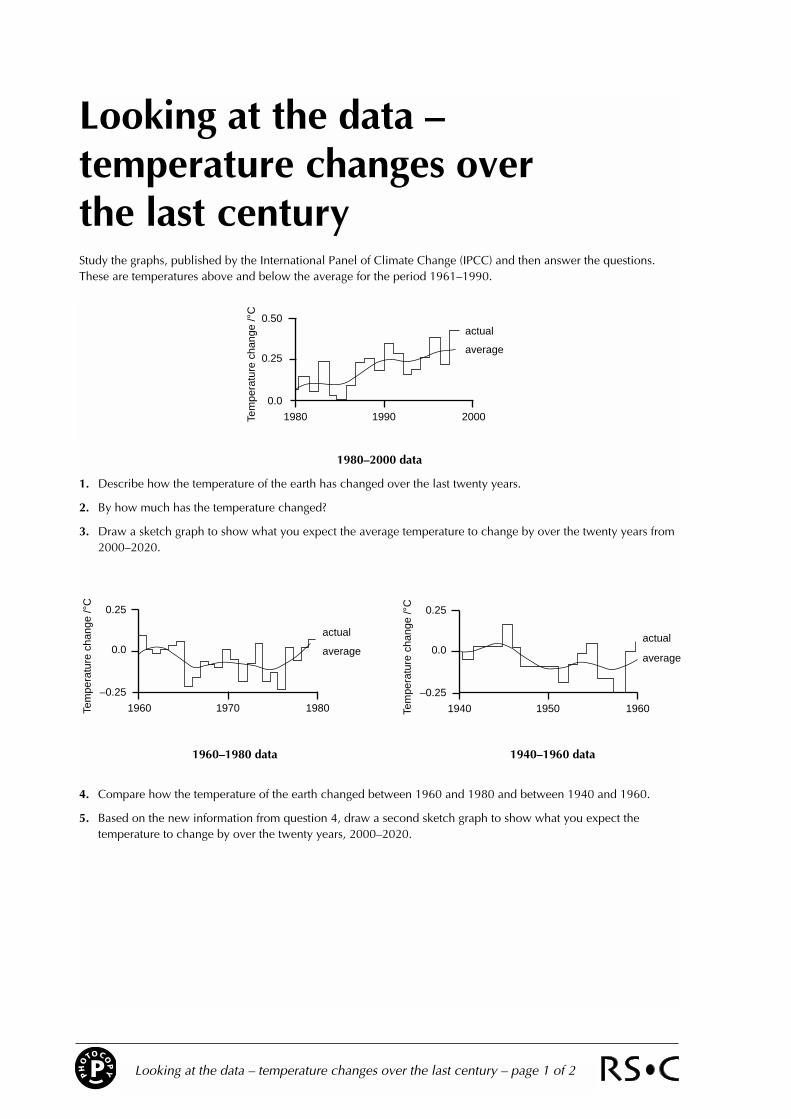
Looking at the data – temperature changes over the last centuryStudy the graphs, published by the International Panel of Climate Change (IPCC) and then answer the questions.These are temperatures above and below the average for the period 1961–1990.
1980–2000 data
1. Describe how the temperature of the earth has changed over the last twenty years.
2. By how much has the temperature changed?
3. Draw a sketch graph to show what you expect the average temperature to change by over the twenty years from2000–2020.
1960–1980 data 1940–1960 data
4. Compare how the temperature of the earth changed between 1960 and 1980 and between 1940 and 1960.
5. Based on the new information from question 4, draw a second sketch graph to show what you expect thetemperature to change by over the twenty years, 2000–2020.
actual
average
1980 1990 2000
0.0
0.25
0.50
Tem
pera
ture
cha
nge
/°C
actual
average
1960 1970 1980
–0.25
0.0
0.25
Tem
pera
ture
cha
nge
/°C
actual
average
1940 1950 1960
–0.25
0.0
0.25
Tem
pera
ture
cha
nge
/°C
PHO
TOCOP
YPLooking at the data – temperature changes over the last century – page 2 of 2
1920–1940 data 1900–1920 data
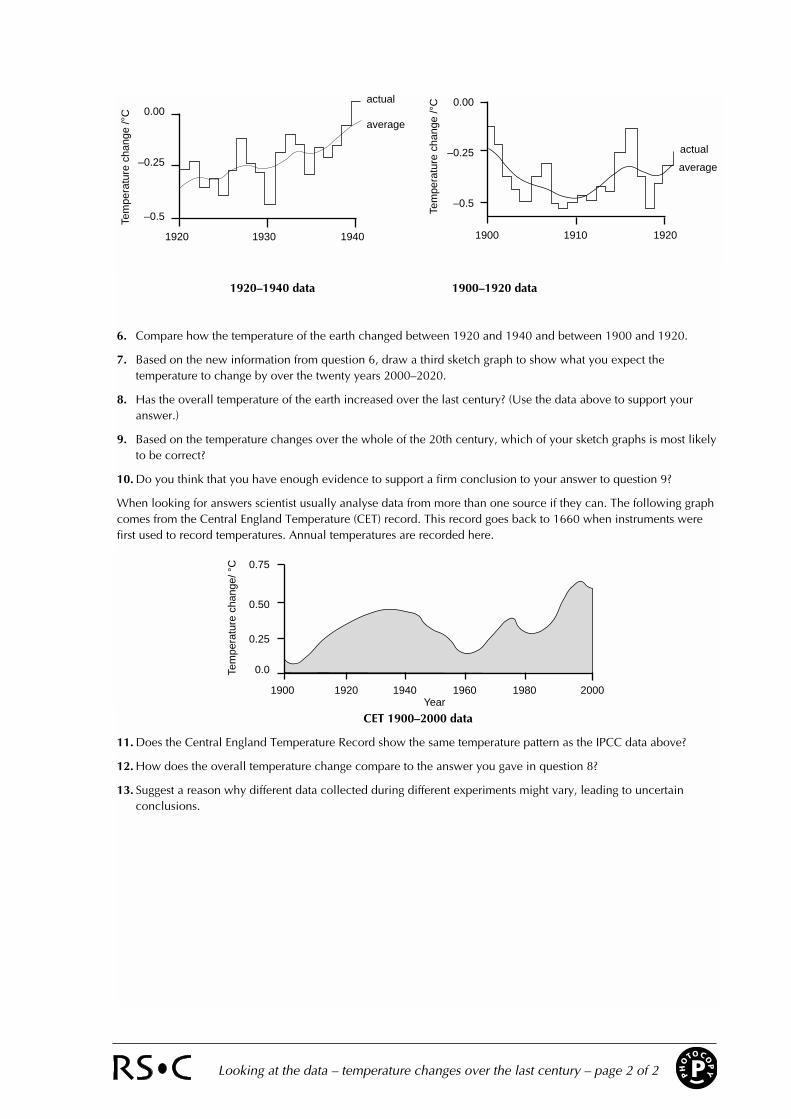
6. Compare how the temperature of the earth changed between 1920 and 1940 and between 1900 and 1920.
7. Based on the new information from question 6, draw a third sketch graph to show what you expect thetemperature to change by over the twenty years 2000–2020.
8. Has the overall temperature of the earth increased over the last century? (Use the data above to support youranswer.)
9. Based on the temperature changes over the whole of the 20th century, which of your sketch graphs is most likelyto be correct?
10. Do you think that you have enough evidence to support a firm conclusion to your answer to question 9?
When looking for answers scientist usually analyse data from more than one source if they can. The following graphcomes from the Central England Temperature (CET) record. This record goes back to 1660 when instruments werefirst used to record temperatures. Annual temperatures are recorded here.
CET 1900–2000 data
11. Does the Central England Temperature Record show the same temperature pattern as the IPCC data above?
12. How does the overall temperature change compare to the answer you gave in question 8?
13. Suggest a reason why different data collected during different experiments might vary, leading to uncertainconclusions.
0.75
0.50
0.25
0.0
1900 1920 1940 1960 1980 2000Year
Tem
pera
ture
cha
nge/
°C
actual
average
1920 1930 1940
–0.5
–0.25
0.00Te
mpe
ratu
re c
hang
e /°
C
actual
average
1900 1910 1920
–0.5
–0.25
0.00
Tem
pera
ture
cha
nge
/°C

PHO
TOCOP
YP Looking at the data – temperature changes over several centuries – page 1 of 2
Looking at the data – temperaturechanges over several centuriesStudy the graphs, from the Central England Temperature record (CET) and then answer the questions.
CET 1900–2000 data
CET 1800–1900 data
1. Do you think that the temperature changes seen in the 19th century were any different to those seen in the 20thcentury?
2. Which century was the coldest?
You may have seen pictures of people ice skating on the river Thames. At the same time, other places in Europewere also suffering from long bitterly cold winters and cold wet summers. This cooler period is often known as the‘Little Ice Age’.
CET 1660–2000 data
3. When do you think the end of the Little Ice Age was?
4. After the Little Ice Age, how long did it take to warm up?
5. Compare the temperatures of the 1730s and 1740s with the present temperature.
0.75
0.50
0.25
0.0
1900 1920 1940 1960 1980 2000Year
Tem
pera
ture
cha
nge/
°C
+0.5
0.25
–0.25
–0.5
1800 1820 1840 1860 1880 1900Year
Tem
pera
ture
/ °C
0.0
+0.75
+0.50
+0.250.0
–0.25–0.50–0.75
Tem
pera
ture
/ °C
1660
1680
1700
1720
1740
1760
1780
1800
1820
1840
1860
1880
1900
1920
1940
1960
1980
2000
Year
PHO
TOCOP
YPLooking at the data – temperature changes over several centuries – page 2 of 2
6. How do these values compare to the temperature in the 1930s?
7. How do you think the temperature will vary over the next twenty years?
In groups of 3 or 48. Look back at the conclusions you came to about how you think the average temperature will change based on:
■ the 1980–2000 data■ the 1940–1980 data■ the 1900–1940 data■ the 1660–2000 data
Try and decide if any are correct.
9. What is your overall conclusion about global warming?
10. Has the data changed your views about global warming?
If you have time, go on to the extension sheet.
PHO
TOCOP
YP Looking at the data – extension sheet – page 1 of 1
Looking at the data – extension sheetQuestion 1. Looking at the data, does the evidence so far support a firm conclusion?
Explain your answer.
So far you have investigated data from two different sources. The Central EnglandTemperature record goes back for 340 years, which is a very long experiment, butwhen we stop and think about the age of the earth, 340 years is a very short length oftime because the Earth is millions of years old. To help support our conclusion we needto take our temperature investigation back further. To do this a new method ofdetermining temperature (and time) must be found.
Question 2. Can you think of anything that scientists could use to help discover what the temperature was hundreds, thousands and even millions of years ago?
Background informationRecently leading scientists have also tried to answer the above question. Their searchfor complete temperature records has taken them to some places on Earth where manypeople do not go, such as the middle of the Atlantic and Pacific oceans, and the ice andsnow of Greenland and Antarctica. The scientists have applied an idea that the ‘fatherof geology’, James Hutton had in the 1700s.
In the 1700s James Hutton from Edinburgh realised that the key to understanding the future of the planet wasby investigating the past. James Hutton was the first man to study the rocks and realise that the Earth wasmillions of years old. He introduced the idea of geological time, and used fossils to learn about previous ages.Hutton’s ideas were very controversial at the time because in 1650 Archbishop James Ussher of Irelandcompleted his dating of the Earth using biblical evidence.
Ussher declared that the world was created on the evening of October 22, 4004 BC, and was less than 6000years old.
PHO
TOCOP
YPCollecting climatic data from ice and sediment cores – page 1 of 2
Information sheet – collecting climatic data from ice and sediment cores
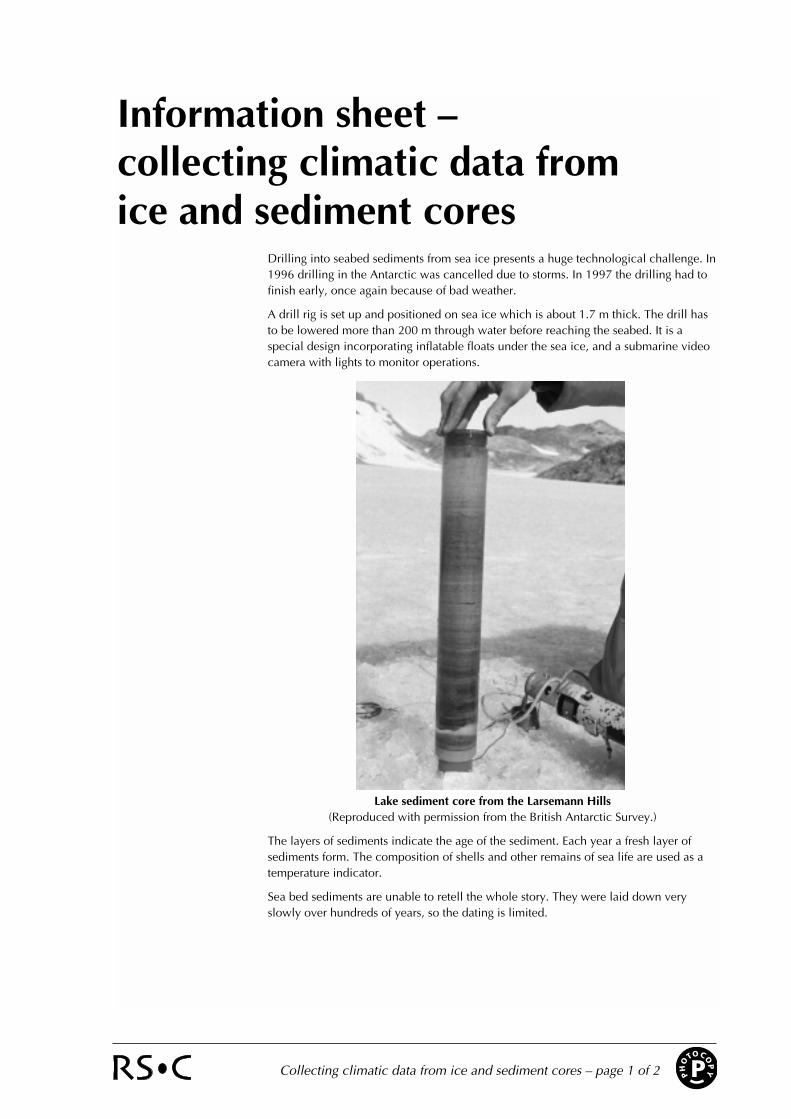
Drilling into seabed sediments from sea ice presents a huge technological challenge. In1996 drilling in the Antarctic was cancelled due to storms. In 1997 the drilling had tofinish early, once again because of bad weather.
A drill rig is set up and positioned on sea ice which is about 1.7 m thick. The drill hasto be lowered more than 200 m through water before reaching the seabed. It is aspecial design incorporating inflatable floats under the sea ice, and a submarine videocamera with lights to monitor operations.
Lake sediment core from the Larsemann Hills(Reproduced with permission from the British Antarctic Survey.)
The layers of sediments indicate the age of the sediment. Each year a fresh layer ofsediments form. The composition of shells and other remains of sea life are used as atemperature indicator.
Sea bed sediments are unable to retell the whole story. They were laid down veryslowly over hundreds of years, so the dating is limited.
PHO
TOCOP
YP Collecting climatic data from ice and sediment cores – page 2 of 2
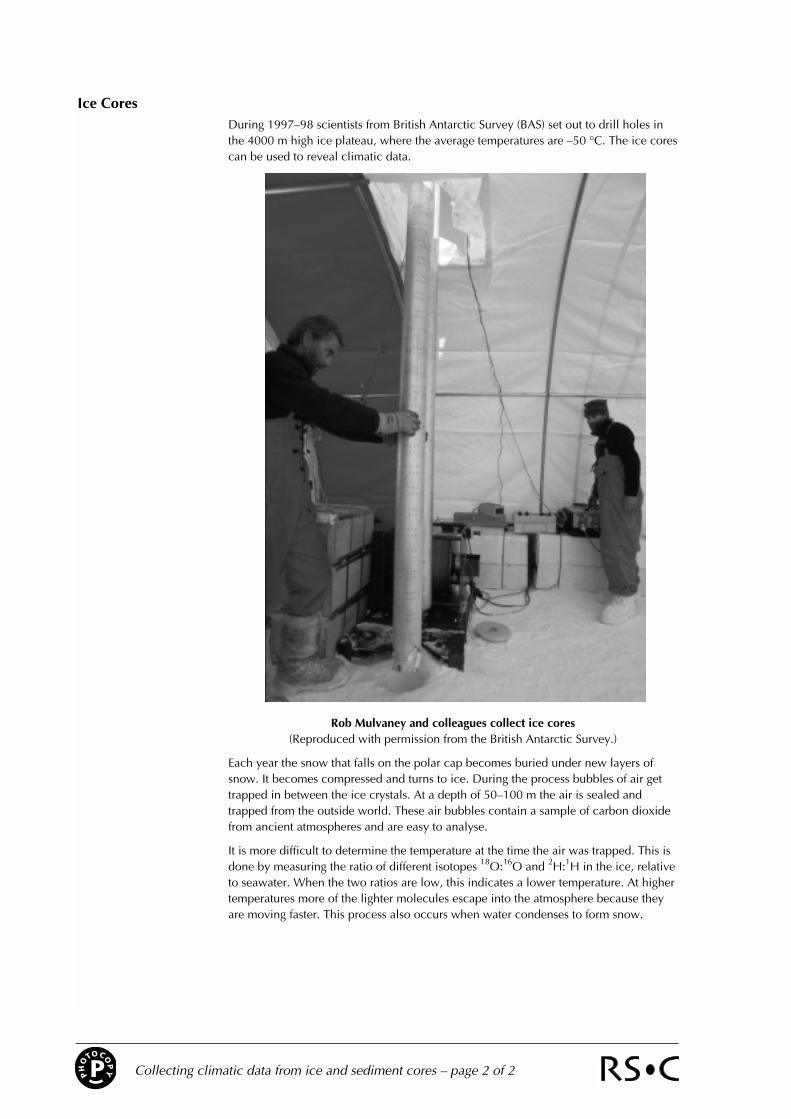
Ice CoresDuring 1997–98 scientists from British Antarctic Survey (BAS) set out to drill holes inthe 4000 m high ice plateau, where the average temperatures are –50 °C. The ice corescan be used to reveal climatic data.
Rob Mulvaney and colleagues collect ice cores(Reproduced with permission from the British Antarctic Survey.)
Each year the snow that falls on the polar cap becomes buried under new layers ofsnow. It becomes compressed and turns to ice. During the process bubbles of air gettrapped in between the ice crystals. At a depth of 50–100 m the air is sealed andtrapped from the outside world. These air bubbles contain a sample of carbon dioxidefrom ancient atmospheres and are easy to analyse.
It is more difficult to determine the temperature at the time the air was trapped. This isdone by measuring the ratio of different isotopes 18O:16O and 2H:1H in the ice, relativeto seawater. When the two ratios are low, this indicates a lower temperature. At highertemperatures more of the lighter molecules escape into the atmosphere because theyare moving faster. This process also occurs when water condenses to form snow.
PHO
TOCOP
YP Collecting climatic data that is millions of years old – page 1 of 3
Collecting climatic data that is millions of years oldTo investigate what the climate was like millions of years ago, geologists look to fossilised plants. By studyingdifferent types of plants they can gather climatic information, such as annual temperature range and wateravailability that corresponds to the time when the plant was living. This data can then be fed into computer climatemodels. Fossilised animals and pollen found in the same area, together with the position in the rock layer where theplants are found, are often used to age the fossilised plants.
Several different techniques are used to gather temperature information. Here are three methods that are used.
1. Fossil flora are compared to the nearest living plants today and the temperature is extrapolated back.
Question 1. What do you think is the main problem with this method?
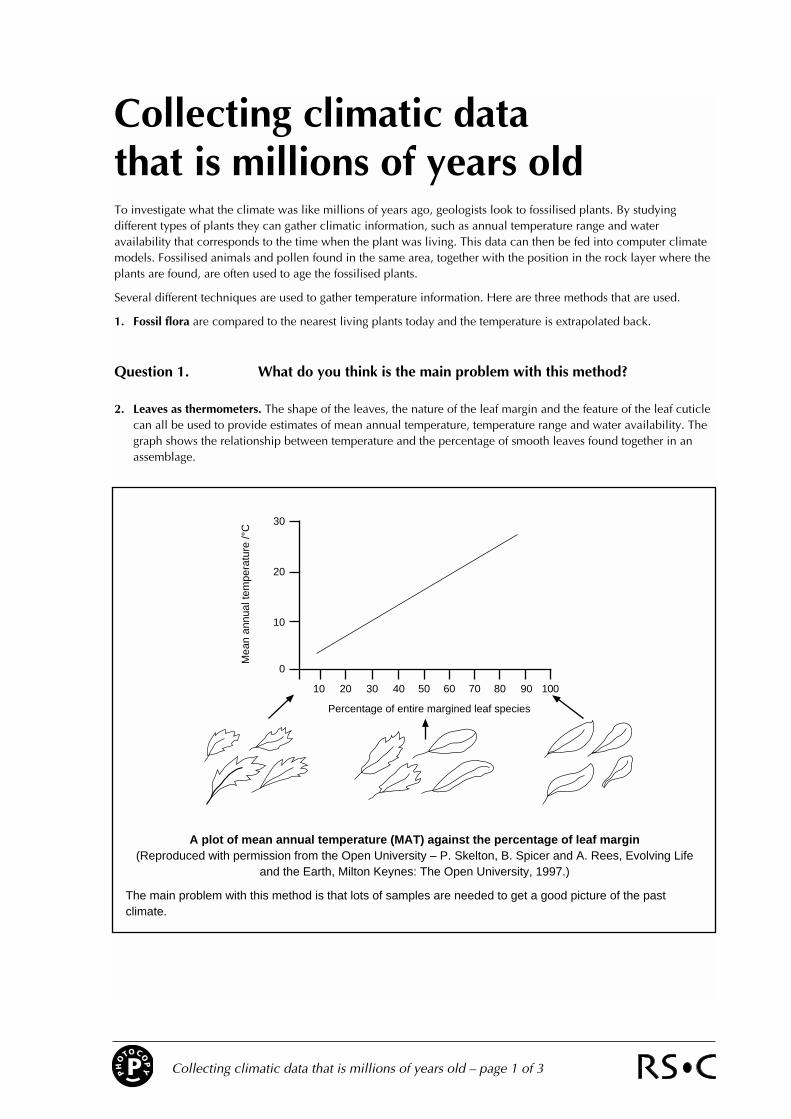
2. Leaves as thermometers. The shape of the leaves, the nature of the leaf margin and the feature of the leaf cuticlecan all be used to provide estimates of mean annual temperature, temperature range and water availability. Thegraph shows the relationship between temperature and the percentage of smooth leaves found together in anassemblage.
A plot of mean annual temperature (MAT) against the percentage of leaf margin(Reproduced with permission from the Open University – P. Skelton, B. Spicer and A. Rees, Evolving Life
and the Earth, Milton Keynes: The Open University, 1997.)
The main problem with this method is that lots of samples are needed to get a good picture of the pastclimate.
30
20
10
0
10 20 30 40 50 60 70 80 90 100
Percentage of entire margined leaf species
Mea
n an
nual
tem
pera
ture
/°C

PHO
TOCOP
YPCollecting climatic data that is millions of years old – page 2 of 3
Question 2. Using the graph, work out the mean annual temperatures if the following leaves were found together in an assemblage.
a) Temperature = b) Temperature =
c) Temperature = d) Temperature =
e) Temperature = f) Temperature =
PHO
TOCOP
YP Collecting climatic data that is millions of years old – page 3 of 3
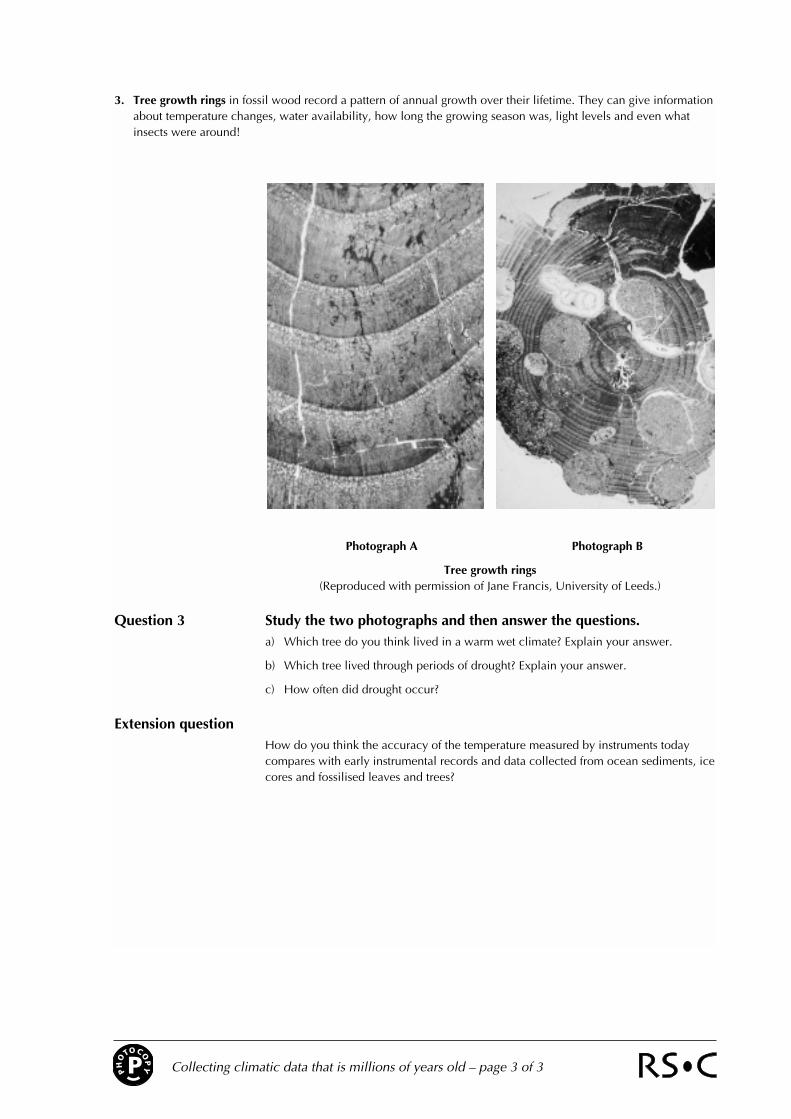
3. Tree growth rings in fossil wood record a pattern of annual growth over their lifetime. They can give informationabout temperature changes, water availability, how long the growing season was, light levels and even whatinsects were around!
Photograph A Photograph B
Tree growth rings(Reproduced with permission of Jane Francis, University of Leeds.)
Question 3 Study the two photographs and then answer the questions.a) Which tree do you think lived in a warm wet climate? Explain your answer.
b) Which tree lived through periods of drought? Explain your answer.
c) How often did drought occur?
Extension questionHow do you think the accuracy of the temperature measured by instruments todaycompares with early instrumental records and data collected from ocean sediments, icecores and fossilised leaves and trees?
PHO
TOCOP
YPLooking at climatic data from the past – page 1 of 3
Looking at climatic datafrom the past
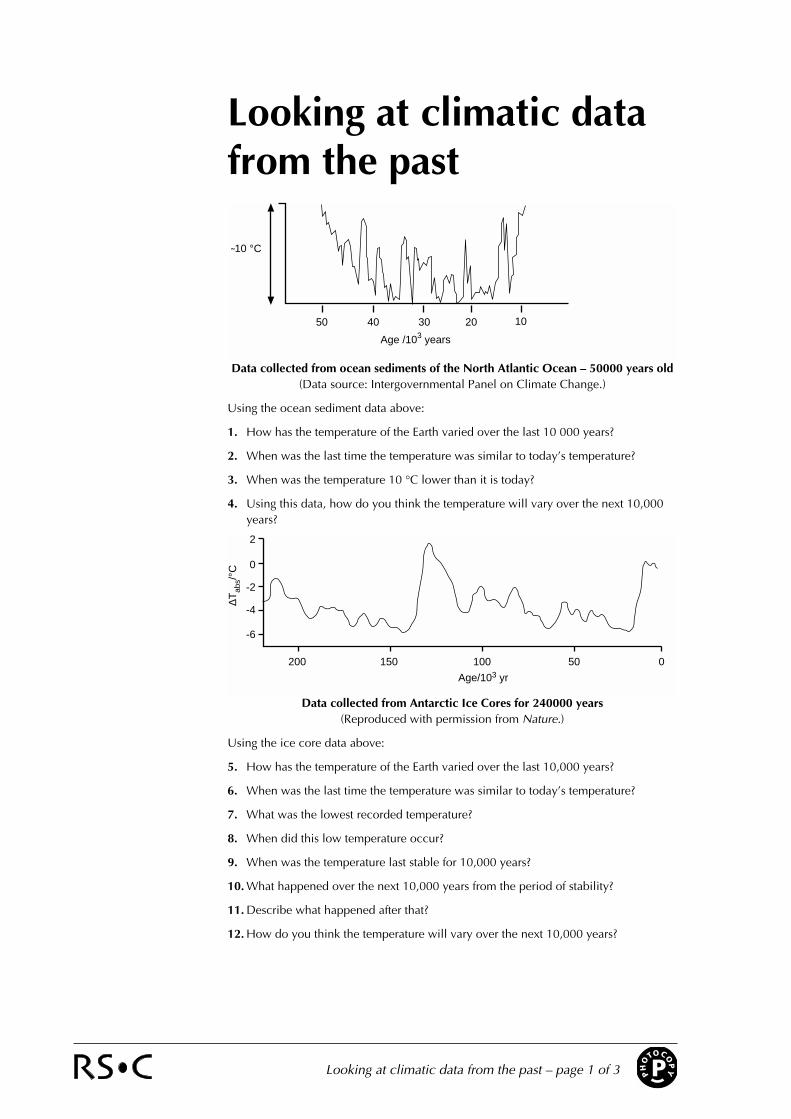
Data collected from ocean sediments of the North Atlantic Ocean – 50000 years old(Data source: Intergovernmental Panel on Climate Change.)
Using the ocean sediment data above:
1. How has the temperature of the Earth varied over the last 10 000 years?
2. When was the last time the temperature was similar to today’s temperature?
3. When was the temperature 10 °C lower than it is today?
4. Using this data, how do you think the temperature will vary over the next 10,000years?
Data collected from Antarctic Ice Cores for 240000 years(Reproduced with permission from Nature.)
Using the ice core data above:
5. How has the temperature of the Earth varied over the last 10,000 years?
6. When was the last time the temperature was similar to today’s temperature?
7. What was the lowest recorded temperature?
8. When did this low temperature occur?
9. When was the temperature last stable for 10,000 years?
10. What happened over the next 10,000 years from the period of stability?
11. Describe what happened after that?
12. How do you think the temperature will vary over the next 10,000 years?
200 150 100 50 0
2
0
-2
-4
-6
∆Tab
s/°C
Age/103 yr
50 40 30 20 10
Age /103 years
˜10 °C

PHO
TOCOP
YP Looking at climatic data from the past – page 2 of 3
Comparing data from (a) sediments of the North Atlantic Ocean, with (b) data collected from Antarctic ice cores
(Data source: Intergovernmental Panel on Climate Change)
13. Look at the two data sets above and write down when the results agree.
14. Look at the two data sets and write down when the results disagree.
15. Do the two sets of data follow the same patterns?
16. Suggest a reason why the data sets are not the same.
17. When interpreting data and predicting future global temperatures what do youthink are the main problems / questions facing scientists?
Many scientists are very concerned about the temperature of the Earth and thus manyare employed to research into the past to try and understand what is happening in thepresent.
Data covering even longer timescales is shown on the next page.
50 40 30 20 10Age /103 years
˜10 °C
˜5 °C
50 40 30 20 10
Age /103 years
(a)
(b)
PHO
TOCOP
YP
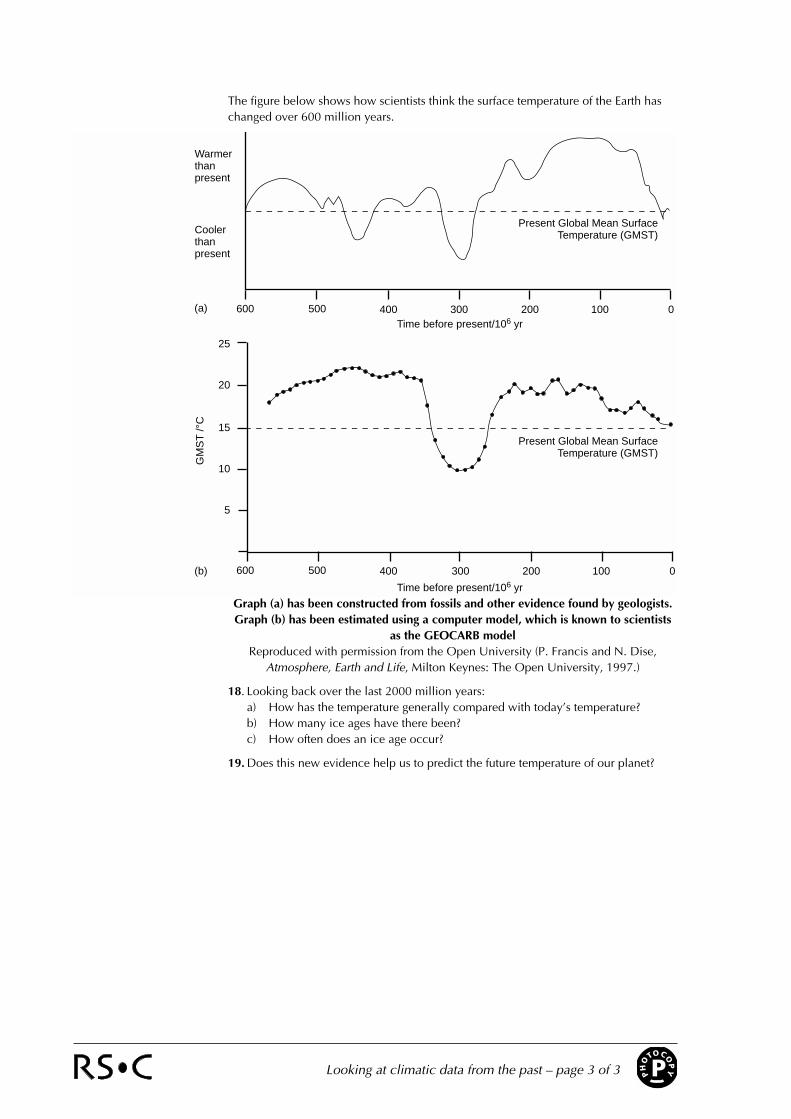
The figure below shows how scientists think the surface temperature of the Earth haschanged over 600 million years.
Graph (a) has been constructed from fossils and other evidence found by geologists.Graph (b) has been estimated using a computer model, which is known to scientists
as the GEOCARB modelReproduced with permission from the Open University (P. Francis and N. Dise,
Atmosphere, Earth and Life, Milton Keynes: The Open University, 1997.)
18. Looking back over the last 2000 million years:a) How has the temperature generally compared with today’s temperature?b) How many ice ages have there been?c) How often does an ice age occur?
19. Does this new evidence help us to predict the future temperature of our planet?
Looking at climatic data from the past – page 3 of 3
Warmerthanpresent
Coolerthanpresent
600 500 400 300 200 100 0
Present Global Mean SurfaceTemperature (GMST)
Time before present/106 yr
(a)
25
20
15
10
5
600 500 400 300 200 100 0
Time before present/106 yr
GM
ST
/°C
(b)
Present Global Mean SurfaceTemperature (GMST)
PHO
TOCOP
YPLife as a scientist in Antarctica – page 1 of 4
Life as a scientist in AntarcticaDr Jane Francis has been on geological expeditions to Antarctica. She works in thedepartment of Earth Science at the University of Leeds. We interviewed her to find outwhat life was like as an expedition scientist.
Map of the South Pole – the arrow indicates Livingstone Island(Map reproduced by courtesy of the British Antarctic Survey.)
Q Where is Antarctica?
A Near the South Pole
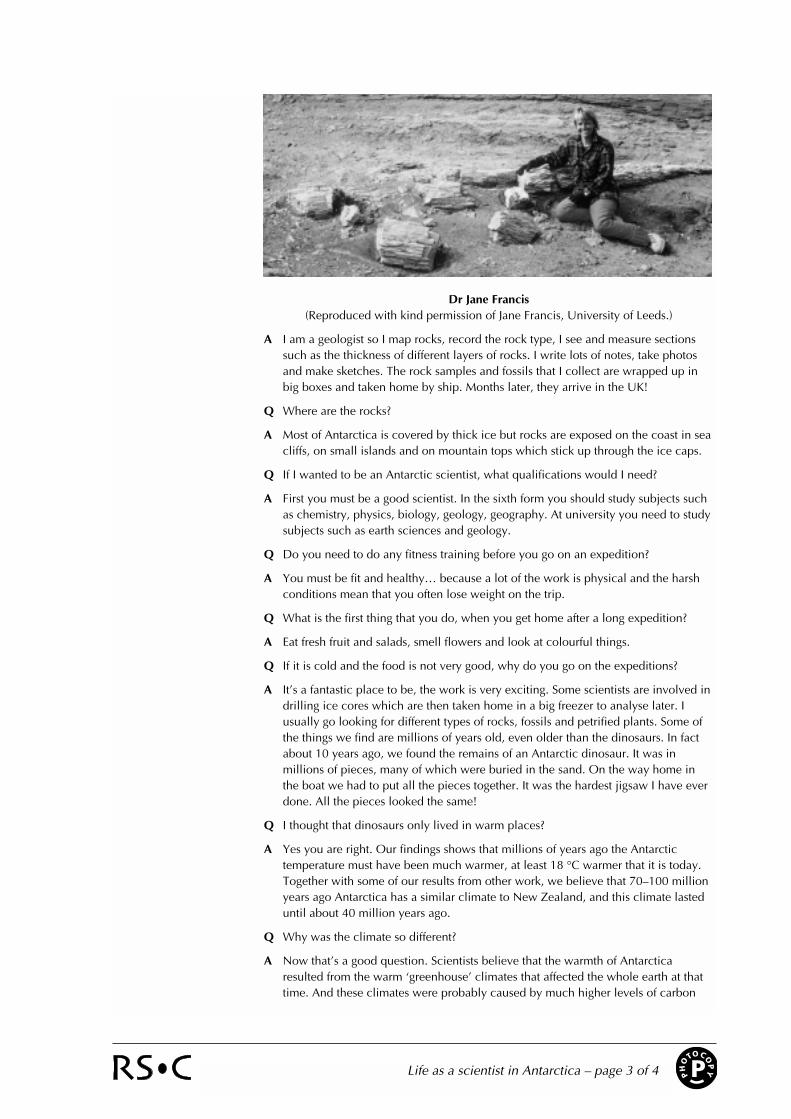
Livingstone Island, Antarctic Peninsula(Reproduced with kind permission of Jane Francis, University of Leeds.)
Q How do you get to Antarctica?
A By boat and plane. We fly from the UK to the Falkland Islands, then catch a ship toAntarctica.
Q How long does the expedition last?
A Usually 2 or 3 months during the summer, December to February. During this timeit is light for most of the day and night because it is so near the South Pole.
Q Where do you stay?
A In tents as close as possible to the rocks we are working on. The tents take twopeople and we sleep and cook in them. They are very windproof and quite warm.

PHO
TOCOP
YP Life as a scientist in Antarctica – page 2 of 4
Expedition tents and storage boxes(Reproduced with kind permission of Jane Francis, University of Leeds.)
Q Does is get very cold?
A Yes, we have to wrap up warm. I wear three pairs of socks and often five layers ofclothes. Sometimes it is too cold to go outside and we have to stay in the tents (lie-ups). When it snows we read a lot of books and play games.
Generally, the weather in the summer is usually very good, clean air, blue skies,warm sun but very strong winds, so temperatures are below freezing. Also we canhave blizzards and a lot of snow. We have to wear sunglasses all the time andsunscreen on our faces because it is very easy to get very sunburnt because of theozone hole!
Q How many people in the group?
A 2–5. Each scientist has a field assistant for safety.
Q What do you eat?
A A lot of high energy dried food such as soya, dried fruit, porridge and tons ofchocolate for energy. We drink a lot of tea because we get dehydrated in the coldair.
Q Where do you wash?
A We don’t, its too cold! You don’t smell in cold temperatures. Also, sometimes thereis a shortage of water because we have to melt ice to make water and that uses upprecious fuel supplies.
Q What do you do in the evening?
A It takes a lot of the evening to cook dinner on one small stove. Then we work, wehave to write up the notes from the day’s work.
Q Do you miss your home, while you are away?
A Yes, but the work is very interesting and Antarctica is such a beautiful and excitingplace to be.
Q What work do you do?
PHO
TOCOP
YPLife as a scientist in Antarctica – page 3 of 4
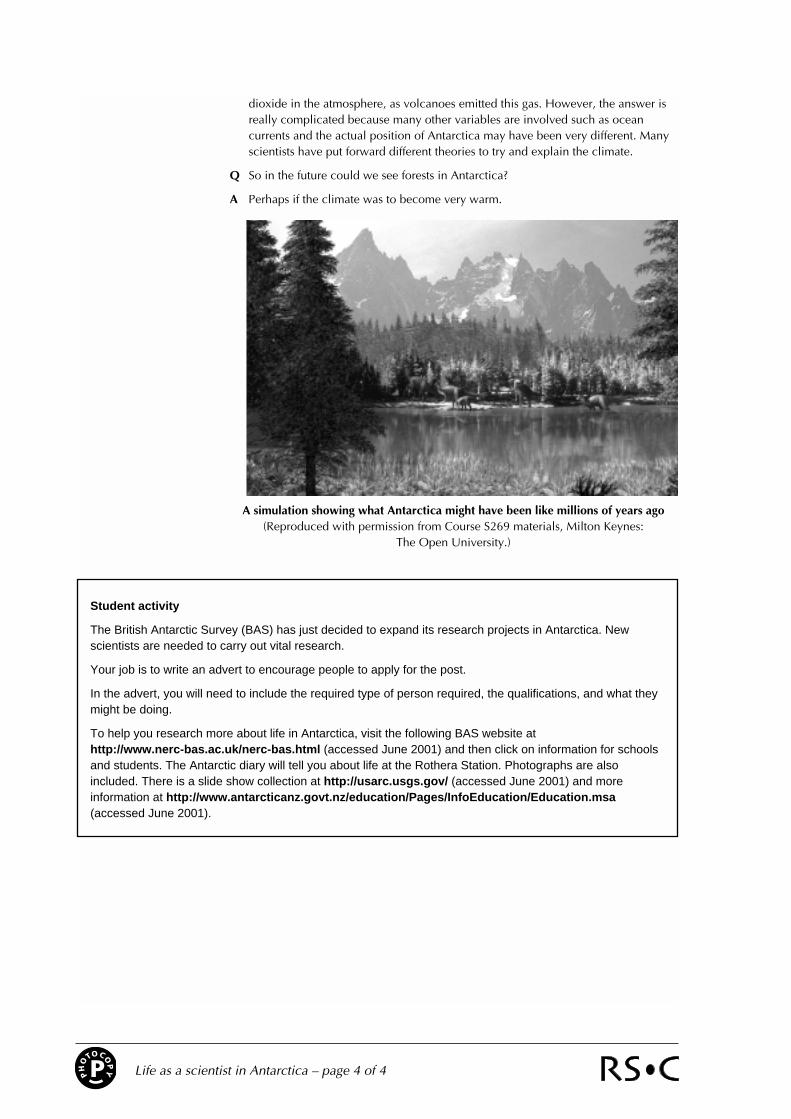
Dr Jane Francis(Reproduced with kind permission of Jane Francis, University of Leeds.)
A I am a geologist so I map rocks, record the rock type, I see and measure sectionssuch as the thickness of different layers of rocks. I write lots of notes, take photosand make sketches. The rock samples and fossils that I collect are wrapped up inbig boxes and taken home by ship. Months later, they arrive in the UK!
Q Where are the rocks?
A Most of Antarctica is covered by thick ice but rocks are exposed on the coast in seacliffs, on small islands and on mountain tops which stick up through the ice caps.
Q If I wanted to be an Antarctic scientist, what qualifications would I need?
A First you must be a good scientist. In the sixth form you should study subjects suchas chemistry, physics, biology, geology, geography. At university you need to studysubjects such as earth sciences and geology.
Q Do you need to do any fitness training before you go on an expedition?
A You must be fit and healthy… because a lot of the work is physical and the harshconditions mean that you often lose weight on the trip.
Q What is the first thing that you do, when you get home after a long expedition?
A Eat fresh fruit and salads, smell flowers and look at colourful things.
Q If it is cold and the food is not very good, why do you go on the expeditions?
A It’s a fantastic place to be, the work is very exciting. Some scientists are involved indrilling ice cores which are then taken home in a big freezer to analyse later. Iusually go looking for different types of rocks, fossils and petrified plants. Some ofthe things we find are millions of years old, even older than the dinosaurs. In factabout 10 years ago, we found the remains of an Antarctic dinosaur. It was inmillions of pieces, many of which were buried in the sand. On the way home inthe boat we had to put all the pieces together. It was the hardest jigsaw I have everdone. All the pieces looked the same!
Q I thought that dinosaurs only lived in warm places?
A Yes you are right. Our findings shows that millions of years ago the Antarctictemperature must have been much warmer, at least 18 °C warmer that it is today.Together with some of our results from other work, we believe that 70–100 millionyears ago Antarctica has a similar climate to New Zealand, and this climate lasteduntil about 40 million years ago.
Q Why was the climate so different?
A Now that’s a good question. Scientists believe that the warmth of Antarcticaresulted from the warm ‘greenhouse’ climates that affected the whole earth at thattime. And these climates were probably caused by much higher levels of carbon
PHO
TOCOP
YP Life as a scientist in Antarctica – page 4 of 4
dioxide in the atmosphere, as volcanoes emitted this gas. However, the answer isreally complicated because many other variables are involved such as oceancurrents and the actual position of Antarctica may have been very different. Manyscientists have put forward different theories to try and explain the climate.
Q So in the future could we see forests in Antarctica?
A Perhaps if the climate was to become very warm.
A simulation showing what Antarctica might have been like millions of years ago(Reproduced with permission from Course S269 materials, Milton Keynes:
The Open University.)
Student activity
The British Antarctic Survey (BAS) has just decided to expand its research projects in Antarctica. Newscientists are needed to carry out vital research.
Your job is to write an advert to encourage people to apply for the post.
In the advert, you will need to include the required type of person required, the qualifications, and what theymight be doing.
To help you research more about life in Antarctica, visit the following BAS website at http://www.nerc-bas.ac.uk/nerc-bas.html (accessed June 2001) and then click on information for schoolsand students. The Antarctic diary will tell you about life at the Rothera Station. Photographs are alsoincluded. There is a slide show collection at http://usarc.usgs.gov/ (accessed June 2001) and moreinformation at http://www.antarcticanz.govt.nz/education/Pages/InfoEducation/Education.msa(accessed June 2001).
PHO
TOCOP
YPA Global Warning – The Earth is getting warmer – page 1 of 1
A Global WarningThe Earth is getting warmer
Now that I have seen
the data, I see why scientists
cannot agree about global
warming.Yes, the data is really confusing
and there is so much of it.
We cant really draw any firm
conclusions.
It could get hotter or cooler.
How?
What do you mean?
Was he right? Is there evidence to
support his theory?
History tells us
that it is always getting
hotter and cooler.
So, whats all the fuss about? Scientists cant
control the temperature of the Earth, can they?
Well, some people think that we are
causing global warming.
By burning fossil fuels, of course!
Well, in 1897, a Swedish Chemist called
Arrhenius, made up this theory, Carbon
dioxide emissions from the burning of coal
would increase the Earths Greenhouse Effect
and lead to global warming?
Have a look at these
graphs and make your
own mind up.

PHO
TOCOP
YP Looking at the data – the Earth is getting warmer – page 1 of 2
Looking at the data – the Earth is getting warmer
The atmospheric concentration of carbon dioxide between 1958 and 1992 at Mauna Loa, Hawaii
Data from Antarctica showing CO2 levels and temperatures over the last 240,000 years(Reproduced with permission from Nature.)
350
330
320
1960 1965 1970 1975 1980 1985
Average level
Actual level
Car
bon
diox
ide
conc
entr
atio
n in
ppm
300
250
200
glaciation glaciationinterglacial
period
atm
osph
eric
CO
2/pp
m
200 150 100 50 0
2
0
-2
-4
-6
200 150 100 50 0
age/103 yr
∆Tat
m/°
C
(a)
(b)
PHO
TOCOP
YP
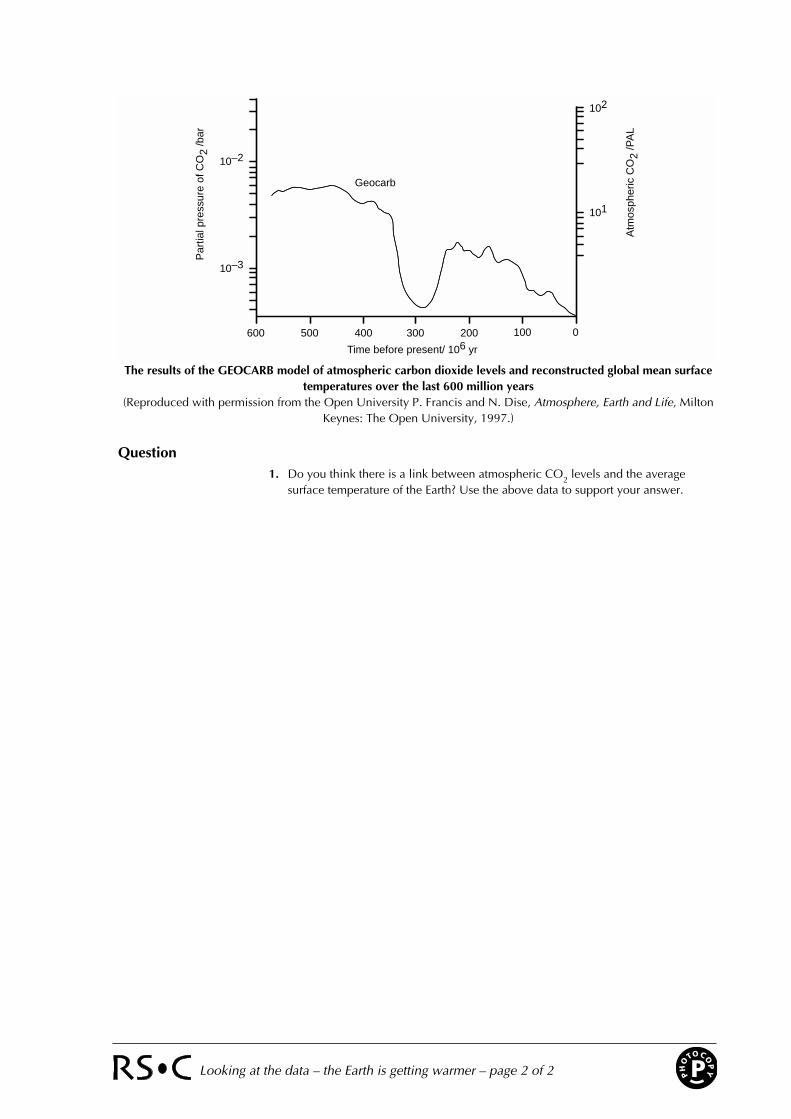
The results of the GEOCARB model of atmospheric carbon dioxide levels and reconstructed global mean surfacetemperatures over the last 600 million years
(Reproduced with permission from the Open University P. Francis and N. Dise, Atmosphere, Earth and Life, MiltonKeynes: The Open University, 1997.)
Question 1. Do you think there is a link between atmospheric CO2 levels and the average
surface temperature of the Earth? Use the above data to support your answer.
Looking at the data – the Earth is getting warmer – page 2 of 2
Geocarb
Par
tial p
ress
ure
of C
O2
/bar
Time before present/ 106 yr
10–2
10–3
101
102
600 500 400 300 200 100 0
Atm
osph
eric
CO
2 /P
AL
PHO
TOCOP
YP Other greenhouse gases – page 1 of 4
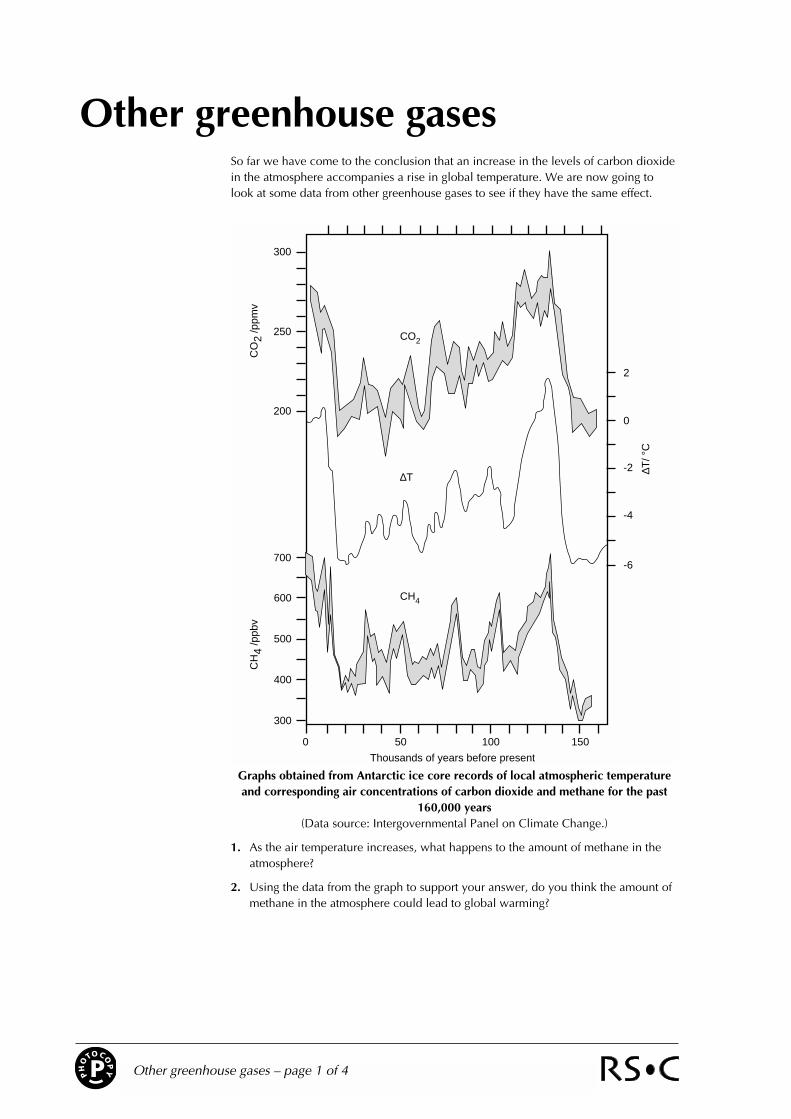
Other greenhouse gasesSo far we have come to the conclusion that an increase in the levels of carbon dioxidein the atmosphere accompanies a rise in global temperature. We are now going tolook at some data from other greenhouse gases to see if they have the same effect.
Graphs obtained from Antarctic ice core records of local atmospheric temperatureand corresponding air concentrations of carbon dioxide and methane for the past
160,000 years(Data source: Intergovernmental Panel on Climate Change.)
1. As the air temperature increases, what happens to the amount of methane in theatmosphere?
2. Using the data from the graph to support your answer, do you think the amount ofmethane in the atmosphere could lead to global warming?
300
250
200
700
600
500
400
300
0 50 100 150
-6
-4
-2
0
2
CO2
∆T
CH4
∆T/ °
C
CO
2 /p
pmv
CH
4 /p
pbv
Thousands of years before present
PHO
TOCOP
YPOther greenhouse gases – page 2 of 4
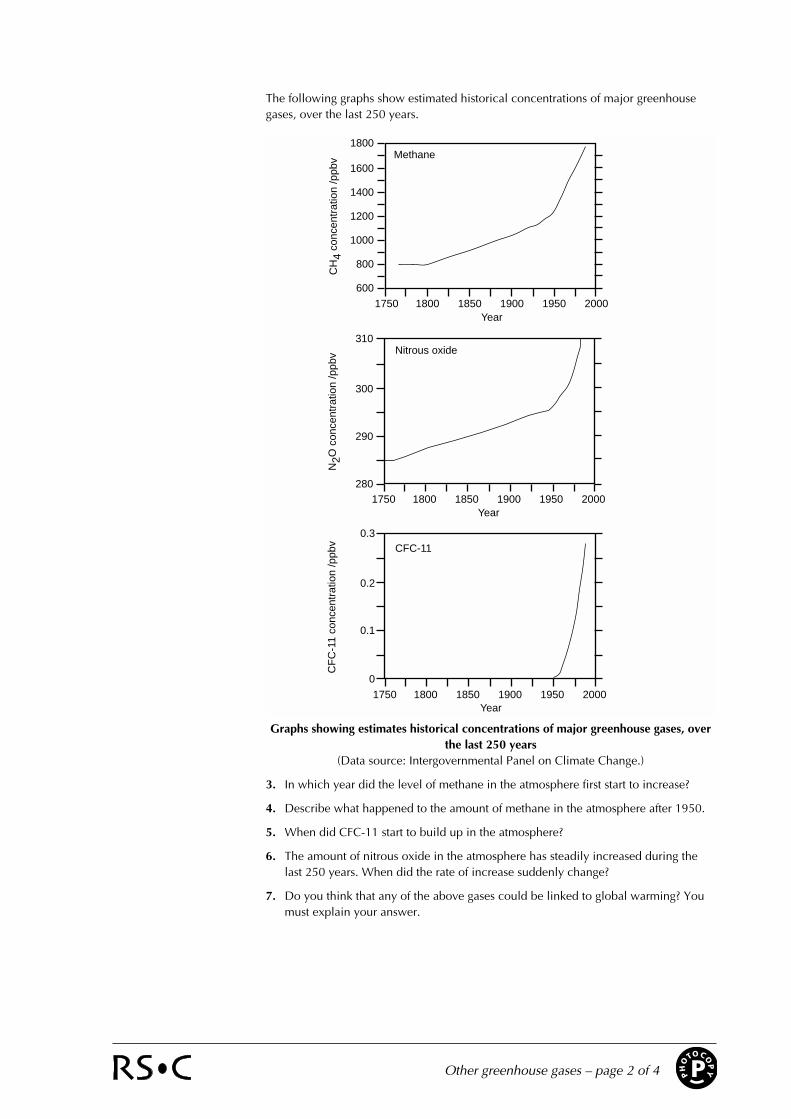
The following graphs show estimated historical concentrations of major greenhousegases, over the last 250 years.
Graphs showing estimates historical concentrations of major greenhouse gases, overthe last 250 years
(Data source: Intergovernmental Panel on Climate Change.)
3. In which year did the level of methane in the atmosphere first start to increase?
4. Describe what happened to the amount of methane in the atmosphere after 1950.
5. When did CFC-11 start to build up in the atmosphere?
6. The amount of nitrous oxide in the atmosphere has steadily increased during thelast 250 years. When did the rate of increase suddenly change?
7. Do you think that any of the above gases could be linked to global warming? Youmust explain your answer.
Methane1800
1600
1400
1200
1000
800
600
1750 1800 1850 1900 1950 2000Year
Year
CH
4 co
ncen
trat
ion
/ppb
v
1750 1800 1850 1900 1950 2000Year
CF
C-1
1 co
ncen
trat
ion
/ppb
v
0.3
0.2
0.1
0
1750 1800 1850 1900 1950 2000
Nitrous oxide
N2O
con
cent
ratio
n /p
pbv
310
300
290
280
CFC-11

PHO
TOCOP
YP Other greenhouse gases – page 3 of 4
The amounts of greenhouse gases in the atmosphere have increased dramatically overthe last fifty years. This is mainly because of increased human population andactivities, such as man-made chemicals and combustion.
Graphs showing carbon dioxide levels(Data source: Intergovernmental Panel on Climate Change.)
The table below lists the main man-made sources of these gases. Greenhouse gasesalso occur naturally.
Greenhouse gas Sources due to human activities
Carbon dioxide Burning of fossil fuelsDeforestation
Methane Bacteria in rice paddy fieldsReleased from natural gas and oil wellsLandfill – (getting rid of waste)Domestic animals – mostly cattleCoal miningBiomass burning
Chlorofluorocarbons (CFCs) RefrigerantsAerosols
Nitrous oxides FertilisersCombustion of fuels in cars and power stationsBiomass burning.
Sources of greenhouse gases
380
✵ ✵
✵✵ ✵
✵
360
340
320
300
280
260
800 1000 1200 1400 1600 1800 2000
1850 1900 1950 2000
0
2
4
6
280
300
320
340
360
380
CO
2 em
issi
ons/
ppm
v
Fos
sil C
O2
emis
sion
s/G
tC/y
r
Year
YearCO
2 em
issi
ons/
ppm
v
KeyIce coremeasurements
✵ South pole
Fossil CO2emissions
Mauna Loa
One hundredyear runningmean
PHO
TOCOP
YPOther greenhouse gases – page 4 of 4
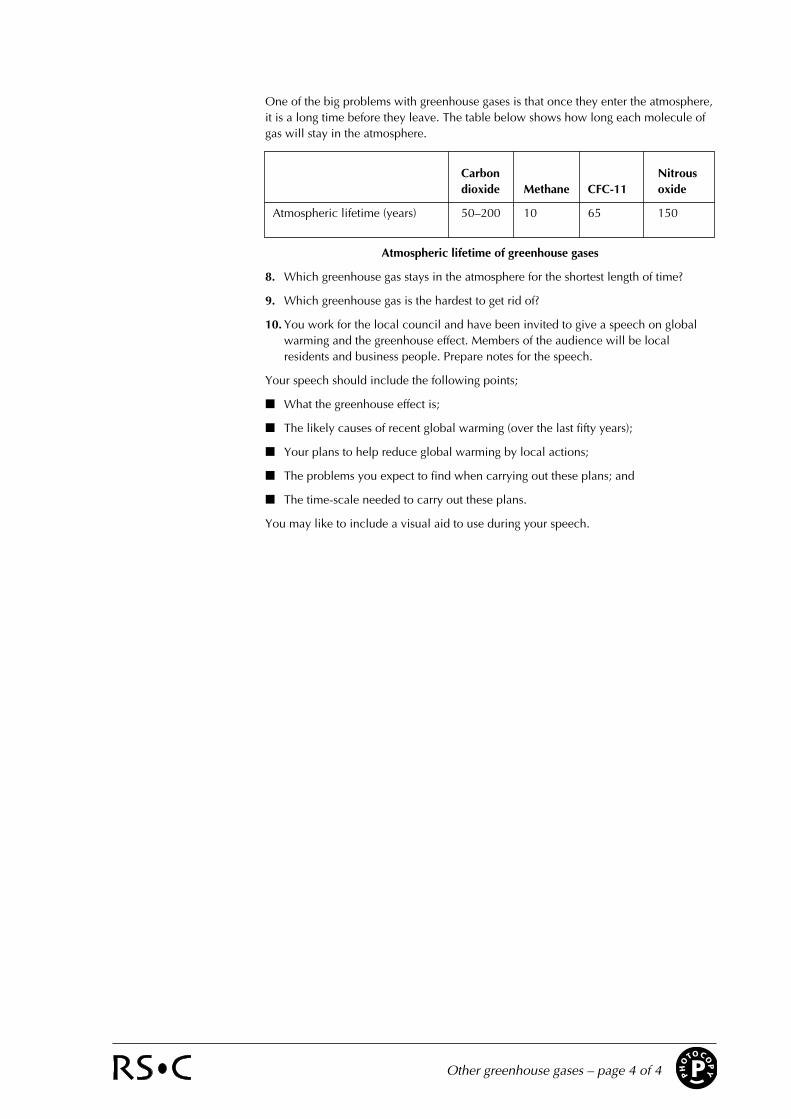
One of the big problems with greenhouse gases is that once they enter the atmosphere,it is a long time before they leave. The table below shows how long each molecule ofgas will stay in the atmosphere.
Carbon Nitrous dioxide Methane CFC-11 oxide
Atmospheric lifetime (years) 50–200 10 65 150
Atmospheric lifetime of greenhouse gases
8. Which greenhouse gas stays in the atmosphere for the shortest length of time?
9. Which greenhouse gas is the hardest to get rid of?
10. You work for the local council and have been invited to give a speech on globalwarming and the greenhouse effect. Members of the audience will be localresidents and business people. Prepare notes for the speech.
Your speech should include the following points;
■ What the greenhouse effect is;
■ The likely causes of recent global warming (over the last fifty years);
■ Your plans to help reduce global warming by local actions;
■ The problems you expect to find when carrying out these plans; and
■ The time-scale needed to carry out these plans.
You may like to include a visual aid to use during your speech.
PHO
TOCOP
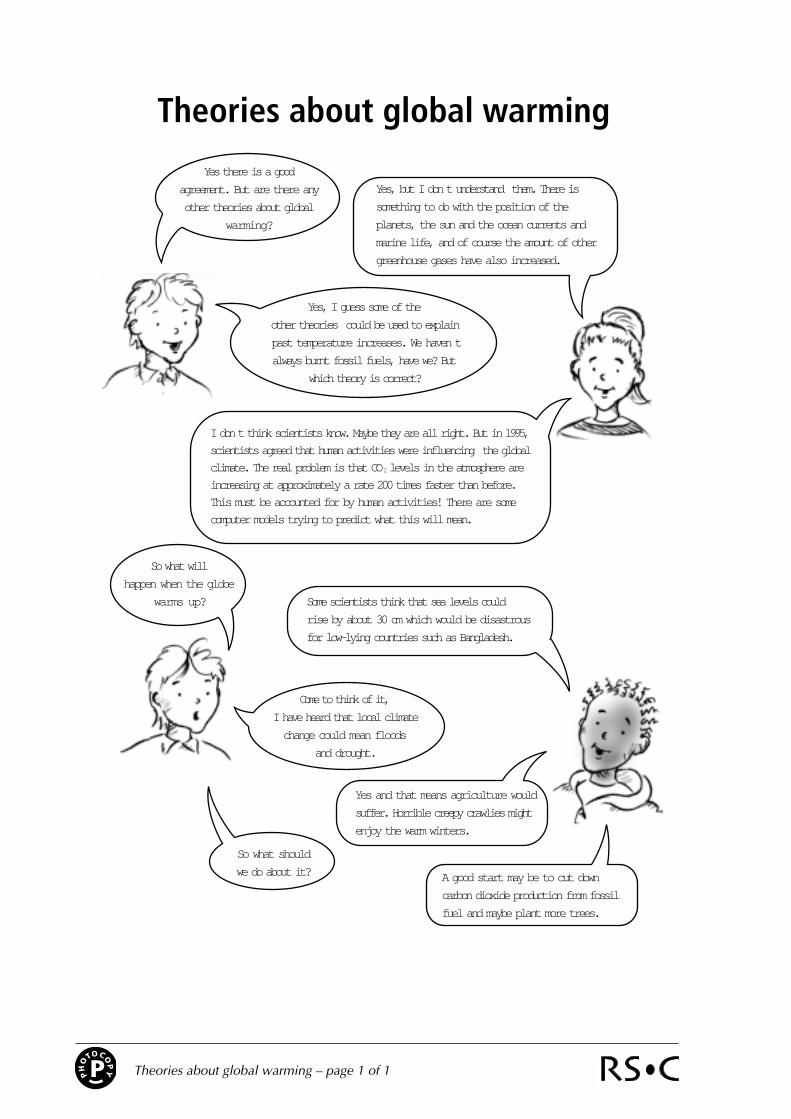
YP Theories about global warming – page 1 of 1
Theories about global warming
Yes there is a good
agreement. But are there any
other theories about global
warming?
Yes, I guess some of the
other theories could be used to explain
past temperature increases. We haven t
always burnt fossil fuels, have we? But
which theory is correct?
I dont think scientists know. Maybe they are all right. But in 1995,
scientists agreed that human activities were influencing the global
climate. The real problem is that CO2 levels in the atmosphere are
increasing at approximately a rate 200 times faster than before.
This must be accounted for by human activities! There are some
computer models trying to predict what this will mean.
Yes, but I dont understand them. There is
something to do with the position of the
planets, the sun and the ocean currents and
marine life, and of course the amount of other
greenhouse gases have also increased.
So what will
happen when the globe
warms up? Some scientists think that sea levels could
rise by about 30 cm which would be disastrous
for low-lying countries such as Bangladesh.
Come to think of it,
I have heard that local climate
change could mean floods
and drought.
Yes and that means agriculture would
suffer. Horrible creepy crawlies might
enjoy the warm winters.
So what should
we do about it? A good start may be to cut down
carbon dioxide production from fossil
fuel and maybe plant more trees.
PHO
TOCOP
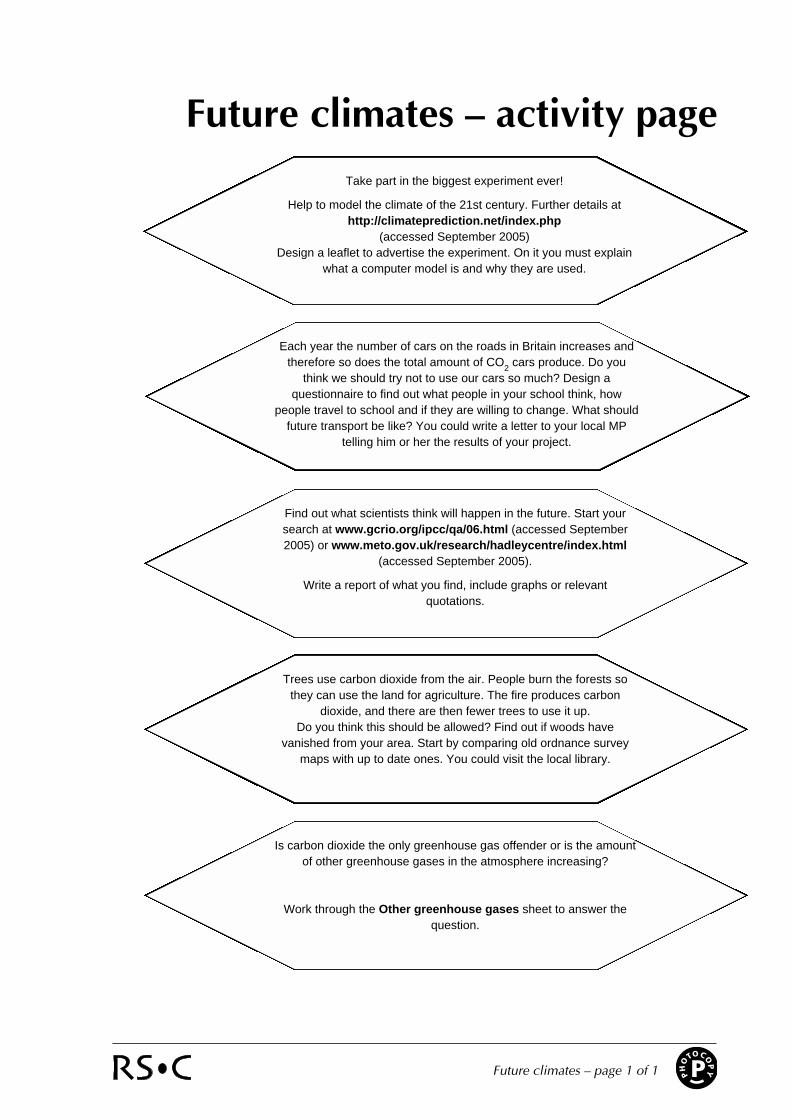
YPFuture climates – page 1 of 1
Future climates – activity pageTake part in the biggest experiment ever!
Help to model the climate of the 21st century. Further details athttp://climateprediction.net/index.php
(accessed September 2005)Design a leaflet to advertise the experiment. On it you must explain
what a computer model is and why they are used.
Each year the number of cars on the roads in Britain increases andtherefore so does the total amount of CO2 cars produce. Do you
think we should try not to use our cars so much? Design aquestionnaire to find out what people in your school think, how
people travel to school and if they are willing to change. What shouldfuture transport be like? You could write a letter to your local MP
telling him or her the results of your project.
Find out what scientists think will happen in the future. Start yoursearch at www.gcrio.org/ipcc/qa/06.html (accessed September2005) or www.meto.gov.uk/research/hadleycentre/index.html
(accessed September 2005).
Write a report of what you find, include graphs or relevantquotations.
Trees use carbon dioxide from the air. People burn the forests sothey can use the land for agriculture. The fire produces carbon
dioxide, and there are then fewer trees to use it up. Do you think this should be allowed? Find out if woods have
vanished from your area. Start by comparing old ordnance surveymaps with up to date ones. You could visit the local library.
Is carbon dioxide the only greenhouse gas offender or is the amountof other greenhouse gases in the atmosphere increasing?
Work through the Other greenhouse gases sheet to answer thequestion.