global views 01-15-16 - global banking and markets views is available on ... recovery in chinese...
TRANSCRIPT

Foreign Exchange Strategy Fixed Income Strategy Fixed Income Research Emerging Markets Strategy Economics
Weekly commentary on economic and financial market developments
Global Views
Corporate Bond Research
Global Views is available on scotiabank.com, Bloomberg at SCOT and Reuters at SM1C
January 15, 2016
Contact Us
Economics
Poorer, But Not Bored 2-5
Derek Holt
Bank Of Canada Should — And Probably Will — Stay On Hold 6-8
Derek Holt and Dov Zigler
A Mixed Outlook For Canadian Industry In 2016 9
Neil Tisdall
Record Global Auto Sales Expected In 2016 10
Carlos Gomes
Germany’s Economic Outlook For 2016-17 11
Erika Cain
Fixed Income Strategy
ECB Minutes, Looking To The Spring! 12
Frédéric Prêtet
Key Data Preview A1-A2
Key Indicators A3-A5
Global Auctions Calendar A6-A7
Events Calendar A8
Global Central Bank Watch A9
Latest Economic Statistics A10-A11
Latest Financial Statistics A12
Global Forecast Update Report
Forecasts & Data
This Week’s Featured Charts
Please see the Global Forecast Update, January 5, 2016, for our latest economic, interest and exchange rate and commodity price forecasts and the Foreign Exchange Outlook, January 2016, for more detailed currency forecasts and commentary.
0
2
4
6
8
10
12
14
16
18
0.25 0.50
Economists Flip A Coin# of respondents Scotiabank
Economics
Source: Scotiabank Economics, Bloomberg.
BoC Overnight Rate Target (%)
0
10
20
30
40
50
60
70Market Sentiment Swings To BoC Cut
probability of cut*, %
BoC Cut At Jan 2016 Meeting
Source: Scotiabank Economics, Bloomberg. end-of-period implied probabilities.

Economics
Global Views
January 15, 2016
2
Poorer, But Not Bored
Please see our full indicator, central bank, auction and event calendars on pp. A3-A9.
Canada — Déjà Vu
Here we go again. Consensus is divided. Markets are increasingly expecting a cut. Nobody is telling a story with great conviction. Governor Poloz doesn’t sound like he’ll cut, but maybe he will. It’s not the least bit clear that the benefits outweigh the costs. It might not get fully passed through perhaps except for riskier lending segments. The aim is to smoke CAD, but somehow it isn’t, and be careful what you ask for. Sound familiar? Wednesday’s Bank of Canada policy statement, Monetary Policy Report and press conference will be the show-stealer on the week — at least in Canada. The debate is much like where it stood last July when markets put about 50-50 odds on a cut and then the BoC did indeed cut. Or perhaps it’s more like going into last March when markets were long convinced that a cut would occur but the BoC kept its powder dry. We don’t think the BoC should cut this time. We don’t think it will cut — yet. Few can say they have high conviction. It’s just one element in a bigger debate on the future of the Canadian economy and broad policy directions; whether to stimulate in an effort to counter complex cyclical and structural forces and how best to do so, or whether doing so would just blow advantages the country had gained in the policy arena over the past two decades and build upon household imbalances. Next week’s decision is best positioned as just a further micro-step along the path to a bigger multi-year series of adjustments for the Canadian economy that should make the BoC wary of over-reacting to the nearest of near-term developments. Canada will be stuck with excess disinflationary capacity for a very long while yet (chart 1) and a quarter point cut next week won’t change that. Easing to date has not exactly helped housing imbalances which macroprudential tightening has been unable to counter and put large and growing upward pressure on imported inflation through destabilizing the currency. A relative import price shock in the context of muted wage growth and high leverage raises risks on the consumer outlook. That was the bottom line to the balanced assessment of several of the arguments on both sides that we summarized here.
Next week isn’t just about the Bank of Canada, mind you. The currency could continue to be more sensitive to developments in China and to commodity prices. Of possibly tertiary importance will be domestic data by week’s end. Retail sales for November and the Consumer Price Index for December will be released on Friday. The former will shed preliminary light on how the holiday shopping season evolved, although that has become a rather stale issue in the here and now; the latter will be watched for signs that core inflation remains around 2% with the BoC’s handicap knocking a half point off of that to get what it feels to be a truer picture of, well, cored core. A currency that has lost 50 cents versus the USD since the peak in 2011 risks sustainably jeopardizing the inflation targeting framework of the central bank through years of pass-through to the upside on inflation just as years of pass-through once followed an appreciating currency in disinflationary ways. Wholesale trade (Monday) will help inform GDP tracking for November but normally captures little to no market attention.
Derek Holt 416.863.7707 [email protected]
THE WEEK AHEAD
Next Week's Risk Dashboard
Chinese GDP
Bank of Canada
ECB
CDN retail sales, CPI
European PMIs, ZEW
US earnings
US CPI, housing, manufacturing
Chinese macro dump
UK CPI, retail sales
Asian trade
-5
-4
-3
-2
-1
0
1
2
3
92 97 02 07 12 17
Canadian Output Gap%
Source: Scotiabank Economics, Bank of Canada.
forecast
Extended Multivariate
Filter Approach
Integrated FrameworkApproach
Chart 1

Economics
Global Views
January 15, 2016
3
… continued from previous page
United States — Discounting Or Bona Fide Weakness?
After starting the week shut for Martin Luther King Day, US markets will then have plenty to consider. Earnings and the latest inflation readings will dominate domestic sources of risk for US markets next week with each having the potential to impact the broader global market tone. Question marks over both have been a key driver of the outlook for the broad risk trade and the Federal Reserve’s role in it.
Forty-three firms listed on the S&P500 will release final quarter earnings for 2015 next week. Several of the names will carry over the focus on financials at the start of the earnings season including Goldman, Bank of America, Morgan Stanley, BoNYM, and Amex but other names will include GE, IBM, Delta, Verizon, Netflix, Starbucks, and Southwest Airlines among others.
How much of an influence will falling energy prices have upon the December CPI reading? Energy has just over a 7% weight in CPI so the scope for downward pressure is limited. A flat monthly reading and a year-ago print that modestly builds upon the prior month’s 0.5% y/y reading are expected.
More important is insight into how much of the softness in US retail sales during the month of December was due to discounting versus lower sales volumes. Recall that headline retail sales fell by 0.1% m/m, sales ex-autos and gasoline were flat, and the so-called ‘control group’ fell 0.3% m/m. The control group is what is used to estimate total personal consumption expenditures on goods and subtracts autos, gasoline stations, building materials, office supplies, tobacco, and everybody’s favourite — mobile homes. The categories that are left included in the core group contained some components that can be culprits for seasonal and holiday discounting like clothing sales that fell by almost a full percentage point in dollar terms, and electronics sales. We need CPI in order to separate out price effects from underlying momentum in the volume of goods sold. Also note that retail sales are notorious for big revisions (chart 2) and so we often discount the first print until we really find out what happened in subsequent releases.
Sundry other data releases will include housing starts and existing home sales, both for December, and the Philadelphia Fed’s manufacturing gauge.
Asia — Will Inflated Trade Figures Distort Chinese GDP?
Because Chinese trade figures may be suspect, it’s possible that markets will view with skepticism the arrival of the Q4 GDP growth estimate for China’s economy early next week. Consensus expects an unchanged reading of 6.9% y/y growth. Why might the print be viewed with skepticism? Because the unexpected recovery in Chinese export growth may well have been driven by fake invoices that could have repeated China’s longstanding problem with over-inflated export figures for purposes of securing greater trade receivables financing. The export surge might have also been mostly driven by valuation effects stemming from yuan depreciation which would not count in the GDP estimate that strips out price effects.
Further to this point, in order to check on the legitimacy of China’s recently better-than-expected export figures, trade releases from other Asian economies will be carefully watched. We already know that what South Korea and Taiwan reported by way of the value of imports from China thoroughly mismatched what China reported to be growth in the value of exports to said countries (chart 3). Differences in timing entry and arrival and the flip sides of each other’s currencies do not explain the magnitude of the differences. Next week
Derek Holt 416.863.7707 [email protected]
THE WEEK AHEAD
-1.0
-0.8
-0.6
-0.4
-0.2
0.0
0.2
0.4
0.6
0.8
1.0
09 10 11 12 13 14 15
U.S. Retail Sales Ex. Auto & Gas Revisions
m/m % change, latest - actual
Source: Scotiabank Economics,U.S. Census Bureau.
Chart 2

Economics
Global Views
January 15, 2016
4
… continued from previous page
will bring out a few more comparators possibly including trade figures from India and Thailand and then the following week will provide more checks on the China figures from Japan, Hong Kong, New Zealand and Philippines on the path to the December trade figures from North America and Europe.
China also releases a trio of prints for December including property prices, industrial production and retail sales. Markets will be sensitive to further signs of progress on these readings including the broadening number of cities reporting rising property prices as well as a possible bottoming in the other readings. It is unclear to what extent destabilizing forces in Chinese markets so far this year may impact confidence going forward.
Regional influences may arise from Bank Negara Malaysia’s policy decision, New Zealand CPI and Australian new home sales.
Europe — The Seven Week Itch
By the time the ECB issues its latest policy decisions next Thursday, just seven weeks will have passed since the last meeting at which President Draghi rolled out additional stimulus measures. Even before the holidays there were calls for additional stimulus yet again as oil prices fell and put the central bank’s inflation target under renewed, or rather, extended downward pressure. To give up on one round of stimulus so soon entails compression of the lagged effects of monetary policy actions to such short lengths as to be unprecedented. I would hope to see patience being signaled. Central banks risk doing more damage by over-reacting and signaling they’ve had the skittles scared out of them in response to recent developments. Recall that the ECB did indeed expand stimulus but its actions disappointed markets on December 3rd. The decisions taken at that meeting were not unanimous, and the ECB increased bond buying by considerably less than markets had come to anticipate given the escalated ECB guidance in the weeks leading up to the meeting. Recall that the ECB at best met expectations for a 10bps deposit rate cut to -0.3% when some had expected a larger cut, and expanded the size of its projected balance sheet by a further €360 billion through extending the current €60 billion pace of monthly buying for a further six months until March 2017 and possibly longer. This fell well shy of scenarios that leaned in the direction of around a €1 trillion — or higher — expansion of the ECB balance sheet. The ECB also announced it would reinvest future principal payments when this becomes relevant and for an uncertain period of time.
European survey measures will capture secondary attention to the ECB meeting next week. They will be watched for further indications that the Eurozone’s growth prospects are gradually improving. The readings will include purchasing managers’ indices for the Eurozone’s manufacturing and service sectors and key member economies, and the ZEW survey of investor expectations.
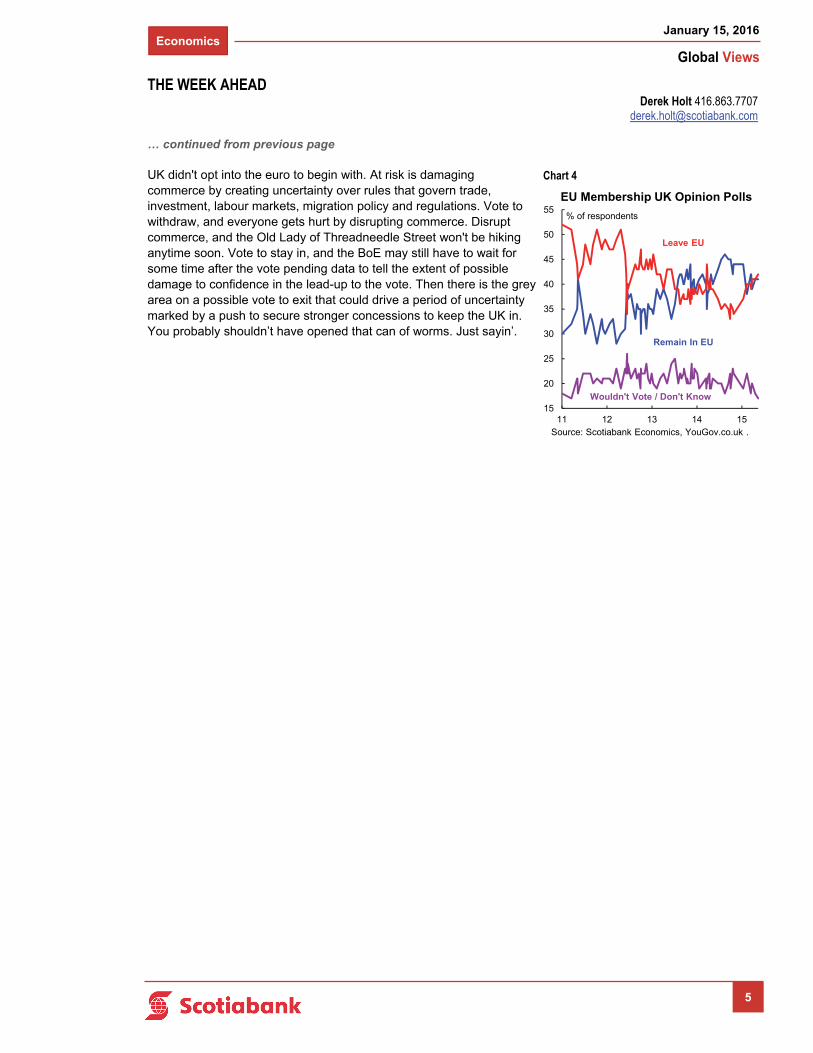
But enough about Europe; let’s talk about Europe. Or rather, the part across the English channel that seems to be in denial of its geography one day, not so the next. UK data risk will matter for a few minutes after the release of CPI and retail sales covering the month of December. They won’t matter to the grander debates unfolding by way of when the Bank of England could hike and Brexit worries; the former is conditional upon the latter. Will the Bank of England hike this year? ‘Probably not’ is the market view. It's in no small part a Brexit call, cutely coined in reference to the risk of the U.K. exiting the European Union following a referendum whose timing is uncertain. The government is committed to going to the masses for a popular vote on a complex matter with uncertain timing spanning as early as just before summer holidays in July and August to well after that. Polling is volatile but the ‘Leave’ camp has recently gained momentum and is only slightly behind the ’Remain’ opinion (chart 4). Nothing stands to be gained on the currency since obviously the
Derek Holt 416.863.7707 [email protected]
THE WEEK AHEAD
-21
-18
-15
-12
-9
-6
-3
0
3
China toSK
SK fromChina
China toTA
TA fromChina
Who's Telling The Truth?
y/y % change, December 2015
Source: Scotiabank Economics, Bloomberg.
Chart 3
Economics
Global Views
January 15, 2016
5
… continued from previous page
UK didn't opt into the euro to begin with. At risk is damaging commerce by creating uncertainty over rules that govern trade, investment, labour markets, migration policy and regulations. Vote to withdraw, and everyone gets hurt by disrupting commerce. Disrupt commerce, and the Old Lady of Threadneedle Street won't be hiking anytime soon. Vote to stay in, and the BoE may still have to wait for some time after the vote pending data to tell the extent of possible damage to confidence in the lead-up to the vote. Then there is the grey area on a possible vote to exit that could drive a period of uncertainty marked by a push to secure stronger concessions to keep the UK in. You probably shouldn’t have opened that can of worms. Just sayin’.
Derek Holt 416.863.7707 [email protected]
THE WEEK AHEAD
Chart 4
15
20
25
30
35
40
45
50
55
11 12 13 14 15
EU Membership UK Opinion Polls
% of respondents
Source: Scotiabank Economics, YouGov.co.uk .
Leave EU
Remain In EU
Wouldn't Vote / Don't Know

Economics
Global Views
January 15, 2016
6
Bank Of Canada Should — And Probably Will — Stay On Hold
We take the opportunity to reinforce our view that the Bank of Canada will pass on the opportunity to cut its overnight rate again next week. We summarize the cases for and against easing and they net out to our unchanged base case that further rate cuts are plausible in future but not likely just yet. The complex issues at hand are not just about the next meeting; they are about conducting a prudent overall policy mixture for the longer-term health of the Canadian economy.
The Weaker Case For A Cut
The Canadian economy is again disappointing BoC expectations and will be challenged to secure any growth whatsoever when final Q4 GDP figures land. A complex array of temporary and deeper underlying forces are responsible. The BoC is likely to revise downward its near-term growth estimates from the forecasts published in its October Monetary Policy Report (MPR).
We do not forecast either definition of the output gap to close over our published forecast horizon that stretches to the end of 2017. Chart 1 shows our forecasts for the two measures of the gap that the BoC follows. A material amount of disinflationary slack will persist throughout the next two years. Indeed, it is not a stretch that excess capacity will persist to decade’s end and perhaps later as part of what Governor Poloz describes as complex forces that will take years to play out.
Lower oil prices yield less pressure on headline CPI than previously expected. This would give the BoC reason to push out its forecast for headline CPI to reach 2% until later than 2017Q1 which was the expectation in the October MPR.
The oil price that matters more to Canada is Western Canada Select and more so in CAD not USD terms. In USD terms it has recently been around US$16 and in C$ terms around C$24. That is pushing down to the range often described as the variable cost break-even point. It would be premature to shut production down at C$24 oil and based upon the first two weeks of trading in the new year (it was $33 coming into the new year). Prices above this variable cost break-even point but below the much higher all-in break-even point mean that continued production recovers variable costs and chips away at some fixed costs. Prices at this level or lower mean that only variable costs are being recouped if at all and thus the profit incentive to continue producing deteriorates. That poses a downside risk to overall output, export volumes and thus the contribution of trade to broad GDP growth. Individual company circumstances differ, but in aggregate we do not believe that oil production in Canada is on the verge of shutting down; further, prices would likely respond positively to less supply pressure globally in this scenario and help restore equilibrium. It is unclear that monetary policy should attempt to manage this process.
Global market instability is posing downside risks to our existing growth forecasts for the Canadian economy.
The BoC believes it has considerable policy flexibility in terms of its lower effective bound for policy rates as well as other unconventional tools, and so giving away another bullet does not compromise its future easing options.
The Business Outlook Survey contained weak components. In particular, companies reported higher excess capacity. Such anecdotes are bearish for corporate Canada’s outlook.
Dov Zigler 212.225.6631 [email protected]
Derek Holt 416.863.7707 [email protected]
CANADIAN MONETARY POLICY
Chart 1

Economics
Global Views
January 15, 2016
7
… continued from previous page
The inventory cycle is a downside risk to industrial production as the inventory-to-sales ratio has not been this high since the depths of the global crisis.
Similar combinations of downgrades to the domestic outlook and declines in commodity prices have spurred the BoC to cut rates in the past.
The Stronger Case Against A Cut — For Now
It wouldn’t matter. Canada is going through needed adjustments following a terms of trade lift to domestic incomes that was then leveraged to record heights in the household sector. Coming off such influences involves simply working through such imbalances. Cutting rates risks further inflaming sectors already in a state of imbalance, notably housing, while doing little for the rest of the economy. The prospect of a multi-year adjustment is not something a rate cut next week can lean against. Adapting to a new reality within the limits of policy — fiscal, monetary and regulatory — may be the order of the day.
Modest fiscal stimulus is in the works. That could give the BoC some confidence that it can pass the baton to the Federal government. The BoC may wish to wait at least until a Federal Budget has been brought down which punts the easing risk into Spring or later. The market was probably more correct in its BoC pricing in this regard than it has become into the new year.
The BoC may view the full lagged effects of easing to date as not having worked their way through the economy. That would counsel patience.
One view is that a depreciated CAD to date is to be relied upon more heavily than further rate cuts to stimulate export growth. Another view posits that CAD works differently this time and so attempts to depreciate it through the role of monetary policy above and beyond drivers like oil, copper and other commodity prices are less likely to be successful on net. Canada remains a high-cost producer and the currency has not depreciated enough to offset the long-term deterioration in productivity adjusted labour costs. Lower cost jurisdictions like Mexico have experienced comparable currency depreciation versus the USD and are more likely to leverage off of a US recovery than Canada.
An arguably greater vulnerability is likely that which faces consumers in the form of a potentially massive import price shock in the context of limited wage growth and relatively high leverage. Cutting further in such fashion as to add downside risks to the currency increasingly risks a stagflation scenario for Canada. Little growth and import price pressures could be mutually reinforcing. My personal view is that sharp currency depreciation will carry lagged upward effects on import price inflation for years to come as an offset to slack arguments and this should be reinforced only with the greatest of care at elevated peaks across everything in the household sector.
Governor Poloz has changed his mind in the past, but he was more forcefully guiding a positive message last week than at any other point I recall over the past year. He dismissed China concerns as more about markets than fundamentals, he sounded upbeat about global growth, and he emphasized benefits of lower oil and CAD depreciation starting to appear by way of nonresource sectors. Had the Governor been more uncertain about near-term policy in a desire to keep options open on game day, we would have expected him to convey a less buoyant spirit. If anything, our read on Governor Poloz’s bias was that he was cheerleading the economy (see our recap of his speech here).
Rate cuts don’t help the resource sector which is only about 15% of the economy (energy) and 20% (total).
I maintain my personal view that imbalances in housing markets are being aggravated by BoC easing.
CANADIAN MONETARY POLICY
Dov Zigler 212.225.6631 [email protected]
Derek Holt 416.863.7707 [email protected]

Economics
Global Views
January 15, 2016
8
… continued from previous page
This risks courting a larger problem down the road. One that would be further driven by additional rate cuts and the effect on rates at least in some segments of the market accompanied by the depreciating effects on the currency that would make Canadian real estate even cheaper for foreign buyers relative to domestic drivers.
How much of a potential rate cut passes through administered lending rates is uncertain but full pass-through has been resisted to date and remains an offsetting risk.
There is merit to keeping some powder dry in the face of potentially greater macroeconomic and financial market risks down the road. It is already questionable whether the BoC’s estimate of 100 points worth of potential additional conventional easing toward what it estimates as the -0.5% lower effective bound would get fully passed through administered rates or offset a turn for the worse in housing as households could be wary of attempting to catch a falling knife. It becomes even more questionable if easing inflates the peaks higher in the near-term and exhausts limited policy flexibility. Policies like negative rates are seeking evidence that they are working in Europe, while QE would have limited effect on rates with the 5 year Government of Canada bond yield already at only a half percentage point and mixed effects through the currency as a drag on consumers but a possible mild lift for trade. Our more detailed thoughts on applying QE and negative rates in Canada can be found here and here.
Cutting in response to developments over the first two weeks of the new year in both oil markets and China may be premature.
CANADIAN MONETARY POLICY
Dov Zigler 212.225.6631 [email protected]
Derek Holt 416.863.7707 [email protected]

Economics
Global Views
January 15, 2016
9
A Mixed Outlook For Canadian Industry In 2016
Canadian business investment remains weak entering 2016, as low prices across a broad range of commodities are tempering expectations in the resource sector. However, the plunge in crude oil prices paired with diverging monetary policy between Canada and the United States has sent the Canadian dollar to a 13-year low, boosting the export-earning capacity of Canadian firms. In addition, pent-up demand in the United States will lead to increasing auto, home and consumer product sales, benefitting many related industries in Canada. Despite a weak investment outlook, sales expectations for the next year are slowly gaining momentum after sentiment dipped to a post-crisis low in the first quarter of 2015 (see chart 1).
The forest products industry has outperformed over the last two years, as strong U.S. housing demand has fuelled both the value and volume of exports. Around three-quarters of Canadian forest product exports are destined to the United States, with China and Japan accounting for the bulk of the remainder. Growing momentum for U.S. residential construction (we expect housing starts to increase 15% in 2016) will provide a solid foundation for a successful year for forestry exports, more than offsetting slow growth in Japan, and slowing activity in China. However, the expiry of the longstanding softwood lumber trade agreement between Canada and the U.S. in October poses a risk, and there are currently no ongoing talks to extend or sign a new agreement. A clause in the previous agreement doesn’t allow any trade action or disputes until a year after expiry, so there is some stability through the fourth quarter of 2016. Capacity constraints may also limit gains, as forestry plant utilization is running at 90%, well above the national industrial average of 82%. Also, much of the specialized equipment needed to increase production is sourced from the U.S. or overseas, and has become more expensive due to Canadian dollar depreciation. While forest products account for a large portion of Canadian exports, their contribution to the overall Canadian economy is relatively small at less than 1%.
Manufacturing accounts for about 10% of Canadian economic activity, and the short-term outlook is supported by the currency realignment and favourable growth trends south of the border. One of the key components of Canadian industry, automobiles, reached record high sales volumes across North America in 2015, and will likely climb further this year with low interest rates assisting financing. Assemblies should also pick up as the largest production facility in Canada will operate year-round following an extended period of retooling last year. Canadian auto and parts exporters benefitted most from record volumes, with exports surging 16% year-to-date in 2015.
Despite the widely publicized troubles surrounding domestic aircraft manufacturing in Canada, aerospace exports advanced 15% year-to-date (to November 2015), and several favourable trends should provide further support this year. Canada is a global leader in the production of flight simulators, landing gear and other aircraft parts, with over 80% destined for export. U.S. defense spending is a key driver for aircraft production and demand for Canadian parts, and is set to rise an estimated +6% in FY2016 following years of sequestration-induced cutbacks. Nonetheless, the aerospace outlook in 2016 will be partially tied to Bombardier Inc, which remains mired in uncertainty. The company received a billion dollar cash injection from the Quebec government late last year in an attempt to ensure that it could continue to fund the much-delayed production take-off of the C-Series jet — and the associated Canadian made components — and keep the company on a successful course.
Neil Tisdall 416.866.6252 [email protected]
CANADIAN INDUSTRY
-10
0
10
20
30
40
50
Jan 13 Jul 13 Jan 14 Jul 14 Jan 15 Jul 15
Forestry, Autos and Aerospace Exports Gained in 2015
Source: Statistics Canada, Scotiabank Economics.
exports y/y % change, 3mma
Forest Products
Autos & Parts
Aerospace
0
5
10
15
20
25
30
35
40
13Q1 13Q3 14Q1 14Q3 15Q1 15Q4
Canadian Businesses Expect Modest Sales Growth in 2016
Source: Bank of Canada, Scotiabank Economics.
sales expectations over the next year, balance of opinion
Chart 1: Canadian Businesses Expect Modest Sales Growth in 2016
Chart 2: Forestry, Autos and Aerospace Exports Gained in 2015

Economics
Global Views
January 15, 2016
10
Record Global Auto Sales Expected In 2016
Global car sales are expected to strengthen over the coming year, extending gains to a seventh consecutive annual record and surpassing the length of the previous upcycle which lasted six years. Stronger economic growth will likely lift purchases 3% in 2016, up from only a 2% advance last year when volumes in emerging markets declined for the first time since 2001. Purchases will be buoyed by improving labour markets — employment in the OECD is advancing at the fastest pace since early 2007 — and a bottoming in purchases across emerging markets. Economic growth in developing countries is expected to pick up for the first time since 2010, helping reverse last year’s slide in car sales which was driven by sharp contractions in both Russia and Brazil. Low gasoline prices, improving household balance sheets and rising incomes will also help lift sales.
Despite the recent increase in short-term interest rates by the Federal Reserve, interest rates across the globe remain ultra-low and most central banks continue to add liquidity, providing support for global financial conditions and car sales. However, there is some concern that the sharp plunge in oil prices could lead to rising defaults for highly-indebted energy companies. These fears have led to an increase in several risk metrics and financial market volatility in recent months, including a spike in interest rates for high yield energy bonds to the highest level since mid-2009.
North America and Western Europe will continue to be the key drivers of the improvement in global car sales. Volumes in these markets advanced 7% last year — the strongest gain in nearly two decades. Purchases in North America climbed above 20 million units, surpassing the 2000 peak and should exceed 21 million in 2016. Each NAFTA member set sales records last year, but the United States will be the main growth driver going forward. Full-year U.S. purchases are set to approach 18 million units in 2016, fueled by a strong labour market, the healthiest household balance sheets in more than a decade and rising replacement demand. The average age of the U.S. vehicle fleet is at record highs, with nearly 40% of all vehicles on the road at least 12 years old. Our analysis suggests that this positive backdrop has set the stage for an extended replacement cycle, not a peak sales year that many fear.
Economic activity continues to gain momentum across Western Europe. Employment and household incomes are advancing at the fastest pace in nearly a decade, and unemployment in Germany has dropped to the lowest level since reunification. Strengthening wage gains, improved access to credit and significant replacement demand lifted sales 8% last year to an estimated 13.1 million — the highest level in six years. However, even with the latest advance, purchases are still 12% below the average since 2001.
Purchases are also expected to advance further in the new EU members of Central and Eastern Europe alongside solid export gains and improving labour markets. Eight of the twelve countries in the region posted double-digit increases in car sales last year, lifting volumes to the highest level since 2007.
Auto sales in China have accelerated in recent months and are expected to advance 7% in 2016, buoyed by a 50% reduction in the sales tax to 5% from 10% for new vehicles with engine capacity of less than 1.6 litres, as well as by ongoing stimulative measures designed to boost economic growth. The tax cut will remain in place through December 2016, and will help lift full-year sales above 21 million units from 20 million in 2015.
India will remain a bright spot for the global auto industry, with sales bolstered by economic growth in excess of 7%, an accommodative central bank, as well as elevated consumer sentiment which is being lifted by the sharp decline in global oil prices since mid-2014. Consumer spending in India is advancing in excess of 6% per annum, nearly five times faster than the pace of consumer activity in the other G20 countries.
Carlos Gomes 416.866.4735 [email protected]
AUTOS
45
50
55
60
65
70
75
80
85
-8
-6
-4
-2
0
2
4
6
8
07 08 09 10 11 12 13 14 15 16
index
Global Auto Sales & Leading Indicator
millions of units
Global Auto Sales
Leading Indicator of Global Auto
Sales
Source: Scotiabank Economics.
Chart 1: Global Auto Sales & Leading Indicator

Economics
Global Views
January 15, 2016
11
Germany’s Economic Outlook For 2016-17
The economic and fiscal outlook is favourable, while inflation should remain subdued.
German economic growth prospects remain generally favourable. Surveys of business activity and confidence have proven surprisingly resilient in the face of slower emerging-market demand and the Volkswagen emissions scandal. Private consumption is expected to remain the dominant driver of growth thanks to solid employment gains and higher real wages. This, combined with improving credit conditions, low interest rates, and rising capacity utilization, also bodes well for a modest pick-up investment. Fiscal policy will also become more accommodative of growth, while industrial output should get a boost from the weaker euro and improving growth prospects in the US and non-euro EU countries. This should benefit exports, though subdued demand in key markets such as China, Russia, and Brazil presents a downside risk. German real GDP growth is forecast at 1.5% in 2015 and 1.8% in 2016-17.
Inflation remains subdued. German consumer price inflation ended the year at 0.3% y/y, bringing the 2015 average to a mere 0.3%, down from 0.9% in 2014. Over the coming months, we expect the headline print to gradually trend higher as base effects from lower oil prices start to fade. Further support will come from demand-pull price pressures, underpinned by tight labour market conditions and wage gains, as well as rising import prices on the back of a weaker euro. However, German and euro zone inflation is forecast to remain below the ECB’s “close to, but below, 2%” target into 2018, which will encourage the ECB to maintain a highly accommodative monetary policy stance. The ECB’s QE program of €60 billion per month will run until at least March 2017, while benchmark interest rates are forecast to remain at record low levels until early 2018. However, with inflation expectations on a weaker trajectory owing to the subdued oil price outlook and recent strengthening of the euro, further expansion of QE and even later policy tightening is possible. We expect German inflation to end 2016 at 1.2% y/y and 2017 at 1.7%.
Germany is primed to maintain a modest general government budget surplus on average of roughly ¼% of GDP through 2017. The federal government budget will also remain balanced, with no net new borrowing planned through 2019. Over the coming years, federal spending is set to increase modestly, however, new expenditures on infrastructure, climate protection, support for local authorities and immigration will be financed by higher tax revenues and lower interest rates. As such, debt metrics will continue to improve and fiscal policy will become moderately more growth-friendly. Lower oil prices and the country’s manufacturing competitiveness will continue to support Germany’s large current account surplus, which is forecast to average roughly 7½% of GDP in 2016-17.
Erika Cain 416.866.4205 [email protected]
EUROPE
-6
-4
-2
0
2
4
6
08 09 10 11 12 13 14 15f 16f 17f
German Real GDP Growth
y/y % change
Source: German Federal Statistical Office, Scotiabank Economics.
forecast
-1.0
-0.5
0.0
0.5
1.0
1.5
2.0
2.5
3.0
3.5
4.0
08 09 10 11 12 13 14 15 16 17
Source: German Federal Statistical Office, Scotiabank Economics
y/y % change
Inflation To Gradually Rise
forecast
ECB target
-5.0
-4.0
-3.0
-2.0
-1.0
0.0
1.0
2.0
3.0
0
10
20
30
40
50
60
70
80
90
08 09 10 11 12 13 14 15f 16f 17f
Sound Public Sector Finances
% of GDP
Source: IMF, Scotiabank Economics.
% of GDP
Fiscal Balance, RHS
Gross Government Debt, LHS
Chart 1
Chart 2
Chart 3

Fixed Income Strategy
Global Views
January 15, 2016
12
ECB Minutes, Looking To The Spring!
Spring “Recalibration’…
The minutes of the December meeting suggest the potential for further monetary policy easing, around spring. More specifically: “a general review of the technical parameters of the APP could take place in spring 2016”.
Among them, the most likely course of action seems to be:
An additional cut in the deposit rate: the 10bp cut announced in December, was seen as “unlikely to trigger material negative side effects”. Some members even expressed their preference for a larger cut (20 bps) but the board seemed willing to keep “some room for further downward adjustments, should the need arise“.
A further extension of the purchasing programme beyond March 2017. Indeed, it seems that there is a broad based agreement inside the board to consider that it will stop QE once “the achievement of a sustained adjustment in inflation consistent with its inflation aim”. In this regard, the ongoing downgrading of the inflation outlook could fuel speculation that the ECB will expand the list of assets being purchased. Indeed, the December’s decision to include “regional and local government bonds in the list of assets eligible” was already seen as “avoiding any possible strains on the availability of securities, especially in view of the extension of the programme beyond September 2016”.
Meanwhile:
Increasing the volume of monthly sovereign bond purchases seems unlikely. This possibility was raised at the December meeting and appears to have provoked some opposition. While “considered to be a legitimate monetary policy tool, [increasing monthly purchases] were seen to be associated with significant risks and side effects, and should therefore be kept in reserve as a contingency measure in case of extremely adverse developments, such as deflation, and should not be used as a means to fine-tune the inflation outlook”.
Recent data support further action
Firstly, the latest inflation data proved weaker than expected. Furthermore, the ongoing fall in oil prices will lead to another downward revision to the ECB’s inflation forecast at the March meeting. The minutes indeed showed increasing nervousness within the board about constantly revising down the inflation forecasts.
Second, the rise in core inflation has topped out and eased back to 0.9% y/y. In December, the hawks pointed out that “there were encouraging developments in the inflation outlook” and that “core inflation was now even a little stronger at the end of the projection horizon than in the September exercise”.
Third, inflation expectations have fallen. In particular, 5Y in 5Y inflation swaps rate is down closer to 1.60%. In December, this metric was at “1.8%, some 10 basis points higher than at the time of the Governing Council meeting of 22 October. The price of deflation protection, as derived from options, had decreased”. While some members expressed some caution in interpreting too much from 5Y in 5Y inflation swaps, this downward move is likely to put pressure on the board.
Fourth, there is renewed uncertainty surrounding the global outlook. This is in sharp contrast with the mood in December when it was considered that “earlier concerns about developments in China in particular, following the stock market fall in August 2015, had not been borne out. Thus, a case could be made that the balance of risks had not deteriorated and had perhaps even become less negative”.
To conclude, the probability of further “recalibration” of monetary stimulus has increased although the minutes do not point to immediate action. The focus on spring 2016 would suggest potential further policy easing at the June meeting although there could be speculation of a move as early as the March meeting on the back of a sharp downward revision to the inflation forecast. The ECB might choose to use the March meeting to pre-announce the likelihood of further policy easing at its following meeting in June.
Frédéric Prêtet 00.33.17037.7705 [email protected]

Economics
Global Views
January 15, 2016
13
Key Data Preview
CANADA
December is generally a down month in terms of not-seasonally-adjusted CPI, and we don’t expect that Dec. 2015 will have brought anything particularly different than is seasonally normal in terms of core inflation. We’re projecting a -0.3% m/m core CPI print and a somewhat weaker headline number that we project to come in at -0.4% m/m as gasoline prices fell quite steeply (-4.6% m/m on average according to Bloomberg). Food prices, in contrast, tend to rise in December, and anecdotal evidence implied that this year’s food price hike was a bit stronger than what is seasonally normal, aided and abetted by the weak C$. This raises the structural question regarding Canadian inflation: how much C$ pass-through will Canadian CPI experience? The recent depreciation of the C$ implies that headline inflation ex-gasoline should continue to rise as higher import costs (and seemingly persistently higher import costs) feed into the retail channel. We anticipate that headline CPI will be left running at 1.7% y/y while core should come in closer to 2% y/y for December.
We’re forecasting a +0.3% m/m retail sales print on headline driven largely by the economy playing catch-up after a weak September (-0.4% m/m) and scant rebound in October (+0.1% m/m). That said, we’re not getting particularly enthusiastic for a few reasons. First, costs might make up a decent chunk of the increase (seasonally adjusted CPI came in at +0.2% m/m for November). Second, the consumer faces quite a few headwinds which we see as having built up into Q4, ranging from higher overall retail costs to rising economic uncertainty. Finally, vehicle sales, a force for retail spending in 2014, seem to be plateauing (albeit at an elevated level), removing a major source of retail spending growth from the equation.
Manufacturing sales likewise should rebound from a very soft three-month spell to close Q3 and start Q4, and we’re expecting a +0.5% m/m print for November. Our forecast is driven by a mix of factors: a) A base effect bounce: manufacturing sales were extremely weak in Aug.-Oct. (a cumulative -3.3%) which doesn’t seem to have persevered into Nov. as evinced by… b) Exports numbers: exports of motor vehicles bounced back by 5.9% m/m in Nov. and, c) New orders: while new orders have softened in recent months, the aggregate size of the order book is large enough to sustain modest manufacturing sales growth. All of that said, we’re not expecting miracles from the manufacturing sector in November. There is North America-wide drop-off in manufacturing activity underway driven by a mix of a plateauing in vehicle assemblies, a decline in demand from the energy sector, and the inventory cycle. The trade data for November reflected these factors, and showed declines in exports of industrial machinery, electronics, aircraft, and consumer goods, which cumulatively does not augur well for the breadth or robustness of the manufacturing sales rebound that we expect to see in November.
UNITED STATES
U.S. CPI should post a pretty decent print for December — considering oil prices. The gasoline price registered by AAA was down by a relatively modest -5.8% m/m given the more than 10% monthly decline in oil prices in December. The fact that gasoline prices have displayed some stickiness near US$2/gallon is one reason that inflation doesn’t seem to have plummeted to end 2015. The other reason is that core CPI seems to have been fairly robust in 2015 largely as a result of the increase in shelter costs. Our analysis indicates that shelter costs tend to reflect changes in home price indices such as the Case Shiller Index with a 12-24 month lag, implying that the solid pace of home price appreciation in recent years should continue to buoy core CPI for at least another year. Core CPI, in turn, is dominated by owners’ equivalent rent and rents, which make up 1/3 of the total CPI index and 40% of core CPI, and thus should prevent downsides in core CPI from materializing.
We’re anticipating a 5.5m annualized pace of existing home sales for December — a marked pick-up from the 4.8m sales notched in November. Our rationale is that home sales activity fell because the paper-work required for finalizing and closing sales was changed, delaying some closings. To what extent did the sales that were essentially effected in Nov. but not finalized until Dec. add to December sales — and to what extent did the new paper-work in turn push December sales outwards? There is no econometric model for this, however, the question itself points to the possibility of upside to existing home sales in December if the average of 5.5m annualized sales from June-Oct. is bolstered by a combination of Nov. sales that fell into Dec. and Dec. sales running at a more normal rate.
Dov Zigler 212.225.6631 [email protected]
Derek Holt 416.863.7707 [email protected]
A1

Economics
Global Views
January 15, 2016
14
… continued from previous page
EUROPE
On Friday, January 22nd, preliminary PMI data for January will be released in the euro zone, Germany, and France. Euro zone business sentiment and activity surveys have proven to be relatively resilient in recent months. December reports showed a strong performance across most sectors throughout the euro currency bloc. We believe that the positive impact from highly accommodative monetary policy by the European Central Bank will continue to provide strong stimulus at a time when oil prices remain very low. As such, we expect the euro zone manufacturing PMI index to remain around 53, while the services component could move up slightly to 54.5 from 54.2 in the prior month in line with the improvement seen in consumer confidence and some payback in France after the November terrorist attacks.
LATIN AMERICA
Colombian retail sales data for November will be released on January 18th. We expect that retail sales eked out an expansion of 0.5% y/y, a minor improvement over October’s 0.1% print but still reflective of the country’s slowing economy momentum. Inflation continues to accelerate and closed 2015 at a seven-year high of 6.8% y/y, far above the central bank’s 2-4% target range. The plunging value of the Colombian peso — due to the collapsing prospects of future crude oil prices — has hit consumer purchasing power as the realized price of imported goods surge upward.
ASIA
China will release fourth quarter GDP data on January 18th (EST). Our activity proxy for China’s economic momentum indicates that over the last three months of 2015, real GDP growth was virtually in line with the official target of “around 7%” as output likely expanded by 6.8%-6.9% y/y. High frequency data show that China’s economic transformation has continued, with the industrial sector gradually losing steam while the services sector is maintaining its momentum. Due to these rebalancing dynamics, we expect Chinese output expansion to slow to 6.4% and 6.2% in 2016 and 2017, respectively. Nevertheless, we anticipate official intervention to continue over the course of 2016 in order to partially counteract the decelerating forces the economy is facing. Indeed, the government will aim to maintain a relatively stable economic environment to mitigate the risk of disruptive market volatility amid the implementation of its ambitious structural reform agenda.
A2
Tuuli McCully 416.863.2859 [email protected]
Rory Johnston 416.862.3908 [email protected]
Erika Cain 416.866.4205 [email protected]
6.0
6.5
7.0
7.5
8.0
8.5
Mar-12 Mar-13 Mar-14 Mar-15
China Real GDP Growth
y/y % change
Source: Bloomberg, Scotiabank Economics.
forecast
-4
-2
0
2
4
6
8
10
12
14
Nov-11 Nov-12 Nov-13 Nov-14 Nov-15
y/y %change
Source: Scotiabank Economics, Bloomberg.
forecast
Colombian Retail Sales
42
44
46
48
50
52
54
56
58
Feb-13 Feb-14 Feb-15 Feb-16
European Manufacturing PMIs
index
France
Source: Scotiabank Economics, Markit.
Germany
Euro zone
forecast
Chart 1
Chart 2
Chart 3
A2
Economics
Global Views
January 15, 2016
1
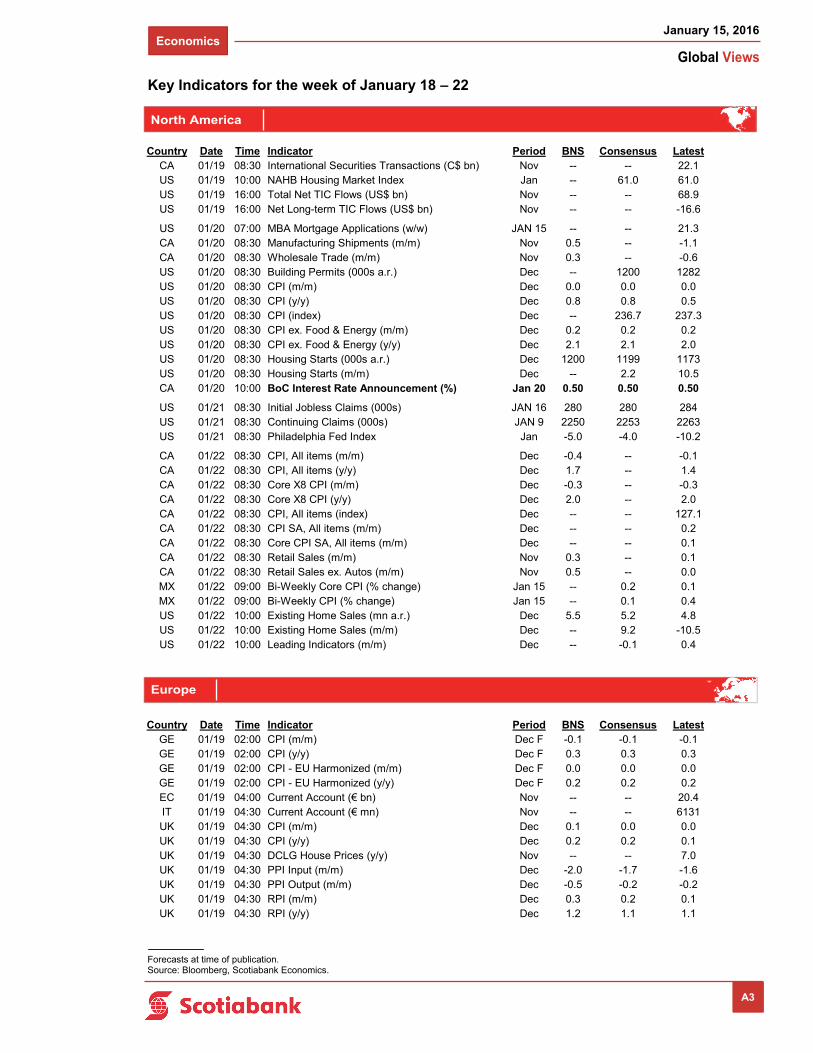
Key Indicators for the week of January 18 – 22
Forecasts at time of publication. Source: Bloomberg, Scotiabank Economics.
North America
A3
Europe
Country Date Time Indicator Period BNS Consensus LatestCA 01/19 08:30 International Securities Transactions (C$ bn) Nov -- -- 22.1US 01/19 10:00 NAHB Housing Market Index Jan -- 61.0 61.0US 01/19 16:00 Total Net TIC Flows (US$ bn) Nov -- -- 68.9US 01/19 16:00 Net Long-term TIC Flows (US$ bn) Nov -- -- -16.6
US 01/20 07:00 MBA Mortgage Applications (w/w) JAN 15 -- -- 21.3CA 01/20 08:30 Manufacturing Shipments (m/m) Nov 0.5 -- -1.1CA 01/20 08:30 Wholesale Trade (m/m) Nov 0.3 -- -0.6US 01/20 08:30 Building Permits (000s a.r.) Dec -- 1200 1282US 01/20 08:30 CPI (m/m) Dec 0.0 0.0 0.0US 01/20 08:30 CPI (y/y) Dec 0.8 0.8 0.5US 01/20 08:30 CPI (index) Dec -- 236.7 237.3US 01/20 08:30 CPI ex. Food & Energy (m/m) Dec 0.2 0.2 0.2US 01/20 08:30 CPI ex. Food & Energy (y/y) Dec 2.1 2.1 2.0US 01/20 08:30 Housing Starts (000s a.r.) Dec 1200 1199 1173US 01/20 08:30 Housing Starts (m/m) Dec -- 2.2 10.5CA 01/20 10:00 BoC Interest Rate Announcement (%) Jan 20 0.50 0.50 0.50
US 01/21 08:30 Initial Jobless Claims (000s) JAN 16 280 280 284US 01/21 08:30 Continuing Claims (000s) JAN 9 2250 2253 2263US 01/21 08:30 Philadelphia Fed Index Jan -5.0 -4.0 -10.2
CA 01/22 08:30 CPI, All items (m/m) Dec -0.4 -- -0.1CA 01/22 08:30 CPI, All items (y/y) Dec 1.7 -- 1.4CA 01/22 08:30 Core X8 CPI (m/m) Dec -0.3 -- -0.3CA 01/22 08:30 Core X8 CPI (y/y) Dec 2.0 -- 2.0CA 01/22 08:30 CPI, All items (index) Dec -- -- 127.1CA 01/22 08:30 CPI SA, All items (m/m) Dec -- -- 0.2CA 01/22 08:30 Core CPI SA, All items (m/m) Dec -- -- 0.1CA 01/22 08:30 Retail Sales (m/m) Nov 0.3 -- 0.1CA 01/22 08:30 Retail Sales ex. Autos (m/m) Nov 0.5 -- 0.0MX 01/22 09:00 Bi-Weekly Core CPI (% change) Jan 15 -- 0.2 0.1MX 01/22 09:00 Bi-Weekly CPI (% change) Jan 15 -- 0.1 0.4US 01/22 10:00 Existing Home Sales (mn a.r.) Dec 5.5 5.2 4.8US 01/22 10:00 Existing Home Sales (m/m) Dec -- 9.2 -10.5US 01/22 10:00 Leading Indicators (m/m) Dec -- -0.1 0.4
Country Date Time Indicator Period BNS Consensus LatestGE 01/19 02:00 CPI (m/m) Dec F -0.1 -0.1 -0.1GE 01/19 02:00 CPI (y/y) Dec F 0.3 0.3 0.3GE 01/19 02:00 CPI - EU Harmonized (m/m) Dec F 0.0 0.0 0.0GE 01/19 02:00 CPI - EU Harmonized (y/y) Dec F 0.2 0.2 0.2EC 01/19 04:00 Current Account (€ bn) Nov -- -- 20.4IT 01/19 04:30 Current Account (€ mn) Nov -- -- 6131UK 01/19 04:30 CPI (m/m) Dec 0.1 0.0 0.0UK 01/19 04:30 CPI (y/y) Dec 0.2 0.2 0.1UK 01/19 04:30 DCLG House Prices (y/y) Nov -- -- 7.0UK 01/19 04:30 PPI Input (m/m) Dec -2.0 -1.7 -1.6UK 01/19 04:30 PPI Output (m/m) Dec -0.5 -0.2 -0.2UK 01/19 04:30 RPI (m/m) Dec 0.3 0.2 0.1UK 01/19 04:30 RPI (y/y) Dec 1.2 1.1 1.1

Economics
Global Views
January 15, 2016
2
Key Indicators for the week of January 18 – 22
Forecasts at time of publication. Source: Bloomberg, Scotiabank Economics.
A4
Asia Pacific
Europe (continued from previous page)
Country Date Time Indicator Period BNS Consensus LatestEC 01/19 05:00 ZEW Survey (Economic Sentiment) Jan -- -- 33.9GE 01/19 05:00 ZEW Survey (Current Situation) Jan -- 53.1 55.0GE 01/19 05:00 ZEW Survey (Economic Sentiment) Jan 11.0 7.9 16.1TU 01/19 07:00 Benchmark Repo Rate (%) Jan 19 7.50 7.50 7.50
GE 01/20 02:00 Producer Prices (m/m) Dec -- -0.4 -0.2UK 01/20 04:30 Average Weekly Earnings (3-month, y/y) Nov -- 2.1 2.4UK 01/20 04:30 Employment Change (3M/3M, 000s) Nov 210.0 235.0 207.0UK 01/20 04:30 Jobless Claims Change (000s) Dec 0.0 2.8 3.9UK 01/20 04:30 ILO Unemployment Rate (%) Nov 5.1 5.2 5.2
EC 01/21 05:00 CPI (m/m) Dec 0.0 0.0 0.0EC 01/21 05:00 CPI (y/y) Dec F 0.2 0.2 0.2EC 01/21 05:00 Euro zone Core CPI Estimate (y/y) Dec F 0.9 0.9 0.9EC 01/21 07:45 ECB Main Refinancing Rate (%) Jan 21 0.05 0.05 0.05EC 01/21 10:00 Consumer Confidence Jan A -5.3 -5.7 -5.7
FR 01/22 03:00 Manufacturing PMI Jan P -- 51.3 51.4FR 01/22 03:00 Services PMI Jan P -- 50.2 49.8GE 01/22 03:30 Manufacturing PMI Jan P -- 53.0 53.2GE 01/22 03:30 Services PMI Jan P -- 55.5 56.0EC 01/22 04:00 Composite PMI Jan P 54.4 54.1 54.3EC 01/22 04:00 Manufacturing PMI Jan P 53.0 53.0 53.2EC 01/22 04:00 Services PMI Jan P 54.5 54.1 54.2UK 01/22 04:30 PSNB ex. Interventions (£ bn) Dec 8.5 10.5 14.2UK 01/22 04:30 Public Finances (PSNCR) (£ bn) Dec -- -- 5.4UK 01/22 04:30 Public Sector Net Borrowing (£ bn) Dec -- 10.0 13.6UK 01/22 04:30 Retail Sales ex. Auto Fuel (m/m) Dec -0.4 -0.3 1.7UK 01/22 04:30 Retail Sales with Auto Fuel (m/m) Dec -0.2 -0.3 1.7
Country Date Time Indicator Period BNS Consensus LatestAU 01/17 19:30 New Motor Vehicle Sales (m/m) Dec -- -- 1.0SI 01/17 19:30 Exports (y/y) Dec -- -4.4 -3.3JN 01/17 23:30 Capacity Utilization (m/m) Nov -- -- 1.3JN 01/17 23:30 Tertiary Industry Index (m/m) Nov -- -0.7 0.9JN 01/17 23:30 Industrial Production (y/y) Nov F 1.6 -- 1.6
JN 01/18 00:30 Nationwide Department Store Sales (y/y) Dec -- -- -2.7SK 01/18 16:00 PPI (y/y) Dec -- -- -4.6CH 01/18 21:00 Fixed Asset Investment YTD (y/y) Dec -- 10.2 10.2CH 01/18 21:00 Industrial Production (y/y) Dec 6.1 6.0 6.2CH 01/18 21:00 Real GDP (y/y) 4Q 6.9 6.9 6.9CH 01/18 21:00 Retail Sales (y/y) Dec 11.2 11.3 11.2
HK 01/19 03:30 Unemployment Rate (%) Dec 3.3 3.3 3.3NZ 01/19 16:45 Consumer Prices (y/y) 4Q 0.7 0.3 0.4MA 01/19 23:00 CPI (y/y) Dec 2.6 2.8 2.6HK 01/19 Composite Interest Rate (%) Dec -- -- 0.25PH 01/19 Balance of Payments (US$ mn) Dec -- -- -141.0
TA 01/20 03:00 Export Orders (y/y) Dec -- -6.7 -6.3AU 01/20 10:30 Conference Board Leading Index (%) Nov -- -- -0.1NZ 01/20 16:30 Business NZ PMI Dec -- -- 54.7

Economics
Global Views
January 15, 2016
3
Key Indicators for the week of January 18 – 22
Forecasts at time of publication. Source: Bloomberg, Scotiabank Economics.
A5
Latin America
Country Date Time Indicator Period BNS Consensus LatestAU 01/20 19:00 HIA New Home Sales (m/m) Nov -- -- -3.0NZ 01/20 19:00 ANZ Consumer Confidence Index Jan -- -- 118.7JN 01/20 23:30 All Industry Activity Index (m/m) Nov -- -0.8 1.0JN 01/20 Supermarket Sales (y/y) Dec -- -- -1.0
HK 01/21 03:30 CPI (y/y) Dec 2.4 2.4 2.4MA 01/21 05:00 Overnight Rate (%) Jan 21 3.25 3.25 3.25TA 01/21 19:30 Unemployment Rate (%) Dec 3.8 3.9 3.8JN 01/21 21:00 Markit/JMMA Manufacturing PMI Jan P -- 52.8 52.6
TA 01/22 03:00 Industrial Production (y/y) Dec -- -5.5 -4.9TH 01/22 Customs Exports (y/y) Dec -- -6.7 -7.4TH 01/22 Customs Imports (y/y) Dec -- -- -9.5TH 01/22 Customs Trade Balance (US$ mn) Dec -- -- 298.5
Asia Pacific (continued from previous
Country Date Time Indicator Period BNS Consensus LatestCO 01/18 16:00 Retail Sales (y/y) Nov 0.5 1.2 0.1
CO 01/19 16:00 Trade Balance (US$ mn) Nov -- -1638 -1595
BZ 01/20 SELIC Target Rate (%) Jan 20 14.50 14.75 14.25

Economics
Global Views
January 15, 2016
4
Global Auctions for the week of January 18 – 22
North America
Europe
Source: Bloomberg, Scotiabank Economics.
A6
Country Date Time EventUS 01/19 11:30 U.S. to Sell USD31 Bln 3-Month BillsUS 01/19 11:30 U.S. to Sell USD26 Bln 6-Month Bills
US 01/20 11:30 U.S. to Sell 4-Week Bills
CA 01/21 12:00 Canada to Sell CAD2.5 Bln 1.5% 2026 BondsUS 01/21 13:00 U.S. to Sell USD15 Bln 10-Year TIPS
Country Date Time EventNE 01/18 05:00 Netherlands to Sell Up to EUR2 Bln 71-Day BillsNE 01/18 05:00 Netherlands to Sell Up to EUR2 Bln 162-Day BillsNO 01/18 05:05 Norway to Sell NOK4 Bln 336-Day BillsFR 01/18 08:50 France to Sell Up to EUR3.5 Bln 91-Day BillsFR 01/18 08:50 France to Sell Up to EUR1.6 Bln 140-Day BillsFR 01/18 08:50 France to Sell Up to EUR1.6 Bln 3500-Day Bills
MB 01/19 05:00 Malta to Sell 91-Day 2016 BillsMB 01/19 05:00 Malta to Sell 182-Day 2016 BillsEC 01/19 05:10 ECB Main Refinancing Operation ResultSZ 01/19 05:15 Switzerland to Sell 91-Day BillsFI 01/19 05:30 Finland to Sell 2.625% 2042 BondsFI 01/19 05:30 Finland to Sell 0.375% 2020 BondsEC 01/19 06:30 ESM to Sell Up to EUR1.5 Bln 182-Day Bills
DE 01/20 04:30 Denmark to Sell 1.75% 2025 BondsDE 01/20 04:30 Denmark to Sell 1% I/L 2023 BondsSW 01/20 05:03 Sweden to Sell BondsUK 01/20 05:30 U.K. to Sell GBP4 Bln 1.5% 2021 BondsPO 01/20 05:30 Portugal to Sell 182-Day BillsPO 01/20 05:30 Portugal to Sell 364-Day Bills
SP 01/21 04:30 Spain to Sell 1.95% 2030 BondsSP 01/21 04:30 Spain to Sell 0.25% 2019 BondsFR 01/21 04:50 France to Sell 0.25% 2020 BondsFR 01/21 04:50 France to Sell 0% 2019 BondsFR 01/21 04:50 France to Sell 2.25% 2022 BondsFR 01/21 05:50 France to Sell 0.1% I/L 2025 BondsFR 01/21 05:50 France to Sell 0.7% I/L 2030 Bonds
UK 01/22 06:00 U.K. to Sell GBP1.5 Bln 28-Day BillsUK 01/22 06:00 U.K. to Sell GBP1.5 Bln 91-Day BillsUK 01/22 06:00 U.K. to Sell GBP1.5 Bln 182-Day BillsIC 01/22 06:00 Iceland to Sell Bonds

Economics
Global Views
January 15, 2016
5
Global Auctions for the week of January 18 – 22
Source: Bloomberg, Scotiabank Economics.
A7
Asia Pacific
Latin America
Country Date Time EventCH 01/17 21:00 China Development Bank To Sell CNY3 Bln 5-Yr BondsJN 01/17 22:35 Japan to Sell 1-Year Bills
CH 01/18 01:00 Agricultural Dev Bank to Sell CNY4 Bln 2-Yr Bonds JN 01/18 22:45 Japan to Sell 5-Year Bonds
CH 01/19 22:00 China Plans to Sell 7-Year Upsized Bonds
AU 01/20 18:30 Australia Sells AUD500 Mln 91-Day BillsJN 01/20 22:35 Japan to Sell 3-Month BillsJN 01/20 22:45 Japan to Sell 20-Year Bonds
CH 01/21 22:00 China Plans to Sell 3-Month T-Bills
Country Date Time EventBZ 01/19 09:00 Brazil to Sell I/L Bonds - 05/15/2021BZ 01/19 09:00 Brazil to Sell I/L Bonds - 08/15/2026BZ 01/19 09:00 Brazil to Sell I/L Bonds - 05/15/2035BZ 01/19 09:00 Brazil to Sell I/L Bonds - 05/15/2055
BZ 01/21 09:00 Brazil to Sell Bills LTN - 10/01/2016BZ 01/21 09:00 Brazil to Sell Bills LTN - 04/01/2018BZ 01/21 09:00 Brazil to Sell Bills LTN - 01/01/2020BZ 01/21 09:00 Brazil to Sell LFT - 03/1/2022

Economics
Global Views
January 15, 2016
6
Events for the week of January 18 – 22
Europe
Source: Bloomberg, Scotiabank Economics.
A8
North America
Latin America
Asia Pacific
Country Date Time EventCA 01/18 10:00 Toronto Real Estate Board releasing Toronto 2016 ForecastUS 01/18 Iowa Caucuses
US 01/19 11:00 CBO releases summary of annual Budget & Economic Outlook ReportCA 01/19 12:00 Tiff Macklem Speaks at Joint Event in OttawaCA 01/19 12:30 TABE Lunch: Risks from Mortgage Debt. Alexander & Jacobson
CA 01/20 10:00 Bank of Canada Rate DecisionCA 01/20 10:00 Bank of Canada Releases Monetary Policy Report
CA 01/21 12:00 Canada Infrastructure Minister Speaks in Toronto
Country Date Time EventSW 01/18 03:30 Riksbank Publishes Minutes from Extraordinary Meeting Jan. 4UK 01/18 13:30 Bank of England Official Gertjan Vlieghe Speaks in London
TU 01/19 07:00 Benchmark Repurchase RateTU 01/19 07:00 Overnight Lending RateTU 01/19 07:00 Overnight Borrowing RateUK 01/19 07:00 BOE Governor Mark Carney Speaks in London
EC 01/21 07:45 ECB Main Refinancing RateEC 01/21 07:45 ECB Deposit Facility RateEC 01/21 07:45 ECB Marginal Lending Facility
EC 01/22 04:00 ECB Survey of Professional ForecastersEC 01/22 07:00 BOE's Cunliffe Speaks at Bruegel in BrusselsGR 01/22 Athens Sovereign Debt to Be Rated by Moody'sPO 01/22 Azores Sovereign Debt to Be Rated by Moody'sGE 01/22 Baden-Wuerttemberg Sovereign Debt to Be Rated by Moody'sSP 01/22 Barcelona Sovereign Debt to Be Rated by Moody'sRU 01/22 Bashkortostan Sovereign Debt to Be Rated by Moody's
Country Date Time EventMA JAN 15-16 Taiwan Holds Presidential Election
MA 01/21 05:00 BNM Overnight Policy Rate
Country Date Time EventBZ 01/20 Selic Rate

Economics
Global Views
January 15, 2016
7
Global Central Bank Watch
NORTH AMERICARate Current Rate Next Meeting Scotia's Forecasts Consensus ForecastsBank of Canada – Overnight Target Rate 0.50 January 20, 2016 0.50 0.50
Federal Reserve – Federal Funds Target Rate 0.50 January 27, 2016 0.50 0.50
Banco de México – Overnight Rate 3.25 February 4, 2016 3.50 --
EUROPERate Current Rate Next Meeting Scotia's Forecasts Consensus ForecastsEuropean Central Bank – Refinancing Rate 0.05 January 21, 2016 0.05 0.05
Bank of England – Bank Rate 0.50 February 4, 2016 0.50 0.50
Swiss National Bank – Libor Target Rate -0.75 March 17, 2016 -0.75 --
Central Bank of Russia – One-Week Auction Rate 11.00 January 29, 2016 11.00 --
Central Bank of the Republic of Turkey – 1 Wk Repo Rate 7.50 January 19, 2016 7.50 7.50
Sweden Riksbank – Repo Rate -0.35 February 11, 2016 -0.35 --
Norges Bank – Deposit Rate 0.75 March 17, 2016 0.75 --
ASIA PACIFICRate Current Rate Next Meeting Scotia's Forecasts Consensus ForecastsReserve Bank of Australia – Cash Target Rate 2.00 February 1, 2016 2.00 2.00
Reserve Bank of New Zealand – Cash Rate 2.50 January 27, 2016 2.50 2.50
People's Bank of China – Lending Rate 4.35 TBA -- --
Reserve Bank of India – Repo Rate 6.75 February 2, 2016 6.75 --
Bank of Korea – Bank Rate 1.50 February 16, 2016 1.50 --
Bank of Thailand – Repo Rate 1.50 February 3, 2016 1.50 1.50
Bank Indonesia – Reference Interest Rate 7.25 February 18, 2016 7.25 --
LATIN AMERICARate Current Rate Next Meeting Scotia's Forecasts Consensus ForecastsBanco Central do Brasil – Selic Rate 14.25 January 20, 2016 14.50 14.75
Banco Central de Chile – Overnight Rate 3.50 February 11, 2016 3.50 --
Banco de la República de Colombia – Lending Rate 5.75 January 29, 2016 5.75 6.00
Banco Central de Reserva del Perú – Reference Rate 3.75 February 11, 2016 3.75 --
AFRICARate Current Rate Next Meeting Scotia's Forecasts Consensus ForecastsSouth African Reserve Bank – Repo Rate 6.25 January 28, 2016 6.25 6.75
The Bank of Canada meets on January 20th to release its latest policy decision. Consensus is divided on the outcome. For our views, please see the article by Derek Holt and Dov Zigler on page 6 of this report. Fed: The tone of United States macroeconomic data has weakened of late, global risk appetite has diminished, and market-based inflation expectations have declined. This combination of factors will likely lead the Federal Reserve to strike a modestly cautious tone at its January 27 meeting. We will not receive very much further guidance on this front from Fed officials, however, as the Fed is now going into communications black-out ahead of the meeting.
Monetary policymakers at the European Central Bank (ECB) will meet for a scheduled policy meeting on Thursday, January 21st. The ECB is expected to keep benchmark interest rates unchanged and not announce any changes to its Asset Purchase Program (APP). However, with the weak oil price outlook and the strengthening of the euro weighing on inflation expectations, markets will be paying close attention to any clues on whether the ECB will opt to expand its APP in the coming months. We expect monetary policymakers at the Central Bank of the Republic of Turkey (CBRT) to keep interest rates unchanged at its next meeting on January 19th. The CBRT will likely maintain a cautious monetary policy stance over the near term, given US monetary tightening and the country’s elevated inflation environment.
We expect the Banco Central do Brasil to increase its benchmark SELIC rate by 25 basis points to 14.50% when monetary authorities meet on January 20th. Inflation has continued to accelerate despite tight monetary policy and exceeded 10% y/y at the close of 2015, the fastest pace of price growth since 2003.
North America
Europe
Asia Pacific
Latin America
Africa
Forecasts at time of publication. Source: Bloomberg, Scotiabank Economics.
A9

Economics
Global Views
January 15, 2016
8
North America
Canada 2014 15Q2 15Q3 Latest United States 2014 15Q2 15Q3 Latest Real GDP (annual rates) 2.5 -0.3 2.3 Real GDP (annual rates) 2.4 3.9 2.0 Current Acc. Bal. (C$B, ar) -44.9 -66.3 -64.8 Current Acc. Bal. (US$B, ar) -390 -444 -496 Merch. Trade Bal. (C$B, ar) 4.8 -25.3 -18.8 -23.8 (Nov) Merch. Trade Bal. (US$B, ar) -741 -757 -760 -735 (Nov) Industrial Production 2.5 -1.4 -0.2 -0.2 (Nov) Industrial Production 3.7 1.6 1.3 -2.0 (Dec) Housing Starts (000s) 189 193 213 173 (Dec) Housing Starts (millions) 1.00 1.16 1.16 1.17 (Nov) Employment 0.6 0.9 0.9 0.8 (Dec) Employment 1.9 2.2 2.0 1.9 (Dec) Unemployment Rate (%) 6.9 6.8 7.0 7.1 (Dec) Unemployment Rate (%) 6.2 5.4 5.2 5.0 (Dec) Retail Sales 4.6 1.9 1.9 1.9 (Oct) Retail Sales 3.6 1.0 1.6 1.6 (Dec) Auto Sales (000s) 1850 1872 1955 1983 (Oct) Auto Sales (millions) 16.4 17.1 17.8 17.2 (Dec) CPI 1.9 0.9 1.2 1.4 (Nov) CPI 1.6 0.0 0.1 0.5 (Nov) IPPI 2.5 -1.4 -0.2 0.2 (Nov) PPI 1.9 -3.3 -3.3 -2.7 (Dec) Pre-tax Corp. Profits 7.0 -15.6 -19.2 Pre-tax Corp. Profits 2.1 7.5 2.0
Mexico Real GDP 2.3 2.3 2.6 Current Acc. Bal. (US$B, ar) -24.0 -30.2 -35.4 Merch. Trade Bal. (US$B, ar) -2.8 -7.4 -25.9 -18.8 (Nov) Industrial Production 2.6 0.6 1.3 0.1 (Nov) CPI 4.0 2.9 2.6 2.1 (Dec)
Euro Zone 2014 15Q2 15Q3 Latest Germany 2014 15Q2 15Q3 Latest Real GDP 0.9 1.3 1.3 Real GDP 1.6 1.6 1.7 Current Acc. Bal. (US$B, ar) 320 293 403 350 (Oct) Current Acc. Bal. (US$B, ar) 212.1 276.7 296.6 318.7 (Nov) Merch. Trade Bal. (US$B, ar) 332.5 377.0 364.9 399.6 (Oct) Merch. Trade Bal. (US$B, ar) 283.3 287.6 279.9 264.1 (Nov) Industrial Production 0.8 1.3 1.7 10.3 (Nov) Industrial Production 1.5 1.5 1.3 -0.1 (Nov) Unemployment Rate (%) 11.6 11.1 10.8 10.6 (Nov) Unemployment Rate (%) 6.7 6.4 6.4 6.3 (Dec) CPI 0.4 0.2 0.1 0.1 (Nov) CPI 0.9 0.5 0.1 0.3 (Dec)
France United Kingdom Real GDP 0.2 1.1 1.1 Real GDP 2.9 2.3 2.1 Current Acc. Bal. (US$B, ar) -26.2 0.6 4.9 -33.0 (Nov) Current Acc. Bal. (US$B, ar) -92.5 -70.0 -69.8 Merch. Trade Bal. (US$B, ar) -43.6 -35.0 -37.1 -51.8 (Nov) Merch. Trade Bal. (US$B, ar) -202.6 -162.8 -198.5 -194.3 (Nov) Industrial Production -1.1 1.0 0.8 1.1 (Nov) Industrial Production 1.3 1.4 1.4 1.6 (Nov) Unemployment Rate (%) 10.3 10.4 10.5 10.1 (Nov) Unemployment Rate (%) 6.2 5.6 5.3 5.2 (Sep) CPI 0.5 0.2 0.1 0.2 (Dec) CPI 1.5 0.0 0.0 0.7 (Nov)
Italy Russia Real GDP -0.4 0.6 0.8 Real GDP 0.6 -4.6 -4.1 Current Acc. Bal. (US$B, ar) 30.8 25.0 46.5 73.6 (Oct) Current Acc. Bal. (US$B, ar) 58.4 15.9 7.5 Merch. Trade Bal. (US$B, ar) 55.4 45.9 53.6 64.9 (Oct) Merch. Trade Bal. (US$B, ar) 15.8 14.4 9.4 9.1 (Nov) Industrial Production -0.5 0.7 1.8 1.2 (Nov) Industrial Production -1.6 -4.9 -4.2 -3.5 (Nov) CPI 0.2 0.0 0.0 0.1 (Dec) CPI 7.8 15.8 15.7 12.9 (Dec)
Europe
All data expressed as year-over-year % change unless otherwise noted.
Economic Statistics
Source: Bloomberg, IHS Global, Scotiabank Economics.
A10

Economics
Global Views
January 15, 2016
9
Asia Pacific
Australia 2014 15Q2 15Q3 Latest Japan 2014 15Q2 15Q3 Latest Real GDP 2.6 1.9 2.5 Real GDP -0.1 0.7 1.7 Current Acc. Bal. (US$B, ar) -44.1 -51.9 -61.5 Current Acc. Bal. (US$B, ar) 25.0 124.0 160.2 112.0 (Nov) Merch. Trade Bal. (US$B, ar) 12.2 -14.7 -14.4 -28.6 (Nov) Merch. Trade Bal. (US$B, ar) -122.1 -24.0 -32.1 -0.3 (Nov) Industrial Production 4.6 0.3 1.9 Industrial Production 2.1 -0.5 -0.4 -2.2 (Nov) Unemployment Rate (%) 6.1 6.0 6.2 5.8 (Dec) Unemployment Rate (%) 3.6 3.3 3.4 3.3 (Nov) CPI 2.5 1.5 1.5 CPI 2.7 0.5 0.2 2.6 (Nov)
South Korea China Real GDP 3.3 2.2 2.7 Real GDP 7.3 7.5 7.9 Current Acc. Bal. (US$B, ar) 84.4 111.7 116.4 112.9 (Nov) Current Acc. Bal. (US$B, ar) 219.7 Merch. Trade Bal. (US$B, ar) 47.2 98.5 80.8 84.0 (Dec) Merch. Trade Bal. (US$B, ar) 382.5 560.6 654.4 721.1 (Dec) Industrial Production 0.5 -1.9 -0.3 -0.3 (Nov) Industrial Production 7.9 6.8 5.7 6.2 (Nov) CPI 1.3 0.5 0.7 1.3 (Dec) CPI 1.5 1.4 1.6 1.6 (Dec)
Thailand India Real GDP 0.9 2.8 2.9 Real GDP 7.0 7.1 7.4 Current Acc. Bal. (US$B, ar) 15.4 6.1 7.2 Current Acc. Bal. (US$B, ar) -27.3 -6.1 -8.2 Merch. Trade Bal. (US$B, ar) 2.0 2.6 3.2 2.1 (Nov) Merch. Trade Bal. (US$B, ar) -11.7 -10.7 -11.9 -9.8 (Nov) Industrial Production -4.6 -7.7 -5.9 -3.3 (Sep) Industrial Production 1.8 3.3 4.8 -3.2 (Nov) CPI 1.9 -1.1 -1.1 -0.9 (Dec) WPI 3.8 -2.3 -4.6 -0.7 (Dec)
Indonesia Real GDP 5.0 4.7 4.7 Current Acc. Bal. (US$B, ar) -27.5 -4.3 -4.0 Merch. Trade Bal. (US$B, ar) -0.2 0.7 0.9 -0.2 (Dec) Industrial Production 4.8 5.2 4.1 5.2 (Oct) CPI 6.4 7.1 7.1 3.4 (Dec)
Brazil 2014 15Q2 15Q3 Latest Chile 2014 15Q2 15Q3 Latest Real GDP 0.1 -3.0 -4.5 Real GDP 1.9 1.9 2.2 Current Acc. Bal. (US$B, ar) -104.3 -51.3 -47.1 Current Acc. Bal. (US$B, ar) -5.9 0.1 -10.4 Merch. Trade Bal. (US$B, ar) -4.0 31.1 32.1 74.9 (Dec) Merch. Trade Bal. (US$B, ar) 6.7 9.5 -2.4 -1.8 (Dec) Industrial Production -2.9 -6.2 -9.4 -13.9 (Nov) Industrial Production 0.4 0.1 -2.1 0.6 (Nov) CPI 6.3 8.5 9.5 10.7 (Dec) CPI 4.4 4.2 4.8 4.4 (Dec)
Peru Colombia Real GDP 2.4 3.0 2.9 Real GDP 4.6 3.0 3.2 Current Acc. Bal. (US$B, ar) -8.0 -1.6 -2.4 Current Acc. Bal. (US$B, ar) -19.6 -4.1 -5.3 Merch. Trade Bal. (US$B, ar) -0.1 -0.3 -0.3 -0.3 (Nov) Merch. Trade Bal. (US$B, ar) -0.5 -0.9 -1.5 -1.6 (Oct) Unemployment Rate (%) 6.0 6.9 6.3 5.7 (Dec) Industrial Production 1.5 -0.7 1.7 1.3 (Oct) CPI 3.2 3.3 3.8 4.4 (Dec) CPI 2.9 4.5 4.9 6.8 (Dec)
Latin America
Economic Statistics
All data expressed as year-over-year % change unless otherwise noted.
Source: Bloomberg, IHS Global, Scotiabank Economics.
A11

Economics
Global Views
January 15, 2016
10
Financial Statistics
A12
Interest Rates (%, end of period)
Canada 15Q3 15Q4 Jan/08 Jan/15* United States 15Q3 15Q4 Jan/08 Jan/15*BoC Overnight Rate 0.50 0.50 0.50 0.50 Fed Funds Target Rate 0.25 0.50 0.50 0.50 3-mo. T-bill 0.44 0.51 0.44 0.32 3-mo. T-bill -0.02 0.16 0.19 0.23 10-yr Gov’t Bond 1.43 1.39 1.30 1.16 10-yr Gov’t Bond 2.04 2.27 2.12 2.02 30-yr Gov’t Bond 2.20 2.15 2.06 1.99 30-yr Gov’t Bond 2.85 3.02 2.91 2.81 Prime 2.70 2.70 2.70 2.70 Prime 3.25 3.50 3.50 3.50 FX Reserves (US$B) 78.3 78.1 (Nov) FX Reserves (US$B) 109.2 105.6 (Nov)
Germany France 3-mo. Interbank -0.06 -0.09 -0.10 -0.10 3-mo. T-bill -0.20 -0.45 -0.40 -0.39 10-yr Gov’t Bond 0.59 0.63 0.51 0.54 10-yr Gov’t Bond 0.99 0.99 0.88 0.86 FX Reserves (US$B) 59.3 58.2 (Nov) FX Reserves (US$B) 53.1 48.8 (Nov)
Euro Zone United Kingdom Refinancing Rate 0.05 0.05 0.05 0.05 Repo Rate 0.50 0.50 0.50 0.50 Overnight Rate -0.12 -0.13 -0.24 -0.24 3-mo. T-bill 0.49 0.48 0.50 0.49 FX Reserves (US$B) 332.3 323.8 (Nov) 10-yr Gov’t Bond 1.76 1.96 1.77 1.66
FX Reserves (US$B) 118.9 117.4 (Nov)
Japan Australia Discount Rate 0.30 0.30 0.30 0.30 Cash Rate 2.00 2.00 2.00 2.00 3-mo. Libor 0.02 0.02 0.02 0.02 10-yr Gov’t Bond 2.61 2.88 2.78 2.69 10-yr Gov’t Bond 0.36 0.27 0.23 0.22 FX Reserves (US$B) 48.1 46.3 (Nov) FX Reserves (US$B) 1221.5 1206.9 (Nov)
Exchange Rates (end of period)
USDCAD 1.33 1.38 1.42 1.45 ¥/US$ 119.88 120.22 117.26 116.83CADUSD 0.75 0.72 0.71 0.69 US¢/Australian$ 0.70 0.73 0.70 0.69GBPUSD 1.513 1.474 1.452 1.428 Chinese Yuan/US$ 6.36 6.49 6.59 6.58EURUSD 1.118 1.086 1.092 1.095 South Korean Won/US$ 1185 1175 1198 1213JPYEUR 0.75 0.77 0.78 0.78 Mexican Peso/US$ 16.918 17.208 17.935 18.194USDCHF 0.97 1.00 0.99 1.00 Brazilian Real/US$ 3.948 3.961 4.025 4.048
Equity Markets (index, end of period)
United States (DJIA) 16285 17425 16346 15992 U.K. (FT100) 6062 6242 5912 5789 United States (S&P500) 1920 2044 1922 1876 Germany (Dax) 9660 10743 9849 9500 Canada (S&P/TSX) 13307 13010 12445 12048 France (CAC40) 4455 4637 4334 4190 Mexico (IPC) 42633 42978 40265 40617 Japan (Nikkei) 17388 19034 17698 17147 Brazil (Bovespa) 45059 43350 40612 38294 Hong Kong (Hang Seng) 20846 21914 20454 19521 Italy (BCI) 1179 1218 1145 1125 South Korea (Composite) 1963 1961 1918 1879
Commodity Prices (end of period)
Pulp (US$/tonne) 960 940 940 940 Copper (US$/lb) 2.31 2.13 2.04 1.96 Newsprint (US$/tonne) 510 505 505 505 Zinc (US$/lb) 0.75 0.73 0.67 0.67 Lumber (US$/mfbm) 242 274 273 265 Gold (US$/oz) 1114.00 1060.00 1101.85 1093.75 WTI Oil (US$/bbl) 45.09 37.04 33.16 29.45 Silver (US$/oz) 14.65 13.82 14.04 13.80 Natural Gas (US$/mmbtu) 2.52 2.34 2.47 2.10 CRB (index) 193.76 176.14 168.58 160.36
* Latest observation taken at time of writing. Source: Bloomberg, Scotiabank Economics.
A12

Global Views
January 15, 2016
Fixed Income Strategy (London) www.gbm.scotiabank.com © 2012, The Bank of Nova Scotia This material, its content, or any copy of it, may not be altered in any way, transmitted to, copied or distributed to any other party without the prior express written consent of ScotiabankTM. This material has not been prepared by a member of the research department of Scotiabank, it is solely for the use of sophisticated institutional investors, and this material does not constitute investment advice or any personal recommendation to invest in a financial instrument or “investment research” as defined by the Financial Services Authority. This material is provided for information and discussion purposes only. An investment decision should not be made solely on the basis of the contents of this publication. It is not to be construed as a solicitation or an offer to buy or sell any financial instruments and has no regard to the specific investment objectives, financial situation or particular needs of any recipient. It is not intended to provide legal, tax, accounting or other advice and recipients should obtain specific professional advice from their own legal, tax, accounting or other appropriate professional advisers before embarking on any course of action. The information in this material is based on publicly available information and although it has been compiled or obtained from sources believed to be reliable, such information has not been independently verified and no guarantee, representation or warranty, express or implied, is made as to its accuracy, completeness or correctness. Information included in this material related to comparison performance (whether past or future) or simulated performance (whether past or future) is not a reliable indicator of future returns. This presentation is not directed to or intended for use by any person resident or located in any country where the distribution of such information is contrary to the laws of such country. Scotiabank its directors, officers, employees or clients may currently or from time to time own or hold interests in long or short positions in any securities referred to herein, and may at any time make purchases or sales of these securities as principal or agent. Scotiabank may also have provided or may provide investment banking, capital markets or other services to the companies referred to in this communication.
TM Trademark of The Bank of Nova Scotia. Used under license, where applicable. Scotiabank, together with "Global Banking and Markets", is a marketing name for the global corporate and investment banking and capital markets businesses of The Bank of Nova Scotia and certain of its affiliates in the countries where they operate, including Scotia Capital Inc., Scotia Capital (USA) Inc., Scotiabanc Inc.; Citadel Hill Advisors L.L.C.; The Bank of Nova Scotia Trust Company of New York; Scotiabank Europe plc; Scotia Capital (Europe) Limited; Scotiabank (Ireland) Limited; Scotiabank Inverlat S.A., Institución de Banca Múltiple, Scotia Inverlat Casa de Bolsa S.A. de C.V., Scotia Inverlat Derivados S.A. de C.V. – all members of the Scotiabank Group and authorized users of the mark. The Bank of Nova Scotia is incorporated in Canada with limited liability. Scotia Capital Inc. is a member of CIPF. Scotia Capital (USA) Inc. is a registered broker-dealer with the SEC and is a member of the NASD and SIPC. The Bank of Nova Scotia, Scotiabank Europe plc, Scotia Capital (Europe) Limited and Scotia Capital Inc. are each authorised and regulated by the Financial Services Authority (FSA) in the U.K. Scotiabank Inverlat, S.A., Scotia Inverlat Casa de Bolsa, S.A. de C.V., and Scotia Derivados, S.A. de C.V., are each authorized and regulated by the Mexican financial authorities. Fixed Income Strategy (Paris) Disclaimer © 2011, The Bank of Nova Scotia This material, its content, or any copy of it, may not be altered in any way, transmitted to, copied or distributed to any other party without the prior express written consent of Scotiabank™. This material has not been prepared by a member of the research department of Scotiabank, it is solely for the use of sophisticated institutional investors, and this material does not constitute investment advice or any personal recommendation to invest in a financial instrument or “investment research” as defined by the Financial Services Authority. This material is provided for information and discussion purposes only. An investment decision should not be made solely on the basis of the contents of this publication. It is not to be construed as a solicitation or an offer to buy or sell any financial instruments and has no regard to the specific investment objectives, financial situation or particular needs of any recipient. It is not intended to provide legal, tax, accounting or other advice and recipients should obtain specific professional advice from their own legal, tax, accounting or other appropriate professional advisers before embarking on any course of action. The information in this material is based on publicly available information and although it has been compiled or obtained from sources believed to be reliable, such information has not been independently verified and no guarantee, representation or warranty, express or implied, is made as to its accuracy, completeness or correctness. Information included in this material related to comparison performance (whether past or future) or simulated performance (whether past or future) is not a reliable indicator of future returns. This presentation is not directed to or intended for use by any person resident or located in any country where the distribution of such information is contrary to the laws of such country. Scotiabank its directors, officers, employees or clients may currently or from time to time own or hold interests in long or short positions in any securities referred to herein, and may at any time make purchases or sales of these securities as principal or agent. Scotiabank may also have provided or may provide investment banking, capital markets or other services to the companies referred to in this communication.
Disclaimer

Scotiabank Economics
Scotia Plaza 40 King Street West, 63rd Floor
Toronto, Ontario Canada M5H 1H1
Tel: 416.866.6253 Fax: 416.866.2829
Email: [email protected]
For general and publication-related inquiries, contact
us by telephone, email and/or fax.
Scotiabank Economics
This report has been prepared by Scotiabank Economics as a resource for the clients of Scotiabank. Opinions, estimates and projections contained herein are our own as of the date hereof and are subject to change without notice. The information and opinions contained herein have been compiled or arrived at from sources believed reliable but no representation or warranty, express or implied, is made as to their accuracy or completeness. Neither Scotiabank nor its affiliates accepts any liability whatsoever for any loss arising from any use of this report or its contents. TM Trademark of The Bank of Nova Scotia. Used under license, where applicable.
Disclaimer
Global Views
January 15, 2016