global value equity portfolio - january 2011
DESCRIPTION
The S&P 500 index had its best performance in December since 1991 and our portfolio benefited as well. Our wish was to end 2010 well by beating our benchmark in December. The insurance stocks made our wish come true.TRANSCRIPT
January 31, 2011
Insurance made our Christmas wish come true
The S&P 500 index had its best performance in December since 1991
and our portfolio benefited as well. Our wish was to end 2010 well by
beating our benchmark in December. The insurance stocks made our
wish come true.
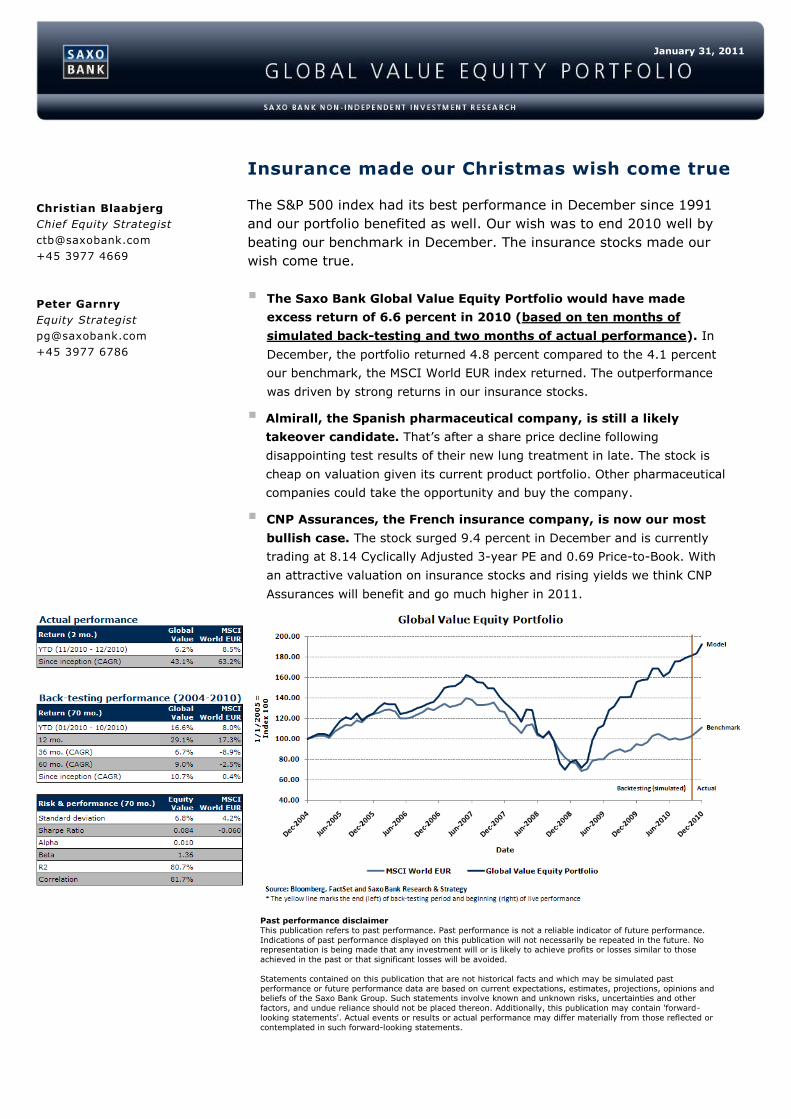
The Saxo Bank Global Value Equity Portfolio would have made
excess return of 6.6 percent in 2010 (based on ten months of
simulated back-testing and two months of actual performance). In
December, the portfolio returned 4.8 percent compared to the 4.1 percent
our benchmark, the MSCI World EUR index returned. The outperformance
was driven by strong returns in our insurance stocks.
Almirall, the Spanish pharmaceutical company, is still a likely
takeover candidate. That‟s after a share price decline following
disappointing test results of their new lung treatment in late. The stock is
cheap on valuation given its current product portfolio. Other pharmaceutical
companies could take the opportunity and buy the company.
CNP Assurances, the French insurance company, is now our most
bullish case. The stock surged 9.4 percent in December and is currently
trading at 8.14 Cyclically Adjusted 3-year PE and 0.69 Price-to-Book. With
an attractive valuation on insurance stocks and rising yields we think CNP
Assurances will benefit and go much higher in 2011.
Christian Blaabjerg
Chief Equity Strategist
+45 3977 4669
Peter Garnry
Equity Strategist
+45 3977 6786
Past performance disclaimer
This publication refers to past performance. Past performance is not a reliable indicator of future performance.
Indications of past performance displayed on this publication will not necessarily be repeated in the future. No representation is being made that any investment will or is likely to achieve profits or losses similar to those
achieved in the past or that significant losses will be avoided.
Statements contained on this publication that are not historical facts and which may be simulated past
performance or future performance data are based on current expectations, estimates, projections, opinions and beliefs of the Saxo Bank Group. Such statements involve known and unknown risks, uncertainties and other
factors, and undue reliance should not be placed thereon. Additionally, this publication may contain 'forward-
looking statements'. Actual events or results or actual performance may differ materially from those reflected or
contemplated in such forward-looking statements.

January 31, 2011
2
Global Value Equity Portfolio – January 2011
Changes to the January portfolio
Three stocks have been placed on the bench – for now
Strong performances in two stocks and changes in relative valuations have kicked three
stocks onto the bench. Koninklijke Philips Electronics N.V. (after a 10.3 percent surge in
December), Zurich Financial Services (surged 14.0 percent) and CapitaCommercial Trust (up
1.0 percent in December). Performances in these three stocks have made them relatively
more expensive and are no longer part of our best global value plays.
So which three new stocks are in for January?
Kowloon Development, the Hong Kong-based company that invests in real estate properties
and trades securities, has been added as its market capitalization has passed the USD one
billion requirement. The stock is currently trading at 12.66 CAPE 3 yr., 0.68 Price-to-Book
and a 5.4 dividend yield and is thus not the cheapest stock in our portfolio. The company
reported very strong half-year results as of June 2010 and we expect the trend to continue
and we see significantly upside from here.
Cincinnati Financial Corp., the U.S. property and casualty company, is added this month due
to a change in relative valuations among our global value candidates; the stock was close to
get elected last month. The stock is currently trading at 9.67 CAPE 3 yr., 1.30 Price-to-Book
and a 4.8 dividend yield. With A.M. Best Co. confirming its A+ (Superior) rating just before
Christmas and a fairly decent third quarter result, we think the stock will go higher as the
market is, in our opinion, too pessimistic about earnings in 2011 and 2012.
Ten Network Holdings Ltd., the Australian operator of commercial television stations
through five capital cities in Australia known as the Ten Network, is added to the portfolio
due to changes in relative valuations among our global value candidates. The stock is
currently trading at 14.6 CAPE 3-yr., 1.91 Price-to-Book and a 3.6 dividend yield. Given the
stock‟s valuation the upside will likely be limited.
Our January portfolio is comprised of the following stocks:

January 31, 2011
3
The portfolio’s sector weight in financials is unchanged at 55 percent.
Financials, particularly insurance stocks, are still trading at depressed levels based on
uncertainty and low expectations for the future. We are still completely confident in the
exposure profile because we believe in the no constraints philosophy – that is seeking value
wherever it exists, both geographically and in sectors. The weights in utilities and health
technology are also unchanged and comprise a combined 20 percent weight in our January
portfolio.
The portfolio’s currency exposure is primarily in EUR, GBP and HKD (75 percent).
January 31, 2011
4
Global Value Equity Portfolio – December 2010
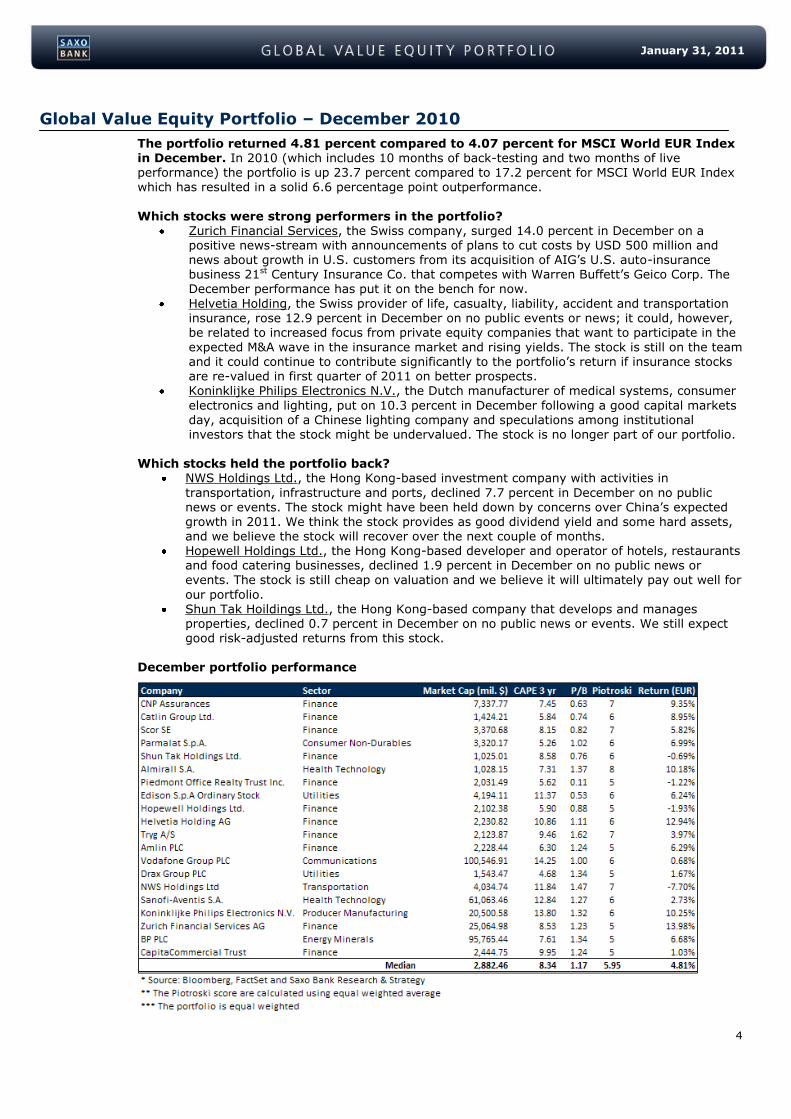
The portfolio returned 4.81 percent compared to 4.07 percent for MSCI World EUR Index in December. In 2010 (which includes 10 months of back-testing and two months of live performance) the portfolio is up 23.7 percent compared to 17.2 percent for MSCI World EUR Index which has resulted in a solid 6.6 percentage point outperformance.
Which stocks were strong performers in the portfolio?
Zurich Financial Services, the Swiss company, surged 14.0 percent in December on a positive news-stream with announcements of plans to cut costs by USD 500 million and news about growth in U.S. customers from its acquisition of AIG‟s U.S. auto-insurance business 21st Century Insurance Co. that competes with Warren Buffett‟s Geico Corp. The December performance has put it on the bench for now.
Helvetia Holding, the Swiss provider of life, casualty, liability, accident and transportation insurance, rose 12.9 percent in December on no public events or news; it could, however, be related to increased focus from private equity companies that want to participate in the
expected M&A wave in the insurance market and rising yields. The stock is still on the team and it could continue to contribute significantly to the portfolio‟s return if insurance stocks are re-valued in first quarter of 2011 on better prospects.
Koninklijke Philips Electronics N.V., the Dutch manufacturer of medical systems, consumer
electronics and lighting, put on 10.3 percent in December following a good capital markets day, acquisition of a Chinese lighting company and speculations among institutional investors that the stock might be undervalued. The stock is no longer part of our portfolio.
Which stocks held the portfolio back?
NWS Holdings Ltd., the Hong Kong-based investment company with activities in
transportation, infrastructure and ports, declined 7.7 percent in December on no public news or events. The stock might have been held down by concerns over China‟s expected growth in 2011. We think the stock provides as good dividend yield and some hard assets, and we believe the stock will recover over the next couple of months.
Hopewell Holdings Ltd., the Hong Kong-based developer and operator of hotels, restaurants and food catering businesses, declined 1.9 percent in December on no public news or
events. The stock is still cheap on valuation and we believe it will ultimately pay out well for
our portfolio. Shun Tak Hoildings Ltd., the Hong Kong-based company that develops and manages
properties, declined 0.7 percent in December on no public news or events. We still expect good risk-adjusted returns from this stock.
December portfolio performance

January 31, 2011
5
Portfolio basics
Value creates excess risk-adjusted return. This equity portfolio is based on classical deep value
criteria mixed with a quality indicator based on a Piotroski score. Our portfolio would have produced
excess risk-adjusted return in the back testing period by 10.3%; the annual return was 10.7% p.a.
compared to 0.4% p.a. return for our benchmark, the MSCI World Index EUR.
Global portfolio without constrains. Our equity portfolio has no constraints in terms of exposure
restrictions towards geography or sectors. The portfolio seeks to exploit deep value opportunities
wherever they are located in the world. We have found during back-testing that the additional risk
taken by this approach is sufficiently offset by the extra return received.
Equal weighted portfolio. The portfolio is based on an equal weighted approach and the monthly
return is calculated accordingly on these weights.
The portfolio is not hedged to offset movements in the currency markets. In order to
reduce the impact on returns from currency fluctuations the investor must hedge all currency
exposure on a monthly basis using the currency exposure pie chart that can found in the
publication.
The portfolio’s returns are calculated on gross basis (excluding dividends, transaction
cost and taxes). Net returns after taxes may vary between investors due to different tax
treatments on dividends and capital gains depending on the tax jurisdictions. Transaction cost may
vary between different brokers.
Due to the monthly rebalancing of the portfolio monthly transaction costs of 0.25 percent
are higher than for a traditional buy and hold portfolio. Based on a sample test the portfolio‟s
monthly dividend return of around 0.5 percent compensates for the above monthly average
transaction costs estimated to be around 0.25 percent. The back-test‟s positive risk-adjusted results
are excluding dividend and transaction costs which would normally give rise to concerns about
alpha when correcting for transaction costs. However, our sample tests on the back-testing period
show that dividends offset the transaction costs.
The new portfolio. The Global Value Equity Portfolio portfolio is an update of the original portfolio
we released in September 2010. In further testing we found that by changing the parameter
settings we could receive a better risk adjusted return. Furthermore, we now have monthly holding
periods creating a composite index.
Research methodology
Saxo Bank’s Global Value Equity Strategy portfolio is designed to address the classic
challenge in equity portfolio research: how to produce excess return given a benchmark
index. The aim, therefore, is to create a portfolio that generates a positive Sharpe Ratio indicating
the portfolio produced excess return over the risk-free rate for each unit of risk taken.
According to the existing literature in the field it is possible, using various value criteria,
to create a portfolio that outperforms the chosen benchmark index on a risk-adjusted
basis. Studies such as Fama and French (1992), Lakonishok, Shleifer and Vishny (1994) and
Piotroski (2002)1 document that significant excess return is possible for high book-to-market
portfolios (that is a portfolio with a low price-to-book ratio). Following this line of research our
portfolio uses Benjamin Graham deep value criteria (published by Rea in a Journal of Portfolio
Management article from 1977)2, amongst other criteria, such as: a trailing earnings yield (more
1 Eugene F. Fama and Kenneth R. French (1992), The Cross-Section of Expected Returns, The Journal of Finance, vol. XLVII, no.
2, pp. 427-465; Josef Lakonishok, Andrei Shleifer and Robert W. Vishny (1994), Contrarian Investment, Extrapolation, and Risk,
The Journal of Finance, vol. 49, no. 5, pp. 1541-1578; Joseph D. Piotroski (2002), Value Investing: The Use of Historical Financial Statement Information to Separate Winners from Losers, The University of Chigago School of Business. 2 James B. Rea (1977), Remembering Benjamin Graham – Teacher and Friend, Journal of Portfolio Management, vol. 3, no. 4,
pp. 66-72.

January 31, 2011
6
specifically CAPE3) greater than twice the corporate bond yield, a dividend yield at least equal to
two-thirds of the corporate AAA bond yield and a low debt-to-equity ratio.
The Saxo Bank Global Value Equity portfolio is constructed using a bottom-up approach
which de-emphasises the significance of economic and market cycles. On this basis, the
portfolio will be fully-invested at all times. One of the consequences of being invested at all
times is downward pressure on the portfolio‟s alpha while creating a higher beta. The latter
argument is not that intuitive because value stocks are typically perceived as producing stable
returns (low beta and positive alpha). This is mitigated because we are using deep value criteria
that will increase the number of companies with depressed valuations, which will lead to higher
volatility (beta). Note, higher volatility does not necessarily mean higher risk (as in underlying
business risk). Our hypothesis is the portfolio will compensate on a risk-adjusted basis for our risk-
taking in these depressed and neglected companies measured as low P/B stocks.
Our monthly stock sample is selected according to our search criteria and the universe is
cash equities available to trade on the Saxo Bank trading platforms4. We also limit the
universe to primary issues (listings), but include inactive stocks to ensure the population does not
include survivorship bias from excluding bankruptcies, mergers and delisting etc. The difference
between active and inactive population of stocks is 19,490 and 37,301 irrespectively.
Our research design is based on a few screening criteria such as market value, average
daily trading volume, cyclical adjusted price earnings (CAPE), dividend yield and interest-
bearing debt over equity. To generate a portfolio with medium-to-low business and liquidity risk
only stocks (and companies) with a market capitalisation above USD 1 billion (as of 2010
approximately 2,460 companies pass this criterion) and 60-day average daily trading volume above
EUR 1.5 million (4,800 stock/companies pass this criterion) are permitted. The CAPE 3-year
parameter is set to maximum of 16 which equals a minimum earnings yield of 6.25%. This
constraint limits the sample to stocks with conservative valuations (3,400 stocks/companies pass
this criterion). The dividend yield should at least equal two-thirds of the corporate AAA bond yield
which on average through the back-testing period is a minimum of 3.3% (around 2,200
stocks/companies pass this criterion). Interest-bearing debt should be less than two-thirds equity.
This parameter ensures that highly leveraged companies such as commercial banks and real estate
stocks do not pass our screening (8,100 stocks/companies pass this criterion). Benjamin Graham
preferred stocks with P/B ratios below two which we are also applying in our portfolio (8,100
stocks/companies pass this criterion).
The first iteration of the portfolio was built on a trailing earnings (CAPE 7-year) yield
greater than twice the corporate AAA bond yield. However, this limited our sample too
much (sometimes only five stocks passed our screening in a single month). Thus we
changed the parameter to CAPE 3-year below 16 to increase the monthly sample. The problem
presented was that a relatively high stable corporate AAA bond yields around five percent, which in
return equals an earnings yield of at least 10%. For this to be met CAPE 7-year would have to be
below 10, which is virtually impossible to obtain for long periods in the equity market – we would
not be able to be invested at all times in the equity market.
Back-testing methodology
We set the last day of the prior month as our back-testing date. For example when back-
testing January 2006 we use the back-testing date of 31 December 2005. Each monthly screening
3 CAPE is the current market price divided with a chosen period of earnings per share (EPS) and the concept was first published
and used by Benjamin Graham and David Dodd in their book Security Analysis (1934). They emphasised using no less than five
years of annual EPS. The concept is based on adjusting the EPS for cyclical upward or downward extremes (smoothing out the
earnings pattern). Through our iterative research we observed that our mix of value criteria produced a too narrow a sample to
conduct a diversified portfolio in some early observation (particularly in 2005). From a sensitivity analysis of our parameters the
CAPE parameter came out as the most sensitive. On this basis we concluded to change our CAPE parameter from originally CAPE 7 yr. (current market price divided with the latest seven years of annual EPS) to CAPE 3 yr. We will use CAPE and CAPE 3 yr.
interchangeably in this paper. 4 See appendix for the stock exchanges on which Saxo Bank facilitates cash equity trading.
January 31, 2011
7
provides the stocks that pass our criteria and returns all relevant parameter data. The start back
test date is set at 31 December 2004, which means that the portfolio‟s beginning date is 1 January
2005. This provides us with 70 monthly return observations which are sufficient enough to generate
valid statistical analyses such as beta, alpha, Sharpe ratio and Treynor measures.
In order to avoid having look-ahead bias in our portfolio we use lagging arguments on all
relevant parameters in the portfolio. Our data provider does not have a point-in-time database
on fundamental data, meaning that if our back-testing date is 31 January 2006 and we are looking
back on the last annual report data, we are receiving annual report data from 2005 instead of 2004
despite the information first being available to the public in February or March 2005. By
implementing three month lagging arguments on all relevant parameters, we avoid having look-
ahead bias in our portfolio.
Each month the screening output is analysed and the stocks are ranked based on a
weighted average of separate rankings for Piotroski score, CAPE and P/B. The 20 stocks
with the lowest weighted ranking (most attractive valuation and Piotroski score) are selected as the
forthcoming month‟s portfolio. Based on the monthly price return adjusted to currency cross
changes in EUR we calculate the portfolio‟s equally weighted return for that month.
The portfolio is rebalanced every month, thus the holding period is dynamic in the sense
that a stock will be re-elected to our portfolio if it still is among the 20 most promising
stocks in terms of valuation and Piotroski score. A stock that increases far more in price
relative to other value stocks will probably have a short holding period. If the potential price
appreciation has not materialised yet the stock will usually remain in the portfolio.
In back-testing, our portfolio would have produced an annual gross return, excluding
dividends (monthly dividends are estimated to be 0.5 percent) and transaction costs
(monthly costs estimated to be 0.25 percent), of 10.7% compared to 0.4% for MSCI
World Index EUR. See our comments about transaction costs under „Portfolio basics‟. Even though
our weighted holding period is shorter compared to the normal value philosophy the total return
compensates for the additional costs related to our monthly rebalancing. Our portfolio produced
excess return over the MSCI World Index EUR in 40 out of 70 months. This corresponds to around
57.1% positive excess return observations throughout the back-testing period. In addition, our
portfolio does not include dividends which would have increased the annual performance relatively
to MSCI World Index EUR as the portfolio had constantly around 3.5-5.5% dividend yield which has
consistently been around 1-2 percentage points above that of MSCI World Index EUR.
We calculate the Sharpe ratio, beta, alpha, R2 and correlation based on monthly return
observations for the portfolio and MSCI World Index EUR. We use the iBoxx EUR Treasuries
1-3Y Total Return Index as our risk-free rate. Beta and alpha are calculated with linear regression of
the portfolio‟s and MSCI World Index EUR‟s monthly excess return over the risk-free rate. The
portfolio performed well over the back-testing period with a positive Sharpe Ratio of 0.08 (on a
monthly basis), beta of 1.38 and alpha of 0.01 with R2 of 80.9% and correlation between monthly
return of the portfolio and MSCI World Index EUR of 81.8%.
The portfolio’s return distribution over the back-testing period has had a positive
skewness and excess kurtosis. Our portfolio has a positive skewness of 0.06 indicating that the
return distribution has an asymmetric tail extending towards more positive values. But the value
lies within one standard deviation and thus the value is probably just a chance fluctuation from zero
– that is the return distribution is probably symmetric. Our portfolio has an excess kurtosis of 4.33
which means that the returns follow a leptokurtic distribution (more peaked values). Our portfolio‟s
kurtosis lies above two standard deviations indicating that our portfolio has significantly peaked
return distribution which point towards it having fat tails (higher probabilities of larger positive and
negative monthly returns). Thus we should expect large positive as well as negative returns.

January 31, 2011
8
Historical data also suggests the maximum monthly return since 2005 has been 27.5% for the
portfolio compared to 11.1% for MSCI World Index EUR5.
5 This publication refers to past performance. Past performance is not a reliable indicator of future
performance. Indications of past performance displayed on this publication will not necessarily be
repeated in the future. No representation is being made that any investment will or is likely to achieve
profits or losses similar to those achieved in the past or that significant losses will be avoided.
Statements contained on this publication that are not historical facts and which may be simulated past
performance or future performance data are based on current expectations, estimates, projections,
opinions and beliefs of the Saxo Bank Group. Such statements involve known and unknown risks,
uncertainties and other factors, and undue reliance should not be placed thereon. Additionally, this publication may contain 'forward-looking statements'. Actual events or results or actual performance may
differ materially from those reflected or contemplated in such forward-looking statements.

January 31, 2011
9
Appendix - stock exchanges available for trading (cash equity)
American Stock Exchange
Euronext Amsterdam
Australian Stock Exchange Ltd.
Euronext Brussels
OMX Copenhagen
OMX Copenhagen – First North
Hong Kong Stock Exchange
OMX Helsinki
Euronext Lisbon
London International Exchange
London Stock Exchange SEAQ Market
London Stock Exchange SETS Market
Milano Stock Exchange
NASDAQ Global Markets
NASDAQ Capital Markets
New York Stock Exchange
NYSE ARCA
Oslo Stock Exchange
OTC Bulletin Board on NASDAQ
Euronext Paris
Singapore Exchange Securities Trading Limited
Sistema De Interconexion Bursatil Espanol
OMX Stockholm
OMX Stockholm – First North
Swiss Exchange
Wiener Börse (Vienna) Stock Exchange
SWX Europe

January 31, 2011
10
NON-INDEPENDENT INVESTMENT RESEARCH
This investment research has not been prepared in accordance with legal requirements designed to promote the independence of
investment research. Further it is not subject to any prohibition on dealing ahead of the dissemination of investment research.
Saxo Bank, its affiliates or staff, may perform services for, solicit business from, hold long or short positions in, or otherwise be
interested in the investments (including derivatives), of any issuer mentioned herein.
None of the information contained herein constitutes an offer (or solicitation of an offer) to buy or sell any currency, product or
financial instrument, to make any investment, or to participate in any particular trading strategy. This material is produced for
marketing and/or informational purposes only and Saxo Bank A/S and its owners, subsidiaries and affiliates whether acting directly
or through branch offices (“Saxo Bank”) make no representation or warranty, and assume no liability, for the accuracy or
completeness of the information provided herein. In providing this material Saxo Bank has not taken into account any particular
recipient‟s investment objectives, special investment goals, financial situation, and specific needs and demands and nothing herein
is intended as a recommendation for any recipient to invest or divest in a particular manner and Saxo Bank assumes no liability for
any recipient sustaining a loss from trading in accordance with a perceived recommendation. All investments entail a risk and may
result in both profits and losses. In particular investments in leveraged products, such as but not limited to foreign exchange,
derivates and commodities can be very speculative and profits and losses may fluctuate both violently and rapidly. Speculative
trading is not suitable for all investors and all recipients should carefully consider their financial situation and consult financial
advisor(s) in order to understand the risks involved and ensure the suitability of their situation prior to making any investment,
divestment or entering into any transaction. Any mentioning herein, if any, of any risk may not be, and should not be considered to
be, neither a comprehensive disclosure or risks nor a comprehensive description such risks. Any expression of opinion may be
personal to the author and may not reflect the opinion of Saxo Bank and all expressions of opinion are subject to change without
notice (neither prior nor subsequent).
This publication refers to past performance. Past performance is not a reliable indicator of future performance. Indications of past
performance displayed on this publication will not necessarily be repeated in the future. No representation is being made that any
investment will or is likely to achieve profits or losses similar to those achieved in the past, or that significant losses will be
avoided.
Statements contained on this publication that are not historical facts and which may be simulated past performance or future
performance data are based on current expectations, estimates, projections, opinions and beliefs of the Saxo Bank Group. Such
statements involve known and unknown risks, uncertainties and other factors, and undue reliance should not be placed thereon.
Additionally, this publication may contain 'forward-looking statements'. Actual events or results or actual performance may differ
materially from those reflected or contemplated in such forward-looking statements.
This material is confidential and should not be copied, distributed, published or reproduced in whole or in part or disclosed by
recipients to any other person.
Any information or opinions in this material are not intended for distribution to, or use by, any person in any jurisdiction or country
where such distribution or use would be lawful. The information in this document is not directed at or intended for “US Persons”
within the meaning of the United States Securities Act of 1993, as amended and the United States Securities Exchange Act of
1934, as amended.
The Saxo Bank Group is under the supervision of the Danish Financial Supervisory Authority (In Danish: "Finanstilsynet") and is
subject to the Danish Executive Order on Good Business Practice for Financial Undertakings.
Saxo Bank A/S
Philip Heymans Allé 15
2900 Hellerup
Denmark
Phone: +45 39 77 40 00
Reg. No. 1149
CVR. No. 15731249
This disclaimer is subject to Saxo Bank's Full Disclaimer available at www.saxobank.com/disclaimer.