global tuberculosis control global tuberculosis · global tuberculosis control v acknowledgements...
TRANSCRIPT

COMMUNICABLE DISEASESWORLD HEALTH ORGANIZATION
GENEVA
WHO/CDS/TB/2002.295ORIGINAL: ENGLISH
DISTR.: GENERAL
WHO REPORT2002
GlobalTuberculosis
ControlSURVEILLANCE,
PLANNING, FINANCING
GLO
BA
L TUB
ERC
ULO
SI S CO
NTR
OL
WH
O R
EPOR
T 2002C
OM
MU
NIC
AB
LE DISEA
SESW
HO
The global tuberculosis epidemic isgrowing larger and more dangerous each
year. The World Health Organization’sprogramme on Communicable Diseases
monitors the epidemic, evaluatingsurveillance, planning, and financing
data in support of nationalTB control programmes.
For further information abouttuberculosis or other
communicable diseases,please contact
Information Resource CentreCommunicable Diseases
World Health Organization20 avenue Appia
CH–1211 Geneva 27, [email protected]
fax +41 22 791 4285tel +41 22 791 3504
You can also visit our website at
http://www.who.int/gtb
COMMUNICABLE DISEASESWORLD HEALTH ORGANIZATION
GENEVA
WHO/CDS/TB/2002.295ORIGINAL: ENGLISH
DISTR.: GENERAL
WHO REPORT2002
GlobalTuberculosis
ControlSURVEILLANCE,
PLANNING, FINANCING
GLO
BA
L TUB
ERC
ULO
SIS CO
NTR
OL
WH
O R
EPOR
T 2002C
OM
MU
NIC
AB
LE DISEA
SESW
HO
The global tuberculosis epidemic isgrowing larger and more dangerous each
year. The World Health Organization’sprogramme on Communicable Diseases
monitors the epidemic, evaluatingsurveillance, planning, and financing
data in support of nationalTB control programmes.
For further information abouttuberculosis or other
communicable diseases,please contact
Information Resource CentreCommunicable Diseases
World Health Organization20 avenue Appia
CH–1211 Geneva 27, [email protected]
fax +41 22 791 4285tel +41 22 791 3504
You can also visit our website at
http://www.who.int/gtb

COMMUNICABLE DISEASESWORLD HEALTH ORGANIZATION
GENEVA
WHO/CDS/TB/2002.295 • ORIGINAL: ENGLISH • DISTR.: GENERAL
Global Tuberculosis ControlSURVEILLANCE, PLANNING, FINANCING
WHO REPORT2002
Suggested Citation: World Health Organization. Global Tuberculosis Control:
Surveillance, Planning, Financing. WHO Report 2002. Geneva, Switzerland,
WHO/CDS/TB/2002.295
Copies of Global Tuberculosis Control are available from
Communicable Diseases
World Health Organization
20 Avenue Appia
CH–1211 Geneva 27
Switzerland
and at
http://www.who.int/gtb/publications/globrep02/index.html
© WORLD HEALTH ORGANIZATION, 2002
This document is not a formal publication of the World Health Organization (WHO),and all rights are reserved by the Organization. The document may, however, be freelyreviewed, abstracted, reproduced and translated, in part or in whole, but not for salenor for use in conjunction with commercial purposes.
The views expressed in documents by named authors are solelythe responsibility of those authors.
Designed by minimum graphicsPrinted in Switzerland
Contents
Acknowledgements v
List of abbreviations vi
Summary 1
Introduction 2
Methods 3
Progress in global TB control 3
Collection of surveillance data 3
Surveillance in the European region 3
Categorization of countries 4
Case detection 4
Treatment success and cure rate 5
Planning for DOTS expansion 6
Development and review of national DOTS expansion plans 6
Development of country profiles 7
Development of regional plans for DOTS expansion 7
Partnerships and coordination 7
Financing DOTS expansion 7
Results 9
Progress in global TB control 9
Countries reporting to WHO 9
Categorization of countries, 1995–2000 9
Case notifications, 1995–2000 10
Case detection rate, 1995–2000 13
Treatment results, 1994–1999 cohorts 15
Progress in TB control in 22 high-burden countries 19
Progress in TB control in all DOTS countries 20
Planning for DOTS expansion 21
Development and review of national DOTS expansion plans 21
Country planning for DOTS expansion 21
WHO regional plans 23
Partnerships and coordination 23
Financing DOTS expansion 23
Assessment of budgets in relation to standard criteria 23
Budgets, funds and funding gaps 23
GLOBAL TUBERCULOSIS CONTROL i i ii i ii i ii i ii i i

i vi vi vi vi v WHO REPORT 2002
Breakdown of budgets 25
Total costs of TB control and total funding gaps 26
Discussion 27
Progress in global TB control 27
Planning for DOTS expansion 27
Financing DOTS expansion 28
Annex 1. Data collection form 31
Annex 2. Global profile 43
Explanatory notes for the global profile 45
Global profile 46
Annex 3. Profiles of high-burden countries 49
Annex 4. Regional profiles 129
Explanatory notes for the regional profiles 131
Africa 133
The Americas 145
The Eastern Mediterranean 157
Europe 169
South-East Asia 183
The Western Pacific 195
Annex 5. World maps 207
1. Estimated TB incidence rates, 2000 209
2. Implementation of DOTS, 2000 210
3. Tuberculosis notification rates, 2000 211
4. Technical and financial partners: 22 high-burden countries 212
Annex 6. Comparison of cases notified and registered for treatment in 1999 213
Annex 7. Changes in treatment success and DOTS detection rate, 1995–2000 217
Annex 8. Global profile (updated) 223

GLOBAL TUBERCULOSIS CONTROL vvvvv
Acknowledgements
This report was prepared by Léopold Blanc, Dan Bleed, Chris Dye, Katherine Floyd, Karen Palmer, and Catherine Watt. The project
was coordinated by Chris Dye and Léopold Blanc.
Other WHO staff who assisted in compiling information for this report were as follows:
HQ Geneva: Marcos Espinal, Malgosia Grzemska, Fabio Luelmo, Salah Ottmani, Mario Raviglione, Holger Sawert.
African Region: Panganai Dhliwayo (Zimbabwe), Giuliano Gargioni (Uganda), Jan van den Hombergh (Ethiopia), Bah Keita (Côte
d’Ivoire), Daniel Kibuga (AFRO), Vainess Mfungwe (AFRO), Wilfred Nkhoma (AFRO), Eugene Nyarko (AFRO), Davis Rumisha
(AFRO), Henriette Wembanyama (DR Congo).
The Americas: José Ramón Cruz (AMRO), Rodolfo Rodriguez Cruz (AMRO), Carolyn Mohan (AMRO), Dionne Patz (AMRO).
Eastern Mediterranean Region: Samiha Baghdadi (EMRO), Emanuele Capobianco (EMRO), Paolo Mantellini (Afghanistan), Akihiro
Seita (EMRO).
European Region: Lucica Ditiu (Albania and TFYR Macedonia), Wieslaw Jakubowiak (Russian Federation), Kestutis Miskinis
(Ukraine), Eva Nathanson (EURO), Gombogaram Tsogt (Central Asia), Richard Zaleskis (EURO).
South-East Asia Region: Pierpaolo de Colombani (Bangladesh), Tom Frieden (India), Nani Nair (SEARO), Jai Narain (SEARO).
Western Pacific Region: Dongil Ahn (WPRO), Daniel Chin (China), Marcus Hodge (WPRO), Takeshi Kasai (WPRO), Pieter van
Maaren (WPRO).
A primary aim of this report is to standardize and share information in support of national TB control programmes. The data
presented here are supplied largely by programme managers, who have been instrumental in driving much of the work on surveil-
lance, planning and financing. We thank all of them, and their staff, for their contributions. WHO’s Global TB Monitoring and
Surveillance Project is carried out with the financial backing of USAID. The DOTS Expansion Project is supported by funding from
the governments of Australia, Belgium, Germany, Ireland, the Netherlands, Norway, Switzerland, UK, and USA. Andrea Infuso
and the staff of EuroTB (Paris), especially Delphine Antoine, worked closely with Eva Nathanson at EURO to ensure that Euro-
pean data were as complete as possible by January 2002. Bill Coggin (CDC USA) and Carina Idema (NTP) assisted with the
analysis of data from South Africa. We also thank, as usual, Sue Hobbs and Keith Wynn for doing everything necessary to get this
report published by World TB Day on March 24.
v iv iv iv iv i WHO REPORT 2002
List of abbreviations
GFATM Global Fund to Fight AIDS, TBand Malaria
GLRA German Leprosy Relief Associa-tion
GMS German Medical ServiceGTZ Gesellschaft für Technische
Zusammenarbeit (Germandevelopment agency)
HBC The 22 high-burden countriesaccounting for approximately80% of all new TB cases arisingeach year
HIV Human immunodeficiency virusHSR Health Sector ReformHPSP Health and Population Sector
ProgrammeHSDP Health Sector Development
ProgrammeICD Italian Cooperation for Develop-
mentIEC Information, Education, Commu-
nicationIFRC International Federation of Red
Cross and Red Crescent SocietiesIEDC Infectious and Endemic Disease
Control Project (China)IPT Isoniazid preventive therapyIUATLD International Union Against
Tuberculosis and Lung DiseaseJATA Japan Anti-Tuberculosis Associa-
tionJFAP Japan Foundation for AIDS
PreventionJICA Japan International Cooperation
AgencyKfW Kreditanstalt für WiederaufbauKNCV Royal Netherlands Tuberculosis
AssociationLGA Local Government AreasMCNV Medical Committee Netherlands-
VietnamMDR-TB Multidrug-resistant tuberculosisMerlin Medical Emergancy Relief
InternationalMPA Minimum Package of ActivitiesMPH Master of Public HealthMoH Ministry of HealthMoPH Ministry of Public HealthMSF Médecins Sans FrontièresNASCOP National AIDS/STDs Control
ProgrammeNGO Non-governmental organizationNHC National Health CommitteeNHLA Norwegian Heart and Lung
AssociationNICC National Interagency Coordinat-
ing Committee
ADB Asian Development BankAFB Acid-fast bacilliAFR WHO African RegionAFRO WHO Regional Office for AfricaALM American Leprosy MissionALTI Aide au Lépreux et Tuberculeux
de l’IturiAMR WHO Region of the AmericasAMRO WHO Regional Office for the
AmericasARV Antiretroviral treatmentAusAID Australian Agency for Interna-
tional DevelopmentBRAC Bangladesh Rural Advancement
CommitteeCB Community-basedCDC Centers for Disease Control and
Prevention, USACDR Case detection rate (i.e. smear-
positive case detection rate,whole country)
CENAT Centre National Anti-TuberculeuxCESAL Centro de Estudios de
Solidariedad con l’America LatinaCIDA Canadian International Develop-
ment AgencyCRL Central reference laboratoryDARE District AIDS and Reproductive
Health Project (Kenya)DANIDA Danish International Develop-
ment AgencyDDR DOTS detection rate (i.e. smear-
positive case detection rate underDOTS)
DFB Damien Foundation BelgiumDFID UK Department for International
DevelopmentDOTS The internationally recommended
control strategy for TBDOT Directly observed treatmentDTBE Division of TB Elimination (CDC)EMR WHO Eastern Mediterranean
RegionEMRO WHO Regional Office for the
Eastern MediterraneanEPOS EPOS Health ConsultantsESP Essential services packageEU European UnionEUR WHO European RegionEURO WHO Regional Office for EuropeFDB Fondation Damien BelgiqueFEFO First expiry, first outFHI Family Health InternationalFILHA Finnish Lung and Health
AssociationGDEP Global DOTS Expansion PlanGDF Global TB Drug Facility
NLHA National Lung Health AssociationNLR National Leprosy Relief Associa-
tionNPO National programme officerNPS National Prevalence SurveyNTLP National Tuberculosis and
Leprosy ProgrammeNTP National Tuberculosis Control
ProgrammeNWFP North-West Frontier Province
(Pakistan)OPAS Organização Pan-Americana da
Saúde (PAHO)OSI Open Society Institute (Soros)PAHO Pan-American Health Organiza-
tionPHC Primary Health CarePHRI Public Health Research InstitutePIH Partners in HealthQA Quality AssuranceRIT Research Institute for Tuberculo-
sis (Japan)RNTCP Revised National TB Control
ProgrammeSANTA South African National TB
AssociationSAPP II Social Action Programme, Project
II (Pakistan)SCC Standardized short-course
chemotherapySEAR WHO South-East Asia RegionSEARO WHO Regional Office for South-
East AsiaSIDA Swedish International Develop-
ment AgencySPC Secretariat of the Pacific
CommunitySTI Sexually transmitted infectionTADSA TB Alliance DOTS Support
AssociationTB TuberculosisTBL Tuberculosis and LeprosyTLCP Tuberculosis and Leprosy Control
ProgrammeTLMI The Leprosy Mission Interna-
tionalUNAIDS Joint United Nations Programme
on HIV/AIDSUNDP United Nations Development
ProgrammeUSAID United States Agency for
International DevelopmentWB World BankWPR WHO Western Pacific RegionWPRO WHO Regional Office for the
Western Pacific

GLOBAL TUBERCULOSIS CONTROL 11111
Summary
represent only one quarter (27%) of
the estimated total, and the rate of
progress in case finding between
1999 and 2000 was no faster than
the average since 1994, a mean an-
nual increment of 133 000 smear-
positive cases. Globally, DOTS
programmes must recruit an extra
330 000 smear-positive patients
each year to reach 70% case detec-
tion by 2005.
6. Over half of the additional smear-
positive cases reported under DOTS
in 2000 (as compared with 1999)
were found in just five countries—
India (28%), the Philippines (19%),
Ethiopia (6%), South Africa (5%) and
Myanmar (4%). Only India, the Phil-
ippines, and Myanmar significantly
increased the proportion of all new
cases detected.
7. DOTS programmes successfully
treated 80% of all registered new
smear-positive patients in 1999, but
only 19% of all new smear-positive
cases estimated to have arisen that
year.
8. Following the departure of Peru from
the list of HBC, Viet Nam was the
only high-burden country to have
reached targets for case detection
and cure by the end of year 2000.
9. The constraints on DOTS expansion
most commonly identified were: lack
of qualified staff and management
skills, shortage of laboratory equip-
ment, absence of collaboration be-
tween TB and HIV programmes, an
unregulated private sector, and de-
centralization of health services.
Other constraints restricted to a sub-
set of HBC include poor access to
health services (e.g. Ethiopia, Mo-
zambique), and war (Afghanistan,
DR Congo).
10. All 22 HBC have prepared a plan for
DOTS expansion, with the collabo-
ration of international technical part-
ners; 11 have established National
Interagency Coordination Commit-
tees; 19 have budgets for one or
more years 2002–5; six were
assisted by the Global Drug Facility.
11. The budgets developed by the 22
HBC, which usually focus on costs
specific to TB control only, currently
total US$ 436–486 million per year
for the period 2002–5. At least 17%
of this total is not yet funded. The
largest anticipated shortfalls are in
Afghanistan, DR Congo, Indonesia,
Myanmar, Uganda and Pakistan,
where 29–100% of the budget is not
yet funded. When the costs not cov-
ered in these budgets are added, the
total public investment required in
TB control in the 22 HBC is esti-
mated at around US$ 1 billion per
year, with a funding gap of up to
US$ 300 million per year.
Conclusion12. Between 1999 and 2000, global TB
control continued along the steady
but slow path traced since 1994. At
this rate of progress, the target of
70% case detection under DOTS will
not be reached until 2013.
13. 2001 was a year for the preparation
of plans and identification of fund-
ing gaps; the emphasis in 2002 will
be on implementing these plans for
DOTS expansion.
14. Funds permitting, the biggest ad-
vances during 2002 are expected in
Cambodia, China, India, Myanmar,
Pakistan, the Philippines, and
Uganda. The challenge will be to
show that DOTS expansion in these
and other countries can significantly
accelerate case finding while high
cure rates are maintained.
Background and aims1. This is the 6th annual report on
global TB control. It includes data on
case notifications and treatment out-
comes from all national control pro-
grammes that have reported to
WHO, together with an analysis of
plans, finances, and constraints on
DOTS expansion for 22 high-burden
countries (HBC). Seven consecutive
years of data are now available to
assess progress towards the 2005
global targets for case detection
(70%) and treatment success (85%).
Methods2. During 2001, a standard form for re-
porting surveillance data was sent to
210 countries via WHO regional of-
fices. The form requests information
about policy and practice in TB con-
trol, the number and types of TB cases
notified in 2000, and the outcomes of
treatment and retreatment for smear-
positive cases registered in 1999.
3. NTP managers in the 22 HBC were
asked to identify the major con-
straints to DOTS expansion, and to
present 3–5 year plans and budgets
to overcome these constraints as
they move towards target case detec-
tion and cure rates.
Main findings4. The number of countries implement-
ing the DOTS strategy increased by
21 during 2000, bringing the total to
148 (out of 210). By the end of year
2000, over half (55%) the world’s
population lived in parts of countries
providing DOTS. DOTS programmes
notified almost two million new TB
cases, more than one million of
which were smear-positive.
5. However, the 1.02 million smear-
positive cases notified under DOTS
22222 WHO REPORT 2002
Introduction
in provinces supported by a World Bank
loan as compared with the rest of the
country. Peru had reduced incidence suf-
ficiently to be removed from the list of
22 high-burden countries (HBC), which
account for about 80% of all new cases
each year. It has been replaced by Mo-
zambique. However, the overall rate of
recruitment of patients by DOTS pro-
grammes suggested that the global tar-
get of 70% case detection would not be
reached until 2013.
The current report is number six in
the series. It presents data available at
21 January 2002 on case notifications for
2000, treatment results for patients reg-
istered in 1999, and the status of DOTS
implementation by the end of 2000. This
information is supplemented, where
possible, with the latest data on progress
made by countries during 2001. We com-
pared the new figures with those in pre-
vious reports (data from 1994 onwards),
paying special attention to progress in
the 22 HBC.
Whether TB control programmes will
be able to reach the 2005 targets de-
pends on how well they can identify the
major constraints on effective TB con-
trol, and on how effectively they can de-
velop plans and set budgets to overcome
these constraints. To assist this process,
we asked NTP managers in the 22 HBC
to identify the principal constraints, and
to set out their 3–5 year plans and budg-
ets for DOTS expansion.4 The results are
intended to be used as a set of blueprints
for TB control between now and 2005.
The goal of this annual report is to chart
progress in TB control and, in particu-
lar, progress in implementing the WHO
DOTS strategy.1 The targets for global TB
control ratified by the World Health As-
sembly are: (1) to treat successfully 85%
of detected smear-positive TB cases, and
(2) to detect 70% of all such cases. Since
these targets were not reached by the
end of year 2000 as originally planned,
the target year has been re-set to 2005.2
Monitoring and evaluation are car-
ried out through WHO’s Global TB
Monitoring and Surveillance Project, es-
tablished in 1995. Last year we reported
on the steady but slow progress in DOTS
implementation.3 India showed the big-
gest progress in DOTS expansion. China
recorded a large reduction in prevalence
1 World Health Organization. WHO Tuber-culosis Programme: Framework for EffectiveTuberculosis Control. Geneva: WHO 1994.WHO/TB/94.179.
World Health Organization. An ExpandedFramework for Effective Tuberculosis Control.Geneva: WHO 2002. WHO/CDS/TB/2002.297.
2 World Health Organization. Fifty-thirdWorld Health Assembly. Stop TuberculosisInitiative, Report by the Director General.A53/5, 5 May 2000.
3 World Health Organization. Global Tuber-culosis Control. WHO Report 2001. WHO/CDS/TB/2001.287. See http://www.who.int/gtb/publications/globrep01/index.html.
4 This updates some information in: WorldHealth Organization. Global DOTS Expan-sion Plan. Geneva: WHO 2001. WHO/CDS/STB/2001.11.

GLOBAL TUBERCULOSIS CONTROL 33333
Methods
cumstances, the data collected by the
national health authority, and reported
in turn to WHO, will be incomplete, and
inaccurate in some countries.
Third, this report presents data with
a significant time delay. Published in
2002, it contains data that were com-
piled mostly during 2001. The new data
available are case notifications for 2000
(the most recent year of complete infor-
mation), and treatment outcomes for
patients registered in 1999. Treatment
results always lag notifications by one
year because treatment usually lasts
6–9 months. WHO recommends that
data are compiled and analysed more
often than once per year within coun-
tries, e.g. quarterly, but this is unneces-
sary for monitoring at the global level.
Fourth, we have, for this report, sys-
tematically updated our surveillance da-
tabase by asking respondents to tell us
of any retrospectively adjusted figures for
case notifications (smear-positive cases
and all forms of TB) for each year since
1995. Because some countries update
their information without notifying
WHO, the numbers published in this
report may not agree with other publica-
tions on TB surveillance.
During 2001, we asked the national
health authorities in 210 countries and
territories to complete a standard TB
data collection form (Annex 1). The form
was accompanied by WHO/IUATLD defi-
nitions for TB surveillance.5 The form
asks for:
1. programme information in 2000, i.e.
national policy and typical practice,
population coverage of DOTS and
other non-DOTS strategies, and
completeness of reporting;
2. TB cases reported during 2000,
divided into various types, and in-
cluding a stratification of smear-
positive cases by age and sex;
3. treatment outcomes for smear-
positive cases registered during
1999, plus outcomes for all retreat-
ment cases.
The information about policy and
practice concerns the country as a whole,
whereas the other sections ask for data
from DOTS and non-DOTS areas sepa-
rately. Treatment and (especially)
retreatment outcomes are not expected
from non-DOTS programmes, but the
form allows respondents to supply these
data if they can do so.
Completed forms were first reviewed
in the relevant WHO country and re-
gional office, and then at WHO, Geneva.
Inconsistencies in the data were followed
up with NTP managers, or with other
responsible persons in countries. Data
were analysed principally with Microsoft
Access and Excel.6
Surveillance in theEuropean regionIn the WHO European Region, tubercu-
losis monitoring and surveillance are
carried out jointly with EuroTB (Institut
de Veille Sanitaire, Paris), the WHO Col-
laborating Centre for the surveillance of
tuberculosis in Europe, with financial
support from the European Commis-
sion. A joint WHO/EuroTB data collec-
tion form was sent to countries,
designed to meet the overlapping objec-
tives of both organizations, and to mini-
mize the burden of reporting imposed
on NTP managers. In addition to the in-
formation requested on the global form
(Annex 1), the WHO/EuroTB form asks
for TB notifications by nationality, citi-
zenship, age and sex, and notifications
and treatment outcomes by sputum cul-
ture and smear examination.
In the European Region only, na-
tional respondents were invited to report
to WHO directly via the regional web-site
Progress in global TB controlCollection of surveillance dataWHO member states and other coun-
tries and territories voluntarily report
communicable disease surveillance data
to WHO. One distinctive feature of TB
surveillance is the collection of data on
treatment outcomes as well as disease
incidence. Another is the stratification of
data by type of control strategy (DOTS
or non-DOTS). Together, these data are
important in monitoring progress to-
wards targets (85% treatment success,
70% case detection), and in assessing
the epidemiological impact of DOTS.
Before setting out the details of
methods used to collect the most recent
set of data, we make four general re-
marks about the process. First, the ques-
tions posed on the WHO form for data
collection assume that countries are able
to provide precisely the information re-
quested. We recognize, however, that
some countries have slightly different
definitions and procedures, and we en-
courage respondents to note such dif-
ferences in their reports.
Second, WHO deals with national
health authorities, most of whom super-
vise only public systems of TB control.
In a number of countries, TB treatment
is unregulated, case reporting by private
practitioners to the local health author-
ity is not mandatory, and legislation is
not enforced, or not dictated by clear
criteria and definitions. Under these cir-
5 WHO/IUATLD/KNCV. Revised interna-tional definitions in tuberculosis control.Int. J. Tuberc. Lung. Dis. 2001; 5: 213–215.
6 WHO offers reference material about na-tional recording and reporting systems,and prototype software designed for na-tional or provincial TB managers to assem-ble, clean, and analyse their TB data. Forfurther information, contact local or re-gional WHO offices, or [email protected].

44444 WHO REPORT 2002
(http://cisid.who.dk/tb). This system
provides messages to help check data
on entry, and immediate feedback on the
TB situation in neighbouring countries,
using a menu for custom queries of the
regional database.
Categorization of countriesFrom the responses as a whole (but par-
ticularly the section on policy), we ac-
cepted or revised each country’s own
determination of its DOTS status. Coun-
tries were then further categorized quali-
tatively (or semi-quantitatively), as
shown in Figure 1, using the definitions
in Table 1. A country was considered to
be implementing the DOTS strategy if
by 31 December 2000 it had a national
TB control policy based on WHO recom-
mendations, it complied with all techni-
cal elements of the DOTS strategy1,5
(Table 2), and it reported on notifications
and treatment outcomes from DOTS
areas.
If DOTS was implemented only in
some districts (or equivalent administra-
tive units) on the initiative of local au-
thorities, but endorsed by national
authorities, the country was classified as
DOTS. If a country reported that DOTS
was newly implemented during 2000, so
that the results of cohort analysis were
not yet available, it was also classified
as DOTS, provided 2000 case notifica-
tions from DOTS areas were available.
This system of categorization pro-
vides a first impression of each country’s
progress in TB control. However, WHO
targets are expressed more stringently
in terms of treatment success and the
case detection rate. TB control should
ensure high treatment success before
expanding case finding. The reason is
that a proportion of patients given less
than a fully-curative course of treatment
remain chronically infectious, and con-
tinue to spread TB. Thus DOTS pro-
grammes must be shown to achieve high
cure rates in pilot projects before at-
tempting country-wide coverage. Case
detection and treatment success rates
are defined and measured as follows.
Case detectionWe made separate assessments of TB
control programmes in DOTS and non-
DOTS areas. Case notifications distin-
guished between all types of TB and
sputum smear-positive cases (or culture-
positive cases, in some countries).
Table 3 contains standard case defini-
tions, including recent minor revisions.5
TABLE 2TABLE 2TABLE 2TABLE 2TABLE 2
Technical elements of the WHOTB control strategy (DOTS)*
MICROSCOPY • Case detection amongsymptomatic patients self-reporting tohealth services, using sputum smearmicroscopy.**
SCC/DOT • Standardized short-coursechemotherapy using regimens of 6–8months for at least all confirmed smear-positive cases. Good case managementincludes directly observed therapy (DOT)during the intensive phase for all newsputum positive cases, during thecontinuation phase of regimenscontaining rifampicin, and during theentirety of a retreatment regimen.***
DRUG SUPPLY • Establishment and maintenanceof a system to supply all essential anti-tuberculosis drugs, and to ensure nointerruption in their availability.
RECORDING AND REPORTING • Establishment andmaintenance of a standardized recordingand reporting system, allowing assess-ment of treatment results (see Table 5).
* The DOTS strategy comprises five elementsin all, including political commitment.
** Sputum culture can be used for diagnosis,but direct sputum smear microscopy shouldstill be performed for all suspected cases.
*** In countries that have consistentlydocumented high treatment success rates,directly observed therapy may be reserved fora subset of patients, as long as cohortanalysis of treatment results is provided todocument the outcome of all cases.
TABLE 1TABLE 1TABLE 1TABLE 1TABLE 1
Categorization of countries
Category Definition
0 Countries not reporting to WHO.
1 Countries not implementing theDOTS strategy and having anestimated incidence rate of 10 ormore cases per 100 000population.
2 Countries implementing the DOTSstrategy in less than 10% of thetotal population (pilot phase).
3 Countries implementing the DOTSstrategy in 10 to 90% of the totalpopulation (expansion phase).
4 Countries implementing the DOTSstrategy in over 90% of the totalpopulation (routine implemen-tation).
5 Countries not implementing theDOTS strategy but having anestimated incidence rate of lessthan 10 cases per 100 000population (low incidence).
Has thecountry reported to
WHO on its TB controlactivities?
Category 0
NO
YES
Category 3Category 2 Category 4
< 10%coverage?
10–90%coverage?
> 90%coverage?
Category 5
YES NO
Category 1
Is the country’sestimated incidence rate
< 10 per 100 000population?
NO
Does thecountry follow a
standard WHO TBcontrol strategy?
YES
FIGURE 1. Categorization of countries
GLOBAL TUBERCULOSIS CONTROL 55555
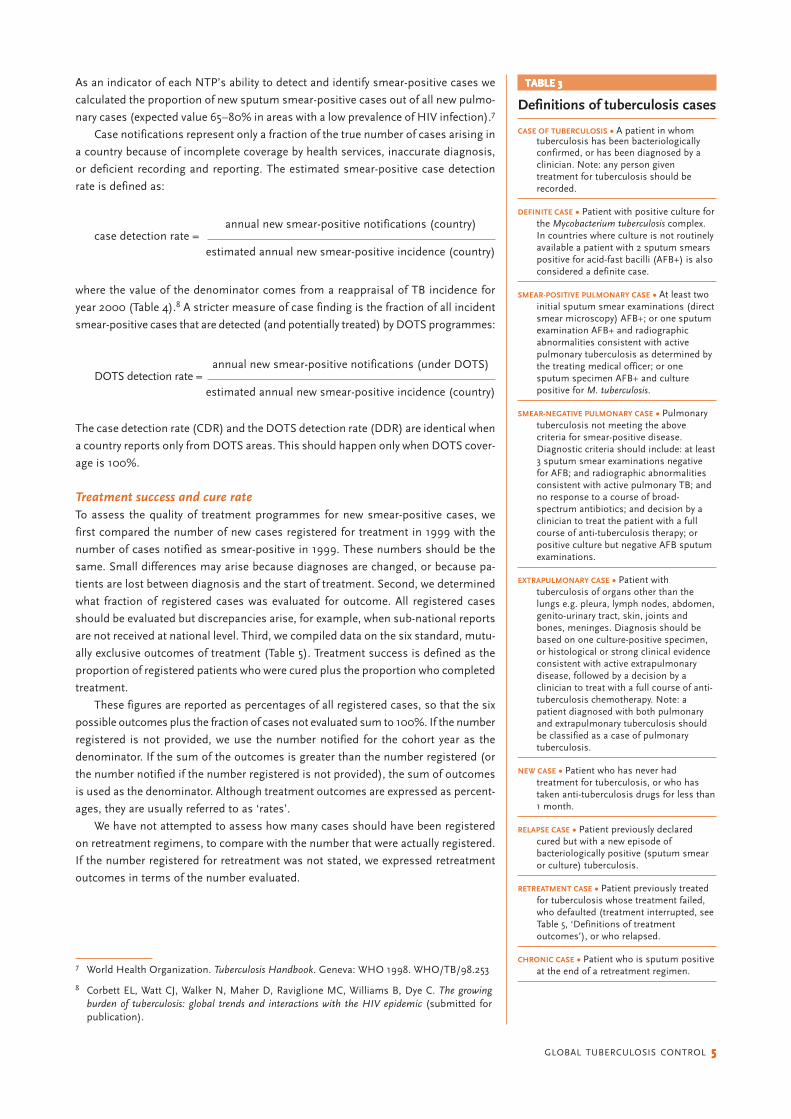
TABLE 3TABLE 3TABLE 3TABLE 3TABLE 3
Definitions of tuberculosis cases
CASE OF TUBERCULOSIS • A patient in whomtuberculosis has been bacteriologicallyconfirmed, or has been diagnosed by aclinician. Note: any person giventreatment for tuberculosis should berecorded.
DEFINITE CASE • Patient with positive culture forthe Mycobacterium tuberculosis complex.In countries where culture is not routinelyavailable a patient with 2 sputum smearspositive for acid-fast bacilli (AFB+) is alsoconsidered a definite case.
SMEAR-POSITIVE PULMONARY CASE • At least twoinitial sputum smear examinations (directsmear microscopy) AFB+; or one sputumexamination AFB+ and radiographicabnormalities consistent with activepulmonary tuberculosis as determined bythe treating medical officer; or onesputum specimen AFB+ and culturepositive for M. tuberculosis.
SMEAR-NEGATIVE PULMONARY CASE • Pulmonarytuberculosis not meeting the abovecriteria for smear-positive disease.Diagnostic criteria should include: at least3 sputum smear examinations negativefor AFB; and radiographic abnormalitiesconsistent with active pulmonary TB; andno response to a course of broad-spectrum antibiotics; and decision by aclinician to treat the patient with a fullcourse of anti-tuberculosis therapy; orpositive culture but negative AFB sputumexaminations.
EXTRAPULMONARY CASE • Patient withtuberculosis of organs other than thelungs e.g. pleura, lymph nodes, abdomen,genito-urinary tract, skin, joints andbones, meninges. Diagnosis should bebased on one culture-positive specimen,or histological or strong clinical evidenceconsistent with active extrapulmonarydisease, followed by a decision by aclinician to treat with a full course of anti-tuberculosis chemotherapy. Note: apatient diagnosed with both pulmonaryand extrapulmonary tuberculosis shouldbe classified as a case of pulmonarytuberculosis.
NEW CASE • Patient who has never hadtreatment for tuberculosis, or who hastaken anti-tuberculosis drugs for less than1 month.
RELAPSE CASE • Patient previously declaredcured but with a new episode ofbacteriologically positive (sputum smearor culture) tuberculosis.
RETREATMENT CASE • Patient previously treatedfor tuberculosis whose treatment failed,who defaulted (treatment interrupted, seeTable 5, ‘Definitions of treatmentoutcomes’), or who relapsed.
CHRONIC CASE • Patient who is sputum positiveat the end of a retreatment regimen.7 World Health Organization. Tuberculosis Handbook. Geneva: WHO 1998. WHO/TB/98.253
8 Corbett EL, Watt CJ, Walker N, Maher D, Raviglione MC, Williams B, Dye C. The growingburden of tuberculosis: global trends and interactions with the HIV epidemic (submitted forpublication).
As an indicator of each NTP’s ability to detect and identify smear-positive cases we
calculated the proportion of new sputum smear-positive cases out of all new pulmo-
nary cases (expected value 65–80% in areas with a low prevalence of HIV infection).7
Case notifications represent only a fraction of the true number of cases arising in
a country because of incomplete coverage by health services, inaccurate diagnosis,
or deficient recording and reporting. The estimated smear-positive case detection
rate is defined as:
where the value of the denominator comes from a reappraisal of TB incidence for
year 2000 (Table 4).8 A stricter measure of case finding is the fraction of all incident
smear-positive cases that are detected (and potentially treated) by DOTS programmes:
The case detection rate (CDR) and the DOTS detection rate (DDR) are identical when
a country reports only from DOTS areas. This should happen only when DOTS cover-
age is 100%.
Treatment success and cure rateTo assess the quality of treatment programmes for new smear-positive cases, we
first compared the number of new cases registered for treatment in 1999 with the
number of cases notified as smear-positive in 1999. These numbers should be the
same. Small differences may arise because diagnoses are changed, or because pa-
tients are lost between diagnosis and the start of treatment. Second, we determined
what fraction of registered cases was evaluated for outcome. All registered cases
should be evaluated but discrepancies arise, for example, when sub-national reports
are not received at national level. Third, we compiled data on the six standard, mutu-
ally exclusive outcomes of treatment (Table 5). Treatment success is defined as the
proportion of registered patients who were cured plus the proportion who completed
treatment.
These figures are reported as percentages of all registered cases, so that the six
possible outcomes plus the fraction of cases not evaluated sum to 100%. If the number
registered is not provided, we use the number notified for the cohort year as the
denominator. If the sum of the outcomes is greater than the number registered (or
the number notified if the number registered is not provided), the sum of outcomes
is used as the denominator. Although treatment outcomes are expressed as percent-
ages, they are usually referred to as ‘rates’.
We have not attempted to assess how many cases should have been registered
on retreatment regimens, to compare with the number that were actually registered.
If the number registered for retreatment was not stated, we expressed retreatment
outcomes in terms of the number evaluated.
annual new smear-positive notifications (country)case detection rate =
estimated annual new smear-positive incidence (country)
annual new smear-positive notifications (under DOTS)DOTS detection rate =
estimated annual new smear-positive incidence (country)

66666 WHO REPORT 2002
Planning for DOTS expansionBuilding on the Global DOTS Expansion
Plan (GDEP) 2001,4 WHO worked dur-
ing 2001 with NTP managers and repre-
sentatives of the 22 HBC in an effort to
achieve the following six objectives:
1. assess progress made in preparing
medium-term plans (3–5 years) for
DOTS expansion, guiding each coun-
try towards the 2005 targets;
2. review country plans using a check-
list of essential elements;
3. update the 2000 country profiles;4
4. review WHO regional plans;
5. determine the principal technical and
financial partners;
6. determine whether or not a National
Interagency Coordination Commit-
tee (NICC) had been formed.
Development and review ofnational DOTS expansion plansProgress in the development of country
plans (objectives 1 and 2) was assessed
by asking NTP managers from all HBC
to provide WHO with their DOTS expan-
TABLE 5TABLE 5TABLE 5TABLE 5TABLE 5
Definitions of treatment outcomes
CURED • Initially smear-positive patient who has a negative sputum smear in the last month oftreatment, and on at least one previous occasion.*
COMPLETED TREATMENT • Patient who has completed treatment but does not meet the criteria forcure or failure.
DIED • Patient who died during treatment, irrespective of cause.
FAILED • Smear-positive patient who remained smear-positive, or became smear-positive again, atleast 5 months after the start of treatment.
INTERRUPTED TREATMENT (DEFAULTED) • Patient who did not collect drugs for 2 months or more at anytime after registration.
TRANSFERRED OUT • Patient who was transferred to another reporting unit and for whom treatmentresults are not known.
SUCCESSFULLY TREATED • The sum of cases that were cured and that completed treatment (expressedas a percentage of the number registered in the cohort).**
* Some European countries define cure in terms of culture conversion, rather than sputum smearconversion.9
** A cohort is a group of patients diagnosed and registered for treatment during a given time period,usually one quarter of a year.
9 Veen J, Raviglione MC, Rieder HL, MigiloriGB, Graf P, Grzemska M, Zalesky R. Stand-ardized tuberculosis treatment outcomemonitoring in Europe. Eur Respir J 1998; 12:505–510.
TABLE 4TABLE 4TABLE 4TABLE 4TABLE 4
Estimated incidence of TB: high-burden countries, 2000NUMBER ESTIMATED
ALL CASES SMEAR-POSITIVE CASES
COUNTRY POPULATION (1000s) THOUSANDS RATE PER THOUSANDS RATE PER CUMULATIVE100 000 POP 100 000 POP INCIDENCE (%)
1 India 1 008 937 1 856 184 831 82 21
2 China 1 275 133 1 365 107 588 46 37
3 Indonesia 212 092 595 280 267 126 44
4 Nigeria 113 862 347 305 150 132 48
5 Bangladesh 137 439 332 242 149 109 51
6 Ethiopia 62 908 249 397 105 166 54
7 Philippines 75 653 249 330 112 148 57
8 Pakistan 141 256 247 175 111 78 60
9 South Africa 43 309 228 526 93 214 63
10 Russian Federation 145 491 193 132 87 59 65
11 DR Congo 50 948 163 320 70 138 67
12 Kenya 30 669 149 484 62 201 68
13 Viet Nam 78 137 148 189 66 85 70
14 UR Tanzania 35 119 126 359 54 153 72
15 Brazil 170 406 116 68 52 30 73
16 Thailand 62 806 88 140 39 62 74
17 Uganda 23 300 82 351 35 149 75
18 Myanmar 47 749 80 168 36 76 76
19 Mozambique 18 292 79 433 33 180 77
20 Cambodia 13 104 75 572 33 256 77
21 Zimbabwe 12 627 74 584 30 234 78
22 Afghanistan 21 765 70 321 31 144 79
Total, high-burden countries 3 781 004 6 910 183 3 033 80 79
Global total 6 053 531 8 735 144 3 836 63 100

GLOBAL TUBERCULOSIS CONTROL 77777
sion plan. Each plan was reviewed to
determine whether the following ele-
ments of an ideal plan are included:
● coverage of the period 2001–
2005;
● a situational analysis, including an
assessment of constraints and re-
sulting gaps;
● a statement of broad goals;
● measurable objectives and a time
frame for achieving them, with
specific objectives of reaching a
DOTS population coverage of >
90% (Figure 1, category 4); and
achieving 70% case detection and
85% treatment success by 2005;
● clear identification of strategies
specifically corresponding to each
objective, saying how DOTS will be
expanded, how case detection and
cure rates will be improved, how
the private sector will be involved,
how community-based care will be
incorporated, and how TB/HIV will
be addressed;
● clear identification of tasks or ac-
tivities specifically corresponding
to each strategy;
● a budget;
● a section on monitoring and evalu-
ation, saying how the NTP will
know if objectives and goals have
been met.
Development of country profilesYear 2001 country profiles (Annex 3) were
updated (objective 3) by incorporating
information from the following sources:
tables summarizing planning status
(prepared for WHO in advance of the
2nd DOTS Expansion Working Group
meeting, Paris, October 2001); posters
presented at the Paris meeting; and
through a series of consultations with,
and reviews of the profiles by, NTP staff
and collaborating technical agencies.
Each country profile contains the five
sections shown in Box 1.
Development of regional plans forDOTS expansionWHO regional offices were asked to out-
line TB control activities in 2001 (objec-
tive 4), with a description of constraints
and proposed actions to expand DOTS,
BOX 1BOX 1BOX 1BOX 1BOX 1
Standard format of countryprofiles (Annex 3)
1. TB control within the health sys-
tem describes the relationship
between the TB control system
and the overall health care sys-
tem.
2. Progress in DOTS coverage de-
scribes the most recent data
available to WHO including,
where possible, preliminary in-
formation on coverage during
2001.
3. Planning for TB control describes
the major DOTS expansion plan-
ning initiatives undertaken,
including a table with the con-
straints to DOTS expansion
(classified as constraints relating
to political environment, to
health system capacity, or to
people and community) and the
actions taken in 2001, or planned
for 2002, to overcome them.
4. Partnerships describes the key
technical and financial partners
along with the kind of support
they are providing.
5. Financing TB control presents
budgets and information on ex-
isting funding and funding gaps
(see also “Financing DOTS ex-
pansion”).
and to list global and local partners who
will respond to the various needs of pro-
grammes.
Partnerships and coordinationThe network of donors and collaborat-
ing organizations (objective 5) was moni-
tored through direct consultation with
NTP managers and WHO regional of-
fices. Lead technical agencies, along with
other technical and financial partners,
are listed in each country profile. The
coordination of these numerous agen-
cies is vital for the efficient use of lim-
ited resources within countries. To assist
this process, WHO recommends the
establishment of a formal coordination
mechanism, such as a National
Interagency Coordinating Committee
(NICC). We therefore asked (objective 6)
NTP managers in each of the 22 HBC to
report on whether such a mechanism
exists.
Financing DOTS expansionThe analysis of the financial resources
required for TB control in the 22 HBC
had seven objectives:
1. assess the availability of budget data
for the period 2002–2005;
2. assess the quality and completeness
of budgets against a set of standard
criteria, and use this assessment to
indicate where further work may be
needed;
3. summarize the average annual
budget for TB control in each of the
HBC and for all 22 countries com-
bined;
4. estimate the budget available per
patient;
5. provide, in standard format, a de-
tailed breakdown of budgets, includ-
ing identification of funding gaps;
6. provide estimates of the total cost of
TB control in each of the HBC, in-
cluding costs imposed on general
health services (which are often ex-
cluded from TB budgets);
7. provide estimates of the gap between
the total cost of TB control in the 22
HBC and available funding.
As with information on planning, we
asked NTP managers in all 22 HBC, as
members of the Global DOTS Expansion
Working Group, to provide budget data
(objective 1). Countries were categorized
as (a) having a budget, (b) in the proc-
ess of developing a budget, or (c) not
yet having a budget. This report reflects
information available as of January 2002.
Budgets were reviewed (objective 2)
using a standard checklist of nine ques-
tions (Box 2). Total budgets, existing
pledges, and funding gaps were con-
verted into an annual average (objective
3) by dividing by the number of years
covered. The average budget per patient
(objective 4) was obtained by dividing
by the average number of patients that
must be treated each year if targets for

88888 WHO REPORT 2002
10 Floyd K, Blanc L, Raviglione MC, Lee JW.Resources required for the achievement ofglobal tuberculosis control targets (submit-ted for publication).
BOX 2BOX 2BOX 2BOX 2BOX 2
Questions used to evaluate budget estimates
1. How are budgets related to targets for TB control?
Should be linked to targets for DOTS population coverage, case detection
and cure.
2. How comprehensive are budgets with respect to service delivery?
Should cover costs specific to TB control, including the budgets required for
dedicated tuberculosis hospitals and clinics; should cover all relevant admin-
istrative levels of the country; would ideally cover the cost of using resources
that are not specific to TB control i.e. general health services staff and infra-
structure.
3. Do budgets cover all major items specific to TB control?
Should include diagnostic supplies and equipment, first-line drugs, training,
programme management and supervision.
4. Do budgets include all relevant financial inputs?
Should include staff, buildings, vehicles, supplies, and equipment.
5. What time period do budgets cover?
Should cover period 2002–5.
6. Do budgets include a detailed breakdown by line item?
7. Do budgets include a detailed breakdown of the funding gap by line item?
8. What types of TB case are covered in budgets?
Should include all types of case for which care is publicly funded (not neces-
sarily smear-positive cases only).
9. Do budgets include funds for new interventions or strategies specifically aimedat increasing case detection and cure rates to target levels?
case detection and cure are to be
reached. The number of patients to be
treated was calculated from estimated
incidence in 2000, from case detection
rates, from trends in incidence and
population projections for the period
2001–5, and assuming linear progress
toward 70% case detection over the pe-
riod 2001–5. The methods are described
in full elsewhere.10
Line items in the budgets were as-
signed to one of eight categories (objec-
tive 5): staff, buildings, diagnostic
supplies and equipment, first-line drugs,
training, programme management and
supervision, activities specifically aimed
at increasing case detection and cure
rates, and miscellaneous. Budgets were
summed for each category, and for all
categories combined. Wherever possi-
ble, government funding (regular budg-
ets and loans) and grants were identified,
and hence the budget gap, for each cat-
egory and for all categories combined.
Budgets were also reviewed to check
whether any costs associated with diag-
nosis and treatment had been omitted
(objective 6). Where important costs
were not included—such as days in hos-
pital at the beginning of treatment, or
outpatient visits to general health serv-
ices for observation of treatment—these
were estimated (per patient) using pub-
lished and unpublished economic cost-
ing studies. These costs were then added
to the total budget per patient to give a
comprehensive estimate of the financial
resources (per patient) required for TB
control. The total annual costs associ-
ated with achieving targets were then
estimated as the total cost per patient
multiplied by the average annual number
of patients to be treated during the pe-
riod 2001–5.
An estimate of the total funding gap
(objective 7) is given by the difference
between total costs and funds already
available, where the latter include funds
for costs specific to TB control and for
general health services staff and infra-
structure. This gap is usually greater than
the gap identified in country budgets.
Full details of the methods used for ob-
jectives 6 and 7 are provided elsewhere.10

GLOBAL TUBERCULOSIS CONTROL 99999
Results
last year. We received reports from all 22
HBC, all countries with more than 30
million people except Canada, and all
other countries with more than 10 mil-
lion people except Madagascar (Tables
6a and 6b).
Categorization of countries,1995–2000The number of countries implementing
a strategy consistent with DOTS has con-
tinued to increase, reaching 148 (of 210)
in 2000, 22 more than in 1999 (Figure 2,
Progress in global TB controlCountries reporting to WHOBy 21 January 2002, 202 (89%) of 210
countries reported case notifications for
2000 and/or treatment outcomes for
patients registered in 1999, 10 more than
TABLE 6TABLE 6TABLE 6TABLE 6TABLE 6aaaaa
List of countries implementing DOTS, 2000CATEGORY 2 (8 countries) CATEGORY 3 (44 countries) CATEGORY 4 (95 countries)
Brazil Afghanistan Algeria Libyan Arab Jamahiriya (the)Bulgaria Argentina American Samoa MalawiDominican Republic (the) Armenia Andorra MalaysiaGuyana Australia Antigua and Barbuda MaldivesPakistan Azerbaijan Austria MaliPapua New Guinea Bolivia Bahamas (the) MaltaParaguay Cameroon Bahrain Marshall Islands (the)Uzbekistan China Bangladesh Mauritius
Colombia Belize Micronesia (Federated States of)Costa Rica Benin MongoliaCôte d’Ivoire Bhutan MoroccoDemocratic People’s Republic Bosnia and Herzegovina Mozambique
of Korea (the) Botswana NamibiaDemocratic Republic of Brunei Darussalam Nauru
the Congo (the) Burkina Faso Netherlands (the)Ecuador Cambodia New ZealandEritrea Chile NicaraguaEthiopia China, Hong Kong SAR Northern Mariana IslandsGhana China, Macao SAR (the Commonwealth of the)Haiti Comoros (the) NorwayHonduras Congo (the) OmanIndia Cook Islands PeruItaly Cuba PortugalJapan Czech Republic (the) Puerto RicoLao People’s Democratic Djibouti Qatar
Republic (the) Egypt RwandaLithuania El Salvador Saint Kitts and NevisMexico Estonia Saint LuciaMyanmar Fiji Saint Vincent and the GrenadinesNepal French Polynesia SamoaNiger (the) Georgia San MarinoNigeria Guam Saudi ArabiaPanama Guatemala SeychellesPhilippines (the) Guinea-Bissau SingaporePoland Hungary SlovakiaRomania Indonesia SloveniaRussian Federation (the) Iran (Islamic Republic of) Solomon IslandsSierra Leone Iraq SurinameSomalia Jamaica Syrian Arab Republic (the)South Africa Jordan TogoSri Lanka Kazakhstan TongaSudan (the) Kenya TunisiaThailand Kiribati UgandaTurkmenistan Kyrgyzstan United Republic of Tanzania (the)United Arab Emirates (the) Latvia United States of America (the)Vanuatu Lebanon UruguayYemen Lesotho Venezuela
Viet NamZimbabwe
Bold: countries that adoptedDOTS in 2000
Italics: countries that movedone or more categories downsince 1999 due to decrease incoverage.
Underline: countries thatmoved one or more categoriesup since 1999.

1010101010 WHO REPORT 2002
TABLE 6TABLE 6TABLE 6TABLE 6TABLE 6bbbbb
List of countries not implementing DOTS ornot reporting to WHO, 2000CATEGORY 0 (23 countries) CATEGORY 1 (33 countries) CATEGORY 4 (95 countries)
Anguilla Albania SwitzerlandBritish Virgin Islands Angola TajikistanBurundi Barbados The former Yugoslav RepublicCanada Belarus of MacedoniaCape Verde Belgium TokelauCentral African Republic (the) Croatia Trinidad and TobagoChad Denmark TurkeyDominica Finland UkraineEquatorial Guinea France United Kingdom of Great BritainGabon Germany and Northern Ireland (the)Gambia (the) Greece YugoslaviaGuinea Ireland ZambiaKuwait IsraelLiberia LuxembourgMadagascar MauritaniaNetherlands Antilles MontserratPalau New CaledoniaSenegal NiueTurks and Caicos Islands Republic of Korea (the)Tuvalu Republic of Moldova (the)United States Virgin Islands Sao Tome and PrincipeWallis and Futuna Islands SpainWest Bank and Gaza Swaziland
Bold: countries that reported in 1999 and were classified as DOTS, but did not report in 2000Italic: countries that reported in 1999 and were classified as non-DOTS, but that did not report in 2000Underline: countries that reported in 2000, and were classified as DOTS in 1999 but not in 2000.
CATEGORY 5 (7 countries)
BermudaCayman IslandsCyprusGrenadaIcelandMonacoSweden
1990 1991 1992 1993 1994 1995 1996 1997 1998 1999 2000
0
50
100
150
200
250
NU
MB
ER O
F C
OU
NTR
IES
YEAR
TOTAL NUMBER OF COUNTRIES
FIGURE 2. Number of countries implementing DOTS, 1990–2000
Table 6a). All 22 HBC were classified as
DOTS in 2000, though Brazil submitted
incomplete data. Ninety-six countries
had implemented DOTS in over 90% of
the country (category 4; Figures 3 and
4). Eight countries were in the DOTS
pilot phase (category 2), and 44 were in
the expansion phase (category 3). Five
countries classified as DOTS based on
1999 data did not report for 2000. Since
1995, countries have generally been mov-
ing out of category 1 (non-DOTS, high
incidence) into categories 2–4 (Figure 3).
By the end of 2000, over half (55%)
of the world’s population lived in coun-
ties, districts, oblasts, and provinces of
countries that provide DOTS services.
Reported DOTS population coverage
was over 65% in the WHO regions of
Africa, the Americas, and the Western
Pacific, and lowest in the European Re-
gion (17%, Figure 5). Table 7 presents
DOTS coverage for each HBC, and for
the whole world, from 1995 to 2000.
Fourteen countries implemented
DOTS for the first time in 2000 (Table
6a). Three had limited coverage (< 10%,
category 2), including Bulgaria. Three
achieved moderate coverage (10–90%,
category 3). The eight that reached high
coverage (> 90%) were mostly small
countries and islands. Among the four
countries that moved up to category 3 in
2000 were DPR Korea and the Russian
Federation. Bangladesh, Egypt, Indone-
sia, Iraq, and Zimbabwe all claimed full
coverage (category 4).
Case notifications, 1995–2000The 202 countries reporting to WHO
notified a total of 3 671 973 cases (61 per
100 000 population), of which 1 529 806
(42%) were sputum smear-positive
(Table 8). These totals are slightly larger
than those for 1999.
Among all cases reported for 2000,
almost 2 million (over half) originated
in DOTS areas (Table 8). Of the smear-
positive cases, over 1 million (about two
thirds) were notified under DOTS. Both
of these figures represent an increase of
18% over 1999. The African (20%),
South-East Asia (38%), and Western Pa-
cific Regions (22%) together accounted
for 80% of all notified cases and similar

GLOBAL TUBERCULOSIS CONTROL 1111111111
CATEGORY 0NO REPORT
CATEGORY 1NON-DOTS,
HIGH INCIDENCE
CATEGORY 2DOTS,
PILOT PHASE
CATEGORY 3DOTS,
EXPANSION PHASE
CATEGORY 4DOTS,
FULL COVERAGE
CATEGORY 5NON-DOTS,
LOW INCIDENCE
0
20
40
60
80
100
NU
MB
ER O
F C
OU
NTR
IES
1995
1996
1997
1998
1999
2000
FIGURE 3. Changes in the categorization of countries, 1995–2000, according to the scheme in Figure 1
CATEGORY 0NO REPORT
11%
CATEGORY 1NON-DOTS,
HIGH INCIDENCE16%
CATEGORY 2DOTS,
PILOT PHASE4%
CATEGORY 3DOTS,
EXPANSIONPHASE21%
CATEGORY 4DOTS,
FULL COVERAGE45%
CATEGORY 5NON-DOTS,
LOW INCIDENCE3%
FIGURE 4
Proportions of countries withdifferent levels of DOTScoverage, 2000
TABLE 7TABLE 7TABLE 7TABLE 7TABLE 7
Progress in DOTS implementation: high-burden countries, 1995–2000PERCENT OF POPULATION COVERED BY DOTS
1995 1996 1997 1998 1999 2000
1 India 1.5 2 2.3 9 13.5 30
2 China 49 60.4 64.2 63.9 64 68
3 Indonesia 6 13.7 28.3 80 90 98
4 Nigeria 47 30 40 45 45 47
5 Bangladesh 40.5 65 80 90 90 92
6 Ethiopia 39 39 48 64.4 63 85
7 Philippines 4.3 2 15 16.9 43 89.6
8 Pakistan 2 8 8 8 9
9 South Africa 13 22 66 77
10 Russian Federation 2.3 2.3 5 5 12
11 DR Congo 47 51.4 60 60 62 70
12 Kenya 15 100 100 100 100 100
13 Viet Nam 50 95 93 96 98.5 99.8
14 UR Tanzania 98 100 100 100 100 100
15 Brazil 0 0 3 7 7
16 Thailand 1.1 4 32 59 70
17 Uganda 0 100 100 100 100
18 Myanmar 59 60 60.3 64 77
19 Mozambique 97 100 84 95 100
20 Cambodia 60 80 88 100 100 99
21 Zimbabwe 0 0 100 11.6 100
22 Afghanistan 12 11 13.5 15
Total, high-burden countries 24 32 36 43 46 55
Global total 22 32 36 43 46 55
Zero indicates that a report was received, but the country had not implemented DOTS.Blank indicates that no report was received.

1212121212 WHO REPORT 2002
TABLE 8TABLE 8TABLE 8TABLE 8TABLE 8
Summary of notifications by WHO region, 2000% OF POP * NOTIFICATIONS NEW SS+ % OF NEW PULM
NUMBER % NOTIFICATIONS CASES SS+ *
AFR DOTS 68 622 655 85 309 513 64non-DOTS 23 105 910 15 44 037 52no report 9.0Total 728 565 353 550
AMR DOTS 65 123 576 53 70 327 72non-DOTS 31 109 980 47 59 399 64no report 3.8Total 233 556 129 726
EMR DOTS 65 120 834 88 56 630 68non-DOTS 34 17 162 12 4 088 34no report 1.1Total 137 996 60 718
EUR DOTS 17 73 860 20 22 430 40non-DOTS 83 296 075 80 70 497 29no report 0.0Total 369 935 92 927
SEAR DOTS 49 445 296 32 235 511 62non-DOTS 51 952 093 68 272 640 31no report 0.0Total 1 397 389 508 151
WPR DOTS 67 598 218 74 326 993 60non-DOTS 33 206 314 26 57 741 31no report 0.0Total 804 532 384 734
Global DOTS 55 1 984 439 54 1 021 404 62non-DOTS 43 1 687 534 46 508 402 34no report 1.6Total 3 671 973 1 529 806
* Percent of population: the regional DOTS population includes only that portion of the population ofDOTS countries that is covered by DOTS.
TABLE 9TABLE 9TABLE 9TABLE 9TABLE 9
Case notifications: high-burden countries, 2000NUMBER NOTIFIED % OF NEW PULMONARY
ALL CASES SMEAR-POSITIVE CASES SMEAR POSITIVE *
DOTS NON-DOTS DOTS NON-DOTS DOTS NON-DOTS
1 India 211 751 903 967 95 012 254 362 56 31
2 China 348 436 114 937 191 280 22 486 58 20
3 Indonesia 67 949 50 633 77
4 Nigeria 25 821 17 423 73
5 Bangladesh 59 669 15 689 35 644 2 641 66 20
6 Ethiopia 91 101 30 510 50
7 Philippines 96 371 32 124 49 991 17 065 56 56
8 Pakistan 11 050 3 285 37
9 South Africa 87 836 23 433 62 399 14 992 84 77
10 Russian Federation 8 288 129 309 2 330 23 793 32 20
11 DR Congo 60 627 36 123 82
12 Kenya 58 067 6 092 26 162 2 611 54 55
13 Viet Nam 89 792 53 169 75
14 UR Tanzania 54 442 24 049 58
15 Brazil 2 420 76 831 416 40 666 21 62
16 Thailand 34 187 17 754 59
17 Uganda 30 372 17 246 66
18 Myanmar 30 840 17 254 67
19 Mozambique 21 158 13 257 77
20 Cambodia 18 891 14 822 93
21 Zimbabwe 51 918 15 455 36
22 Afghanistan 7 107 2 892 55
Total, high-burden countries 1 468 093 1 302 382 777 106 378 616 62 32
Global total 1 984 439 1 687 534 1 021 404 508 402 62 34
* Expected percentage of new pulmonary cases that are smear positive is 65–80%.

GLOBAL TUBERCULOSIS CONTROL 1313131313
proportions of sputum smear-positive
cases (Figure 6).
In DOTS areas, 52% of all new cases
were smear-positive (45–60% expected),
compared with 30% in other areas. Sixty-
two percent of new pulmonary cases
were sputum smear-positive in DOTS
areas (55–70% expected), compared
with 32% elsewhere (Tables 8 and 9).
Although the global case notification
rate has remained approximately stable
since 1980 (Figure 7), the number of
cases enrolled in DOTS programmes has
increased linearly. The increment in
smear-positive cases detected by DOTS
programmes between 1999 and 2000
was 151 924 cases, similar to the annual
average of 132 572 (standard error: 20
106) since 1994.
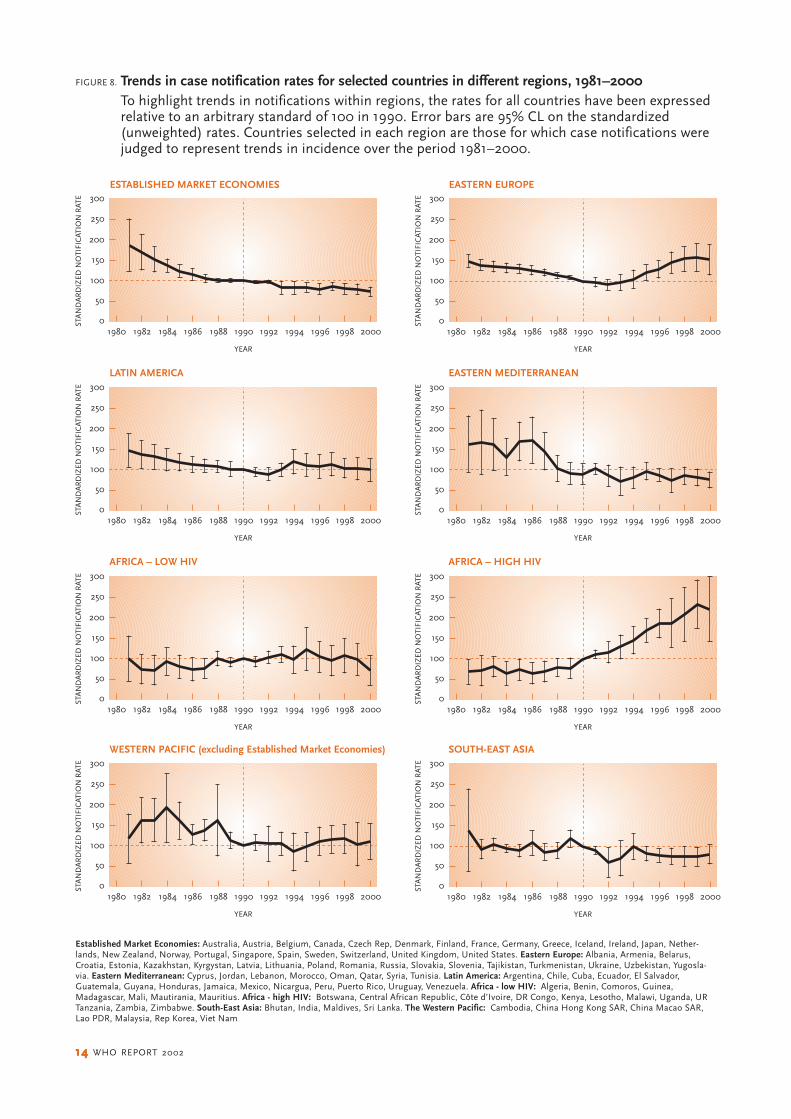
Figure 8 shows the series of case
notifications that have been used to
judge trends in incidence for groups of
epidemiologically similar countries.3
Notification rates were standardized to
100 in 1990, in order to reveal trends
more clearly by eliminating the absolute
differences between countries in that
year. Although the incidence of TB has
been rising quickly in central and east-
ern Europe (8%/year), and in the east-
ern and southern African countries most
affected by HIV/AIDS (10%/year), there
is strong evidence that the rates of in-
crease are slowing in both parts of the
world (Figure 9). There are also signs
WPR22%
AFR20%
AMR6%
EMR4%
EUR10%
SEAR38%
WPR25%
AFR23%
AMR8%
EMR4%
EUR6%
SEAR34%
ALL CASES
SMEAR-POSITIVE
FIGURE 6
Proportions of all notified cases,and smear-positive cases,by WHO region, 2000
1980 1982 1984 1986 1988 1990 1992 1994 1996 1998 2000
0
20
40
60
80
100
CA
SE N
OTI
FIC
AIO
N R
ATE
(PER
10
0 0
00
)
YEAR
FIGURE 7. Global trend in the case notification rate, 1980–2000
AFR AMR EMR EUR SEAR WPR
0
500
1000
1500
2000
POPU
LATI
ON
(M
ILLI
ON
S)
WHO REGION
68
65
65
17
4967
FIGURE 5. DOTS population coverage by WHO region, 2000Each bar shows the population of the region, and theorange portion of the bar shows the population covered byDOTS. The number above each bar is the percent of thepopulation covered.
that TB is declining more quickly again
in Established Market Economies after
a relatively stable period during the early
1990s (Figure 9).
Case detection rate, 1995–2000The 3 671 973 cases of tuberculosis (all
forms) notified in 2000 represent 42%
of the 8.74 million estimated new cases;
the total of 1 529 806 new smear-posi-
tives is 40% of the 3.84 million estimated
cases (Tables 4, 8, 10). Both of these frac-
tions have remained fairly stable over the
six years we have compiled data. Twenty-
three percent of all estimated cases, and
27% of estimated smear-positive cases,
were detected under DOTS. The detec-
tion rate of smear-positive cases within
1414141414 WHO REPORT 2002
0
50
100
150
200
250
300
1982 1984 1986 1988 1990 1992 1994 1996 1998 20001980
YEAR
STA
ND
AR
DIZ
ED N
OTI
FIC
ATIO
N R
ATE
0
50
100
150
200
250
300
1982 1984 1986 1988 1990 1992 1994 1996 1998 20001980
YEAR
STA
ND
AR
DIZ
ED N
OTI
FIC
ATIO
N R
ATE
0
50
100
150
200
250
300
1982 1984 1986 1988 1990 1992 1994 1996 1998 20001980
YEAR
STA
ND
AR
DIZ
ED N
OTI
FIC
ATIO
N R
ATE
0
50
100
150
200
250
300
1982 1984 1986 1988 1990 1992 1994 1996 1998 20001980
YEAR
STA
ND
AR
DIZ
ED N
OTI
FIC
ATIO
N R
ATE
0
50
100
150
200
250
300
1982 1984 1986 1988 1990 1992 1994 1996 1998 20001980
YEAR
STA
ND
AR
DIZ
ED N
OTI
FIC
ATIO
N R
ATE
0
50
100
150
200
250
300
1982 1984 1986 1988 1990 1992 1994 1996 1998 20001980
YEAR
STA
ND
AR
DIZ
ED N
OTI
FIC
ATIO
N R
ATE
0
50
100
150
200
250
300
1982 1984 1986 1988 1990 1992 1994 1996 1998 20001980
YEAR
STA
ND
AR
DIZ
ED N
OTI
FIC
ATIO
N R
ATE
0
50
100
150
200
250
300
1982 1984 1986 1988 1990 1992 1994 1996 1998 20001980
YEAR
STA
ND
AR
DIZ
ED N
OTI
FIC
ATIO
N R
ATE
ESTABLISHED MARKET ECONOMIES EASTERN EUROPE
LATIN AMERICA EASTERN MEDITERRANEAN
AFRICA – LOW HIV AFRICA – HIGH HIV
WESTERN PACIFIC (excluding Established Market Economies) SOUTH-EAST ASIA
FIGURE 8. Trends in case notification rates for selected countries in different regions, 1981–2000To highlight trends in notifications within regions, the rates for all countries have been expressedrelative to an arbitrary standard of 100 in 1990. Error bars are 95% CL on the standardized(unweighted) rates. Countries selected in each region are those for which case notifications werejudged to represent trends in incidence over the period 1981–2000.
Established Market Economies: Australia, Austria, Belgium, Canada, Czech Rep, Denmark, Finland, France, Germany, Greece, Iceland, Ireland, Japan, Nether-lands, New Zealand, Norway, Portugal, Singapore, Spain, Sweden, Switzerland, United Kingdom, United States. Eastern Europe: Albania, Armenia, Belarus,Croatia, Estonia, Kazakhstan, Kyrgystan, Latvia, Lithuania, Poland, Romania, Russia, Slovakia, Slovenia, Tajikistan, Turkmenistan, Ukraine, Uzbekistan, Yugosla-via. Eastern Mediterranean: Cyprus, Jordan, Lebanon, Morocco, Oman, Qatar, Syria, Tunisia. Latin America: Argentina, Chile, Cuba, Ecuador, El Salvador,Guatemala, Guyana, Honduras, Jamaica, Mexico, Nicargua, Peru, Puerto Rico, Uruguay, Venezuela. Africa - low HIV: Algeria, Benin, Comoros, Guinea,Madagascar, Mali, Mautirania, Mauritius. Africa - high HIV: Botswana, Central African Republic, Côte d’Ivoire, DR Congo, Kenya, Lesotho, Malawi, Uganda, URTanzania, Zambia, Zimbabwe. South-East Asia: Bhutan, India, Maldives, Sri Lanka. The Western Pacific: Cambodia, China Hong Kong SAR, China Macao SAR,Lao PDR, Malaysia, Rep Korea, Viet Nam

GLOBAL TUBERCULOSIS CONTROL 1515151515
1991 1992 1993 1994 1995 1996 1997 1998 1999-10
-5
0
5
10
15
20
CH
AN
GE
IN T
B N
OTI
FIC
TIO
NS
(%)
YEAR
2000
EASTERN EUROPE
AFRICA –HIGH HIV
ESTABLISHEDMARKET ECONOMIES
FIGURE 9. Trends in TB notification rates, 1991–2000Average percent change in notification rates betweenconsecutive years for 3 groups of countries.See Figure 8 for countries included.
DOTS programmes has been rising
faster than the overall smear-positive
detection rate, approaching a 40% ceil-
ing (Figure 10, Table 10). Case detection
rates in 2000, as in previous years, were
lowest in the Eastern Mediterranean
Region and highest in Europe and the
Americas (Figure 11).
Treatment results,1994–1999 cohortsThe number of new sputum smear-posi-
tive cases notified under DOTS in 1999
was 869 480 (Table 11a), approximately
the same number of cases (876 284) that
was registered for treatment in 1999 (An-
nex 6 lists notified and registered cases
for 1999 by country). Brazil and Ethio-
pia registered many fewer cases than
were originally notified, and Brazil evalu-
ated only 12%; Pakistan and the Philip-
pines registered many more than were
notified.
Of the registered cases, 96% were
evaluated for treatment outcome (Tables
TABLE 10TABLE 10TABLE 10TABLE 10TABLE 10
Case detection rate of new smear-positive cases (%): high-burden countries, 1995–2000DOTS PROGRAMMES WHOLE COUNTRY
1995 1996 1997 1998 1999 2000 1995 1996 1997 1998 1999 2000
1 India 0.3 0.8 1.0 1.5 6.5 11 34 37 34 34 42 42
2 China 16 24 26 33 32 33 24 30 33 37 36 36
3 Indonesia 1.4 4.6 7.5 12 19 19 12 * * * * *
4 Nigeria 8.5 13 9.0 10 11 12 * * * * * *
5 Bangladesh 6.6 14 18 23 23 24 15 21 23 26 26 26
6 Ethiopia 15 19 21 22 23 29 * * * * 23 *
7 Philippines 0.4 0.5 3.2 10 19 45 101 89 80 67 68 60
8 Pakistan 1.0 1.8 3.9 2.1 3.0 3 * — 14 6 *
9 South Africa 5.9 21 64 67 40 66 77 86 85 84
10 Russian Federation 0.4 0.9 0.9 1.6 2.7 62 65 60 56 27 30
11 DR Congo 46 52 49 59 55 51 50 * 48 * * *
12 Kenya 59 59 55 57 53 43 * * * * * 47
13 Viet Nam 30 60 78 82 82 80 61 78 * 85 82 *
14 UR Tanzania 61 59 55 54 50 45 * * * * * *
15 Brazil 4.1 4.0 0.8 81 80 80 81 79 80
16 Thailand 0.3 5.0 21 39 46 55 45 35 * * *
17 Uganda 62 61 56 50 56 59 61 * 57 *
18 Myanmar 25 26 28 32 48 25 28 28 * * *
19 Mozambique† 53 48 45 45 40 * * * * 43 *
20 Cambodia 42 35 44 45 49 44 * 44 * * * *
21 Zimbabwe 57 52 52 44 54 61 * * *
22 Afghanistan 2.0 6.0 5.4 9.2 — — * * * *
All high-burden countries 8.3 12 15 19 22 26 31 34 35 37 38 38
Global 11 15 16 21 23 27 35 38 38 40 40 40
— not available* no additional data beyond DOTS report† no report was received for Mozambique for 1999, but the most recent report included updated information for 1999

1616161616 WHO REPORT 2002
11a and 12). Seventy-two percent of the
registered cases were cured and a fur-
ther 8% completed treatment (no labo-
ratory confirmation of cure), giving an
overall treatment success rate of 80% in
DOTS areas. Eighty-three percent of
evaluated cases, and 19% of all esti-
mated smear-positive cases, were
treated successfully under DOTS.
The discrepancy between cases no-
tified and registered was bigger in non-
DOTS areas (Table 11b). In the
non-DOTS areas that presented results,
treatment success was low (28%), and
the cure rate significantly lower (22%).
As usual, this poor performance is ex-
plained primarily by the low evaluation
rate (41%), and secondarily by treatment
interruption (7%). Looking at evaluated
patients only, 68% were successfully
treated outside DOTS programmes.
By WHO region, the documented
treatment success rates under DOTS
varied from 69% in Africa to 94% in the
Western Pacific Region (Figure 12, Table
12). Fatal outcomes were most common
in Africa (7%), where a higher fraction
of cases are HIV-positive, and Europe
(6%), where a higher fraction of cases
occur among the elderly. Treatment in-
terruption (default) was most frequent
in the African (11%) and Eastern Medi-
terranean Regions (8%).
Comparing treatment results for six
consecutive cohorts (1995–99) shows
that the overall success rates have re-
1995 1996 1997 1998 1999 20000
10
20
30
40
50
CA
SE D
ETEC
TIO
N R
ATE
(%)
YEAR
FIGURE 10. Global case detection rate (orange bars) and DOTS detectionrate (grey bars), 1995–2000
0
20
40
60
80
100
CA
SE D
ETEC
TIO
N (
%)
AFR AMR EMR EUR SEAR WPR
WHO REGION
FIGURE 11. Detection rates of all TB cases (orange bars) and of smear-positive TB (green bars) by WHO region, 2000
0
20
40
60
80
100
PER
CEN
TAG
E O
F R
EGIS
TER
ED C
ASE
S
0
20
40
60
80
100
PER
CEN
TAG
E O
F R
EGIS
TER
ED C
ASE
S
AFR AMR EMR EUR SEAR WPR
WHO REGION
AFR AMR EMR EUR SEAR WPR
WHO REGION
(a) DOTS (b) NON-DOTS
NOT EVALUATED NOT TREATED SUCCESSFULLY TREATED SUCCESSFULLY
FIGURE 12. Treatment success in (a) DOTS and (b) non-DOTS areas, by WHO region, 1999 cohort

GLOBAL TUBERCULOSIS CONTROL 1717171717
TABLE 11ATABLE 11ATABLE 11ATABLE 11ATABLE 11A
Treatment outcomes for new smear-positive cases: high-burden countries: DOTS strategy, 1999 cohort*TREATMENT OUTCOMES (%)* % EST* CASES
SUCCESSFULLY
REGST’D COMPLETED TRANS- NOT TREATMENT TREATED
NOTIFIED REGISTERED* (%) CURED TREATMENT* DIED FAILED DEFAULTED FERRED EVAL’D SUCCESS (%) UNDER DOTS
1 India 53 034 53 086 100 80 2.1 4.5 3.0 9.3 0.8 0.1 82 5.32 China 188 525 188 112 100 96 1.1 1.0 0.7 0.3 0.5 96† 313 Indonesia 49 172 46 187 94 42 8.2 1.4 1.2 1.6 0.5 45 50 8.74 Nigeria 15 903 14 868 93 60 15 6.0 2.7 13 2.6 0.0 75 7.95 Bangladesh 34 047 34 047 100 78 3.5 4.6 0.8 7.8 2.9 2.7 81 196 Ethiopia 21 457 15 980 74 60 16 6.8 1.0 9.7 4.0 2.6 76 137 Philippines 20 477 36 913 180 70 17 2.7 1.5 5.8 3.1 0.0 87† 308 Pakistan 2 269 2 967 131 56 14 4.4 0.7 21 3.6 0.3 70 1.99 South Africa 54 404 63 304 116 52 7.9 7.0 1.3 13 17 2.2 60 45
10 Russian Federation 1 274 1 542 121 63 2.7 9.4 9.3 6.3 7.5 2.1 65 1.311 DR Congo 34 923 34 923 100 59 9.7 5.4 0.9 7.4 8.8 8.7 69 3812 Kenya 27 197 24 670 91 64 14 6.0 0.3 9.5 6.2 0.0 78 3813 Viet Nam 53 561 53 227 99 90 2.1 2.9 1.2 2.0 1.2 0.4 92† 7514 UR Tanzania 24 125 23 994 99 71 6.2 9.8 0.4 6.7 5.7 0.0 78 3815 Brazil 2 108 10 0.9 0.6 0.1 0.6 88 11 0.416 Thailand 14 934 13 650 91 73 4.1 11 1.9 8.2 2.2 0.0 77 2717 Uganda 18 149 14 250 79 30 31 7.8 0.3 16 5.1 9.1 61 2718 Myanmar 11 458 11 641 102 70 11 5.4 1.7 10 1.9 0.0 81 2619 Mozambique 11 791 69 2.3 11 1.3 12 2.6 1.5 71 2820 Cambodia 15 744 15 744 100 91 2.8 2.6 0.4 3.0 0.5 0.0 93† 4621 Zimbabwe 14 414 12 791 89 59 14 10 0.1 6.6 11 0.0 73 3422 Afghanistan 1 669 80 6.4 4.3 2.1 5.0 2.0 0.0 87† 5.0
High-burden countries 658 844 673 687 102 75 6.1 4.1 1.2 5.8 3.7 4.6 81 19
Global (DOTS) 869 480 876 284 101 72 8.2 4.4 1.4 6.2 3.7 4.1 80 19
* Cohort: cases diagnosed during 1999 and treated/followed-up through 2000. See table 5 and accompanying text for definitions of treatment outcomes.If number registered was provided, this (or the sum of the outcomes, if greater) was used as the denominator for calculating treatment outcomes. If the numberregistered was missing, then the number notified (or the sum of the outcomes, if greater) was used as the denominator. Est: estimated cases for 1999 (asopposed to notified or registered).†=treatment success > 85%.
TABLE 11BTABLE 11BTABLE 11BTABLE 11BTABLE 11B
Treatment outcomes for smear-positive cases: high-burden countries: non-DOTS strategy, 1999 cohort*TREATMENT OUTCOMES (%)*
REGST’D COMPLETED TRANS- NOT TREATMENT
NOTIFIED REGISTERED* (%) CURED TREATMENT* DIED FAILED DEFAULTED FERRED EVAL’D SUCCESS (%)
1 India 296 736 291 932 98 7.0 3.3 0.2 0.2 5.2 1.9 82 102 China 23 901 19 878 83 84 1.4 8.1 3.7 1.5 1.1 843 Indonesia4 Nigeria5 Bangladesh 3 774 3 774 100 44 12 0.5 0.4 25 5.6 13 566 Ethiopia 4 531 28 39 3.9 0.8 18 4.8 4.5 687 Philippines 52 8968 Pakistan 3 9799 South Africa 23 667 18 191 77 33 16 6.3 1.4 19 23 1.2 49
10 Russian Federation 20 47011 DR Congo12 Kenya 2 747 82 6.0 5.1 1.5 4.0 1.4 0.0 88†13 Viet Nam 244 46 19 85 8.7 4.3 0.0 2.2 0.0 0.0 93†14 UR Tanzania15 Brazil 39 326 53 4.0 0.2 8.2 2.5 32.2 5316 Thailand17 Uganda18 Myanmar19 Mozambique20 Cambodia21 Zimbabwe22 Afghanistan 252 54 30 2.4 2.8 9.5 1.2 0.0 84
High-burden countries 464 993 341 099 73 18 3.9 1.1 0.7 6.5 3.0 67 22
Global (non-DOTS) 619 954 394 361 64 22 6.1 1.5 1.3 7.2 3.4 59 28
* see notes for Table 11a.

1818181818 WHO REPORT 2002
TABLE 12TABLE 12TABLE 12TABLE 12TABLE 12
Treatment outcomes for smear-positive cases, by WHO Region and strategy, 1999 cohort*TREATMENT OUTCOMES (%)* % EST* CASES
SUCCESSFULLY
REGST’D COMPLETED TRANS- NOT TREATMENT TREATEDWHO REGION / STRATEGY NOTIFIED REGISTERED (%) CURED TREATMENT* DIED FAILED DEFAULTED FERRED EVAL’D SUCCESS (%) UNDER DOTS
AFR DOTS 254 581 274 971 108 58 11 7.4 1.1 11 8.7 3.4 69 22non-DOTS 25 207 38 793 154 41 18 6.1 1.8 15 13 4.9 60
AMR DOTS 68 152 67 852 100 66 14 4.3 1.2 6.2 3.3 4.7 80 31non-DOTS 64 677 54 692 85 50 6.6 4.4 0.7 11 3.6 25 56
EMR DOTS 43 886 51 238 117 69 14 3.8 1.8 8.0 2.8 0.7 83 16non-DOTS 19 250 20 415 106 36 11 1.0 6.4 13 5.3 28 47
EUR DOTS 17 766 16 828 95 63 15 5.8 6.1 4.9 3.5 1.9 78 6.2non-DOTS 13 346 3 679 28 61 5.5 6.7 7.4 4.3 3.5 12 66
SEAR DOTS 176 793 170 226 96 68 4.9 4.3 1.7 6.7 1.3 13 73 9.2non-DOTS 308 997 302 779 98 8.8 3.6 0.3 0.2 5.6 1.9 80 12
WPR DOTS 283 934 318 165 112 89 4.9 2.0 1.2 2.0 0.8 0.5 94† 35non-DOTS 48 891 34 959 72 54 10 1.9 7.1 5.0 3.2 18 65
Global DOTS 845 112 899 280 106 72 8.2 4.4 1.4 6.2 3.7 4.1 80 19non-DOTS 480 368 455 317 95 22 6.1 1.5 1.3 7.2 3.4 59 28
* see notes for Table 11a.
TABLE 13TABLE 13TABLE 13TABLE 13TABLE 13
Treatment success for smear-positive cases (%): high-burden countries, 1994–99 cohortsDOTS PROGRAMMES WHOLE COUNTRY
1994 1995 1996 1997 1998 1999 1994 1995 1996 1997 1998 1999
1 India 83 79 79 82 84 82 * 25 21 18 27 21
2 China 94 96 96 96 97 96 91 93 94 95 95 95
3 Indonesia 94 91 81 54 58 50 * * * * * *
4 Nigeria 65 49 32 73 73 75 * * * * * *
5 Bangladesh 73 71 72 78 80 81 * * 63 73 77 79
6 Ethiopia 74 61 73 72 74 76 * * 71 * * 74
7 Philippines 80 — 82 83 84 87 88 60 35 78 71 *
8 Pakistan 74 70 — 67 66 70 69 * — * 23 *
9 South Africa — — 69 73 74 60 78 58 61 68 72 57
10 Russian Federation — 65 62 67 68 65 — * 57 * * *
11 DR Congo 71 80 48 64 70 69 72 74 48 64 * *
12 Kenya 73 75 77 65 70 78 * * * * * 79
13 Viet Nam 91 91 90 85 93 92 * 89 89 85 92 92
14 UR Tanzania 80 73 76 77 76 78 * * * * * *
15 Brazil — — — — 91 11 70 17 20 27 40 51
16 Thailand — — 78 62 68 77 58 64 * 58 * *
17 Uganda — — 33 40 62 61 — 44 * * * *
18 Myanmar — 66 79 82 82 81 77 67 79 * * *
19 Mozambique 67 39 54 67 — 71 * * 55 65 — *
20 Cambodia 84 91 94 91 91 93 * * * * * *
21 Zimbabwe — — — — 70 73 52 53 32 59 * *
22 Afghanistan — — — 45 33 87 — — — * * 86
High burden countries 87 83 78 81 83 81 83 53 50 56 62 60
Global 77 79 77 78 81 80 75 57 54 59 64 63
Cohort: see notes for Tables 11a. — not available; * no additional data beyond DOTS report.

GLOBAL TUBERCULOSIS CONTROL 1919191919
mained approximately stable at 77–81%
under DOTS, and 54–64% worldwide
(Table 13).
In DOTS areas, 144 865 cases were
registered for retreatment in 1999,
roughly the same as the 1998 cohort. The
latest data give an overall treatment suc-
cess rate of 74%, but only 64% of pa-
tients had documented smear
conversions (Table 14, Annex 2).
Progress in TB control in22 high-burden countriesThis is the first annual report in which
all 22 HBC provided data from DOTS
programmes covering at least part of the
country (Table 15). The arrows in Figure
13 depicting progress in DOTS imple-
mentation from 1999 to 2000 are typi-
cally short. Viet Nam was the only HBC
to have reached targets for both case
detection and cure.
Treatment success under DOTS gen-
erally exceeded 70%, and exceeded the
85% target in five countries. It has been
lower in African countries such as
TABLE 14TABLE 14TABLE 14TABLE 14TABLE 14
Retreatment outcomes in DOTS programmes: high-burden countries, 1999 cohort*TREATMENT OUTCOMES (%)*
COMPLETED TRANS- NOT TREATMENT
REGISTERED CURED TREATMENT* DIED FAILED DEFAULTED FERRED EVAL’D SUCCESS (%)
1 India 23 204 54 16 7.0 5.4 17 1.2 0.2 69
2 China 43 638 93 2.5 1.6 1.5 0.8 0.2 0.0 96†
3 Indonesia 1 374 46 24 2.8 2.8 4.4 2.3 17 70
4 Nigeria 1 639 61 13 7.6 5.1 9.0 3.8 0.0 74
5 Bangladesh 1 459 75 4.8 3.7 2.2 9.8 4.2 0.0 80
6 Ethiopia 846 59 15 8.6 3.0 10 4.1 0.0 74
7 Philippines
8 Pakistan 1 093 19 56 1.2 2.0 20 1.9 0.0 75
9 South Africa 21 125 40 7.3 8.4 3.6 20 20 1.1 47
10 Russian Federation 1 578 21 23 7.9 15 13 10 9.1 45
11 DR Congo 2 608 60 7.5 7.0 1.8 7.3 11 5.7 67
12 Kenya 1 545 62 11 11 0.6 10 4.9 0.0 73
13 Viet Nam 5 283 83 3.7 4.6 4.3 2.0 2.5 0.0 87†
14 UR Tanzania 1 737 70 4.9 13 0.9 6.4 5.0 0.0 75
15 Brazil
16 Thailand 716 60 7.4 13 5.6 10 3.6 0.0 68
17 Uganda 1 111 28 20 11 1.0 11 5.5 24 48
18 Myanmar 2 292 61 10 7.1 3.9 14 3.8 0.0 71
19 Mozambique 1 371 69 2.4 12 2.0 11 3.6 0.0 71
20 Cambodia 792 88 3.2 3.7 1.2 2.8 1.0 0.0 91†
21 Zimbabwe 943 50 17 16 0.8 7.8 9.2 0.0 66
22 Afghanistan 72 11 3.9 4.6 3.9 3.9 0.0 84
High-burden countries 114 354 67 8.6 5.3 3.1 9.4 5.0 1.2 76
Global 144 865 64 10 5.7 3.6 9.6 4.8 2.4 74
* see notes for Table 11a.
TABLE 15TABLE 15TABLE 15TABLE 15TABLE 15
Progress in DOTS implementation: high-burden countries, 1999–2000
DOTS
HIGH TREATMENT SUCCESS (≥ 70%)
NON-DOTS OR LOW LOW INTERMEDIATE HIGH
INCOMPLETE TREATMENT CASE CASE CASE
DATA SUCCESS DETECTION* DETECTION DETECTION
(< 70%) (< 10%) (10–49%) (≥ 50%)
Brazil Afghanistan Bangladesh Myanmar Viet Nam
DR Congo Pakistan Cambodia Nigeria Zimbabwe
Indonesia China Philippines
Russian Federation Ethiopia Thailand
South Africa India UR Tanzania
Uganda Kenya
Mozambique
* DOTS detection rate: patients found and treated through DOTS programmes.Bold: countries that moved one or more categories up since 1999.Underline: countries that moved one or more categories down since 1999.
Uganda, Mozambique and South Africa,
in part because of high death rates linked
to HIV/AIDS. Low cure rates in the Rus-
sian Federation can be explained, in part,
by treatment failure linked to drug resist-
ance. Afghanistan reported the biggest
improvement in treatment success be-
tween 1998 and 1999: their data suggest
that 87% of 1799 smear-positive cases
were successfully treated in 1999
(though this is somewhat more than the
number notified in that year). Brazil’s
recorded treatment success under DOTS
was 11%; it is so low because only 250 of
2108 registered smear-positive patients
were evaluated.
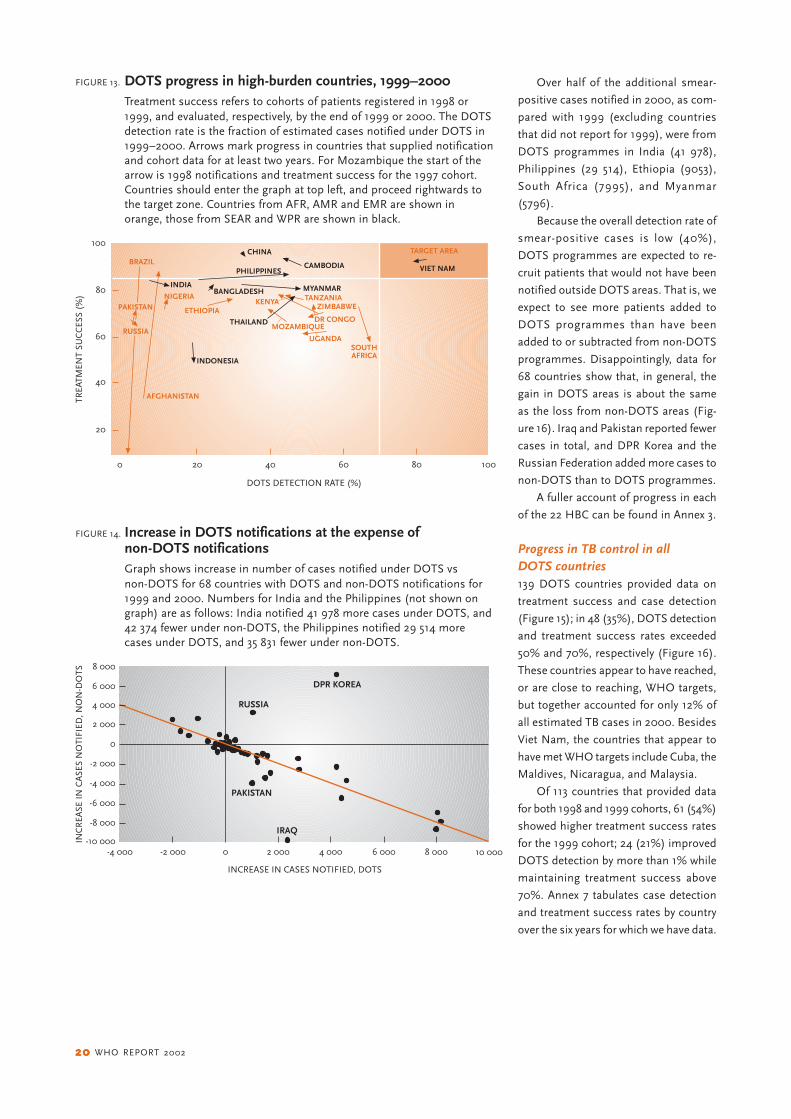
2020202020 WHO REPORT 2002
Over half of the additional smear-
positive cases notified in 2000, as com-
pared with 1999 (excluding countries
that did not report for 1999), were from
DOTS programmes in India (41 978),
Philippines (29 514), Ethiopia (9053),
South Africa (7995), and Myanmar
(5796).
Because the overall detection rate of
smear-positive cases is low (40%),
DOTS programmes are expected to re-
cruit patients that would not have been
notified outside DOTS areas. That is, we
expect to see more patients added to
DOTS programmes than have been
added to or subtracted from non-DOTS
programmes. Disappointingly, data for
68 countries show that, in general, the
gain in DOTS areas is about the same
as the loss from non-DOTS areas (Fig-
ure 16). Iraq and Pakistan reported fewer
cases in total, and DPR Korea and the
Russian Federation added more cases to
non-DOTS than to DOTS programmes.
A fuller account of progress in each
of the 22 HBC can be found in Annex 3.
Progress in TB control in allDOTS countries139 DOTS countries provided data on
treatment success and case detection
(Figure 15); in 48 (35%), DOTS detection
and treatment success rates exceeded
50% and 70%, respectively (Figure 16).
These countries appear to have reached,
or are close to reaching, WHO targets,
but together accounted for only 12% of
all estimated TB cases in 2000. Besides
Viet Nam, the countries that appear to
have met WHO targets include Cuba, the
Maldives, Nicaragua, and Malaysia.
Of 113 countries that provided data
for both 1998 and 1999 cohorts, 61 (54%)
showed higher treatment success rates
for the 1999 cohort; 24 (21%) improved
DOTS detection by more than 1% while
maintaining treatment success above
70%. Annex 7 tabulates case detection
and treatment success rates by country
over the six years for which we have data.
20
40
60
80
100
TREA
TMEN
T SU
CC
ESS
(%)
20 40 60 80 1000
DOTS DETECTION RATE (%)
BRAZIL
AFGHANISTAN
NIGERIA
ETHIOPIAKENYA
MOZAMBIQUE
UGANDA
DR CONGO
ZIMBABWETANZANIA
SOUTHAFRICA
INDONESIA
BANGLADESH
THAILAND
CHINA
PHILIPPINES
INDIA
CAMBODIA
MYANMAR
VIET NAM
PAKISTAN
RUSSIA
TARGET AREA
FIGURE 13. DOTS progress in high-burden countries, 1999–2000Treatment success refers to cohorts of patients registered in 1998 or1999, and evaluated, respectively, by the end of 1999 or 2000. The DOTSdetection rate is the fraction of estimated cases notified under DOTS in1999–2000. Arrows mark progress in countries that supplied notificationand cohort data for at least two years. For Mozambique the start of thearrow is 1998 notifications and treatment success for the 1997 cohort.Countries should enter the graph at top left, and proceed rightwards tothe target zone. Countries from AFR, AMR and EMR are shown inorange, those from SEAR and WPR are shown in black.
8 000
INC
REA
SE IN
CA
SES
NO
TIFI
ED, N
ON
-DO
TS
INCREASE IN CASES NOTIFIED, DOTS
6 000
4 000
2 000
0
-2 000
-4 000
-6 000
-8 000
-10 000-2 000 0 2 000 4 000 10 0006 000 8 000-4 000
PAKISTAN
RUSSIA
DPR KOREA
IRAQ
FIGURE 14. Increase in DOTS notifications at the expense ofnon-DOTS notificationsGraph shows increase in number of cases notified under DOTS vsnon-DOTS for 68 countries with DOTS and non-DOTS notifications for1999 and 2000. Numbers for India and the Philippines (not shown ongraph) are as follows: India notified 41 978 more cases under DOTS, and42 374 fewer under non-DOTS, the Philippines notified 29 514 morecases under DOTS, and 35 831 fewer under non-DOTS.

GLOBAL TUBERCULOSIS CONTROL 2121212121
Planning for DOTS expansionDevelopment and review ofnational DOTS expansion plansTable 16 gives an overview of the coun-
try plans; further details are in Annex 3.
Of the 22 HBC, all but six have com-
pleted a plan for DOTS expansion that
will guide TB control efforts for the next
3–5 years. Six of the countries (Afghani-
stan, China, Mozambique, Russian Fed-
eration, Thailand, and Zimbabwe) are
still developing plans or have complete
plans that are not yet available to WHO.
All 22 countries will have finished the
planning process before the end of 2002.
Of the plans currently available, all
have a budget, and many have clearly-
stated goals, but some are missing, or
partially missing, essential elements. For
example, Nigeria’s plan could include a
more critical analysis of constraints and
resulting gaps, and a clearer statement
of goals. The objectives described in the
plans of Pakistan and DR Congo could
be refined, so that they are measurable
within a specific period of time. Plans for
India, Indonesia, Bangladesh, DR
Congo, Brazil, and Myanmar do not
mention the particular objective of full
DOTS coverage by 2005. DR Congo’s
plan does not mention the target objec-
tive of 85% treatment success by 2005.
The objective of 70% case detection is
not mentioned in Tanzania’s plan.
Plans for Nigeria, Pakistan, the Phil-
ippines, and Brazil could describe bet-
ter links between strategies and
objectives. Indonesia’s plan does not
describe clear strategies for expanding
DOTS. Plans for India, Indonesia, Ni-
geria, Bangladesh, DR Congo, Vietnam,
and Myanmar do not describe, or only
partially describe, strategies for increas-
ing case detection and cure rates.
Pakistan, South Africa, India, and
Kenya include strategies in their plans
for involving the private sector in DOTS
expansion. Pakistan, South Africa, Kenya,
Vietnam, Brazil, Uganda, and Cambodia,
and partially Indonesia, include strate-
gies for developing community-based
care. South Africa, Kenya, Vietnam, Tan-
zania, Uganda, and Cambodia include
strategies for dealing with TB and HIV
co-infection.
With the exceptions of Nigeria, Paki-
stan, South Africa, and DR Congo, all
countries have plans that include tasks
or activities corresponding to their strat-
egies for expanding DOTS. Pakistan,
South Africa, DR Congo, Kenya, Vietnam,
Tanzania, and Uganda all have clear
strategies for monitoring and evaluation.
In several other countries (India, Indo-
nesia, Nigeria, Bangladesh, Ethiopia, the
Philippines, Myanmar, and Cambodia),
plans for monitoring and evaluation are
underdeveloped, and Brazil has none.
Country planning forDOTS expansionThe most commonly identified con-
straints to DOTS expansion were a lack
of qualified staff, a lack of management
skills, and weak laboratory networks
(Annex 3). In countries with a high preva-
lence of HIV, the absence of collabora-
tion between the HIV and TB
programmes is a major constraint to the
detection and management of TB (and
AIDS) cases. The low access to health
care services in Ethiopia and Mozam-
bique is a serious obstacle to achieving
countrywide DOTS coverage. The private
TARGET AREA100
TREA
TMEN
T SU
CC
ESS
(%) 80
60
40
20
DOTS DETECTION RATE (%)
0 70 80 10020 40 60 120
FIGURE 15. DOTS status in 2000Estimated DOTS detection rate in 2000 and treatment successfor the 1999 cohort in 139 countries reporting to WHO. The remainingDOTS countries have adopted the strategy too recently to providetreatment outcomes.
FIGURE 16. Magnified view of Figure 1548 countries that reported treatment success rates over 70% andestimated DOTS detection rates over 50%
TARGET AREA
100
TREA
TMEN
T SU
CC
ESS
(%)
90
80
70
DOTS DETECTION RATE (%)
90 10060 70 80 12011050
LEBANON
SAMOAGUAM
TUNISIA SEYCHELLES
SLOVENIADR CONGO
NEPALMONGOLIA
YEMENMARSHALL IS
SOLOMON ISMEXICOEL SALVADOR
PUERTO RICO
ZIMBABWE
DJIBOUTIBOTSWANAESTONIA
BOLIVIA QATAR
USA
MOROCCO
URUGUAY
NICARAGUAVENEZUELA
CHILE
N. MARIANA TONGA
BRUNEI DARUSSALAMJAMAICA
MALAYSIA
VIET NAM
PORTUGALFR. POLYNESIA
MALDIVES
PERUCUBA
NICARAGUA
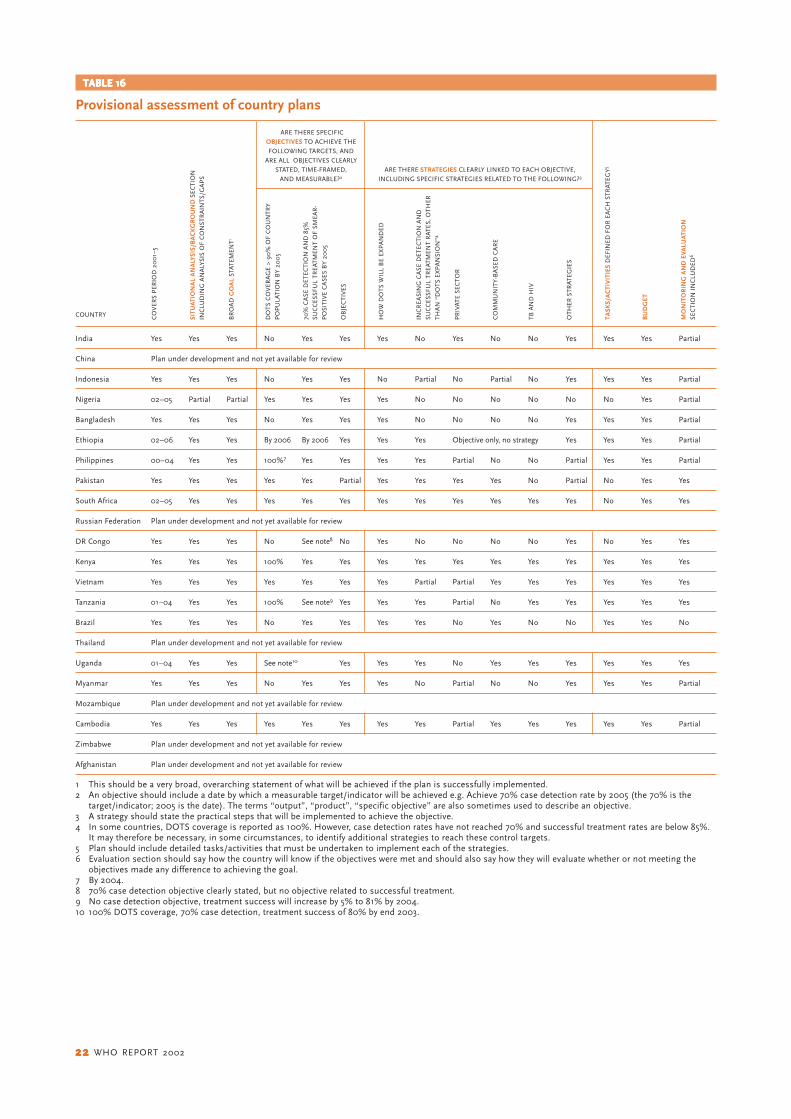
2222222222 WHO REPORT 2002
TABLE 16TABLE 16TABLE 16TABLE 16TABLE 16
Provisional assessment of country plans
India Yes Yes Yes No Yes Yes Yes No Yes No No Yes Yes Yes Partial
China Plan under development and not yet available for review
Indonesia Yes Yes Yes No Yes Yes No Partial No Partial No Yes Yes Yes Partial
Nigeria 02–05 Partial Partial Yes Yes Yes Yes No No No No No No Yes Partial
Bangladesh Yes Yes Yes No Yes Yes Yes No No No No Yes Yes Yes Partial
Ethiopia 02–06 Yes Yes By 2006 By 2006 Yes Yes Yes Objective only, no strategy Yes Yes Yes Partial
Philippines 00–04 Yes Yes 100%7 Yes Yes Yes Yes Partial No No Partial Yes Yes Partial
Pakistan Yes Yes Yes Yes Yes Partial Yes Yes Yes Yes No Partial No Yes Yes
South Africa 02–05 Yes Yes Yes Yes Yes Yes Yes Yes Yes Yes Yes No Yes Yes
Russian Federation Plan under development and not yet available for review
DR Congo Yes Yes Yes No See note8 No Yes No No No No Yes No Yes Yes
Kenya Yes Yes Yes 100% Yes Yes Yes Yes Yes Yes Yes Yes Yes Yes Yes
Vietnam Yes Yes Yes Yes Yes Yes Yes Partial Partial Yes Yes Yes Yes Yes Yes
Tanzania 01–04 Yes Yes 100% See note9 Yes Yes Yes Partial No Yes Yes Yes Yes Yes
Brazil Yes Yes Yes No Yes Yes Yes Yes No Yes No No Yes Yes No
Thailand Plan under development and not yet available for review
Uganda 01–04 Yes Yes See note10 Yes Yes Yes No Yes Yes Yes Yes Yes Yes
Myanmar Yes Yes Yes No Yes Yes Yes No Partial No No Yes Yes Yes Partial
Mozambique Plan under development and not yet available for review
Cambodia Yes Yes Yes Yes Yes Yes Yes Yes Partial Yes Yes Yes Yes Yes Partial
Zimbabwe Plan under development and not yet available for review
Afghanistan Plan under development and not yet available for review
1 This should be a very broad, overarching statement of what will be achieved if the plan is successfully implemented.2 An objective should include a date by which a measurable target/indicator will be achieved e.g. Achieve 70% case detection rate by 2005 (the 70% is the
target/indicator; 2005 is the date). The terms “output”, “product”, “specific objective” are also sometimes used to describe an objective.3 A strategy should state the practical steps that will be implemented to achieve the objective.4 In some countries, DOTS coverage is reported as 100%. However, case detection rates have not reached 70% and successful treatment rates are below 85%.
It may therefore be necessary, in some circumstances, to identify additional strategies to reach these control targets.5 Plan should include detailed tasks/activities that must be undertaken to implement each of the strategies.6 Evaluation section should say how the country will know if the objectives were met and should also say how they will evaluate whether or not meeting the
objectives made any difference to achieving the goal.7 By 2004.8 70% case detection objective clearly stated, but no objective related to successful treatment.9 No case detection objective, treatment success will increase by 5% to 81% by 2004.10 100% DOTS coverage, 70% case detection, treatment success of 80% by end 2003.
ARE THERE SPECIFICOBJECTIVES TO ACHIEVE THE
FOLLOWING TARGETS, ANDARE ALL OBJECTIVES CLEARLY
STATED, TIME-FRAMED,AND MEASURABLE?2
COUNTRY CO
VER
S P
ERIO
D 2
00
1–5
SITU
ATIO
NA
L A
NA
LYSI
S/B
AC
KG
RO
UN
D S
ECTI
ON
INC
LUD
ING
AN
ALY
SIS
OF
CO
NST
RA
INTS
/GA
PS
BR
OA
D G
OA
L ST
ATEM
ENT1
DO
TS C
OV
ERA
GE
> 9
0%
OF
CO
UN
TRY
PO
PU
LATI
ON
BY
20
05
70%
CA
SE D
ETEC
TIO
N A
ND
85%
SUC
CES
SFU
L TR
EATM
ENT
OF
SMEA
R-
PO
SITI
VE
CA
SES
BY
20
05
OB
JEC
TIV
ES
HO
W D
OTS
WIL
L B
E EX
PA
ND
ED
INC
REA
SIN
G C
ASE
DET
ECTI
ON
AN
DSU
CC
ESSF
UL
TREA
TMEN
T R
ATES
, OTH
ER
THA
N “
DO
TS E
XP
AN
SIO
N”4
PR
IVAT
E SE
CTO
R
CO
MM
UN
ITY
-BA
SED
CA
RE
TB A
ND
HIV
OTH
ER S
TRAT
EGIE
S
TASK
S/A
CTI
VIT
IES
DEF
INED
FO
R E
AC
H S
TRAT
EGY
5
BU
DG
ET
MO
NI T
OR
I NG
AN
D E
V ALU
ATI O
NSE
CTI
ON
IN
CLU
DED
6
ARE THERE STRATEGIES CLEARLY LINKED TO EACH OBJECTIVE,INCLUDING SPECIFIC STRATEGIES RELATED TO THE FOLLOWING?3
GLOBAL TUBERCULOSIS CONTROL 2323232323
health care sector is unregulated in most
countries, and commonly does not com-
ply with DOTS standards, though there
are exceptions in parts of India, Indone-
sia, and the Philippines.
Health sector reform, especially the
decentralization of TB control activities,
was identified as a major constraint in
Indonesia and the Philippines because
district and provincial governments have
been reluctant to participate in, and
fund, TB control. By contrast, reform has
been seen as an opportunity in Cambo-
dia, Ethiopia, and Kenya, where there is
now the potential for better access to
DOTS. Other countries did not experi-
ence major changes in the organization
of their health systems during the period
under review, but those with systems
that were already decentralized have
found it hard to expand DOTS quickly
because of the time needed to convince
local authorities to participate.
The war in Afghanistan nearly de-
stroyed the health infrastructure, and the
newly-developed DOTS programme was
severely curtailed. Similarly in DR Congo,
DOTS cannot be expanded into areas
affected by war or civil unrest.
To help alleviate drug shortages, the
Global Drug Facility supplied three coun-
tries (DR Congo, Kenya, Myanmar) in
2001, and placed orders for three addi-
tional countries (Pakistan, Uganda, Ni-
geria) to be delivered in the first quarter
of 2002. All HBC have a secure supply
of TB drugs for 2002. Except in parts of
China, drugs will be supplied free of
charge to all patients.
For each constraint identified, most
national TB control programmes have
begun to implement activities to over-
come them, generally through training,
advocacy, and establishment of a labo-
ratory network. Major steps have been
taken by India and China to institution-
alize TB control in the government sys-
tem by obtaining either a government
resolution (India), or by having the na-
tional plan for TB control endorsed by
the government (China).
WHO regional plansIn 2000, WPRO prepared a medium-
term regional strategic plan for 2001–
2005. During 2001, all other regional of-
fices prepared such plans, including the
expansion of regional capacity and the
involvement of partners. The strategic
plans describe activities that will be un-
dertaken by WHO and partners to assist
all countries with DOTS expansion. In
2001, as part of the GDEP, regional
meetings of technical and financial part-
ners were held in the WHO regions of
Africa, the Americas, Europe and the
Western Pacific to present the plans and
to discuss country support for DOTS
expansion activities.
Partnerships and coordinationAs recommended in the Global DOTS
Expansion Plan,4 an international lead
technical partner has been identified for
each of the 22 HBC (Annex 3). One of
the roles of lead agencies is to stimulate
the establishment of a NICC. NICCs have
now been formed in 11 of the 22 HBC
(i.e. Brazil, Cambodia, China, Kenya,
Myanmar, Pakistan, Philippines, Russia,
Tanzania, Thailand, Vietnam) and are
under development in all others, and
should be operational by the end of
2002.
Financing DOTS expansionAssessment of budgets in relation tostandard criteriaBudgets for some or all of the years
2002–5 are available for 17 of the 22 HBC
(Table 17, Annex 3). Budgets are in the
process of being developed for the Rus-
sian Federation, South Africa, Mozam-
bique, and Zimbabwe; a budget is
reported to be available for Thailand. For
the Russian Federation and Thailand,
other recent data provide an indication
of the likely budget required. Thus, as of
January 2002, more or less accurate
budgets were available for 19 of the 22
HBC.
For Ethiopia, Bangladesh, Brazil, Tan-
zania, Nigeria, Pakistan, Kenya, and DR
Congo, it is not clear whether budgets
have been explicitly linked to an estimate
of the total number of patients to be
treated. For Ethiopia and Bangladesh,
budgets appear low in relation to recent
estimates10 of the total number of pa-
tients that will need to be treated if the
70% case detection target is to be
reached in 2005. Ethiopia’s budget is
provisional, but will be completed dur-
ing 2002 (Annex 3).
With only one exception (Brazil),
budgets cover all relevant administrative
levels of the country and all major costs
specific to TB control (i.e. first-line drugs,
diagnostic supplies and equipment, pro-
gramme management and supervision,
and training). Nine of the 17 countries
include all essential financial inputs,
while eight do not include a budget for
staff costs (usually because these costs
are assumed to be covered by general
government budgets). For Brazil, it is
unclear what type of inputs are included.
Most budgets cover the entire period
2002–5, though Uganda and Tanzania
have budgets only for 2002–4. All budg-
ets cover funding for the types of patients
for whom care is publicly funded. Except
for Afghanistan, all budgets include
some funds specifically for activities to
increase case detection and cure rates.
Most budgets do not include an as-
sessment of the costs associated with
using resources that are not specific to
TB control i.e. use of general health serv-
ices staff and infrastructure (e.g. build-
ings, equipment, non-staff operating
costs) for the provision of treatment.
These resources are used every day that
a tuberculosis patient spends in hospi-
tal, and every time a patient makes an
outpatient visit for observation of treat-
ment or monitoring of sputum status.
Only in China, Indonesia, the Philip-
pines, and Cambodia have such costs
been considered. The budget for China
covers the costs associated with pay-
ments to general health workers (e.g.
village doctors) for observing treatment.
In the other three countries, budgets in-
clude the cost of staff time spent on tu-
berculosis patient care in general health
services.
Budgets, funds and funding gapsThe budgets for the 19 HBC for which
data are available total around US$ 450–
500 million per year (Table 18). This to-
tal excludes South Africa, Mozambique,
and Zimbabwe. The country with the
largest budget is the Russian Federation

2424242424 WHO REPORT 2002
(US$ 150–200 million per year), followed
by China (US$ 97 million per year) and
India (US$ 46 million per year). Indone-
sia (US$ 35 million per year) and the
Philippines (US$ 22 million per year)
also have relatively large budgets. Except
for Brazil (US$ 15 million per year at fed-
eral level), other countries have budgets
of less than US$ 10 million per year.
Data on both funding and funding
gaps are available for 16 HBC (Figure 17).
Government funding accounts for a large
share in India, Brazil, Thailand, and the
Philippines, and is also around or above
60% of the total budget for China, Indo-
nesia, and Vietnam. Grant funding over-
all is low (Table 18), at less than 5% of
the total budget required according to
current data. However, it is very high in
certain countries, notably Tanzania
(> 80% of the budget) and Bangladesh
(75% of the total budget). Donor fund-
ing is also important in Kenya, Cambo-
dia, Uganda, DR Congo, and Pakistan.
In absolute terms, the biggest pledges
made so far by donors are to India, Tan-
zania, and Bangladesh.
The total funding gap, according to
existing estimates, amounts to US$ 81
million per year for the 16 countries that
have estimates. With a gap of US$ 44
million per year, China accounts for more
than 50% of the total gap (Table 18),
TABLE 17TABLE 17TABLE 17TABLE 17TABLE 17
Characteristics of budgetsCOUNTRY EXPLICITLY COVERS ALL INCLUDES ALL INCLUDES ASSESS- INCLUDES COVERS PERIOD INCLUDES INCLUDES ALLOWS FOR INCLUDES FUNDS FOR
LINKED TO ADMINISTRATIVE MAJOR MENT OF COSTS ALL 2002–2004/5 BREAKDOWN BREAKDOWN TREATING ALL NEW INTERVENTIONS
ACHIEVING LEVELS OF THE COMPONENTS ASSOCIATED WITH FINANCIAL INCLUDING BY LINE OF THE PATIENTS FOR OR STRATEGIESGLOBAL COUNTRY OF COSTS USING RESOURCES INPUTS 2 BREAKDOWN ITEM FUNDING WHOM CARE IS AIMED AT
TARGETS1 SPECIFIC THAT ARE NOT TB- BY YEAR GAP BY PUBLICLY INCREASING CASETO TB SPECIFIC i.e. GENERAL LINE FUNDED DETECTION
CONTROL HEALTH SERVICES ITEM AND CURE RATES
STAFF AND GENERAL TO TARGETHEALTH SERVICES LEVELSINFRASTRUCTURE
India Yes Yes Yes No Yes Yes Yes Yes Yes Yes
China Yes Yes Yes Yes 3 Yes Yes Yes Yes Yes 4 Yes
Indonesia Yes Yes Yes Yes 3 Yes Yes Yes Yes Yes Yes
Nigeria ?? Yes Yes No No Yes Yes No Yes Yes
Bangladesh ?? Yes Yes No No Yes Yes Yes Yes Yes
Ethiopia ?? Yes Yes No No Yes Yes No Yes Yes
Philippines Yes Yes Yes Yes 3 Yes Yes Yes Yes Yes Yes
Pakistan ?? Yes Yes No Yes Yes Yes Yes Yes Yes
South Africa N.A. N.A. N.A. N.A. N.A. N.A. N.A. N.A. N.A. N.A.
RussianFederation N.A. N.A. N.A. N.A. N.A. N.A. N.A. N.A. N.A. N.A.
DR Congo ?? Yes Partially No No Yes Yes Yes Yes Yes
Kenya ?? Yes Yes No No Yes Yes Yes Yes Yes
Viet Nam Yes Yes Yes No Yes Yes Yes Yes Yes Yes
UR Tanzania ?? Yes Yes No Yes 2001/2–2003/4 Yes Yes Yes Yes
Brazil ?? Federal only Yes No ?? Yes No No Yes ??
Thailand N.A. N.A. N.A. N.A. N.A. N.A. N.A. N.A. N.A. N.A.
Uganda Yes Yes Yes No No 5 2001/2–2003/4 Yes Yes Yes Yes
Myanmar Yes Yes Yes No Yes Yes Yes Yes Yes Yes
Mozambique N.A. N.A. N.A. N.A. N.A. N.A. N.A. N.A. N.A. N.A.
Cambodia Yes Yes Yes Yes 3 Yes Yes Yes Yes Yes Yes
Zimbabwe N.A. N.A. N.A. N.A. N.A. N.A. N.A. N.A. N.A. N.A.
Afghanistan Partially Yes Yes No No Yes Yes Yes Yes No
All Yes + No Yes + No Yes + No Yes + No Yes + No Yes + No Yes + No Yes + No Yes Yes + No
1 ?? Indicates that the existing estimate of the budget required appears low in relation to the number of patients to be treated if targets are to be reached in 2005(see next table) and/or the number of cases to be treated is not specified.
2 Staff, buildings, equipment, vehicles and supplies. Where “No” is entered, the main exclusion is staff costs.3 Estimates for China include the costs associated with use of general health workers (e.g. village doctors) for DOT; costs for Cambodia, Indonesia and the
Philippines include costs associated with the staff required in general health services as well as TB-control specific requirements.4 In China, public funding is only provided for (a) new smear-positive, (b) retreatment, and (c) seriously-ill smear-negative and extra-pulmonary patients (about
11% of the total number of patients in this latter category).5 Data are available regarding the costs of all financial inputs, but data on staff costs were not included in the final budget supplied to WHO.N.A.: no budget estimates were available when analysis was undertaken.

GLOBAL TUBERCULOSIS CONTROL 2525252525
TABLE 18TABLE 18TABLE 18TABLE 18TABLE 18
Estimated total budgets, funding, and costs for all resources required for TB control: high-burden countries1
COUNTRY TOTAL BUDGET GOVERNMENT DONOR RESOURCE GAP AS IMPLIED TOTAL ESTIMATED TOTALPER YEAR CONTRIBUTION FUNDS GAP % TOTAL BUDGET COST PER YEAR ESTIMATED
ACCORDING TO (INCLUDING PLEDGED PER YEAR ESTIMATED PER PATIENT FOR ALL RESOURCES COST PEREXISTING WB LOAN PER YEAR BUDGET TREATED 2,3 REQUIRED FOR PATIENT
ESTIMATES FUNDS)PER YEAR TB CONTROL 3,4 TREATED 3,4
(US$ MILLIONS) (US$ MILLIONS) (US$ MILLIONS) (US$ MILLIONS) (US$ MILLIONS)
India 46 38 (approx) 5 (approx) 1 for 2 33 111 78for 2001–3 for 2001–3 2001–3
China 97 52.5 0.5 44 45 243 97 243
Indonesia 35 24.5 0.5 10 29 166 35 166
Nigeria 7 ?? ?? ?? ?? 53 18 131
Bangladesh 5 1 3 0 0 25 24 121for 2001–3 for 2001–3
Ethiopia 5 0.1 (approx) ?? ?? ?? 25 18 91
Philippines 22 17 0 5 23 114 22 114
Pakistan 7 3 1 3 43 33 24 119
South Africa N.A. N.A. N.A. N.A. N.A. N.A. 230 1365
Russian Federation 150–200 1 N.A. N.A. N.A. N.A. 788–1051 150–200 788–1051
DR Congo 8 ?? 1 7 88 78 13 115
Kenya 5 2 2 1 20 31 36 235
Viet Nam 7 5 1 1 14 71 19 202
UR Tanzania 5 0.1–0.3 4.4 0.6 12 54 10 101
Brazil 15 at federal level 15 ?? 0 0 203 52 699
Thailand 10 1 10 N.A. 0 0 197 21 401
Uganda 3 0.5 0.5 2 67 60 8 166
Myanmar 2 0.4 0.04 2 80 66 2 66
Mozambique N.A. N.A. N.A. N.A. N.A. N.A. Not yet Not yetestimated estimated
Cambodia 5 2 1 2 40 155 10 327
Zimbabwe N.A. N.A. N.A. N.A. N.A. N.A. 22 324
Afghanistan 2 0 ?? 2 100 67 2 67
All 436–486 171 + ?? 20 + ?? 81 + ?? > 17 25–1051 926–976 66–1365
1 Figures are averages for the period 2002–5, except for the Russian Federation (based on data for 1999–2001) and Thailand (based on data for 2000).2 Total estimated average budget per year divided by average number of patients to be treated per year.3 Number of patients to be treated based on estimated number of cases, case detection data, the assumption that targets will be reached in 2005, and the
assumption that there is constant progress towards targets (see Methods section).4 In addition to budget totals, these estimates include costs that are not typically considered in budget estimates. The main costs not typically included in
budget estimates are costs associated with using resources that are not TB-specific i.e. general health services staff and infrastructure (buildings, equipment,non-staff operating costs). These resources are used when patients are hospitalized at the beginning of treatment and when they make outpatient visits forobservation of treatment or monitoring of sputum status. Sources include plan budgets and costing studies. Estimated costs in year 2000 US$ prices.
N.A.: No budget estimates were available when analysis was undertaken.
though it is anticipated that a World Bank
loan will substantially reduce this short-
fall in the near future. The budget gap is
also high in Indonesia, at US$ 10 mil-
lion per year. Other countries have
budget gaps of up to US$ 5 million per
year. As a fraction of the total budget re-
quired, the gaps are biggest (29–100%)
in Afghanistan, DR Congo, Myanmar,
Uganda, Pakistan, Cambodia and Indo-
nesia.
The estimated budget per patient
ranges from US$ 25 in Bangladesh and
Ethiopia to US$ 800–1 000 in the Rus-
sian Federation. Most countries have a
budget per patient in the range of US$
30–70, though estimates for China, Thai-
land, Indonesia, Cambodia, and Brazil
are higher (US$ 150–250).
Breakdown of budgetsDetailed breakdowns by line item are
provided for each country in Annex 3. The
overall breakdown for the 16 HBC that
have provided data is shown in Figure
18. Staff and buildings are excluded from
this figure for two main reasons: data on
budgets for staff are not available for
seven of the 16 countries, and only one
country (India) has provided data for
building costs.
The main budget items, excluding
staff and buildings, are drugs (37%) and

2626262626 WHO REPORT 2002
programme management and supervi-
sion (22%). Diagnostic supplies and
equipment, training, and activities spe-
cifically aimed at increasing case detec-
tion and cure rates (e.g. private sector
strategy, health education) amount to
around 10% each.
The breakdown of budget gaps for
the 14 countries that provided data (In-
dia, China, Indonesia, Pakistan, Bangla-
desh, the Philippines, DR Congo, Kenya,
Vietnam, Tanzania, Uganda, Myanmar,
Cambodia, and Afghanistan) is similar,
though with more emphasis on pro-
gramme management and supervision,
and less emphasis on drugs (Figure 19).
Of the total funding gap of US$ 301 mil-
lion in these countries (this total is for
all years for which data are available, and
excludes staff and building costs), 29%
is for programme management and
supervision, and 22% for drugs.
PERCENTAGE OF BUDGET
GOVERNMENT GRANT GAP
Afghanistan
Cambodia
Myanmar
Uganda
Thailand
Brazil
UR Tanzania
Viet Nam
Kenya
DR Congo
Philippines
Bangladesh
Indonesia
China
India
0 20 40 60 80 100
Pakistan
FIGURE 17. Funding availability and funding gaps, 16 high-burdencountries for which data are available
FIGURE 18
Breakdown of country budgetsexcluding staff and buildingcosts, 16 high-burden countriesfor which data are available
FIGURE 19
Breakdown of funding gapsidentified in country budgets,excluding staff and buildingcosts, 14 high-burden countriesfor which data are available
11 Recent estimates indicate that when lowand lower middle-income countries beyondthe 22 HBC are considered, this increasesto a total requirement of US$ 1.2 billion peryear. See note 10.
Total costs of TB control andtotal funding gapsThe total cost of all resources required
for TB control in the 22 HBC (i.e. includ-
ing the items that are usually not
considered in TB budgets) is around
US$ 1 billion per year (Table 18).11 The
countries with the largest resource re-
quirements are South Africa, the Russian
Federation, India, and China. Most other
countries require US$ 10–35 million per
year. On a per patient basis, costs are
highest in South Africa and the Russian
Federation (at over US$ 1 000 per pa-
tient), and lowest (at US$ 70–80) in
Myanmar, Afghanistan, and India. The
gap between total costs (US$ 1 billion
per year) and available funding may be
around US$ 300 million per year, or
about one third of the total resources
required.
DIAGNOSIS11%
DRUGS37%TRAINING
11%
PROGRAMMEMANAGEMENT
ANDSUPERVISON
22%
ACTIVITIES TOINCREASE
CD AND CURERATES14%
MISCELLANEOUS5%
DIAGNOSIS15%
DRUGS22%
TRAINING11%
PROGRAMMEMANAGEMENT
ANDSUPERVISION
29%
ACTIVITIES TOINCREASE
CD AND CURERATES
17%
MISCELLANEOUS6%
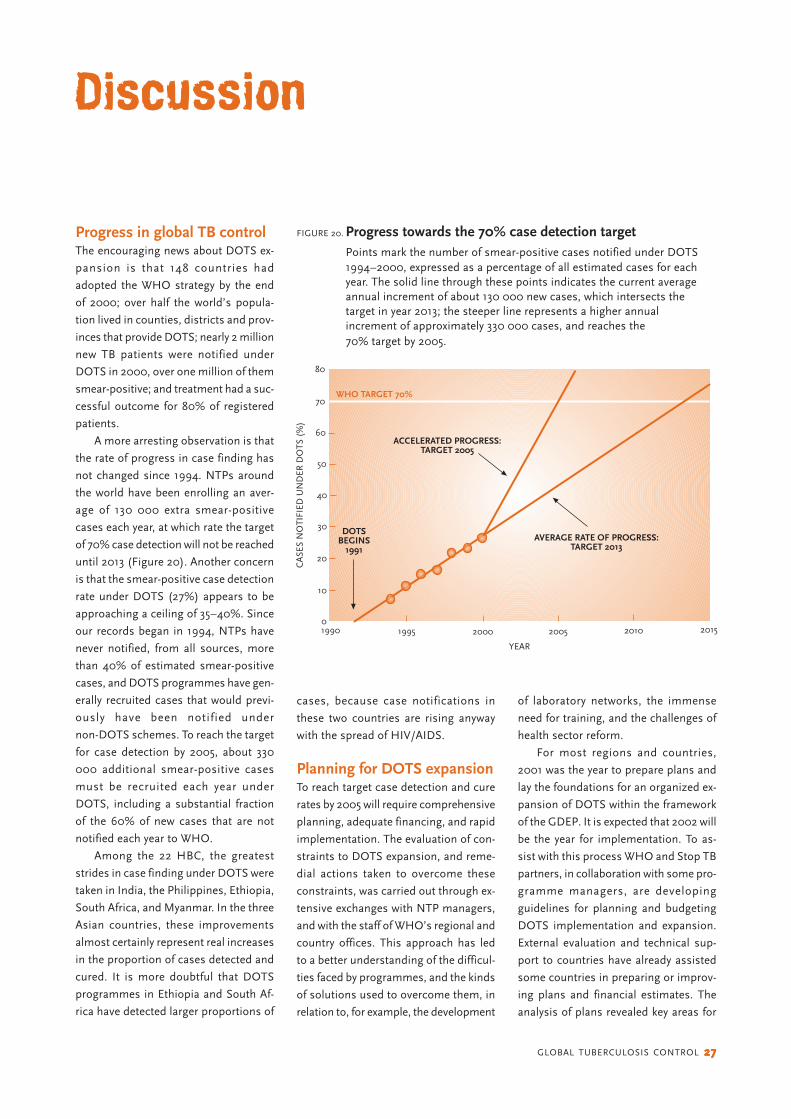
GLOBAL TUBERCULOSIS CONTROL 2727272727
Discussion
cases, because case notifications in
these two countries are rising anyway
with the spread of HIV/AIDS.
Planning for DOTS expansionTo reach target case detection and cure
rates by 2005 will require comprehensive
planning, adequate financing, and rapid
implementation. The evaluation of con-
straints to DOTS expansion, and reme-
dial actions taken to overcome these
constraints, was carried out through ex-
tensive exchanges with NTP managers,
and with the staff of WHO’s regional and
country offices. This approach has led
to a better understanding of the difficul-
ties faced by programmes, and the kinds
of solutions used to overcome them, in
relation to, for example, the development
of laboratory networks, the immense
need for training, and the challenges of
health sector reform.
For most regions and countries,
2001 was the year to prepare plans and
lay the foundations for an organized ex-
pansion of DOTS within the framework
of the GDEP. It is expected that 2002 will
be the year for implementation. To as-
sist with this process WHO and Stop TB
partners, in collaboration with some pro-
gramme managers, are developing
guidelines for planning and budgeting
DOTS implementation and expansion.
External evaluation and technical sup-
port to countries have already assisted
some countries in preparing or improv-
ing plans and financial estimates. The
analysis of plans revealed key areas for
FIGURE 20. Progress towards the 70% case detection targetPoints mark the number of smear-positive cases notified under DOTS1994–2000, expressed as a percentage of all estimated cases for eachyear. The solid line through these points indicates the current averageannual increment of about 130 000 new cases, which intersects thetarget in year 2013; the steeper line represents a higher annualincrement of approximately 330 000 cases, and reaches the70% target by 2005.
Progress in global TB controlThe encouraging news about DOTS ex-
pansion is that 148 countries had
adopted the WHO strategy by the end
of 2000; over half the world’s popula-
tion lived in counties, districts and prov-
inces that provide DOTS; nearly 2 million
new TB patients were notified under
DOTS in 2000, over one million of them
smear-positive; and treatment had a suc-
cessful outcome for 80% of registered
patients.
A more arresting observation is that
the rate of progress in case finding has
not changed since 1994. NTPs around
the world have been enrolling an aver-
age of 130 000 extra smear-positive
cases each year, at which rate the target
of 70% case detection will not be reached
until 2013 (Figure 20). Another concern
is that the smear-positive case detection
rate under DOTS (27%) appears to be
approaching a ceiling of 35–40%. Since
our records began in 1994, NTPs have
never notified, from all sources, more
than 40% of estimated smear-positive
cases, and DOTS programmes have gen-
erally recruited cases that would previ-
ously have been notified under
non-DOTS schemes. To reach the target
for case detection by 2005, about 330
000 additional smear-positive cases
must be recruited each year under
DOTS, including a substantial fraction
of the 60% of new cases that are not
notified each year to WHO.
Among the 22 HBC, the greatest
strides in case finding under DOTS were
taken in India, the Philippines, Ethiopia,
South Africa, and Myanmar. In the three
Asian countries, these improvements
almost certainly represent real increases
in the proportion of cases detected and
cured. It is more doubtful that DOTS
programmes in Ethiopia and South Af-
rica have detected larger proportions of
YEAR
80
CA
SES
NO
TIFI
ED U
ND
ER D
OTS
(%
)
70
60
50
40
30
20
10
01990 1995 2000 2005 2010 2015
DOTSBEGINS
1991
ACCELERATED PROGRESS:TARGET 2005
AVERAGE RATE OF PROGRESS:TARGET 2013
WHO TARGET 70%

2828282828 WHO REPORT 2002
support, such as identification of suc-
cessful strategies for DOTS expansion,
for increasing case detection and cure
rates, for involvement of other sectors
in TB control, and for budgeting. Further
discussion with NTP managers will im-
prove country plans, leading to better
implementation of DOTS.
Assisted by the Stop TB Partnership,
all 22 HBC made progress towards pre-
paring sound strategic plans during
2001. However, the content and quality
of current strategic plans vary widely (in
part because the guidelines for writing
such plans are still under development).
Despite the high and rising TB burden
linked to HIV, three African countries—
Kenya, Tanzania, and Uganda—are ready
to further expand DOTS. The same ap-
plies to Cambodia, China, and the Phil-
ippines in the Western Pacific Region
(Viet Nam having already reached WHO
targets), and to India and Myanmar in
the South-East Asia Region. Nigeria and
Pakistan have just completed the plan-
ning phase and substantial additional
funding is expected to be available in
early 2002. Elements missing from the
plans presented by some other countries
suggest that they are not immediately
ready to scale up DOTS. This applies
especially to Bangladesh, Brazil, Mozam-
bique, and Zimbabwe.
Following the lead of the regional
office for the Western Pacific, all other
WHO regional offices have started to
respond in a systematic way to the needs
of all countries through strategic plan-
ning. International partnerships are now
better organized than ever, and in a
position to provide strong technical sup-
port to countries. More donors are
investing in TB control, and the estab-
lishment of the Global Fund to fight
AIDS, Tuberculosis and Malaria should
provide an opportunity to accelerate the
implementation of plans developed dur-
ing 2001. New services, such as the Glo-
bal Drug Facility, are beginning to supply
countries with essential drugs for TB
control. Assurance of a reliable supply
of 4-drug fixed-dose combination tablets
facilitates successful DOTS expansion.
These four-drug combinations simplify
chemotherapy and reduce the risk of in-
adequate treatment. There is potential
for this pharmaceutical newcomer to im-
prove TB control.
Financing DOTS expansionThe total financial resources required for
TB control in the 22 HBC, at an esti-
mated US$ 1 billion per year if targets
are to be met in 2005, are small in the
context of recent estimates of the re-
sources required for both HIV/AIDS and
malaria. However, important funding
gaps are evident, and if progress in glo-
bal tuberculosis control is to be made,
these will need to be filled—by govern-
ments, by donors, or by both. Initially,
new funds would be best targeted to the
funding gaps identified in existing coun-
try budgets (Annex 3), since these gaps
represent the unfunded components of
existing plans for DOTS implementation.
These gaps currently total almost
US$ 100 million per year, and are largely
for items and activities specific to TB
control. Subsequently, funding may also
need to be directed towards new invest-
ment in general health services.
The variation among countries in the
total estimated cost of TB control, exist-
ing country budgets, and costs and
budgets per patient, is striking. Costs in
the 22 HBC are dominated by four coun-
tries—South Africa, the Russian Federa-
tion, India, and China account for 65%
of the total. Existing country budgets,
while not typically considering all the
costs associated with provision of diag-
nosis and treatment, largely support this
finding. South Africa has yet to complete
a detailed budgeting exercise, but China,
India, and the Russian Federation ac-
count for about 70% of the total budget
for the 19 HBC that have provided esti-
mates. Budgets per patient vary across
two orders of magnitude, from
US$ 25 in Bangladesh and Ethiopia up to
a maximum of US$ 1 051 in the Russian
Federation; the total estimated cost per
patient ranges from US$ 66 to US$ 1 051.
This variation is due, in part, to dif-
ferences in estimated numbers of cases,
the prices of inputs such as staff and
materials, and differences in how TB
control is delivered. South Africa has the
highest total costs because it is a mid-
dle-income country (and therefore has
higher costs, especially for staff), and
because hospitalization for the first 1–2
months of treatment is common in ru-
ral areas. High costs for the Russian Fed-
eration reflect reliance on an extensive
infrastructure for provision of diagnosis
and treatment—there are over 100 000
beds in specialized tuberculosis dispen-
saries, hospitals and sanatoria. Relatively
modest requirements in India and China
reflect their reliance on outpatient care,
drug prices in the region of US$ 10–20
per patient (versus US$ 30–40 in sev-
eral other countries), and relatively low
average income levels. This variation in-
dicates that efficiency could be im-
proved, and resource requirements
lowered, in some settings.
In the case of the budget data, varia-
tion also reflects differences in the type
of costs considered and, possibly, the
quality of the budgeting exercise. For
example, the budget for China covers all
inputs required for TB control, including
dedicated staff and facilities and pay-
ments to general health workers for ob-
serving treatment. For the Russian
Federation, the budget covers an exten-
sive network of dedicated TB hospitals
and clinics; for several other countries,
the costs of national TB programme staff
are not included, and nor are the costs
associated with using general health
system staff and facilities. Where budg-
ets currently appear low in relation to es-
timated numbers of cases and the
number of patients that will need to be
treated if targets are to be achieved, a
review of the existing estimates may be
warranted.
Budget gaps range from zero to
100% of the budget in the 16 countries
that provided estimates. There is a big
difference in nine countries between the
total budget and the funding that will be
provided by government. Only three
countries (Bangladesh, Kenya, Tanzania)
have, as of January 2002, significantly
narrowed the gap between the total
budget and government funding with
pledges from donors.
On the positive side, current infor-
mation about grant funding from donors
almost certainly underestimates com-

GLOBAL TUBERCULOSIS CONTROL 2929292929
mitments for the period 2002–5, be-
cause many donors make firm pledges
one year at a time. For the 16 HBC rep-
resented in Figure 17, grant funding for
2002 totals US$ 27 million, compared
with the annual average of US$ 20 mil-
lion for the period 2002–5. Furthermore,
the US$ 27 million for 2002 would cer-
tainly be much higher if data were in-
cluded for Nigeria and the Russian
Federation, where donor funding is ex-
pected to be important. Ethiopia re-
ceived around US$ 4 million in 2001, and
is likely to receive much more during
2002–5. Altogether, these three countries
could increase donor funding in 2002 to
around US$ 40 million. However, this
level of grant funding is still not suffi-
cient to fill the funding gaps that have
been identified. Increased funding com-
mitments to TB control from traditional
donors, the Global Fund to Fight AIDS,
TB and Malaria, or governments, or all
three, is necessary if existing plans for
improved TB control are to be fully im-
plemented.
Although budgeting for DOTS imple-
mentation has advanced enormously
over the past year, there is room for
improvement. Immediate priorities
include:
● finalizing budgets for the 5 coun-
tries that currently lack data i.e. the
Russian Federation, Zimbabwe,
Mozambique, Thailand, and South
Africa;
● ensuring that all budgets are
closely tied to the achievement of
targets. In particular, the total
number of patients to be treated
needs to be stated, and the budget
requirement explicitly linked to
this total; and
● filling existing gaps in budgets—
detailed breakdowns of the total
budget, and the funding sources
and funding gap for this budget,
are not yet available for Brazil,
Ethiopia, and Nigeria.
A more general limitation is that
most existing budgets focus on costs
specific to TB control only. They do not
include an assessment of costs to the
general health system, e.g. for staff and
buildings that are shared among differ-
ent types of patients. These resources
are essential for successful TB control
because they are used every time a pa-
tient makes an outpatient visit to a health
facility to collect drugs, or to monitor
sputum smear status, and every time a
patient is hospitalized. At present, the
implicit assumption in many budgets is
that these costs do not need to be in-
cluded because they are covered by gen-
eral government health budgets. In some
countries, this may be a reasonable as-
sumption. However, there are several
countries where the number of patients
to be treated will need to increase sub-
stantially if case detection targets are to
be met; and a few where patient num-
bers may increase even without an in-
crease in the proportion detected, due
to the impact of the HIV/AIDS epidemic.
In combination with scaling up of inter-
ventions in other priority areas (e.g. HIV/
AIDS and malaria), it is therefore impor-
tant that countries assess the extent to
which health systems have the capacity
to manage increased numbers of pa-
tients, or whether additional investment
is required. If additional investment is
required, it will be important to assess
the funding available for such invest-
ment, and to identify funding gaps. Such
analyses would also make the existing
budget data more comprehensive and
would improve the accuracy of current
estimates of total costs and funding gaps
in all HBC.
Finally, existing budgets propose
conspicuously small investments in new
interventions, or in specific actions to
increase case detection and cure rates.
At present, the total planned investment
in such interventions amounts to
US$ 24 million per year. We recommend
a closer scrutiny of budgets to verify that
this sum of money really will be sufficient
to reach targets for case detection and
cure.