global reef expedition final report
TRANSCRIPT

VOL
8

55

G L O B A L R E E F E X P E D I T I O N F I N A L R E P O R T
VOL
8
Samuel Purkis, PhD, Alexandra C. Dempsey, Renée D. Carlton,
Badi Samaniego, PhD, Katie Lubarsky, Philip P. Renaud
©2017 Khaled bin Sultan Living Oceans Foundation. All Rights Reserved. Science Without Borders®
The findings presented in this report were collected as part of the Global Reef Expedition through the support provided by His Royal Highness Prince Khaled bin Sultan.
This final report is submitted to fulfill the requirements of the Final Report for the Global Reef Expedition: Kingdom of Tonga Research Mission. This is in accordance with the research permit under an agreement between KSLOF and the Government of the Kingdom of Tonga, Ministry of Lands, Environment, Climate Change, and Natural Resources.
Khaled bin Sultan Living Oceans Foundation (KSLOF) was incorporated in California as a 501 (c)(3), public benefit, Private Operating Foundation in September 2000. The Living Oceans Foundation is dedicated to providing science-based solutions to protect and restore ocean health.
For more information, visit www.lof.org Facebook: www.facebook.com/livingoceansfoundation Twitter: @LivingOceansFdn
Khaled Bin Sultan Living Oceans Foundation 130 Severn Ave, Suite 100 Annapolis, MD 21403
Executive Director: CAPT Philip G. Renaud Interim-Chief Scientist: Dr. Samuel Purkis Coral Reef Ecologist: Alexandra C. Dempsey Marine Ecologist: Renée D. Carlton
Full Page Photographs by © Keith Ellenbogen/iLCP (Sections 2.0, 3.0, 5.0, page 47), and © Jurgen Fruend/iLCP (Cover, Section 4.0)
Citation: Global Reef Expedition: Kingdom of Tonga. Final Report. Purkis, S., Dempsey, A., Carlton, R., Samaniego, B., Lubarsky, K. and Renaud, P.G. (2017) Khaled Bin Sultan Living Oceans Foundation, Annapolis, MD. Vol 8. ISBN: 978-0-9975451-2-8

KI NG DOM OF TONGA
EXECUTIVE SUMMARY . . . . . . . . . . . . . . . . . . . . . . . . . . . . . . . . . . . . . . . . . . . 2
1.0 INTRODUCTION . . . . . . . . . . . . . . . . . . . . . . . . . . . . . . . . . . . . . . . . . . . . . . 4
2.0 METHODS
2.1 Site Descriptions. . . . . . . . . . . . . . . . . . . . . . . . . . . . . . . . . . . . . . . . . . . . . . 8
2.2 Habitat Mapping . . . . . . . . . . . . . . . . . . . . . . . . . . . . . . . . . . . . . . . . . . . . . . 82.2a) Satellite Imagery . . . . . . . . . . . . . . . . . . . . . . . . . . . . . . . . . . . . . . . . . . . . . 10
2.2b) Benthic Video . . . . . . . . . . . . . . . . . . . . . . . . . . . . . . . . . . . . . . . . . . . . . . . . 11
2.2c) Habitat Classifications . . . . . . . . . . . . . . . . . . . . . . . . . . . . . . . . . . . . . . . . . 11
2.2d) Acoustic Water Depth Soundings. . . . . . . . . . . . . . . . . . . . . . . . . . . . . . . . 13
2.3 Coral Reef Community Surveys . . . . . . . . . . . . . . . . . . . . . . . . . . . . . . . . . 142.3a) Benthic Cover Assessments . . . . . . . . . . . . . . . . . . . . . . . . . . . . . . . . . . . . 14
2.3b) Fish Assessments. . . . . . . . . . . . . . . . . . . . . . . . . . . . . . . . . . . . . . . . . . . . . 17
3.0 RESULTS
3.1 Habitat Mapping . . . . . . . . . . . . . . . . . . . . . . . . . . . . . . . . . . . . . . . . . . . . . 20
3.2 Benthic Community Assessment by Region . . . . . . . . . . . . . . . . . . . . . . . 223.2a) Ha’apai . . . . . . . . . . . . . . . . . . . . . . . . . . . . . . . . . . . . . . . . . . . . . . . . . . . . . . 22
3.2b) Vava’u . . . . . . . . . . . . . . . . . . . . . . . . . . . . . . . . . . . . . . . . . . . . . . . . . . . . . . 25
3.2c) Niuatoputapu. . . . . . . . . . . . . . . . . . . . . . . . . . . . . . . . . . . . . . . . . . . . . . . . . 28
3.3 Fish Community Assessment . . . . . . . . . . . . . . . . . . . . . . . . . . . . . . . . . . . 303.3a) Species Richness of Fish Assemblage . . . . . . . . . . . . . . . . . . . . . . . . . . . 30
3.3b) Density of Fish . . . . . . . . . . . . . . . . . . . . . . . . . . . . . . . . . . . . . . . . . . . . . . . 31
3.3c) Fish Biomass. . . . . . . . . . . . . . . . . . . . . . . . . . . . . . . . . . . . . . . . . . . . . . . . . 32
3.3d) Fish Size Distribution . . . . . . . . . . . . . . . . . . . . . . . . . . . . . . . . . . . . . . . . . . 34
4.0 DISCUSSION . . . . . . . . . . . . . . . . . . . . . . . . . . . . . . . . . . . . . . . . . . . . . . . 38
5.0 RECOMMENDATIONS . . . . . . . . . . . . . . . . . . . . . . . . . . . . . . . . . . . . . . . . 44
ACKNOWLEDGMENTS . . . . . . . . . . . . . . . . . . . . . . . . . . . . . . . . . . . . . . . . . . . 46
LITERATURE CITED . . . . . . . . . . . . . . . . . . . . . . . . . . . . . . . . . . . . . . . . . . . . . 48
APPENDICES . . . . . . . . . . . . . . . . . . . . . . . . . . . . . . . . . . . . . . . . . . . . . . . . . . 50
TABLE OF CONTENTS
KI NG DOM OF TONGA

2
EXECUTIVE SUMMARY
In April 2011, the Khaled bin Sultan Living Oceans Foundation (KSLOF) embarked
on the Global Reef Expedition (GRE)- the largest coral reef survey and mapping
expedition in history. The GRE was a rigorous five-year scientific mission to study coral
reefs around the world. The expedition was designed to assess the impact of
anthropogenic and natural disturbances on reef ecosystems, including runoff, climate
change, storm damage, and Crown-of-Thorns Starfish (COTS) outbreaks. The ultimate
goal of the Foundation’s research is to provide scientists, managers, and stakeholders
with recommendations that are indispensable for formulating an effective management
strategy for coral reefs and associated habitats. Herein, we report on a study that
KSLOF has undertaken to assess the health and resilience of the coral reefs in the
Kingdom of Tonga (KOT). The study took place in September-October 2013. The
Foundation quantitatively measured and categorized coral reef environments in
three regions of the KOT, Ha’apai, Vava’u, and around the island of Niuatoputapu.
This scientific mission involved 20 participants from numerous organizations around the world, who worked alongside scientists representing the government in the KOT, to gather the highest quality data. The mission in the KOT was conducted with the following objectives:
Develop detailed habitat and bathymetric maps of shallow marine habitats.
Evaluate the composition, structure, and health of coral reefs.
Assess the diversity and abundance of reef fish, including commercially valuable fish species.
Document the impacts of broad scale natural disturbances and patterns of recovery on the coral reef assemblage, with emphasis on storm and tsunami damage, and Crown-of-Thorns Starfish predation impacts.
The GRE utilized standardized sampling methods1 to map and survey coral reef benthic and fish communities at 58 dive sites throughout the KOT. More than 300 benthic coral reef surveys and 190 fish surveys were completed on SCUBA, and over 2,200 km2 of satellite imagery was collected and interpreted in to habitat and bathymetry maps.
HABITAT MAPPING
High resolution habitat and bathymetric maps were created for each of the locations surveyed in the KOT. The satellite images have a resolution of 2 m x 2 m. The habitat classifications (total of 41 habitats) very clearly define different substrate and reef environments in the lagoon and fore reefs, as well as vegetation and sand flats found on the emergent land. The habitat maps were used in conjunction with the bathymetric maps to calculate total area and depth distribution of each habitat type. This will be of great value to marine spatial planning efforts. Scientists and the public can use the maps, but marine managers may find them particularly

3
KI NG DOM OF TONGA
helpful in establishing areas for protection. These maps are freely accessible on the KSLOF online map portal (http://maps.lof.org/lof).
BENTHIC COVER ASSESSMENT
To assess the health of the reefs, KSLOF used a combination of collected data and peer-reviewed scientific literature to classify the reef systems of the KOT as being in either “good”, “moderate”, or “poor” conditions. These categories are based on overall live coral cover, algae, and invertebrate composition. We found that the KOT has, overall, what we define as “moderate” reef health. This means there is moderate live coral cover — 31% averaged across all sites visited — a similar value as compared to nearby island groups, such as Fiji and French Polynesia, which were also surveyed on the GRE. The only region where we observed higher than average COTS predation was in Vava’u, but the numbers were not high enough to classify the situation as a full-fledged COTS outbreak. Niuatoputapu was the only island that had been impacted by a natural disturbance, the 2009 American Samoan Tsunami, within 10 years prior to our survey. Here, we observed evidence of tsunami damage but also saw encouraging signs of recovery. Considering the few natural disturbances experienced in the area, we
expected the reefs to have a healthier benthic community and higher live coral cover than was recorded in the field. Possible reasons for this disparity include overfishing and overharvesting of sea cucumbers.
FISH COMMUNITY
Evidence of overfishing was apparent in data collected during our reef fish community surveys. Although the diversity of fish species observed at all sites was high, the overall biomass of fish recorded was low and dominated by small-bodied fish. These results are reason for concern for the long-term sustainability of the Tongan reef fish communities. Although economically important fish were recorded in our surveys, their numbers were relatively low and they did not contribute greatly to overall fish biomass. The only island surveyed with a high biomass of economically important fish species was Niuatoputapu. Here, the fishing pressure is likely lower than at other sites because the human population is smaller. Furthermore, it seems the large fishing vessels based out of Tonga’tapu rarely visit Niuatoputapu. As was observed throughout the Ha’apai and Vava’u regions, there is a disparity in the fish community where there is a higher proportion of fish in lower trophic levels than in higher trophic levels. The imbalance of small-bodied fish, and lack of large predatory fish, may also have an impact on the benthic communities. A healthy benthic community needs a well-balanced fish and invertebrate community to control growth of macroalgae and cyanobacteria. Conversely, to maintain a healthy fish community, a healthy benthic community is needed as corals and the structures they create provide shelter to many reef fish. When one of these communities becomes imbalanced, as is expected of the fish community of the KOT, it can have detrimental effects on the overall coral reef community.
The Khaled bin Sultan Living Oceans Foundation hopes the data presented in this report will be used by the people of the KOT to effectively protect and manage the benthic and fish community resources of the region. We believe that with continued and improved management practices, the reefs throughout the KOT will be able to thrive.
Evidence of overfishing was apparent
in data collected during our
reef fish community surveys.
Although the diversity of fish
species observed at all sites
was high, the overall biomass
of fish recorded was low and
dominated by small-bodied fish.

INTRODUCTION
4
The Khaled bin Sultan Living Oceans Foundation (KSLOF) embarked on the Global Reef Expedition (GRE) to assess the health of the coral reef communities around the world. From September-October 2013, scientists from KSLOF visited the Kingdom of Tonga (KOT) to gather data on coral reef benthic and fish communities around three of the KOT’s island groups: Ha’apai, Vava’u, and Niua, specifically around the island of Niuatoputapu. The research project was designed with the following objectives:
Develop detailed habitat and bathymetric maps of shallow marine habitats.
Evaluate the composition, structure, and health of coral reefs.
Assess the diversity and abundance of reef fish, including commercially valuable fish species.
Document the impacts of broad scale natural disturbances and patterns of recovery on the coral reef assemblage with emphasis on storm damage, tsunami, and Crown-of-Thorns Starfish predation impacts.
The KOT is situated in the Central South Pacific Ocean on the boundary between the Pacific and Australian tectonic plates (Figure 1). The KOT’s islands are either of volcanic origin or sit atop uplifted Pleistocene reef terraces1. The area encompassing the KOT Exclusive Economic Zone (EEZ) covers 700,000 km2. Within the EEZ the reef area is estimated to measure approximately 1,500 km2 and is distributed throughout the island groups2. Ha’apai contains the largest total reef area. The island groups visited on the GRE contain a wide range of reef types, such as: lagoonal patch reefs, barrier reefs, wave-cut raised reefs, and platform reefs. These reef types are home to over 190 species of scleractinian corals (also called stony or hard corals) and 220 species of reef fish1.
Throughout the past four decades prior to the GRE survey, the KOT has experienced recurrent natural disturbances, particularly tropical storms and cyclones (1982, 1995, 1997, 1999, 2000), tsunamis (2009), El Niño warm water induced coral bleaching, and Crown-of-Thorns Starfish (COTS) outbreaks (1970s and 1980s, 1992)1,3,4. These natural disturbances, in conjunction with chronic anthropogenic stressors, (originating in human activity) such as fishing pressure, aquarium trade collection, and nutrient runoff from land based development, have had detrimental effects on the Kingdom of Tonga’s reefs5. These impacts have been well documented around the island of Tonga’tapu where, in many areas, the overall live coral cover averages less than 20%3. In order to gain a better understanding of the undisturbed baseline reef health, the KSLOF GRE specifically targeted sites that have seen minimal impact from major human populations. For instance, KSLOF traveled to the island groups north of Tonga’tapu, to Ha’apai, Vava’u, and Niuatoputapu, to gather comprehensive baseline data for the reefs surrounding these understudied regions. The island of Niuatoputapu is part of the Niua group, which is the farthest north and the most remote location surveyed on the GRE mission to the KOT.
A recent study by the United States National Oceanic and Atmospheric Administration (NOAA), has shown that
1.0
Whereas the benthic
communities around the KOT
have felt the effects of natural
and anthropogenic disturbances
near highly populated areas,
it is the fish populations that have perhaps suffered the most.

5
KI NG DOM OF TONGA
although the KOT is located in close proximity to other island nations such as American Samoa, Fiji, and Wallis and Futuna, the reef ecosystems are relatively isolated by oceanographic currents6. This isolation means that the pelagic coral and fish larvae that replenish and settle on Tongan reefs are most likely coming from a self-seeding coral reef ecosystem. Essentially, local larvae populations are recolonizing Tongan reefs after a major disturbance. On the basis of prevailing currents, the only island group that might conceivably have interaction with nearby nations is the farthest north Niua group, which perhaps receives pulses of coral and fish larvae from the islands of American Samoa, albeit rarely6. The self-seeding coral reef ecosystem of the KOT may encounter difficulties recovering should prolonged large-scale disturbances occur, especially if there are compounding anthropogenic influences impacting natural reef recovery.
Whereas the benthic communities around the KOT have felt the effects of natural and anthropogenic disturbances near highly populated areas, it is the fish populations that have perhaps suffered the most. Fishing pressure from local fishers has had harmful effects on the fish biomass around the reefs of Tonga’tapu. A study from the mid 1950’s suggested dynamite fishing was having detrimental effects on the reef habitats and observed, in many areas, that only large fish were found at depths greater than 30 m7. Although dynamite fishing has since been banned, other fishing practices, such as spear fishing, long line fishing, and net fishing were swiftly mastered, local human populations grew, and the amount of fish landed continued to increase. Fishing regulations have not been able to keep up with the demand from both local subsistence fishers and fisheries exports1. The combined effects of overfishing practices and minimal recruits (fish and coral) coming from outside reef systems could lead to a drastic decline in the overall health of the
coral reefs and fish communities.
The KOT has established five Marine Protected Areas (MPA’s) around the island of Tonga’tapu and six Specially Managed Areas (SMAs) around the islands of Ha’apai and Vava’u8. SMAs are community based fisheries management areas that are typically designated and managed by the coastal community adjacent to the area. Numerous documents published by the Ministry of Environment and Climate Change suggest gaps in data have prevented the establishment of more of these protected areas1,3,5,8–11. This report is intended to fill some of these data gaps and will outline suggested areas for protection. With increased community participation and improved resource management, we are optimistic that the Tongan reefs will show evidence of resilience and continue to thrive for generations to come.
BOUNDARY OF TONGA EXCLUSIVE ECONOMIC ZONE (EEZ).Figure 1

K I N G D O M O F T O N G A

METHODS
8
Table 1
R EG ION DIVE SITESNUMBER
OF BENTHIC TRANSECTS
NUMBER OF FISH
TRANSECTS
HA’APAI 32 176 112
VAVA’U 20 31 19
NIUATOPUTAPU 6 107 61
Total 58 314 192
TOTAL NUMBER OF SURVEYS COMPLETED
AT EACH LOCATION.
SITE DESCRIPTIONS The GRE mapped and surveyed coral reefs around the three northern island groups
in the KOT. The survey sites were selected with an effort to include areas both
outside and within designated SMAs, as well as different proximities from human
population centers to better understand the impacts of humans on the health of
Tonga’s reefs. A total of 58 dive sites were surveyed, among which 314 benthic
habitat transects and 192 fish surveys were completed. A list of each dive site visited
is found in Appendix 1, including site name, date visited, latitude, longitude, closest
island, exposure, and reef type. The dive sites were selected based on accessibility
by boat and with the goal of including all reef habitats (as defined in the habitat
maps below). Table 1 shows the total number of surveys conducted in each group.
A total of 58 dive sites were
surveyed, among which
314 benthic habitat transects and 192 fish
surveys were completed.
2.1
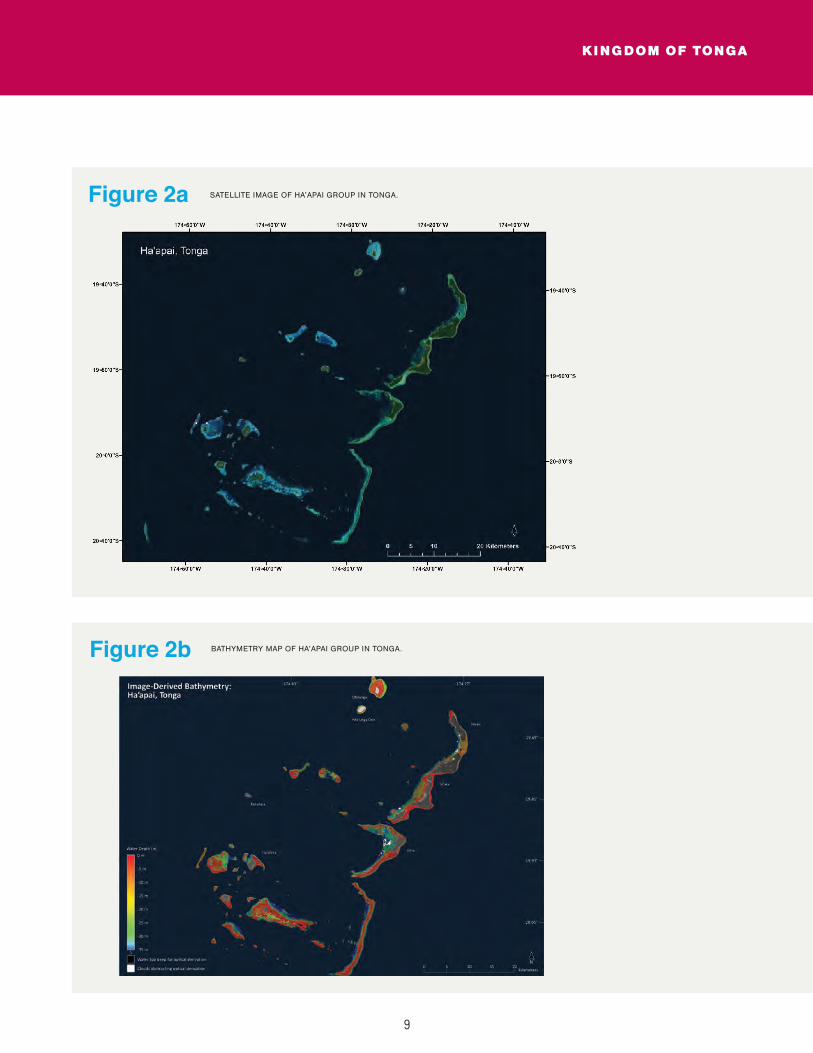
2.2 HABITAT MAPPING Using multispectral WorldView-2 satellite imagery obtained from DigitalGlobe Inc., in combination with data obtained from aerial surveys and ground-truthing, high resolution bathymetric maps and thematic habitat maps were created for shallow marine environments found within the lagoon and fore reefs (see examples of map outputs in Figures 2a-c). The remote sensing data and their derivatives will be useful not only for marine spatial planning, but also as a reference for future research on the KOT’s coral reefs. The maps extend from the
shoreline to approximately 25 m water depth. Prior to the field surveys, an aerial survey of each island’s coastline and adjacent shallow marine habitat was undertaken. Ground-truthing, which was used to define habitat classes, and guide interpretation of the remote sensing data, included continuous acquisition of depth soundings, drop-camera deployment, samples of sediment and hard substrates, snorkel and dive assessments, and fine scale photo-transect surveys.
9
KI NG DOM OF TONGA
SATELLITE IMAGE OF HA’APAI GROUP IN TONGA.Figure 2a
BATHYMETRY MAP OF HA’APAI GROUP IN TONGA.Figure 2b

METHODS
10
2.2a
SATELLITE IMAGERYA total of 2,212 sq. km of DigitalGlobe Inc. WorldView-2 (8 band) satellite imagery was acquired for the three regions mapped. The satellite images had a spatial resolution of 2×2 m (each pixel covers a 4 m2 area) enabling real-time navigation in the field to locate features of interest. The team used the scenes in conjunction with a differential
GPS device to navigate throughout the islands. Modelers used the imagery, combined with the ground-truthing data, to create bathymetric and benthic habitat maps that can be found on the Khaled bin Sultan Living Oceans Foundation World Web Map Portal (http://maps.lof.org/lof).
HABITAT MAP OF HA’APAI GROUP IN TONGA.Figure 2c
A total of 2,212 sq. km of DigitalGlobe Inc. WorldView-2 (8
band) satellite imagery was acquired for the three regions mapped.

11
KI NG DOM OF TONGA
Figure 3 SEAVIEWER UNDERWATER VIDEO SYSTEM, OR DROP-CAM, USED
TO RECORD BENTHIC COMPOSITION AROUND EACH ISLAND.
2.2b
BENTHIC VIDEOAn underwater tethered video camera, called a drop-cam, was used to gather video of the benthic composition at each survey site (Figure 3). At each point, the drop-cam was suspended from the survey boat enabling it to “fly” along the sea floor recording video for 15-60 seconds. During this time, the laptop operator watched the video in real-time and guided the drop-cam operator to raise or lower the camera. In this manner, damage to marine life was prevented.
The video was recorded on a ruggedized laptop, the geographic position, time, date, boat heading, and boat speed were digitally etched into the video stream. Drop-cam deployment was limited to depths shallower than 40 m due to the limited length of the tether cable (50 m). Clips of some of the drop-cams are also included as a layer of the GIS maps produced on the KSLOF online Map Portal.
2.2c
HABITAT CLASSIFICATIONSHabitat classifications of all the marine and terrestrial habitat types were determined using the satellite imagery, ground-truthing, and benthic video surveys. The combination of all data collected was used for development of a habitat classification scheme and training of eCognition software to develop object-based classification models. A total of 41 habitat types were defined (Table 2). When calculating, and presenting total area coverage of the different habitat
classifications, multiple habitat types were sometimes combined (Table 2). For example, for backreef coral, we combined backreef coral bommies and backreef coral framework to represent this broad reef environment. A more detailed description of each habitat classification can be found online in the Khaled bin Sultan Living Oceans Foundation’s interactive World Web Map portal under the “Information” toggle.

METHODS
12
HAB ITAT CLASS I FICATION G ROU P
Backreef Coral Back reef coral bommiesBack reef coral framework
Deep Forereef Slope
Deep Lagoonal water
Lagoonal Coral Lagoonal Acropora frameworkLagoonal floor coral bommiesLagoonal fringing reefsLagoonal patch reefsLagoonal pinnacle reefs massive coral dominate
Lagoonal Substrate Back reef pavementBack reef rubble dominatedBack reef sediment dominatedLagoonal floor barrenLagoonal sediment apron sediment dominated
Lagoonal Macroalgae Dominated Substrate Lagoonal floor macroalgae on sedimentLagoonal pinnacle reefs- calcareous red algae conglomerateLagoonal sediment apron macroalgae on sediment
Nearshore Algal Communities Coralline algal ridgeDense macroalgae on sediment
Dense Seagrass Meadows
Shallow Forereef Community Shallow fore reef slopeShallow fore reef terrace
Fore reef sand flats
Terrestrial Beach sandInland watersMud flatsTerrestrial vegetationUnvegetated terrestrial
Mangroves
Urban
Table 2 HABITAT CLASSIFICATION GROUPING. TABLE SHOWS THE SPECIFIC HABITAT CLASSIFICATION AREAS
THAT WERE COMBINED TO DETERMINE AREA COVERAGE OF A MORE GENERAL HABITAT TYPE.
13
KI NG DOM OF TONGA
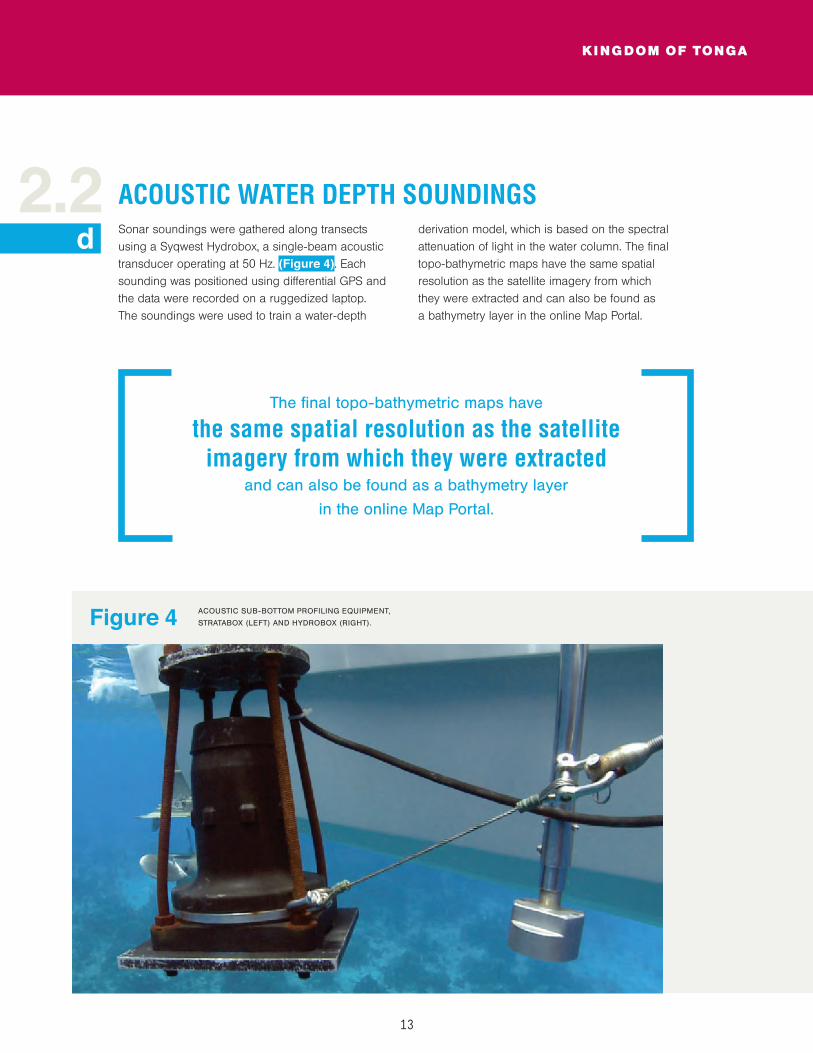
Figure 4 ACOUSTIC SUB-BOTTOM PROFILING EQUIPMENT,
STRATABOX (LEFT) AND HYDROBOX (RIGHT).
The final topo-bathymetric maps have
the same spatial resolution as the satellite imagery from which they were extracted
and can also be found as a bathymetry layer
in the online Map Portal.
2.2d
ACOUSTIC WATER DEPTH SOUNDINGSSonar soundings were gathered along transects using a Syqwest Hydrobox, a single-beam acoustic transducer operating at 50 Hz. (Figure 4). Each sounding was positioned using differential GPS and the data were recorded on a ruggedized laptop. The soundings were used to train a water-depth
derivation model, which is based on the spectral attenuation of light in the water column. The final topo-bathymetric maps have the same spatial resolution as the satellite imagery from which they were extracted and can also be found as a bathymetry layer in the online Map Portal.
METHODS
14
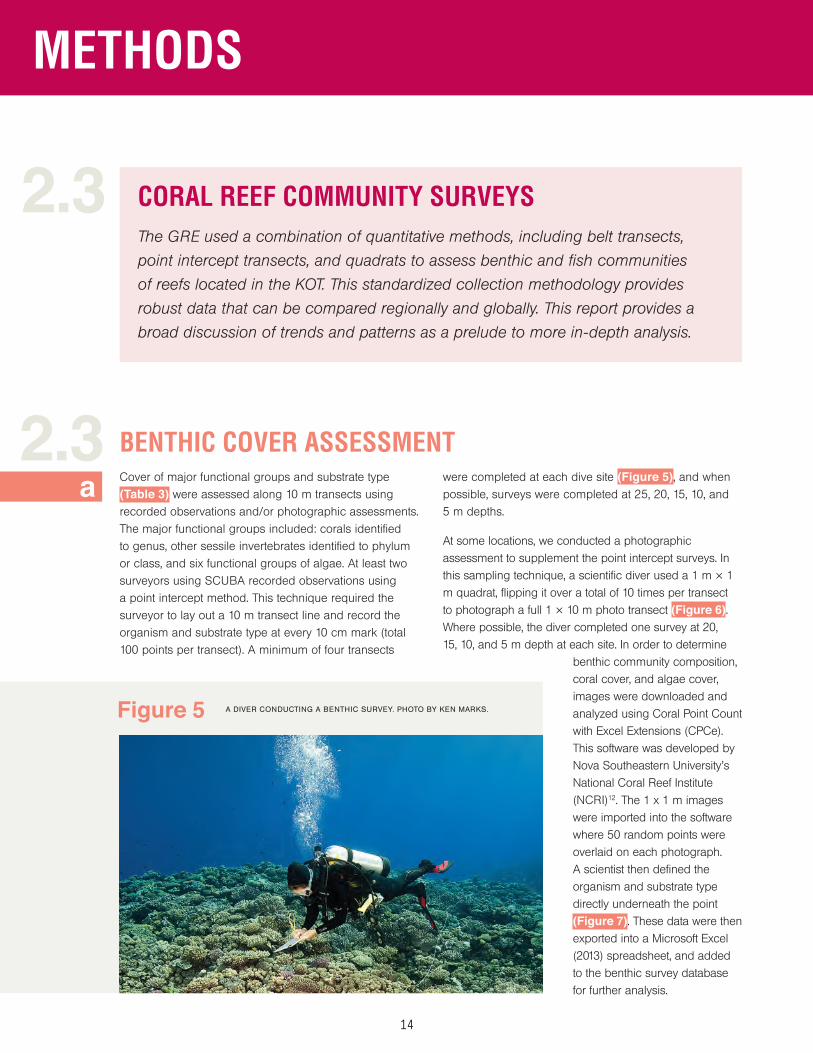
BENTHIC COVER ASSESSMENTCover of major functional groups and substrate type (Table 3) were assessed along 10 m transects using recorded observations and/or photographic assessments. The major functional groups included: corals identified to genus, other sessile invertebrates identified to phylum or class, and six functional groups of algae. At least two surveyors using SCUBA recorded observations using a point intercept method. This technique required the surveyor to lay out a 10 m transect line and record the organism and substrate type at every 10 cm mark (total 100 points per transect). A minimum of four transects
were completed at each dive site (Figure 5), and when possible, surveys were completed at 25, 20, 15, 10, and 5 m depths.
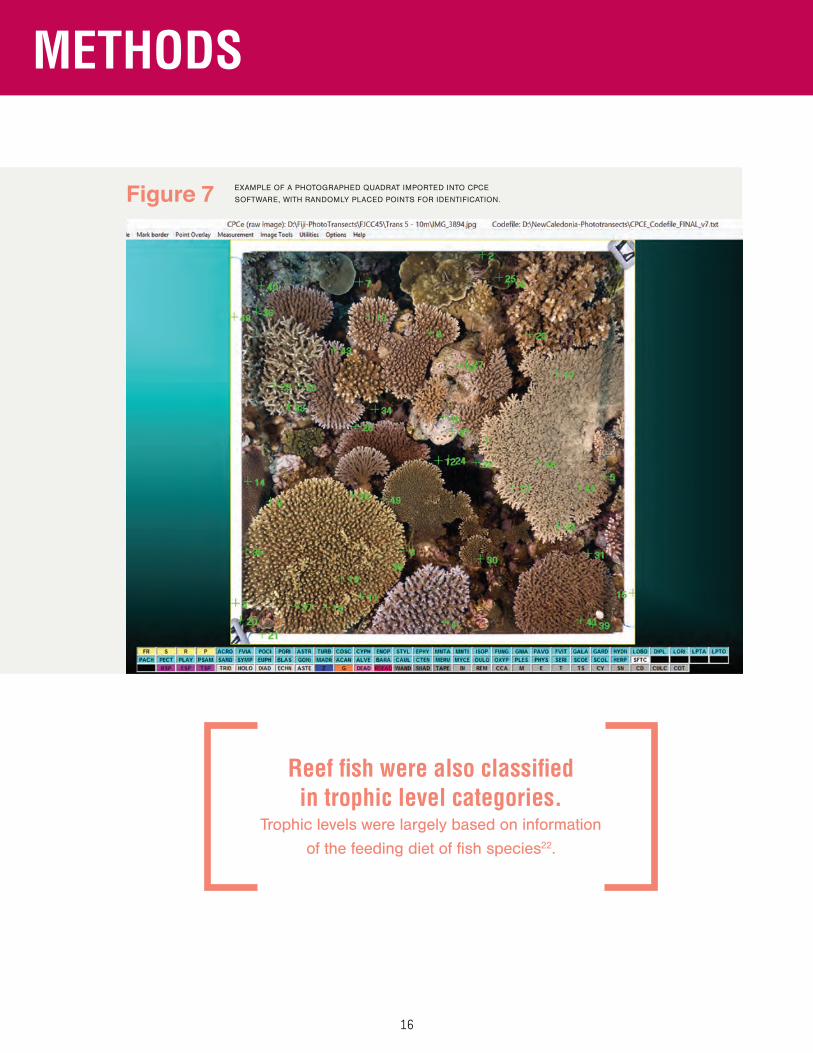
At some locations, we conducted a photographic assessment to supplement the point intercept surveys. In this sampling technique, a scientific diver used a 1 m × 1 m quadrat, flipping it over a total of 10 times per transect to photograph a full 1 × 10 m photo transect (Figure 6). Where possible, the diver completed one survey at 20, 15, 10, and 5 m depth at each site. In order to determine
benthic community composition, coral cover, and algae cover, images were downloaded and analyzed using Coral Point Count with Excel Extensions (CPCe). This software was developed by Nova Southeastern University’s National Coral Reef Institute (NCRI)12. The 1 x 1 m images were imported into the software where 50 random points were overlaid on each photograph. A scientist then defined the organism and substrate type directly underneath the point (Figure 7). These data were then exported into a Microsoft Excel (2013) spreadsheet, and added to the benthic survey database for further analysis.
CORAL REEF COMMUNITY SURVEYS The GRE used a combination of quantitative methods, including belt transects,
point intercept transects, and quadrats to assess benthic and fish communities
of reefs located in the KOT. This standardized collection methodology provides
robust data that can be compared regionally and globally. This report provides a
broad discussion of trends and patterns as a prelude to more in-depth analysis.
2.3
2.3a
Figure 5 A DIVER CONDUCTING A BENTHIC SURVEY. PHOTO BY KEN MARKS.

15
KI NG DOM OF TONGA
The benthic substrate cover percentages were calculated for each island as the average percentage of all transects collected at that island, binned first by depth, then by site. The percentage of each substrate type was calculated by dividing the total number of samples observed in each depth on each transect by the total number of points recorded, multiplied by 100. The average percentage of all transects at the island is presented as the measure of each substrate type. To further analyze the coral and algae cover, the sum of the specific algae types or coral genus recorded on each transect was divided by the total number of algae or coral observed per transect. The average of the percentages for each algae type is presented in Figures 11, 14, and 16 in the Results.
To measure overall coral diversity (by genus), we used the Simpson Index of Diversity which is commonly used to characterize species diversity in a community13. This index uses the total number of individual coral colonies of a specific genus observed per island, and the total number of genera to provide a number to represent the total diversity of the island community. Using this index, the diversity will fall within a range of 0-1 with 0 being low diversity, and 1 being the most diverse.
B E NTH IC HAB ITAT
SUBSTRATE TYPE
Live Coral
Dead Coral
Fused Rubble
Pavement
Rubble
Sand/Sediment
Recently Dead Coral
LIVE COVER
Algae
Macroalgae
Crustose Coralline Algae (CCA)
Erect Coralline Algae
Turf Sediment
Turf
Cyanobacteria
Other Invertebrates
Coral (to Genus)
Table 3 CLASSIFICATION OF BENTHIC HABITAT RECORDED
DURING BENTHIC TRANSECT SCUBA SURVEYS.
Figure 6 A DIVER TAKES A PHOTO OF A 1M X 1M SQUARE QUADRAT. PHOTO BY PHILIP RENAUD.
METHODS
16
Figure 7 EXAMPLE OF A PHOTOGRAPHED QUADRAT IMPORTED INTO CPCE
SOFTWARE, WITH RANDOMLY PLACED POINTS FOR IDENTIFICATION.
Reef fish were also classified in trophic level categories.
Trophic levels were largely based on information
of the feeding diet of fish species22.

17
KI NG DOM OF TONGA
FISH ASSESSMENTSReef fish surveys were conducted by one surveyor at selected locations (atolls, islands and reefs) at each of the island groups. The survey transects covered depths between 1 to 22 m, but the majority of the surveys were between 5 to 20 m depth (Figure 8).
The fish assemblages at the dive sites were surveyed following a fish visual census technique modified from the survey principles described by English et al. (1994)14. The diver identified and counted fish along a 30 × 4 m transect. Each transect survey was completed in about 10 to 15 minutes. Transects were deployed at deep (>12m) and shallow (<10m) sections of the reefs, as allowed by the morphology of the dive site. At least 2 transects at the deep and another 2 transects at the shallow reefs were surveyed by the diver.
The fish assemblages were characterized in terms of species richness, abundance and standing stock biomass. Fish were identified to species level whenever possible with the aid of photographic fish guides15–18. Total lengths were estimated to the nearest centimeter. The abundance of each species of a particular size was estimated by actual counts or by cluster in the case of a school of fish. The biomass of each species was then computed
using the formula W=aLb where W is the weight in grams, L is the length of the fish in centimeters, and a and b are the species specific growth constants derived from the length-weight relationships19–23. Abundance and biomass data were then converted and represented as density by individuals/100m2 and biomass by kg/100m2.
Reef fish were also classified in trophic level categories. Trophic levels were largely based on information of the feeding diet of fish species22. The correspondence between trophic levels and feeding habits is not strictly straightforward or well-defined because of wide overlaps in the food items consumed by different species24. Hence, the trophic levels under which a specific species is classified may be considered elastic and a mean of its diet items. Trophic levels were expressed numerically and broadly represented herbivores (2.0 – 2.5), coralivores (2.6 – 3.0), planktivores (3.1 – 3.5), benthic carnivores (3.6 - 4.0), and piscivores (4.1 – 4.5)25. By analyzing the fish communities using trophic levels, we can understand the fish community structures and determine how fishing pressures might be affecting the fish communities. Fish in trophic levels 2.0-2.5 and 2.5-3.0 are typically small in size and are not considered important to local fisheries26. These fish include damselfish, tangs, surgeonfish, butterflyfish, and a few small-bodied parrotfish. Fish in trophic level 3.0-3.5 and 3.5-4.0 include larger bodied herbivores, planktivores, omnivores, or carnivores that feed on small benthic invertebrates. Fish classified in these ranges include wrasses, and some species of butterflyfish, damselfish, hogfish, goatfish, snappers, and triggerfish. Fish falling in the trophic level 4.0-4.5 are typically considered top predators and prey on finfish of the lower trophic levels. These predatory fish include large wrasse, grouper, hawksfish, snapper, goatfish, and sharks. The majority of the fish important to local fisheries are found in trophic levels 3.5-4.0 and 4.0-4.526. Fish that are classified in trophic levels 2.0-3.0 are usually important indicator species that contribute to the health of the reef by providing such services as cropping algal growth which otherwise would impede the settlement of juvenile corals27,28.
b
Figure 8 A SCIENTIFIC SCUBA DIVER RECORDS FISH ALONG
A TRANSECT LINE. PHOTO BY KEN MARKS.
2.3


K I N G D O M O F T O N G A
3.0

RESULTS
20
HABITAT MAPPINGOf the total area surveyed throughout the KOT, the largest area mapped was the Ha’apai island group. A total of 2,397 km2 of satellite imagery, 323 drop-cams and over 900,000 depth soundings were used to map the region of Ha’apai visited on the GRE. The second largest area mapped was Vava’u using 773 km2 of satellite imagery, 174 drop-cams, and nearly 55,000 depth soundings. The habitat area mapped around Niuatoputapu required 130 km2 of satellite imagery, 27 drop-cams, and almost 14,000 depth soundings for classification.
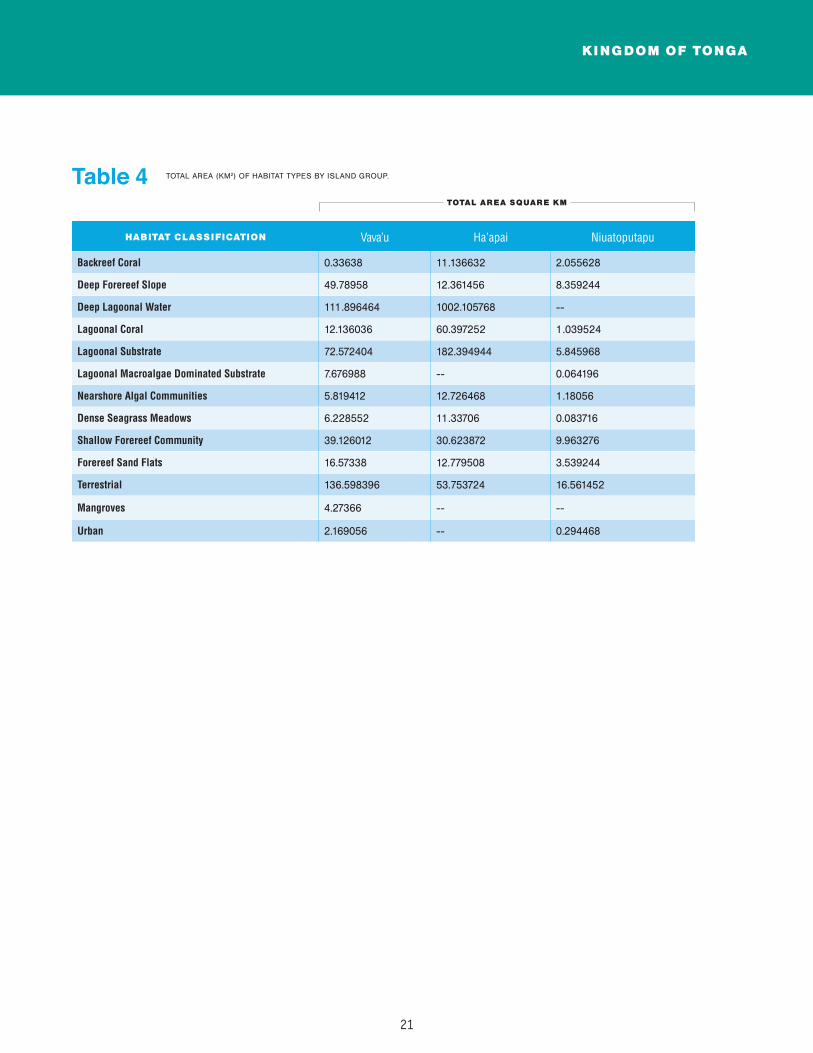
In both Vava’u and Ha’apai, the dominant marine habitats were deep lagoonal water measuring 112 km2 in Vava’u and nearly 1,000 km2 in Ha’apai (Table 4). Deep lagoonal water is described as being greater than 30 m in depth. The lagoon around Niuatoputapu was very shallow, therefore no area was mapped as deep water. Lagoonal coral covered 60 km2 in Ha’apai, 12 km2 in Vava’u and 1 km2 in Niuatoputapu. Lagoonal substrate dominated by macroalgae accounted for the least amount of area in all three regions. Interestingly, there were no macroalgae-dominated lagoonal substrates in Ha’apai, however, lagoonal pinnacle reefs made up of calcareous red algae conglomerate were found solely in the Ha’apai group.
Within the lagoon, nearshore algal communities and dense seagrass meadows were typically located in close proximity to each other throughout all three of the mapped areas. Together they covered a total of 24 km2 in Ha’apai, 12 km2 in Vava’u, and 1.2 km2 in Niuatoputapu. Mangroves, another important marine habitat, were only found around the islands of Vava’u, measuring over 4 km2. Both seagrass beds and mangroves are critical habitats that deserve acute attention when establishing management areas. This pair of habitats often act as nurseries to numerous reef and nearshore fish species29–31, particularly those of interest to local fisheries such as parrotfish (Scaridae) and snapper (Lutjantidae) species.
The region with the largest area of fore reef communities was Vava’u. The dominant habitats were the deep fore reef slope covering 112 km2, followed by shallow fore reef community measuring 39 km2, and fore reef sand flats covering 17 km2 in this region. In both Ha’apai and Niuatoputapu, the dominant fore reef habitat was the shallow fore reef community measuring 30 km2 and 10 km2, consecutively. Both the shallow fore reef community and the deep fore reef slope habitat classifications are described as dominated by scleractinian coral communities, either by Acropora or Porites, particularly on the deep fore reef slope, and Pocillopora and Acropora or calcareous red algae in the shallow fore reef communities.
All the detailed maps of the islands visited in the KOT, along with a detailed description of the habitat classifications, can be found on the KSLOF interactive map portal. GIS data are available upon request.
3.1
The region with the largest area of
fore reef communities was Vava’u.
In both Ha’apai and
Niuatoputapu, the dominant
fore reef habitat was the
shallow fore reef community
measuring 30 km2 and
10 km2, consecutively.
21
KI NG DOM OF TONGA
HABITAT CLASSIFICATION Vava’u Ha’apai Niuatoputapu
Backreef Coral 0.33638 11.136632 2.055628
Deep Forereef Slope 49.78958 12.361456 8.359244
Deep Lagoonal Water 111.896464 1002.105768 --
Lagoonal Coral 12.136036 60.397252 1.039524
Lagoonal Substrate 72.572404 182.394944 5.845968
Lagoonal Macroalgae Dominated Substrate 7.676988 -- 0.064196
Nearshore Algal Communities 5.819412 12.726468 1.18056
Dense Seagrass Meadows 6.228552 11.33706 0.083716
Shallow Forereef Community 39.126012 30.623872 9.963276
Forereef Sand Flats 16.57338 12.779508 3.539244
Terrestrial 136.598396 53.753724 16.561452
Mangroves 4.27366 -- --
Urban 2.169056 -- 0.294468
TOTAL AR EA SQUAR E KM
Table 4 TOTAL AREA (KM2) OF HABITAT TYPES BY ISLAND GROUP.
RESULTS
22
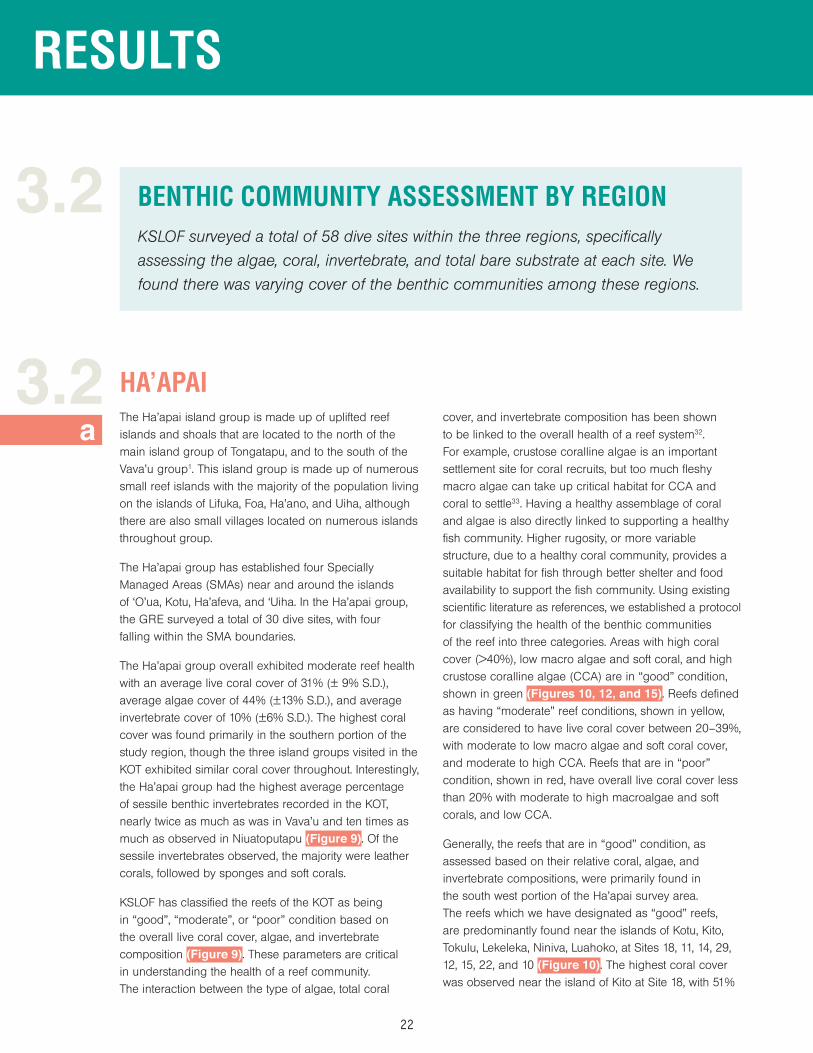
HA’APAIThe Ha’apai island group is made up of uplifted reef islands and shoals that are located to the north of the main island group of Tongatapu, and to the south of the Vava’u group1. This island group is made up of numerous small reef islands with the majority of the population living on the islands of Lifuka, Foa, Ha’ano, and Uiha, although there are also small villages located on numerous islands throughout group.
The Ha’apai group has established four Specially Managed Areas (SMAs) near and around the islands of ‘O’ua, Kotu, Ha’afeva, and ‘Uiha. In the Ha’apai group, the GRE surveyed a total of 30 dive sites, with four falling within the SMA boundaries.
The Ha’apai group overall exhibited moderate reef health with an average live coral cover of 31% (± 9% S.D.), average algae cover of 44% (±13% S.D.), and average invertebrate cover of 10% (±6% S.D.). The highest coral cover was found primarily in the southern portion of the study region, though the three island groups visited in the KOT exhibited similar coral cover throughout. Interestingly, the Ha’apai group had the highest average percentage of sessile benthic invertebrates recorded in the KOT, nearly twice as much as was in Vava’u and ten times as much as observed in Niuatoputapu (Figure 9). Of the sessile invertebrates observed, the majority were leather corals, followed by sponges and soft corals.
KSLOF has classified the reefs of the KOT as being in “good”, “moderate”, or “poor” condition based on the overall live coral cover, algae, and invertebrate composition (Figure 9). These parameters are critical in understanding the health of a reef community. The interaction between the type of algae, total coral
cover, and invertebrate composition has been shown to be linked to the overall health of a reef system32. For example, crustose coralline algae is an important settlement site for coral recruits, but too much fleshy macro algae can take up critical habitat for CCA and coral to settle33. Having a healthy assemblage of coral and algae is also directly linked to supporting a healthy fish community. Higher rugosity, or more variable structure, due to a healthy coral community, provides a suitable habitat for fish through better shelter and food availability to support the fish community. Using existing scientific literature as references, we established a protocol for classifying the health of the benthic communities of the reef into three categories. Areas with high coral cover (>40%), low macro algae and soft coral, and high crustose coralline algae (CCA) are in “good” condition, shown in green (Figures 10, 12, and 15). Reefs defined as having “moderate” reef conditions, shown in yellow, are considered to have live coral cover between 20–39%, with moderate to low macro algae and soft coral cover, and moderate to high CCA. Reefs that are in “poor” condition, shown in red, have overall live coral cover less than 20% with moderate to high macroalgae and soft corals, and low CCA.
Generally, the reefs that are in “good” condition, as assessed based on their relative coral, algae, and invertebrate compositions, were primarily found in the south west portion of the Ha’apai survey area. The reefs which we have designated as “good” reefs, are predominantly found near the islands of Kotu, Kito, Tokulu, Lekeleka, Niniva, Luahoko, at Sites 18, 11, 14, 29, 12, 15, 22, and 10 (Figure 10). The highest coral cover was observed near the island of Kito at Site 18, with 51%
BENTHIC COMMUNITY ASSESSMENT BY REGIONKSLOF surveyed a total of 58 dive sites within the three regions, specifically
assessing the algae, coral, invertebrate, and total bare substrate at each site. We
found there was varying cover of the benthic communities among these regions.
3.2
3.2a

23
KI NG DOM OF TONGA
(±19% S.D.) live coral cover. The sites designated as having “good” reefs in the Ha’apai group are dominated by a mix of live Acropora and CCA which encourages coral recruits to settle in the area33. Sites with the worst reef conditions are sites 3, 16, 7, and 25. These “poor” sites have some of the lowest coral cover recorded in the KOT, particularly Site 25, situated near the island of ‘Uiha (Figure 10), with only 8% (±4% S.D.) coral cover. This site had very small corals with a moderate mix of
algae, including greater amounts of erect calcareous algae, such as Halimeda, than recorded elsewhere, and abundant patches of macroalgae and cyanobacteria colonizing dead parts of coral skeletons. It is worth noting that Sites 3 and 25 are located within a channel connecting the lagoon to the open ocean, flowing between ‘Uiha and Uoleva, and the stronger current is likely having an impact on the benthic communities, it could be a driving factor in the lower coral cover.
Figure 9 AVERAGE BENTHIC COVER (%) OF EACH ISLAND GROUP SURVEYED IN THE KINGDOM OF TONGA.
THE SUBSTRATE TYPES ARE BARE SUBSTRATE, ALGAE, LIVE CORAL, AND INVERTEBRATES.
ALGAE CORAL INVERTEBRATEBARE SUBSTRATE

RESULTS
24
Algae accounted for 44% of the mean live cover in Ha’apai (Figure 11). The algae composition of Ha’apai was healthy, with CCA being the dominant algae type observed at nearly all sites. This is encouraging — high CCA can be taken to evidence that there is a relatively healthy fish community34, and CCA acts as a settlement site for new coral recruits33. The next most dominant algae type was turf algae. The sites with the lowest coral cover were dominated by algae covering up to 85% (±5% S.D.) of the benthic substrate, primarily dominated by turf and erect coralline algae. One interesting observation was the higher occurrence of cyanobacteria when compared to the surrounding reefs. There were numerous sites, particularly Sites 1, 15, and 28, with abnormally high levels where the cyanobacteria accounted for up to 34% (± 41% S.D.) of the total algae observed.
The overall coral diversity (by genus) in the Ha’apai group was relatively high. Interestingly, some of the sites with the lowest diversity had some of the highest coral cover as these were made up of monospecific stands of corals, as is the case at Site 18 where Acropora was the dominant genus. One site that had noticeably high coral diversity was Site 31, which also had moderate coral cover, measuring 35% (±9% S.D.). This high diversity (0.91 on the Simpson Index of Diversity) and moderate coral cover is an encouraging finding. Over time and with protection, this reef will likely be able to be designated as a healthy reef. A fair number of the reefs designated as moderate had high diversity, which is encouraging to the region as it means there is a sufficient flow of new coral larva successfully colonizing the reefs.
Figure 10HA’APAI GROUP RANKED DIVE SITES. GREEN INDICATES A REEF WITH “GOOD” REEF HEALTH, AS ASSESSED
ON THE BASIS OF THEIR RELATIVE CORAL, ALGAE AND INVERTEBRATE COMPOSITIONS, YELLOW HAS “MODERATE” REEF
HEALTH, AND RED INDICATES “POOR” REEF HEALTH.
No Take Zone
Existing SMA
Poor Condition
Moderate Condition
Good Condition

25
KI NG DOM OF TONGA
VAVA’UThe Vava’u island group is made up of uplifted reefs1, with a total land area of 121 km2. The largest reef islands of the group are Vava’u, Kapa, Hunga, and Nuapapu with nearly all of the local population living on the island of Vava’u. The islands create a number of bays and coves that host many different marine habitats such as seagrass beds, mangrove communities, sand flats, algal communities, and a diverse array of coral reef assemblages1.
There are two designated SMAs in the Vava’u group, around the islands of Ovaka and Taunga, with three new proposed areas currently under review. KSLOF conducted surveys both inside and outside these existing reserves.
The benthic community in Vava’u, similar to the Ha’apai group, had overall moderate reef health with an average coral cover of 34% (±10% S.D., Figure 9). Algae accounted for nearly 50% (±12% S.D.) of the live benthic cover with CCA being the dominant algae type. The dominant coral genera were Acropora and Pocillopora with some sites having astoundingly large Porites colonies (Figure 13).
The areas with “good” reef conditions were found at Sites 44, 34, 52, 38, 47, 45, and 35, near the islands of Ovaka, Vaka’eitu, ‘Euaiki, Vav’u, Luahiapo, Mu’omu’a, and Vaka’eitu (Figure 12). These sites had live coral cover ranging from 42-51% with the
3.2b
Figure 11 RELATIVE COMPOSITION OF ALGAE (%) AT EACH SITE SURVEYED IN THE HA’APAI GROUP.
TURF SEDIMENTTURF ALGAEMACRO ALGAEERECT CORALLINECYANOBACTERIACCA
RESULTS
26
No Take Zone
Existing SMA
Poor Condition
Moderate Condition
Good Condition
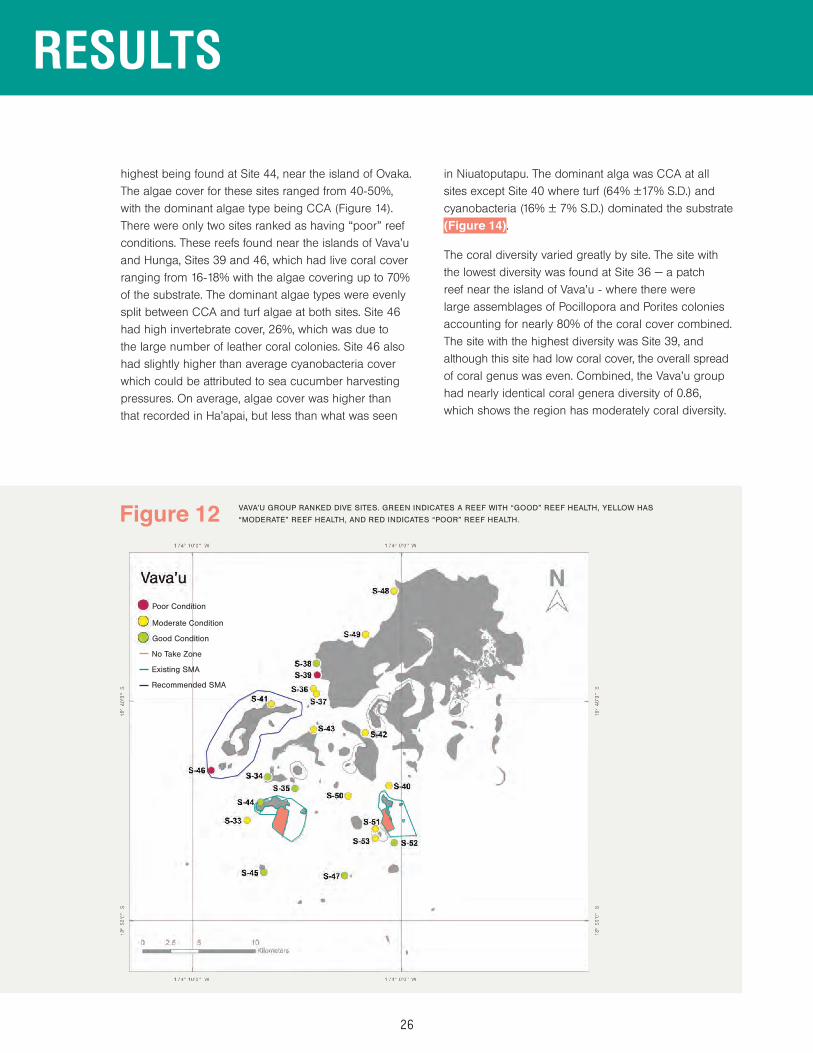
Figure 12 VAVA’U GROUP RANKED DIVE SITES. GREEN INDICATES A REEF WITH “GOOD” REEF HEALTH, YELLOW HAS
“MODERATE” REEF HEALTH, AND RED INDICATES “POOR” REEF HEALTH.
highest being found at Site 44, near the island of Ovaka. The algae cover for these sites ranged from 40-50%, with the dominant algae type being CCA (Figure 14). There were only two sites ranked as having “poor” reef conditions. These reefs found near the islands of Vava’u and Hunga, Sites 39 and 46, which had live coral cover ranging from 16-18% with the algae covering up to 70% of the substrate. The dominant algae types were evenly split between CCA and turf algae at both sites. Site 46 had high invertebrate cover, 26%, which was due to the large number of leather coral colonies. Site 46 also had slightly higher than average cyanobacteria cover which could be attributed to sea cucumber harvesting pressures. On average, algae cover was higher than that recorded in Ha’apai, but less than what was seen
in Niuatoputapu. The dominant alga was CCA at all sites except Site 40 where turf (64% ±17% S.D.) and cyanobacteria (16% ± 7% S.D.) dominated the substrate (Figure 14).
The coral diversity varied greatly by site. The site with the lowest diversity was found at Site 36 — a patch reef near the island of Vava’u - where there were large assemblages of Pocillopora and Porites colonies accounting for nearly 80% of the coral cover combined. The site with the highest diversity was Site 39, and although this site had low coral cover, the overall spread of coral genus was even. Combined, the Vava’u group had nearly identical coral genera diversity of 0.86, which shows the region has moderately coral diversity.
Recommended SMA

27
KI NG DOM OF TONGA
Figure 13 LARGE PORITES SPP. COLONIES OBSERVED AT SITE 35 IN VAVA’U.
Figure 14 RELATIVE COMPOSITION OF ALGAE (%) AT EACH SITE SURVEYED IN THE VAVA’U GROUP.
TURF SEDIMENTTURF ALGAEMACRO ALGAEERECT CORALLINECYANOBACTERIACCA

RESULTS
28
NIUATOPUTAPUThe island of Niuatoputapu is part of the Niua group, which is the most northern and remote location surveyed on the GRE mission to the KOT. We visited six survey sites, encompassing most of the reef habitats found around this island.
In 2009, Niuatoputapu was hit by a tsunami that was caused by the M8 Samoan earthquake causing severe damage to the island communities and surrounding reefs35,36. There was still evidence of the tsunami damage on the reef even six years after the tsunami wave hit the region.
Likely due to the impacts of the Samoan Tsunami, the average coral cover was slightly lower than seen in the Ha’apai and Vava’u groups. The average coral cover was 29% (±11% S.D.) with 66% (±12% S.D.) average algae cover (Figure 15). The algae cover was dominated by CCA, but interestingly, there was a nearly even spread of benthic cover between coralline algae, macroalgae, and turf algae which is different than what was observed at Ha’apai and Vava’u (Figure 16). The dominant coral genera found around Niuatoputapu were Acropora, Montipora, Pocillopora, and Porites, with a few areas being surprisingly dominated by Turbinaria.
3.2c
Figure 15 NIUATOPUTAPU RANKED DIVE SITES. GREEN INDICATES A REEF WITH “GOOD” REEF HEALTH, YELLOW HAS
“MODERATE” REEF HEALTH, AND “RED” INDICATES POOR REEF HEALTH.
Poor Condition
Moderate Condition
Good Condition

29
KI NG DOM OF TONGA
There was only one site considered to have “good” reef conditions. Site 56 had the highest live coral cover and is located approximately 3 km offshore to the west of the main landmass (Figure 15). This site had coral cover of 45% (±3% S.D.) and 46% (±10% S.D.) algae with the dominant algae types being CCA, macroalgae, and turf algae. The dominant coral genera at this site were Porites, followed by Montipora, Acropora, Astreopora, Pocillopora, and Turbinaria. The sites with “poor” reef conditions were found on the north side of the fringing reef, at sites 57 and 58. These sites had coral cover ranging from 14-18%, with algae cover ranging from 76-82% and were dominated by CCA, erect coralline algae, macroalgae and turf algae. The dominant coral genera at these poor sites were Montipora, Pocillopora, Isopora, Echinopora, and Acropora. The rest of the sites surveyed at Niuatoputapu had “moderate” reef conditions with coral cover that ranged from 32-33% live coral cover.
The coral diversity in Niuatoputapu was the highest of all three regions with a combined diversity of 0.88. Interestingly, the areas with poor reef conditions had the lowest diversity of 0.80 and the rest of the sites ranged in diversity from 0.82-0.86. Overall, there is a more uniform diversity as compared to what was seen in Ha’apai and Vava’u, which is encouraging. These findings indicate that there is a healthy spread of coral species around the island and this might promote ecosystem resilience. It is possible that this farthest north region of Tonga has the highest coral diversity since it is the most likely to receive input of new recruits from the nearby reefs of American Samoa6, unlike the other two regions of Ha’apai and Vava’u.
Figure 16 RELATIVE COMPOSITION OF ALGAE (%) AT EACH SITE SURVEYED IN THE NIUATOPUTAPU.
TURF SEDIMENT
TURF ALGAE
MACRO ALGAE
ERECT CORALLINE
CYANOBACTERIA
CCA

RESULTS
30
FISH COMMUNITY ASSESSMENT The reef fish communities at the three survey locations in the KOT were diverse
and abundant, however dominated by fish of lower trophic levels. Important
fish guilds and functional groups were well-represented. There was a diverse
composition of small ecologically important species such as damselfishes
and wrasses, as well as, groups with critical ecological functions such as
surgeonfishes and parrotfishes. However, the overall biomass of fish was low and
dominated by small-bodied fish causing concern for the long-term sustainability
of the fish communities. Economically important fish, such as groupers, snappers,
breams, jacks, surgeonfish and parrotfish were represented in our surveys. Yet
there was a noticeably low abundance of large predatory species such as sharks
and barracuda. It is unclear why the numbers of these predators were low. It
is possible that they are inherently shy in the area and tend to stay away from
divers, but excessive fishing pressure cannot be ruled out as the cause.
3.3
SPECIES RICHNESS OF FISH ASSEMBLAGEIn total, 222 fish species from 27 families were surveyed between the three island regions in the KOT (Table 1). Overall, Vava’u had the highest total species richness (167 species), followed closely by Ha’apai (165 species), and with the lowest species richness at Niuatoputapu (114 species; Table 5). However, the lower total number of species surveyed at Niuatoputapu may be due to
lower survey intensity around this island, as the mean number of species per 120 m2 (the area surveyed by each belt transect) was the highest in Niuatoputapu, at 23 species/120m2. Vava’u had the second highest mean species richness (20 species/120m2), followed closely by Ha’apai (18 species/120m2).
3.3a
LOCATION/ ISLAND# of Survey
Stations# of Replicate
TransectsTotal
FamiliesTotal
SpeciesMean # of Species
Mean Density
Mean Biomass
Ha’apai 30 112 22 165 18 96 4.0
Niuatoputapu 6 19 19 114 23 90 8.3
Vava’u 18 61 25 167 20 83 4.2
TOTAL/MEAN 54 192 27 222 18 91 4.5
ESTIMATED MEAN SPECIES RICHNESS OF FISH (# OF SPECIES/120M2), MEAN DENSITY (INDIVIDUALS/100M2),
AND MEAN BIOMASS (KG/100M2) OF FISH AT 3 LOCATIONS IN TONGA.Table 5

31
KI NG DOM OF TONGA
3.3b
DENSITY OF FISHThe overall mean fish density for all islands groups surveyed in the KOT was 91 individuals/100m2, with the highest average density found in Ha’apai (96 individuals/100m2), followed by Niuatoputapu (90 individuals/100m2), and with the lowest fish density in Vava’u (83 individuals/100m2; Table 5).
Across all island groups, trophic level 3.0-3.5 made up the largest proportion of the total mean density, ranging from 33 individuals/100m2 (+/- 20.5 SD) at Niuatoputapu to 50 individuals/100m2 (+/- 63.3 SD) in Ha’apai (Figure 18). The 4.0-4.5 trophic level had the lowest mean density across island groups ranging from 1 individual/100m2 (+/- 0.95 SD) in Ha’apai to 7 individuals/100m2 (+/- 11.9 SD) in Niuatoputapu. Although Vava’u had the lowest overall mean fish density, the average density per trophic level at Vava’u was intermediate when
compared to the other two sites for all trophic levels except 2.0-2.5, for which it had the lowest density (14 individuals/100m2 +/- 14.5 SD).
Throughout all the island groups, more than half of the fish observed were herbivores and planktivores. Impressively, herbivores and planktivores combined accounted for over 80% of the total density of fish observed in Ha’apai. This could indicate that there is a lack of primary predators of these fish, which could indicate overfishing, but this high number of herbivores and planktivores could be helping to maintain the moderate health of the reefs throughout the KOT. Of the recorded predatory fish, Niuatoputapu had the most carnivores present, and the fewest number of planktivores when compared to the two other island groups (Figure 18).
Figure 17
TL 4.0-4.5
TL 3.5-4.0
TL 3.0-3.5
TL 2.5-3.0
TL 2.0-2.5
ESTIMATED SPECIES RICHNESS (# OF SPECIES/
120 M2) BROKEN DOWN BY TROPHIC LEVELS (TL) AT
3 LOCATIONS IN TONGA.
In general, average species richness for all trophic levels was highest in Niuatoputapu, except for the 2.5-3.0 trophic level, for which Vava’u had the highest (5 species/ 120m2 +/- 1.5 SD; Figure 17). Conversely, Ha’apai generally had the lowest average species richness, except in the 3.0-3.5 trophic level, for which Vava’u was lowest (5.3 species/m2 +/- 1.6 SD). Across all three island groups, species in the 3.0-3.5 trophic level made up the largest proportion of the average species richness, ranging between 5.3 species/120m2 (+/- 1.6 SD) in Vava’u to 6.1 species/120m2 (+/- 2.0 SD) in Niuatoputapu. Predictably, the 4.0-4.5 trophic level had the lowest species richness across island groups, ranging from 0.8 species/120m2 (+/-0.5 SD) in Ha’apai to 2.8 species/120m2 (+/- 1.3 SD) in Niuatoputapu

RESULTS
32
FISH BIOMASSOverall, fish biomass was highest at Niuatoputapu, with a mean biomass of 8.3 kg/100m2, followed by Vava’u and Ha’apai with mean biomass 4.2 and 4.0 kg/m2, respectively. The mean fish biomass for all three of the island groups combined was 4.5 kg/100m2.
Although species richness and fish density were lowest in trophic level 4.0-4.5 for all islands, in Niuatoputapu this trophic level made up the largest proportion of the mean biomass at 4.2 kg/100m2 (+/- 7.8 SD), about half of the total mean biomass for this island group (Figure 19). This indicates that the fish in this trophic level were large at Niuatoputapu, both in comparison to fish in the other trophic levels at the same site, and when compared with fish in the same trophic level in the other two island groups. At Ha’apai, the highest biomass was found in trophic level 2.0-2.5 (1.6 kg/100m2 +/- 2.0 SD), and at Vava’u trophic level 3.0-3.5 had the highest biomass, at 1.5 kg/100m2 (+/- 4.1 SD). The 3.5-4.0 trophic
level had the lowest biomass at Ha’apai (0.23 kg/100m2 +/- 0.22 SD) and Vava’u (0.42 kg/100m2 +/- 0.50 SD), and trophic level 2.5-3.0 had the lowest biomass at Niuatoputapu (0.48 kg/100m2 +/- 0.24 SD).
Niuatoputapu had the highest biomass of top predators and carnivores, accounting for over 60% of the biomass calculated when the data is normalized by sampling effort. The biomass of herbivores and planktivores accounted for most of the biomass of the fish observed in Ha’apai, while herbivores, planktivores, and omnivores were the most abundant groups found in Vava’u. Overall, the biomass of fish was low and dominated by small bodied fish causing concern for the long-term sustainability of the fish communities. When compared to nearby countries such as French Polynesia and Fiji, these numbers were well below the average biomass (Figure 20).
3.3c
Figure 18ESTIMATED MEAN
DENSITY OF FISH
(INDIVIDUALS/100M2)
BROKEN DOWN BY
TROPHIC LEVEL (TL)
AT 3 LOCATIONS
IN TONGA.
TL 4.0-4.5
TL 3.5-4.0
TL 3.0-3.5
TL 2.5-3.0
TL 2.0-2.5

33
KI NG DOM OF TONGA
Figure 20 GLOBAL COMPARISON OF REEF FISH BIOMASS (KG/100M2).
Figure 19ESTIMATED MEAN
BIOMASS OF FISH
(KG/100M2) BROKEN
DOWN BY TROPHIC
LEVEL (TL) AT
3 LOCATIONS
IN TONGA.
TL 4.0-4.5
TL 3.5-4.0
TL 3.0-3.5
TL 2.5-3.0
TL 2.0-2.5

RESULTS
34
FISH SIZE DISTRIBUTIONSmall fish ranging in size from 11–20 cm made up the largest proportion of fish surveyed in all island groups, making up between 73% (Ha’apai) to 80% (Niuatoputapu) of the total (Figure 21). A higher proportion of larger fish (31–50 cm) were found at Niuatoputapu than in the Ha’apai or Vava’u, likely explaining the high biomass of
predators found in this island group relative to the other locations. Fish longer than 41 cm were essentially absent from Ha’apai and Vava’u, with this size class making up <0.2% of the total fish surveyed at these sites (0.16% at Ha’apai, 0.08% at Vava’u).
3.3d
Figure 21 THE RELATIVE SIZE DISTRIBUTION (%) OF SELECTED IMPORTANT FISH FAMILIES BASED ON THE TOTAL DENSITIES
FROM 3 LOCATIONS IN TONGA. FAMILIES INCLUDED WERE: ACANTHURIDAE (18 SPECIES), CARANGIDAE (2),
HAEMULIDAE (1), LETHRINIDAE (1), LUTJANIDAE (7), NEMIPTERIDAE (1), SCARIDAE (17), SERRANIDAE (9), AND
SIGANIDAE (2). FISH WITH TOTAL LENGTHS BELOW 10CM AND GREATER THAN 50CM WERE EXCLUDED.
41–50 cm31–40 cm21–30 cm11–20 cm

35
KI NG DOM OF TONGA
The reef fish communities at the three survey
locations in the KOT were diverse and abundant,
however dominated by fish of lower trophic levels.
The overall biomass of fish was low and dominated by small-bodied fish causing concern for the long-term
sustainability of the fish communities. There was a noticeably low abundance
of large predatory species such as
sharks and barracuda.
KI NG DOM OF TONGA


K I N G D O M O F T O N G A
4.0

DISCUSSION
38
DISCUSSION
One of the most critical findings from the KSLOF mission to the KOT was the poor status of the fish communities at all three island groups surveyed. The fish communities appear to be dominated by herbivorous and planktonivorous fish so small, that they are unlikely to represent any semblance of a functional fishery. In both Ha’apai and Vava’u, fish larger than 40 cm were essentially absent, causing extreme concern regarding the long-term sustainability of these fish communities. When compared to other countries visited on the GRE, the reef fish communities more closely resemble those of the Caribbean, rather than other countries surveyed in the South Pacific such as neighboring Fiji and French Polynesia (Figure 22). This is alarming as both the fish communities and benthic habitats of the Caribbean are in poor condition, and the reefs of Tonga are nearing this same predicament37,38.
Fish play an important role in the KOT, not just economically but also ecologically1,7,39,40. Reef fish communities contribute greatly to maintaining a healthy reef community and their over-exploitation is likely to severely decrease the health of near shore coral reef habitats27,41,42. Based on our findings, we speculate that the benthic habitats are being affected by the low fish biomass and abundance.
Prior to 2013, there had not been a major natural disturbance recorded in the area for over ten years, except for the American Samoan tsunami which only directly impacted the island of Niuatoputapu35. The reefs in the KOT, particularly those reefs in the Ha’apai and Vava’u groups, should be thriving, healthy, reef communities. Unfortunately, the findings collected by KSLOF show the reefs are only in moderate health,
4.0
Figure 22 GLOBAL COMPARISON OF REEF FISH DENSITIES (NUMBER OF FISH/100M2) IN COUNTRIES VISITED ON THE GRE.

39
KI NG DOM OF TONGA
and this is likely a byproduct of the poor reef fish and invertebrate communities, as well as anthropogenic stressors such as fishing pressure and possibly nutrient runoff. When compared to other countries surveyed on the GRE (Figure 23), there is hope that with enhanced fisheries management, anthropogenic stress to these reefs would decrease markedly, and a recovery could be initiated. For instance, numerous studies have shown that a healthy reef fish community is vital in maintaining a healthy reef habitat27,42. This is especially true of herbivorous fish, particularly those that feed on macroalgae27. One group of fish that are important in maintaining a healthy reef habitat are parrotfish28,37,43, a group often targeted by fishermen as they can grow to be large and provide substantial protein for consumption37,43. Studies have shown that should their populations decline, there can be a negative impact on the overall reef habitat37. Parrotfish primarily feed on macroalgae that, un-managed, can overgrow stony corals, reducing the overall live coral cover and structure beneficial to other organisms. Parrotfish can grow to be 40 cm in length or greater. During our time in the KOT we rarely encountered parrotfish, and those which were observed were all less than 30 cm in length44.
In Ha’apai, surveys were completed both inside and outside of the Fish Habitat Reserve (FHR) in the SMA by O’ua. At this site, there was evidence of recent COTS damage to the reef, particularly within the FHR boundaries, which led to our classifying the benthic habitat as being in “poor” condition. Although there were still few fish at sites both inside and outside of the FHR boundaries, we found the fish populations inside the FHR to be healthier than those found at the adjacent site outside. This result suggests that the FHR and SMA is possibly working as intended, although further studies are necessary considering the overall low biomass of reef fish in the KOT.
The reefs around the island of Vava’u were in moderate health. During our visit, Sites 37, 42, 43, and 51 all had evidence of COTS predation. Sites 37 and 43 had above average COTS populations observed and removed to prevent further damage to the reef. In these instances, the elevated COTS populations likely contributed to the
overall moderate reef health. Generally, on the western, or leeward side of the island group, the fish densities and biomass were higher than average. Despite the low-to-moderate live coral cover, likely due to COTS predation, the benthic structure remained reasonably complex, providing suitable habitat for reef fish communities. At Site 46, the most westerly site surveyed, higher than average fish biomass and densities were observed, but there was very low live coral cover overall. Instead, there were high leather coral populations that may act as good habitat for some fish.
Leather coral is a type of soft coral which does not calcify and therefore does not contribute to the overall growth of the reef substrate. Instead, this species grows outward along the benthos, covering the substrate, and occupying space where reef-building corals might otherwise settle. The habitat provided by the higher presence of leather coral likely explains the discrepancy in the reef and fish population balance. One site of interest is Site 44, located on the northwest side of O’vaka. This site was surveyed within the SMA, but not within the FHR. The benthic habitat here was in good condition, but the fish populations were critically low. At this site, the
The findings collected
by KSLOF show
the reefs are only in moderate health,
and this is likely a byproduct
of the poor reef fish and
invertebrate communities, as
well as anthropogenic stressors
such as fishing pressure and
possibly nutrient runoff.

DISCUSSION
40
DISCUSSION
fish communities were dominated by small herbivores, planktivores and benthic invertivores. By having a disproportionate abundance of lower trophic level fish, this indicates the fish community is being overharvested, an action that will likely prove to be detrimental to the reef’s health.
The island that had the most stable overall reef system was Niuatoputapu. While surveying the reefs, we observed numerous large coral colonies that had been broken or displaced by the 2009 American Samoa Tsunami, as well as evidence of sediment or sand covering recently dead coral colonies. Although the tsunami appeared to have had an impact on the benthic habitat, there was evidence of recovery. The dominant algae at all sites was CCA, suggesting the grazers in the
fish community and other benthic invertebrates found in Niuatoputapu are helping reduce the turf and macroalgae growth, preventing these algae from dominating the benthos. In Niuatoputapu, there were more predatory large fish and sharks observed, as compared to the other two island groups. It is likely that the lower fishing pressure has aided in maintaining a healthier reef fish community than Ha’apai and Vava’u, although when compared globally, there is ample reason for concern for the long-term sustainability of the fish community. Because this island is in relatively close proximity to American Samoa and the currents carry fish and benthic invertebrate larvae from those nearby reefs, it is possible that this site has a higher resilience than Ha’apai and Vava’u located farther to the south6.
Figure 23 GLOBAL COMPARISON OF PERCENT CORAL COVER OF CORAL REEFS SURVEYED ON THE GRE.

41
KI NG DOM OF TONGA
The fish communities appear to be dominated by herbivorous and planktonivorous fish so small, that they are unlikely to represent any semblance of a functional fishery.
When compared to other countries visited on
the GRE, the reef fish communities more closely
resemble those of the Caribbean, rather than
other countries surveyed in the South Pacific
such as neighboring Fiji and French Polynesia
KI NG DOM OF TONGA


K I N G D O M O F T O N G A
5.0

RECOMMENDATIONS
44
5.0
With the aid of the Marine and Coastal Biodiversity Management in Pacific Island Countries project (MACBIO) and the Department of Fisheries and Civil Society Forum of Tonga, many lessons have been learned regarding the effectiveness of Tonga’s SMAs45. Perhaps one of the most important of these is the gains to be made by providing education on the importance of establishing SMAs and the benefits they provide to local fishermen. By educating stakeholders in the importance of SMAs and the necessary commitment to disciplining those that are in violation of the SMA policies, the SMA will have the best chance of being effective. KSLOF recommends a continued commitment to working with local stakeholders on Niuatoputapu as new SMA’s are established. Currently, many of the SMAs have designated FHRs which have been proven to be vital in replenishing reef fish stocks. It might be of interest to the people of Niuatoputapu to establish an FHR close to Site 54, one of the few to exhibit a particularly healthy reef fish community.
Suggested SMA sites provided by MACBIO around the Vava’u group coincide well with the areas we would
We recommend
substantial effort
be dedicated to
educating the people of Niuatoputapu
on the importance
of sustainable fishing
practices, as well as to
protecting the marine resources and reefs
surrounding the northern
Niua islands from larger
fishing vessels.
The Ministry of Fisheries of the KOT has done substantial work in establishing
SMAs and protecting the country’s fisheries resources. KSLOF commends these
efforts and hopes our information can aid the establishment of additional SMAs,
and enhance the enforcement of those that already exist by providing a better
understanding of the health of reefs around Ha’apai, Vava’u, and Niuatoputapu.
Based on our findings and existing marine connectivity models6, we recommend
substantial effort be dedicated to educating the people of Niuatoputapu on the
importance of sustainable fishing practices, as well as to protecting the marine
resources and reefs surrounding the northern Niua islands from larger fishing
vessels. These reefs are of critical importance in providing new reef fish and
benthic invertebrate recruits to the southern island groups that are exposed to
considerably elevated fishing pressures.

45
KI NG DOM OF TONGA
suggest for future management46 (Figure 12). One recommended SMA that our findings support includes an SMA surrounding the island of ‘Euaiki. This area has moderate-to-good live coral cover, as well as a moderate-to-healthy fish community. Elevated levels of COTS were observed on the northern end of the island, however, so it is worth re-surveying the reef habitat to ensure it is recovering from this disturbance. Another SMA site that is of interest is near the island of Hunga. Here, the GRE data suggest fishing pressure to be sustainable. We also recommend an FHR be established near Site 46, since it is also characterized by a relatively healthy fish population.
The one region where there were no SMAs suggested by MACBIO, but we feel may be the most necessary, is in the Ha’apai group. The Ha’apai group already has four established SMAs near the islands of ‘Oua, Ha’afeva, Kotu, and ‘Uiha. Based on our findings, we recommend expanding the extent of each of the existing SMAs, as well as the size of the FHR’s contained within them. By increasing the size of the FHR, there is a higher likelihood of recovery in the fish population. There are no established SMAs in the northern portion of the island group, but sites such as 1, 22, 29 and 30 would likely benefit from the establishment of SMAs and FHRs.
Overall, the reef fish species that are particularly important to local fishers, such as parrotfish, emperors, snapper, and groupers, all of which play an important economic and ecological role within the KOT, are at
a critical low. It is imperative that the larger FHRs be established within the SMAs to aid in the replenishment of these worryingly low fish numbers. It is also critical that accurate documentation of the number of fish landings, as well as their size and species distribution, be recorded and provided by local fishermen as there is limited information being collected on this currently. KSLOF emphasizes the importance of continued engagement with local fishers to establish quota and size restrictions that will best protect and improve the populations of economically important reef fish species.
It is imperative that
the larger FHRs
be established
within the SMAs
to aid in the replenishment of these worryingly low fish numbers.
ACKNOWLEDGMENTS
46
The Foundation would like to express our thanks to the Cabinet Ministers of the Ministry of Lands, Environment, Climate Change and Natural Resources for granting us permission to sample and study the reefs of your country. KSLOF would like to especially thank Mr. ‘Apai Moala of the Geological Services Unit, NRD, Mr. Hoifua ‘Aholahi of the Conservation Unit, DoE, Mr. Sione Mailau of the Ministry of Fisheries, Mr. Malakai Finau of the Environment Department in Ha’apai, Dr. Fiona Webster, an Australian volunteer representing the Ministry of Fisheries, and Karen Stone of the Vava’u Environmental Protection Association for their hard work in assisting with the planning and execution of this research mission. The Foundation is particularly grateful for the dedicated efforts of all scientists, scientific divers, and observers and would like to thank them for their contributions. Several foreign researchers were also invited by KSLOF to participate in the surveys in the frame of local research programs. Their results are not discussed here.
The research mission to the Kingdom of Tonga would not have been possible without the leadership, vision, and generosity of His Royal Highness Prince Khaled bin Sultan. The Foundation is deeply appreciative of his financial support and for the generous use of the research vessel, M/Y Golden Shadow. His vision of Science Without Borders® was materialized in the research mission to the Kingdom of Tonga through the involvement and partnerships by scientists from the following countries: Kingdom of Tonga, United States of America, Australia, Portugal, the Philippines, and Taiwan.
KSLOF appreciates the skill and dedication of the scientific divers who aided in the collection of vital data for the Foundation, especially our international partners from Nova Southeastern University, University of the Azores, University of Miami, the United States National Oceanic and Atmospheric Administration (NOAA),
the Atlantic and Gulf Rapid Reef Assessment, and the National Museum of Marine Biology and Aquarium, Taiwan. The Foundation is particularly grateful for the dedicated efforts of each scientist, and we thank each of you for your contributions, especially the detailed data you gathered (Appendix 2).
KSLOF sincerely appreciates the professionalism and hard work of the officers and crew of the M/Y Golden Shadow. They were responsible for getting us safely to our research sites and conducting all logistical operations of the dive and research vessels. They ensured that each researcher had access to the study sites and proper working tools and equipment needed to complete the work, and had highly capable engineers and electricians that repaired and fabricated gear when we ran into complications. Behind the scenes, the crew worked all hours to support the scientists on the Global Reef Expedition, and for that, the Foundation is immensely grateful.
As deliverables from this research project are completed, we look forward to continuing these partnerships to ensure the information and data from this project are applied toward the conservation needs and goals of the Tongan people.
The Khaled bin Sultan Living Oceans Foundation is grateful for the assistance
provided by the Kingdom of Tonga in obtaining the permits for research, and
getting permission to work within the three different regions visited.

47
KI NG DOM OF TONGA
LITERATURE CITED
4848
1. Lovell, E. R. & Palaki, A. Tonga coral reefs: National status report. Status Coral Reefs 101–130 (2000).
2. UNEP-WCMC. Protected Area Country Profile for Tonga from World Database of Protected Areas. (2016).
3. Adjeroud, M., Briand, M. J., Kayal, M. & Dumas, P. Coral assemblages in Tonga: spatial patterns, replenishment capacities, and implications for conservation strategies. Environ. Monit. Assess. 185, 5763–5773 (2013).
4. Clark, K. et al. Characteristics of the 29th September 2009 South Pacific tsunami as observed at Niuatoputapu Island, Tonga. Earth-Sci. Rev. 107, 52–65 (2011).
5. Kronen, M. & Bender, A. Assessing Marine Resource Exploitation in Lofanga, Tonga: One Case Study—Two Approaches. Hum. Ecol. 35, 195–207 (2007).
6. Kendall, M., Poti, M., Wynne, T., Kinlan, B. & Bauer, L. Ocean currents and larval transport among islands and shallow seamounts of the Samoan Archipelago and adjacent island nations. in A biogeographic assessment of the Samoan Archipelago 132, 27–96 (NOAA Tech Memo, 2011).
7. Van Pel, H. Fisheries in Tonga. (South Pacific Commission, 1956).
8. Palaki, A., Nakaya, S. & Kimura, T. Management Plan for Marine Protected Areas in the Kingdom of Tonga. (2007).
9. Bell, L. A., Fa’anunu, U. & Koloa, T. Fisheries resources profiles: Kingdom of Tonga. Honiara Solomon Isl. (1994).
10. Matoto, S., Ledua, E., Mou-Tham, G. & Dalzell, P. The aquarium-fish fishery in Tongatapu, Tonga. Status and recommendations for management. (1996).
11. Moore, B. & Malimali, S. Demographic assessment of exploited coastal finfish species of Tongatapu, Tonga. (Pacific Community, 2016).
12. Kohler, K. E. & Gill, S. M. Coral Point Count with Excel extensions (CPCe): A Visual Basic program for the determination of coral and substrate coverage using random point count methodology. Comput. Geosci. 32, 1259–1269 (2006).
13. Komyakova, V., Munday, P. L. & Jones, G. P. Relative Importance of Coral Cover, Habitat Complexity and Diversity in Determining the Structure of Reef Fish Communities. PLoS ONE 8, e83178 (2013).
14. English, S., Wilkinson, C. & Baker, V. Survey Manual for Tropical Marine Resources. Aust. Inst. Mar. Sci. 368 (1994).
15. Bacchet, P., Zysman, T. & Lefevre, Y. Guide Des Poissons De Tahiti Et Ses Isles. (Pirae).
16. Kuiter, R. H. & Debelius, H. World Atlas of Marine Fishes. (IKAN-Unterwasserarchiv).
17. Randall, J. E. Reef and Shore Fishes of the South Pacific, New Caledonia to Tahiti and Pitcairn Islands. (University of Hawaii Press, 2005).
18. Allen, G. R., Steene, R., Humann, P. & Deloach, N. Reef Fish Identification Guide- Tropical Pacific. (New World Publications, Inc., 2012).
19. Letourneur, Y. Length-weight relationship of some marine fish species in Reunion Island, Indian Ocean. Naga 21, 37–38 (1998).
20. Letourneur, Y., Kulbicki, M. & Labrosse, P. Length-weight relationship of fishes from coral reefs and lagoons of New Caledonia: an update. Naga 21, 39–46 (1998).
21. Gonzales, B. J., Palla, H. P. & Mishina, H. Length-weight relationship of five serranids from Palawan Island, Philippines. Naga ICLARM Q. 23, 26–28 (2000).
22. FishBase. A Global Information System on Fishes. (WorldFish Center, 2004).
23. Kulbicki, M., Mou Tham, G., Thallot, P. & Wantiez, L. Length-weight relationships of fish from the lagoon of New Caledonia. Naga ICLARM Q. 16, 26–30 (1993).
24. Bozec, Y.-M., Kulbicki, M., Chassot, E. & Gascuel, D. Trophic signature of coral reef fish assemblages: Towards a potential indicator of ecosystem disturbance. Aquat. Living Resour. 18, 103–109 (2005).
25. Simon, A. N. P., Sabban, F. B., Chipeco, C. B. & Ticzon, V. S. Trophic spectrum analysis of reef fishes in Twin Rocks Marine Sanctuary, Northern Verde Island Passage, Philippines. (2016).
26. Robinson, J. P. W., Baum, J. K. & Giacomini, H. Trophic roles determine coral reef fish community size structure. Can. J. Fish. Aquat. Sci. 73, 496–505 (2016).
27. Crosby, M. P. & Reese, E. A manual for monitoring coral reefs with indicator species: butterflyfishes as indicators of change on Indo-Pacific reefs. (1996).
28. Mumby, P. J. et al. Fishing, Trophic Cascades, and the Process of Grazing on Coral Reefs. Science 311, 98–101 (2006).

49
KI NG DOM OF TONGA
49
29. Honda, K., Nakamura, Y., Nakaoka, M., Uy, W. H. & Fortes, M. D. Habitat Use by Fishes in Coral Reefs, Seagrass Beds and Mangrove Habitats in the Philippines. PLoS ONE 8, e65735 (2013).
30. Mumby, P. J. et al. Mangroves enhance the biomass of coral reef fish communities in the Caribbean. Nature 427, 533–536 (2004).
31. Verweij, M. C., Nagelkerken, I., Hans, I., Ruseler, S. M. & Mason, P. R. Seagrass nurseries contribute to coral reef fish populations. Limnol. Oceanogr. 53, 1540–1547 (2008).
32. Gratwicke, B. & Speight, M. R. The relationship between fish species richness, abundance and habitat complexity in a range of shallow tropical marine habitats. J. Fish Biol. 66, 650–667 (2005).
33. Price, N. Habitat selection, facilitation, and biotic settlement cues affect distribution and performance of coral recruits in French Polynesia. Oecologia 163, 747–758 (2010).
34. McCook, L., Jompa, J. & Diaz-Pulido, G. Competition between corals and algae on coral reefs: a review of evidence and mechanisms. Coral Reefs 19, 400–417 (2001).
35. Fritz, H. M. et al. Insights on the 2009 South Pacific tsunami in Samoa and Tonga from field surveys and numerical simulations. Earth-Sci. Rev. 107, 66–75 (2011).
36. Okal, E. A. et al. Field Survey of the Samoa Tsunami of 29 September 2009. Seismol. Res. Lett. 81, 577–591 (2010).
37. Bellwood, D. R., Hoey, A. S. & Hughes, T. P. Human activity selectively impacts the ecosystem roles of parrotfishes on coral reefs. Proc. R. Soc. B Biol. Sci. 279, 1621–1629 (2012).
38. Gardner, T. A., Cote, I. M., Gill, J. A., Grant, A. & Watkinson, A. R. Long-Term Region-Wide Declines in Caribbean Corals. Science 301, 958–960 (2003).
39. Fisheries Management and Planning Selection, Technical Division. Tonga National Snapper and Grouper Fisheries Management Plan. (Ministry of Fisheries).
40. Atherton, J. N., MacKenna, S. A., Wheatley, A. & Secretariat of the Pacific Regional Environment Programme. Rapid biodiversity assessment of the Vava’u archipelago, Kingdom of Tonga: 2014. (2015).
41. Zamani, N. P. & Madduppa, H. H. A standard criteria for assesing the health of coral reefs: implication for management and conservation. J Indones. Coral Reefs 1, 137–146 (2011).
42. Duffy, J. E., Lefcheck, J. S., Stuart-Smith, R. D., Navarrete, S. A. & Edgar, G. J. Biodiversity enhances reef fish biomass and resistance to climate change. Proc. Natl. Acad. Sci. 113, 6230–6235 (2016).
43. Vallès, H. & Oxenford, H. A. Parrotfish Size: A Simple yet Useful Alternative Indicator of Fishing Effects on Caribbean Reefs? PLoS ONE 9, e86291 (2014).
44. Bellwood, D. R., Hoey, A. S. & Choat, J. H. Limited functional redundancy in high diversity systems: resilience and ecosystem function on coral reefs. Ecol. Lett. 6, 281–285 (2003).
45. Lipooti’o e Fakataha Ki He Ngaahi Feitu’u Pule’i Makehe (Special Management Areas, SMAs) – Lessons Learned. 48 (2016).
46. MACBIO. Tonga. MACBIO Available at: http://macbio-pacific.info/tonga/. (Accessed: 11th April 2017)

APPENDIX
5050
Island Group Site Code Date Latitude Longitude Reef Location Exposure
Ha’apai Site 01 11-Sep-13 -19.806 -174.380 Lagoon Protected
Ha’apai Site 02 11-Sep-13 -19.798 -174.385 Lagoon Protected
Ha’apai Site 03 12-Sep-13 -19.856 -174.427 Lagoon Intermediate
Ha’apai Site 04 12-Sep-13 -19.867 -174.482 Lagoon Intermediate
Ha’apai Site 05 12-Sep-13 -19.820 -174.443 Lagoon Intermediate
Ha’apai Site 06 13-Sep-13 -19.985 -174.509 Lagoon Protected
Ha’apai Site 07 13-Sep-13 -20.058 -174.486 Lagoon Protected
Ha’apai Site 08 13-Sep-13 -20.067 -174.503 Lagoon Protected
Ha’apai Site 09 14-Sep-13 -20.071 -174.507 Lagoon Protected
Ha’apai Site 10 14-Sep-13 -20.057 -174.547 Lagoon Protected
Ha’apai Site 11 15-Sep-13 -19.927 -174.816 Lagoon Intermediate
Ha’apai Site 12 15-Sep-13 -19.916 -174.806 Lagoon Intermediate
Ha’apai Site 13 15-Sep-13 -19.907 -174.758 Lagoon Intermediate
Ha’apai Site 14 16-Sep-13 -20.094 -174.789 Fore Reef Intermediate
Ha’apai Site 15 16-Sep-13 -20.082 -174.757 Fore Reef Intermediate
Ha’apai Site 16 16-Sep-13 -20.06 -174.680 Fore Reef Protected
Ha’apai Site 17 16-Sep-13 -19.926 -174.728 Fore Reef Protected
Ha’apai Site 18 17-Sep-13 -20.002 -174.792 Fore Reef Intermediate
Ha’apai Site 19 17-Sep-13 -19.948 -174.685 Fore Reef Intermediate
Ha’apai Site 20 17-Sep-13 -20.062 -174.665 Fore Reef Protected
Ha’apai Site 21 18-Sep-13 -19.815 -174.714 Fore Reef Protected
Ha’apai Site 22 18-Sep-13 -19.754 -174.649 Fore Reef Intermediate
Ha’apai Site 23 18-Sep-13 -19.843 -174.532 Lagoon Intermediate
Ha’apai Site 24 19-Sep-13 -19.833 -174.337 Fore Reef Exposed
Ha’apai Site 25 19-Sep-13 -19.892 -174.388 Fore Reef Exposed
Ha’apai Site 26 19-Sep-13 -19.841 -174.521 Fore Reef Intermediate
Ha’apai Site 27 20-Sep-13 -19.746 -174.377 Lagoon Protected
Ha’apai Site 28 20-Sep-13 -19.718 -174.428 Lagoon Protected
Ha’apai Site 29 20-Sep-13 -19.671 -174.401 Lagoon Protected
Ha’apai Site 30 21-Sep-13 -19.599 -174.470 Fore Reef Intermediate
Ha’apai Site 31 21-Sep-13 -19.631 -174.488 Fore Reef Intermediate
Ha’apai Site 32 21-Sep-13 -19.643 -174.493 Fore Reef Intermediate
Vava’u Site 33 22-Sep-13 -18.757 -174.123 Lagoon Protected
Vava’u Site 34 22-Sep-13 -18.724 -174.106 Fore Reef Intermediate
Vava’u Site 35 22-Sep-13 -18.733 -174.085 Lagoon Protected
1 SITES SURVEYED

51
KI NG DOM OF TONGA
Island Group Site Code Date Latitude Longitude Reef Location Exposure
Vava’u Site 36 23-Sep-13 -18.657 -174.07 Fore Reef Intermediate
Vava’u Site 37 23-Sep-13 -18.661 -174.068 Fore Reef Intermediate
Vava’u Site 38 24-Sep-13 -18.638 -174.068 Fore Reef Intermediate
Vava’u Site 39 24-Sep-13 -18.647 -174.067 Fore Reef Intermediate
Vava’u Site 40 24-Sep-13 -18.731 -174.010 Lagoon Protected
Vava’u Site 41 25-Sep-13 -18.669 -174.104 Fore Reef Intermediate
Vava’u Site 42 25-Sep-13 -18.691 -174.029 Lagoon Protected
Vava’u Site 43 25-Sep-13 -18.688 -174.070 Fore Reef Protected
Vava’u Site 44 25-Sep-13 -18.743 -174.112 Fore Reef Protected
Vava’u Site 45 26-Sep-13 -18.797 -174.110 Lagoon Intermediate
Vava’u Site 46 26-Sep-13 -18.719 -174.151 Fore Reef Intermediate
Vava’u Site 47 26-Sep-13 -18.799 -174.045 Lagoon Intermediate
Vava’u Site 48 27-Sep-13 -18.583 -174.006 Fore Reef Intermediate
Vava’u Site 49 27-Sep-13 -18.616 -174.029 Fore Reef Intermediate
Vava’u Site 50 27-Sep-13 -18.739 -174.042 Lagoon Protected
Vava’u Site 51 27-Sep-13 -18.763 -174.021 Lagoon Protected
Vava’u Site 52 28-Sep-13 -18.774 -174.005 Lagoon Protected
Vava’u Site 53 28-Sep-13 -18.771 -174.021 Fore Reef Protected
Niuatoputapu Site 54 29-Sep-13 -15.982 -173.791 Fore Reef Exposed
Niuatoputapu Site 55 29-Sep-13 -15.975 -173.811 Fore Reef Exposed
Niuatoputapu Site 56 29-Sep-13 -15.938 -173.830 Fore Reef Intermediate
Niuatoputapu Site 57 30-Sep-13 -15.926 -173.767 Fore Reef Intermediate
Niuatoputapu Site 58 30-Sep-13 -15.933 -173.798 Fore Reef Intermediate
Niuatoputapu Site 59 30-Sep-13 -15.931 -173.78 Fore Reef Intermediate

APPENDIX
5252
PARTICIPANT Institution Function
Andrew Bruckner, PhD Khaled bin Sultan Living Oceans Foundation Lead Scientist, Coral Surveys
Alexandra Dempsey Khaled bin Sultan Living Oceans Foundation Coral Reef Ecologist, Benthic Surveys
Renée Carlton Khaled bin Sultan Living Oceans Foundation Ocean acidification resesarch
Anderson Mayfield, PhD KSLOF research Fellow, Taiwan Coral health research
Joao Monteiro KSLOF Fellow, University of Azores, Portugal Coral symbiont research
Ken Marks Ken Marks Phototransects
Jeremy Kerr KSLOF Fellow, Nova Southeastern University Habitat Mapping
Steve Saul, PhD Nova Southeastern University Habitat Mapping
Dawn Bailey Dive-in Coral Surveys
Nate Formel Independent consultant, United States Benthic surveys
Kate Fraser Independent consultant, Australia Fish Assessments
Robert Gardiner Nova Southeastern University Habitat Mapping
Amy HeemsothKhaled bin Sultan Living Oceans Foundation, Education Director
Education and Outreach
Apai MoalaMinistry of Lands, Environment, Climate Change & Natural Resources
Education and Outreach
Hoifua ‘AholahiMinistry of Lands, Environment, Climate Change & Natural Resources
Education and Outreach
Malakai FinauMinistry of Lands, Environment, Climate Change & Natural Resources
Education and Outreach
Sione Tui’moala Mailau Ministry of Agriculture, Forests and Fisheries Education and Outreach
Karen Stone Vava’u Environmental Protection Association (VEPA)Vava’u Environmental Protection Association (VEPA)
Fiona Webster, PhD Australian Volunteer for International Development Invertebrate Surveys
2 PARTICIPANTS
NOTES

NOTES

55

ISBN: 978-0-9975451-2-8