global patterns of workplace productivity for people with ... · 1 global patterns of workplace...
TRANSCRIPT
1
Global patterns of workplace productivity for people with depression: absenteeism and
presenteeism costs across eight diverse countries
Sara Evans-Lacko and Martin Knapp
Corresponding Author Full Contact Details:
Sara Evans-Lacko, PhD
Personal Social Services Research Unit
London School of Economics and Political Science
Houghton Street
London
WC2A 2AE
Telephone: + 44 (0) 20 7955 6028
Fax: +44 (0) 20 7277 1462
Email: [email protected]
Author Information:
Sara Evans-Lacko, PhD
Personal Social Services Research Unit
London School of Economics and Political Science
Houghton Street
London
WC2A 2AE
Health Service and Population Research Department
Institute of Psychiatry, Psychology & Neuroscience at King's College London
London UK
Email: [email protected]

2
Martin Knapp, PhD
Personal Social Services Research Unit
London School of Economics and Political Science
Houghton Street
London
WC2A 2AE
Email: [email protected]
3
Abstract
Purpose: Depression is a leading cause of disability worldwide. Research suggests that by
far, the greatest contributor to the overall economic impact of depression is loss in
productivity; however, there is very little research on the costs of depression outside of
Western high-income countries. Thus, this study examines the impact of depression on
workplace productivity across eight diverse countries.
Methods: We estimated the extent and costs of depression-related absenteeism and
presenteeism in the workplace across eight countries: Brazil, Canada, China, Japan, South
Korea, Mexico, South Africa and the USA. We also examined the individual, workplace and
societal factors associated with lower productivity.
Results: To our knowledge this is the first study to examine the impact of depression on
workplace productivity across a diverse set of countries, in terms of both culture and GDP.
Mean annual per person costs for absenteeism were lowest in South Korea at $181 and
highest in Japan ($2,674). Mean presenteeism costs per person were highest in the USA
($5,524) and Brazil ($5,788). Costs associated with presenteeism tended to be 5 to 10 times
higher than those associated with absenteeism.
Conclusions: These findings suggest that the impact of depression in the workplace is
considerable across all countries, both in absolute monetary terms and in relation to
proportion of country GDP. Overall, depression is an issue deserving much greater
attention, regardless of a country’s economic development, national income or culture.
Keywords: mental health, depression, employment, stigma, productivity
4
Introduction
According to the most recent Global Burden of Disease statistics, depression ranks as a
leading cause of disability worldwide [1], affecting 350 million people [2]. Among all medical
conditions, depression may have the greatest negative impact on time management and
productivity [3,4]. In high-income countries, trends suggest that sick days lost to mental
health problems such as depression have increased in recent years [5]. In addition to the
significant personal consequences associated with depression, the economic impact of
these trends can be considerable, including for employers.
In the workplace, depression can influence productivity through increased absenteeism.
Additionally, depression can influence the performance of workers who are ‘present’ at
work, i.e., presenteeism. Previous research suggests presenteeism accounts for the majority
of the costs [6–8]. However, most research has been done in Western, high-income
countries, and little is known about how the relationship between depression and
workplace productivity varies across countries. Labour market circumstances and culture
may influence the relationship between depression and workplace productivity [9]. We (1)
estimate workplace productivity (absenteeism and presenteeism) associated with
depression across eight diverse countries; (2) make population-level country estimates of
annual absenteeism and presenteeism costs associated with depression; and (3) examine
individual, workplace and societal factors associated with lower productivity.
Methods
Data source
We performed secondary analysis on data collected in the Global IDEA (Impact of
Depression in the Workplace in Europe Audit) survey which collected data on presenteeism
5
and absenteeism associated with depression and their correlates. Participants were
recruited through an online market research panel. Before joining the panel, participants
were screened to: remove duplicates, validate name and surname, validate country based
on internet protocol address, validate town and zip/postal code according to official lists,
check for valid correlations between sociodemographic data (gender, age of parents and
children) and validate contact information. Individuals who worked in advertising and/or
market research, and those aged under 16 years old were excluded.
Employed people across Brazil, Canada, China, Japan, South Korea, Mexico, South Africa and
the USA were sampled from the online research panels. Selected panel members were
invited to participate in the survey through Ipsos MORI (www.ipsos-mori.com/) via email.
Quotas were set to include equal distributions of age and gender, and the sample was
designed to be geographically representative of each country. Additionally, as managers
were considered of key interest, ten percent of the sample for each country was
represented by managers. Response rates varied by country. Reported estimates ranged
from around 5% in China, 8% in the USA, 10% in Brazil, Mexico, Canada and South Africa,
15% in Japan and 37% in South Korea. Questionnaires were collected from approximately
1,000 respondents per country.
Measures
Sociodemographic information included age band (18-24, 25-44, and 45-64 years), gender,
education level completed (tertiles were created for each country to indicate locally
relevant high, medium and low education categories). Data were collected on annual or
6
monthly household income from individuals in all countries except for China, where
individual-level income details were collected.
Previous diagnosis of depression was determined via self-report by asking respondents:
Have you ever personally been diagnosed as having depression by a doctor/medical
professional?
Did not tell employer because of fear of losing job
Employees who reported a previous diagnosis of depression which they did not disclose to
their employer were asked whether they did not tell their employer because they felt it
would put their job at risk or in this economic climate they felt that it was too risky.
Country variables
We used data from the IDEA survey to describe the overall population prevalence of
employees with a diagnosis of depression. We derived annual prevalence rates from lifetime
prevalence rates based on nationally representative psychiatric epidemiological surveys.
Given the standardized cross-country methodology, we used World Mental Health Survey
data where available. The ratio of lifetime to annual prevalence of depression ranged from
1.7 in China to 3.0 in Japan. We applied individual country ratios based on data from their
own country surveys and also performed sensitivity analyses based on the lowest (1.7) and
highest (3.0) ratios from participating study countries. Country unemployment rates for
2013 were taken from the International Labour Organisation global employment trends
report (World Health Organization 2014). Figures for gross domestic product (GDP) per
7
capita (US $) for each participating country were taken from the World Bank (World Bank
2014).
Work performance
Self-reported presenteeism was assessed using the WHO Health and Work Performance
Questionnaire (HPQ) [12,13]. For this assessment, respondents rate their overall work
performance during the past four weeks and this is transformed to a 0 to 100 scale where 0
corresponds to doing no work at all (while at work) and 100 signifies top work performance.
Presenteeism as assessed by the HPQ has been found to be valid when, for example,
compared to independent employer records of job performance and supervisor ratings [14].
Absenteeism was assessed using the following question: ‘The last time you experienced
depression, how many working days did you have to take off work because of your
depression’? Data collected from individuals on their reported salary was used to convert
the measures of absenteeism and presenteeism into US dollar purchasing parities based on
a conversion factor from the World Bank [15] in order to estimate the cost associated with
depression in the workplace using a human capital approach.
Statistical analysis
Individual and country characteristics are presented for each country. A high proportion of
participants had zero costs associated with presenteeism/absenteeism, and thus the data
followed skewed distributions. We therefore used a modified Park test [16] to select the
most appropriate distribution. Parameter estimates suggested a Gaussian distribution had
the best fit for presenteeism costs, while a Poisson distribution had the best fit for
absenteeism costs. Consequently, two generalised linear models were used to examine

8
bivariate and multivariable factors associated with: (i) depression-related absenteeism costs
and (ii) depression-related presenteeism costs. Country contextual variables (i.e.,
prevalence of employees with a previous diagnosis of depression and per capita GDP) were
computed as an average rating for each country across respondents, and each variable was
standardized (i.e., z-score was computed). Post-stratification survey weights, based on
gender, age and region of residence, which were aligned with nationally representative
figures, were used in all analyses. We used generalized estimating equations (GEE) with
robust variance estimates to model within-country correlations [17]. We selected GEE
instead of mixed regression models as we were interested in understanding the influence of
overall cultural factors rather than individual country-level effects. As GEE is a non-
likelihood-based method, Pan’s QIC was used for variable selection and to select the
working correlation matrix [18]. Given the diversity in country economic circumstances, we
also investigated whether the relationship between fear of losing one’s job and productivity
(absenteeism and presenteeism) differed by country GDP, testing the interaction between
these variables. All analyses were carried out using SAS version 9.3 and Stata version 11.
Ethics statement
This study was classified as exempt by the King’s College London, Psychiatry, Nursing, and
Midwifery Research Ethics Subcommittee as this was secondary data and was fully
anonymised. Data collection was performed independently by Ipsos MORI in accordance
with the standards of ESOMAR, AIMRI and EFAMRO in Europe and are in line with the data
protection act 1998. Data were collected as part of a market research survey and are hosted
with the market research agency Ipsos MORI. All data for the market research survey are
9
anonymous and did not include any personal information. No minors or children were
involved in the study and written consent was obtained.
Results
Participant characteristics and country averages
Individual sociodemographic characteristics and weighted country averages for mental
health and employment characteristics are described in table 1. As expected, given the
diversity of countries included in the sample, there was some variation between countries in
relation to education and income.
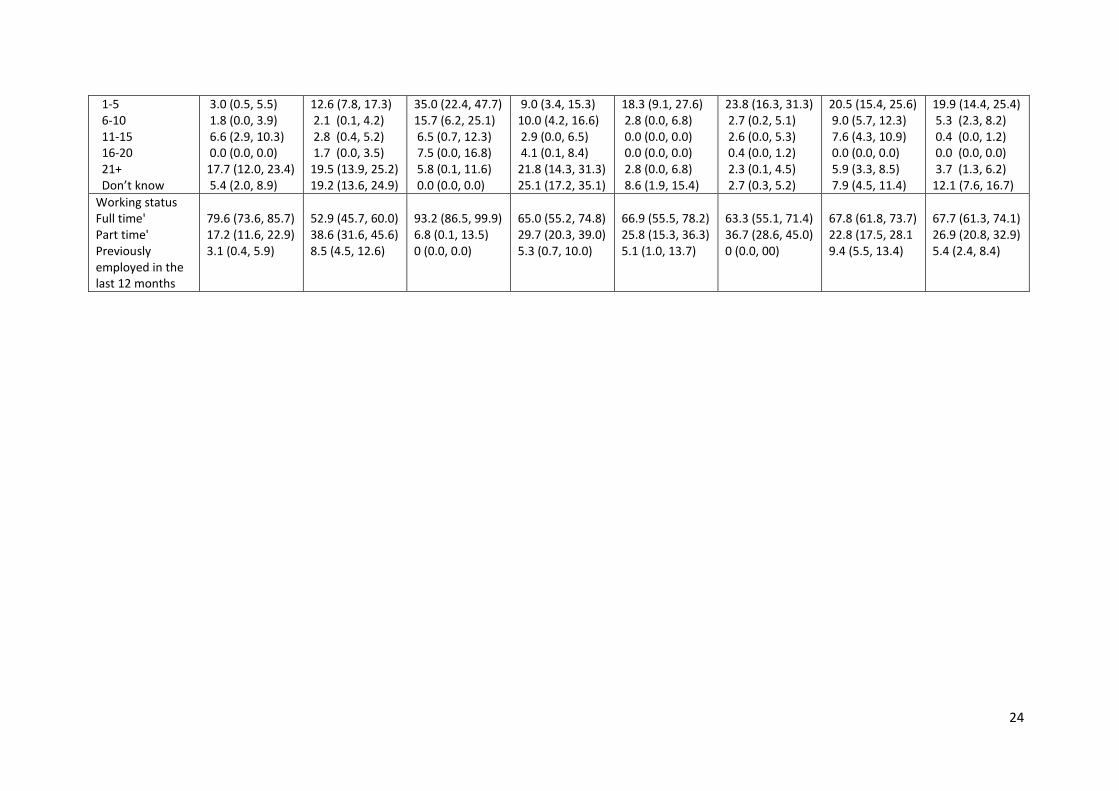
Less than 10% of respondents in China (6.4%) and South Korea (7.4%) reported having a
previous diagnosis of depression by a doctor or medical professional, while more than 20%
reported a previous diagnosis in Canada (20.7%), USA (22.7%) and South Africa (25.6%).
There was substantial inter-country variation in number of days off, with sample
proportions reporting 21+ days off work due to their depression varying from 2.3% in
Mexico to 21.8% in Japan. Respondents in Japan and the US were the most likely to report
not telling their employer about their depression because of fear of losing their job or due
to the economic climate (12.0% and 11.4%, respectively), in contrast to fewer than 5% in
Brazil and Mexico.
TABLE 1 ABOUT HERE
Productivity costs of depression associated with absenteeism and presenteeism across
countries
Mean annual per person costs for absenteeism associated with depression were lowest in
South Korea at $181. Although Japan had a relatively low prevalence of employees who

10
reported a diagnosis of depression, the average cost of absenteeism associated with
depression was highest in Japan ($2,674) as a high number of employees took time off of
work for at least 10 days. Japan also had the highest aggregate costs of absenteeism
associated with depression (almost $6 billion), when taking into account the size of the
labour force in the country and the estimated annual prevalence of depression among
employed persons. In order to account for differences in, for example, salary levels across
countries, we also expressed the aggregate costs as a proportion of country GDP. The
proportion was highest in Brazil and South Africa (0.7%) and lowest in South Korea (0.01%).
TABLE 2 ABOUT HERE
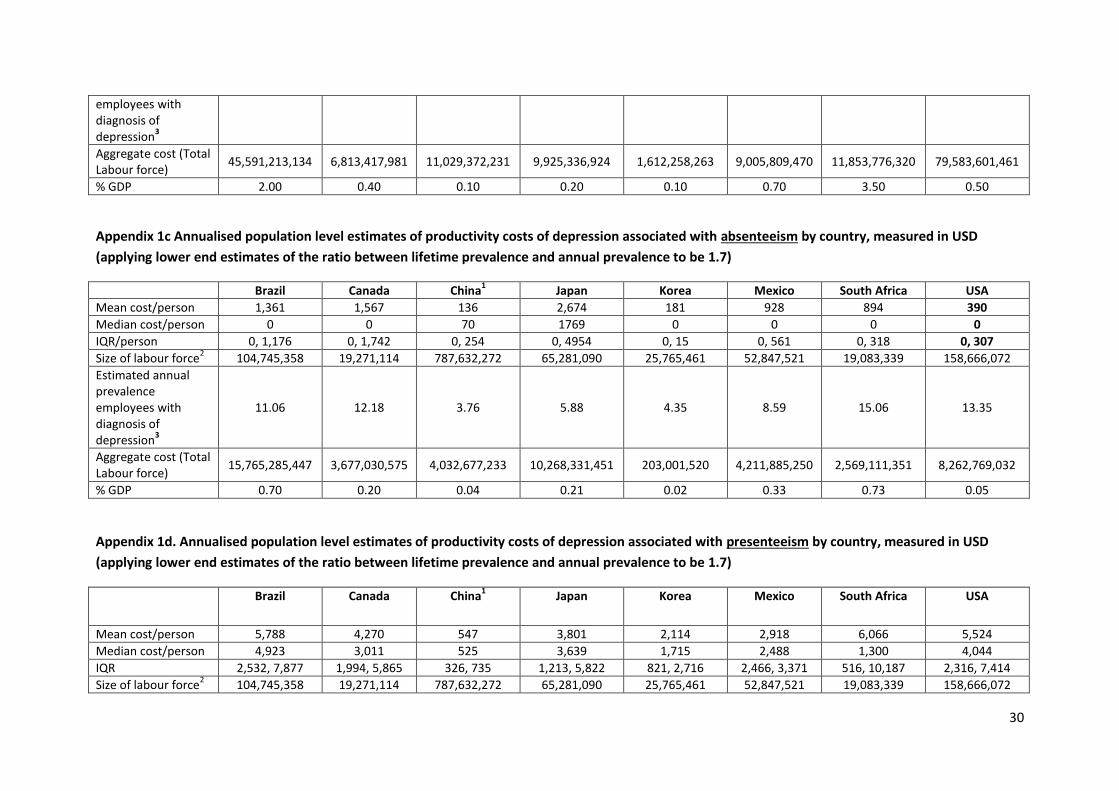
Mean presenteeism cost per person associated with depression was lowest in China at
$547; however, it is likely an underestimate relative to the other countries as it is based on
individual income rather than household income as is done for the other countries. The USA
($5,524) and Brazil ($5,788) had the highest presenteeism costs per person associated with
depression. Costs of presenteeism associated with depression tended to be 5 to 10 times
higher than those for absenteeism. When taking into account the size of the labour force
and the estimated annual prevalence of depression among employed persons, the US was
the highest at more than $84 billion and Brazil second at over $63 billion. In terms of
proportion of GDP; however, presenteeism costs associated with depression accounted for
the greatest proportion in South Africa (4.2%) and the lowest in Korea (0.1%). Interestingly,
the ratio of presenteeism costs to absenteeism costs varied across countries – being more
equal in Japan (1.4) and Canada (2.7), whereas presenteeism accounted for much greater
proportions of costs in the US (14.2) and South Africa (6.8).
TABLE 3 ABOUT HERE
11
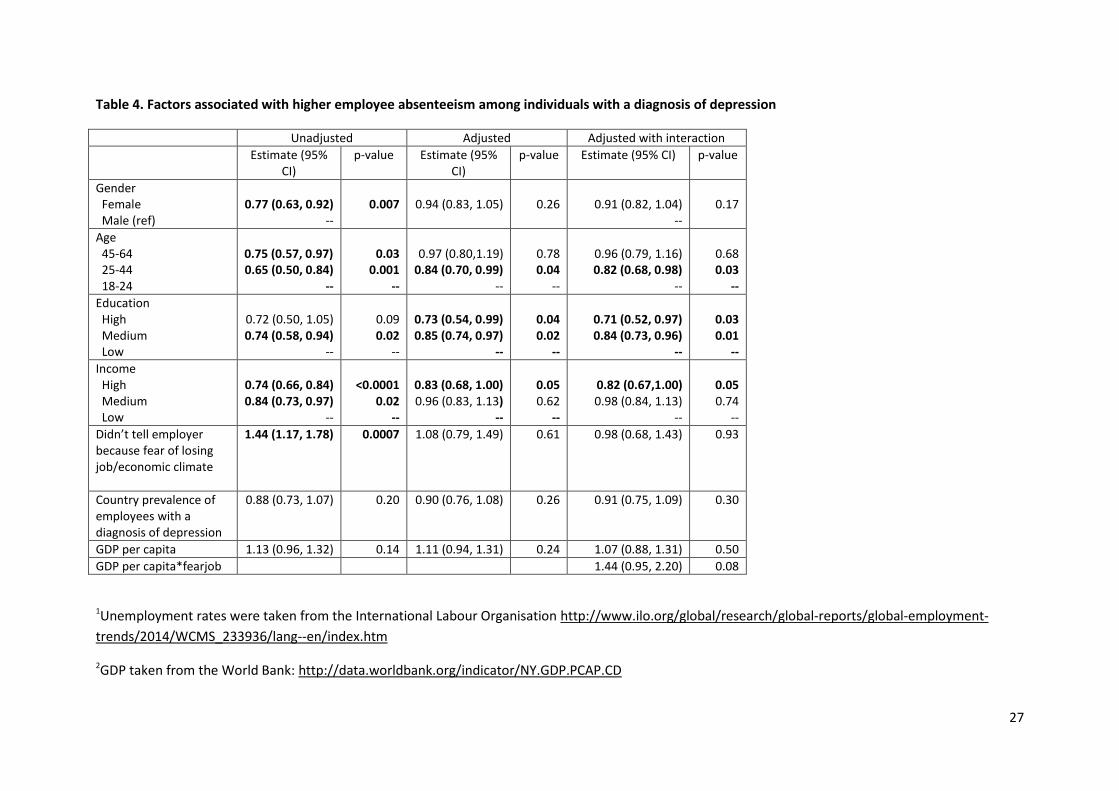
Factors associated with absenteeism
When adjusting for all covariates, individuals of middle age (relative to younger age), those
with higher levels of education and those with higher incomes tended to have lower levels
of depression-related absenteeism. There was a marginal trend for the interaction term for
GDP per capita by non-disclosure due to fear of losing one’s job (p=0.08), suggesting that
individuals living in countries with higher GDP per capita who did not tell their employer
because they feared losing their job were more likely to have higher levels of absenteeism.
We repeated the analyses excluding China (due to the difference in income measurement)
and the results did not change significantly.
TABLE 4 ABOUT HERE
Factors associated with presenteeism
After adjusting for covariates, individuals with higher levels of education and individuals
who did not tell their employer because they feared losing their job tended to have lower
depression-related presenteeism. Individuals with higher incomes had higher depression-
related presenteeism. Individuals living in a country with higher prevalence of depression
also tended to have higher presenteeism. There was a significant interaction for GDP per
capita by non-disclosure due to fear of losing one’s job (p<0.08) suggesting that individuals
living in countries with a higher GDP per capita who did not tell their employer because they
feared losing their job had higher levels of presenteeism (p=0.0002). As with absenteeism,
we repeated the analyses excluding China and the results did not change significantly.
TABLE 5 ABOUT HERE
12
Discussion
To our knowledge this is the first study to examine the impact of depression on workplace
productivity across a diverse set of countries, in terms of both culture and GDP. Previous
research on the economic case for tackling depression in the workplace is mainly relevant
for Western countries and high-income countries. These findings suggest the impact of
depression in the workplace is considerable across all countries, both in absolute monetary
terms and in relation to proportion of country GDP. In other words, depression is an issue
deserving attention, regardless of a country’s economic development, national income or
culture [19–21]. Moreover, with the growth in non-communicable diseases globally – with
mental illnesses contributing substantially – the scale of the problem is likely to increase
(Bloom, et al., 2011).
Although the impact of depression on workplace productivity is universal, there were
significant inter-country differences in terms of the prevalence of employees with
depression taking time off work, number of days taken off, level of presenteeism and ratio
of presenteeism to absenteeism. Most previous studies have been conducted in western or
high-income countries and thus, this study provided an opportunity to explore global
similarities and differences. Our study provides higher estimates of work productivity costs
compared with previous US studies [8,23,24]; however, these studies were based on
samples collected more than a decade ago, and there were some methodological
differences. We found lower overall productivity costs (in relation to proportion of GDP)
associated with depression in Asian countries) compared to the US. One driver of lower
costs was the lower prevalence of employees diagnosed with depression in Asian countries.
In line with previous epidemiological research [25,26], Asian countries had the lowest
13
prevalence of diagnosis of depression and this may be due to a true difference and/or
measurement bias. In the case of the present study, differences could also be due to lower
diagnostic rates or a cultural reluctance to disclose depression. Previous research from
Japan found a significant relationship between depression (as identified by a psychiatric
epidemiological survey using the WHO Composite International Diagnostic Interview [27])
and lower presenteeism; but, did not identify a significant relationship between presence of
depression and absenteeism [9]. It may be that our sample identified a relationship
between depression and absenteeism in Japan as our criteria for depression identified
individuals with more severe depression, given they had to receive a diagnosis by a medical
professional (Brown et al. 2014; Bebbington et al. 2000) and that there is a high threshold of
depression severity which warrants absenteeism in Japan.
We found that presenteeism rates varied according to country characteristics. Individuals
living in a country with a higher prevalence of depression diagnoses had higher levels of
presenteeism. It may be that prevalence of depression diagnoses also reflects comfort in
seeking treatment and or disclosing one’s diagnosis. Previous research has shown that a
cultural context which is more open and accepting of mental illness is associated with higher
rates of help-seeking, antidepressant use and empowerment and lower rates of self-stigma
and suicide among people with mental illness (Evans-Lacko et al. 2012; Schomerus et al.
2014; Lewer, et al., 2015). We also know that openness and support by managers in the
workplace is associated with more social acceptance for employees with depression [33].
Thus, it seems that sociocultural and workplace attitudes which promote acceptance and
openness about depression could also be important for improving workplace productivity of
14
employees with depression; further research is needed to understand whether this may be
at least partially mediated by increased treatment and help-seeking.
Differences in absenteeism and presenteeism were related to economic climate and per
capita GDP. Greater reluctance to disclose one’s depression to an employer due to a fear of
losing one’s job was related to lower levels of presenteeism. For both absenteeism and
presenteeism, this seemed to depend on per capita GDP, in that individuals living in
countries with higher per capita GDP who did not disclose their depression to their
employer because they feared losing their job, had higher levels of presenteeism and
absenteeism; however this only reached the level of a trend for absenteeism. Thus, in
higher income countries, individuals with depression who experience added stress due to
the economic climate may cope through taking time off of work, as this might be more
acceptable when the economy is stable, as there is likely to be a stronger social safety net.
On the other hand, in lower income countries, individuals who fear disclosing their
depression because they may lose their job do not feel comfortable taking time off of work.
Consequently, they may remain at work; but, have lower levels of productivity and this is
reflected in their relatively lower levels of presenteeism. Some variation may also be due to
the fact that the probability of people with depression being employed varies by country
and we do not know about differences in the experiences or rates of unemployed people
with depression across countries. There is a paucity of data on unemployment rates of
depressed persons, though we know that people with mental illness are at a considerable
employment disadvantage; for example, in OECD countries, there is a difference in
unemployment rate of around 30 percentage points for those with a severe mental disorder
and 10-15 percentage points for those with a moderate disorder, when compared to those
15
with no disorder [34]. We also know that adverse labour market conditions and stigmatising
attitudes have a disproportionately negative impact on employment of individuals with
mental illness [35]. This difference may be even greater in lower and middle income
countries [36].
We also found that absenteeism and presenteeism were associated with individuals’
characteristics. Higher income and education were associated with lower levels of
absenteeism. This is supported by previous research, including a large European survey of
employed individuals [33] and a meta-analysis of work strain which showed that individuals
with higher status occupations had lower levels of absenteeism, and this may be due to
their greater financial and interpersonal resources to deal with adverse circumstances [37].
Interestingly, our analyses showed that higher levels of income were associated with higher
levels of presenteeism, which would be in line with the importance of financial support.
Higher levels of education, however, were associated with lower levels of presenteeism. It is
possible that individuals with higher levels of education have a more cognitively demanding
job and therefore may feel more severely impacted by the cognitive impairments associated
with depression (Schultz 2007). Some research has shown that among employees with
depression, presenteeism was lower among individuals with jobs involving strong
judgement and communication skills [39].
Strengths and limitations
To our knowledge, this is the first study to examine workplace productivity associated with
depression across a diverse range of countries using a common methodology. Our findings
come from a unique dataset including employees and managers from eight countries, with
information on their personal experiences and perceptions of depression in the workplace.

16
Nevertheless, there are several limitations. Diagnosis of depression was based on self-report
and we were not able to control for clinical characteristics, such as severity and/or type of
symptoms and response rates were relatively low. However, the characteristics of
respondents are in line with other epidemiological research, as study respondents reporting
a diagnosis of depression were more likely to be female, divorced and working part-time.
Additionally, prevalence of depression diagnosis was lowest in Asian countries. Additionally,
as the survey only asked about lifetime experience of depression, we had to derive annual
prevalence rates from secondary sources. We used estimates from nationally representative
psychiatric epidemiology surveys available for each country.
We used the human capital approach to estimate productivity costs, which is still the most
commonly used approach across health economics; however, it assumes a societal
perspective and therefore the associated costs are higher than when using other methods
such as friction costs calculations [40,41]. National mental health policies, employment
assistance programmes available in the workplace and other policies could be important
factors which help explain relationships between depression and productivity in the
workplace, and it is a limitation that we have not included this information in our analyses;
however, this was beyond the scope of this paper. Additional limitations are that data from
this study did not include information on variables such as functioning and work roles, or
number and duration of depressive episodes, all of which might be related to workplace
productivity.
Conclusion
Previous research has noted the significant impact of depression on workplace productivity.
Our study highlights the individual and country contextual characteristics which influence
17
absenteeism and presenteeism among employees with depression. The trends toward
escalating rates of chronic diseases alongside growing economic pressures are an increasing
challenge for governments and employers worldwide [42,43]. There is some evidence of
growing interest in improving workplace mental health and an increase in workplace health
promotion programmes; yet, still only a minority of companies participate in these
programmes and rates are much lower in low and middle income countries compared to
high-income countries [44]. There are few interventions which have been shown to be cost-
effective for addressing depression in the workplace [45]; but almost all the available
evidence comes from Western, high-income countries. Interventions which support
employees with depression need to be developed, adapted, implemented and evaluated
across all countries in order to mitigate the high personal and societal impacts and
economic costs of depression in the workplace.
Conflict of interest
SEL and MK received consulting fees from Lundbeck.
Authors’ contributions
The original study design and protocol was written by SEL and MK. SEL performed data
analysis and initial drafting of the manuscript with contributions from MK. All authors
participated in interpretation of the analysis, editing and rewriting of the manuscript and all
authors have approved the final manuscript.
Acknowledgments

18
Funding for this study was provided by Lundbeck. The funders had no role in study design,
data collection and analysis or decision to publish. Lundbeck put together the
questionnaire with the European Depression Association. We would like to acknowledge
Lundbeck and IPSOS Mori for sharing the IDEA survey data.

19
References
1. Murray CJL, Vos T, Lozano R, Naghavi M, Flaxman AD, Michaud C, et al. Disability-adjusted life years (DALYs) for 291 diseases and injuries in 21 regions, 1990-2010: a systematic analysis for the Global Burden of Disease Study 2010. Lancet. 2012;380: 2197–223. doi:10.1016/S0140-6736(12)61689-4
2. World Health Organisation Depression factsheet [Internet]. 2013. Available: http://www.who.int/mediacentre/factsheets/fs369/en/
3. Burton WNM, Pransky GMMo, Conti DJP, Chen C-YP, Edington DWP. The Association of Medical Conditions and Presenteeism. J Occup Environ Med. 2004;46.
4. Henderson M, Harvey SB, Overland S, Mykletun A, Hotopf M. Work and common psychiatric disorders. J R Soc Med. SAGE Publications; 2011;104: 198–207. doi:10.1258/jrsm.2011.100231
5. Henderson, M., Madan I. Mental health and work. In: Davies, S. MN, editor. Annual Report of the Chief Medical Officer 2013, Public Mental Health Priorities: Investing in the Evidence. London: Department of Health; 2014. pp. 157–169.
6. Collins JJ, Baase CM, Sharda CE, Ozminkowski RJ, Nicholson S, Billotti GM, et al. The Assessment of Chronic Health Conditions on Work Performance, Absence, and Total Economic Impact for Employers. J Occup Environ Med. 2005;47. Available: http://journals.lww.com/joem/Fulltext/2005/06000/The_Assessment_of_Chronic_Health_Conditions_on.5.aspx
7. Johns G. Presenteeism in the workplace: A review and research agenda. J Organ Behav. John Wiley & Sons, Ltd.; 2010;31: 519–542. doi:10.1002/job.630
8. Stewart W, Ricci J, Chee E, Hahn S, Morganstein D. Cost of lost productive work time among US workers with depression. JAMA. 2003;289: 3135–3144. Available: http://dx.doi.org/10.1001/jama.289.23.3135
9. Tsuchiya M, Kawakami N, Ono Y, Nakane Y, Nakamura Y, Fukao A, et al. Impact of mental disorders on work performance in a community sample of workers in Japan: the World Mental Health Japan Survey 2002-2005. Psychiatry Res. 2012;198: 140–5. doi:10.1016/j.psychres.2011.10.014
10. International Labour Organization. Where is the unemployment rate the highest. In: Global employment trends. 2014 p. 10/12/2014.
11. World Bank. GDP per capita [Internet]. 2014.
12. Kessler RC, Barber C, Beck A, Berglund P, Cleary PD, McKenas D, et al. The World Health Organization Health and Work Performance Questionnaire (HPQ). J Occup Environ Med. 2003;45. Available: http://journals.lww.com/joem/Fulltext/2003/02000/The_World_Health_Organization_Health_and_Work.7.aspx
13. Kessler RC, Ames M, Hymel PA, Loeppke R, McKenas DK, Richling DE, et al. Using the World Health Organization Health and Work Performance Questionnaire (HPQ) to Evaluate the Indirect Workplace Costs of Illness. J Occup Environ Med. 2004;46. Available: http://journals.lww.com/joem/Fulltext/2004/06001/Using_the_World_Health_Organization_Health_and.4.aspx
20
14. Kessler RC, Ames M, Hymel P a., Loeppke R, McKenas DK, Richling DE, et al. Using the World Health Organization Health and Work Performance Questionnaire (HPQ) to Evaluate the Indirect Workplace Costs of Illness. J Occup Environ Med. 2004;46: S23–S37. doi:10.1097/01.jom.0000126683.75201.c5
15. World Bank. PPP conversion factor [Internet]. 2015 [cited 12 Dec 2015]. Available: http://data.worldbank.org/indicator/PA.NUS.PPP
16. Manning WG, Mullahy J. Estimating log models: to transform or not to transform? J Health Econ. 2001;20: 461–494. doi:10.1016/S0167-6296(01)00086-8
17. Zeger SL, Liang KY. Longitudinal data analysis for discrete and continuous outcomes. Biometrics. 1986;42: 121–30. Available: http://www.ncbi.nlm.nih.gov/pubmed/3719049
18. Pan W. Akaike’s Information Criterion in Generalized Estimating Equations. Biometrics. 2001;57: 120–125. doi:10.1111/j.0006-341X.2001.00120.x
19. Eaton J, DeSilva M, Regan M, Lamichhane J, Thornicroft G. There is no wealth without mental health. The Lancet Psychiatry. Elsevier; 2014;1: 252–253. doi:10.1016/S2215-0366(14)70277-9
20. Ribeiro WS, Mari J de J, Quintana MI, Dewey ME, Evans-Lacko S, Vilete LMP, et al. The impact of epidemic violence on the prevalence of psychiatric disorders in Sao Paulo and Rio de Janeiro, Brazil. PLoS One. Public Library of Science; 2013;8: e63545. doi:10.1371/journal.pone.0063545
21. Bass JK, Bornemann TH, Burkey M, Chehil S, Chen L, Copeland JRM, et al. A United Nations General Assembly Special Session for mental, neurological, and substance use disorders: the time has come. PLoS Med. Public Library of Science; 2012;9: e1001159. doi:10.1371/journal.pmed.1001159
22. Bloom, D.E., Cafiero, E.T., Jané-Llopis, E., Abrahams-Gessel, S., Bloom, L.R., Fathima, S. F, A.B., Gaziano, T., Mowafi, M., Pandya, A., Prettner, K., Rosenberg, L., Seligman, B., Stein, A.Z., & Weinstein C. The Global Economic Burden of Noncommunicable Diseases. [Internet]. Geneva; 2011. Available: http://www3.weforum.org/docs/WEF_Harvard_HE_GlobalEconomicBurdenNonCommunicableDiseases_2011.pdf
23. Greenberg PE, Kessler RC, Birnbaum HG, Leong SA, Lowe SW, Corey-Lisle C-LPTEB of D in the USHDICB 1990 and 2000? JCP 1899; 64: 1465–75. The Economic Burden of Depression in the United States: How Did It Change Between 1990 and 2000? J Clin Psychiatry. 2003;64: 1465–1475. Available: http://www.psychiatrist.com/jcp/article/Pages/2003/v64n12/v64n1211.aspx
24. Kessler RC, Akiskal HS, Ames M, Birnbaum H, Greenberg P, Hirschfeld RMA, et al. Prevalence and effects of mood disorders on work performance in a nationally representative sample of U.S. workers. Am J Psychiatry. 2006;163: 1561–8. doi:10.1176/appi.ajp.163.9.1561
25. Demyttenaere K, Bruffaerts R, Posada-Villa J, Gasquet I, Kovess V, Lepine JP, et al. Prevalence, severity, and unmet need for treatment of mental disorders in the World Health Organization World Mental Health Surveys. JAMA. American Medical Association; 2004;291: 2581–90. doi:10.1001/jama.291.21.2581
21
26. Ferrari AJ, Charlson FJ, Norman RE, Flaxman AD, Patten SB, Vos T, et al. The epidemiological modelling of major depressive disorder: application for the Global Burden of Disease Study 2010. Potash JB, editor. PLoS One. Public Library of Science; 2013;8: e69637. doi:10.1371/journal.pone.0069637
27. Kessler RC, Üstün TB. The World Mental Health (WMH) Survey Initiative version of the World Health Organization (WHO) Composite International Diagnostic Interview (CIDI). Int J Methods Psychiatr Res. 2004;13: 93–121. doi:10.1002/mpr.168
28. Brown J, Evans-Lacko S, Aschan L, Henderson MJ, Hatch SL, Hotopf M. Seeking informal and formal help for mental health problems in the community: a secondary analysis from a psychiatric morbidity survey in South London. BMC Psychiatry. 2014;14: 275. doi:10.1186/s12888-014-0275-y
29. Bebbington PE, Meltzer H, Brugha TS, FARRELL M, Jenkins R, Ceresa C, et al. Unequal access and unmet need: neurotic disorders and the use of primary care services. Psychol Med. Cambridge University Press; 2000;30: 1359–1367. Available: http://journals.cambridge.org/abstract_S0033291799002950
30. Evans-Lacko S, Brohan E, Mojtabai R, Thornicroft G. Association between public views of mental illness and self-stigma among individuals with mental illness in 14 European countries. PsycholMed. Health Service and Population Research Department, Institute of Psychiatry, King’s College London, UK; 2012; 1–13.
31. Schomerus G, Evans-Lacko S, Rüsch N, Mojtabai R, Angermeyer MC, Thornicroft G. Collective levels of stigma and national suicide rates in 25 European countries. Epidemiol Psychiatr Sci. Cambridge University Press; 2014; 1–6. doi:10.1017/S2045796014000109
32. Lewer D, O’Reilly C, Mojtabai R, Evans-Lacko S. Antidepressant use in 27 European countries: associations with sociodemographic, cultural and economic factors. Br J Psychiatry. 2015; doi:10.1192/bjp.bp.114.156786
33. Evans-Lacko S, Knapp M. Importance of social and cultural factors for attitudes, disclosure and time off work for depression: findings from a seven country European study on depression in the workplace. PLoS One. Public Library of Science; 2014;9: e91053. doi:10.1371/journal.pone.0091053
34. OECD. Sick on the Job?: Myths and Realities about Mental Health and Work, Mental Health and Work [Internet]. 2012. Available: http://dx.doi.org/10.1787/9789264124523-en
35. Evans-Lacko S, Knapp M, McCrone P, Thornicroft G, Mojtabai R. The mental health consequences of the recession: economic hardship and employment of people with mental health problems in 27 European countries. PLoS One; 2013;8: e69792.
36. Buckup S. The Price of Exclusion: The economic consequences of excluding people with disabilities from the world of work [Internet]. Geneva; 2009. Available: http://www.ilo.org/wcmsp5/groups/public/---ed_emp/---ifp_skills/documents/publication/wcms_119305.pdf
37. Darr W, Johns G. Work strain, health, and absenteeism: A meta-analysis. J Occup Health Psychol. 2008;13: 293–318.
38. Schultz AB ED. Employee Health and Presenteeism: A Systematic Review. J Occup
22
Rehabil. 2007;17: 547–579.
39. Lerner DMP, Adler DAM, Chang HP, Berndt ERP, Irish JTP, Lapitsky LM, et al. The Clinical and Occupational Correlates of Work Productivity Loss Among Employed Patients With Depression. J Occup Environ Med. 2004;46.
40. Drummond MF, Sculpher MJ, Claxton K SG. Methods for the Economic Evaluation of Health Care Programmes. Fourth. Oxford University Press; 2015.
41. van den Hout WB. The value of productivity: human-capital versus friction-cost method. Ann Rheum Dis. 2010;69 Suppl 1: i89–91. doi:10.1136/ard.2009.117150
42. Wahlbeck K, McDaid D. Actions to alleviate the mental health impact of the economic crisis. World Psychiatry. Finnish Association for Mental Health, Maistraatinportti 4 A, FI-00240 Helsinki, Finland; 2012;11: 139–145.
43. Stuckler D, Basu S, Suhrcke M, Coutts A, McKee M. The public health effect of economic crises and alternative policy responses in Europe: an empirical analysis. Lancet. 2009;374: 315–23. doi:10.1016/S0140-6736(09)61124-7
44. Wolf K. Making the Link between Health and Productivity at the Workplace —A Global Perspective. Ind Health. 2010;48: 251–255.
45. Kadel, R, Knapp, M MD. Economic evaluation of workplace-initiated interventions for common mental disorders: a systematic review of intervention studies. Under Rev.
46. Kessler RC, Bromet EJ. The epidemiology of depression across cultures. Annu Rev Public Health. 2013;34: 119–38. doi:10.1146/annurev-publhealth-031912-114409
47. Hasin, DS, Goodwin, RD, Stinson, FS GB. JAMA Network | JAMA Psychiatry | Epidemiology of Major Depressive Disorder: Results From the National Epidemiologic Survey on Alcoholism and Related Conditions. Arch Gen Psychiatry. 2005;62: 1097–110. Available: http://archpsyc.jamanetwork.com/article.aspx?articleid=208965
48. Kessler, Berglund, Demler, Jin. R, Koretz, Merikangas, et al. The Epidemiology of Major Depressive Disorder: Results From the National Comorbidity Survey Replication (NCS-R). J Am Med Assoc. 2003;289: 3095–3105. Available: http://jama.jamanetwork.com/article.aspx?articleid=196765
49. Patten SB, Williams JVA, Lavorato DH, Wang JL, McDonald K, Bulloch AGM. Descriptive epidemiology of major depressive disorder in Canada in 2012. Can J Psychiatry. 2015;60: 23–30. Available: http://www.pubmedcentral.nih.gov/articlerender.fcgi?artid=4314053&tool=pmcentrez&rendertype=abstract
50. Cho MJ, Kim J-K, Jeon HJ, Suh T, Chung I-W, Hong JP, et al. Lifetime and 12-month prevalence of DSM-IV psychiatric disorders among Korean adults. J Nerv Ment Dis. 2007;195: 203–10. doi:10.1097/01.nmd.0000243826.40732.45

23
Table 1. Characteristics of employee respondents in each of the participating countries (weighted percent, 95% Confidence Interval)
Brazil n=1,000
Canada n=1,000
China n=1,000
Japan n=1,000
South Korea n=1,000
Mexico n=1,000
South Africa n=1,061
USA n=1,000
Gender Male Female
57.3 (54.1, 60.4) 42.7 (39.6, 45.9)
51.9 (48.8, 55.0) 48.1 (45.0, 51.2)
55.1 (51.8, 41.6) 44.9 (41.6, 48.2)
56.5 (53.4, 59.5) 43.5 (40.5, 46.6)
58.6 (55.5, 61,6) 41.4 (38.4, 44.5)
65.8 (62.8, 68.9) 34,2 (31.1, 37.2)
40.0 (36.9, 43.1) 60.0 (56.9, 63.1)
52.5 (49.4, 55.7) 47.5 (44.3, 50.6)
Age 18-24 25-44 45-64
32.7 (29.7, 35.7) 40.1 (37.0, 43.2) 27.2 (24.4, 30.0)
26.0 (23.3, 28.8) 35.3 (32.3, 38.2) 38.7 (35.7, 41.7)
27.6 (24.8, 30.5) 39.8 (36.7, 42.9) 32.6 (29.1, 36.1)
17.5 (15.1, 19.8) 38.6 (35.5, 41.6) 44.0 (40.9, 47.1)
15.5 (13.3, 17.7) 40.8 (37.7, 43.8) 43.7 (40.6, 46.8)
31.9 (28.6, 35.2) 41.7 (38.3, 45.1) 26.4 (23.4, 29.4)
40.8 (37.5, 44.1) 60.0 (56.8, 63.2) 19.0 (16.8, 21.2)
20.4 (17.9, 22.8) 37.5 (34.5, 40.6) 42.1 (38.9, 45.2)
Education No formal qualification Educational title < University University or above
49.9 (44.5, 55.4) 45.2 (40.0, 50.6) 4.8 (2.7, 6.9)
3.3 (2.0, 4.8) 55.6 (48.4, 62.8) 34.6 (30.1, 39.0)
0.2 (0, 0.5) 40.8 (34.5, 47.4) 58.9 (54.0, 63.8)
0.2 (0, 0.5) 52.4 (46.0, 55.2) 47.3 (42.8, 51.9)
17.6 (15.2, 19.9) 19.8 (17.3, 22.3) 62.7 (59.6, 69.7)
76.0 (69.7, 82.3) 23.9 (19.4, 28.3) 0.2 (0, 0.5)
4.3 (3.0, 5.7) 57.1 (49.5, 64.5) 38.8 (33.9, 43.6)
1.6 (0.7, 2.7) 36.7 (29.9, 43.4) 49.2 (42.6, 55.7)
Annual income in USD Median (IQR)
19700 (12313, 30782)
55000 (24387, 75377)
7844 (4902, 9805)
51462 (32749, 70175)
25393 (19750, 36678)
12599 (11887, 13334)
17328 (9206, 22076)
55000 (40000, 87500)
Previous diagnosis of depression
18.8 (16.3, 21.3)
20.7 (18.2, 23.2)
6.4 (4.8, 8.1)
10.0 (8.1, 11.9)
7.4 (5.8, 9.0)
14.6 (12.3, 17.0)
25.6 (22.9, 28.4)
22.7 (20.0, 25.3)
Didn’t tell employer about depression because fear of losing job/economic climate
2.4 (0.1, 4.8)
7.3 (3.7, 10.9)
6.6 (0.1, 13.2)
12.0 (5.5., 18.5)
8.0 (1.7, 14.3)
3.0 (0.3, 5.8)
7.2 (3.8, 10.5)
11.4 (7.2, 15.7)
Number of days taken off during episode of depression 0
65.4 (58.3, 72.5)
42.1 (35.0, 49.2)
29.6 (16.3, 42.8)
23.1 (15.3, 32.8)
67.4 (56.1, 78.6)
65.6 (57.5, 73.8)
49.0 (42.8, 55.3)
58.6 (51.9, 65.3)
24
1-5 6-10 11-15 16-20 21+ Don’t know
3.0 (0.5, 5.5) 1.8 (0.0, 3.9) 6.6 (2.9, 10.3) 0.0 (0.0, 0.0) 17.7 (12.0, 23.4) 5.4 (2.0, 8.9)
12.6 (7.8, 17.3) 2.1 (0.1, 4.2) 2.8 (0.4, 5.2) 1.7 (0.0, 3.5) 19.5 (13.9, 25.2) 19.2 (13.6, 24.9)
35.0 (22.4, 47.7) 15.7 (6.2, 25.1) 6.5 (0.7, 12.3) 7.5 (0.0, 16.8) 5.8 (0.1, 11.6) 0.0 (0.0, 0.0)
9.0 (3.4, 15.3) 10.0 (4.2, 16.6) 2.9 (0.0, 6.5) 4.1 (0.1, 8.4) 21.8 (14.3, 31.3) 25.1 (17.2, 35.1)
18.3 (9.1, 27.6) 2.8 (0.0, 6.8) 0.0 (0.0, 0.0) 0.0 (0.0, 0.0) 2.8 (0.0, 6.8) 8.6 (1.9, 15.4)
23.8 (16.3, 31.3) 2.7 (0.2, 5.1) 2.6 (0.0, 5.3) 0.4 (0.0, 1.2) 2.3 (0.1, 4.5) 2.7 (0.3, 5.2)
20.5 (15.4, 25.6) 9.0 (5.7, 12.3) 7.6 (4.3, 10.9) 0.0 (0.0, 0.0) 5.9 (3.3, 8.5) 7.9 (4.5, 11.4)
19.9 (14.4, 25.4) 5.3 (2.3, 8.2) 0.4 (0.0, 1.2) 0.0 (0.0, 0.0) 3.7 (1.3, 6.2) 12.1 (7.6, 16.7)
Working status Full time' Part time' Previously employed in the last 12 months
79.6 (73.6, 85.7) 17.2 (11.6, 22.9) 3.1 (0.4, 5.9)
52.9 (45.7, 60.0) 38.6 (31.6, 45.6) 8.5 (4.5, 12.6)
93.2 (86.5, 99.9) 6.8 (0.1, 13.5) 0 (0.0, 0.0)
65.0 (55.2, 74.8) 29.7 (20.3, 39.0) 5.3 (0.7, 10.0)
66.9 (55.5, 78.2) 25.8 (15.3, 36.3) 5.1 (1.0, 13.7)
63.3 (55.1, 71.4) 36.7 (28.6, 45.0) 0 (0.0, 00)
67.8 (61.8, 73.7) 22.8 (17.5, 28.1 9.4 (5.5, 13.4)
67.7 (61.3, 74.1) 26.9 (20.8, 32.9) 5.4 (2.4, 8.4)

25
Table 2. Annualised population level estimates of productivity costs of depression associated with absenteeism by country, measured in USD
Brazil Canada China1 Japan Korea Mexico South Africa USA
Mean cost/person 1,361 1,567 136 2,674 181 928 894 390
Median cost/person
0 0 70 1769 0 0 0 0
IQR/person 0, 1,176 0, 1,742 0, 254 0, 4954 0, 15 0, 561 0, 318 0, 307
Size of labour force
2
104,745,358 19,271,114 787,632,272 65,281,090 25,765,461 52,847,521 19,083,339 158,666,072
Estimated annual prevalence employees with diagnosis of depression
3
10.44 8.28 3.76 3.33 2.96 7.30 12.80 9.66
Aggregate cost (Total Labour force)
14,889,436,256 2,500,380,791 4,032,677,233 5,818,721,155 138,041,034 3,580,102,463 2,183,744,648 5,977,322,278
% GDP 0.66 0.14 0.04 0.12 0.01 0.28 0.62 0.04
Table 3. Annualised population level estimates of productivity costs of depression associated with presenteeism by country, measured in USD
Brazil Canada China1 Japan Korea Mexico South Africa USA
Mean cost/person 5,788 4,270 547 3,801 2,114 2,918 6,066 5,524
Median cost/person 4,923 3,011 525 3,639 1,715 2,488 1,300 4,044
IQR 2,532, 7,877 1,994, 5,865 326, 735 1,213, 5,822 821, 2,716 2,466, 3,371 516, 10,187 2,316, 7,414
Size of labour force2 104,745,358 19,271,114 787,632,272 65,281,090 25,765,461 52,847,521 19,083,339 158,666,072
Estimated annual prevalence employees with diagnosis of depression
3
10.44 8.28 3.76 3.33 2.96 7.30 12.80 9.66
Aggregate cost (Total Labour force)
63,321,129,353 6,813,417,981 16,219,665,046 8,271,114,103 1,612,258,263 11,257,261,838 14,817,220,400 84,663,405,809
% GDP 2.82 0.37 0.18 0.17 0.12 0.89 4.23 0.50
26
1 Estimate based on individual rather than household income for China only
2 Size of the labour force was taken from the International Labour Organization, Key Indicators of the Labour Market Database (2009-2013)
3As only lifetime diagnosis of depression was collected, we divided the prevalence estimates collected in this study (as shown in table 1) by the ratio of
lifetime to annual prevalence rates identified for each country as identified by nationally representative estimates from the World Mental Health Survey
[46] or national epidemiological surveys [47,48]
27
Table 4. Factors associated with higher employee absenteeism among individuals with a diagnosis of depression
Unadjusted Adjusted Adjusted with interaction
Estimate (95% CI)
p-value Estimate (95% CI)
p-value Estimate (95% CI) p-value
Gender Female Male (ref)
0.77 (0.63, 0.92)
--
0.007
0.94 (0.83, 1.05)
0.26
0.91 (0.82, 1.04)
--
0.17
Age 45-64 25-44 18-24
0.75 (0.57, 0.97) 0.65 (0.50, 0.84)
--
0.03
0.001 --
0.97 (0.80,1.19)
0.84 (0.70, 0.99) --
0.78 0.04
--
0.96 (0.79, 1.16) 0.82 (0.68, 0.98)
--
0.68 0.03
--
Education High Medium Low
0.72 (0.50, 1.05) 0.74 (0.58, 0.94)
--
0.09 0.02
--
0.73 (0.54, 0.99) 0.85 (0.74, 0.97)
--
0.04 0.02
--
0.71 (0.52, 0.97) 0.84 (0.73, 0.96)
--
0.03 0.01
--
Income High Medium Low
0.74 (0.66, 0.84) 0.84 (0.73, 0.97)
--
<0.0001
0.02 --
0.83 (0.68, 1.00) 0.96 (0.83, 1.13)
--
0.05 0.62
--
0.82 (0.67,1.00) 0.98 (0.84, 1.13)
--
0.05 0.74
--
Didn’t tell employer because fear of losing job/economic climate
1.44 (1.17, 1.78) 0.0007 1.08 (0.79, 1.49) 0.61 0.98 (0.68, 1.43)
0.93
Country prevalence of employees with a diagnosis of depression
0.88 (0.73, 1.07) 0.20 0.90 (0.76, 1.08)
0.26 0.91 (0.75, 1.09)
0.30
GDP per capita 1.13 (0.96, 1.32) 0.14 1.11 (0.94, 1.31) 0.24 1.07 (0.88, 1.31) 0.50
GDP per capita*fearjob 1.44 (0.95, 2.20) 0.08
1Unemployment rates were taken from the International Labour Organisation http://www.ilo.org/global/research/global-reports/global-employment-
trends/2014/WCMS_233936/lang--en/index.htm
2GDP taken from the World Bank: http://data.worldbank.org/indicator/NY.GDP.PCAP.CD

28
Table 5. Factors associated with higher employee presenteeism3 among individuals with a diagnosis of depression
Unadjusted Adjusted Adjusted with interaction
Estimate (95% CI)
p-value Estimate (95% CI)
p-value Estimate (95% CI)
p-value
Gender Female Male (ref)
1.19 (0.98, 1.43)
--
0.07
0.99 (0.96, 1.03)
--
0.55
--
0.99 (0.96, 1.03)
--
0.55
Age 45-64 25-44 18-24
4.90 (3.32, 7.31) 4.48 (3.00, 3.32)
--
<0.0001 <0.0001
--
1.03 (0.96, 1.11) 0.96 (0.90, 1.03)
--
0.43 0.26
--
1.02 (0.95 ,1.09) 0.95 (0.90, 1.02)
--
0.55 0.17
Education High Medium Low
0.82 (0.75, 0.90) 0.82 (0.70, 0.95)
--
<0.0001
0.008 --
0.90 (0.88, 0.93) 0.95 (0.91, 0.99)
--
<0.0001
0.02 --
0.90 (0.88, 0.93) 0.96 (0.92, 0.99)
--
<0.0001
0.03 --
Income High Medium Low
1.25 (1.16, 1.32) 1.77 (1.51, 2.10)
--
<0.0001 <0.0001
--
1.04 (1.01, 1.08) 1.10 (1.08, 1.13)
--
0.03
<0.0001
1.04 (1.01, 1.08) 1.10 (1.08, 1.13)
--
0.03
<0.0001
Didn’t tell employer because fear of losing job/economic climate
0.06 (0.01, 0.64) 0.02 0.80 (0.77, 0.84)
<0.0001
0.79 (0.75, 0.84)
<0.0001
Country prevalence of employees with a diagnosis of depression
0.97 (0.90, 1.04) 0.37 1.05 (1.00, 1.10) 0.05 1.05 (1.01, 1.10) 0.05
GDP per capita 1.09 (1.02, 1.16) 0.01 0.99 (0.97, 1.02) 0.84 0.99 (0.96, 1.02) 0.48
GDP per capita*fearjob 1.12 (1.06, 1.20) 0.0002 1Unemployment rates were taken from the International Labour Organisation http://www.ilo.org/global/research/global-reports/global-employment-
trends/2014/WCMS_233936/lang--en/index.htm
2GDP taken from the World Bank: http://data.worldbank.org/indicator/NY.GDP.PCAP.CD
3Though duration and number of episodes may differ by country (and e.g., access to appropriate care and treatment). We assumed an average of 37.7
weeks for an episode of depression based on the global burden of disease review and estimate [26].

29
Appendix 1. Sensitivity analysis for annualised population level estimates of productivity costs based on range of estimates for the ratio of lifetime
prevalence to annual prevalence rates from 1.7-3.03
Appendix 1a Annualised population level estimates of productivity costs of depression associated with absenteeism by country, measured in USD
(applying upper end estimates of the ratio between lifetime prevalence and annual prevalence to be 3.0)
Brazil Canada China1 Japan Korea Mexico South Africa USA
Mean cost/person 1,361 1,567 136 2,674 181 928 894 390
Median cost/person 0 0 70 1769 0 0 0 0
IQR/person 0, 1,176 0, 1,742 0, 254 0, 4954 0, 15 0, 561 0, 318 0, 307
Size of labour force2 104,745,358 19,271,114 787,632,272 65,281,090 25,765,461 52,847,521 19,083,339 158,666,072
Estimated annual prevalence employees with diagnosis of depression
3
6.27 6.90 2.13 3.33 2.47 4.87 8.53 7.57
Aggregate cost (Total Labour force)
10,720,394,104 2,500,380,791 2,742,220,518 17,456,163,466 138,041,034 2,864,081,970 1,746,995,719 5,618,682,942
% GDP 0.50 0.10 0.03 0.40 0.01 0.20 0.50 0.03
Appendix 1b. Annualised population level estimates of productivity costs of depression associated with presenteeism by country, measured in USD
(applying upper end estimates of the ratio between lifetime prevalence and annual prevalence to be 3.0)
Brazil Canada China1 Japan Korea Mexico South Africa USA
Mean cost/person 5,788 4,270 547 3,801 2,114 2,918 6,066 5,524
Median cost/person 4,923 3,011 525 3,639 1,715 2,488 1,300 4,044
IQR 2,532, 7,877 1,994, 5,865 326, 735 1,213, 5,822 821, 2,716 2,466, 3,371 516, 10,187 2,316, 7,414
Size of labour force2 104,745,358 19,271,114 787,632,272 65,281,090 25,765,461 52,847,521 19,083,339 158,666,072
Estimated annual prevalence
6.27 6.90 2.13 3.33 2.47 4.87 8.53 7.57
30
employees with diagnosis of depression
3
Aggregate cost (Total Labour force)
45,591,213,134 6,813,417,981 11,029,372,231 9,925,336,924 1,612,258,263 9,005,809,470 11,853,776,320 79,583,601,461
% GDP 2.00 0.40 0.10 0.20 0.10 0.70 3.50 0.50
Appendix 1c Annualised population level estimates of productivity costs of depression associated with absenteeism by country, measured in USD
(applying lower end estimates of the ratio between lifetime prevalence and annual prevalence to be 1.7)
Brazil Canada China1 Japan Korea Mexico South Africa USA
Mean cost/person 1,361 1,567 136 2,674 181 928 894 390
Median cost/person 0 0 70 1769 0 0 0 0
IQR/person 0, 1,176 0, 1,742 0, 254 0, 4954 0, 15 0, 561 0, 318 0, 307
Size of labour force2 104,745,358 19,271,114 787,632,272 65,281,090 25,765,461 52,847,521 19,083,339 158,666,072
Estimated annual prevalence employees with diagnosis of depression
3
11.06 12.18 3.76 5.88 4.35 8.59 15.06 13.35
Aggregate cost (Total Labour force)
15,765,285,447 3,677,030,575 4,032,677,233 10,268,331,451 203,001,520 4,211,885,250 2,569,111,351 8,262,769,032
% GDP 0.70 0.20 0.04 0.21 0.02 0.33 0.73 0.05
Appendix 1d. Annualised population level estimates of productivity costs of depression associated with presenteeism by country, measured in USD
(applying lower end estimates of the ratio between lifetime prevalence and annual prevalence to be 1.7)
Brazil Canada China1 Japan Korea Mexico South Africa USA
Mean cost/person 5,788 4,270 547 3,801 2,114 2,918 6,066 5,524
Median cost/person 4,923 3,011 525 3,639 1,715 2,488 1,300 4,044
IQR 2,532, 7,877 1,994, 5,865 326, 735 1,213, 5,822 821, 2,716 2,466, 3,371 516, 10,187 2,316, 7,414
Size of labour force2 104,745,358 19,271,114 787,632,272 65,281,090 25,765,461 52,847,521 19,083,339 158,666,072

31
Estimated annual prevalence employees with diagnosis of depression
3
11.06 12.18 3.76 5.88 4.35 8.59 15.06 13.35
Aggregate cost (Total Labour force)
67,045,901,668 10,019,732,32
6 16,219,665,046 14,596,083,711 2,370,968,034
13,243,837,457
17,432,024,000 117,034,708,03
1
% GDP 2.99 0.55 0.18 0.30 0.18 1.05 4.97 0.70
1 Estimate based on individual rather than household income for China only
2 Size of the labour force was taken from the International Labour Organization, Key Indicators of the Labour Market Database (2009-2013)
3As only lifetime diagnosis of depression was collected, we divided the prevalence estimates collected in this study (as shown in table 1) by the upper (2.5)
and lower (1.7) a estimates for the ratio between lifetime prevalence and annual prevalence for countries participating in this study based on estimates
from the World Mental Health Survey [47] and national epidemiological surveys [49,50].