global outlook - de.standardlifeinvestments.com · economic outlook a bumpier ride a testing time...
TRANSCRIPT

Global OutlookJuly 2018


Foreword
Our latest Global Outlook is being released at a challenging time for investors. Global growth has been weaker than anticipated so far this year, especially outside of the US. The Federal Reserve (Fed) is continuing to withdraw policy support amid solid domestic growth, limited spare capacity and looser fiscal policy. Oil prices have increased and are squeezing consumers’ real incomes. And long-feared geopolitical risks – such as a ratcheting up in trade policy tensions and the formation of a Eurosceptic government in Italy – have rapidly crystallised. Against this more dangerous and uncertain backdrop, risk assets have struggled to keep their head above water.
In such times, it pays to step back from the noise and ask how much the fundamentals have really changed. In her Economic Outlook article, Chief Economist Lucy O’Carroll argues that the headwinds outlined above have increased the risks to the expansion, and will reduce the synchronisation of the cycle. However, her comprehensive assessment of the economic and policy drivers of the cycle gives many reasons to be positive and she expects most of the major economies to grow at or above trend through this year and next.
Two of the major risks to this broadly benign outlook are an unexpectedly large increase in US interest rates and further rapid appreciation of the US dollar. Liam O’Donnell, Investment Director, Government Bonds, thinks there is scope for long-term interest rates to rise from their current levels thanks to the outlook for Fed policy and unfavourable supply dynamics. But he also argues that there are clear limits to how high yields can sustainably rise in a world of constrained growth and high debt. Meanwhile, Ken
Dickson, Investment Director, Currency, assesses the different drivers of the US dollar and concludes that a large and sustained upswing is unlikely in the current environment.
These findings reinforce the positive messages from our Spotlight article written by Yashaswini Dunga, an Economist in our Research Institute, and emerging market debt article from Kieran Curtis, Investment Director, Emerging Market Debt. Yashaswini’s update of our emerging market heatmap shows that although there are pockets of vulnerability in the large economies, systemic crisis risks are low compared with both recent and longer-term history. Furthermore, Kieran shows that the sell-off in emerging market bonds has been out of step with underlying fundamentals, creating buying opportunities for investors. Navigating markets has become more difficult over recent months but when we stand back from the noise, there are still reasons to be confident about the economic and return environment.
Jeremy LawsonHead of the Aberdeen Standard Investments Research Institute

Economic Outlook
A bumpier rideThere has been a widespread softening in data over the first few months of the year amid the emergence of a number of potentially disruptive headwinds. Nevertheless, the outlook for the global economy remains broadly positive.
Lucy O’CarrollChief Economist

Economic Outlook A bumpier ride
A testing timeAt the beginning of the year optimism was high that 2018 would deliver the strongest global growth since 2011, supporting another solid year for asset returns. That optimism has been tested over recent months in the face of both weaker-than-anticipated data as well as a number of adverse political and policy shocks. It is too early to become pessimistic about the outlook as we still expect most of the major economies to growth at or above trend over the next 12 months. But the ride will be bumpier and less synchronised than last year, with risks tilted to the downside of the current consensus.
Recent data signal a slowdown in activityOfficial growth figures moderated in the first quarter for the US, UK and Eurozone, and turned negative in Japan. Reported growth held steady in China, but our own activity measure continued to turn down. Some of this weakness has spilled over into the second quarter. The global manufacturing purchasing managers’ index (PMI) slipped to 53.1 in May, though it remains comfortably in expansion territory and was offset by a rise in the services PMI measure. Consumer, business and investor confidence surveys have also moderated, driven by a pullback in expectations.
A number of headwinds have hit the world economyTemporary drags, including unseasonably severe weather in Europe and Japan and hurricane-related distortions in the US, partly drove this moderation. However, these one-off effects are not the whole story. In addition, a number of headwinds have hit the world economy: a sharp rise in oil prices in response to supply disruptions; the re-emergence of risks in Italy; growing trade tensions; and tightening financial conditions as the US dollar has appreciated.
Crude oil prices have risen by 12% since the beginning of the year and nearly 70% over the past 12 months. This is a headwind for households’ real disposable income growth and therefore consumption. Price rises of this order are not, however, sufficient to bring a halt to the global expansion. And in the US, which is now a major
oil producer, rising energy investment should provide some offset to the consumer squeeze. Moreover, the oil forward curve suggests that the energy price impulse is set to peak over the summer before moderating gradually through the second half of 2018.
In Italy, meanwhile, government bond spreads have been volatile and widened significantly since the Eurosceptic coalition has taken power, while Eurozone investor and business confidence has weakened. The risk of Italian exit from the Eurozone is low in the short term. The European Central Bank (ECB) designed its Outright Monetary Transactions (OMT) programme to prevent an accidental exit; the institutional barriers to a legal referendum and exit are high; the extra-legal route would be very risky. However, the populist government is likely to be unpredictable and support for the euro is lower in Italy than in most other countries. Therefore, the underlying risks are higher than in the (recent) past, when Italy had a pro-business, reformist Europhile government under former Prime Minister Renzi.
The global trade picture has also become less favourable, with business surveys of export orders falling. This is partly due to a weakening in the Asian semi-conductor cycle, but it may also reflect creeping protectionism, with President Trump’s communication style and negotiating tactics continuing to test market sentiment. Some of the surprises have been positive – especially the president’s willingness to meet with his North Korean counterpart. For a time, North American Free Trade Agreement (NAFTA) negotiations appeared to be going well too but recent developments have been less encouraging.
Trade tensions between the US and China are also high, with threats of tariffs and non-tariff restrictions escalating. Little has been put into practice but erratic negotiations and competing political priorities in the US have raised the likelihood of implementation. Many questions remain, but the risks of a trade war have certainly increased. Even without tariffs, the on-again, off-again nature of negotiations could further erode sentiment.
At the same time, the US dollar environment has become a headwind for emerging market (EM) economies. Growth has disappointed expectations in many of the large EMs so far this year and momentum appears to be slowing. A stronger US dollar, higher US yields and rising oil prices are also compounding the pressure. Risk appetite has reversed as a result, with
Chart 1 EM industrial indicators remain solid
2.0
2.5
3.0
3.5
4.0
4.5
5.0
5.5
6.0
2012 2013 2014 2015 2016 2017 2018 48.5
49.0
49.5
50.0
50.5
51.0
51.5
52.0
52.5
Manufacturing PMI Industrial production, % year-on-year (R. H. Scale)
Source: CPB, Markit, Haver (as of May 2018)
Index level %
3 month moving average, emerging markets:
the risks of a trade war have certainly
increased

Economic Outlook A bumpier ride
significant portfolio outflows from EMs after 16 months of inflows. However, the stress has been limited so far to countries with large imbalances and an unstable political outlook.
These headwinds should not derail continued global expansion in 2018-19Critically, this build-up of headwinds must be set against a number of healthy cyclical dynamics. Investment should hold up well over the next couple of years, given continued strength in surveys, rising capacity constraints and still-accommodative financial conditions. Household spending remains supported by high levels of confidence and loosening bank-lending conditions. In some economies, there is scope for further employment growth to boost real incomes; elsewhere, higher wage growth is likely to play a role. Tax cuts in the US and Germany will also boost disposable incomes. Indeed, fiscal policy is set to be modestly supportive in the major economies overall.
For EMs, recent growth may have disappointed expectations but the outlook remains healthy. The EM
manufacturing PMI peaked in late 2017 but it is still well above trend. Industrial production also continues to improve gradually from its 2015 trough (see Chart 1). Moreover, EM average inflation is at its lowest level since the financial crisis; the aggregate current account was in surplus in 2017; and reserve cover has (with some exceptions) improved. At the same time, China’s stability and strong domestic demand should continue to serve as a backstop against a more severe outturn for EMs.
These views are consistent with the latest signals from our short-term proprietary indicators. Our ‘nowcasts’, which provide a gauge of current economic conditions on a timelier basis
than official statistics, are pointing to trend growth in most economies over the next few quarters – with the US notably above trend, and Japan below. Our various business cycle indicators are still sitting in the expansion phase, though more of this phase is now in the past than in the future. In addition, our recession risk models for the developed economies generally point to very low recession probabilities over the next 12 months.
Solid growth, muted inflation and cautious central banks ahead Overall, we expect the world economy to expand by a healthy 3.8% this year, nudged down from 3.9% in our previous quarterly forecast (see Table 1). The composition of growth has, however, changed more than the headline numbers. This is partly due to the rise in oil prices, which will favour oil producers over consumers. The expansion is expected to maintain a similar pace in 2019 (3.8%), cooling gradually through 2020 (3.6%) as the near-term US fiscal stimulus fades; monetary and financial conditions become less accommodative; and the trend pace of Chinese growth slows.
Turning to inflation, underlying global trends have generally remained muted. Core inflation measures in the US have moved back to target-consistent levels. This reflects payback from unusual weakness in early 2017, the impact of past dollar depreciation, seasonal factors and the gradual tightening of the labour market. Eurozone and Japanese inflation momentum has, in contrast, remained subdued. Strongly anchored inflation expectations, globalisation and disruptive technological change still appear to be partly offsetting rising cyclical pressures. There could also be more spare capacity available than falling headline unemployment rates suggest. Overall, we expect inflationary pressures to continue to build at a measured pace as the expansion further erodes spare capacity.
In response, central banks are likely to continue proceeding with a degree of caution. In the US, both the data and recent Federal Reserve (Fed) communications have been consistent
headwinds must be set against a number
of healthy cyclical dynamics
Table 1 Upswing intact but slightly less synchronised
GDP growth CPI inflation
2018 2019 2020 2018 2019 2020
Global 3.8 3.8 3.6 3.4 3.2 3.2
DM 2.3 2.2 1.8 2 1.8 1.8
US 3 2.7 1.8 2.6 2.2 2.2
UK 1.4 1.5 1.5 2.3 1.9 2
Japan 0.8 1.1 0.7 1.3 1.2 1.3
Eurozone 2.1 1.9 1.8 1.7 1.5 1.4
EM 4.8 4.9 4.9 4.4 4.1 4.1
Brazil 2 2.5 2.6 3.7 4.2 4.2
Russia 1.7 1.6 1.5 3.7 4 4
India 7.2 7.4 7.5 4.5 5 5
China 6.4 6 5.9 2.4 2.3 2.3
Green shading means above consensus. Red means below consensusNote: DM/EM denote developed markets/emerging marketsSource: Aberdeen Standard Investments (as of June 2018)
Economic Outlook A bumpier ride
with our forecast of two further rate rises this year (a total of four in 2018), followed by four in 2019 and one more in 2020. This would bring the target rate for the federal funds rate to 3.5-3.75%, well above our 2.75-3% estimate for the long-term neutral nominal rate. This reflects our expectation that the policy stance will need to become genuinely tight by H2 2019 to prevent the domestic economy overheating.
Economic and financial market shocks in other parts of the world could, in principle, cause the Fed to back away from its hiking cycle. Given the limited degree of spare capacity in the economy and the anticipated boost to domestic demand from fiscal easing, however, the Fed’s ‘pain threshold’ for shocks in the rest of the world is probably considerably higher now than earlier in the recovery.
Other developed market central banks are likely to be more sensitive to shocks. The Bank of England, for example, stepped back from a rate rise in May, signalling its data dependency. We continue to expect a rate increase later this year, followed by two more in both 2019 and 2020. The risks are skewed to the downside, however, given uncertainties around the growth and productivity outlook. For the ECB, continued above-trend growth and a gradual pick-up in core inflation pressures have prompted an announced end to asset purchases by year-end. We expect gradual rate rises from September 2019. In Japan, meanwhile,
our base case remains for no policy change over the forecast horizon, reflecting a lack of inflation momentum.
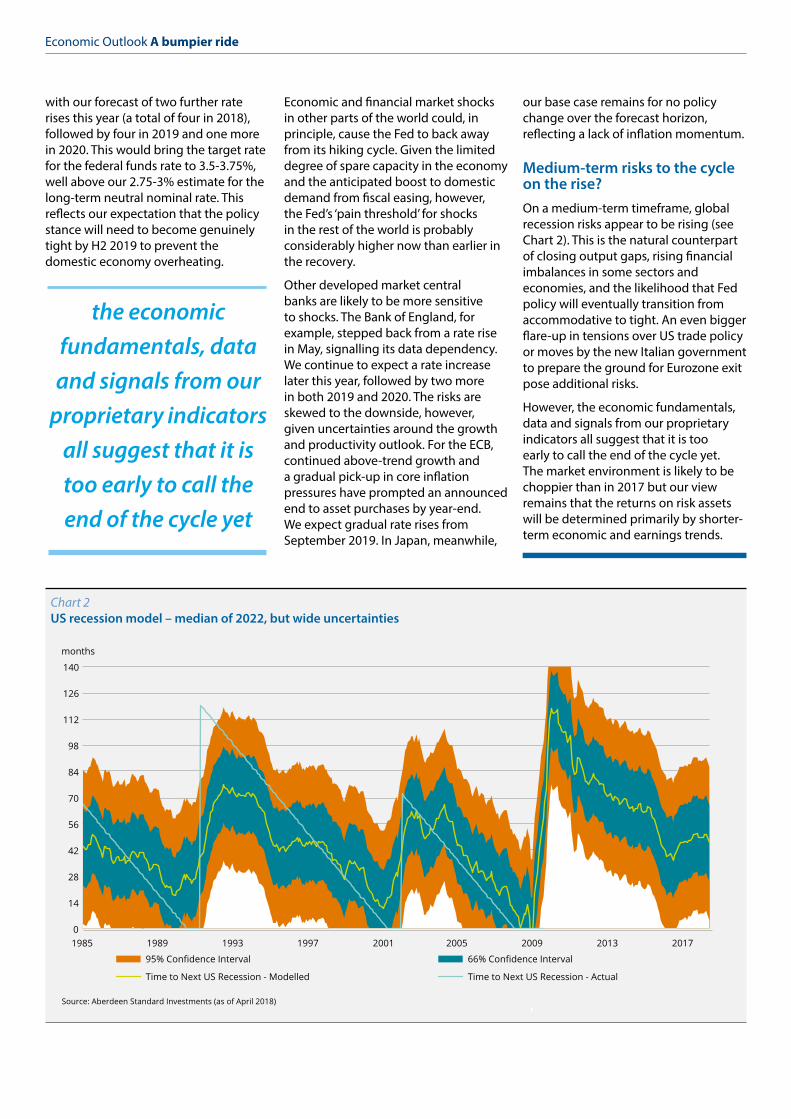
Medium-term risks to the cycle on the rise?On a medium-term timeframe, global recession risks appear to be rising (see Chart 2). This is the natural counterpart of closing output gaps, rising financial imbalances in some sectors and economies, and the likelihood that Fed policy will eventually transition from accommodative to tight. An even bigger flare-up in tensions over US trade policy or moves by the new Italian government to prepare the ground for Eurozone exit pose additional risks.
However, the economic fundamentals, data and signals from our proprietary indicators all suggest that it is too early to call the end of the cycle yet. The market environment is likely to be choppier than in 2017 but our view remains that the returns on risk assets will be determined primarily by shorter-term economic and earnings trends.
the economic fundamentals, data and signals from our
proprietary indicators all suggest that it is too early to call the end of the cycle yet
Chart 2 US recession model – median of 2022, but wide uncertainties
0
14
28
42
56
70
84
98
112
126
140
months
Source: Aberdeen Standard Investments (as of April 2018)
95% Confidence Interval 66% Confidence Interval
Time to Next US Recession - Modelled Time to Next US Recession - Actual
1985 1989 1993 1997 2001 2005 2009 2013 2017

Global Spotlight
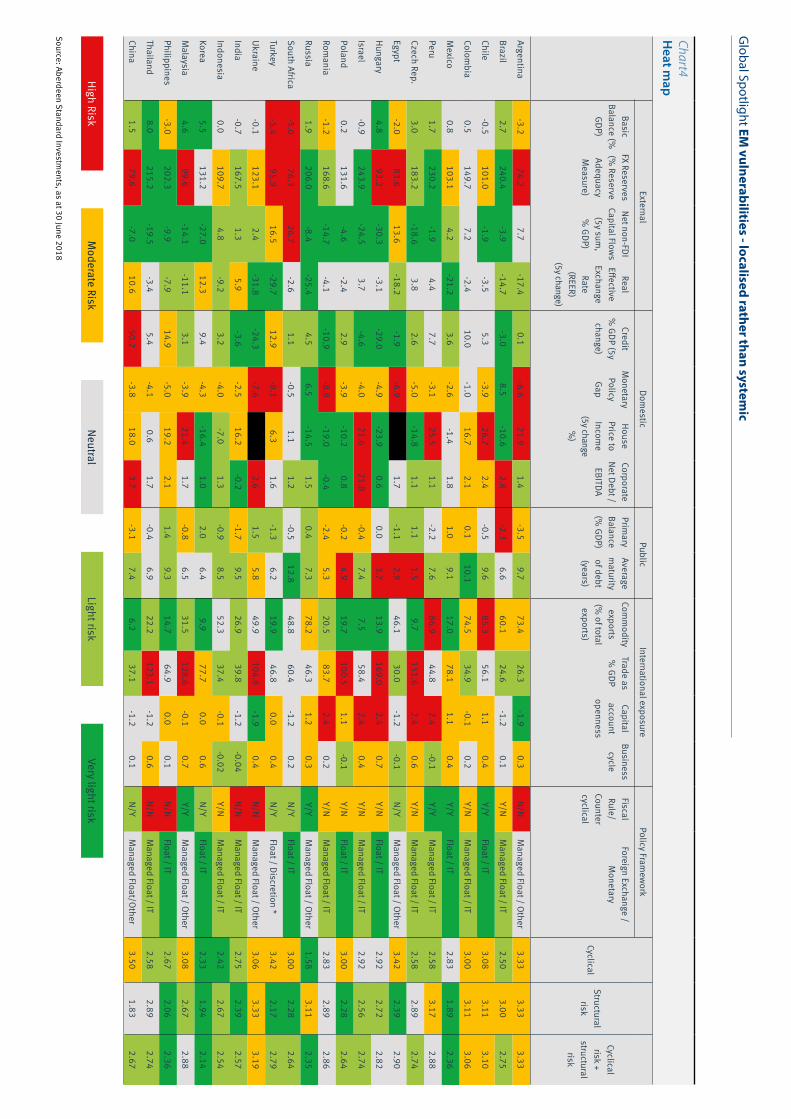
EM vulnerabilities – localised rather than systemicOur heatmap allows us to assess the extent and nature of crisis vulnerabilities across a wide range of emerging markets (EM). Argentina, Chile, Colombia, South Africa, Turkey and the Ukraine appear relatively more vulnerable to crises. In aggregate, however, systemic crisis risks appear low compared with previous episodes when EM assets were underperforming.
Yashaswini DungaEconomist, Research Institute
The changing macro and market backdropThe recent sell-off in EM assets has raised questions about their vulnerability to the withdrawal of US monetary policy accommodation and renewed strength in the US dollar. In the currency space, major movers have included the Argentinian peso, the Turkish lira, the Brazilian Real and the Russian rouble. In some cases, these falls have been larger than during the 2013 taper tantrum (see Chart 1). Meanwhile, the MSCI Emerging Markets Index has fallen, portfolio flows into EM have turned negative for the first time since November 2016 and yield spreads have widened significantly.
Pockets of external imbalancesThese developments tell us where investors currently see the greatest vulnerabilities to the changing environment. However, that also makes it a good time to take stock and examine what the fundamental drivers of vulnerability are telling us.
To do this, we have developed a heatmap that measures vulnerabilities along five dimensions – external imbalances, domestic private sector imbalances, public sector solvency risks, the quality of institutional
policy frameworks and the nature of economies’ exposure to external economic shocks – each of which has provided early warning signs before past crises.
Our external imbalances block has four components:
• a country’s current basic balance (the current account balance plus foreign direct investment flows);
• foreign reserve adequacy as measured by the IMF’s risk assessment matrix (RAM) indicator;
• the extent of non-foreign direct investment net capital flows over the past five years; and
• the cumulative change in the real exchange rate over the past five years.
For example, countries with large basic balance deficits, which are heavily reliant on short-term capital to finance those deficits, have low levels of foreign reserves and have overvalued exchange rates, will be much more vulnerable to sudden stops in capital flows and exchange rate crises.
Looking across the 23 emerging markets included in our analysis, aggregate external imbalances are greatest in South Africa, Turkey, Egypt and Argentina. South Africa has a large basic balance deficit, low levels of reserves and has relied on significant short-term
Chart1 Currency performance against 2013 taper tantrum
INR
BRL
TRY
ARS
ZAR
IDN
MXN RUS
THB
MYR PHP PEN CLP
PLN HUF
CZK
SGD COP HKD
CNY
UAH
-50
-40
-30
-20
-10
0
10
-35 -30 -25 -20 -15 -10 -5 0 5 10
Source: Haver (as of June 2018) Depreciation against USD % May- Aug 2013
Dep
reci
atio
n ag
ains
t USD
% F
eb- J
une
2018
Better than taper tantrum 2013
Worse than taper tantrum 2013
ILS KRW

Global Spotlight EM vulnerabilities - localised rather than systemic
capital inflows over the past five years. Turkey has a similar vulnerability, while Argentina screens as slightly less risky because its basic balance deficit is smaller (see Chart 2).
At the component level, low levels of reserve adequacy screen as the greatest source of vulnerability across the EM complex as a whole. In aggregate, however, external imbalances are fairly modest and certainly lower than they were on the eve of the Asian Crisis in 1996, or even the taper tantrum in 2013. Critically, the EM current account balance is currently in surplus and few countries have overvalued exchange rates.
Larger domestic private and public sector imbalancesWhile large external imbalances are almost always present in advance of EM crises, the extent of any domestic imbalances can amplify the effects of external shocks. Where large domestic imbalances are present but external imbalances are not, sudden stops in capital flows are much less of a risk but there is still vulnerability to periods of economic underperformance.
Our domestic imbalances block has six components:
• the change in the ratio of private sector credit to GDP over the past five years;
• the gap between the current central bank policy rate and the optimal policy rate;
• the change in the ratio of house prices to household income over the past five years;
• the ratio of aggregate corporate net debt to corporate earnings;
• the gap between the general government primary budget balance and the balance needed to achieve public debt sustainability; and
• the average maturity profile of the outstanding public debt stock.
In aggregate, domestic imbalances appear more pronounced than external imbalances. Most countries have veered towards loose monetary policy settings over recent years, though that is partly related to developments in the advanced economies. The most visible indicator of loose policy has been rapid house price growth in many of the economies. However, aggregate credit growth has been more restrained in recent years after a burst of strong growth immediately after the financial crisis.
Fiscal positions are another potential fault line. When EM growth was growing strongly earlier in the current global expansion, fiscal positions appeared relatively healthy. But, as trend growth has dropped and many countries experienced severe slowdowns or even recessions after 2013, fiscal positions have deteriorated and almost half of the economies we monitor currently have primary deficits that are too large to stabilise debt ratios at prevailing interest rates. In addition, there are a few economies – the Czech Republic, Egypt, Hungary and Poland – where the average maturity of government debt is low.
Fortunately, there is much less ‘original sin’ – whereby governments are forced to borrow in foreign currency – compared with the 1990s, which attenuates the risk of weak public balance sheets. Less positively, vulnerability to currency mismatches
has become more of a problem in the corporate sector as some countries have accumulated significant amounts of dollar and euro-denominated debt in the corporate sector. Looking at the latest figures, Argentina, Indonesia, and Mexico are most exposed to changes in dollar financing costs while the Czech Republic and Hungary have high proportions of euro-denominated debt.
This is a particularly dangerous combination. Turkey is one country where large private sector domestic imbalances have arisen alongside large external imbalances. Argentina’s domestic imbalances are not quite as acute but still signal vulnerabilities. Chile and Israel, on the other hand, have large domestic private sector imbalances – loose monetary policy, excessive house price growth and high corporate leverage in particular – but more modest external balances. Israel, for example, has a strong foreign reserve position and experienced very little non-FDI capital inflows over recent years.
Moderate latent structural risksCyclical external and internal imbalances tend to dominate discussions of crisis vulnerabilities in EM. However, it is also important to consider the extent to which a country is exposed to foreign economic and financial shocks as well as the quality of countries’ domestic macroeconomic institutions and policy framework.
For example, a high dependence on commodity exports, significant openness to trade in goods, services and capital flows, and correlated business cycles, can interact powerfully with internal or external imbalances to amplify the effects of external shocks. It can also leave countries vulnerable to recessions and reduce the ability to meet foreign obligations even when imbalances appear contained.
Meanwhile, the quality of a country’s policy framework will influence how domestic or foreign shocks are transmitted, not to mention the confidence foreign investors have in countries’ ability to cope with sudden changes in macroeconomic or financial conditions. For example, countries with flexible exchange rates and inflation-targeting regimes will be less vulnerable
Chart2 Basic balance as % GDP
2006 2007 2008 2009 2010 2011 2012 2013 2014 2015 2016 2017 -8
-6
-4
-2
0
2
4
6
Argentina South Africa Turkey Source: National sources, Haver (as of Q4 2017)
%
Basic balance (current account + FDI inflows) as % of GDP:

to speculative attacks or the perception that governments will make policy mistakes.
Our structural block therefore has the following six components:
• commodity exports as a share of total exports;
• international trade as a share of GDP;• the openness of a country’s capital
account;• the correlation of a country’s business
cycle with the US business cycle;• the degree to which fiscal policy is
counter-cyclical or pro-cyclical; and• the monetary policy and exchange
rate regime.In general, structural risk is lower than cyclical risk, partly reflecting the significant improvements that have been made to institutional frameworks since the 1990s. Fixed exchange rates are now relatively uncommon, which means that currencies can absorb more of the burden from external shocks. Inflation targeting is now commonplace, helping to anchor inflation expectations and reducing the risk premia investors require to hold EM assets. A number of countries have also put in place fiscal rules, which have made fiscal policy less pro-cyclical than in past cycles.
That said, there are latent structural vulnerabilities. Most of the Latin American economies in our heatmap are large commodity producers, leaving them sensitive to externally driven commodity price shocks. Central and Eastern European economies like the
Czech Republic, Hungary and Poland combine liberalised capital accounts with extremely high openness to trade, exposing them to financial shocks, and especially those emanating from the Eurozone. Although fiscal rules are in place in most economies, fewer have the ability to cushion economic shocks with looser fiscal policy. And there are more managed than fully floating exchange rate regimes.
China risk – not as large as it seemsThis edition of the heatmap includes China for the first time. China actually has the worst ‘cyclical’ risk score (the addition of its external and domestic imbalances) of all the economies we monitor, primarily because of its rapid accumulation of debt since the financial crisis.
However, although we expect the country’s domestic imbalances to constrain future growth in the near-term, we do not anticipate a crisis. That is primarily due to China’s unique combination of tight capital controls, direct government control over key economic sectors, including the largest banks, and a strong external position (debt accumulation has been financed out of domestic saving not foreign borrowing). This should allow for slow rather than rapid deleveraging as long as the government maintains its emphasis on slower and higher-quality credit growth. Moreover, some of the other factors that are lifting China’s risk score – namely the low level of reserve adequacy – overstate the economy’s reserve needs.
Indonesia and India – victims of changing EM sentiment?Indonesia and India are two test cases for our framework. Both have been caught up in the recent sell-off in EM assets, with their currencies weakening and sovereign yield spreads each widening by around 50 basis points. However, both screen as having low absolute and relative crisis vulnerability, with only modest external and internal imbalances, and a favourable structural risk profile thanks to their relatively closed economies, low correlations with the US business cycle and sound monetary policy frameworks. It is likely, therefore, that their recent underperformance is more related to the change in general EM sentiment, amplified by investor positioning.
All about fiscal in BrazilBrazil is a more interesting case. In the wake of its deep recession, most of its external and domestic private sector imbalances have unwound. However, corporate leverage remains high and public finances remain in a parlous state. Indeed, without a large and persistent fiscal consolidation the country’s ratio of public debt to GDP will continue to rise from already high levels by EM standards. The political outlook is also uncertain. With low potential growth after failing to introduce structural reforms during the boom years, the country remains vulnerable to changes in sentiment.
Our EM heat map allows us to systematically assess the vulnerabilities typically associated with crisis episodes. We find that Argentina, Chile, Colombia and the Ukraine display the greatest aggregate risks, though Egypt, Israel, Poland, South Africa, Turkey and Malaysia have a combination of external and internal imbalances that leave them vulnerable to changes in the macro environment. By region, risk vulnerabilities appear highest in Latin America and lowest in Asia (see Chart 3). Importantly, despite the recent underperformance of EM assets, the aggregate picture is more encouraging now than at any time since 2013. We therefore consider a systemic EM wide crisis to be a low-probability prospect.
Global Spotlight EM vulnerabilities - localised rather than systemic
Chart3 Overall risk scores
2.0
2.2
2.4
2.6
2.8
3.0
3.2
3.4
Mex
ico
Braz
il
Peru
Colo
mbi
a
Chile
Arge
ntin
a
Russ
ia
Pola
nd
Sout
h Af
rica
Czec
h Re
p
Turk
ey
Isra
el
Rom
ania
Hun
gary
Egyp
t
Ukr
aine
Kore
a
Phili
ppin
es
Indo
nesi
a
Indi
a
Chin
a
Thai
land
Mal
aysi
a
LatAm CEMEA Asia
Source: Aberdeen Standard Investments (as of June 2018)
Risk score
Aggregate risk scores by country
Global Spotlight EM
vulnerabilities - localised rather than systemic
Chart4 H
eat map
ExternalDom
esticPublic
International exposurePolicy Fram
ework
CyclicalStructural
risk
Cyclical risk +
structural risk
Basic Balance (%
GDP)
FX Reserves (%
Reserve Adequacy M
easure)
Net non-FDI Capital Flow
s (5y sum
, %
GDP)
Real Effective Exchange
Rate (REER)
(5y change)
Credit %
GDP (5y change)
Monetary Policy Gap
House Price to Incom
e (5y change
%)
Corporate Net Debt /
EBITDA
Primary
Balance (%
GDP)
Average m
aturity of debt (years)
Comm
odity exports
(% of total
exports)
Trade as %
GDPCapital account
openness
Business cycle
Fiscal Rule/
Counter cyclical
Foreign Exchange / M
onetary
Argentina-3.2
74.27.7
-17.40.1
-6.621.9
1.4-3.5
9.773.4
26.3-1.9
0.3N/N
Managed Float / Other
3.333.33
3.33
Brazil2.7
240.4-3.9
-14.7-3.0
8.5-10.6
2.8-2.3
6.660.1
24.6-1.2
0.1Y/N
Managed Float / IT
2.503.00
2.75
Chile-0.5
101.0-1.9
-3.55.3
-3.926.7
2.4-0.5
9.685.3
56.11.1
0.4Y/Y
Float / IT3.08
3.113.10
Colombia
0.5149.7
7.2-2.4
10.0-1.0
16.72.1
0.110.1
74.534.9
-0.10.2
Y/NM
anaged Float / IT3.00
3.113.06
Mexico
0.8103.1
4.2-21.2
3.6-2.6
-1.41.8
1.09.1
17.078.1
1.10.4
Y/YFloat / IT
2.831.89
2.36
Peru1.7
230.2-1.9
4.47.7
-3.125.5
1.1-2.2
7.686.9
44.82.4
-0.1Y/Y
Managed Float / IT
2.583.17
2.88
Czech Rep.3.0
183.2-18.6
3.82.6
-5.0-14.8
1.11.1
1.59.7
151.62.4
0.6Y/N
Managed Float / IT
2.582.89
2.74
Egypt-2.0
83.613.6
-18.2-1.9
-6.91.7
-1.12.9
46.130.0
-1.2-0.1
N/YM
anaged Float / Other3.42
2.392.90
Hungary4.8
93.2-30.3
-3.1-29.0
-4.9-23.9
0.60.0
3.713.9
169.02.4
0.7Y/N
Float / IT2.92
2.722.82
Israel-0.9
243.9-24.5
3.7-4.6
-4.021.6
21.8-0.4
7.47.5
58.42.4
0.4Y/N
Managed Float / IT
2.922.56
2.74
Poland0.2
131.6-4.6
-2.42.9
-3.9-10.2
0.8-0.2
4.919.7
100.51.1
-0.1Y/N
Float / IT3.00
2.282.64
Romania
-1.2168.6
-14.7-4.1
-10.9-8.8
-19.0-0.4
-2.45.3
20.583.7
2.40.2
Y/NM
anaged Float / IT2.83
2.892.86
Russia1.9
206.0-8.4
-25.44.5
6.5-14.5
1.50.4
7.378.2
46.31.2
0.3Y/Y
Managed Float / Other
1.583.11
2.35
South Africa-5.0
76.326.7
-2.61.1
-0.51.1
1.2-0.5
12.848.8
60.4-1.2
0.2N/Y
Float / IT3.00
2.282.64
Turkey-5.4
95.916.5
-29.712.9
-8.16.3
1.6-1.3
6.219.9
46.80.0
0.4N/Y
Float / Discretion *3.42
2.172.79
Ukraine-0.1
123.12.4
-31.8-24.3
-7.62.6
1.55.8
49.9104.8
-1.90.4
N/NM
anaged Float / Other3.06
3.333.19
India-0.7
167.51.3
5.9-3.6
-2.516.2
-0.2-1.7
9.526.9
39.8-1.2
-0.04N/N
Managed Float / IT
2.752.39
2.57
Indonesia0.0
109.74.8
-9.23.2
-4.0-7.0
1.3-0.9
8.552.3
37.4-0.1
-0.02Y/N
Managed Float / IT
2.422.67
2.54
Korea5.5
131.2-27.0
12.39.4
-4.3-16.4
1.02.0
6.49.9
77.70.0
0.6N/Y
Float / IT2.33
1.942.14
Malaysia
4.699.6
-14.1-11.1
3.1-3.9
21.41.7
-0.86.5
31.5128.6
-0.10.7
Y/YM
anaged Float / Other3.08
2.672.88
Philippines-3.0
202.3-9.9
-7.914.9
-5.019.2
2.11.4
9.314.7
64.90.0
0.1N/N
Float / IT2.67
2.062.36
Thailand8.0
215.2-19.5
-3.45.4
-4.10.6
1.7-0.4
6.922.2
123.1-1.2
0.6N/N
Managed Float / IT
2.582.89
2.74
China1.5
79.6-7.0
10.650.2
-3.818.0
3.7-3.1
7.46.2
37.1-1.2
0.1N/Y
Managed Float/Other
3.501.83
2.67
High RiskM
oderate RiskNeutral
Light riskVery light risk
Source: Aberdeen Standard Investments, as at 30 June 2018

A sharp reversal in performanceEM bond managers could be forgiven for feeling afflicted by the Chinese curse: “may you live in interesting times”. Strong Q1 performance in the local debt market, which was at odds with wider fixed income trends at the time, has been followed by a very weak Q2 in
both absolute and relative terms. In fact, there is little evidence that the origin of the curse was actually China, with the first recorded use of the phrase by British statesman Joseph Chamberlain and the ‘Chinese’ origin seemingly added by his son. Appropriately then, for the majority of EMs this year, performance has been driven less by domestic and more by external factors, particularly Federal Reserve policy, slower growth in the Eurozone and concerns about the trade policy agenda of the US administration.
Meanwhile, the domestic fundamentals of EM economies are in fact quite bondholder friendly. Growth is generally moderate and at or below potential trend levels, inflation is mostly at or below central bank target levels, and credit growth is moderate; supporting growth without building significant imbalances. Recent price action has cheapened currencies further from levels that were already below fair value in many instances, while also pricing interest rate hikes into all EM curves as the policy outlook for many is more stable. This creates a very interesting opportunity for investors.
A broad-based buying opportunity…Foreign investors have sold all the South African government bonds, and more, they bought after Cyril Ramaphosa’s victory at the ANC conference. This is despite real progress on replacing management at key institutions, on reforming the mining sector and towards a more coherent policy on land reform. In Mexico, data has been edging towards supporting rate cuts but concerns about the approaching election and currency volatility means Banxico has delivered a rate hike. In Brazil, meanwhile, the bond curve now prices the policy rate returning to the highs of the previous two cycles despite
inflation below target, a lacklustre recovery and high unemployment.
…Even in more challenged issuersMoreover, opportunities are growing even in areas where fundamentals have been less clearly positive. Turkey and Argentina have hit the headlines due to very weak currencies this year and, in both cases, growing current account deficits and high and rising inflation are clues that the economies have been growing too quickly. We have liked Argentina for some time
due to the government’s commitment to fiscal reform and our expectation that monetary policy would be kept sufficiently tight. However, in reality the former has been too gradual and the commitment to the latter was
Emerging Market Debt
Sell-off creates investment opportunities After strong performance through 2017 and early 2018, emerging market (EM) debt has underperformed amid a rising US dollar and fears financial conditions were tightening too rapidly. However, this has created numerous buying opportunities as EM fundamentals remain sound and supportive of bond prices.
Kieran CurtisInvestment Director, Emerging Market Debt
opportunities are growing even in areas where fundamentals have been less clearly
positive
the domestic fundamentals of EM
economies are in fact quite bondholder
friendly

questioned when rates were cut in January. Argentina has now agreed an IMF programme that involves faster rebalancing of the fiscal account and interest rates have been raised to 40%. While some overshoot is not impossible, we think the peso is a little cheap to fair value even assuming higher-than-expected inflation for the remainder of this year. Investors can monetise these high interest rates through bonds linked directly to the policy rate.
Turkish authorities took a little longer to react to recent adverse market dynamics but the steps taken since have been decisive. Crucially, we think that the rise
in policy rates to 17.75% will have quite a big impact on growth given how credit intensive the economy has become. Slower growth should bring both the current account deficit and inflation to levels that are more manageable and ultimately has the chance to deliver some compelling returns to bondholders. Politicians in Turkey have traditionally preferred lower interest rates so it will pay to be vigilant on the re-emergence of political pressure on the central bank. However, as with Argentina, investors are handsomely compensated for this risk.
Looking for the triggersHigh yields, adjusted for inflation, in EM compared with developed market peers offer very attractive compensation for the risks to the outlook, such as deterioration in global trade policy and tightening by developed market central banks. Meanwhile, systemic risks are quite low compared with recent years, as shown by the Aberdeen Standard Investments EM heatmap. Policy response by EM governments, a stabilisation of the dollar and a pick-up in European data are all factors that could trigger a rebound. A calming in trade tensions between the US and China would also be beneficial as it would make investors less fearful about EM economies being caught in the cross-hairs of a bigger conflict.Interesting times for sure.
Chart 1 More than compensating for risk
2008 2009 2010 2011 2012 2013 2014 2015 2016 2017 2018 -2
-1
0
1
2
3
4
5
Emerging markets* Developed markets**
Source: HSBC, IMF (as of May 2018)
%
10 year real yield:
* PPP weighted average of Brazil, China, India, Indonesia, Mexico, Poland, South Africa, and Turkey** PPP weighted average of Germany, Japan, UK, and the US

US dollar cycles – significant moves but with prolonged periods of calmSince the floating era began in 1973, the Federal Reserve’s real USD traded-weighted index has been subject to long appreciation and depreciation regimes that have often taken it a long way from measures of fair value (see Chart 1). However, there have also been prolonged periods of relative dollar stability. In the six years after H2 1974, the USD drifted 8% lower at an annual average of only 1.4%. Between 1987 and 1996, the USD only eased 3.7% lower at an annual average of 0.4%. Finally, between 2010 and 2014, the real exchange rate appreciated 1.4% for an annual rate of 0.4%.
A different pattern to the current appreciation regimeIn 2015, we argued that although the dollar was likely to remain in an appreciation regime for some time, most of the gains were likely to have been front-loaded. However, we also argued that the upward trend was unlikely to reverse as quickly as it did in the 1985 and 2002 cycles. This is broadly how things have played out. The dollar’s local peak was at the end of 2016 and
though it did weaken through 2017, its recent rally has left it just 4% down over the past 18 months.
Reassessing the interest rate driver…While the net change in the dollar since 2015 has been broadly in line with expectations, we have had to update our views on the relative importance of its different drivers, especially after the dollar depreciated more than we expected during 2017. In our 2015 note, we placed quite a lot of weight on interest rate differentials as a positive driver, noting that other major countries were unlikely to be able to match either short or long US rates for a considerable period. That appeared to augur well for the dollar last year.
Though our expectations for relative interest rates have generally been validated, other drivers have been more important for explaining movements in the dollar over the past 18 months. One has been changes in the relative slope of yield curves in core government bond markets, with flows last year tending to move in the direction of countries with steepening rather than flattening curves. Looking forward, we do not expect yield curve developments to help the dollar much. The Federal
Reserve’s tightening cycle will likely continue to flatten the US curve, while we expect the European curve to steepen as the European Central Bank continues to anchor short rates at low levels while ending its asset purchase programme later this year.
…As well as the role of global growthChanging patterns in global growth have also been critical for understanding the transitions to different dollar regimes. Historically, the trade-weighted dollar has tended to appreciate in two types of environment: global downturns or recessions; and periods in which economic growth is accelerating more in the US than elsewhere. In both cases, risk-adjusted returns on US assets
Currency
US dollar regimes, revisited In this article we update our previous assessment of US dollar (USD) regimes and suggest that a period of relative stability is more likely than a major upswing or downswing. Ken Dickson
Investment Director, Currency
we do not expect yield curve
developments to help the dollar much

are likely to be superior to returns outside the US, and capital flows reflect that reality. Conversely, the dollar has tended to depreciate during synchronised global upswings, when expected risk-adjusted returns appear to be higher outside the US.
Through 2017, not only was the global growth environment strong, but growth expectations were consistently revised up more outside the US than in it. The reverse has been true since January, as investors have digested the implications of the large US fiscal stimulus and European growth has been unexpectedly weak. Moreover, these dollar cycles can be self-sustaining. For example, a stronger dollar will tend to tighten US dollar liquidity conditions outside the US, weighing on foreign growth, and pushing investors to take even stronger dollar positions until a
major change in the growth or policy environment breaks the cycle. Looking ahead, US growth will remain supported by tax cuts and increased government spending over coming months. However, growth expectations outside the US have arguably fallen too low.
Current signalling is not strongThe upshot of our analysis is that it never pays to put too much weight on any single driver of currencies.
Large swings in the dollar are usually due to a confluence of forces and there are many episodes where the dollar tracks broadly sideways as the different forces offset one another. We may now be in one of these directionless episodes. There is no valuation case for a much stronger or weaker dollar. Interest rate and growth signals are not very strong and they are partially offsetting where they do exist.
Chart 1 Dollar dynamics
1973 1977 1981 1985 1989 1993 1997 2001 2005 2009 2013 2017 80 85 90 95
100 105 110 115 120 125 130
US Trade Weighted Real Broad Dollar Index
Source: Federal Reserve, Bloomberg (as of 31 May 2018)
Index level
-21.8%
-34.6%
-28.8%
52.7%
34.2%
28.7% There is no valuation
case for a much stronger or weaker
dollar

Slight shift towards more hawkish policy in the short termThe June FOMC meeting and press conference tilted the outlook for monetary policy in a modestly more hawkish direction compared to previous meetings. Specifically, the median dot plot forecast for hikes in 2018 moved from three to four, in line with what Governor Powell viewed as an economy which is doing “very well”. Importantly though, the peak in the federal funds rate was seen as unchanged, with just a slightly quicker pace of hiking expected this year.
For us this makes sense. While economic activity in Europe has eased, US growth remains sound and is likely to continue to benefit from the extraordinary measures announced by the Trump administration earlier in the year. One can doubt the extent to which US interest rates can continue to rise in isolation; however, the current domestic backdrop speaks for a continued rise in the federal funds rate, which should
keep US Treasuries under pressure. However, there are additional factors changing the valuation dynamic for bonds that investors must carefully consider.
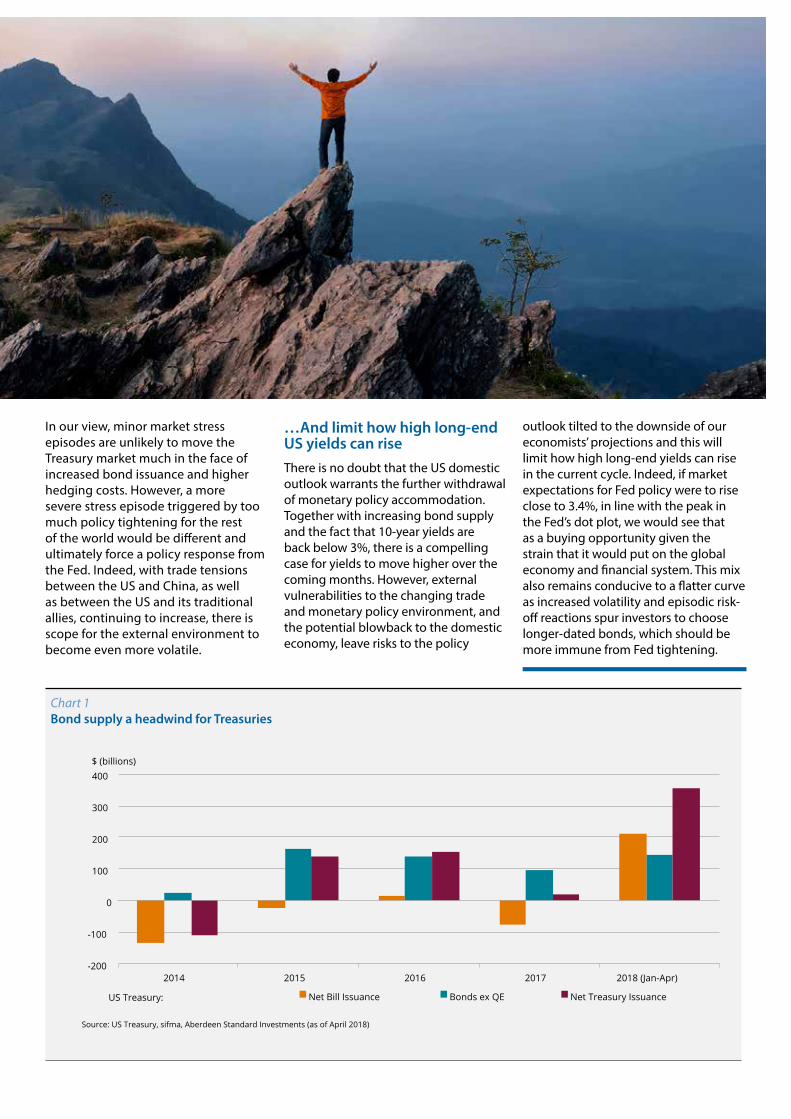
Widening LIBOR-OIS spreads pressuring funding marketsThe spread between US dollar LIBOR (London Interbank Offered Rate) and OIS (Overnight Indexed Swap) curves widened considerably in Q1 as a confluence of factors resulted in funding markets squeezing higher. The first of these was regulatory change that has had an impact on supply and demand for certain types of LIBOR-linked securities. The second is US monetary policy and treasury issuance (see Chart 1), both of which have become more active recently. The one-off rebuild of the Treasury General Cash account added extra pressure on short-term funding markets; however, the combination of higher treasury issuance and previous regulatory change are more permanent in nature. For this reason, we expect the US LIBOR-OIS curve to remain relatively elevated.
In addition to tightening financial conditions, widening spreads have had the undesirable effect of reducing the attractiveness of Treasuries as a safe-haven asset for international investors because funding purchases has become increasingly expensive. The changing dynamics outlined above reinforce our bias to remain short of US duration over the short term. Whereas in the past
treasuries offered attractive yields for international investors, recent trends regarding interest rate divergence and contrasting supply profiles have altered the assumed ‘fair value’ for Treasuries in a global context.
Feedback loops may constrain policy divergence…From a more medium-term view, however, the factors driving US bonds cannot occur in a vacuum. While Governor Powell played down the impact of Fed policy on global markets, and our economists’ central view is for six more rate hikes by the end of 2019, there are realistic scenarios in
which the Fed would not be able to increase rates so much and so quickly. In particular, there is a meaningful risk that further Fed tightening will have a knock-on effect on the US dollar, further tightening dollar liquidity conditions and cause a more severe sell-off in broader risk assets.
Government bonds
US bond yields: further to climb US government bonds should continue to exhibit weakness as a unique mix of increasing deficits, rising short-term policy rates and a shrinking Federal Reserve (Fed) balance sheet puts the market on a different course from its peers. But there are limits to how high yields can rise.
Liam O’DonnellInvestment Director, Government Bonds
the current domestic backdrop speaks for a continued rise in
the federal funds rate
there is a compelling case for yields to
move higher over the coming months
In our view, minor market stress episodes are unlikely to move the Treasury market much in the face of increased bond issuance and higher hedging costs. However, a more severe stress episode triggered by too much policy tightening for the rest of the world would be different and ultimately force a policy response from the Fed. Indeed, with trade tensions between the US and China, as well as between the US and its traditional allies, continuing to increase, there is scope for the external environment to become even more volatile.
…And limit how high long-end US yields can riseThere is no doubt that the US domestic outlook warrants the further withdrawal of monetary policy accommodation. Together with increasing bond supply and the fact that 10-year yields are back below 3%, there is a compelling case for yields to move higher over the coming months. However, external vulnerabilities to the changing trade and monetary policy environment, and the potential blowback to the domestic economy, leave risks to the policy
outlook tilted to the downside of our economists’ projections and this will limit how high long-end yields can rise in the current cycle. Indeed, if market expectations for Fed policy were to rise close to 3.4%, in line with the peak in the Fed’s dot plot, we would see that as a buying opportunity given the strain that it would put on the global economy and financial system. This mix also remains conducive to a flatter curve as increased volatility and episodic risk-off reactions spur investors to choose longer-dated bonds, which should be more immune from Fed tightening.
Chart 1 Bond supply a headwind for Treasuries
2014 2015 2016 2017 2018 (Jan-Apr) -200
-100
0
100
200
300
400
Net Bill Issuance Bonds ex QE Net Treasury Issuance
Source: US Treasury, sifma, Aberdeen Standard Investments (as of April 2018)
$ (billions)
US Treasury:

About Aberdeen Standard InvestmentsAberdeen Standard Investments is a leading global asset manager dedicated to creating long-term value for clients. To achieve this, we offer a comprehensive range of investment capabilities, as well as the highest levels of service.
Overall, we manage £576 billion* on behalf of clients in 80 countries. In managing these assets, we employ over 1,000 investment professionals and provide client support from 49 client relationship offices globally.
The Aberdeen Standard Investments brand was created in connection with the merger of Aberdeen Asset Management PLC and Standard Life Plc on 14 August 2017 to form Standard Life Aberdeen plc.
*Standard Life Aberdeen plc as at 31 December 2017.
Our industry-leading publicationsOur global strategists combine valuable experience, thorough research and analysis to tackle major issues of the moment.
To provide first-hand insight into the issues that are currently driving markets, we produce a series of flagship publications.
Publications
Weekly Economic Briefing
A regular analysis of major cyclical developments and structural themes in leading advanced and emerging economies.
Thinking Aloud
Opinion, thoughts and insight on the economic and market developments affecting investors.
Global Outlook
A monthly publication which includes a series of articles that examine investment trends and developments in each of the major asset classes, rotating between macro, country and sector or company-specific insights.
Global Horizons
An occasional report that captures the in-depth research of longer-term themes. We also periodically examine the major changes that are likely to influence financial markets in the coming years.
Long-Term Investment Outlook & Strategic Asset Allocation
A regular update of our in-depth analysis of long-term investment returns across a wide range of asset classes and different time periods, including suggestions for the strategic asset allocation implications for clients.
Important information Investors should be aware that past performance is not a guide to future results. The value of investments, and the income from them, can go down as well as up and investors may get back less than the amount invested.
Aberdeen Standard Investments is a brand of the investment businesses of Aberdeen Asset Management and Standard Life Investments.
This document should not be considered as an offer, investment recommendation, or solicitation, to deal in any investments or funds mentioned herein and does not constitute investment research. Aberdeen Standard Investments does not warrant the accuracy, adequacy or completeness of the information and materials contained in this document and expressly disclaims liability for errors or omissions in such information and materials.
Any research or analysis used in the preparation of this document has been procured by Aberdeen Standard Investments for its own use and may have been acted on for its own purpose. The results thus obtained are made available only coincidentally and the information is not guaranteed as to its accuracy. Some of the information in this document may contain projections or other forward looking statements regarding future events or future financial performance of countries, markets or companies. These statements are only predictions and actual events or results may differ materially.
All information, opinions and estimates in this document are those of Aberdeen Standard Investments, and constitute our best judgement as of the date indicated and may be superseded by subsequent market events or other reasons. Aberdeen Standard Investments reserves the right to make changes and corrections to any information in this document at any time, without notice.
The reader must make their own assessment of the relevance, accuracy and adequacy of the information contained in this document and make such independent investigations, as they may consider necessary or appropriate for the purpose of such assessment. This material serves to provide general information and is not meant to be investment, legal or tax advice for any particular investor. No warranty whatsoever is given and no liability whatsoever is accepted for any loss arising whether directly or indirectly as a result of the reader, any person or group of persons acting on any information, opinion or estimate contained in this document.
This material is not to be reproduced in whole or in part without the prior written consent of Aberdeen Standard Investments.
Any data contained herein which is attributed to a third party (“Third Party Data”) is the property of (a) third party supplier(s) (the “Owner”) and is licensed for use by Standard Life Aberdeen**. Third Party Data may not be copied or distributed. Third Party Data is provided “as is” and is not warranted to be accurate, complete or timely. To the extent permitted by applicable law, none of the Owner, Standard Life Aberdeen** or any other third party (including any third party involved in providing and/or compiling Third Party Data) shall have any liability for Third Party Data or for any use made of Third Party Data. Past performance is no guarantee of future results. Neither the Owner nor any other third party sponsors, endorses or promotes the fund or product to which Third Party Data relates.
**Standard Life Aberdeen means the relevant member of Standard Life Aberdeen group, being Standard Life Aberdeen plc together with its subsidiaries, subsidiary undertakings and associated companies (whether direct or indirect) from time to time
Risks of investing:This document is not a complete list or explanation of the risks involved and investors should read the relevant offering documents and consult with their own advisors before investing.
Available for distribution by the following affiliates in the relevant countries:
Aberdeen Standard Investments is the marketing name in Brazil for Aberdeen do Brasil Gestão de Recursos Ltda. Aberdeen do Brasil Gestão de Recursos Ltda. is an entity duly registered with the Comissão de Valores Mobiliários (CVM) as an investment manager.
Canada: Standard Life Investments (USA) Ltd, Aberdeen Asset Management Inc., Aberdeen Fund Distributors, LLC, and Aberdeen Asset Management Canada Limited. Standard Life Investments (USA) Ltd. is registered as an Exempt Market Dealer and Portfolio Manager in each of the Canadian provinces and territories and an Investment Fund Manager in the Canadian provinces of Ontario, Quebec and Newfoundland and Labrador. Aberdeen Asset Management Inc. is registered as a Portfolio Manager in the Canadian provinces of Ontario, New Brunswick, and Nova Scotia and as an Investment Fund Manager in the provinces of Ontario, Quebec, and Newfoundland and Labrador. Aberdeen Asset Management Canada Limited is registered as a Portfolio Manager in the province of Ontario. Aberdeen Fund Distributors, LLC, operates as an Exempt Market Dealer in all provinces and territories of Canada. Aberdeen Fund Distributors, LLC, and Aberdeen Asset Management Canada Limited, are wholly owned subsidiaries of Aberdeen Asset Management Inc. Aberdeen Asset Management Inc. is a wholly-owned subsidiary of Standard Life Aberdeen plc.
In the United States, Aberdeen Standard Investments is the marketing name for the following affiliated, registered investment advisers: Aberdeen Asset Management Inc., Aberdeen Asset Managers Ltd., Aberdeen Asset Management Ltd., Aberdeen Asset Management Asia Ltd., Aberdeen Asset Capital Management, LLC, Standard Life Investments (Corporate Funds) Ltd., and Standard Life Investments (USA) Ltd.
United Kingdom, Norway and EU Countries by Aberdeen Asset Managers Limited. Authorised and regulated by the Financial Conduct Authority in the United Kingdom. Registered Office: 10 Queen’s Terrace, Aberdeen AB10 1YG. Registered in Scotland No. 108419.
Switzerland by Aberdeen Asset Managers Switzerland AG (AAMS). Registered in Switzerland No. CH-020.3.033.962-7. Registered Office: Schweizergasse 14, 8001 Zurich. Authorised by the Swiss Financial Market Supervisory Authority (FINMA).
Abu Dhabi Global Market (“ADGM”) by Aberdeen Asset Middle East Limited. Regulated by the ADGM Financial Services Regulatory Authority. Aberdeen Asset Middle East Limited, Al Sila Tower, 24th Floor, Abu Dhabi Global Market Square, Al Maryah Island, PO Box 5100737, Abu Dhabi, United Arab Emirates.
Singapore by Aberdeen Asset Management Asia Limited, Registration Number 199105448E.
Hong Kong by Aberdeen Standard Investments (Hong Kong) Limited. This document has not been reviewed by the Securities and Futures Commission.
The People’s Republic of China (“PRC”) by Aberdeen Standard Asset Management (Shanghai) Co., Ltd in the PRC only.
Australia and New Zealand by Aberdeen Asset Management Limited ABN 59 002 123 364, AFSL No. 240263. In New Zealand to wholesale investors only as defined in the Financial Markets Conduct Act 2013 (New Zealand).
Malaysia by Aberdeen Asset Management Sdn Bhd, Company Number: 690313-D and Aberdeen Islamic Asset Management Sdn Bhd, Company Number: 827342-W.
Thailand by Aberdeen Asset Management Company Limited.
Japan by Aberdeen Standard Investments (Japan) Limited.
Standard Life Investments companies
Standard Life Investments Limited is registered in Scotland (SC123321) at 1 George Street, Edinburgh EH2 2LL. Standard Life Investments Limited is authorised and regulated in the UK by the Financial Conduct Authority.
Standard Life Investments Limited, a company registered in Ireland (904256) 90 St Stephen’s Green Dublin 2, is authorised and regulated in the UK by the Financial Conduct Authority.
Calls may be monitored and/or recorded to protect both you and us and help with our training.
© 2018 Standard Life Aberdeen, images reproduced under licence
Investment involves risk. The value of investments, and the income from them, can go down as well as up and an investor may get back less than the amount invested. Past performance is not a guide to future results.
Aberdeen Standard Investments is a brand of the investment businesses of Aberdeen Asset Management and Standard Life Investments.
Visit us online
aberdeenstandard.comGB-301017-50078-2 ASI_0066_Global Outlook_Jul_TCM