global navigator - hsbc
TRANSCRIPT

6 January 2021
Global Navigator

2
Source:
Key events and performance of the Indian market (Nifty 50 and Nifty 500 rebased to 1000) in January 2020 – 31 December 2020
This slide is for illustration purposes only and does not constitute investment research, investment advice or a recommendation to any reader of this content to buy or sell investment product. Investors should seek financial advice regarding
the appropriateness of investing in any securities or investment strategies that may have been discussed in this report and should understand that the views regarding future prospects may or may not be realised.
Data ended December 2020 except otherwise mentioned. Past performance is not indicative of future performance.
Optimism about Covid-19 vaccine, US stimulus package and Brexit deal buoyed Nifty 50; the benchmark jumped 8% in December
Looking back – Events and India Markets
5
6
7
8
9
300
500
700
900
1100
1300
1500
Jan
-20
Fe
b-2
0
Ma
r-2
0
Ap
r-20
Ma
y-2
0
Jun
-20
Jul-
20
Au
g-2
0
Se
p-2
0
Oct-
20
Nov-2
0
Dec-2
0
10
-year
yie
ld m
ovem
ent (%
)
Index m
ovem
ent
Nifty 50 Nifty 500 Nifty Midcap 150 Index 10-year benchmar yield (RHS)Index rebased to 1000
Gradual
reopening of
domestic and
global
economies
Positive Indian
factory activity &
GST numbers;
accommodative
stance by RBI
US election uncertainty, rise in Covid-19 cases &
global economic recovery worries
Covid-19
vaccine hopes,
expectations of
fresh US
stimulus
measures
RBI’s liquidity
boosting
measures,
government
measures to
boost
consumer
demand
Optimism about Covid-19
vaccine, US stimulus
package and the Brexit
deal
RBI kept
interest rate
unchanged,
weak domestic
economic data
Positive IIP data
& strong
earnings from
an IT major
Concerns about impact of coronavirus crisis, and lockdowns on the global as well as
local economy & fears of a second wave of the pandemic
RBI
maintains
accomodati
ve stance
RBI cuts
repo rate by
75 bps &
govt rolls out
Rs 1.7 lakh
crore
package
Measures
announced
by RBI and
government
to support
the economy
US-China tensions

3
Global Economic Update
GDP Inflation Industrial Growth
Current Previous Current Previous Current Previous
US33.4%
Q3 2020
-31.4%
Q2 2020
0.2%
Nov’20
0.0%
Oct’20
0.4%
Nov’20
0.9%
Oct’20
Eurozone-4.3%
Q3 2020
-14.7%
Q2 2020
-0.3%
Nov’20
-0.3%
Oct’20
2.1%
Oct’20
0.1%
Oct’20
UK16.0%
Q3 2020
-18.8%
Q2 2020
0.3%
Nov’20
0.7%
Oct’20
-5.5%
Oct’20
-6.3%
Sep’20
China4.9%
Q3 2020
3.2%
Q2 2020
-0.5%
Nov’20
0.5%
Oct’20
7.0%
Nov’20
6.9%
Oct’20
Japan22.9%
Q3 2020
-29.2%
Q2 2020
-0.9%
Nov’20
-0.7%
Oct’20
0.0%
Nov’20
4.0%
Oct’20
India-7.5%
Q2 2020
-23.9%
Q1 2020
6.93%
Nov’20
7.61%
Oct’20
3.6%
Oct’20
0.5%
Sep’20
Major Global Central Bank Latest Key Interest rate
US Federal Reserve 0.00-0.25%
Bank of England 0.10%
European Central Bank 0.00%
Bank of Japan -0.10%
India 4.00%
Source: Bloomberg, Respective Central Banks, IMF. Data ended December 2020 except otherwise mentioned
Sharp rebound likely this year after previous year’s downfall
2.8
8.2
5.2
8.8
2.3
2.8
5.9
3.1
0.0 2.0 4.0 6.0 8.0 10.0B
razil
Chin
aE
uro
zone
India
Jap
an
Russia
UK
US
IMF GDP Projections for 2021

4
Global Economic Update
Source : CRISIL. Data ended December 2020 except otherwise mentioned
US Q3 GDP growth revised upwards; Fed keeps interest rate near zero
• The US’ revised upwards its gross domestic product (GDP) growth in the third quarter to 33.4% from 33.1% reported earlier. This compares with a contraction of
31.4% in the previous quarter.
• Meanwhile, the US Federal Reserve (Fed), in its December policy meeting, kept the target range for federal funds rate at 0-0.25% and signalled that it plans to
continue its asset purchase programme until the economy shows substantial progress towards the central bank's goals of maximum employment and price
stability.
• Among other key developments, US President Donald Trump signed into law a $2.3 trillion pandemic aid and spending package.
Key economic indicators
• Non-farm payrolls rose 245,000 in November followed by a reading of 610,000 for October. Unemployment rate fell to 6.7% in November from 6.9% in October
• ADP said the private sector employment rose 307,000 jobs in November after climbing a revised 404,000 in October
• Consumer price index (CPI) rose 0.2% in November after remaining unchanged in October
• Retail sales tumbled 1.1% in November following a 0.1% fall in October
• Industrial production climbed 0.4% in November following a 0.9% growth in October; capacity utilisation of the industrial sector, meanwhile, increased to 73.3%
from a revised 73%
• Manufacturing PMI posted 57.1 in December, up from 56.7 in November while services PMI was 55.3 compared with 58.4. The composite PMI was 55.7
compared with 58.6
• Producer price index (PPI) for final demand inched up 0.1% in November after climbing 0.3% in October
• University of Michigan consumer sentiment index rose to 81.4 in December from 76.9 in November
• Consumer confidence index fell to 88.6 in December from 92.9 in November
• Construction spending increased 0.9% to $1.46 trillion in November, the highest level since the government started tracking the series in 2002; data for October
was revised higher to show construction outlays accelerating 1.6%.
• The NAHB Housing Market Index slid to 86 in December after climbing to 90 in November
• Housing starts jumped 1.2% to an annual rate of 1.55 million in November from a revised October rate of 1.53 million; building permits spiked 6.2% to an annual
rate of 1.64 million from 1.54 million during the period
• Existing home sales tumbled 2.5% to an annual rate of 6.69 million in November after jumping 4.4% to a revised rate of 6.86 million in October
• New home sales plunged 11% to an annual rate of 841,000 in November after sliding 2.1% to a revised rate of 945,000 in October
US Fed keeps rates near zero; economy surged in the third quarter

5
Global Economic Update
Source: CRISIL. Data ended December 2020 except otherwise mentioned
ECB expands bond buying as Covid-19 resurgence weighs on the euro area’s economic recovery
• The European Central Bank (ECB) increased Pandemic Emergency Purchase Program by 500 billion euros to 1.85 trillion euros, and extended it by nine
months to at least the end of March 2022. The central bank held interest rates on its main refinancing operations, marginal lending facility and deposit facility at
0.00%, 0.25% and -0.50%, respectively.
• Eurozone GDP declined 4.3% on-year in the third quarter of 2020 after contracting 14.7% in the previous quarter.
• The European Union entered into an investment deal that will give European companies greater access to China and help redress what Europe sees as
unbalanced economic ties.
Key Eurozone economic indicators
• Eurozone retail sales rose 1.5% on-month in October after a 1.7% monthly slump in September
• Jobless rate fell marginally to 8.4% in October from 8.5% in the previous month
• ZEW economic sentiment rose 21.6 points to 54.4 in December
• Consumer prices were down 0.3% on a yearly basis in November, at the same rate as in October
• Industrial output expanded 2.1% on month in October, faster than the 0.1% rise seen in September
• Manufacturing PMI was 55.2 in December compared with 53.8 in November and services PMI was 47.3 compared with 41.7.
• Consumer confidence rose to -13.9 in December from -17.6 in November
BoE holds interest rate steady; UK, EU reach post-Brexit trade agreement
• The Bank of England (BoE) kept its main lending rate at 0.1%, after cutting twice from 0.75% since the onset of the pandemic in March. It also retained its target
stock of asset purchases at 895 billion pounds ($1.2 trillion).
• The economic recovery during July-September was better than expected, with GDP growth getting revised to a record 16.0% from the previous estimate of
15.5%. In the second quarter, the economy had slumped 18.8%.
• Among other key developments, the UK and the European Union reached a post-Brexit trade deal which ensures the two sides can continue to trade in goods
without tariffs or quotas..
Key UK economic indicators
• The country’s industrial production rose 1.3% on-month in October compared with 0.5% gain in September. On an annualised basis, industrial output fell 5.5% in
October, as against a 6.3% decline in September
• CPI weakened to a three-month low of 0.3% on year in November from 0.7% in October.
The UK and the EU enter into a post-Brexit trade agreement

6
Global Economic Update
Source: CRISIL. Data ended December 2020 except otherwise mentioned
China lowers 2019 GDP growth to 6.0%
• China revised down its GDP growth for 2019 to 6.0% from the previously reported 6.1%. The People's Bank of China retained the one-year loan prime rate at
3.85% and the five-year loan prime rate at 4.65%.
Key Chinese economic indicators
• The country’s CPI fell 0.5% in November from a year earlier – the first decline since October 2009 –after rising 0.5% in October. Producer price index,
meanwhile, fell 1.5% on-year after a 2.1% drop in October
• Exports in November surged 21.1% on-year and imports rose 4.5%, resulting in a record trade surplus of $75.42 billion compared with a surplus of $58.44 in the
previous month
• Industrial production grew 7% on-year in November, after rising 6.9% in October
• Retail sales rose 5% on-year in November compared with 4.3% a month ago
• Fixed asset investment grew 2.6% in the first 11 months of the year from the same period in 2019, compared with 1.8% growth in the first 10 months of the year.
• Industrial profits rose 15.5% on-year in November to 729 billion yuan following a 28.2% gain in October
• Official manufacturing PMI fell to 51.9 in December from 52.1 in November, while non-manufacturing PMI fell to 55.7 from 56.4
• Caixin/ Markit manufacturing PMI fell to 53.0 in December from 54.9 in November
Japan unveils $708 billion fresh stimulus; Jul-Sept GDP growth upgraded to 22.9%
• Japan’s economy grew an annualised 22.9% during July-September compared with the preliminary figure of 21.4%. In April-June, the economy had contracted
29.2%.
• Japan rolled out a fresh $708 billion economic stimulus package to speed up the recovery. The new package will include about 40 trillion yen ($384.54 billion) in
direct fiscal spending and initiatives targeted at reducing carbon emissions and boosting adoption of digital technology.
• The cabinet approved a record $1.03 trillion budget draft for the next fiscal year starting in April 2021.
• Among other developments, the Bank of Japan’s (BoJ) board voted 8-1 to retain interest rate at -0.1% on current accounts that financial institutions maintain
with the central bank.
Key Japanese economic indicators
• Core machinery orders surged 17.1% in October, recouping the previous month’s 4.4% fall
• Exports fell 4.2% in November from a year earlier and imports dropped 11.1%, resulting in a trade surplus of 366.8 billion yen
• Core consumer prices dropped 0.9% in November from a year earlier compared with October’s 0.7% fall
Japan rolls out a stimulus package to boost the economy

7
US Fixed Income Markets - Overview
US treasury prices fell in December
• The US treasuries declined in December, with the yield of the 10-year bond settling at 0.91% on December 31 compared with 0.84% on November 30.
• Sentiment for safe haven Treasuries was dented after the US Fed pledged to maintain its bond-buying programme until the economy returns to full employment.
• Treasury prices fell further after US President Donald Trump signed into law a $2.3-trillion pandemic aid and spending package.
• More bond selling was seen after the UK and the European Union (EU) negotiated a post-Brexit trade deal and France decided to reopen its borders to
passengers from Britain.
• Some discouraging US domestic economic data and concerns about the impact of the more infectious variant of Covid-19 on global economic growth triggered
bond purchases.
Global bond yields
31-Dec 30-Nov Change
US 10-Year (%) 0.91 0.84 0.07
UK 10-Year (%) 0.20 0.38 -0.18
German 10-Year (%) -0.58 -0.57 -0.01
Japan10-Year (%) 0.02 0.03 -0.01
Source: Bloomberg. Data ended December 2020 except otherwise mentioned
Fresh US stimulus package, UK-EU trade deal affected US treasury prices
0.30
0.60
0.90
1.20
1.50
1.80
2.10
Dec-1
9
Jan
-20
Fe
b-2
0
Ma
r-20
Ap
r-20
Ma
y-2
0
Jun
-20
Jul-2
0
Au
g-2
0
Se
p-2
0
Oct-
20
Nov-2
0
Dec-2
0
Yie
ld (
%
US 10-Year G-Sec Yield

8
Commodity Market Review
International crude oil prices rose in December
• Crude oil ended year 2020 on a positive note with price on the New York Mercantile Exchange (NYMEX) on December 31 at $48.52 per barrel, up 7% from
$45.34 per barrel a month ago.
• The price stayed elevated through most of December as various countries started to roll out Covid-19 vaccine, which gave rise to hopes of growth in demand.
• Price also gained after the United Kingdom and the European Union reached a post-Brexit trade deal and an unexpected fall in the US oil supply.
• However, worries about new Covid-19 strain, which raised concerns about slower recovery in fuel demand, and rising tensions between the US and China
halted the gains.
Source – NYMEX. Data ended December 2020 except otherwise mentioned
Hopes of demand recovery following Covid vaccine rollouts support oil prices
-60
-40
-20
0
20
40
60
80
Dec-1
9
Jan
-20
Fe
b-2
0
Ma
r-20
Ap
r-20
Ma
y-2
0
Jun
-20
Jul-2
0
Au
g-2
0
Se
p-2
0
Oct-
20
Nov-2
0
Dec-2
0
($ Per Barrel)Global Crude Oil prices - NYMEX ($ per barrel)

9
Commodity Market Review
Gold prices rose in December
• Gold price on the Multi Commodity Exchange on December 31 was INR 50,005 per 10 gm, up 2.52% from INR 48,778 per 10 gm a month ago.
• Gold started December on a negative note as optimism about a Covid-19 vaccine boosted hopes of economic recovery and dented demand for safe haven
assets such as yellow precious metal.
• The fall, however, was capped after the US lawmakers agreed on a $900 billion Covid-19 economic relief package.
• Concerns around a new Covid strain also supported prices.
Source: MCX. Data ended December 2020 except otherwise mentioned
Worries about new Covid strain supports the demand for the safe-haven asset
35000
40000
45000
50000
55000
60000
Dec-1
9
Jan
-20
Fe
b-2
0
Ma
r-20
Ap
r-20
Ma
y-2
0
Jun
-20
Jul-2
0
Au
g-2
0
Se
p-2
0
Oct-
20
Nov-2
0
Dec-2
0
Gold (INR / 10 gms)

10
Repo rate remains unchanged at 4%
Source: RBI, CRISIL Research, Data as of December 2020 except otherwise mentioned. Past performance is not indicative of future performance
3.50%
4.50%
5.50%
6.50%
7.50%
8.50%
Dec-1
5
Fe
b-1
6
Ap
r-16
Jun
-16
Au
g-1
6
Oct-
16
Dec-1
6
Fe
b-1
7
Ap
r-17
Jun
-17
Au
g-1
7
Oct-
17
Dec-1
7
Fe
b-1
8
Ap
r-18
Jun
-18
Au
g-1
8
Oct-
18
Dec-1
8
Fe
b-1
9
Ap
r-19
Jun
-19
Au
g-1
9
Oct-
19
Dec-1
9
Fe
b-2
0
Ap
r-20
Jun
-20
Au
g-2
0
Oct-
20
Dec-2
0
Repo Rate Average monthly 10 year bond yield

11
Indian Economic Environment
Global and domestic institutions scale down India’s GDP contraction forecasts for current fiscal, expect rebound in next
• Gradual recovery in India’s economic activity has prompted various institutions to temper their earlier forecasts of a sharp contraction in gross domestic product
(GDP) this fiscal.
• The Organisation for Economic Co-operation and Development revised its India GDP growth forecast to -9.9% for fiscal 2021 from -10.2% projected in
September. It also forecast the economy would rebound 8% in the next fiscal and 5% thereafter.
• The Asian Development Bank (ADB) expects India's economy to grow 8% next fiscal, from a projected contraction of 8% this fiscal (earlier forecast being -9%).
• According to a United Nations report, India's economy could prove to be the "most resilient” in the sub-region of south and south-west Asia over the long term.
• The Reserve Bank of India (RBI) too, revised its forecast for the current fiscal to -7.5% compared with -9.5% earlier.
• S&P Global Ratings raised India's growth projection for the current fiscal to -7.7% from -9% estimated earlier on the back of rising demand and falling Covid-19
infection rates.
Source – Central Statistical Organisation (CSO), CRISIL Data ended December 2020 except otherwise mentioned.
6.7
5.66.1
7.2
8.2
7.1 7.0
6.1
4.2
0
2
4
6
8
10
12
2011-12 2012-13 2013-14 2014-15 2015-16 2016-17 2017-18 2018-19 2019-20
Dom
estic G
DP
Gro
wth
%

12
Indian Economic Environment
Retail inflation retreated in November
• India’s retail, or consumer price-index (CPI)-based, inflation decelerated to a three-month low of 6.93% in November 2020 compared with 7.61% in October, as
vegetable prices eased significantly.
• However, the wholesale price index-based inflation rose to a 9-month high of 1.55% in November compared with 1.48% in October 2020 and 0.58% in
November 2019, as manufactured products turned costlier.
• Meanwhile, the RBI expects CPI inflation at 6.8% for the third quarter of fiscal 2021 and 5.8% for the fourth quarter. For the first half of fiscal 2022, it has
projected inflation at 5.2-4.6%, with risks broadly balanced.
• An RBI paper said maintaining 4% inflation is appropriate for India as targeting a lower rate could impart deflationary bias to the monetary policy.
Source – Ministry of Commerce, Comptroller General of Accounts, CRISIL Data ended December 2020 except otherwise mentioned
Indicators Current Previous
Monthly CPI Inflation 6.93% (November 2020) 7.61% (October 2020)
Industrial Growth 3.6% (Oct 2020) 0.49% (Sep 2020)
Exports $173.66 bn (April-November FY21) $211.17 bn (April-November FY20)
Imports $215.69 bn (April-November FY21) $324.59 bn (April-November FY20)
Trade Balance - $42.03 bn (April-November FY21) -$113.42 bn (April-November FY20)
Gross Tax Collections INR 10,26,055 cr (April-November FY21) INR 11,74,143 cr (April-November FY20)
Retail inflation fell in November on the back of a dip in vegetable prices

13
Indian Economic Environment
Goods and Services Tax (GST)-related developments
• GST collection hit an all-time high in December at INR 1.15 lakh crore compared with INR 1.05 lakh crore in November as economic activity gained momentum
and a sustained drive against tax evasion yielded results
• The government further tightened the GST rules, limiting the use of tax credits and tweaking the electronic permits needed for goods transportation to check tax
evasion amid a sharp shortfall in revenue. It also said businesses with monthly turnover of over INR 50 lakh would have to mandatorily pay at least 1% of their
GST liability in cash
• The government rolled out the quarterly return filing and monthly payment of taxes (QRMP) scheme for small taxpayers under GST system
• The government extended the deadline for completing GST anti-profiteering investigations from November 30, 2020 to March 31, 2021
• The government also extended the date for filing annual returns under GST for fiscal 2020, to February 28, 2021 from the previous deadline of December 31,
2020
• The Ministry of Finance (MoF) said all states had taken the INR 1.1 lakh crore borrowing option to meet the shortfall from GST implementation
• The Centre released INR 6,000 crore as loan to states to meet GST shortfall, taking the total amount of funds released to INR 54,000 crore
• The GST Network said businesses would now get complete auto-populated monthly sales return form GSTR-3B. It also rolled out the ‘communication between
taxpayer’ feature on its portal
Decisions taken by the Cabinet
• The Union Cabinet approved a proposal to provide employees' provident fund contribution to firms hiring additional workforce for two years from 2020 to 2023
• It approved changes to the guidelines for providing direct-to-home (DTH) services to bring it in line with the existing policy that allows 100% foreign direct
investment (FDI) in the DTH broadcasting services sector
• It also approved an interest subvention of INR 4,573 crore for new distilleries producing ethanol, which could be used for doping of petrol
Source –CRISI Data ended December 2020 except otherwise mentioned.
GST collection hit an all time high in December

14
Indian Economic Environment
Other major developments
• Prime Minister Narendra Modi released over INR 18,000 crore to more than 9 crore farmer families under the Pradhan Mantri Kisan Samman Nidhi, or PM-
KISAN. He also launched National Common Mobility Card services.
• India and the United States inked a memorandum of understanding to co-operate on intellectual property examination and protection for the next 10 years and
to strengthen related systems in both countries.
• Nine states implemented the one-nation-one-ration-card system.
• The Ministry of Finance extended till February 15, 2021, the deadline for states to implement the ‘citizen-centric’ reforms in order to avail of the additional
borrowing limit granted by the Centre in May.
• It approved interest rate at 8.5% for subscribers of the Employees’ Provident Fund Organisation for the year 2019-20.
• It also notified the updated viability gap funding scheme which gives a push to the social infrastructure sector in India along with extending the existing scheme
to continue support to core infrastructure sectors.
• It approved INR 9,880 crore worth capital expenditure proposals of 27 states. Of this, INR 4,940 crore has been released as the first instalment.
• The government retained interest rates on small savings schemes for the quarter starting January 1, 2021.
• It identified investment prospects worth INR 1.02 lakh crore across sectors, as it sought to revive growth and soften the blow from the pandemic to the economy.
• It also shortlisted 50 key infrastructure projects worth over INR 2 lakh crore for regular monitoring by the Prime Minister's Office to ensure early completion.
• It prepared a five-phase road map to ease the regulatory and compliance burden faced by companies, and identified at least eight sectors that were complying
with hundreds of legislative and regulatory requirements at present.
• Further, it deferred implementation of the strict disclosure requirements for auditor reports of companies by one year.
• It also extended the suspension of the Insolvency and Bankruptcy Code till March 31, 2021.
• It extended the benefit of Remission of Duties and Taxes on Exported Products scheme to all export goods from January 1, 2021.
• The government entered into a $1 billion loan agreement with the New Development Bank to support the Mahatma Gandhi National Rural Employment
Guarantee Scheme and the country’s rural infrastructure.
• The World Bank and the Indian government signed a pact for a $500 million to build safe and green national highway corridors.
• India also inked a $400 million loan agreement with the World Bank to support the country’s social assistance programmes for poor and vulnerable households
impacted by the pandemic.
Source –CRISIL Data ended December 2020 except otherwise mentioned

15
Indian Economic Environment
• The government sold 61.43 lakh shares of Special Undertaking of The Unit Trust of India's stake in Axis Bank.
• It offloaded 20% stake in IRCTC via an offer for sale to raise INR 4,374 crore.
• It also invited expression of interest for sale of its 63.75% stake in Shipping Corporation of India, along with management control.
• The Centre launched a programme for socio-economic profiling of beneficiaries of PM Street Vendors’ Aatmanirbhar Nidhi, or PM SVANidhi scheme to extend
benefits of other government plans to them.
• NITI Aayog released 'Vision 2035: Public Health Surveillance in India', where it proposed strengthening public health surveillance in India by implementing a
surveillance information system.
• NITI Aayog Chief Amitabh Kant launched India's first digital asset management platform DigiBoxx.
• The government issued a set of rules to ensure the rights of electricity consumers.
• It formed a central power transmission utility - The Central Transmission Utility of India - separating its business from that of Power Grid Corporation of India.
• It extended the validity of motor vehicle documents such as driving licence, registration certificate and permits till March 31, 2021.
• It also extended the deadline for 100% collection of toll charges on the national highway network through FASTag till February 15.
• Further, it gave extra time to various classes of tax payers to file their income tax returns and tax audit reports in view of the pandemic situation, extending the
deadline to January 10, 2021.
• The Ministry of Labour issued guidelines for the Atma Nirbhar Bharat Rozgar Yojana, clarifying the government would only contribute to new employees earning
up to INR 15,000 a month as defined under the Employees Provident Fund & Miscellaneous Provisions Act.
• Minister of Petroleum Dharmendra Pradhan said the government planned $60 billion investment in creating gas infrastructure in the country till 2024, and
expected share of gas in the energy mix to rise to 15% by 2030.
• The government allowed domestic airlines to operate at 80% of their pre-pandemic approved capacity with immediate effect.
• It also approved a framework for the proliferation of public Wi-fi networks through Prime Minister Wi-Fi Access Network Interface (PM WANI) scheme.
• The Employees' State Insurance Corporation allowed its beneficiaries to avail of health services directly in any nearby private hospital in case of emergency.
Source –CRISIL Data ended December 2020 except otherwise mentioned

16
Indian Economic Environment
Regulatory developments in the month
• The RBI raised the contactless card transactions limit to INR 5,000 from INR 2,000 with effect from January 1, 2021.
• It rolled out a composite Digital Payments Index with March 2018 as the base period to capture the extent of digitisation of payments across the country.
• The central bank identified cross-border payments as the second cohort of its regulatory sandbox programme.
• It extended the applicability of centralised know-your-customer, or KYC, registry to legal entities from individual accounts at present, effective April 1, 2021.
• It also announced measures to ease procedures for exporters at a time when exports are finding it difficult to recover.
• The Competition Commission of India removed certain disclosure requirements related to non-compete restrictions at the time of entities seeking approval for
merger deals.
• The Department of Telecommunications issued guidelines for PM Wani project, saying that any entity can become a public Wi-Fi hotspot to provide internet
services to consumers.
• The Directorate General of Civil Aviation extended the ban on international commercial flights till January 31, 2021.
Key economic indicators released in the month
• Output of eight core infrastructure sectors dropped 2.6% on-year in November 2020, owing to decline in production of natural gas, refinery products, steel and
cement. Core sector growth contracted 0.9% on-year in October.
• The country’s exports dipped 8.74% to $23.52 billion in November while imports declined a steeper 13.32% to $33.39 billion, resulting in a trade deficit of $9.87
billion. Preliminary figures for December show exports shrank only 0.8% to $26.89 billion while imports rose 7.6% to $42.6 billion, resulting in trade deficit
widening to $15.71 billion.
• India’s current account surplus moderated to $15.5 billion (or 2.4% of GDP) in the July-September quarter of the current fiscal compared with $19.2 billion (3.8%
of GDP) in the preceding quarter.
• Fiscal deficit for the eight months to end-November stood at INR 10.75 lakh crore, or 135.1% of budget estimates for the entire fiscal.
• According to data from the Department for Promotion of Industry and Internal Trade, FDI equity inflows into India grew 21% to $35.33 billion during April-
October 2020.
• India IHS Markit manufacturing Purchasing Managers' Index (PMI) fell from 58.9 in October to a three-month low of 56.3 in November while services PMI fell to
53.7 in November from 54.1 in October. The composite PMI dipped to 56.3 in November from 58 in October.
Source –CRISIL Data ended December 2020 except otherwise mentioned
Domestic infrastructure sector output contracted in November

17
Index of Industrial Production - IIP
Source: MOSPI, Data ended December 2020 except otherwise mentioned
Past performance is not indicative of future performance
India’s Index of Industrial Production rose 3.6% on-year in October 2020 owing to better performance of manufacturing and electricity generation sectors. It had
expanded by a revised 0.49% in September.
-70
-60
-50
-40
-30
-20
-10
0
10
20
30
Oct-
15
Jan
-16
Ap
r-16
Jul-1
6
Oct-
16
Jan
-17
Ap
r-17
Jul-1
7
Oct-
17
Jan
-18
Ap
r-18
Jul-1
8
Oct-
18
Jan
-19
Ap
r-19
Jul-1
9
Oct-
19
Jan
-20
Ap
r-20
Jul-2
0
Oct-
20
YoY % 3 month moving average %

18
Inflation target and trend
Source: MOSPI, RBI, Data ended December 2020 except otherwise mentioned
Past performance is not indicative of future performance
RBI target: 4% +/- 2%
Inflation stays over the RBI’s max target range
-6%
-4%
-2%
0%
2%
4%
6%
8%
-6
-4
-2
0
2
4
6
8
Dec / 1
5
Ma
r / 1
6
Jun
/ 1
6
Se
p / 1
6
Dec / 1
6
Ma
r / 1
7
Jun
/ 1
7
Se
p / 1
7
Dec / 1
7
Ma
r / 1
8
Jun
/ 1
8
Se
p / 1
8
Dec / 1
8
Ma
r / 1
9
Jun
/ 1
9
Se
p / 1
9
Dec / 1
9
Ma
r / 2
0
Jun
/ 2
0
Se
p / 2
0
Dec / 2
0
CPI WPI RBI Inflation upper bound (6%) RBI inflation lower bound (2%) Average

19
GST collection
Source: Ministry of Finance, Data ended December 2020 except otherwise mentioned
Past performance is not indicative of future performance
The GST collection hit an all-time high in December at INR 1.15 lakh crore compared with INR 1.05 lakh crore in November.
32294
62009
9091787422 86449
95480
105155 104963
115174
0
20000
40000
60000
80000
100000
120000
140000
Apr-20 May-20 Jun-20 Jul-20 Aug-20 Sep-20 Oct-20 Nov-20 Dec-20
Co
llecti
on
(IN
R c
r)

20
Equity Market Review
Indian equity indices rose sharply in December
• Domestic equities ended the year on a splendid note. Benchmarks S&P BSE Sensex and Nifty 50 soared to record highs and rose 8% each on-month in the
last month of 2020. The year was highly volatile, but indices managed to end on a firm note.
• Optimism regarding the Covid-19 vaccine, a stimulus package in the US and the Brexit deal helped offset the earlier losses caused by the surge in Covid-19
cases and resultant lockdown restrictions. The S&P BSE Sensex and Nifty 50 were up 16% and 15%, respectively, in 2020..
• The domestic markets rose in the beginning of the month after the Reserve Bank of India (RBI) decided to maintain the interest rate at 4%, retain its
accommodative stance and revise its domestic growth forecast upward to -7.5% from -9.5% for fiscal 2021.
• Better-than-expected domestic gross domestic product (GDP) data and good auto sales numbers boosted sentiments.
• More gains were seen after S&P Global Ratings raised India's growth projection for the current fiscal.
• Strong buying by the foreign institutional investors (FIIs) further supported the benchmarks. FIIs were net buyers of equities in December. They bought equities
worth INR 53,500 crore in December compared with INR 70,896 crore in November.
• Globally, optimism about economic recovery amid rollout of a Covid-19 vaccine, signing of a $2.3 trillion stimulus package by US President Donald Trump, and
a trade deal between the UK and the European Union boosted domestic markets.
• Some gains were capped due to intermittent profit booking and volatility amid the expiry of the December futures and options contract.
• Selling by domestic institutional investors (DIIs) also acted as a dampener. DIIs sold equities worth INR 37,294 crore in December compared with equities
worth INR 48,339 crore sold in November.
• Reports of rise in Covid-19 cases due to a new strain of the virus in the UK and several other countries also dented sentiments.
Source –CRISIL Data ended December 2020 except otherwise mentioned
Upbeat global cues, including positive reports of Covid-19 vaccine, boosted Indian equities

21
Equity Market Review
S&P BSE sectoral indices ended higher in December
• All the S&P BSE sectoral indices ended higher in December 2020. The realty, metal, consumer durables and information technology (IT) sectors saw heavy
buying. The S&P BSE Realty, S&P BSE Metal, S&P BSE consumer durables and S&P BSE IT indices rose 12-20%.
• The S&P BSE PSU and S&P BSE Capital goods indices followed suit at around 10% each.
• Defensive counters such as fast moving consumer goods (FMCG) and healthcare also ended positive. The S&P BSE FMCG and S&P BSE Healthcare gained
around 7% each.
Source: NSDL, NSE Data ended December 2020 except otherwise mentioned
694
-5,4
12
-12,6
84
-65,8
17
-5,2
09
13,1
79
5,4
93
2,4
90 1
5,7
50
-11,4
11
14,5
37
65,2
39
48,2
24
-741
2,2
50
16,9
33
55,5
95
-825
11,3
56
2,4
34
-10,0
08
-11,0
47
110
-16,9
09
-48,3
39
-37,2
94
-80000
-60000
-40000
-20000
0
20000
40000
60000
80000
Dec-1
9
Jan
-20
Fe
b-2
0
Ma
r-20
Ap
r-20
Ma
y-2
0
Jun
-20
Jul-2
0
Au
g-2
0
Se
p-2
0
Oct-
20
Nov-2
0
Dec-2
0
INR
Cr
FII Net Monthly Investment DII Net Monthly Investment

22
Indices 31-Dec-20 27-Nov-20% Change
1 Month
% Change
1 Year
% Change
YTD
Nifty 50 13982 12969 7.81 14.90 14.90
S&P BSE Sensex 47751 44150 8.16 15.75 15.75
S&P BSE Auto 20811 20129 3.39 12.59 12.59
S&P BSE BANKEX 35888 33884 5.92 -2.14 -2.14
S&P BSE Capital Goods 18745 17022 10.12 10.63 10.63
S&P BSE Consumer durables 30394 27046 12.38 21.52 21.52
S&P BSE FMCG 12609 11726 7.53 10.55 10.55
S&P BSE Healthcare 21681 20319 6.71 61.45 61.45
S&P BSE Information Technology 24248 21635 12.08 56.68 56.68
S&P BSE Metal 11599 10219 13.51 11.23 11.23
S&P BSE MidCap 17941 16915 6.07 19.87 19.87
S&P BSE Oil & Gas 14090 13251 6.33 -4.44 -4.44
S&P BSE Power 2062 1999 3.14 7.05 7.05
S&P BSE PSU 5781 5295 9.18 -16.88 -16.88
S&P BSE Realty Index 2478 2062 20.20 8.66 8.66
S&P BSE SmallCap 18098 16875 7.25 32.11 32.11
Equity Market Review
Source: NSE, BSE. Data ended December 2020 except otherwise mentioned

23
Equity mirrors economic growth in the long term
Source: BSE, IMF The GDP projection start after fiscal year 2020 and are shown shaded in this graph is for illustration purposes only and is not guaranteed
Data ended December 31, 2020 except otherwise mentioned. Past performance may or may not sustain and does not guarantee future performance.
GDP - India looks on a long-term growth trajectory despite intermittent hiccups
0
5,000
10,000
15,000
20,000
25,000
30,000
35,000
40,000
45,000
0
20,000
40,000
60,000
80,000
100,000
120,000
140,000
160,000
180,000
200,000
220,000
240,000
S&
P B
SE
Sensex
GD
P, curr
ent prices in
Rs b
n
GDP (current price in Rs bn) S&P BSE Sensex (RHS)
24
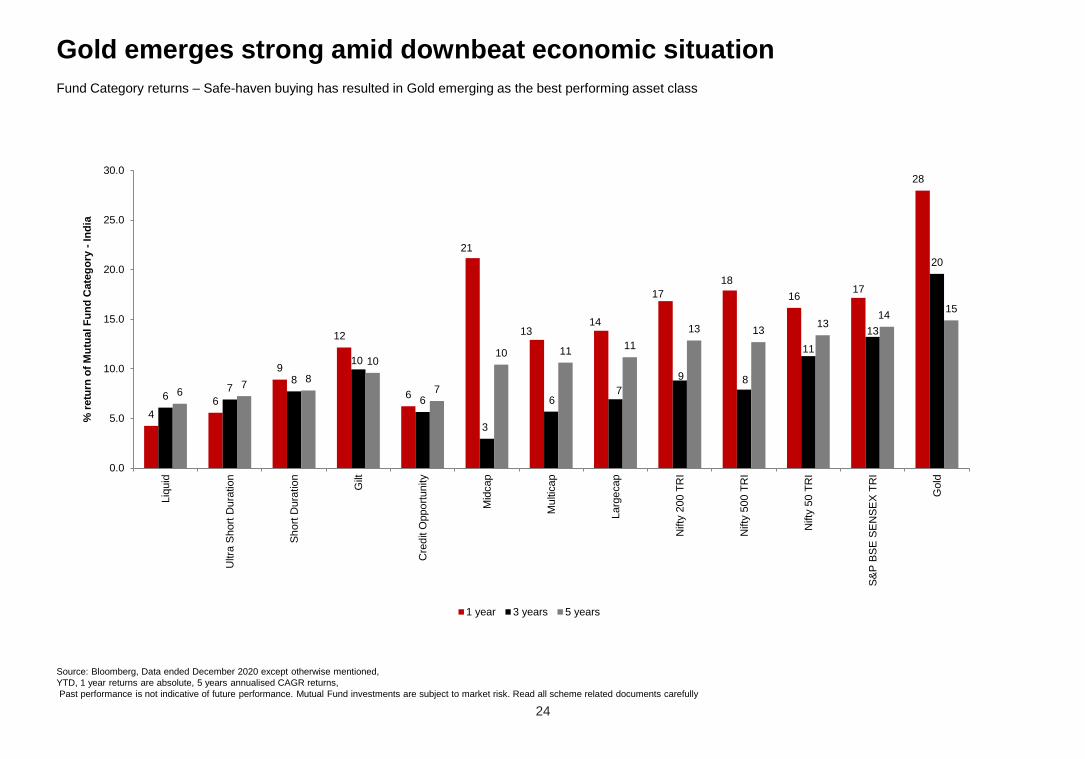
Gold emerges strong amid downbeat economic situation
Source: Bloomberg, Data ended December 2020 except otherwise mentioned,
YTD, 1 year returns are absolute, 5 years annualised CAGR returns,
Past performance is not indicative of future performance. Mutual Fund investments are subject to market risk. Read all scheme related documents carefully
Fund Category returns – Safe-haven buying has resulted in Gold emerging as the best performing asset class
4
6
9
12
6
21
1314
17
18
1617
28
67
8
10
6
3
67
9 8
11
13
20
67
8
10
7
10 1111
13 1313
1415
0.0
5.0
10.0
15.0
20.0
25.0
30.0Liq
uid
Ultra
Short
Dura
tio
n
Sh
ort
Dura
tio
n
Gilt
Cre
dit O
ppo
rtunity
Mid
cap
Mu
ltic
ap
Larg
ecap
Nifty
200 T
RI
Nifty
500 T
RI
Nifty
50 T
RI
S&
P B
SE
SE
NS
EX
TR
I
Gold
% r
etu
rn o
f M
utu
al F
un
d C
ate
go
ry -
Ind
ia
1 year 3 years 5 years

25
Sectoral performance long term trends
Source: BSE, Data ended December 2020 except otherwise mentioned
Figures in red indicate negative returns in that period. *CY20 and 10-year CAGR are as of December 2020
Past performance is not indicative of future performance. Mutual Fund investments are subject to market risk. Read all scheme related documents carefully
Sectoral returns – Most sectoral indices post positive performance over the 10-year period
Sectoral indices
% Change
CY11 CY12 CY13 CY14 CY15 CY16 CY17 CY18 CY19 CY2010-year
CAGR*
S&P BSE Auto -20.44 40.31 7.29 51.98 -0.60 9.39 32.06 -22.12 -11.27 12.59 7.35
S&P BSE BANKEX -31.59 56.72 -9.36 65.04 -9.92 7.35 39.08 5.27 20.72 -2.14 10.36
S&P BSE Capitalgoods -47.66 34.71 -5.56 50.45 -8.51 -3.28 40.03 -1.63 -9.97 10.63 1.97
S&P BSE
Consumerdurables -16.87 46.08 -24.59 66.18 24.02 -6.34 101.92 -8.79 20.86 21.52 16.92
S&P BSE Fast Moving
Consumer Goods 9.53 46.61 11.00 18.27 1.36 3.29 31.54 10.60 -3.58 10.55 13.08
S&P BSE Healthcare -12.83 38.53 22.55 47.43 15.06 -12.88 0.49 -5.92 -3.55 61.45 12.39
S&P BSE Information
Technology -15.72 -1.18 59.78 16.54 4.51 -8.00 10.83 24.93 9.84 56.68 13.50
S&P BSE Metal -47.19 19.13 -9.99 7.91 -31.20 36.65 47.78 -20.75 -11.92 11.23 -4.08
S&P BSE MidCap -34.19 38.52 -5.73 54.69 7.43 7.97 48.13 -13.38 -3.05 19.87 8.68
S&P BSE Oil & Gas -28.98 13.14 3.71 12.01 -3.43 27.17 34.00 -15.57 7.25 -4.44 2.88
S&P BSE Power -39.91 10.86 -14.57 23.03 -6.44 1.53 19.83 -16.06 -3.65 7.05 -3.64
S&P BSE PSU -32.72 15.24 -19.43 39.21 -17.18 12.88 19.27 -21.11 -3.88 -16.88 -4.80
S&P BSE Realty -51.84 53.44 -32.09 8.49 -13.55 -5.98 106.36 -31.07 26.85 8.66 -1.41
S&P BSE SmallCap -42.61 32.97 -11.23 69.24 6.76 1.77 59.64 -23.53 -6.85 32.11 6.46

26
Earnings growth – quarterly trend
Estimates – FY21, FY22
^Average figure mentioned is from FY12 to FY22
Source: Bloomberg, data as of December 31, 2020
Past performance is no guarantee of future returns
Nifty 50 EPS Growth (Y-o-Y)
Nifty 50 earnings de-grew in Q4FY20
Earnings growth may rebound in FY’21 after de-growth in Q4 FY’20
(%)
27
-8
411
-8
33
6
-11
158
17 16 17
6
-3
-33
20
-10
-2 -4 -5
11
51
615
2617
-6 -1
-29
616
10 9
-56
-44
1
29
132
106
1825
1923
1Q 2Q 3Q 4Q 1Q 2Q 3Q 4Q 1Q 2Q 3Q 4Q 1Q 2Q 3Q 4Q 1Q 2Q 3Q 4Q 1Q 2Q 3Q 4Q 1Q 2Q 3Q 4Q 1Q 2Q 3Q 4Q 1Q 2Q 3Q 4Q 1Q 2Q 3Q 4Q 1Q 2Q 3Q 4Q 1Q
FY12 FY13 FY14 FY15 FY16 FY17 FY18 FY19 FY20 FY21 FY22 FY23
AVG: 10%

27
Earnings history
Grey shaded columns are estimates of FY20 - FY22
Source: Bloomberg, Data as of December 31, 2020. Past performance is no guarantee of future returns
India - Equity earnings (Nifty 50 EPS)
Nifty 50 EPS may grow at 23% CAGR over FY20-22E, vs ~8% de-growth in FY18-20
Note: Trailing 12M EPS (Earnings Per Share)
320
345
355
404
387
378
416
482
447
407
463
616
0
100
200
300
400
500
600
700
FY
11
FY
12
FY
13
FY
14
FY
15
FY
16
FY
17
FY
18
FY
19
FY
20
FY
21
FY
22
-9% 13.8%
33%

28
Market valuations – Nifty 50 and Nifty Midcap 100
Source: Bloomberg, data as on December 31, 2020
Investment involves risks. Past performance is not indicative of future performance,
Large and Mid Cap - Price to Book (PB)
Valuations climb up the long term averages
Large and Mid Cap - Price to Earnings (PE)
10
15
20
25
30
35
40
45
50
Dec-0
9
Ma
y-1
0
Oct-
10
Ma
r-11
Se
p-1
1
Fe
b-1
2
Jul-1
2
Jan
-13
Jun
-13
Nov-1
3
Ap
r-14
Oct-
14
Ma
r-15
Au
g-1
5
Fe
b-1
6
Jul-1
6
Dec-1
6
Ma
y-1
7
Nov-1
7
Ap
r-18
Se
p-1
8
Ma
r-19
Au
g-1
9
Jan
-20
Jun
-20
Dec-2
0
Nifty50 Nifty Mid Cap Avg. Nifty50 Avg. Nifty Mid Cap
1.0
1.5
2.0
2.5
3.0
3.5
Dec-0
9
Ma
y-1
0
Oct-
10
Ma
r-11
Se
p-1
1
Fe
b-1
2
Jul-1
2
Jan
-13
Jun
-13
Nov-1
3
Ap
r-14
Oct-
14
Ma
r-15
Au
g-1
5
Fe
b-1
6
Jul-1
6
Dec-1
6
Ma
y-1
7
Nov-1
7
Ap
r-18
Se
p-1
8
Ma
r-19
Au
g-1
9
Jan
-20
Jun
-20
Dec-2
0
Nifty50 Nifty Mid Cap Avg. Nifty50 Avg. Nifty Mid Cap

29
Market valuations – Nifty 50 and S&P BSE 200
Source: Bloomberg, data as on December 31, 2020
Investment involves risks. Past performance is not indicative of future performance,
Large and S&P BSE 200 - Price to Book (PB)
Valuations reach above the long term averages
Large and S&P BSE 200 - Price to Earnings (PE)
10
12
14
16
18
20
22
24
26
28
30
32
34
36
Dec-0
9
Ma
y-1
0
Oct-
10
Ma
r-11
Se
p-1
1
Fe
b-1
2
Jul-1
2
Jan
-13
Jun
-13
Nov-1
3
Ap
r-14
Oct-
14
Ma
r-15
Au
g-1
5
Fe
b-1
6
Jul-1
6
Dec-1
6
Ma
y-1
7
Nov-1
7
Ap
r-18
Se
p-1
8
Ma
r-19
Au
g-1
9
Jan
-20
Jun
-20
Dec-2
0
Nifty50 BSE200 Avg. Nifty50 Avg. BSE200
1.6
1.8
2.0
2.2
2.4
2.6
2.8
3.0
3.2
3.4
Dec-0
9
Ma
y-1
0
Oct-
10
Ma
r-11
Se
p-1
1
Fe
b-1
2
Jul-1
2
Jan
-13
Jun
-13
Nov-1
3
Ap
r-14
Oct-
14
Ma
r-15
Au
g-1
5
Fe
b-1
6
Jul-1
6
Dec-1
6
Ma
y-1
7
Nov-1
7
Ap
r-18
Se
p-1
8
Ma
r-19
Au
g-1
9
Jan
-20
Jun
-20
Dec-2
0
Nifty50 BSE200 Avg. Nifty50 Avg. BSE200

30
India Market cap to GDP (%)
Shaded area are Estimates (E) – FY20, FY21
Source: MOSL, Bloomberg, CRISIL estimates; data as at December 31, 2020
Past performance is not indicative of future performance
Market cap to GDP (%) is mostly hovering around long term average of 77%
103
55
95
88
71
6466
81
69
79
83
79
71
78
FY
08
FY
09
FY
10
FY
11
FY
12
FY
13
FY
14
FY
15
FY
16
FY
17
FY
18
FY
19
FY
20E
FY
21E
Average of 77% for
the period
Market cap as a % of GDP

31
Sectorial Outlook
Source: HSBC Asset Management, India, Data as of December 2020 except otherwise mentioned.
* GICS
Sector* View Commentary
Healthcare Positive
Our positive stance is on account of the earnings resilience coupled with revenue visibility. Over the medium term, we
believe that the profit pool of pharma companies will improve owing to reduction in fixed costs, secular domestic market
growth and US business showing signs of improvement. Most of the companies have significantly deleveraged their balance
sheets which will aid earnings and returns profile going ahead. Valuations can improve further as the sector offers mid-teen
earnings growth visibility and improving return ratios. Our exposure to the sector, is primarily through companies having
exposure to US generic business. We also own domestic focused businesses with a higher degree of vertical integration.
Our small exposure to hospitals/diagnostics space is under anticipation that demand in the post pandemic phase shall
sustain. Also, due to the non-discretionary nature of the demand, we are seeing early signs of recovery coming in from
elective procedures as well.
Financials Positive
We continue to hold a constructive view on lending financials (banks/ NBFCs). We now believe that the market is pricing in
the credit cost normalisation and valuations are largely reflecting the same, with the outperformance of banks vs. NIFTY
since September. While slippage (NPL formation) rates will still rise over 3Q/4QFY21, credit costs, should be contained, as
lenders will run down standard asset buffers which were built up over 4QF20-2QFY21 under pessimistic conditions.
Liquidity and capital adequacy remain comfortable for large private banks and NBFCs. Hence, now the key challenge/focus
is likely to be loan growth and market will start differentiating across franchises that are able to deliver steady growth and
thus, have market share gains. In this, we think that large private banks and NBFCs (with good parentage), will continue to
gain share driven by their investments in digital infrastructure, analytics brand and distribution strength.
In non-lenders, we have exposure to the life insurance sector, as we expect financialisation of savings to continue and with
the rise in protection in the product mix (driven by under-penetration); margins and growth can continue to beat street
expectations. On the same theme of financialisation of savings we have some exposure to brokerages and AMCs with good
track record and decent scale.
Real Estate Positive
We continue to remain positive on the sector and is a differentiated call compared to peers. We see the sector on a revival
path driven by improvement in the residential affordability and listed players being the beneficiaries of industry
consolidation. With low interest rates (coupled with negative real rates), the home purchase affordability is best since 2003.
In addition, the current crisis shall accelerate the consolidation amongst the residential developers in favour of the major
players especially, the listed companies. Commercial assets such as Grade A office spaces and malls will also see
consolidation as new supply will be restricted due to current cash flow issues faced by developers coupled high gestation
business models. The current recovery in sales looks promising and is much better than anticipated. We reckon that
markets are overly pessimistic about the prospects of the sector and we hold a contrarian view here. Our current exposure
are to developers who have a mix of residential portfolio and commercial assets, along with relatively strong balance sheet.

32
Sectorial Outlook
Source: HSBC Asset Management, India, Data as of December 2020 except otherwise mentioned.
* GICS
Sector View Commentary
Consumer
DiscretionaryPositive
We continue to remain positive on the discretionary names as they are beneficiaries of the opening up of the economy. We
remain positive on three types of companies. a) Those companies that have rebounded in the pandemic phase itself. e.g.
Auto OEMs have witnessed good traction due to increased need for personal mobility, small appliances driven by small
ticket purchases. b) The companies that have rebounded in the recovery phase e.g. White goods, paints, QSR etc. c)
Segments and companies that may not have rebounded but we believe that the disruption will affect weaker players and
unorganized players more. Therefore, in the post pandemic phase, these companies shall come out stronger. e.g.
Jewellery retailing, apparel. As a result, the valuations have expanded for those names where market ascribe higher
probability of being beneficiaries of formalisation and / or continue / sustain the market share gains. We reckon that the
high valuations for these names would sustain owing to their leadership position in their respective sub-segments along
with industry leading growth. In the past few months, we have reoriented our exposure within the sector and added to
names where the price correction has been steeper than the value destruction in the business. Also, our exposure is
through companies that are dominant players in their respective businesses coupled with their ability to gain from the
disruption (digital strategy, investing for sustained market share gains etc.)
Communication
ServicesPositive
Though we continue to remain positive, we have reduced the extent of the overweight in the sector owing to lack of
positive surprises (delay in tariff hike) and the advent of the next big capex cycle (5G). Telecom sector will remain
beneficiary of industry consolidation and a 'gradual' return of pricing power. However, the inordinate delay in the much
anticipated tariff hike cycle has brought down the probability of earnings upgrade surprises in the near to medium term.
Along with this, new technology adoption by next year or so, would lead to higher capital outlay. Our current overweight in
the sector is on account of the exposure to the multiplex name, which is a play on industry consolidation and normalisation
in economy. Our preference is for sector leaders with stronger balance sheet and that have shown better execution on the
ground.

33
Sectorial Outlook
Materials Neutral
We continue to have a neutral position in materials, within which there is a positive tilt towards cement and specialty
chemicals. Also, given the pick-up in residential construction and upgradation we expect stocks with exposure to real
estate to do well (paints, pipes, plastic furniture etc.).
In cement with domestic economy activity picking up driven by continued resilient rural activity and normalization in the
urban India, cement demand continues to improve. We also expect prices will remain firm in the “busy” season (or 4Q) as
utilization improves across markets. This has to some extent been reflected in the specific margins (i.e. EBITDA per ton) of
cement companies in the past two quarters and though there can be some moderation in the same in the near term (or
3QFY21) driven by rise in input costs, the earnings growth outlook for these companies remain healthy.
Within specialty chemicals we expect larger niche players to continue to deliver faster revenue traction as India continues
to benefit from the global supply chain diversification theme. These companies have continued to surprise in terms of
order book build up, revenue expectations and also margins, as share of exports continues to see pick-up.
In global cyclicals (metals), we think that current “high” commodity prices and “near peak” margins are unsustainable.
Since, these seem to driven by certain artificial supply and trade issues. This could eventually lead to swift supply
response from producers, which can reverse the current profitability and hence valuations.
Information
TechnologyNeutral
While we continue with our neutral stance, we remain positive on the sector potential from a medium to long term
perspective. This is driven by the view that the pandemic has accelerated the shift towards a more digitised world,
resulting in continued technology investments from enterprises across industries globally. This should not only improve
demand for services vendors but also provide more avenues for growth. Indian IT shall continue to gain market share
owing to proven capabilities across horizontals, domain knowledge of verticals, scale and access to talent. In addition,
large Indian IT companies have strong management, robust profitability ratios and prudent capital allocation. Our
preference is for players with strong digital capabilities, scale, beneficiaries of vendor consolidation and relative valuations.
Our current neutral stance is dictated by the recent outperformance of the sector with the valuations now trending above
historical averages and we reckon that the near term revenue acceleration is adequately reflected in the current prices.
However, but if the current trend of digital adoption and “migration to cloud” were to gain momentum (and we think that it
will), then growth over medium term will accelerate further. Thus Technology is a “buy on dips” sector for us.
Sector View Commentary
Source: HSBC Asset Management, India, Data as of December 2020 except otherwise mentioned.
* GICS

34
Sectorial Outlook
Sector View Commentary
Source: HSBC Asset Management, India, Data as of December 2020 except otherwise mentioned.
* GICS
Consumer
StaplesNegative
We have maintained our underweight stance in staples. This is on account of two reasons 1) lack of positive earning
surprises from hereon and 2) high valuations. Though the earnings visibility for staples remain high, this is priced in at the
current valuations. Also, given the faster normalisation of the economy driven by vaccine news flows, we think that the
earnings surprises would now play out in the case of discretionary and semi-discretionary segments compared to staples.
As a result we have used the weight reduction to add to segments that can offer more earnings surprises going forward.
Within staples our preference is for category leaders with scale and product diversification along with superior execution
capabilities. We are also positive on companies where there has been renewed growth momentum due to revival of their
respective categories e.g.: home insecticides.
Energy Negative
We continue to hold a negative view of the energy companies. This is due to weak demand, weak profitability ratios, and
volatile prices (which are not in control of the companies). Our only exposure in the energy sector is through private sector
conglomerate, that has been able to delever their balance sheet and unlock value of investments made over the last
decade. We believe that technology platform of the conglomerate is unique in the Indian market place and best option in
this category.
Industrials Negative
Private capex has been weak for the last few years and still may take time to pick up. On the government side, due to
stress on both centre and state finances, we expect the order awarding activity to be under pressure this year. However,
we expect the recovery in the medium term as government's thrust on infrastructure will remain and this is one of the large
employment generating sectors. However, companies with weak balance sheets will continue to face funding challenges.
Hence, we remain negative on the sector from a top down perspective. Our exposure within the sector is to the most
dominant player (s), who will benefit from market share gains owing to strong balance sheet, execution capabilities and
scale advantages. We have taken exposure to allied segments (CV, cables), inorder to play the economic recovery theme
rather than the capex recovery theme.
Utilities Negative
We continue with our negative stance on the sector. Lower demand (for both power and gas) is having an impact on
utilities, though the impact on power utilities with regulated business model will be relatively less. Currently India is power
surplus and hence new capex would be limited in the sector and hence the growth for power utilities will continue to
remain subdued in the near to medium term. Within the sector our slight preference is for Gas utilities as opposed to
Power utilities as the former depends more on consumer activity rather than industrial activity.

35
Equity Market Outlook
Source: HSBC Global Asset Management, India, Data as of December 2020 except otherwise mentioned.
• Equity markets continued to be buoyant and ended the year on a strong note. India meaningfully outperformed global equity indices during
December.
• Strong FII flows momentum into Indian equities continued through December, helping the markets to surge higher.
• Considering the sharp economic recovery seen so far, the RBI upgraded the FY21 GDP estimates to a contraction of 7.5% compared earlier
expectation of a contraction of 9.5%.
• As we look ahead and form an outlook for 2021, the restoration phase for the global economy should continue to play out while the pace of
recovery shall vary across individual markets and dependent on the delivery of the vaccine as well as continued policy support.
• The economic activity levels have rebounded and in majority of the segments, it is either above or closer to pre-COVID levels.
• The segments that are worst impacted due to the pandemic such as travel, tourism, hospitality, entertainment, construction etc. are seeing a
more gradual recovery but that trend could get accelerated as a result of the faster than anticipated vaccine intervention, which is expected
now.
• As we look ahead and visualize the outlook for 2021, two key variables that shaped up the equity rally during 2020 viz global liquidity and
lower interest rates are here to stay.
• In addition, the restoration / recovery process from the COVID-19 disruption is likely to continue, leading to significant economic GDP
rebound and corporate earnings growth (~38%) in FY22.
• A sustained period of lower cost of capital coupled with low real rates, sets up a fertile soil for equity to continue to flourish as a preferred
asset class.
• Looking at valuations, on P/E and P/B basis, markets are now trending above historical averages. However, at the same time, the current
lower cost of capital continue make equities relatively more attractive, even after the significant outperformance.
• Over the past few years, we’ve witnessed a trend of profit pool consolidating with the dominant players in respective sectors/industries. We
believe that the trend will accelerate as the current disruption has higher magnitude as well as it encompasses more sectors.
• Another long term theme is that of diversification of the global supply chain due to ‘China + 1’ strategy which could be adopted by corporates
as well as economies and India could stand to benefit out of that.

36
Futures & Options (F&O) Review
Nifty futures
• The Nifty 50 near-month future contract of December ended higher on the rollover day (December 31) versus spot.
• The new near-month contract (January 28) ended 28 points higher on December 31.
• The rollover of the new near-month contract (January) was 70% on the expiry day compared with 74% in the previous expiry.
• Domestic equities ended the year on a splendid note in December. Benchmarks S&P BSE Sensex and Nifty 50 surged to fresh record highs and rose 8% each
on-month in the last month of 2020.
• Volatility of the Nifty 50 index, as measured by India VIX, rose 21.09 on December 31, as against 20.02 on November 26.
• Nifty futures saw a trading volume of INR 3.34 lakh crore, arising out of 32.83 lakh contracts, with an open interest of around 30.69 crore during the month.
Source – NSE, CRISIL. Data ended December 2020 except otherwise mentioned.
0
0.5
1
1.5
2
12500
13000
13500
14000
14500
1-D
ec-2
0
2-D
ec-2
0
3-D
ec-2
0
4-D
ec-2
0
5-D
ec-2
0
6-D
ec-2
0
7-D
ec-2
0
8-D
ec-2
0
9-D
ec-2
0
10-D
ec-2
0
11-D
ec-2
0
12-D
ec-2
0
13-D
ec-2
0
14-D
ec-2
0
15-D
ec-2
0
16-D
ec-2
0
17-D
ec-2
0
18-D
ec-2
0
19-D
ec-2
0
20-D
ec-2
0
21-D
ec-2
0
22-D
ec-2
0
23-D
ec-2
0
24-D
ec-2
0
25-D
ec-2
0
26-D
ec-2
0
27-D
ec-2
0
28-D
ec-2
0
29-D
ec-2
0
30-D
ec-2
0
31-D
ec-2
0
Open in
tere
st in
cr
Nifty
futr
e/ spot
Nifty 50 Futures Nifty 50 Spot Open Interest Cr (Near Month Contract)

37
Futures & Options (F&O) Review
Nifty options
• On December 31, Nifty 14,000 call option witnessed the highest open interest of around 112.74 lakh, and the same contract garnered the maximum number of
contracts of around 33.81 lakh.
• Nifty 13,000 put option witnessed the highest open interest of 88.72 lakh on December 31 and the Nifty 14,000 put option garnered the maximum number of
contracts of around 19.03 lakh.
NSE F&O turnover
• Turnover on the NSE’s derivative segment rose 19% in the month, led by gains in index and stock options. The average put-call ratio was 0.95 in December
higher than 0.90 in the previous month.
Source-NSE. Data as on December 2020 except otherwise mentioned.
Instrument Monthly turnover summary (Figures in INR crore)
Dec-20 Nov-20 Change %
Index futures 691463 826341 -16%
Stock futures 1587988 1543447 3%
Index options 62349153 52195386 19%
Stock options 2633644 2192926 20%
Total 67262248 56758100 19%

38
Futures & Options (F&O) Review
FII segment
• On December 31, FIIs’ open interest was INR 1.52 lakh crore (18 lakh contracts). The details of FII derivatives trades for December 1 to 31 are as follows:-
Source-SEBI. Data as on December 2020 except otherwise mentioned.
BUY SELL BUY % SELL %
No. of
contracts
Amount in
INR Cr
No. of
contracts
Amount in
INR Cr
No. of
contracts
Amount in
INR Cr
No. of
contracts
Amount in
INR Cr
Index Futures 1010457 90217 1047421 93765 1.11 1.18 1.16 1.23
Index Options 83417592 7013897 83188856 6994093 91.89 92.09 91.81 92.00
Stock Futures 4753069 378375 4771791 379681 5.24 4.97 5.27 4.99
Stock Options 1595094 134189 1597467 134380 1.76 1.76 1.76 1.77
Total 90776212 7616678 90605535 7601919 100.00 100.00 100.00 100.00

39
Debt Market Review
Inter-bank call money rates were below the repo rate in December
• Interbank call money rates remained below the RBI’s repo rate of 4% in December as liquidity remained in a state of surplus.
Bond prices were flat in December
• Gilts ended little changed in December with the yield on the 10-year benchmark 5.77% 2030 paper settling at 5.90% on December 31 compared with 5.91% on
November 27.
• Sentiment for dated securities remained weak earlier in the month due to the absence of open market bond purchase announcements from the central bank.
• Comments from Finance Minister Nirmala Sitharaman that India would be looking to step up spending to support economic growth and that the budget deficit
target may be missed put bonds under pressure.
• Prices also dipped after the banking regulator announced that it would buy and simultaneously sell securities for a total notified INR 10000 crore each on
December 17, as against the market’s hopes of an outright bond purchase announcement.
• Gilts retreated further ahead of the results of some weekly debt auctions.
• However, losses were recouped on intermittent value buying and after the RBI’s Monetary Policy Committee (MPC) kept the repo rate unchanged and decided
to continue with the accommodative stance as long as necessary to prop up economic growth.
• Further, RBI Governor Shaktikanta Das assured that the central bank will continue to maintain sufficient liquidity through the use of various instruments at an
appropriate time.
• Bond prices received a boost after domestic retail inflation for November eased.
• Gilts were buoyed later in the month after the central bank bought the bulk of the paper maturing in 2034 in a special open market operation.
• Expectation that the central bank would announce open market bond purchases in January also lifted sentiments.
Source: CRISIL Data as of December 2020 except otherwise mentioned.

40
Debt Market Review
Source: CRISIL Fixed Income database. Data as on December 2020 except mentioned otherwise
Debt Market Indicators 31-Dec-20 27-Nov-20
Call Rate 2.10% 3.40%
3-mth CP rate 3.70% 3.18%
5 yr Corp Bond 5.55% 5.50%
10 Yr Gilt 5.90% 5.91%
Repo 4.00% 4.00%
Reverse Repo 3.35% 3.35%
CRR 3.00% 3.00%
1-mth CDs 3.01% 2.82%
3-mth CDs 3.36% 2.90%
6-mth CDs 3.44% 3.35%
5.86%
5.88%
5.90%
5.92%
5.94%
5.96%
5.98%
0
3000
6000
9000
12000
15000
18000
21000
27-N
ov-2
0
1-D
ec-2
0
2-D
ec-2
0
3-D
ec-2
0
4-D
ec-2
0
7-D
ec-2
0
8-D
ec-2
0
9-D
ec-2
0
10-D
ec-2
0
11-D
ec-2
0
14-D
ec-2
0
15-D
ec-2
0
16-D
ec-2
0
17-D
ec-2
0
18-D
ec-2
0
21-D
ec-2
0
22-D
ec-2
0
23-D
ec-2
0
24-D
ec-2
0
28-D
ec-2
0
29-D
ec-2
0
30-D
ec-2
0
31-D
ec-2
0
Sem
i Annualis
ed C
losin
g Y
ield
Tu
rnover
INR
Cr.
Movement of 10 Year Gilt Benchmark
Turnover INR in Cr Semi Annualised Closing Yield
3.00
3.50
4.00
4.50
5.00
5.50
6.00
6.50
7.00
1 yr 2 yr 3 yr 4 yr 5 yr 7 yr 8 yr 9 yr 10 yr 15 yr 20 yr
Yield (%)
Maturity (years)
Yield Curve
31-Dec-20 27-Nov-20

41
Debt Market Outlook
Source: HSBC Global Asset Management, India, Data as of December 2020 except otherwise mentioned
• The yields during the month have continued to trade in a narrow range. With the policy taking the focus in the beginning of the
month, market sighed a welcome relief soon after the policy as liquidity measures remain untouched.
• The gains were however short-lived and profit booking and lack of Open Market Operations (OMOs) reversed the gains.
• 10-year benchmark moved between a narrow range of 5.85 – 5.92% during the month largely supported by RBI actions.
• Inflation continues to remain elevated and post policy market has concluded that further rate cuts are largely ruled out.
• Liquidity is however expected to remain in surplus guiding the lower rates predominantly in the front end of the curve.
• RBI will continue to remain the driver of rates in the near to medium term until there is a complete return to normalization.
• While the scope for direct rate cuts is limited, we would expect RBI to use unconventional measures (such as OMOs and liquidity
support) to anchor the rates and prevent undue volatility.
• Budget, fiscal position and the resultant borrowing for next financial year will take much of the market attention in the next month.
• In the corporate space, spreads were largely range bound in tandem with the G-sec curve. In the longer end the movement was
largely in line with G-secs.
• Heading into the last quarter, there could be some supply pressures and therefore do not expect any meaningful compression in
spreads.
• RBI maintained the policy rates as expected and much to the relief of the markets left the status on liquidity unchanged as well.
• RBI has guided to continue with accommodative stance as long as it is required - at least during the current financial year and
also running into the next financial year, to revive growth on a durable basis and mitigate the pandemic impact while ensuring
inflation remains within target.

42
Forex Market Review
Indian rupee jumped in December
• The rupee strengthened sharply against the US dollar, aided by positive developments surrounding Covid-19 vaccines, periodic rally in local equity indices, and
foreign fund inflows into the domestic financial market.
• The RBI’s decision to keep interest rate unchanged at 4% and sporadic declines in the US dollar index helped the local unit. The US dollar index fell after the
US Fed said that it would continue to support the US economy through adequate monetary stimulus.
• The rupee gained further after US President Donald Trump signed a second coronavirus stimulus package, on the back of improved investor risk appetite.
• Intermittent gains in other Asian units and exporters’ dollar sales also contributed to the rupee’s rise.
• Some rupee gains were chipped away weighed by state-owned banks’ dollar purchases.
• Lack of progress on a fiscal stimulus bill in the US earlier in the month, the UK government’s decision to impose fresh lockdowns to curb the spread of a new
coronavirus strain, and concerns regarding the impact of Covid 19 on global economic recovery, also erased some of the rupee’s gains.
Source: RBI, CRISIL. Data as on December 2020 except otherwise mentioned
Rupee Movement V/s Global Currencies
31-Dec-20 27-Nov-20 Change % Change
USD 73.06 74.03 0.97 1.31
GBP 99.78 98.85 -0.93 -0.94
EURO 89.71 88.15 -1.56 -1.77
100 YEN 70.80 71.12 0.32 0.45
Strong foreign fund inflows into the domestic financial market prop up the rupee
66
68
70
72
74
76
78
Dec-1
9
Jan
-20
Fe
b-2
0
Ma
r-20
Ap
r-20
Ma
y-2
0
Jun
-20
Jul-2
0
Au
g-2
0
Se
p-2
0
Oct-
20
Nov-2
0
Dec-2
0
(INR per USD)Rupee Vs Dollar
Inverse scale

43
Climate Change and ESG
Source: Bloomberg, International Energy Agency (IEA), data as of December 2020
Investment involves risks. Past performance is no guarantee of future returns
• The issue of climate change (generally measured in terms of carbon dioxide or CO2 emissions) has been in the limelight amid the rising number of climate
disasters such as wildfires, floods, droughts, diseases, etc in recent times. The steadily rising emissions are especially evident from countries other than
advanced economies over the years.
• This has resulted in shifting of focus towards businesses which are sensitive towards tackling these issues or in other words take into consideration the
environmental, social and governance (ESG) factors while conducting their business.
• In fact, globally the total assets under management of mutual funds/ETFs following the ESG route reached $1.2 trillion in third quarter of 2020.
• According to the Forum for Sustainable and Responsible Investment’s 2020 trends report, between 2018 and 2020, total US-domiciled sustainably invested
assets under management grew 42%, to $17.1 trillion, up from $12 trillion.
• If we consider climate change and ESG themes in terms of performance vis-à-vis general equity for illustrative purposes, a sum of $100,000 invested in
MSCI World Climate Change index and MSCI World ESG Sector Leaders index in December 2014 would have grown to $187,000 and $153,000,
respectively as on December 31, 2020 as against growth of $152,000 in MSCI All Country World Index (ACWI) during the same period.
• Meanwhile, on the domestic front, the government formed constituted a committee which will oversee the implementation of the climate change mitigation
targets committed under the Paris Agreement by India.
0
5
10
15
20
25
199
0
199
1
199
2
199
3
199
4
199
5
199
6
199
7
199
8
199
9
200
0
200
1
200
2
200
3
200
4
200
5
200
6
200
7
200
8
200
9
201
0
201
1
201
2
201
3
201
4
201
5
201
6
201
7
201
8
201
9
Energy Related CO2 Emissions (in giga tonnes)
Advanced economies Rest of the World
80
100
120
140
160
180
200
Dec-1
4
Ma
y-1
5
Nov-1
5
Ap
r-16
Oct-
16
Ma
r-17
Se
p-1
7
Ma
r-18
Au
g-1
8
Fe
b-1
9
Jul-1
9
Jan
-20
Jul-2
0
Dec-2
0
(in
$ '0
00)
MSCI All Country World Index (ACWI)
MSCI World Climate Change Net Return Index
MSCI World ESG Sector Leaders Index

44
ESG Performance
Source: NSE, Bloomberg. Data as of December 2020. Returns above 1 year are compounded annualized.
Investment involves risks. Past performance is no guarantee of future returns
Period Performance (%)
Nifty 100 ESG Nifty 50
1 year 21.57 14.90
2 years 16.13 13.43
3 years 11.91 9.88
5 years 13.74 11.95
7 years 13.70 12.04
• In the Indian context, the ESG theme has shown encouraging performance.
• In terms of returns, ESG (represented by Nifty 100 ESG) has outperformed general equity (represented by Nifty 50) across various time periods.
• If long-term growth in ESG scheme is analyzed, if an investor put in INR 100,000 in Nifty 100 ESG and Nifty 50 in April 2011, it would have grown to INR
280,000 and INR 243,000, respectively, for the period ended December 2020.
0
50
100
150
200
250
300
Ap
r-11
Nov-1
1
Jun
-12
Jan
-13
Se
p-1
3
Ap
r-14
Nov-1
4
Jul-1
5
Fe
b-1
6
Se
p-1
6
Ap
r-17
Dec-1
7
Jul-1
8
Fe
b-1
9
Oct-
19
Ma
y-2
0
Dec-2
0
(in
IN
R '0
00)
Growth of Rs 1 lakh
Nifty 100 ESG Index Nifty 50

45
Economic Events Calendar
Source: Crisil
Date Indicators Previous
6-January-21 US ADP Employment Report, December 307,000
Eurozone Producer Price Index, November 0.4%
India Markit Services PMI, December 53.7
7-January-21 Eurozone Consumer Price Index, December -0.3%
Eurozone Retail Sales, November 1.5%
UK Markit Construction PMI, December 54.7
8-January-21 US Non-farm Payrolls, December 245,000
11-January-21 China Consumer Prices, December -0.5%
China Producer Prices, December 0.5%
12-January-21 India Consumer Inflation, December 6.93%
India Industrial Production, November 3.6%
13-January-21 US Consumer Prices, December 0.2%
Eurozone Industrial Production, November 2.1%
14-January-21 China Trade Surplus, December $ 75.4 billion
India Wholesale Inflation, December 1.55%
15-January-21 US Industrial Production, December 0.4%
US Business Inventories, November 0.7%
Eurozone Trade Balance, November 30 billion euros
46
Economic Events Calendar (cont’d)
Source: Crisil
Date Indicators Previous
18-January-21 China Industrial Output, December 7%
China Retail Sales, December 5%
China GDP, Q4 2020 4.9%
20-January-21 UK Consumer Prices, December 0.3%
UK Producer Prices, December -0.8%
China Loan Prime Rate 5Y 4.65%
21-January-21 US Housing Starts, December 1.55 million
ECB Refinancing Rate 0%
BoJ Interest Rate Decision -0.10%
22-January-21 US Existing Home Sales, December 6.69 million
UK Retail Sales, December -3.8%
27-January-21 US Durable Goods Orders, December 0.9%
China Industrial Profits, December 15.5%
28-January-21 US GDP, Q4 2020 33.1%
US Fed Funds Target Rate 0-0.25%
29-January-21 US Pending Home Sales, December -2.6%
India Core Sector Growth, December -2.6%

47
Disclaimer
This document has been prepared by HSBC Asset Management (India) Private Limited (HSBC) for information purposes only and should not be construed as i) an
offer or recommendation to buy or sell securities, commodities, currencies or other investments referred to herein; or ii) an offer to sell or a solicitation or an offer for
purchase of any of the funds of HSBC Mutual Fund; or iii) an investment research or investment advice. It does not have regard to specific investment objectives,
financial situation and the particular needs of any specific person who may receive this document. Investors should seek personal and independent advice regarding
the appropriateness of investing in any of the funds, securities, other investment or investment strategies that may have been discussed or referred herein and
should understand that the views regarding future prospects may or may not be realized. In no event shall HSBC Mutual Fund/HSBC Asset management (India)
Private Limited and / or its affiliates or any of their directors, trustees, officers and employees be liable for any direct, indirect, special, incidental or consequential
damages arising out of the use of information / opinion herein.
This document is intended only for those who access it from within India and approved for distribution in Indian jurisdiction only. Distribution of this document to
anyone (including investors, prospective investors or distributors) who are located outside India or foreign nationals residing in India, is strictly prohibited. Neither this
document nor the units of HSBC Mutual Fund have been registered under Securities law/Regulations in any foreign jurisdiction. The distribution of this document in
certain jurisdictions may be unlawful or restricted or totally prohibited and accordingly, persons who come into possession of this document are required to inform
themselves about, and to observe, any such restrictions. If any person chooses to access this document from a jurisdiction other than India, then such person do so
at his/her own risk and HSBC and its group companies will not be liable for any breach of local law or regulation that such person commits as a result of doing so.
© Copyright. HSBC Asset Management (India) Private Limited 2021, ALL RIGHTS RESERVED.
HSBC Asset Management (India) Private Limited, 16, V.N. Road, Fort, Mumbai-400001
Email: [email protected] | Website: www.assetmanagement.hsbc.com/in
Mutual fund investments are subject to market risks, read all scheme related documents carefully.