global mindedness and perceptions of middle school
TRANSCRIPT
Global Mindedness and Perceptions of Middle School Experiences Among Students Enrolled in the International
Baccalaureate Middle Years Programme
January 2013
Julie H. Wade and Natalie L. Wolanin

i IB Middle Years Programme
Table of Contents
Table of Contents ............................................................................................................................. i
List of Tables .................................................................................................................................. ii
Executive Summary ........................................................................................................................ v
Summary of Methodology .......................................................................................................... v
Key Findings .............................................................................................................................. vi
Recommendations and Next Steps............................................................................................... viii
Background ..................................................................................................................................... 1
Literature Review............................................................................................................................ 2
Methodology ................................................................................................................................... 4
Selection of Schools .................................................................................................................... 4
Student Sample and Survey Administration ............................................................................... 4
Student Survey ............................................................................................................................ 5
Student Demographic Information ............................................................................................. 5
Procedures for Analysis .............................................................................................................. 6
Findings........................................................................................................................................... 8
Characteristics of Survey Respondents ....................................................................................... 8
Survey Responses of MYP and non-MYP Students ................................................................... 9
Perceptions of Students Previously Enrolled in MYP: Responses to Open-ended Survey Questions................................................................................................................................... 24
Discussion ..................................................................................................................................... 28
Recommendations and Next Steps................................................................................................ 29
References ..................................................................................................................................... 30
Appendix A ....................................................................................................................................32
ii IB Middle Years Programme
List of Tables Table 1 Demographic Characteristics of All Survey Respondents Previously Enrolled in
MYP Schools or Non-MYP Schools ..................................................................................8
Table 2 Demographic Characteristics of Subsamples of Survey Respondents MYP and Non-MYP Students Matched on Demographic Characteristics .........................................9
Table 3a Percentage of Respondents Agreeing with Statements on the Responsibility Dimension of the Global-Mindedness Survey: MYP and Non-MYP Students Matched on Demographic Characteristics........................................................................10
Table 3b Odds Ratios for Agreement With Survey Items on the Responsibility Dimension of the Global-Mindedness Survey: Items With Statistically Significant Effect for MYP Enrollment ..............................................................................................................11
Table 4a Percentage of Respondents Agreeing With Statements on the Cultural Pluralism Dimension of the Global-Mindedness Survey: MYP and Non-MYP Students Matched on Demographic Characteristics........................................................................11
Table 4b Odds Ratios for Agreement With Survey Items on the Cultural Pluralism Dimension of the Global-Mindedness Survey: Items With Statistically Significant Effect for MYP Enrollment ..............................................................................................12
Table 5a Percentage of Respondents Agreeing With Statements on the Efficacy Dimension of the Global-Mindedness Survey: MYP and Non-MYP Students Matched on Demographic Characteristics............................................................................................12
Table 5b Odds Ratios for Agreement With Survey Items on the Efficacy Dimension of the Global-Mindedness Survey: Item With Statistically Significant Effect for MYP Enrollment ........................................................................................................................13
Table 6 Percentage of Respondents Agreeing With Statements on the Globalcentrism Dimension of the Global Mindedness Survey: MYP and Non-MYP Students Matched on Demographic Characteristics........................................................................13
Table 7a Percentage of Respondents Agreeing With Statements on the Interconnectedness Dimension of the Global-Mindedness Survey: MYP and Non-MYP Students Matched on Demographic Characteristics........................................................................14
Table 7b Odds Ratios for Agreement With Survey Items on the Interconnectedness Dimension of the Global-Mindedness Survey: Item With Statistically Significant Effect for MYP Enrollment ..............................................................................................14
Table 8 Adjusted Mean Scores on Dimensions of Global-Mindedness Survey: MYP and Non-MYP Students Matched on Demographic Characteristics .......................................15
Table 9 Response to Survey Question About Familiarity With IB Diploma Programme: MYP and Non-MYP Students Matched on Demographic Characteristics ......................16
Table 10 Response to Survey Question About Intended Enrollment in IB Diploma Programme: MYP and Non-MYP Students Matched on Demographic Characteristics ..................................................................................................................16
iii IB Middle Years Programme
Table 11 Response to Survey Question about Intended Enrollment in IB DP Courses: MYP and Non-MYP Students Matched on Demographic Characteristics ......................17
Table 12 Response to Survey Question About Reasons for IB DP Enrollment or Courses: MYP and Non-MYP Students Matched on Demographic Characteristics ......................18
Table 13 Response to Survey Question About Intended Enrollment in High School Courses: MYP and Non-MYP Students Matched on Demographic Characteristics ......19
Table 14 Correlations between Global-Mindedness Ratings and High School Plans: MYP and Non-MYP Students Matched on Demographic Characteristics ................................20
Table 15 Response to Survey Question About Participation in Student Service Learning, Volunteer, and Extracurricular Activities: MYP and Non-MYP Students Matched on Demographic Characteristics .......................................................................................21
Table 16 Response to Survey Question About Reasons for Participation in Student Service Learning Activities: MYP and Non-MYP Students Matched on Demographic Characteristics............................................................................................22
Table 17 Response to Survey Questions about Time Spent on Topics: MYP and Non-MYP Students Matched on Demographic Characteristics ...............................................23
Table 18 Odds Ratios for Indicating A Lot or Moderate Amount of Time Spent on Topics: Items with Statistically Significant Effect for MYP Enrollment......................................24
Table 19 Most Significant Learning Experience in MYP: Most Frequent Responses (N = 385) ..........................................................................................................................25
Table 20 Benefits of Being an MYP Student: Most Frequent Responses (N = 403)...................26
Table 21 How it Feels Being an MYP Student: Most Frequent Responses (N = 403) ................27
Table 22 Challenges of Being an MYP Student: Most Frequent Responses (N = 382) ..............28

iv IB Middle Years Programme
This page is intentionally left blank.
v IB Middle Years Programme
Executive Summary A study of the International Baccalaureate (IB) Middle Years Programme (MYP) was conducted in a large, socioeconomically diverse district of rural, urban, and suburban communities. The study was requested by the school district office overseeing the program in collaboration with the IB. Funding for the study was provided by the IB. The broad objective of this three-phase study is to examine the influence of MYP on later high school performance and course enrollment, as well as to gain a more thorough understanding of the MYP experience from both student and teacher perspectives. This report is focused on phase 2 of the study: an examination of students’ perceptions of their middle school experience, with an emphasis on key features of the MYP, such as promoting active citizenship and global understanding. The MYP uses a holistic approach to learning, with an emphasis on communication and intercultural awareness (IB, 2012a). The MYP encourages students “to become active, compassionate and lifelong learners who understand that other people, with their differences, can also be right.” (IB, 2012b). Five middle schools in the school district have implemented the MYP; all use a whole-school model (i.e., all teachers and students in the school participate in the program). This study compared the perceptions of Grade 9 high school students previously enrolled in the MYP with those of students previously enrolled in non-MYP middle schools with regard to their middle school experiences, their plans for IB, intended course enrollment, student service learning and volunteer experiences, and global mindedness. In addition, the perceptions of former MYP students with regard to their MYP experience, including their most significant learning experience, benefits, and challenges of the MYP, were examined.
Summary of Methodology
An online survey was administered in the spring of 2012 to Grade 9 students in four high schools. The survey included: questions about students’ middle school experience, plans for high school course enrollment, intended enrollment in the IB Diploma Programme (DP), student service learning and volunteer experience, and the Global-Mindedness Survey developed by Hett (1993). The response rate was estimated at 42% across the four schools. Survey responses were compared for two groups of students—students who were previously enrolled in an MYP middle school and students who were previously enrolled in a non-MYP middle school. The study was conducted using two levels of control to reduce the effect of demographic differences between the two groups: 1) by selection of a comparison group using propensity score matching; and 2) by statistically controlling for student background characteristics. For analyses comparing responses from the two groups, matched samples of 175 MYP students and 175 non-MYP students were used. In addition, student perceptions of the MYP experience were examined through responses to a series of open-ended survey questions
vi IB Middle Years Programme
administered only to the students who had attended an MYP middle school; for these findings, responses from all MYP survey respondents were used (N = 558).
Key Findings
Findings for each of the seven evaluation questions follow. Survey Responses of MYP and non-MYP Students
1. How did former MYP students compare with non-MYP students with regard to global mindedness? Overall, students who had attended an MYP school responded to the Global-Mindedness Survey statements more positively than students who had attended non-MYP schools. On 7 of the 30 survey items, previous enrollment at an MYP school was a statistically significant influence, after controlling for demographic characteristics.
Scores of MYP and non-MYP students were compared on the five dimensions of the Global-Mindedness Survey. MYP students had significantly higher levels of global mindedness on the dimension of Cultural Pluralism (see page 5 for description) than non-MYP students. The effect size was small but practically significant.
2. Did intended IB program enrollment differ between former MYP and non-MYP students? About one third of the students in each of the groups reported that they intend to enroll in the IB DP. Previous enrollment in an MYP middle school was not related to students’ reported plans for enrollment in the IB DP. More than 80% of students in each of the groups indicated that they were somewhat or very likely to take courses in the IB DP. Previous enrollment in an MYP middle school was not related to students’ reported plans for taking IB DP courses.
3. Did planned high school course-taking differ between former MYP and non-MYP students? Plans for high school courses in science, social studies, and world languages of MYP students and non-MYP students were similar. In both groups, the largest percentage of students reported plans to take more than the recommended minimum number of courses in world languages—about two thirds of the students in both groups indicated that they probably will take more than two years of world languages. About one half of the students in each group reported that they would like to take more than the required social studies courses, and about a third of the students in each group indicated that they would like to take more than the required science courses.
4. Was there a relationship between measures of global mindedness and planned course-taking and IB enrollment? Overall, the survey data showed a significant association between some dimensions of global mindedness and plans for enrollment or courses in IB, and plans to take more than the required world language courses in both groups of students. The strongest relationships were found between plans for IB and the dimensions of Responsibility (see page 5 for description) and Cultural Pluralism, particularly among students previously enrolled in MYP. The effect sizes for most of these relationships were small.
vii IB Middle Years Programme
5. Did involvement in Student Service Learning differ between former MYP and non-
MYP students? A larger percentage of students previously enrolled in MYP reported working on Student Service Learning (SSL) projects in school and outside of school than their peers who were enrolled in non-MYP middle schools. The percentages for school-organized projects were: MYP, 52%; non-MYP, 44%. Percentages for SSL projects outside of school were: MYP 60%, non-MYP 14%. The effect of MYP was statistically significant on involvement in SSL projects outside of school; the effect size was small but of practical significance.
6. What were the perceptions of the middle school experience with regard to time spent on
international issues, other cultures, and the environment expressed by former MYP and non-MYP students? Students who were previously enrolled in MYP middle schools were significantly more likely to report spending a moderate amount or a lot of time on learning about and discussing issues related to the environment and learning about and discussing other cultures than were students who had been enrolled in non-MYP middle schools. Comparisons of the survey response categories between the two groups of students reflected small and medium effect sizes. Perceptions of Students Previously Enrolled in MYP
7. What were the perceptions of former MYP students with regard to their MYP experience, including their most significant learning experience, benefits, and challenges of MYP? The open-ended survey questions addressed students’ thoughts and opinions about their MYP program; responses from all of the survey respondents who previously attended MYP schools (N = 558) were included in the qualitative analysis of the open-ended survey questions. A total of 385 students responded to the question, “What has been your most significant learning experience in MYP?” Fourteen percent (n = 55) of the responding students named projects/assignments or a specific class. For example, one student said, “So far, the mini-personal project in English class has been my most significant learning experience through MYP because planning ahead of time and working really hard on the assignment taught me a whole lot about setting goals and completing an assignment on time.” Twelve percent of the responding MYP students (n = 45) reported learning about cultures, and eleven percent (n = 43) named community service and learning how to help others, such as participating in the school’s Hunger Banquet. One student explained, “Making sandwiches for the homeless was a significant learning experience because I felt like I was making a difference for people in my community.” Students from MYP middle schools also were asked, “What are the benefits of being an MYP student?” The number of students who responded to this open-ended question was 403. The largest percentage of respondents (68 students, 17%) reported having a better understanding of the world. One student stated, “You not only learn about problems in your own country but other countries too, and you get to discuss more international topics.” Learning something new and participating in projects was reported by 15% of students (n = 59); 13% (n = 52) said that MYP is more rigorous and challenging; and another 13% of respondents (n = 52) named learning about other cultures.
viii IB Middle Years Programme
Asked how it feels to be an MYP student, 16% (n = 66) of the 403 respondents reported feeling proud. One student explained the feeling this way: “It makes me feel proud to be a part of a program that raises awareness about the environment and different cultures.” Finally, the surveyed students were asked about the challenges of being an MYP student, and 382 students responded. One fourth of the respondents (n = 95, 25%) reported that they did not have any challenges being an MYP student. The most frequently reported challenge was that the work is harder (n = 81, 21%); one student described it this way: “The expectations are higher as an MYP student, and the classes move faster.” Other challenges named by 10% or more of the responding students were: more course work and assignments (n = 46, 12%), and projects (n = 38, 10%).
Recommendations and Next Steps
The following recommendations are suggested by the findings: • Examine SSL hours for students with MYP and non-MYP middle school experience. Prior
MYP enrollment had a positive effect on students’ reported out-of-school SSL activities. To substantiate and better understand this effect, it may be useful to analyze the SSL records of students in the original two study groups as they progress through high school to learn whether the reported advantage is lasting, and what kinds of SSL activities are pursued by the MYP students.
• Examine future high school course enrollment of survey respondents to determine whether a relationship between global mindedness and actual course enrollment is demonstrated, given the observed relationship between some dimensions of global mindedness and course plans.
• Examine actual IB DP enrollment by a larger group of MYP and non-MYP students. Although previous MYP enrollment was not related to reported plans for IB DP enrollment among the students in this study, analysis of the IB DP enrollment of a larger group of students in more high schools may help build an understanding of the relationship between MYP and IB DP enrollment.
• Work with counselors and MYP coordinators to ensure that a process is in place to identify students who are struggling with the demands of MYP and to provide the needed support. About one half of the MYP students who responded to the survey named managing the coursework and related issues as a challenge of MYP.
1 IB Middle Years Programme
Global Mindedness and Perceptions of School Experiences Among Students Who Were Enrolled in the International Baccalaureate
Middle Years Programme
Julie H. Wade and Natalie L. Wolanin
Background
Founded in 1968, the International Baccalaureate (IB) currently works with more than 3,500 schools in 145 countries to develop and offer four programs to over 1,080,000 students aged 3 to 19 years. The IB Primary Years Programme (PYP), Middle Years Programme (MYP), Diploma Programme (DP), and the IB Career-related Certificate (IBCC) offer challenging curricula with rigorous assessment; each program encourages students to become lifelong learners and active citizens with a global perspective. The IB mission statement says:
The International Baccalaureate aims to develop inquiring, knowledgeable and caring young people who help to create a better and more peaceful world through intercultural understanding and respect (IB, 2012b).
The MYP, for students aged 11 to 16, uses a holistic approach to learning, with an emphasis on communication and intercultural awareness (IB, 2012a). The MYP encourages students “to become active, compassionate and lifelong learners who understand that other people, with their differences, can also be right.” Involvement in community service is a key element of the program. The school district in which the study was conducted is a large, socioeconomically diverse district of rural, urban, and suburban communities. Across the district, 14 IB programs have been authorized and established: one PYP, five MYPs in middle schools, and eight DPs in high schools. Three of the high schools with DPs also have the MYP for students in grades 9 and 10. All PYPs and MYPs in the district employ a whole-school model. The study was requested by the school district office overseeing the program, in collaboration with the IB. The study was conducted by evaluation personnel within the school district; funding for the study was provided by the IB. The broad objective of the study was to examine the influence of MYP on later high school performance and course enrollment, as well as to gain a more thorough understanding of the MYP experience, from both student and teacher perspectives. The study was conducted in three phases: 1) an analysis of the high school course-taking and performance of students previously enrolled in the five MYP middle schools as compared to the five matched non-MYP schools; 2) a comparison of the perceptions of students previously enrolled in MYP with students previously enrolled in non-MYP middle schools with regard to their middle school experience, their plans for IB, student service learning and volunteer experiences, and global mindedness; and 3) an examination of the perceptions of MYP teachers about the program and MYP professional development.
2 IB Middle Years Programme
This report is focused on phase 2 of the study: an examination of students’ perceptions of their middle school experience, with an emphasis on key features of MYP, such as promoting active citizenship and global understanding. A previous study (Wade, 2011) found that students in MYP schools gave a more positive overall school environment rating than students in non-MYP schools. However, the previous study did not directly address the students’ experience with key elements of the MYP program. This study followed up with students who had attended an MYP school and students who had attended a non-MYP school to assess their perceptions of their middle school experience, their interest in high school courses and intended enrollment in the IB DP, their involvement in student service learning and volunteer activities, and their global mindedness. In addition, the students who had attended an MYP school were asked to respond to a series of open-ended questions about their MYP experience, including their most significant learning experience, benefits, and challenges of MYP.
Literature Review
In an examination of the IB MYP after 30 years of operation, Bunnell (2011) focused on two emerging issues: the lack of research on the implementation and impact of MYP, and the role of MYP in the “continuum” of IB. Noting that the high level of freedom and creativity promoted by MYP may be a difficult fit with the rigorous academic demands of being a pre-DP, Bunnell suggested the need for more research addressing the ways that MYP is implemented in schools. Reimers (2004) examined the impact of MYP on IB diploma scores, with mixed results. Caffyn and Cambridge (2005), however, published a critique questioning the design and analyses, and concluding that the findings were not valid. A few studies have examined academic achievement of MYP students (Tan and Bibby, 2012; Wade, 2011), but little research has been directed at MYP in its role as a “pre-DP.” Despite the lack of empirical evidence, Sperandio (2010) has reported that schools starting MYP programs frequently describe their expectation that the curriculum will provide a “seamless” curriculum in conjunction with the PYP and DP. Among the specific aims of the IB MYP is its emphasis on active citizenship and global mindedness, and these objectives have received little attention in the research. Walker (2005), in a speech about the role of research in the IB organization, suggested that addressing the question “what is distinctive about the IB?” should underlie research efforts. Among the elements he identified as distinctive to the “IB experience” were international mindedness and civic responsibility. Yazzie-Mintz (2010) examined the responses of IB and non-IB students to the High School Survey of Student Engagement, a national survey measuring the academic, social, and emotional engagement of high school students. He found that IB students had higher scores on Social/Behavioral/Participatory Engagement, which includes items related to “gaining awareness of conditions in the community outside of school.” However, a study of MYP student engagement as measured by a middle school version of the same survey found that the responses of MYP students were not significantly different from demographically matched non-MYP peers (Wade, 2011). Perhaps contributing to the scarcity of research in IB is the difficulty of identifying an appropriate comparison group. Assessing the impact of IB program participation is complicated
3 IB Middle Years Programme
by issues of selection, since most IB students are high-achieving even before they participate in an IB program. This problem was highlighted by Kiplinger (2005a; 2005b) and discussed in an IB publication reviewing the research related to IB programs (IB, 2008). Studies of effects associated with IB programs must contend with the fact that IB students, particularly at the high school level, are often high-performing students who have opted to take the most demanding courses. Although the philosophy of the IB program extends beyond academics, it is difficult to measure the impact of IB, academic or otherwise, because of self-selection in most IB programs (IB, 2008). The whole-school model of MYP in the district provided a study sample not confounded by student self-selection factors. Students in the current study, who were previously enrolled in MYP, attended middle schools in which all students and teachers participated in the IB MYP program. Thus, although at the school level some selection factors may be at play (i.e., the schools that students previously attended were not randomly assigned to MYP or non-MYP), the students within schools did not elect whether or not to be in MYP, as has been the case in some earlier studies. Consistent with the recommendations of Walker (2005) and Bunnell (2011) to direct research toward a better understanding of the distinguishing elements of the MYP and how they are implemented in the classroom, this study aims to better understand students’ MYP experience and how it may affect their high school course choices and plans for IB DP enrollment, as well as their global mindedness.
Scope of the Study This study explores the impact of participating in MYP in middle school on the high school experience of students, with an emphasis on key features of the MYP, such as promoting global understanding and active citizenship. To understand the impact of MYP, we examined differences between two groups of Grade 9 students: students who had attended an MYP middle school, and students who had attended a non-MYP middle school. The questions guiding the study were:
1. How did former MYP students compare with non-MYP students with regard to global mindedness?
2. Did intended IB DP enrollment differ between former MYP and non-MYP students? 3. Did planned high school course-taking differ between former MYP and non-MYP
students? 4. Was there a relationship between measures of global mindedness and planned course-
taking and IB DP enrollment for MYP and non-MYP students? 5. Did involvement in Student Service Learning differ between former MYP and non-MYP
students? 6. What were the perceptions of the middle school experience with regard to time spent on
international issues, other cultures, and the environment expressed by former MYP and non-MYP students?
4 IB Middle Years Programme
7. What were the perceptions of former MYP students with regard to their MYP experience, including their most significant learning experience, benefits, and challenges of MYP?
Methodology
Selection of Schools
Five high schools with an IB DP, which receive students from both MYP middle schools and non-MYP middle schools, were chosen for the study. The design allowed concurrent survey participation of former MYP students and non-MYP students. Of the five high schools selected for the study, one school was unable to administer the surveys during the designated timeframe because of staffing difficulties, so the study includes students from four high schools.
Student Sample and Survey Administration
Surveys from 735 students from the four high schools are reported in this study. A total of 840 students completed the survey; 48 surveys could not be used because they did not include student ID numbers that were needed for analysis,1 and 57 surveys were completed by students who were not enrolled in the district during middle school. The student sample was made up of two groups of students—students who were previously enrolled in an MYP middle school and students who were previously enrolled in a non-MYP middle school. Students were classified as previously MYP or non-MYP, based on their Grade 8 school assignment. Although the focus of the study was students’ middle school experience in MYP or non-MYP schools, it should be noted that at the time of the survey (Grade 9) students were attending four different high schools, and three of the high schools had MYP in place for Grades 9 and 10 students. In two of the high schools all Grades 9 and 10 students were enrolled in MYP; in one high school students were given the option of MYP participation. Students from both study groups (MYP and non-MYP middle school groups) were enrolled in each of the four high schools, so that some students from non-MYP middle schools were enrolled MYP high schools at the time of the survey (and the reverse). Prior to administering the survey, teachers sent home a permission form to parents describing the study and the survey, and any student whose parent withheld permission was not surveyed. The link to the online survey was sent to the IB coordinator at each of the four high schools to arrange for Grade 9 students to complete during one class period (in most schools, English class). The survey was administered during the spring 2012 semester. It is not possible to calculate a precise response rate for the survey because, due to scheduling and logistical difficulties in some schools, not all students were given the survey. However, of all Grade 9 students in the four high schools, 840, or 42% of them, completed a survey. Percentages of students responding to the survey varied across the four schools, ranging from 15% to 80%.
1 Student ID was required for assignment to an MYP or non-MYP group and to append student demographic data.
5 IB Middle Years Programme
Student Survey
The online survey was developed by OSA researchers and IB program staff. The survey included: questions about the student’s middle school experience; plans for high school course enrollment; intended enrollment in the IB DP; student service learning and volunteer experience; and the Global-Mindedness Survey developed by Hett (1993). The Global-Mindedness Survey consists of 30 questions. Hett (1993) defines global mindedness as “a worldview in which one sees oneself as connected to the global community and feels a sense of responsibility to its members. This commitment is reflected in the individual’s attitudes, beliefs, and behaviors.” The Global-Mindedness Survey is scored on five dimensions. The dimensions, along with Hett’s definitions of them, are as follows:
1. Responsibility: A deep personal concern for people in all parts of the world which surfaces as a sense of moral responsibility to try and improve conditions in some way (seven survey items).
2. Cultural pluralism: An appreciation of the diversity of cultures in the world and a belief that all have something of value to offer. This is accompanied by taking pleasure in exploring and trying to understand other cultural frameworks (eight survey items).
3. Efficacy: A belief that an individual’s actions can make a difference and that involvement in national and international issues is important (five survey items).
4. Globalcentrism: Thinking in terms of what is good for the global community, not just what will benefit one’s own country. A willingness to make judgments based on global, not ethnocentric, standards (five survey items).
5. Interconnectedness: An awareness and appreciation of the interrelatedness of all peoples and nations which results in a sense of global belonging or kinship with the “human family” (five survey items). Dimension scores were computed by calculating an average rating for the items contained in the dimension. On each survey item, a rating of Strongly Agree was coded 4; Agree was coded 3; Disagree was coded 2; and Strongly Disagree was coded 1. Thus the dimension score could range from 1 (i.e., responded Strongly Disagree to all items in the dimension) to 4 (i.e., responded Strongly Agree on all items). Some items were worded negatively, so that a “Disagree” response would indicate stronger global-mindedness; those items were reverse-scored for calculation of dimension scores. The Global-Mindedness Survey (1993) was developed for use with college students. For the current study, minor wording changes in some of the original Global-Mindedness Survey questions were made in order to make the survey more understandable and relevant for Grade 9 students.
Student Demographic Information
Data on race/ethnicity, gender, previous school, and receipt of services (Free and Reduced-price Meals System [FARMS], English for Speakers of Other Languages [ESOL], and special education) for each student were obtained from the district’s student records. These demographic variables were appended to the survey file (using the student ID) in order to
6 IB Middle Years Programme
conduct analyses comparing students who attended MYP middle schools with students who attended non-MYP middle schools, controlling for demographic differences.
Procedures for Analysis
Different analytic procedures were used to address the evaluation questions: Analytic Procedures for Question 1: How did former MYP students compare with non-MYP students with regard to global mindedness? Because the groups of MYP and non-MYP students differed both in size and on several of the demographic characteristics, two methods were used to reduce the potential effect of those differences. Propensity score matching2 was used to identify two groups of students—students who had attended MYP middle schools and students who had attended non-MYP middle schools—who were similar in composition by race/ethnicity; receipt of FARMS, ESOL, and special education services; and gender. These matched groups were used to analyze the effect of previous MYP enrollment on survey responses. Covariate-adjusted models were used to examine the effect of previous MYP enrollment on students’ global mindedness. Two analytic procedures were used to address the evaluation question. Analysis of Covariance (ANCOVA) was used to test the effect of MYP enrollment on students’ global-mindedness dimension scores (each dimension score was a continuous variable, ranging from 1 to 4). Logistic regression was used to test the effect of MYP enrollment on students’ agreement with survey items measuring global mindedness. Students’ responses to each survey item were coded 1 for “Strongly Agree” or “Agree” and 0 for “Strongly Disagree” or “Disagree.” To control for remaining differences in demographic characteristics, propensity scores based on students’ race/ethnicity, receipt of FARMS services, receipt of special education services, enrollment in ESOL classes, and gender were included in the statistical models; the propensity scores were converted to quintiles and used as covariates in the ANCOVA as well as logistic regression models (Rosenbaum & Rubin, 1983, 1984, 1985).
The Levene’s test of the equality of error variances between the two groups of students also is reported for the ANCOVA model. The ANCOVA, as well as the logistic regression findings, were supplemented with the computation of effect sizes measured by Cohen’s d. Effect sizes were used to judge whether the observed relationships were large enough to be of practical significance to educators (American Psychological Association, 2010). Appendix A describes the computation of effect sizes associated with the analytic procedures used in this evaluation. Analytic Procedures for Questions 2 and 3: Did intended IB DP enrollment differ between former MYP and non-MYP students? Did planned high school course-taking differ between former MYP and non-MYP students?
2 Propensity score matching is a method of identifying two groups of subjects who would have similar chances (based on selected variables) of being in the “treatment” group; in this study, “treatment group” refers to previous enrollment in an MYP middle school. The nearest neighbor matching technique was used to identify the two groups for this study.
7 IB Middle Years Programme
The matched samples of MYP and non-MYP students were used for the analyses addressing questions 2 and 3. For question 2, addressing plans for IB DP enrollment, students from one of the high schools in the study were not included because the IB DP school functions as a systemwide magnet program, so the enrollment process is different from those in the other high schools in the study.
Pearson Chi-square tests were used to examine the influence of previous MYP enrollment on plans for IB DP enrollment and on plans for high school courses.
Analytic Procedures for Questions 4: Was there a relationship between measures of global mindedness and planned course-taking and IB DP enrollment for MYP and non-MYP students? Partial correlations of the global-mindedness dimensions with the high school plans were analyzed separately for the demographically matched groups of MYP students and non-MYP students. In correlations with IB DP enrollment, the survey responses of students in the magnet IB DP school were not included. Demographic characteristics were controlled in the partial correlations (using the propensity score quintile calculated with race/ethnicity, gender, FARMS, ESOL, and special education). For these analyses, plans for high school courses and IB DP were scored dichotomously, so that “yes” or “probably will take” was scored as 1, while all other responses (i.e., “no,” “probably will not,” and “I don’t know yet”) were counted as 0. Global-mindedness dimension scores were on a continuous scale ranging from 1 to 4. Analytic Procedures for Questions 5: Did involvement in Student Service Learning differ between former MYP and non-MYP students?
The matched samples of MYP and non-MYP students were used for the analyses addressing question 5. Logistic regression was used to test the effect of MYP enrollment on students’ report of involvement in SSL and volunteer activities. If the student indicated involvement in the activity the activity was coded 1; otherwise the code was 0. To control for remaining differences in demographic characteristics, propensity score quintiles were included in the statistical models. Cohen’s d was calculated in addition to the odds ratio to provide further context.
Analytic Procedures for Questions 6: What were the perceptions of the middle school experience with regard to time spent on international issues, other cultures, and the environment expressed by former MYP and non-MYP students?
The matched samples of MYP and non-MYP students were used for the analyses addressing question 6. Pearson Chi square tests were used to test the overall difference in the distribution of student responses to the survey questions. Logistic regression was used to follow up significant differences revealed by the chi-square test, so that the comparison could be specified and possible differences in demographic characteristics could be controlled by including propensity score quintiles in the statistical models. Cohen’s d was calculated in addition to the odds ratio to provide further context.
8 IB Middle Years Programme
Analytic Procedures for Questions 7: What were the perceptions of former MYP students with regard to their MYP experience, including their most significant learning experience, benefits, and challenges of MYP?
All students who responded to the survey who were previously enrolled in an MYP middle school were included in the sample for question 7. Students’ responses to open-ended questions were grouped into themes or categories. Categories were developed after reading all responses; each response was then assigned the appropriate category code(s). Counts of responses within categories and examples of quotes were used to present key findings from the responses to open-ended survey questions.
Findings
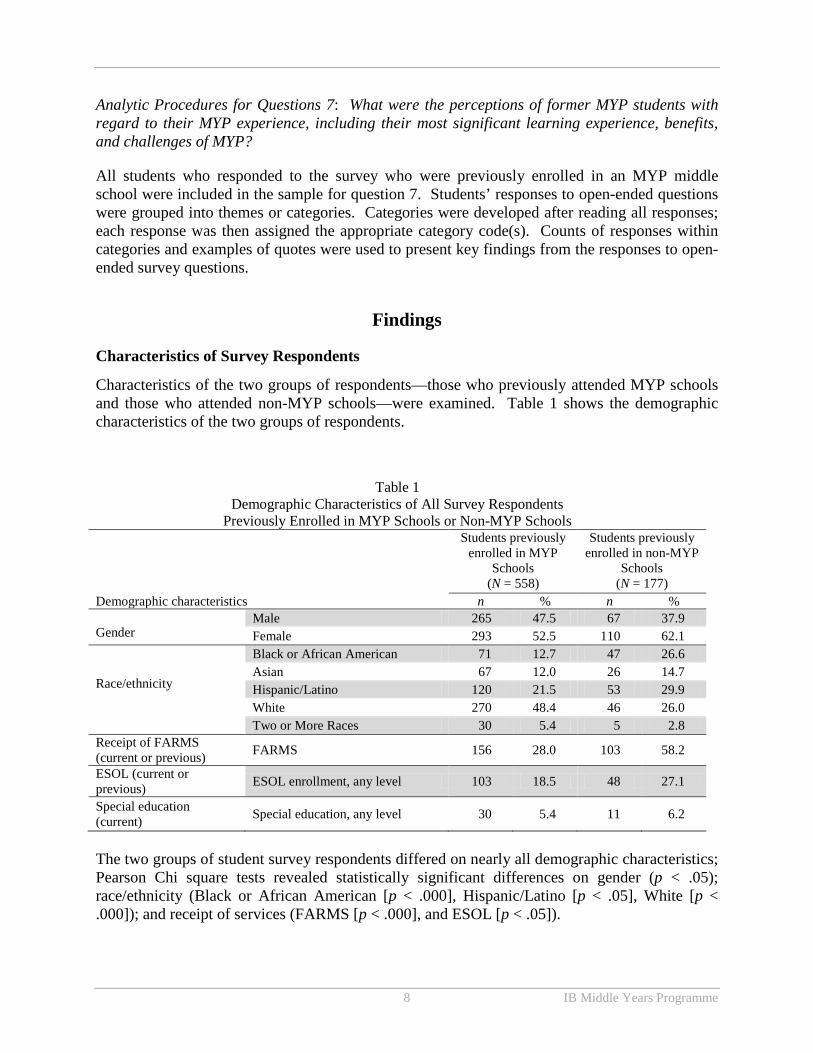
Characteristics of Survey Respondents
Characteristics of the two groups of respondents—those who previously attended MYP schools and those who attended non-MYP schools—were examined. Table 1 shows the demographic characteristics of the two groups of respondents.
The two groups of student survey respondents differed on nearly all demographic characteristics; Pearson Chi square tests revealed statistically significant differences on gender (p < .05); race/ethnicity (Black or African American [p < .000], Hispanic/Latino [p < .05], White [p < .000]); and receipt of services (FARMS [p < .000], and ESOL [p < .05]).
Table 1 Demographic Characteristics of All Survey Respondents
Previously Enrolled in MYP Schools or Non-MYP Schools
Demographic characteristics
Students previously enrolled in MYP
Schools (N = 558)
Students previously enrolled in non-MYP
Schools (N = 177)
n % n % Gender
Male 265 47.5 67 37.9 Female 293 52.5 110 62.1
Race/ethnicity
Black or African American 71 12.7 47 26.6 Asian 67 12.0 26 14.7 Hispanic/Latino 120 21.5 53 29.9 White 270 48.4 46 26.0 Two or More Races 30 5.4 5 2.8
Receipt of FARMS (current or previous) FARMS 156 28.0 103 58.2
ESOL (current or previous) ESOL enrollment, any level 103 18.5 48 27.1
Special education (current) Special education, any level 30 5.4 11 6.2
9 IB Middle Years Programme
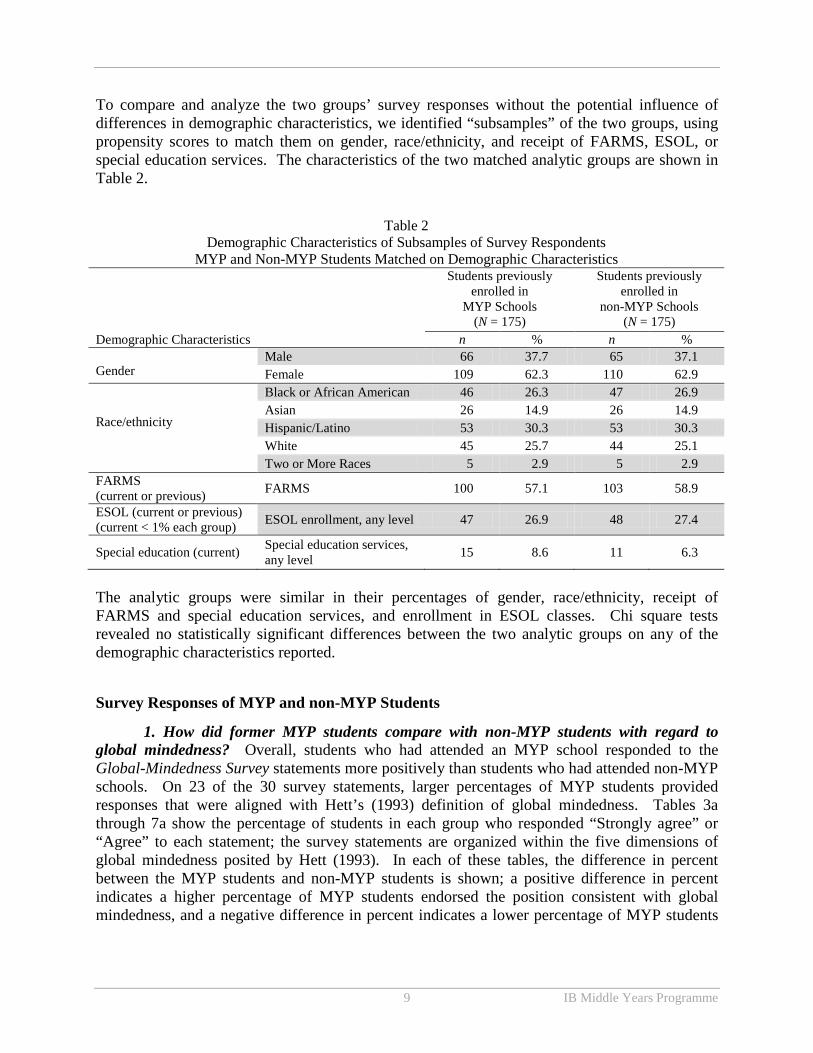
To compare and analyze the two groups’ survey responses without the potential influence of differences in demographic characteristics, we identified “subsamples” of the two groups, using propensity scores to match them on gender, race/ethnicity, and receipt of FARMS, ESOL, or special education services. The characteristics of the two matched analytic groups are shown in Table 2.
The analytic groups were similar in their percentages of gender, race/ethnicity, receipt of FARMS and special education services, and enrollment in ESOL classes. Chi square tests revealed no statistically significant differences between the two analytic groups on any of the demographic characteristics reported.
Survey Responses of MYP and non-MYP Students
1. How did former MYP students compare with non-MYP students with regard to global mindedness? Overall, students who had attended an MYP school responded to the Global-Mindedness Survey statements more positively than students who had attended non-MYP schools. On 23 of the 30 survey statements, larger percentages of MYP students provided responses that were aligned with Hett’s (1993) definition of global mindedness. Tables 3a through 7a show the percentage of students in each group who responded “Strongly agree” or “Agree” to each statement; the survey statements are organized within the five dimensions of global mindedness posited by Hett (1993). In each of these tables, the difference in percent between the MYP students and non-MYP students is shown; a positive difference in percent indicates a higher percentage of MYP students endorsed the position consistent with global mindedness, and a negative difference in percent indicates a lower percentage of MYP students
Table 2 Demographic Characteristics of Subsamples of Survey Respondents
MYP and Non-MYP Students Matched on Demographic Characteristics
Demographic Characteristics
Students previously enrolled in
MYP Schools (N = 175)
Students previously enrolled in
non-MYP Schools (N = 175)
n % n % Gender
Male 66 37.7 65 37.1 Female 109 62.3 110 62.9
Race/ethnicity
Black or African American 46 26.3 47 26.9 Asian 26 14.9 26 14.9 Hispanic/Latino 53 30.3 53 30.3 White 45 25.7 44 25.1 Two or More Races 5 2.9 5 2.9
FARMS (current or previous) FARMS 100 57.1 103 58.9
ESOL (current or previous) (current < 1% each group) ESOL enrollment, any level 47 26.9 48 27.4
Special education (current) Special education services, any level 15 8.6 11 6.3
10 IB Middle Years Programme
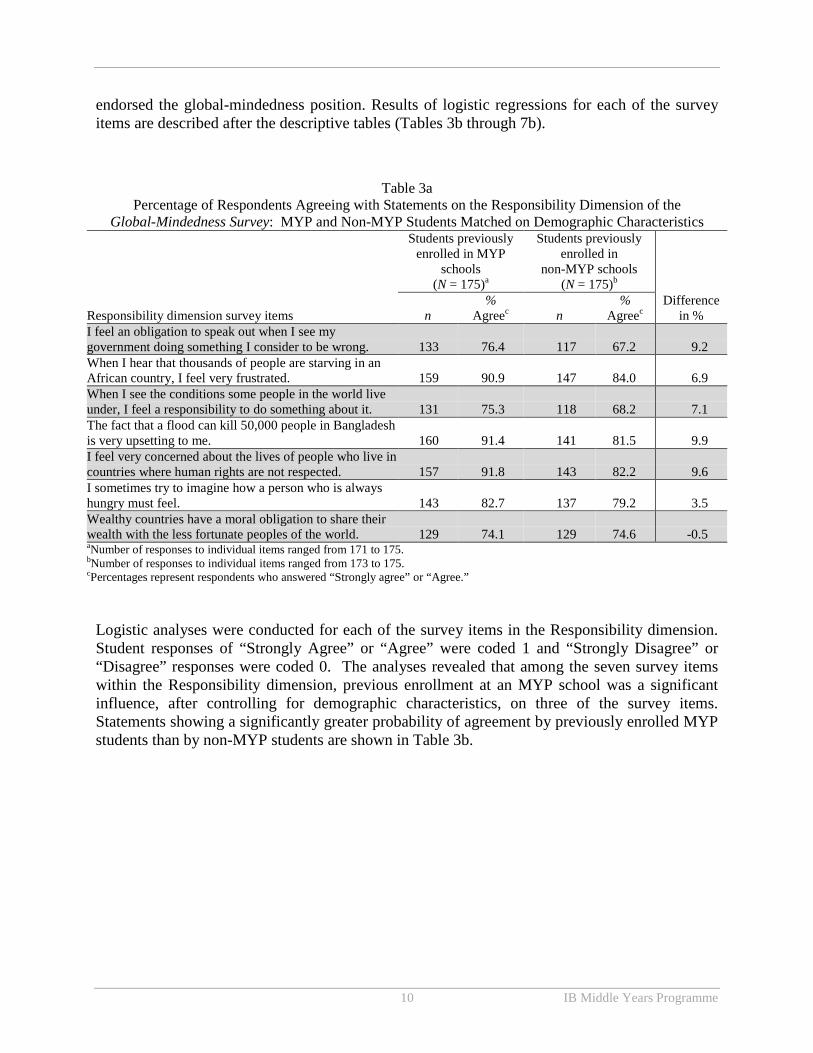
endorsed the global-mindedness position. Results of logistic regressions for each of the survey items are described after the descriptive tables (Tables 3b through 7b).
Logistic analyses were conducted for each of the survey items in the Responsibility dimension. Student responses of “Strongly Agree” or “Agree” were coded 1 and “Strongly Disagree” or “Disagree” responses were coded 0. The analyses revealed that among the seven survey items within the Responsibility dimension, previous enrollment at an MYP school was a significant influence, after controlling for demographic characteristics, on three of the survey items. Statements showing a significantly greater probability of agreement by previously enrolled MYP students than by non-MYP students are shown in Table 3b.
Table 3a Percentage of Respondents Agreeing with Statements on the Responsibility Dimension of the
Global-Mindedness Survey: MYP and Non-MYP Students Matched on Demographic Characteristics
Responsibility dimension survey items
Students previously enrolled in MYP
schools (N = 175)a
Students previously enrolled in
non-MYP schools (N = 175)b
Difference in % n
% Agreec n
% Agreec
I feel an obligation to speak out when I see my government doing something I consider to be wrong. 133 76.4 117 67.2 9.2 When I hear that thousands of people are starving in an African country, I feel very frustrated. 159 90.9 147 84.0 6.9 When I see the conditions some people in the world live under, I feel a responsibility to do something about it. 131 75.3 118 68.2 7.1 The fact that a flood can kill 50,000 people in Bangladesh is very upsetting to me. 160 91.4 141 81.5 9.9 I feel very concerned about the lives of people who live in countries where human rights are not respected. 157 91.8 143 82.2 9.6 I sometimes try to imagine how a person who is always hungry must feel. 143 82.7 137 79.2 3.5 Wealthy countries have a moral obligation to share their wealth with the less fortunate peoples of the world. 129 74.1 129 74.6 -0.5 aNumber of responses to individual items ranged from 171 to 175. bNumber of responses to individual items ranged from 173 to 175. cPercentages represent respondents who answered “Strongly agree” or “Agree.”
11 IB Middle Years Programme
Table 3b Odds Ratios for Agreement With Survey Items on the Responsibility Dimension of the
Global-Mindedness Survey: Items With Statistically Significant Effect for MYP Enrollment
Survey item by student group N Odds Ratio p value Effect size (d) I feel an obligation to speak out when I see my government doing something I consider to be wrong. MYP students 175 1.58 .06 .25 Non-MYP students 175 The fact that a flood can kill 50,000 people in Bangladesh is very upsetting to me. MYP students 175 2.26 .01 .45 Non-MYP students 175 I feel very concerned about the lives of people who live in countries where human rights are not respected. MYP students 175 2.44 .01 .49 Non-MYP students 175
Table 4a Percentage of Respondents Agreeing With Statements on the Cultural Pluralism Dimension of the
Global-Mindedness Survey: MYP and Non-MYP Students Matched on Demographic Characteristics
Cultural Pluralism dimension survey items
Students previously enrolled in MYP
schools (N = 175)a
Students previously enrolled in
non-MYP schools (N = 175)b
Difference in % n
% Agreec n
% Agreec
I generally find it interesting to spend time talking with people from another culture. 170 97.1 161 92.0 5.1 Countries are enriched when they are made up of many people from different cultures and countries. 163 93.1 164 93.7 -0.6 Everyone can learn something of value from all different cultures. 172 98.3 169 97.1 1.2 I enjoy trying to understand people's behavior in the context of their culture. 155 89.1 135 77.6 11.5 My opinions about national policies are based on how those policies might affect the rest of the world. 136 77.7 135 78.0 -0.3 It is important that schools provide clubs and activities designed to promote understanding among students of different ethnic and cultural backgrounds. 161 92.5 153 88.4 4.1 It is important that we educate people to understand the impact that current policies might have on future generations. 160 92.5 151 87.8 4.7 I have very little in common with people in underdeveloped nations. d 89 51.4 83 48.0 -3.4
aNumber of responses to individual items ranged from 171 to 175. bNumber of responses to individual items ranged from 172 to 175. cPercentages represent respondents who answered “Strongly agree” or “Agree.” dSurvey statement is negatively worded, so that lower levels of agreement indicate higher levels of global mindedness.
12 IB Middle Years Programme
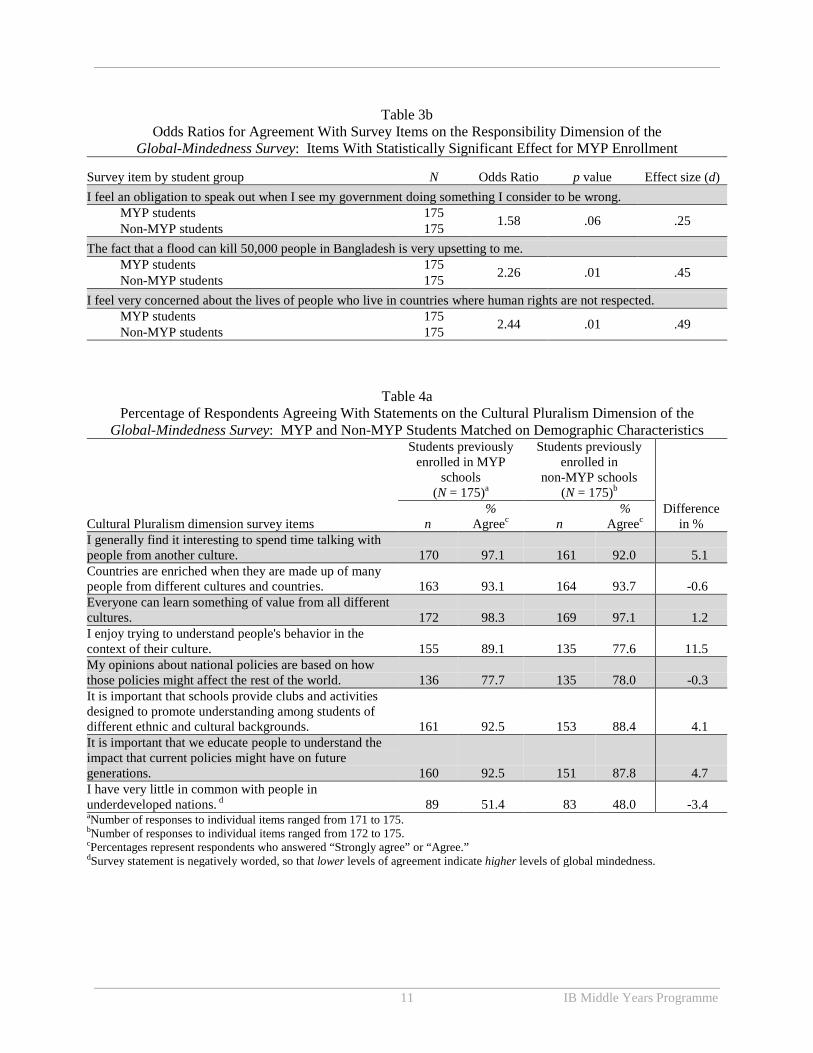
Logistic analyses revealed that among the eight survey items within the Cultural Pluralism dimension, previous enrollment at an MYP school was a significant influence on three of the survey items, after controlling for demographic characteristics. Statements showing a significantly greater probability of agreement by previously enrolled MYP students than by non-MYP students are shown in Table 4b.
Table 4b Odds Ratios for Agreement With Survey Items on the Cultural Pluralism Dimension of the
Global-Mindedness Survey: Items With Statistically Significant Effect for MYP Enrollment
Survey item by student group N Odds Ratio p value Effect size (d) I generally find it interesting to spend time talking with people from another culture. MYP students 175 2.95 .04 .60 Non-MYP students 175 I enjoy trying to understand people's behavior in the context of their culture. MYP students 175 2.36 .01 .47 Non-MYP students 175
Table 5a Percentage of Respondents Agreeing With Statements on the Efficacy Dimension of the
Global-Mindedness Survey: MYP and Non-MYP Students Matched on Demographic Characteristics
Efficacy dimension survey items
Students previously enrolled in MYP
schools (N = 175)a
Students previously enrolled in
non-MYP schools (N = 175)b
Difference in % n
% Agreec n
% Agreec
Really, there is nothing I can do about the problems of the world. d 45 25.9 49 28.2 2.3
Generally, an individual's actions are too small to have a significant effect on the ecosystem. d 61 34.9 56 32.2 -2.7 It is very important to me to choose a career in which I can have a positive effect on the quality of life for future generations. 150 86.7 155 88.6 -1.9 I think my behavior can impact people in other countries. 118 67.8 115 66.5 1.3 I am able to affect what happens on a global level by what I do in my own community. 123 70.7 106 61.3 9.4 aNumber of responses to individual items ranged from 171 to 175. bNumber of responses to individual items ranged from 173 to 175. cPercentages represent respondents who answered “Strongly agree” or “Agree.” dSurvey statement is negatively worded, so that lower levels of agreement indicate higher levels of global mindedness.
13 IB Middle Years Programme
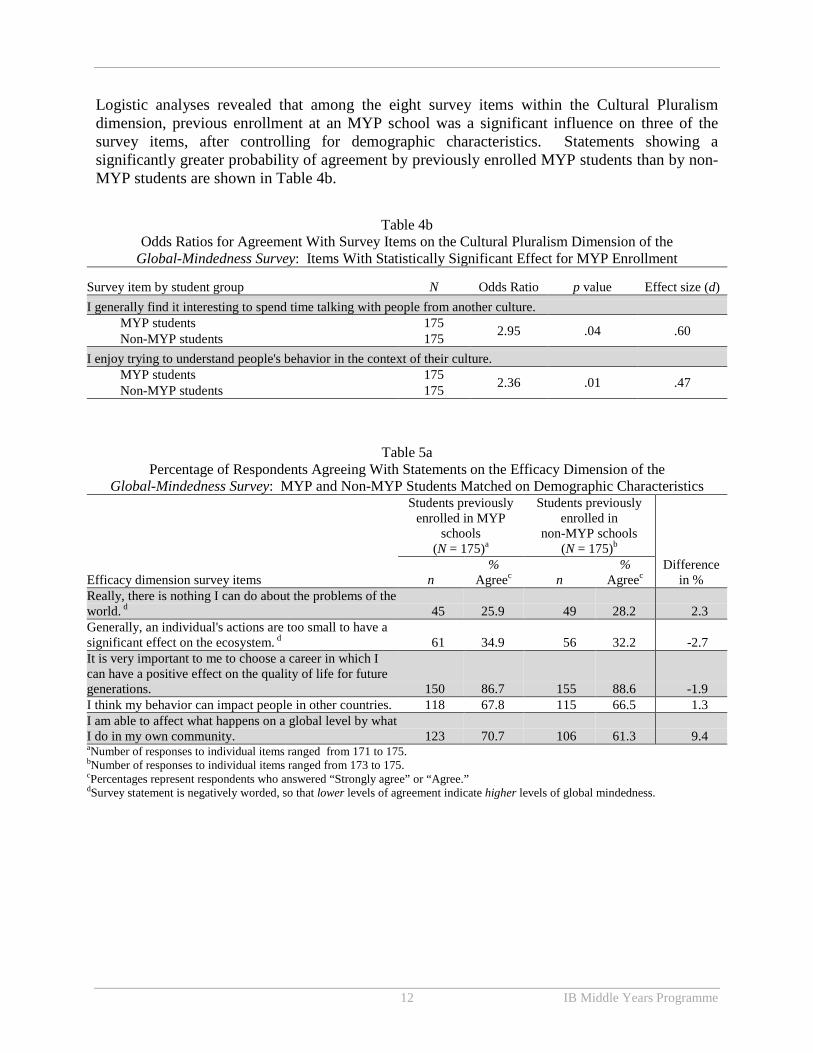
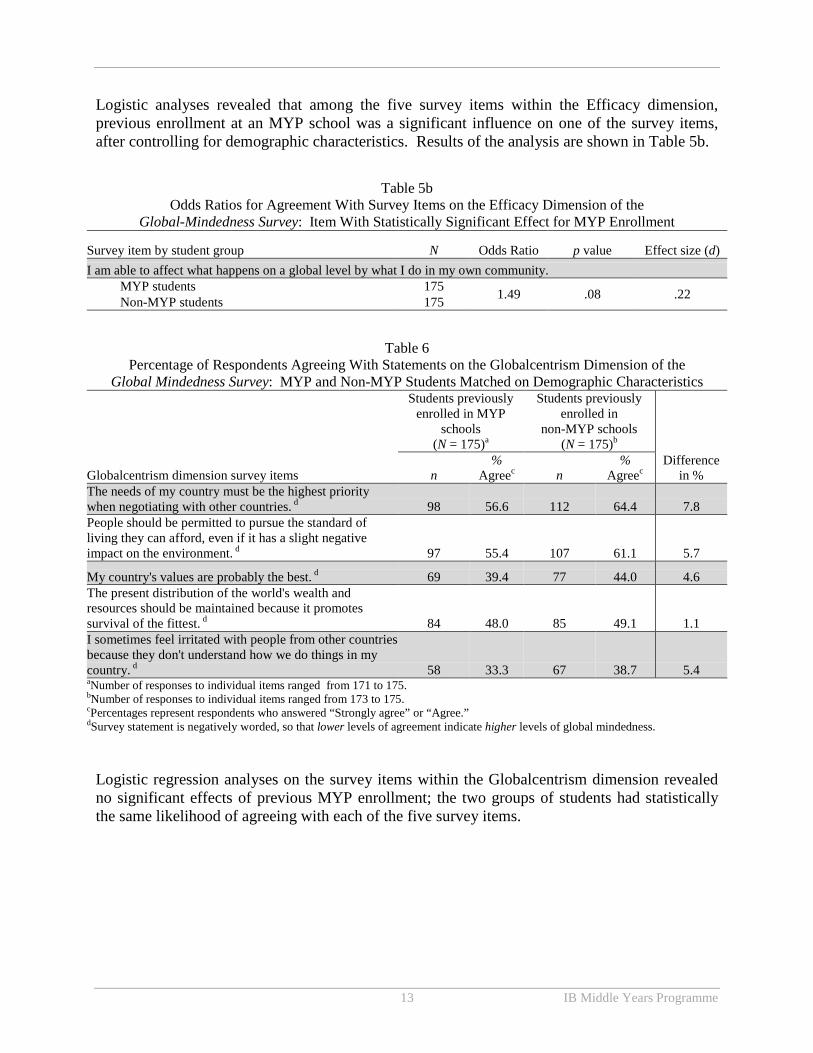
Logistic analyses revealed that among the five survey items within the Efficacy dimension, previous enrollment at an MYP school was a significant influence on one of the survey items, after controlling for demographic characteristics. Results of the analysis are shown in Table 5b.
Logistic regression analyses on the survey items within the Globalcentrism dimension revealed no significant effects of previous MYP enrollment; the two groups of students had statistically the same likelihood of agreeing with each of the five survey items.
Table 5b Odds Ratios for Agreement With Survey Items on the Efficacy Dimension of the
Global-Mindedness Survey: Item With Statistically Significant Effect for MYP Enrollment
Survey item by student group N Odds Ratio p value Effect size (d) I am able to affect what happens on a global level by what I do in my own community. MYP students 175 1.49 .08 .22 Non-MYP students 175
Table 6 Percentage of Respondents Agreeing With Statements on the Globalcentrism Dimension of the
Global Mindedness Survey: MYP and Non-MYP Students Matched on Demographic Characteristics
Globalcentrism dimension survey items
Students previously enrolled in MYP
schools (N = 175)a
Students previously enrolled in
non-MYP schools (N = 175)b
Difference in % n
% Agreec n
% Agreec
The needs of my country must be the highest priority when negotiating with other countries. d 98 56.6 112 64.4 7.8
People should be permitted to pursue the standard of living they can afford, even if it has a slight negative impact on the environment. d 97 55.4 107 61.1 5.7
My country's values are probably the best. d 69 39.4 77 44.0 4.6
The present distribution of the world's wealth and resources should be maintained because it promotes survival of the fittest. d 84 48.0 85 49.1 1.1
I sometimes feel irritated with people from other countries because they don't understand how we do things in my country. d 58 33.3 67 38.7 5.4
aNumber of responses to individual items ranged from 171 to 175. bNumber of responses to individual items ranged from 173 to 175. cPercentages represent respondents who answered “Strongly agree” or “Agree.” dSurvey statement is negatively worded, so that lower levels of agreement indicate higher levels of global mindedness.
14 IB Middle Years Programme
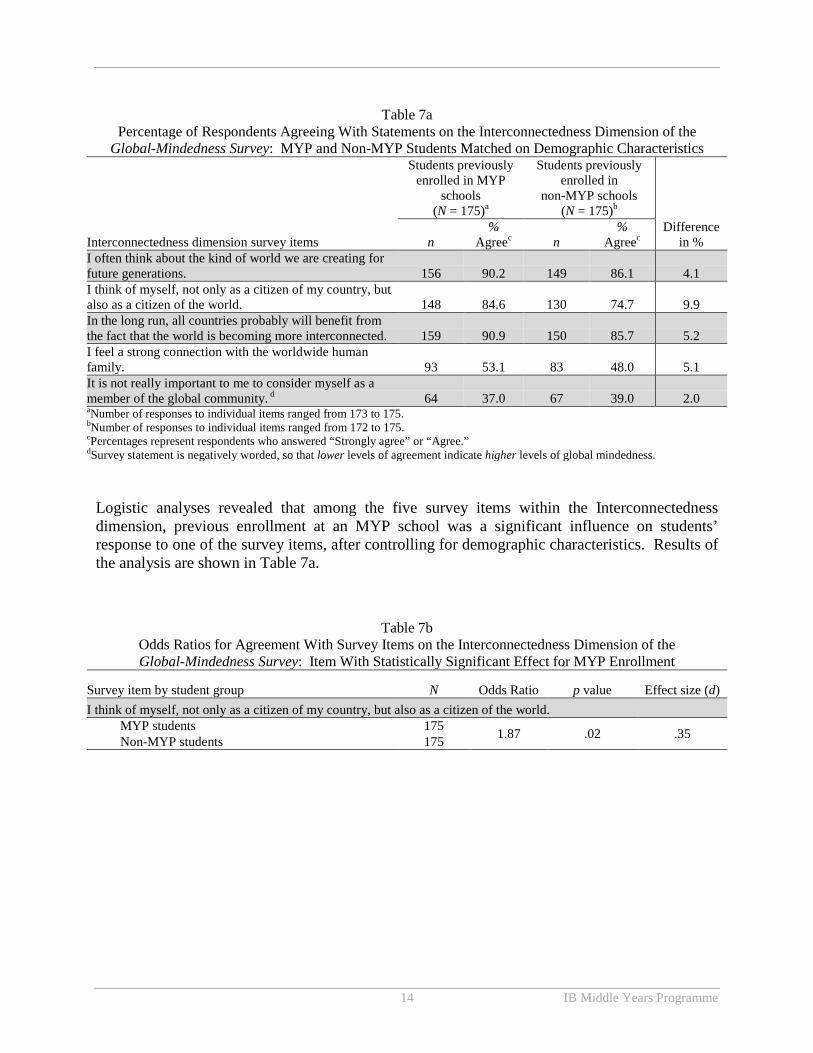
Logistic analyses revealed that among the five survey items within the Interconnectedness dimension, previous enrollment at an MYP school was a significant influence on students’ response to one of the survey items, after controlling for demographic characteristics. Results of the analysis are shown in Table 7a.
Table 7a Percentage of Respondents Agreeing With Statements on the Interconnectedness Dimension of the
Global-Mindedness Survey: MYP and Non-MYP Students Matched on Demographic Characteristics
Interconnectedness dimension survey items
Students previously enrolled in MYP
schools (N = 175)a
Students previously enrolled in
non-MYP schools (N = 175)b
Difference in % n
% Agreec n
% Agreec
I often think about the kind of world we are creating for future generations. 156 90.2 149 86.1 4.1 I think of myself, not only as a citizen of my country, but also as a citizen of the world. 148 84.6 130 74.7 9.9 In the long run, all countries probably will benefit from the fact that the world is becoming more interconnected. 159 90.9 150 85.7 5.2 I feel a strong connection with the worldwide human family. 93 53.1 83 48.0 5.1 It is not really important to me to consider myself as a member of the global community. d 64 37.0 67 39.0 2.0
aNumber of responses to individual items ranged from 173 to 175. bNumber of responses to individual items ranged from 172 to 175. cPercentages represent respondents who answered “Strongly agree” or “Agree.” dSurvey statement is negatively worded, so that lower levels of agreement indicate higher levels of global mindedness.
Table 7b Odds Ratios for Agreement With Survey Items on the Interconnectedness Dimension of the Global-Mindedness Survey: Item With Statistically Significant Effect for MYP Enrollment
Survey item by student group N Odds Ratio p value Effect size (d) I think of myself, not only as a citizen of my country, but also as a citizen of the world. MYP students 175 1.87 .02 .35 Non-MYP students 175
15 IB Middle Years Programme
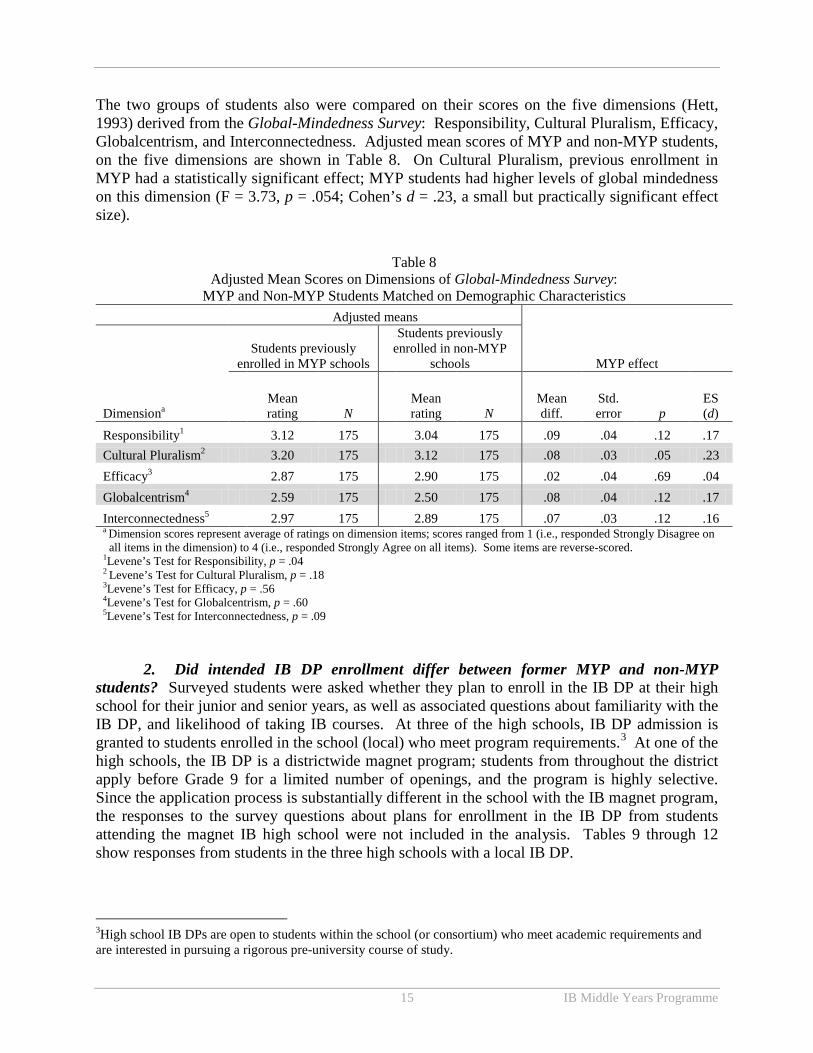
The two groups of students also were compared on their scores on the five dimensions (Hett, 1993) derived from the Global-Mindedness Survey: Responsibility, Cultural Pluralism, Efficacy, Globalcentrism, and Interconnectedness. Adjusted mean scores of MYP and non-MYP students, on the five dimensions are shown in Table 8. On Cultural Pluralism, previous enrollment in MYP had a statistically significant effect; MYP students had higher levels of global mindedness on this dimension (F = 3.73, p = .054; Cohen’s d = .23, a small but practically significant effect size).
2. Did intended IB DP enrollment differ between former MYP and non-MYP students? Surveyed students were asked whether they plan to enroll in the IB DP at their high school for their junior and senior years, as well as associated questions about familiarity with the IB DP, and likelihood of taking IB courses. At three of the high schools, IB DP admission is granted to students enrolled in the school (local) who meet program requirements.3 At one of the high schools, the IB DP is a districtwide magnet program; students from throughout the district apply before Grade 9 for a limited number of openings, and the program is highly selective. Since the application process is substantially different in the school with the IB magnet program, the responses to the survey questions about plans for enrollment in the IB DP from students attending the magnet IB high school were not included in the analysis. Tables 9 through 12 show responses from students in the three high schools with a local IB DP.
3High school IB DPs are open to students within the school (or consortium) who meet academic requirements and are interested in pursuing a rigorous pre-university course of study.
Table 8 Adjusted Mean Scores on Dimensions of Global-Mindedness Survey:
MYP and Non-MYP Students Matched on Demographic Characteristics Adjusted means
MYP effect Students previously
enrolled in MYP schools
Students previously enrolled in non-MYP
schools
Dimensiona Mean rating N
Mean rating N
Mean diff.
Std. error p
ES (d)
Responsibility1 3.12 175 3.04 175 .09 .04 .12 .17 Cultural Pluralism2 3.20 175 3.12 175 .08 .03 .05 .23 Efficacy3 2.87 175 2.90 175 .02 .04 .69 .04 Globalcentrism4 2.59 175 2.50 175 .08 .04 .12 .17 Interconnectedness5 2.97 175 2.89 175 .07 .03 .12 .16 a Dimension scores represent average of ratings on dimension items; scores ranged from 1 (i.e., responded Strongly Disagree on
all items in the dimension) to 4 (i.e., responded Strongly Agree on all items). Some items are reverse-scored. 1Levene’s Test for Responsibility, p = .04 2 Levene’s Test for Cultural Pluralism, p = .18 3Levene’s Test for Efficacy, p = .56 4Levene’s Test for Globalcentrism, p = .60 5Levene’s Test for Interconnectedness, p = .09
16 IB Middle Years Programme
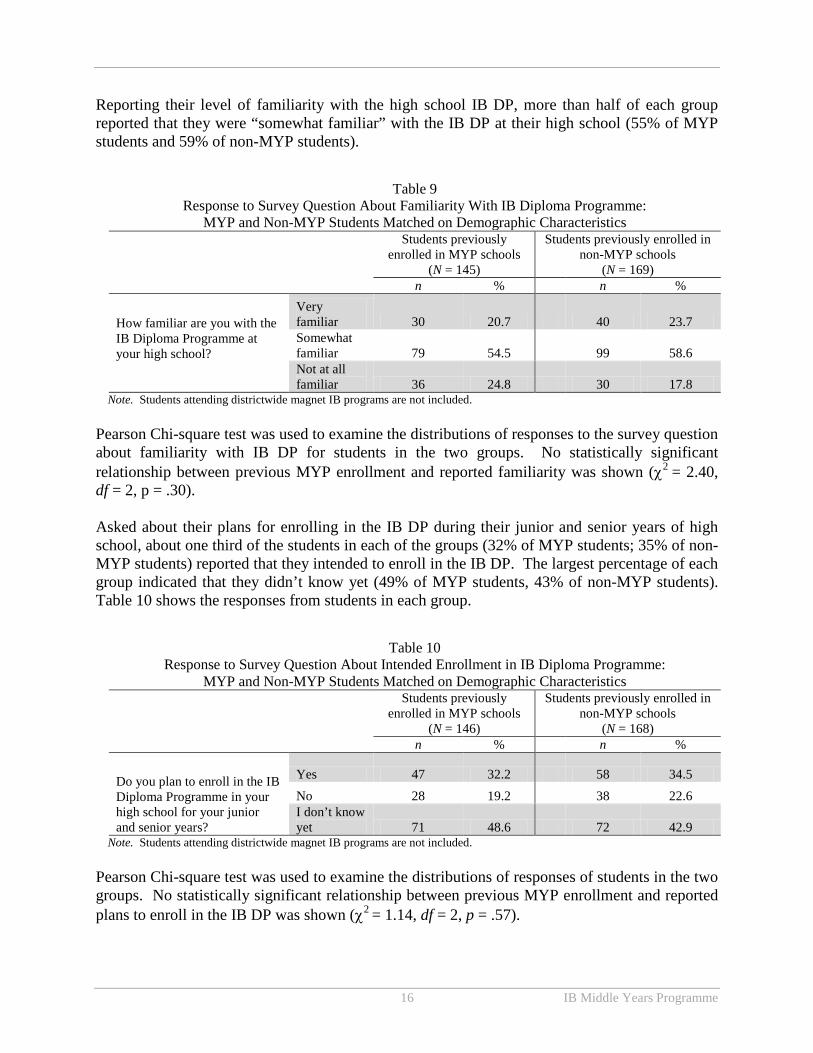
Reporting their level of familiarity with the high school IB DP, more than half of each group reported that they were “somewhat familiar” with the IB DP at their high school (55% of MYP students and 59% of non-MYP students).
Note. Students attending districtwide magnet IB programs are not included. Pearson Chi-square test was used to examine the distributions of responses to the survey question about familiarity with IB DP for students in the two groups. No statistically significant relationship between previous MYP enrollment and reported familiarity was shown (χ2 = 2.40, df = 2, p = .30). Asked about their plans for enrolling in the IB DP during their junior and senior years of high school, about one third of the students in each of the groups (32% of MYP students; 35% of non-MYP students) reported that they intended to enroll in the IB DP. The largest percentage of each group indicated that they didn’t know yet (49% of MYP students, 43% of non-MYP students). Table 10 shows the responses from students in each group.
Note. Students attending districtwide magnet IB programs are not included. Pearson Chi-square test was used to examine the distributions of responses of students in the two groups. No statistically significant relationship between previous MYP enrollment and reported plans to enroll in the IB DP was shown (χ2 = 1.14, df = 2, p = .57).
Table 9 Response to Survey Question About Familiarity With IB Diploma Programme:
MYP and Non-MYP Students Matched on Demographic Characteristics Students previously
enrolled in MYP schools (N = 145)
Students previously enrolled in non-MYP schools
(N = 169) n % n %
How familiar are you with the IB Diploma Programme at your high school?
Very familiar 30 20.7 40 23.7 Somewhat familiar 79 54.5 99 58.6 Not at all familiar 36 24.8 30 17.8
Table 10 Response to Survey Question About Intended Enrollment in IB Diploma Programme:
MYP and Non-MYP Students Matched on Demographic Characteristics Students previously
enrolled in MYP schools (N = 146)
Students previously enrolled in non-MYP schools
(N = 168) n % n %
Do you plan to enroll in the IB Diploma Programme in your high school for your junior and senior years?
Yes 47 32.2 58 34.5 No 28 19.2 38 22.6 I don’t know yet 71 48.6 72 42.9

17 IB Middle Years Programme
Students also were asked whether they were likely to take courses in the IB DP program; responses of students in the two groups are shown in Table 11. More than 80% of students in each of the groups indicated that they were somewhat or very likely to take courses in the IB DP.
Note. Students attending district-wide magnet IB programs are not included.
Pearson Chi-square test was used to examine the distributions of responses of students in the two groups. No statistically significant relationship between previous MYP enrollment and reported plans to take courses in the IB program was shown (χ2 = 2.10, df = 2, p = .35). Finally, students indicated reasons that they may enroll or take courses in the IB DP at their high school. The survey asked, “If you are interested, or think you might be interested, in enrolling or taking courses in the International Baccalaureate program at your high school in future years, please indicate whether the reasons listed below apply to you.” Students could choose all that applied. The percentage of students endorsing each of the reasons for enrolling in the IB DP that were offered on the survey are shown in Table 12 for each of the student groups. The largest percentage of students in both groups—those who previously attended an MYP middle school and those who attended a non-MYP middle school—indicated that IB DP enrollment or courses would help them get into college and prepare for college (nearly 70% or more of both groups on both questions). Over one half of the students in both the MYP and non-MYP groups indicated that the challenging courses in the IB DP would be a reason for enrolling in or taking courses. Among MYP students, fewer than 25% chose reasons related to others: 24% indicated, “My parents want me to complete an IB program;” 22% selected, “…community with my MYP classmates…;” 17% indicated, “My friends are planning to enroll in IB;” and 16% named a positive relationship with MYP teachers as a reason for enrolling in IB. Previous enrollment in MYP had a significant effect on selection of, “My parents want me to complete an IB program.” Students who had attended non-MYP schools were more likely to choose this as a reason for enrolling in the IB DP or taking courses (χ2 = 5.44, df = 1, p = .02).
Table 11 Response to Survey Question about Intended Enrollment in IB DP Courses:
MYP and Non-MYP Students Matched on Demographic Characteristics Students previously
enrolled in MYP schools (N = 143)
Students previously enrolled in non-MYP schools
(N = 163) n % n %
If you do not enroll in the IB Diploma Programme, how likely would you be to take IB courses?
Very likely 58 40.6 62 38.0 Somewhat likely 58 40.6 78 47.9 Not at all likely 27 18.9 23 14.1
18 IB Middle Years Programme
Note. Students attending districtwide magnet IB programs are not included.
3. Did planned high school course-taking differ between former MYP and non-MYP students? Students were asked about their plans for taking high school courses in science, social studies, and world languages. Table 13 shows the responses of students in the two groups. Plans for high school courses in science, social studies, and world languages of MYP students and non-MYP students were similar. In both groups the largest percentage of students reporting plans to take more than the recommended minimum number of courses was in world languages—64% of MYP students and 67% of non-MYP students indicated that they probably will take more than two years of world languages. About one half of the students in each group reported that they would like to take more than the required social studies courses (52% of MYP and 49% of non-MYP), and about a third of the students indicated that they would like to take more than the required science courses (34% of MYP and 37% of non-MYP).
Table 12 Response to Survey Question About Reasons for IB DP Enrollment or Courses:
MYP and Non-MYP Students Matched on Demographic Characteristics
If you are interested, or think you might be interested, in enrolling or taking courses in the IB program at your high school in future years, please indicate whether the reasons listed below apply to you:
Students previously enrolled in MYP
schools (N = 147)
Students previously enrolled in non-MYP
schools (N = 170)
% %
The IB will help me get into a better college. 72.8 72.4
The IB will prepare me for college. 69.4 74.1
The IB courses are challenging. 55.8 57.6
The IB will help me become proficient in a second language. 36.7 32.4
An IB diploma is important to me. 34.7 39.4
I like the selection of courses in IB. 30.6 27.1
My parents want me to complete an IB program. 23.8 35.9 I experienced a strong sense of community with my MYP classmates and want to continue that in high school. 21.8 na
My friends are planning to enroll in IB. 17.0 26.5 I experienced a positive relationship with MYP teachers and want to develop that with my high school teachers. 15.7 na
19 IB Middle Years Programme
aN = 173 for MYP schools and N = 174 for non-MYP schools. Pearson Chi-square tests were used to examine the distributions of students’ responses to each of the questions regarding course enrollment plans. No statistically significant relationship between previous MYP enrollment and reported course enrollment plans was shown (world languages: χ2 = 2.62, df = 3, p = .45; social studies: χ2 = 2.72, df = 2, p = .26; science: χ2 = .55, df = 2, p = .76). Thus, the survey responses from the two groups of students indicated that previous enrollment in MYP was not related to plans for high school course enrollment in science, social studies, and world languages.
4. Was there a relationship between measures of global mindedness and planned course-taking and IB enrollment? Students’ scores on the five dimensions of the Global-Mindedness Survey were examined in relation to their plans for high school courses and programs, including intention to enroll in the IB DP, plans to take IB courses, and plans to take more than the required number of courses in science, social studies, and world languages. For these analyses, plans for high school courses and the IB DP were scored dichotomously, so that “yes” or “probably will take” was scored as 1, while all other responses (i.e., “no,” “probably will not,” and “I don’t know yet”) were counted as 0. Partial correlations were used, controlling for demographic characteristics (using a propensity score calculated with race/ethnicity, gender, FARMS, ESOL, and special education). The partial correlations of the global-mindedness dimensions with the high school plans were analyzed for MYP students and separately for students who had attended a non-MYP middle school. Table 14 shows the partial correlations for the two groups of students.
Table 13 Response to Survey Question About Intended Enrollment in High School Courses:
MYP and Non-MYP Students Matched on Demographic Characteristics Students previously
enrolled in MYP schools
(N = 172)
Students previously enrolled in non-MYP
schools (N = 173)
n % n %
During high school, what are your plans for taking world language courses?
I probably will take more than two years of world language courses. 110 64.0 116 67.1
I probably will take two years of world language courses. 42 24.4 31 17.9
I probably will take less than two years of world language courses 5 2.9 6 3.5
I don’t know yet. 15 8.7 20 11.6 During high school, what are your plans for taking social studies courses?a
I probably will take more than just the required courses. 90 52.0 85 48.9
I probably will take just the courses required for graduation. 63 36.4 58 33.3
I don’t know yet. 20 11.6 31 17.8
During high school, what are your plans for taking science courses?
I probably will take more than just the required courses. 58 33.7 64 37.0
I probably will take just the courses required for graduation. 78 45.3 72 41.6
I don’t know yet. 36 20.9 37 21.4
20 IB Middle Years Programme
Correlations between global-mindedness dimension scores and plans for high school course and program enrollment revealed some significantly positive relationships for students who previously attended MYP schools as well as for students who previously attended non-MYP schools. In these analyses, global mindedness showed the strongest relationships with plans to enroll in the IB DP and plans to take IB courses; scores on Responsibility, Cultural Pluralism, and Interconnectivity showed the strongest relationships among the five global-mindedness dimensions. One dimension in each of the groups was significantly correlated with plans to take
Table 14 Correlations between Global-Mindedness Ratings and High School Plans: MYP and Non-MYP Students Matched on Demographic Characteristics
Correlations
Students previously enrolled in MYP schools
Students previously enrolled in non-MYP schools
Plans to enroll in IB DPa N = 140 N = 158 Responsibility .194 * .093 Cultural Pluralism .221 ** .167 * Efficacy .126 .070 Global Centrism -.113 -.083 Interconnectivity .228 ** .221 ** Plans to take IB coursesa N = 140 N = 158 Responsibility .281 ** .099 Cultural Pluralism .323 *** .146 Efficacy .093 .154 Global Centrism .008 .051 Interconnectivity .169 * .165* Plans to take more than the required science courses N = 168 N = 168 Responsibility .064 .147 Cultural Pluralism .177 * .114 Efficacy .068 .100 Global Centrism .105 .039 Interconnectivity .104 .176* Plans to take more than the required social studies courses N = 168 N = 168 Responsibility .030 .043 Cultural Pluralism .057 .124 Efficacy .045 .030 Global Centrism -.031 .085 Interconnectivity .028 .116 Plans to take more than the required world language courses N = 168 N = 168 Responsibility .131 .167 * Cultural Pluralism .257 * .207 ** Efficacy .092 .157 * Global Centrism .144 .102 Interconnectivity .080 .168 * a Students attending districtwide magnet IB program were not included in analysis. *p < .05; **p < .01; ***p < .001, two-tailed.
21 IB Middle Years Programme
more than the required science courses, and no dimensions were correlated with plans to take more social studies courses. Two or more dimensions were significantly correlated with plans to take more than the required world language courses. Using Cohen’s (1992) guidelines (see Appendix A), most of the significant correlations between global mindedness and high school plans would be interpreted as small but practically significant effect sizes (i.e., correlation coefficients between .10 and .30). Overall, the data showed an association between some dimensions of global mindedness and plans for enrollment or courses in IB and plans to take more than the required world language courses. The association of global mindedness, particularly Responsibility and Cultural Pluralism, with plans to take IB courses was stronger in students who had been enrolled in MYP middle schools.
5. Did involvement in Student Service Learning differ between former MYP and non-MYP students? Percentages of students in each of the two groups who reported participation in SSL and volunteer activities are shown in Table 15.
A larger percentage of students previously enrolled in MYP reported working on SSL projects in school and outside of school than their peers who were enrolled in non-MYP middle schools (school-organized project: MYP 52%, non-MYP 44%; SSL outside of school: MYP 60%, non-MYP 14%). Logistic regression analysis was used to test the relationship of previous MYP enrollment and participation in SSL and volunteer activities. The effect of MYP was statistically significant on involvement in SSL projects outside of school (Odds ratio = 1.74, p = .01, equivalent to Cohen’s d = .31, a small effect size). The percentage of students reporting involvement in other activities was similar between those who had attended MYP and non-MYP schools.
Table 15 Response to Survey Question About Participation in
Student Service Learning, Volunteer, and Extracurricular Activities: MYP and Non-MYP Students Matched on Demographic Characteristics
Have you participated in any of the following activities in middle school or during the current year? (Choose all that apply)
Students previously enrolled in MYP
schools (N = 175)
Students previously enrolled in
non-MYP schools (N = 175) Diff
in % n % n %
School-organized Student Service Learning project 91 52.0 77 44.0 8.0
Student Service Learning project outside of school (on my own or with family, friends, other groups) 105 60.0 81 46.3 13.7
Volunteered for an organization outside of school 79 45.1 76 43.4 1.7
Foreign language club 17 9.7 14 8.0 1.7
A club focused on another culture 14 8.0 16 9.1 -1.1
A club that supports a charity or nonprofit organization 38 21.7 27 15.4 6.3
22 IB Middle Years Programme
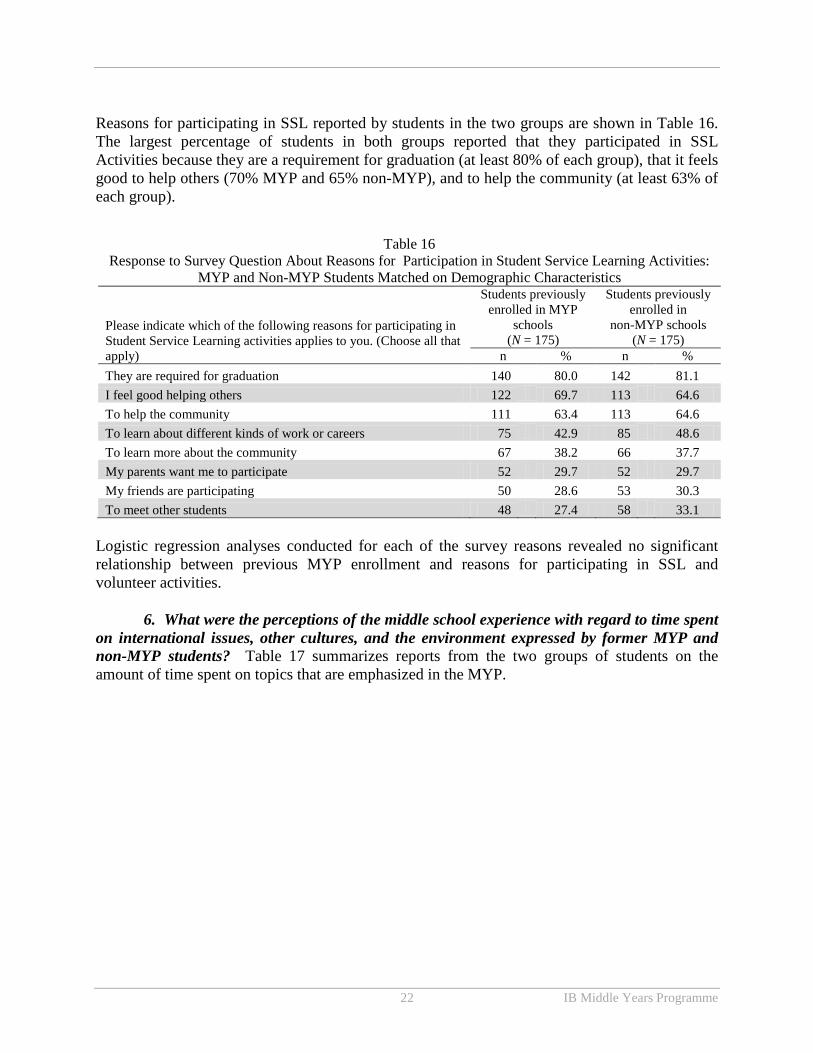
Reasons for participating in SSL reported by students in the two groups are shown in Table 16. The largest percentage of students in both groups reported that they participated in SSL Activities because they are a requirement for graduation (at least 80% of each group), that it feels good to help others (70% MYP and 65% non-MYP), and to help the community (at least 63% of each group).
Logistic regression analyses conducted for each of the survey reasons revealed no significant relationship between previous MYP enrollment and reasons for participating in SSL and volunteer activities.
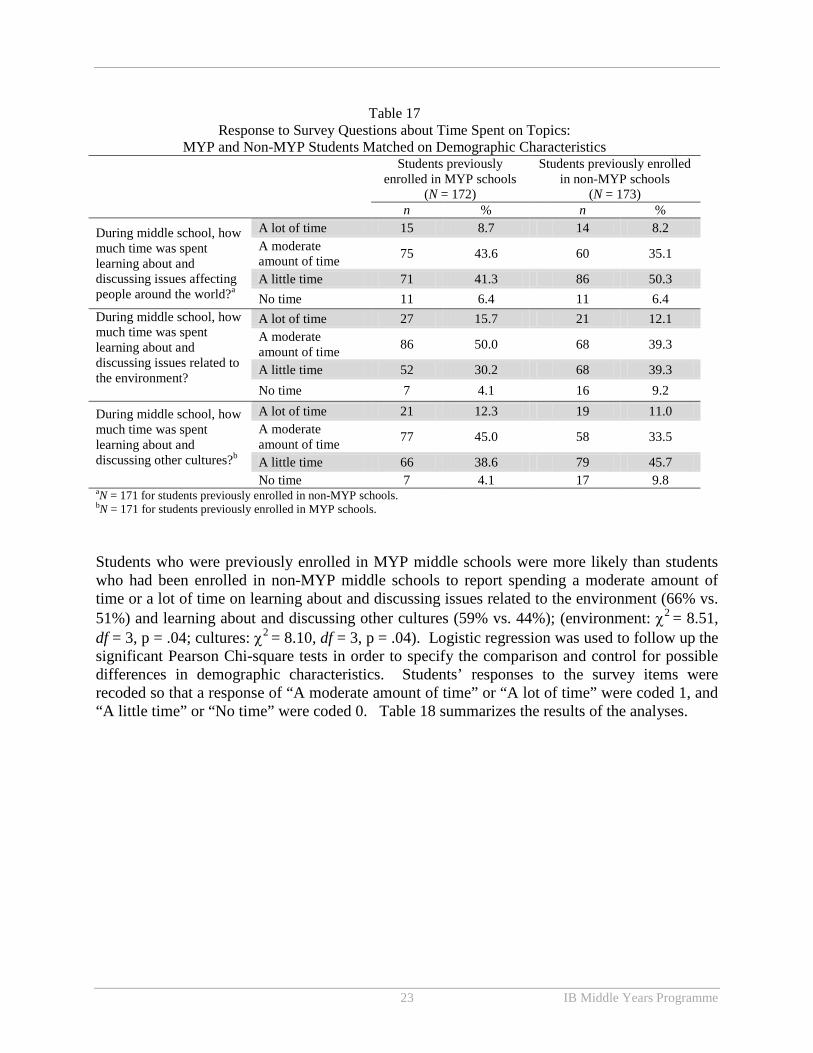
6. What were the perceptions of the middle school experience with regard to time spent on international issues, other cultures, and the environment expressed by former MYP and non-MYP students? Table 17 summarizes reports from the two groups of students on the amount of time spent on topics that are emphasized in the MYP.
Table 16 Response to Survey Question About Reasons for Participation in Student Service Learning Activities:
MYP and Non-MYP Students Matched on Demographic Characteristics
Please indicate which of the following reasons for participating in Student Service Learning activities applies to you. (Choose all that apply)
Students previously enrolled in MYP
schools (N = 175)
Students previously enrolled in
non-MYP schools (N = 175)
n % n % They are required for graduation 140 80.0 142 81.1 I feel good helping others 122 69.7 113 64.6 To help the community 111 63.4 113 64.6 To learn about different kinds of work or careers 75 42.9 85 48.6 To learn more about the community 67 38.2 66 37.7 My parents want me to participate 52 29.7 52 29.7 My friends are participating 50 28.6 53 30.3 To meet other students 48 27.4 58 33.1
23 IB Middle Years Programme
Students who were previously enrolled in MYP middle schools were more likely than students who had been enrolled in non-MYP middle schools to report spending a moderate amount of time or a lot of time on learning about and discussing issues related to the environment (66% vs. 51%) and learning about and discussing other cultures (59% vs. 44%); (environment: χ2 = 8.51, df = 3, p = .04; cultures: χ2 = 8.10, df = 3, p = .04). Logistic regression was used to follow up the significant Pearson Chi-square tests in order to specify the comparison and control for possible differences in demographic characteristics. Students’ responses to the survey items were recoded so that a response of “A moderate amount of time” or “A lot of time” were coded 1, and “A little time” or “No time” were coded 0. Table 18 summarizes the results of the analyses.
Table 17 Response to Survey Questions about Time Spent on Topics:
MYP and Non-MYP Students Matched on Demographic Characteristics Students previously
enrolled in MYP schools (N = 172)
Students previously enrolled in non-MYP schools
(N = 173) n % n %
During middle school, how much time was spent learning about and discussing issues affecting people around the world?a
A lot of time 15 8.7 14 8.2 A moderate amount of time 75 43.6 60 35.1
A little time 71 41.3 86 50.3 No time 11 6.4 11 6.4
During middle school, how much time was spent learning about and discussing issues related to the environment?
A lot of time 27 15.7 21 12.1 A moderate amount of time 86 50.0 68 39.3
A little time 52 30.2 68 39.3 No time 7 4.1 16 9.2
During middle school, how much time was spent learning about and discussing other cultures?b
A lot of time 21 12.3 19 11.0 A moderate amount of time 77 45.0 58 33.5
A little time 66 38.6 79 45.7 No time 7 4.1 17 9.8
aN = 171 for students previously enrolled in non-MYP schools. bN = 171 for students previously enrolled in MYP schools.
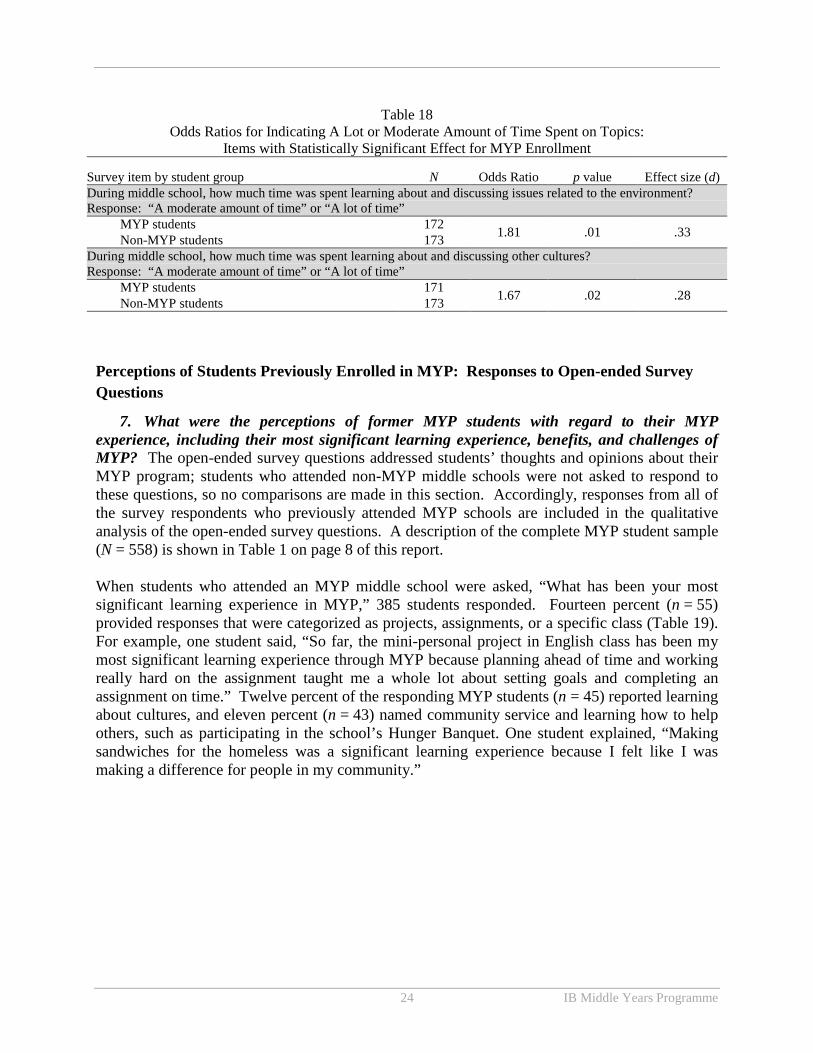
24 IB Middle Years Programme
Perceptions of Students Previously Enrolled in MYP: Responses to Open-ended Survey Questions
7. What were the perceptions of former MYP students with regard to their MYP experience, including their most significant learning experience, benefits, and challenges of MYP? The open-ended survey questions addressed students’ thoughts and opinions about their MYP program; students who attended non-MYP middle schools were not asked to respond to these questions, so no comparisons are made in this section. Accordingly, responses from all of the survey respondents who previously attended MYP schools are included in the qualitative analysis of the open-ended survey questions. A description of the complete MYP student sample (N = 558) is shown in Table 1 on page 8 of this report. When students who attended an MYP middle school were asked, “What has been your most significant learning experience in MYP,” 385 students responded. Fourteen percent (n = 55) provided responses that were categorized as projects, assignments, or a specific class (Table 19). For example, one student said, “So far, the mini-personal project in English class has been my most significant learning experience through MYP because planning ahead of time and working really hard on the assignment taught me a whole lot about setting goals and completing an assignment on time.” Twelve percent of the responding MYP students (n = 45) reported learning about cultures, and eleven percent (n = 43) named community service and learning how to help others, such as participating in the school’s Hunger Banquet. One student explained, “Making sandwiches for the homeless was a significant learning experience because I felt like I was making a difference for people in my community.”
Table 18 Odds Ratios for Indicating A Lot or Moderate Amount of Time Spent on Topics:
Items with Statistically Significant Effect for MYP Enrollment
Survey item by student group N Odds Ratio p value Effect size (d) During middle school, how much time was spent learning about and discussing issues related to the environment? Response: “A moderate amount of time” or “A lot of time” MYP students 172 1.81 .01 .33 Non-MYP students 173 During middle school, how much time was spent learning about and discussing other cultures? Response: “A moderate amount of time” or “A lot of time” MYP students 171 1.67 .02 .28 Non-MYP students 173

25 IB Middle Years Programme
Table 19 Most Significant Learning Experience in MYP: Most Frequent Responses (N = 385)
What has been your most significant learning experience in MYP? n % Projects/ assignments/ specific class 55 14.3 Culture 45 11.7 Doing community service/how to help others/Hunger banquet 43 11.2 Global thinking/understand world around us/know world problems/how interact 28 7.3 More organized/responsible/study skills/better student 19 4.9 Mock interview/8th grade interview 14 3.6 Environment 13 3.4 Everyone can make a difference/impact/working together 13 3.4 Character traits/learner profile characteristics 13 3.4 Challenging/rigorous classes 11 2.9 Outdoor education 11 2.9 Types of learners/thinkers 10 2.6 Language/language programs 10 2.6 Character building days/MYP kick off day/trips 10 2.6 Nothing 30 7.8 Don’t know/don’t remember/don't think they did MYP 52 13.5 Other responses by fewer than 10 students 59 15.3 Note. Respondents’ answers could include more than one category, so percentages add to more than 100.
Students from MYP middle schools also were asked, “What are the benefits of being an MYP student?” The number of students who responded to this open-ended question was 403. The largest percentage of respondents (17%, n = 68) reported having a better understanding of the world. For example, one student stated, “You not only learn about problems in your own country but other countries too, and you get to discuss more international topics.” Learning something new and participating in projects was reported by 15% of students (n = 59), 13% (n = 52) said that MYP is more rigorous and challenging, and another 13% of respondents (n = 52) named learning about other cultures. Table 20 summarizes the responses to this open-ended question about the benefits of being an MYP student.
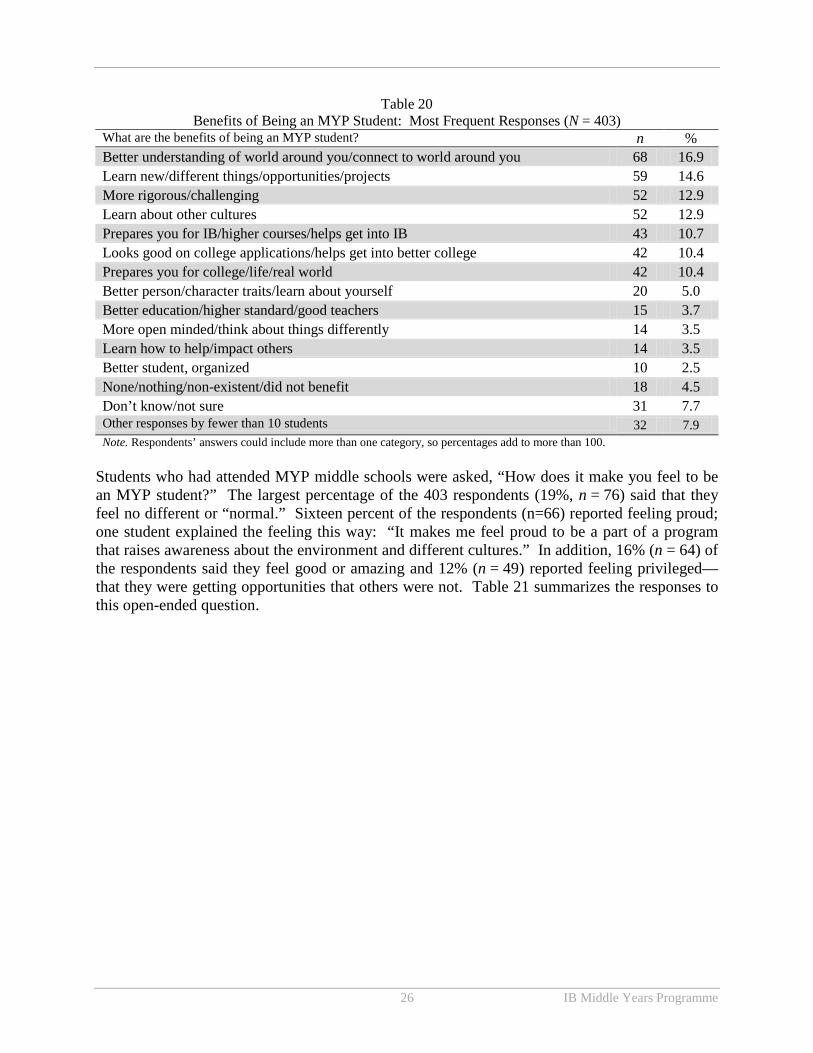
26 IB Middle Years Programme
Table 20 Benefits of Being an MYP Student: Most Frequent Responses (N = 403)
What are the benefits of being an MYP student? n % Better understanding of world around you/connect to world around you 68 16.9 Learn new/different things/opportunities/projects 59 14.6 More rigorous/challenging 52 12.9 Learn about other cultures 52 12.9 Prepares you for IB/higher courses/helps get into IB 43 10.7 Looks good on college applications/helps get into better college 42 10.4 Prepares you for college/life/real world 42 10.4 Better person/character traits/learn about yourself 20 5.0 Better education/higher standard/good teachers 15 3.7 More open minded/think about things differently 14 3.5 Learn how to help/impact others 14 3.5 Better student, organized 10 2.5 None/nothing/non-existent/did not benefit 18 4.5 Don’t know/not sure 31 7.7 Other responses by fewer than 10 students 32 7.9 Note. Respondents’ answers could include more than one category, so percentages add to more than 100.
Students who had attended MYP middle schools were asked, “How does it make you feel to be an MYP student?” The largest percentage of the 403 respondents (19%, n = 76) said that they feel no different or “normal.” Sixteen percent of the respondents (n=66) reported feeling proud; one student explained the feeling this way: “It makes me feel proud to be a part of a program that raises awareness about the environment and different cultures.” In addition, 16% (n = 64) of the respondents said they feel good or amazing and 12% (n = 49) reported feeling privileged—that they were getting opportunities that others were not. Table 21 summarizes the responses to this open-ended question.
27 IB Middle Years Programme
Table 21 How it Feels Being an MYP Student: Most Frequent Responses (N = 403)
How does it make you feel to be an MYP student? n % No different/normal 76 18.9 Proud/accomplished/successful 66 16.4 Good/great/amazing/happy 64 15.9 Privileged/special/important/have opportunities that others don't have/advantage/learning more than others 49 12.2 Smart/intelligent/well-educated/well-rounded /like a "good student"/makes me better/get more out of classes 30 7.4 Challenged 23 5.7 Prepared for: the future/College/IB 19 4.7 Good to learn about other cultures/feel diverse 19 4.7 Good to help my community/make a difference in world, community/helping others/responsible 18 4.5 Good to know what's going on in the world/knowledgeable 15 3.7 Fine/okay 14 3.5 Makes me feel interconnected/part of something bigger 12 3.0 Too much work/have to work harder to maintain grades 10 2.5 Other responses by fewer than 10 students 48 11.9 Note. Respondents’ answers could include more than one category, so percentages add to more than 100.
Finally, students who had attended MYP middle schools were asked about the challenges of being an MYP student, and 382 students responded to the open-ended question. One fourth of the respondents (n = 95, 25%) reported that they did not have any challenges being an MYP student. The most frequently reported challenge to being an MYP student was that the work is harder (21%, n = 81); one student described it this way: “The expectations are higher as an MYP student, and the classes move faster.” Another student had a similar perception, saying, “The courses and classes are a bit more challenging and at a faster pace than other classes.” Other challenges named by 10% or more of the respondents were: more coursework and assignments (12%, n = 46) and projects (10%, n = 38). Students’ responses to this open-ended question are summarized in Table 22.
28 IB Middle Years Programme
Table 22 Challenges of Being an MYP Student: Most Frequent Responses (N = 382)
What challenges have you experienced as an MYP student? n % Not challenging/no challenges/none 95 24.9 Harder work/faster pace/specific subject listed as hard to understand/work harder to get good grades/work independently/adjusting to HS at same time 81 21.2
More course work/more work/more assignments 46 12.0 The projects/mini projects/some projects hard to understand directions 38 9.9 Managing work from all the classes/not enough time to complete assignments/having to stay up late to finish all work/turning in on time/tests + projects due at same time 22 5.8
Learning about cultures/other ways of life/international point of view/insight to world events 17 4.5 Managing time with extracurricular activities/no time for other stuff 16 4.2 Areas of interaction 12 3.1 Fitting in SSL hours/community service 11 2.9 Connecting/relating/having background knowledge 10 2.6 Understanding MYP/understanding of reasons for MYP tasks 10 2.6 Thinking outside the box/in new ways/critical thinking/different style of learning 10 2.6 Don't know/don't remember/think they’ve never been MYP/na 23 6.0 Other responses by fewer than 10 students 31 8.1 Note: Respondents’ answers could include more than one category, so percentages add to more than 100.
Discussion Overall, previous enrollment in MYP had a positive effect on measures of global mindedness; students who had previously been enrolled in an MYP middle school showed higher levels of global mindedness on six of thirty survey statements and on the broad dimension of Cultural Pluralism. Consistent with this finding, the most frequent comments from former MYP students responding to open-ended survey questions were that culture (12%) and global thinking (7%) were the most significant learning experience in MYP, and feeling connected to the world around us (17%) and learning about other cultures (13%) were benefits of involvement in MYP. Previous enrollment in MYP was not related to plans for high school courses or intended IB DP enrollment. Within the two student groups (students from MYP schools and non-MYP schools), however, plans for high school courses, especially the IB DP and IB courses, as well as plans for taking more than the required world language courses, showed a statistically significant association with several of the survey dimensions of global mindedness. Specifically, the Responsibility, Cultural Pluralism, and Interconnectedness dimensions were related to plans for the IB DP and plans for world language courses in both groups of students. Thus, it appears that global mindedness is related to some of the course and program choices students make in high school. Students who previously attended an MYP school were more likely to report involvement in SSL activities outside of school, although reasons for participating in SSL or volunteer activities were similar for MYP and non-MYP students. Previous MYP enrollment was related to the amount of time students reported they spent in middle school on issues related to the environment and on learning about and discussing other cultures. Thus, the findings suggest that there are differences
29 IB Middle Years Programme
in the MYP and non-MYP experiences that are recognized by the students. Indeed, former MYP students responding to open-ended survey questions named learning about other cultures and understanding the world around us, as well as the environment, as among the most significant learning experiences in MYP.
Recommendations and Next Steps
The following recommendations are suggested by the findings: • Examine SSL hours for students with MYP and non-MYP middle school experience. Prior
MYP enrollment had a positive effect on students’ reported out-of-school SSL activities. To substantiate and better understand this effect, it may be useful to analyze the SSL records of students in the original two study groups as they progress through high school to learn whether the reported advantage is lasting, and what kinds of SSL activities are pursued by the MYP students.
• Examine future high school course enrollment of survey respondents to determine whether a relationship between global mindedness and actual course enrollment is demonstrated, given the observed relationship between some dimensions of global mindedness and course plans.
• Examine actual IB DP enrollment by a larger group of MYP and non-MYP students. Although previous MYP enrollment was not related to reported plans for IB DP enrollment among the students in this study, analysis of the IB DP enrollment of a larger group of students in more high schools may help build an understanding of the relationship between MYP and IB DP enrollment.
• Work with counselors and MYP coordinators to ensure that a process is in place to identify students who are struggling with the demands of MYP and to provide the needed support. About one half of the MYP students who responded to the survey named managing the coursework and related issues as a challenge of MYP.
30 IB Middle Years Programme
References
American Psychological Association. (2010). Publication manual of the American Psychological Association (6th ed.). Washington, DC: Author.
Bunnell, T. (2011). The International Baccalaureate Middle Years Programme after 30 years:
A critical inquiry. Journal of Research in International Education, 10(3), 261–274. Caffyn, R., and Cambridge, J. (2005). From Middle Years Programme to Diploma Programme:
A critical response to Candice Reimers. IB Research Notes, 5(2), 2–9. Cohen, J. (1988). Statistical power for the behavioral sciences (2nd ed.). Hillsdale, NJ:
Erlbaum. Cohen, J. (1992). A power primer. Psychological Bulletin, 112(1), 155–159. Hett, E.J. (1993). The development of an instrument to measure global mindedness. Doctoral
dissertation, University of San Diego, 1993. International Baccalaureate. (2008). A review of research relating to the IB Diploma
Programme. Retrieved 1 February 2011, from http://ibo.org/research/resources/documents/dpresearchreview.pdf.
International Baccalaureate. (2012a). The Middle Years Programme. Retrieved 1 September
2012, from http://www.ibo.org/programmes/index.cfm. International Baccalaureate. (2012b) Mission and strategy. Retrieved 1 September, 2012, from
http://www.ibo.org/mission. Kiplinger, V.L. (2005a). Effects of IB Participation on Mathematics Achievement and Growth,
2001–2004 in Academy School District Twenty. Unpublished report. Kiplinger, VL. (2005b). Effects of IB Participation on Reading Achievement and Growth, 2000–
2004 in Academy School District Twenty. Unpublished report. Kline, R.B. (2004). Beyond significance testing: Reforming data analysis methods in
behavioral research. Washington, DC: American Psychological Association. Reimers, C. (2004). From MYP to Diploma: An investigation into the impact of the
International Baccalaureate Middle Years Programme on International Baccalaureate Diploma candidates. International Schools Journal, 24(2), 11–18.
Rosenbaum, P. R., & Rubin, D. B. (1983). The central role of the propensity score in
observational studies for causal effects. Biometrika, 70, 41–45.
31 IB Middle Years Programme
Rosenbaum, P.R. & Rubin, D.B. (1984). Reducing bias in observational studies using subclassification on the propensity score. Journal of the American Statistical Association, 79, 561–524.
Rosenbaum, P.R. & Rubin, D.B. (1985). Constructing a control group using multivariate
matched sampling that incorporates the propensity score. The American Statistician, 39, 33–38.
Sperandio, J. (2010). School program selection: Why schools worldwide choose the
International Baccalaureate Middle Years Program. Journal of School Choice, 4(2), 137–148.
Tan, L and Bibby, Y. 2012. Performance Comparison between IB School Students and Non-IB
School Students on the International Schools’ Assessment (ISA) and on the Social and Emotional Wellbeing Questionnaire. Melbourne: Australian Council for Educational Research.
Wade, Julie. (2011). Student Performance and Student Engagement in the International
Baccalaureate Middle Years Programme. Bethesda, MD: International Baccalaureate Organization.
Walker, G. (2005). Research and the IBO strategic plan. (Text of a speech given as the
introduction to a seminar at the International Baccalaureate Research Unit, May 13, 2005.) IB Research Notes, 5(2), 11–13.
Yazzie-Mintz, E. (2010). Charting the path from engagement to achievement: A report on the
2009 High School Survey of Student Engagement. Bloomington, IN: Center for Evaluation & Education Policy.
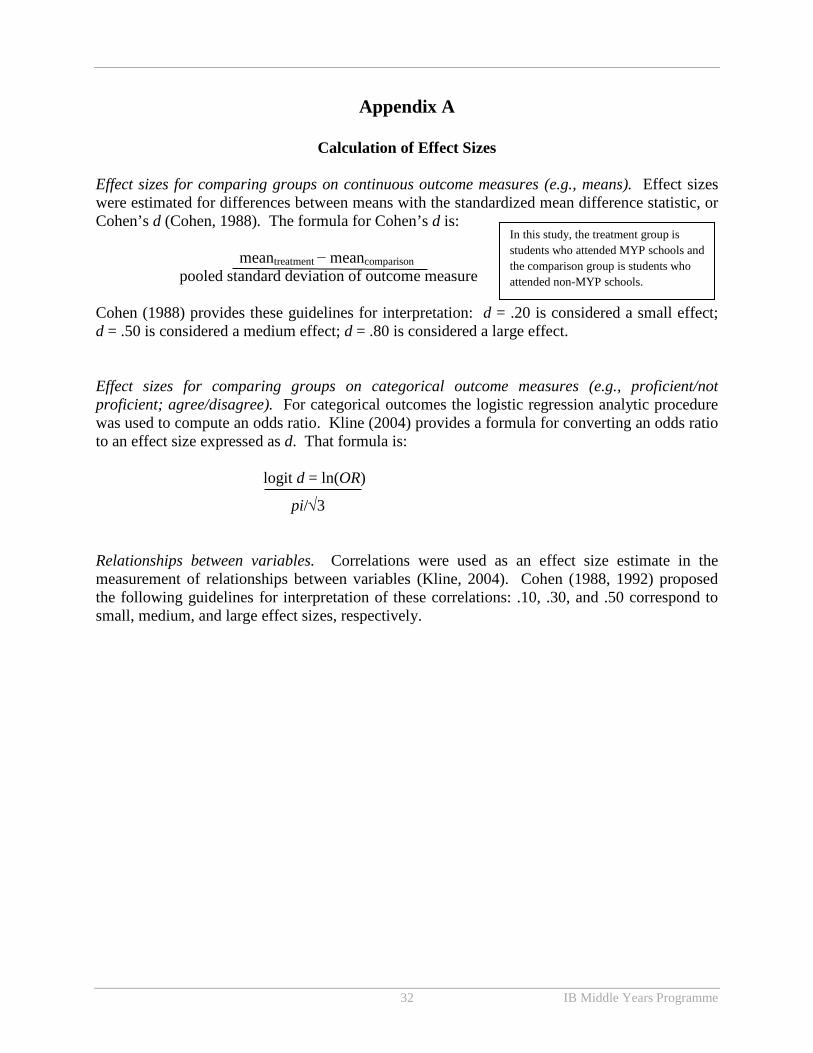
32 IB Middle Years Programme
Appendix A
Calculation of Effect Sizes Effect sizes for comparing groups on continuous outcome measures (e.g., means). Effect sizes were estimated for differences between means with the standardized mean difference statistic, or Cohen’s d (Cohen, 1988). The formula for Cohen’s d is:
meantreatment − meancomparison pooled standard deviation of outcome measure
Cohen (1988) provides these guidelines for interpretation: d = .20 is considered a small effect; d = .50 is considered a medium effect; d = .80 is considered a large effect. Effect sizes for comparing groups on categorical outcome measures (e.g., proficient/not proficient; agree/disagree). For categorical outcomes the logistic regression analytic procedure was used to compute an odds ratio. Kline (2004) provides a formula for converting an odds ratio to an effect size expressed as d. That formula is:
logit d = ln(OR)
pi/√3 Relationships between variables. Correlations were used as an effect size estimate in the measurement of relationships between variables (Kline, 2004). Cohen (1988, 1992) proposed the following guidelines for interpretation of these correlations: .10, .30, and .50 correspond to small, medium, and large effect sizes, respectively.
In this study, the treatment group is students who attended MYP schools and the comparison group is students who attended non-MYP schools.