global land use: how sdgs on sustainable resource...
TRANSCRIPT
Global Land Use: How SDGs on sustainable
resource management could work
Stefan Bringezu
Director
Material Flows and Resource
Management
Wuppertal Institute
Professor
for Sustainable Resource Management
Co-chair WG Land&Soil of the
International Resource Panel
Presentation at the at the Green Week 2014 conference in the session "The international dimension: resource efficiency in the Sustainable Development Goals“
4 June 2014
Brussels

Possible Goal
Efficient use of natural resources in an equitable and environmentally benign
manner for human well-being in current and future generations.
Suggestions for SDGs
- based on a think piece of the International Resource Panel
June 2014 S. BRINGEZU 2
Possible Indicators
the Four Footprints and relations to GDP
Possible Targets
Double the rate of yearly productivity increase
Keep resource consumption within Safe Operating Space
• Materials
• Land
• Water
• GHG emissions

Global trends
Dynamics of land use change
Major types and trends of global land use and land cover (Mha)
Source: Bringezu and Bleischwitz 2009
• Around 15 billion ha of land
worldwide
• Around 30 % used for agriculture
• Built-up land expands (often at
the expense of agriculture)
• Agriculture expands at the
expense of forests and
savannahs, especially in the
tropics
• Around 13 Mha of forests per
year were lost over the last 5
decades
June 2014 S. BRINGEZU 3
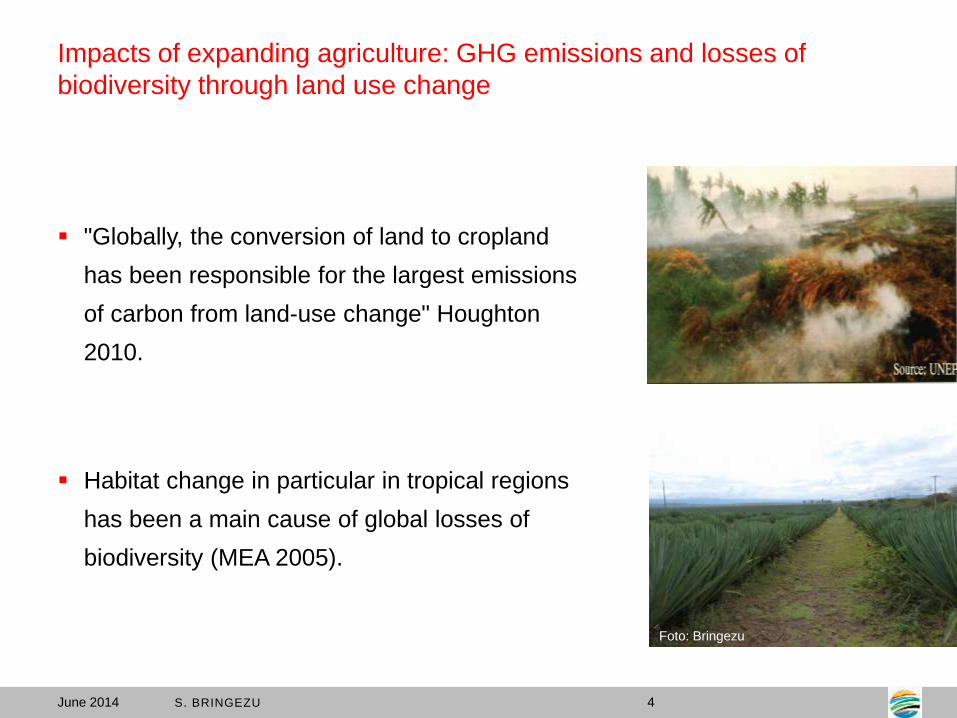
Impacts of expanding agriculture: GHG emissions and losses of
biodiversity through land use change
June 2014 S. BRINGEZU 4
"Globally, the conversion of land to cropland
has been responsible for the largest emissions
of carbon from land-use change" Houghton
2010.
Foto: Bringezu
Habitat change in particular in tropical regions
has been a main cause of global losses of
biodiversity (MEA 2005).
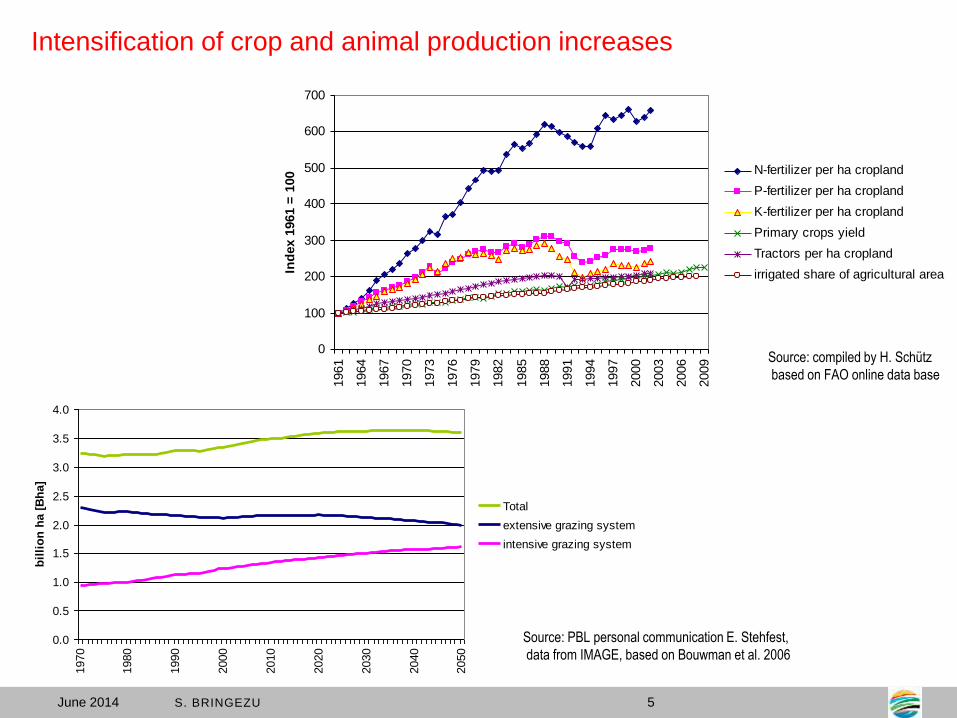
Intensification of crop and animal production increases
0
100
200
300
400
500
600
700
1961
1964
1967
1970
1973
1976
1979
1982
1985
1988
1991
1994
1997
2000
2003
2006
2009
Ind
ex 1
961 =
100 N-fertilizer per ha cropland
P-fertilizer per ha cropland
K-fertilizer per ha cropland
Primary crops yield
Tractors per ha cropland
irrigated share of agricultural area
0.0
0.5
1.0
1.5
2.0
2.5
3.0
3.5
4.0
1970
1980
1990
2000
2010
2020
2030
2040
2050
bil
lio
n h
a [
Bh
a]
Total
extensive grazing system
intensive grazing system
June 2014 S. BRINGEZU 5
Source: PBL personal communication E. Stehfest,
data from IMAGE, based on Bouwman et al. 2006
Source: compiled by H. Schütz
based on FAO online data base
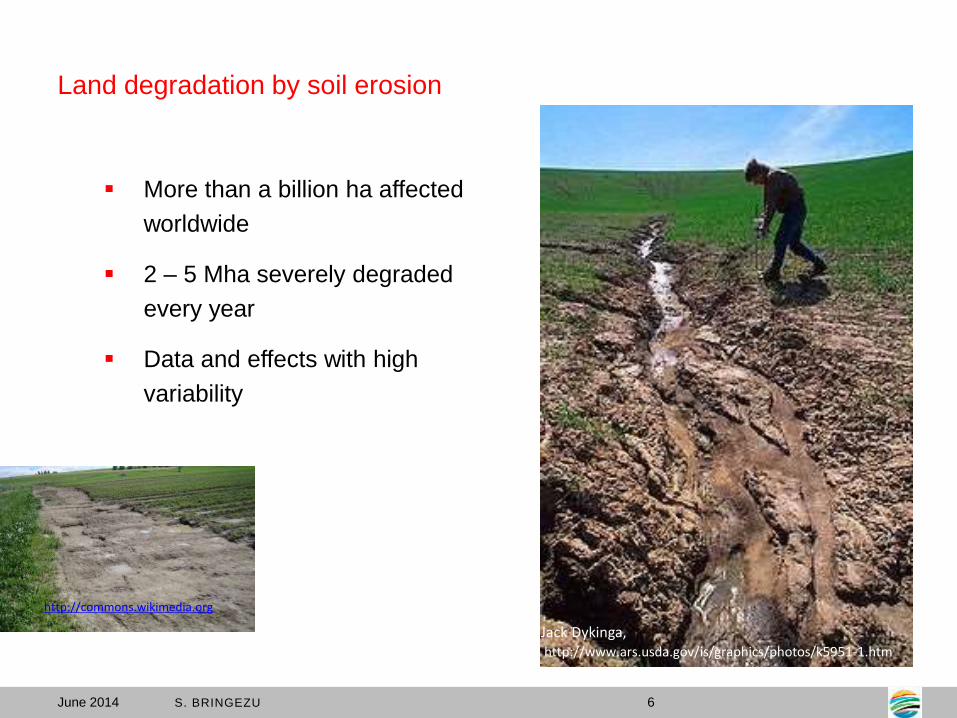
More than a billion ha affected
worldwide
2 – 5 Mha severely degraded
every year
Data and effects with high
variability
Land degradation by soil erosion
http://commons.wikimedia.org
Jack Dykinga, http://www.ars.usda.gov/is/graphics/photos/k5951-1.htm
June 2014 S. BRINGEZU 6
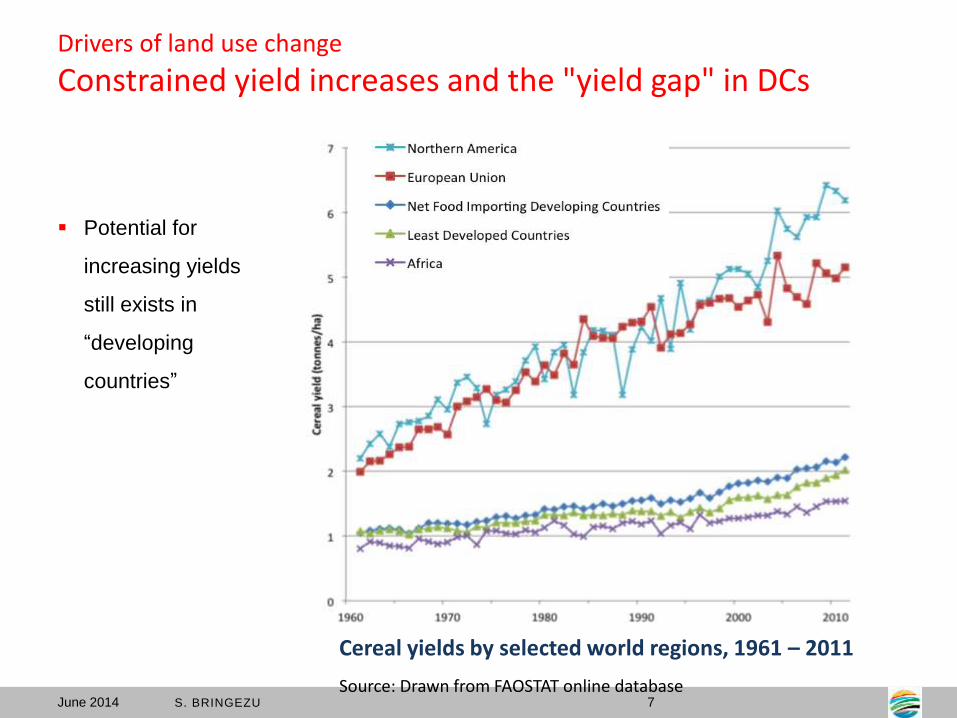
Potential for
increasing yields
still exists in
“developing
countries”
Cereal yields by selected world regions, 1961 – 2011
Source: Drawn from FAOSTAT online database
Drivers of land use change
Constrained yield increases and the "yield gap" in DCs
June 2014 S. BRINGEZU 7
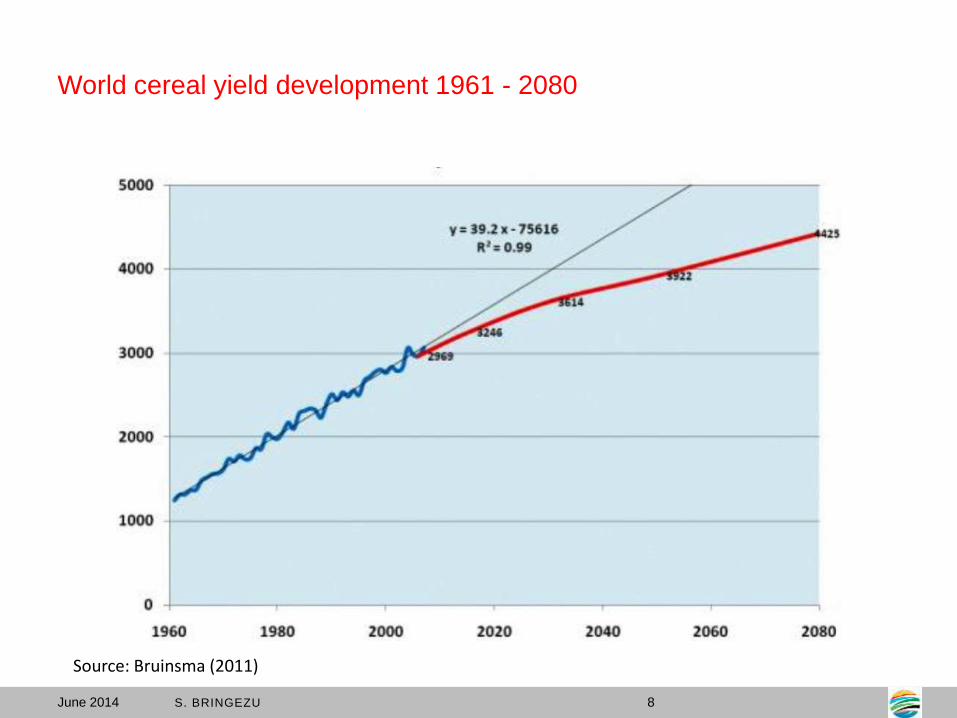
World cereal yield development 1961 - 2080
June 2014 S. BRINGEZU 8
Source: Bruinsma (2011)

Diets are converging: DCs are going to get more protein rich meals
Source: Wirsenius et al. 2010
June 2014 S. BRINGEZU 9
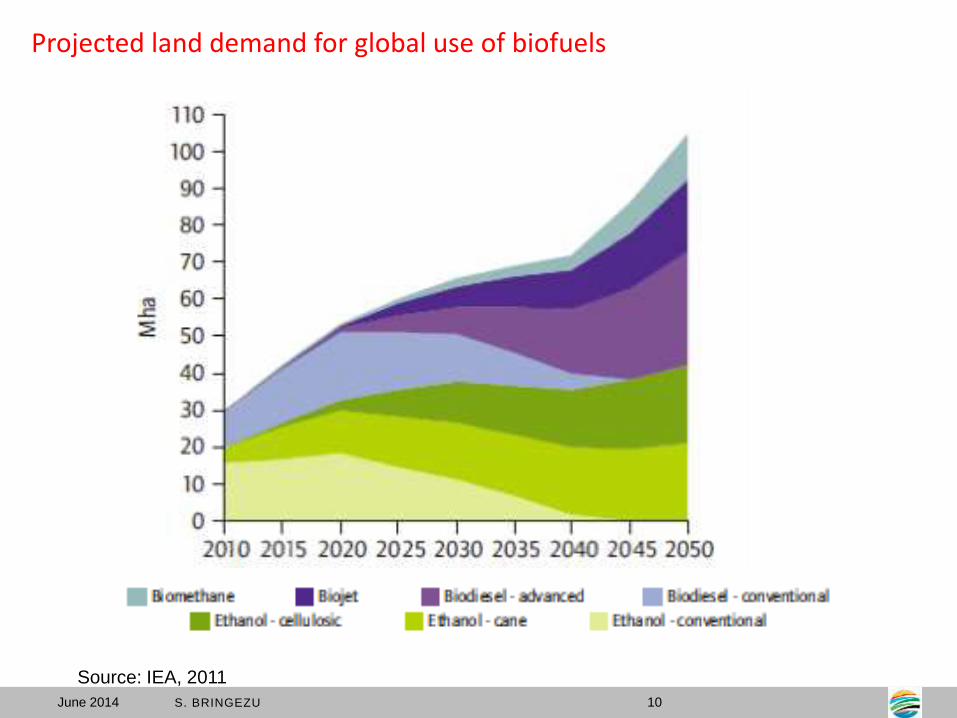
Projected land demand for global use of biofuels
Source: IEA, 2011
June 2014 S. BRINGEZU 10

Global land use change
June 2014 S. BRINGEZU 11
Net expansion is a
result of rising demand
for food and non-food
biomass which cannot
be compensated by
higher yields
Gross expansion
includes also the shift of
cropland to other areas
due to losses by severe
degradation and built-
up land
Net and gross expansion of cropland
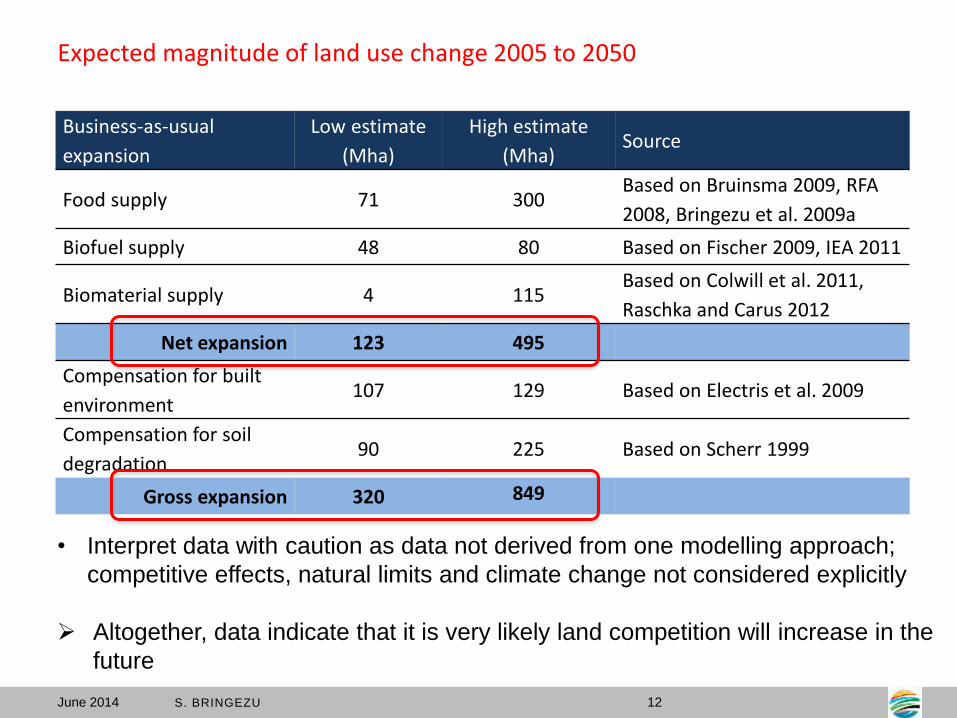
Expected magnitude of land use change 2005 to 2050
Business-as-usual
expansion
Low estimate
(Mha)
High estimate
(Mha) Source
Food supply 71 300 Based on Bruinsma 2009, RFA
2008, Bringezu et al. 2009a
Biofuel supply 48 80 Based on Fischer 2009, IEA 2011
Biomaterial supply 4 115 Based on Colwill et al. 2011,
Raschka and Carus 2012
Net expansion 123 495
Compensation for built
environment 107 129 Based on Electris et al. 2009
Compensation for soil
degradation 90 225 Based on Scherr 1999
Gross expansion 320 849
• Interpret data with caution as data not derived from one modelling approach;
competitive effects, natural limits and climate change not considered explicitly
Altogether, data indicate that it is very likely land competition will increase in the
future
June 2014 S. BRINGEZU 12

How far can we safely expand global cropland?
Approaching the Safe Operating Space
How much more land use change can occur
before the risk of irreversible damages
becomes unacceptable?
In particular regarding biodiversity loss
Agricultural expansion is a key cause of
global biodiversity loss
The Convention on Biological Diversity:
there is a high risk of dramatic
biodiversity loss if ecosystems are pushed
beyond tipping points and the loss should
be halted
Modeling results show that to halt biodiversity
loss agricultural land needs to, at least,
stabilize from 2020 (van Vuuren and Faber
2009)
June 2014 S. BRINGEZU 14
Estimate of quantitative evolution of control variables for seven planetary boundaries from pre-industrial level to the present
Source: Rockström et al. 2009
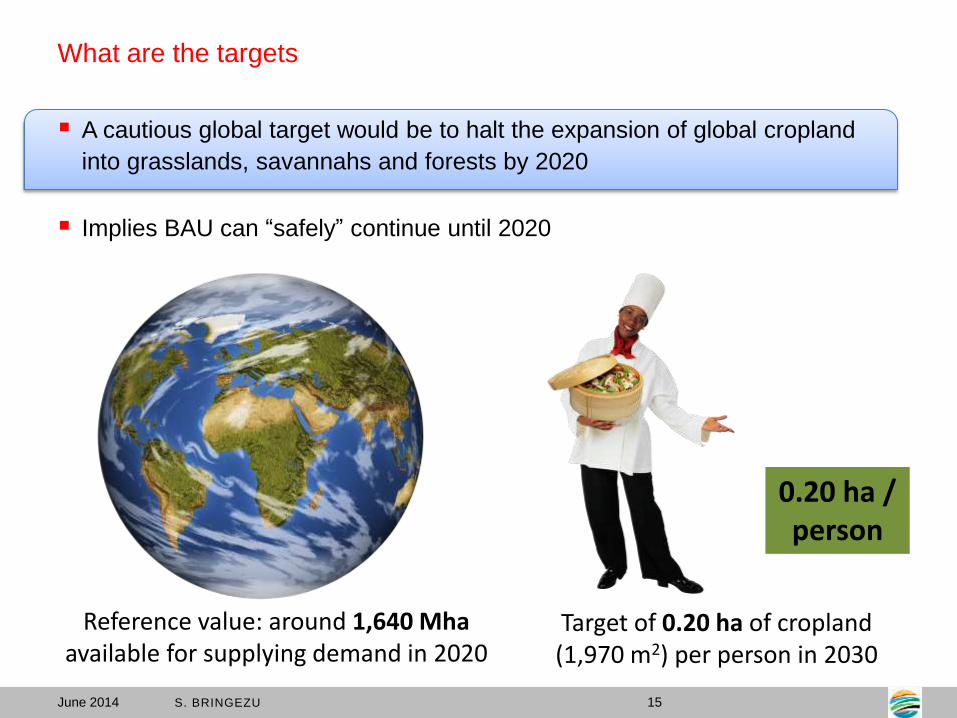
What are the targets
A cautious global target would be to halt the expansion of global cropland
into grasslands, savannahs and forests by 2020
Implies BAU can “safely” continue until 2020
June 2014 S. BRINGEZU 15
Reference value: around 1,640 Mha available for supplying demand in 2020
0.20 ha / person
Target of 0.20 ha of cropland (1,970 m2) per person in 2030

Are we on the right track?
Historical trend of global cropland
12% net expansion since 1960
1200
1400
1600
1800
2000
2200
2400
2600
1960 1970 1980 1990 2000 2010 2020 2030 2040 2050
Mha
Historical Trend
Historical expansion of global cropland
June 2014 S. BRINGEZU 16
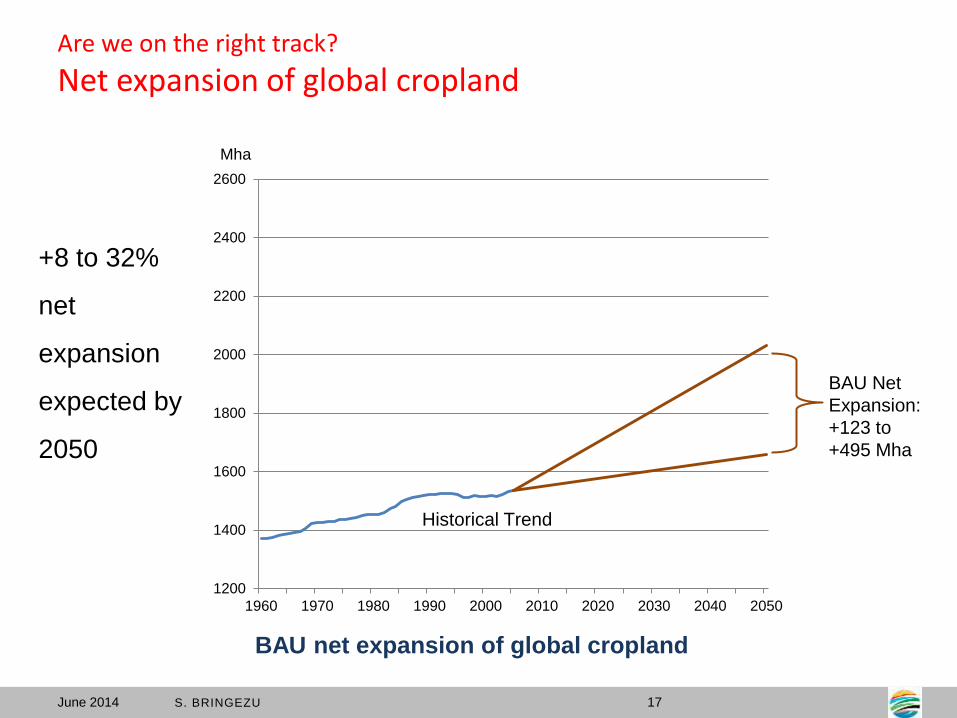
+8 to 32%
net
expansion
expected by
2050
1200
1400
1600
1800
2000
2200
2400
2600
1960 1970 1980 1990 2000 2010 2020 2030 2040 2050
BAU Net
Expansion:
+123 to
+495 Mha
Mha
Historical Trend
Are we on the right track?
Net expansion of global cropland
BAU net expansion of global cropland
June 2014 S. BRINGEZU 17

1200
1400
1600
1800
2000
2200
2400
2600
1960 1970 1980 1990 2000 2010 2020 2030 2040 2050
BAU Gross
Expansion:
+ 320 to
+849 Mha
Mha
Historical Trend
+21 to
55% gross
expansion
expected
by 2050
Are we on the right track?
Gross expansion of global cropland
BAU Gross expansion of global cropland
June 2014 S. BRINGEZU 18
1200
1400
1600
1800
2000
2200
2400
2600
1960 1970 1980 1990 2000 2010 2020 2030 2040 2050
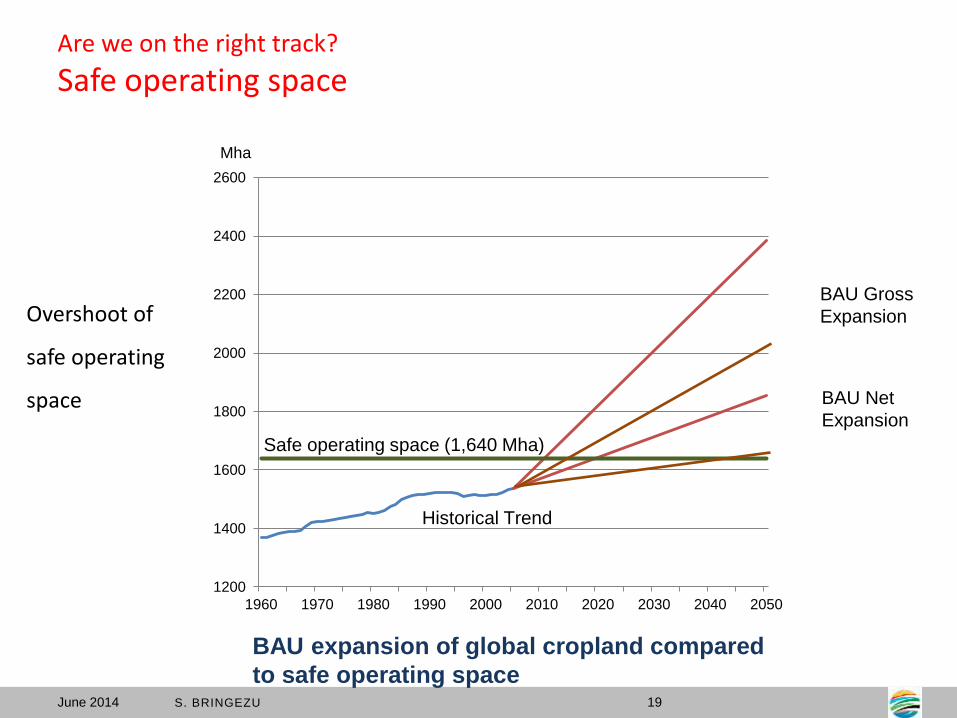
BAU Gross
Expansion
Safe operating space (1,640 Mha)
Mha
Historical Trend
BAU Net
Expansion
Overshoot of
safe operating
space
Are we on the right track?
Safe operating space
BAU expansion of global cropland compared
to safe operating space June 2014 S. BRINGEZU 19
Two major complementary strategies should be pursued in
parallel:
1. improve local management of each square
meter, including decisions on its optimal use
(land potential capacity)
and
2. keep national production and consumption within
the limits of a safe operating space (control the
number of square meters used)
WAYS FORWARD
June 2014 S. BRINGEZU 21

Improving agricultural production
Improve agricultural production
through application of best
management practices (BMPs)
Base BMPS on scientific principles that
are universal, but adapt them to the
local context
Integrate scientific and local
knowledge
Large opportunity for improvement
across all types of land management
systems
Involvement of farmers and other
stakeholders in research and
dissemination of BMPs is crucial
Productivity
Profitability
Durability
Healthy environment
CROPPING SYSTEM OBJECTIVES
Net profit
Resource use efficiencies:
Energy, Labor, Nutrient, Water
Return on investment
Yield stability
Water & air quality
Farm income
Working conditions
Nutrient balance Nutrient loss
Yield
Quality
Biodiversity
Ecosystems services
Adoption
Soil erosion
4R Nutrient Stewardship
Affordable & accessible food
Soil productivity
The 4R Nutrient Stewardship
Source: IPNI 2010
Fertilizer use BMPs—applying the right nutrient source at the right rate, time, and place
June 2014 S. BRINGEZU 22
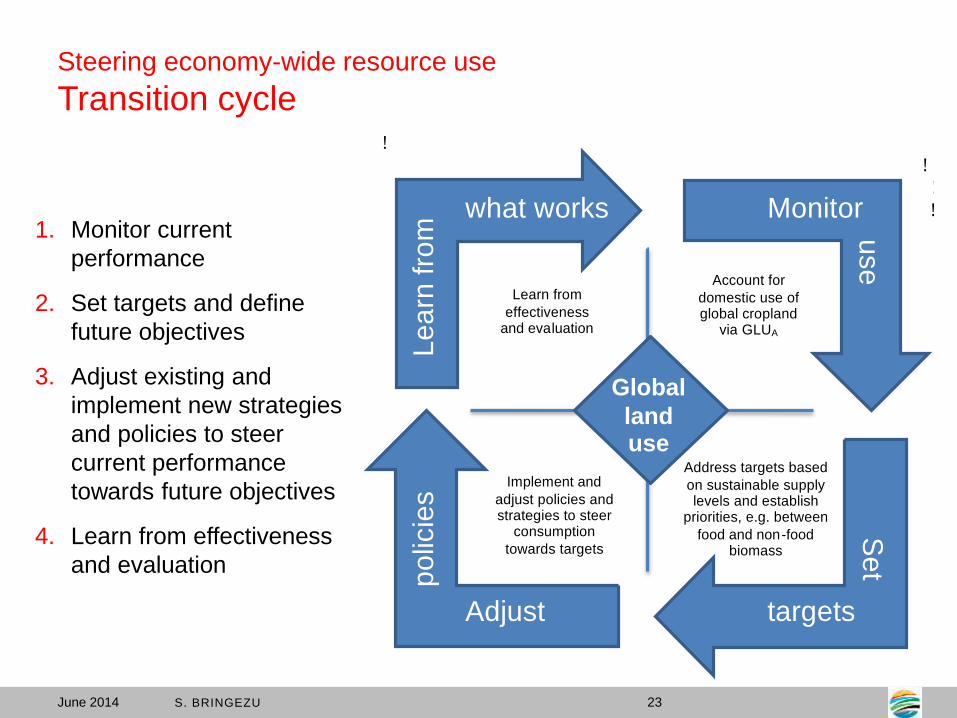
Steering economy-wide resource use
Transition cycle !!
!!!
Global
land use
Address targets based
on sustainable supply levels and establish
priorities, e.g. between
food and non-food biomass
Account for
domestic use of global cropland
via GLUA
Learn from
effectiveness and evaluation
Implement and
adjust policies and strategies to steer
consumption
towards targets
Monitor
use
S
et
targets Adjust
what works
po
licie
s
Le
arn
fro
m
1. Monitor current
performance
2. Set targets and define
future objectives
3. Adjust existing and
implement new strategies
and policies to steer
current performance
towards future objectives
4. Learn from effectiveness
and evaluation
June 2014 S. BRINGEZU 23
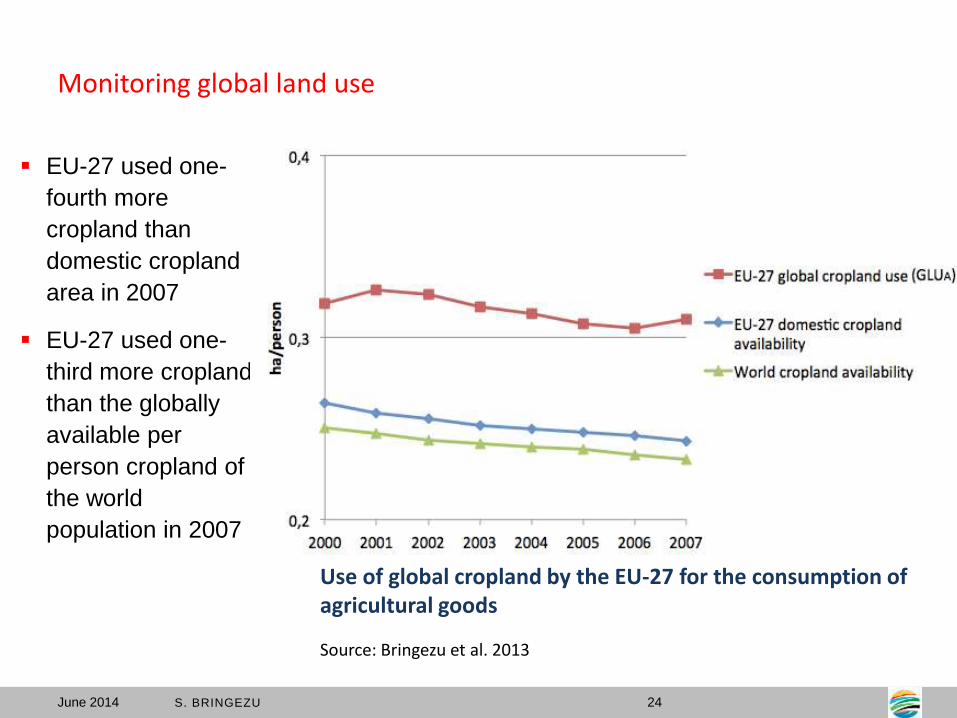
Monitoring global land use
EU-27 used one-
fourth more
cropland than
domestic cropland
area in 2007
EU-27 used one-
third more cropland
than the globally
available per
person cropland of
the world
population in 2007
Use of global cropland by the EU-27 for the consumption of agricultural goods
Source: Bringezu et al. 2013
June 2014 S. BRINGEZU 24
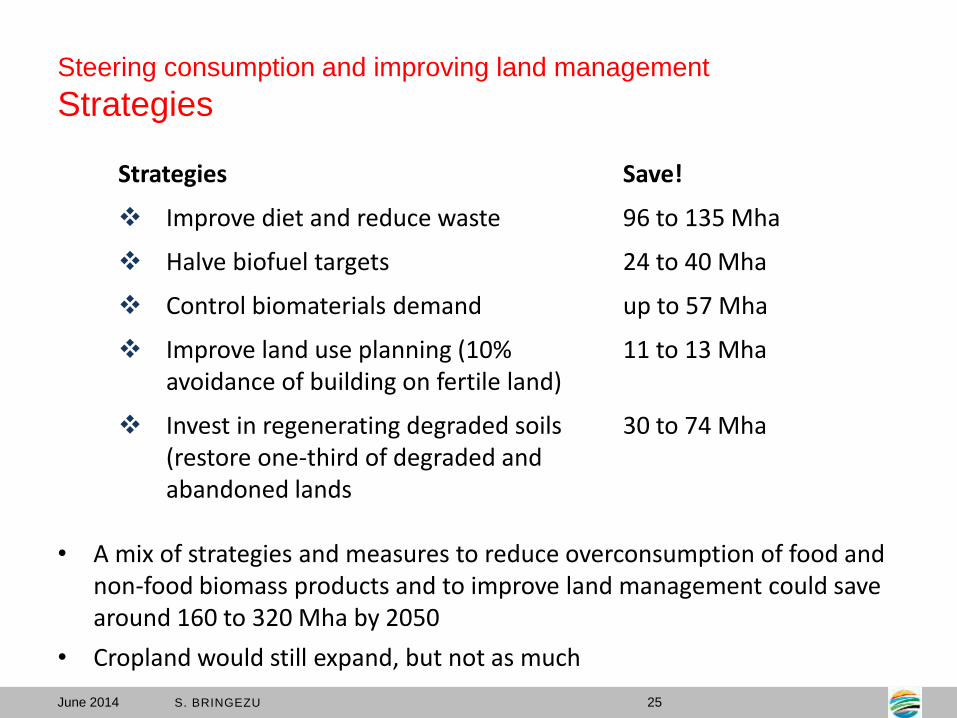
Steering consumption and improving land management
Strategies
Strategies Save!
Improve diet and reduce waste 96 to 135 Mha
Halve biofuel targets 24 to 40 Mha
Control biomaterials demand up to 57 Mha
Improve land use planning (10% avoidance of building on fertile land)
11 to 13 Mha
Invest in regenerating degraded soils (restore one-third of degraded and abandoned lands
30 to 74 Mha
• A mix of strategies and measures to reduce overconsumption of food and non-food biomass products and to improve land management could save around 160 to 320 Mha by 2050
• Cropland would still expand, but not as much
June 2014 S. BRINGEZU 25
1200
1400
1600
1800
2000
2200
2400
2600
1960 1970 1980 1990 2000 2010 2020 2030 2040 2050
Remaining
Gross
Expansion
Historical Trend
Mha
Safe operating space (1,640 Mha)
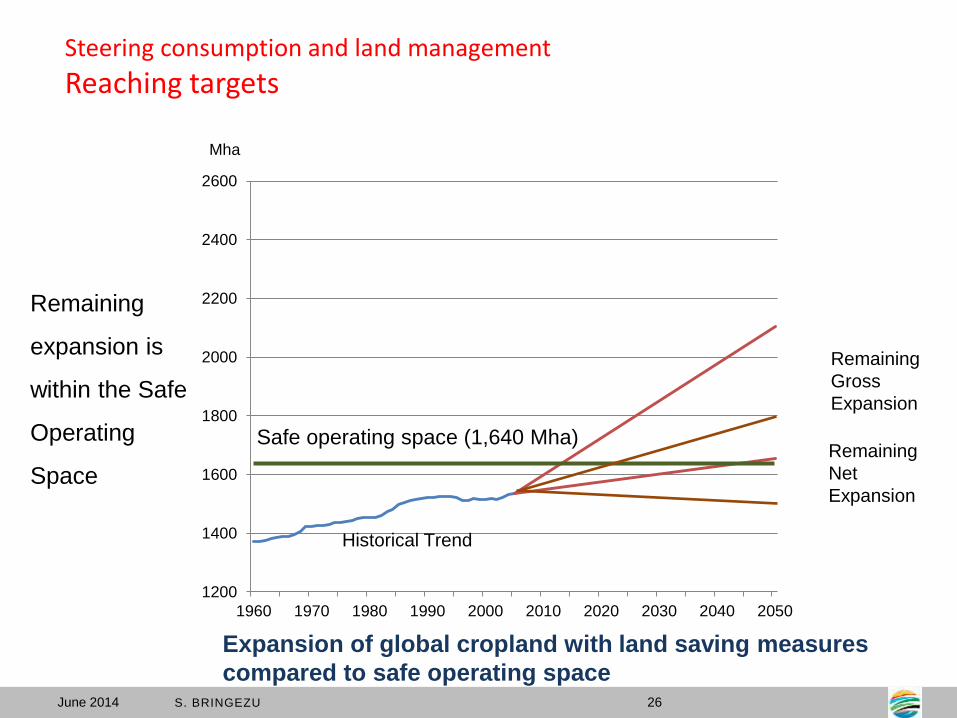
Remaining
expansion is
within the Safe
Operating
Space Remaining
Net
Expansion
Steering consumption and land management
Reaching targets
Expansion of global cropland with land saving measures
compared to safe operating space June 2014 S. BRINGEZU 26

Growing demand for food and non-food biomass will lead to an expansion of
global cropland (BAU). Product certification cannot control global expansion
of gropland
Changing consumption provides high untapped potentials compared to
globally slowing increase of crop production (esp. high-consuming countries)
Large areas with degraded soils need restoration and land use planning
need to avoid building activities on fertile land
A more efficient use of biomass and its substitutes is necessary and
possible, esp. by reducing losses and food waste, shift to more vegetal diet
(esp. in high-consuming countries), and fuel car fleets consuming less fuel
Markets for food and fuels should rather be delinked (e.g. reducing and
outphasing biofuel quota)
Countries could monitor and control their global land use for their
domestic consumption
Conclusion:
It would be possible to implement the SDG goal for land use
June 2014 S. BRINGEZU 27
