global income inequality in the 21 century - world...
TRANSCRIPT

Global income inequality in the 21st century
Branko Milanovic
I Congreso Internacional de Estudios de Desarollo
Santander Nov. 2012

Global inequality today and in the last 25 years

Three concepts of inequality defined
Concept 1 inequality
Concept 2 inequality
Concept 3 (global) inequality

Inequality 1950-2010 The mother of all inequality disputes
With new PPPs Graph in interyd\dofiles\defines.do
Concept 2
Concept 1
Concept 3
.45
.5
5
.65
.7
5
Gin
i co
effi
cien
t
1950 1960 1970 1980 1990 2000 2010 year
Divergence begins
China moves in
Divergence ends
India moves in
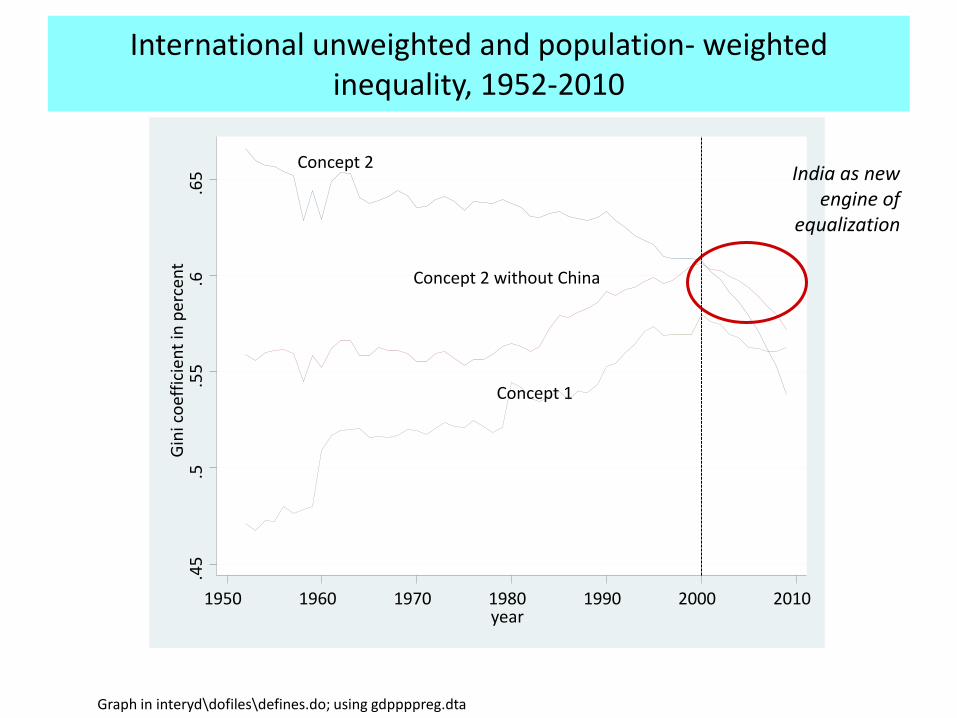
International unweighted and population- weighted inequality, 1952-2010
Graph in interyd\dofiles\defines.do; using gdppppreg.dta
Concept 2
Concept 2 without China
Concept 1
.45
.5
.5
5
.6
.65
G
ini c
oef
fici
ent
in p
erce
nt
1950 1960 1970 1980 1990 2000 2010 year
India as new engine of
equalization

Population coverage
1988 1993 1998 2002 2005 2008
Africa 48 76 67 77 78 75
Asia 93 95 94 96 94 98
E.Europe 99 95 100 97 93 92
LAC 87 92 93 96 96 95
WENAO 92 95 97 99 99 97
World 87 92 92 94 93 94
Non-triviality of the omitted countries (Maddison vs. WDI)

What does Gini of 70 mean?
twoway (scatter gini_disposable year if contcod=="SWE", c(l)) (scatter gini_disposable year if contcod=="USA“ , c (l)) (scatter gini_gross year if contcod=="BRA" & source=="SEDLAC", c(l) legend(off) text(0.30 2005 "Sweden") text(0.42 2004 "USA") text(0.63 2001 "Brazil")) (scatter gini_disposable year if contcod=="WRL", c(l) text (0.72 2005 "World")) Using data_voter_checked.dta to which I added the world from my global data
Sweden
USA
Brazil
World
.2.3
.4.5
.6.7
1970 1980 1990 2000 2010year
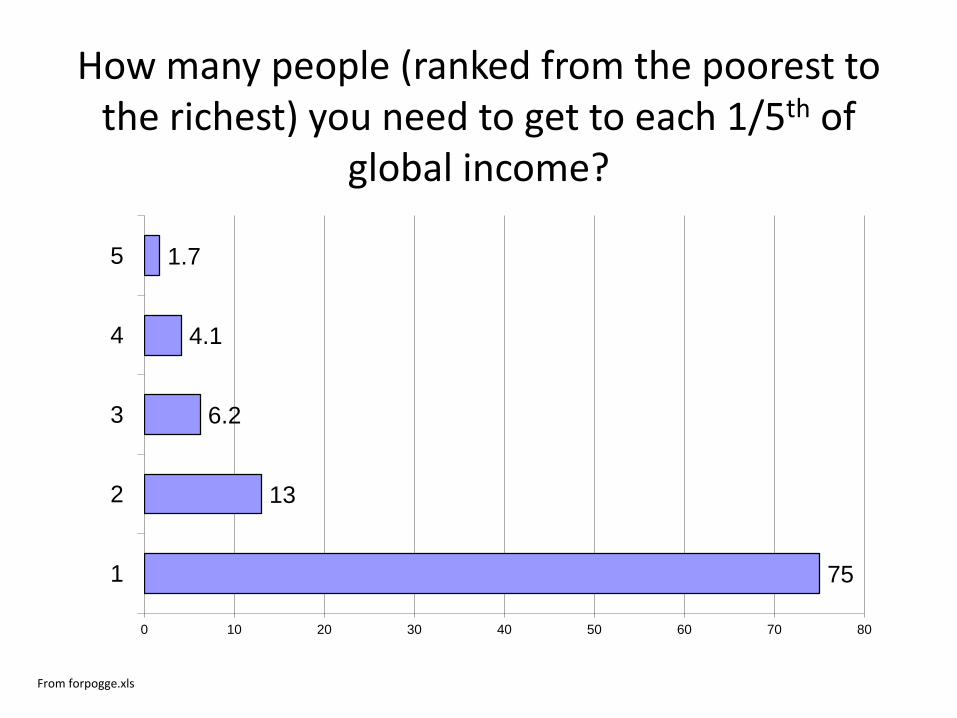
How many people (ranked from the poorest to the richest) you need to get to each 1/5th of
global income?
75
13
6.2
4.1
1.7
0 10 20 30 40 50 60 70 80
1
2
3
4
5
From forpogge.xls

How the world has changed: between the fall of the Berlin Wall and
the fall of Wall Street

Real income growth at various percentiles of global income distribution, 1988-2008 (in 2005 PPPs)
0
10
20
30
40
50
60
70
80
5 10 15 20 25 30 35 40 45 50 55 60 65 70 75 80 85 90 95 99 100
Re
al P
PP
inco
me
ch
ange
19
88
-20
08
Percentile of income distribution

Global Lorenz curves in 1988 and 2008
0
20
40
60
80
100
0 20 40 60 80 100
2008 1988

Shape of global growth vs. US growth
0
10
20
30
40
50
60
70
80
90
5 10 15 20 25 30 35 40 45 50 55 60 65 70 75 80 85 90 95 99 100
Re
al P
PP
inco
me
ch
ange
19
88
-20
08
Percentile of income distribution
World, 1988-2008
United States, 1990-2008

US pattern is not unusual: in most countries increasing gains for the rich
Philippines and Bangladesh Mexico and Colombia
50
100
150
200
250
300
co
mbin
ed r
ea
l_g
row
th 1
and
2
1 2 3 4 5 6 7 8 9 10decile
120
130
140
150
160
co
mbin
ed r
ea
l_g
row
th 1
and
2
1 2 3 4 5 6 7 8 9 10decile
MEX
COL
BGD
PHL

Increasing gains for the rich with a widening urban-rural gap
Urban and rural China Urban and rural Indonesia
170
180
190
200
210
220
co
mbin
ed r
ea
l_g
row
th 1
and
2
1 2 3 4 5 6 7 8 9 10decile
200
250
300
350
400
450
co
mbin
ed r
ea
l_g
row
th 1
and
2
1 2 3 4 5 6 7 8 9 10decile
From key_variables_calcul2.do

Average real growth (in $PPP) across
country deciles (population-weighted)
0
20
40
60
80
100
120
1 2 3 4 5 6 7 8 9 10
Re
al g
row
th
Income decile
Real $PPP growth 1988-2008, in percent, by decile
population-weighted

Global inequality over the long-run of history

Global income inequality, 1820-2008 (Bourguignon-Morrisson and Milanovic; 1990 PPPs )
Theil
Gini
02
04
06
08
01
00
1820 1860 1900 1940 1980 2020year
twoway (scatter Gini year, c(l) xlabel(1820(40)2020) ylabel(0(20)100) msize(vlarge) clwidth(thick)) (scatter Theil year, c(l) msize(large) legend(off) text(90 2010 "Theil") text(70 2010 "Gini"))

A non-Marxist world
• Over the long run, decreasing importance of within-country inequalities despite some reversal in the last quarter century
• Increasing importance of between-country inequalities (but with some hopeful signs in the last five years, before the current crisis),
• Global division between countries more than between classes

Composition of global inequality changed: from being mostly due to “class” (within-national), today it is
mostly due to “location” (where people live; between-national)
Based on Bourguignon-Morrisson (2002), Maddison data, and Milanovic (2005) From thepast.xls
0
20
40
60
80
100
1870 2000
Th
eil
0 in
de
x (
me
an
lo
g d
evia
tio
n)
Class
Location
Location
Class

Gaps between countries today

Different countries and income classes in global income distribution in 2008
From calcu08.dta
USA
India
Brazil
China
Russia
1
10
2
0
30
4
0
50
6
0
70
8
0
90
1
00
p
erc
en
tile
of w
orl
d in
co
me
dis
trib
utio
n
1 20 40 60 80 100 country percentile

• Almost non-overlapping distributions of India and the US: less than 10% of people in India better-off than the poorest percentiles in the US
• But this is not true for Brazil and China: more than ¾ of the population of Brazil better off than the poorest Americas; about ½ of the Chinese.
• Brazil within itself spans the entire global distribution
• China dominates India at any point of income distribution Russia dominates Brazil.
• Americans (richest 10%), Brazilians and Russians (for both, just the highest national percentile) all in the top global percentile

Spain and the rest of the world
Germany
Argentina
Ecuador
Spain
Ivory Coast
0
20
40
60
80
100
perc
entile
of
world incom
e d
istr
ibution
1 5 10 15 20 country ventile

Problems of migration

The XXI century trilema
A. Globalization of ideas, knowledge, Communication, awareness of others’ living standards
B. Increasing differences in mean incomes
among countries
C. No movement of people
If A and B, then no C. Migration is the outcome of current unequal globalization. If B and C, then no A. Unequal globe can exist if people do not know much about each other’s living conditions or costs of transport are too high. If A and C, then no B. Under globalization, people will not move if income differentials are small.

Growing inter-country income differences and migration: Key seven borders today

Concluding comments
• Are the increase around the median and the dip around the 70-80th global percentile related?
• Are China/India growth spelling the doom of the Western middle class?
• Will within-inequalities increase as between-country inequalities go down?
• Role of migration as an engine of development

The key difficulty
• How to manage:
• (1) Rise of the emerging market economies and rich world middle class
• (2) Rising domestic inequalities
• (3) Migration, while recognizing its potential for global poverty alleviation

From the point of view of Spain or any advanced country, this means…
• Increased competitiveness in the age of globalization
• Protection of welfare state and lower domestic inequality
• Openness of borders and managed migration
• Often these objectives might go against each other.

Concept 2
Concept 1
Concept 3
.45
.5
5
.65
.7
5
Gin
i co
effic
ien
t
1950 1960 1970 1980 1990 2000 2010 year