global ict department (gict) the world bank group best practices and lessons from internet...
TRANSCRIPT

GLOBAL ICT DEPARTMENT (GICT)
THE WORLD BANK GROUP
Best Practices and Lessons from Internet Infrastructure Development
Initiatives
Rob StephensWorld Bank Group
March 24, 2005
El Uso de Internet en las Americas17 de Junio, 2005
CIDE

GLOBAL ICT DEPARTMENT
THE WORLD BANK GROUPContents
The World Bank Group and ICTs
Affordability and the access gap
Universal Access: the OBA & smart subsidy approach
Examples: Guatemala and Peru
Closing observations

GLOBAL ICT DEPARTMENT
THE WORLD BANK GROUP
The World Bank Group and ICTs

GLOBAL ICT DEPARTMENT
THE WORLD BANK GROUPExamples of World Bank Group Work
Finance studies: WSIS/UN financing of ICTs studies and Regulatel universal access project
Development of national sector policy and implementation strategy – e-strategies, etc
Privatization of state-owned telecom operators
Encourage public private partnerships
Establishment of legal and regulatory framework and institutions
Capacity-building and finance spectrum management
Design and finance universal access programs
Foster and finance incubators
Invest in private sector companies
Development, Implementation and Financing of UA Schemes

GLOBAL ICT DEPARTMENT
THE WORLD BANK GROUP
No project yetTechnical AssistanceTA & Investment
GICT Rural Access Projects
Project under development

GLOBAL ICT DEPARTMENT
THE WORLD BANK GROUPGICT Portfolio 2005
GICT’s Transactions Sub-SectorsGross Amount
(US$5.0 billion Approvals*)
GICT’s Transactions per RegionGross Amount
(US$5.0 billion Approvals*)
(*) % related to transaction volumes in US$
GICT Portfolio
Fixed Telephony27%
Mobile Telephony
51%
Other - Satellite, Radio, TV
2%
Cable & Broadband
14%Information Technology
6%
• Current portfolio totals US$1.07 billion - 7%of total IFC portfolio
• 140 investments in 52 countries
South Asia7%
World1%
Latin America & Caribbean
31%
Middle East and North Africa
11%
Southern Europe and Central Asia
16%
Sub-Saharan Africa10% East Asia and
Pacific13%
Central and Eastern Europe
11%

GLOBAL ICT DEPARTMENT
THE WORLD BANK GROUP
An overview of the rural access problem

GLOBAL ICT DEPARTMENT
THE WORLD BANK GROUP
Health
Environmental and natural resouces management
Business Services
Education
PublicServices
Telecommunications Infrastructure
Financial Sector
Telecommunications are a key element of economic Telecommunications are a key element of economic and social development ...and social development ...
Less isolation in poor and rural areas

GLOBAL ICT DEPARTMENT
THE WORLD BANK GROUP
Wireless/cellular explosion subscribers growing globally at 30-50% per year, in Africa this rate is of
150%
substantial penetrations are being achieved, already overcoming that of fixed lines worldwide
mobile phones are becoming a means of access for many:— pre-pay mass market— wireless payphones
Satellites fill in the gaps: offer cost-effective solution for remote locations, particularly if power
systems are already available
deployed in rural areas of Chile, Colombia, Guatemala, Peru, South Africa, and elsewhere
serve to demonstrate there is actual demand & viable markets
… … and they are becoming increasingly more and they are becoming increasingly more affordableaffordable

GLOBAL ICT DEPARTMENT
THE WORLD BANK GROUP
Very rapid growth of ISPs, Internet hosts & users
Phoneshops:
basic public telephone
some are adding fax and PCs/e-mail
Telecenters:
basic public telephone & fax
e-mail, Internet, computers
training resources, skills transfer, community role
access to gov’t & commercial data, distance education, health & other info services
Telecenters sustainabilty (financial, social, cultural) challenge
Internet services are also slowly becoming essentialInternet services are also slowly becoming essential

GLOBAL ICT DEPARTMENT
THE WORLD BANK GROUPHowever, great inequalities remainHowever, great inequalities remain
0
20
40
60
80
100
120
0 800 2000 4000 8500 15000 30000
Per-capita GDP (PPP)
Hou
seho
ld p
enet
ratio
n (p
er 1
00)
0
20
40
60
80
100
120
0 800 2000 4000 8500 15000 30000
Per-capita GDP (PPP)
Hou
seho
ld p
enet
ratio
n (p
er 1
00)
Country
Rural areas / Low-income users
Other urban areas / middle-income users
Capital / High-income users

GLOBAL ICT DEPARTMENT
THE WORLD BANK GROUPThe digital divide is widest between urban and rural areasThe digital divide is widest between urban and rural areas

GLOBAL ICT DEPARTMENT
THE WORLD BANK GROUPGiving rise to universal service & universal access Giving rise to universal service & universal access
policiespolicies
-
10
20
30
40
50
60
70
80
90
100
1 3 5 7 9 11 13 15 17 19 21Per-capita income (US$ 000's - illustrative only)
Line
s pe
r 10
0 h
ouse
hold
s
-
10
20
30
40
50
60
70
80
90
100
1 3 5 7 9 11 13 15 17 19 21Per-capita income (US$ 000's - illustrative only)
Line
s pe
r 10
0 h
ouse
hold
s
Universal
Access
Universal
Access
Universal ServiceUniversal Service
Primary focus: shared
access (payphones)
for rural areas
Primary focus: private lines
for low-income users
Developing countries focus limited resources primarily on universal access in rural areas/where the market failure is greatest. Urban areas – markets serve

GLOBAL ICT DEPARTMENT
THE WORLD BANK GROUP
Affordability and the access gapAffordability and the access gap

30000
1
1.5
2
2.5
3
3.5
4
0 5000 10000 15000 20000 25000
GDP per capita (US$)
Tel
eco
mm
un
icat
ion
s r
even
ue
as %
o
f G
DP
World
People spend about 2% on phone servicePeople spend about 2% on phone service

GLOBAL ICT DEPARTMENT
THE WORLD BANK GROUP
% GDPCountry
2.3 1.3Malaysia
Tanzania 1.92.1
1.6 1.3Botswana
1.2 1.5
Rural Areas
Perú
Source: A. Dymond, Intelecon
……including rural areas and poor customersincluding rural areas and poor customers
•Poor people in rural areas often have “high” willingness to pay for phone Poor people in rural areas often have “high” willingness to pay for phone service (different opportunity costs and income measurements)service (different opportunity costs and income measurements)
•Availability is a larger barrier than affordabilityAvailability is a larger barrier than affordability

GLOBAL ICT DEPARTMENT
THE WORLD BANK GROUPAccess Divide: the two gaps
Current individual user access
Community access
Current expansion plans
Geographic Isolation
Po
vert
y
Market Efficiency Gap (MEG)
Commercially Feasible Market
Access Gap (MAP)
Rural Market Access Gap
Full Market Access Gap

GLOBAL ICT DEPARTMENT
THE WORLD BANK GROUPHow to reduce the gaps?
Current individual user access
Community access
Current expansion plans
Geographic Isolation
Po
vert
y
Market Efficiency Gap (MEG) Market
Access Gap (MAP)
Remove Legal and Regulatory
Barriers
Develop Universal Access Programs Full Market Access Gap
Rural Market Access Gap

GLOBAL ICT DEPARTMENT
THE WORLD BANK GROUP
Closing the access gap: output based Closing the access gap: output based aid (OBA) and the smart subsidyaid (OBA) and the smart subsidy

GLOBAL ICT DEPARTMENT
THE WORLD BANK GROUPGovernment defines objectivesGovernment defines objectives
Provide 200 public telephones in a certain rural area, for a one-time subsidy and operate them for a ten year
period at specified minimum quality standards.
RURAL AREA

GLOBAL ICT DEPARTMENT
THE WORLD BANK GROUPPrivate operators bid for subsidyPrivate operators bid for subsidy
$2 million
$1 million
$1.5 million$0.5 million
Concession is awarded to consortium requesting lowest subsidy.

GLOBAL ICT DEPARTMENT
THE WORLD BANK GROUPSubsidy paid against investments
RURAL AREA
Output-Based Aid: Subsidy paid as investment targets are met.

GLOBAL ICT DEPARTMENT
THE WORLD BANK GROUP
Project design aimed at commercial viability of concessions Max subsidy to make private NPV=0 Tariff structure and adjustments, interconnection charges allowed at expected traffic levels
Well-defined roll-out targets for operators E.g. Towns to be served/Services to be provided/ Quality indicators/ Contract length
No exclusivity rights or technology restrictions
Freedom to provide additional services
Key Features of OBA Projects in LAC

GLOBAL ICT DEPARTMENT
THE WORLD BANK GROUPOutput-Based Aid (OBA)
Disbursement of public funding is tied to specified outputs or services delivered by private firms (or NGOs):
May complement or replace user-fees under structures where operator is responsible for financing and providing the service.
Public funding may be sourced from Bank loans, other kinds of donor assistance, or government’s own resources.
Potential benefits:
Better targeting of beneficiaries/outcomes
Better incentives for efficiency & innovation
Opportunities to leverage private financing.

GLOBAL ICT DEPARTMENT
THE WORLD BANK GROUP
Problem
Universal services are socially desirable (social NPV>0) but not always commercially viable (private NPV<0)
Solution
Provide a one-time investment subsidy for private operators willing to provide the universal access service.
Bid the subsidy out competitively to ensure that costs are kept as low as possible. Paid over time as outputs are provided.
This effectively leverages maximum private investment in achieving universal service goals
OBA - Smart Subsidy Approach

GLOBAL ICT DEPARTMENT
THE WORLD BANK GROUP
The spread of the model
income level
level of interest
upper middle income
lower middle income
low income
water
transport
electricity
telecomChile
Guatemala
Nepal
(Paraguay)
Argentina
ChileBolivia
(Mexico) (Ecuador)
Cape Verde (Benin/Togo)
(Uganda) (Senegal)
Peru
Uganda (Nicaragua)
Colombia
South Africa Dom. Rep.

GLOBAL ICT DEPARTMENT
THE WORLD BANK GROUPSome examples: designSome examples: design
Chile Colombia Peru Nepal
Year 19941995
1994 1999 19941998 20012003
Target Meet requests
Towns of 250+ Towns of 300+ Eastern Development Region
Funding Taxation USL+licenses 1% USL+fines IDA Credit
Revenues
US$6m pa. US$60m pa. US$12m pa. US$ 2m pa.
Duration 10 years 10 years 20 years 10 years
Payment Immediate Installments (18 months)
Installments (18 months)
Installments (2 years)
Price regulation
Yes+rural interconnect
Yes Yes No

GLOBAL ICT DEPARTMENT
THE WORLD BANK GROUPSome examples: outcomesSome examples: outcomes
Chile Colombia Peru Nepal
Projects 200 6 7 1
Bidders - 2 to 7 2 to 5 3
Subsidy per town
$3,600 $4,600 $9,500 $9,365
Towns served
6,059 7,415 4,420 1,064
Population served
2.2m 3.7m 1.6m 4m

GLOBAL ICT DEPARTMENT
THE WORLD BANK GROUPFinancing optionsFinancing options
Universal access funds, financed by: government budget operator revenue contributions (typically 1-2%) cellular, basic service or radio frequency license fees interconnect levies and ‘virtual fund’ transfers
Low interest operator loans national sources (e.g. USA’s REA loans) aid agency sources (not a good record)
Micro loans for phoneshops or other retailers e.g. Grameen Bank ‘phone ladies’ part financing by telecom operators

GLOBAL ICT DEPARTMENT
THE WORLD BANK GROUP
Applying the access gap and OBA Applying the access gap and OBA model: Guatemala and Perumodel: Guatemala and Peru

GLOBAL ICT DEPARTMENT
THE WORLD BANK GROUP
Guatemala – Liberalization achievements
LÍNEAS DE TELEFONÍA FIJA
286,4342,0
429,7517,0
610,7676,6
756,1846,0
944,1
1 132,2
2,9 3,1
4,14,8
5,55,9
6,57,1
7,9
8,9
0
200
400
600
800
1000
1200
1995 1996 1997 1998 1999 2000 2001 2002 2003 2004
mile
s d
e lín
eas
0
1
2
3
4
5
6
7
8
9
10
Tel
eden
sid
ad
líneas densidad Fuente. Paul Budde Inc., SIT
LÍNEAS DE TELEFONÍA MÓVIL
43,0 64,0 112,0320,0
660,5
1 009,2
1 386,0
1 875,1
3 168,3
0,4 0,6 1,03,0
5,8
8,6
13,5
24,9
12,0
0
500
1000
1500
2000
2500
3000
3500
1996 1997 1998 1999 2000 2001 2002 2003 2004
mile
s d
e lín
eas
0,0
5,0
10,0
15,0
20,0
25,0
30,0
Tel
eden
sid
ad
líneas densidad Fuente. Paul Budde Inc., SIT

GLOBAL ICT DEPARTMENT
THE WORLD BANK GROUP
DENSIDAD FIJA POR DEPARTAMENTOS, 2003
25,03
7,26 6,76 6,485,55 5,00 4,31
3,50 3,49 3,21 3,20 2,90 2,43 2,07 2,05 2,02 1,94 1,91 1,74 1,68 1,50 1,23
GUA SAC ZAC QUE ESC IZA CHQ RET CHM SUC PET EPR JAL JUT SNM STR HUE SOL TOT BVP AVP QUI
Promedio nacional: 7,87
Fuente: SIT, INE
… there is a pending agenda – access gap: example -- Guatemala

GLOBAL ICT DEPARTMENT
THE WORLD BANK GROUPGuatemala: Identifying the Gaps
• Four areas were selected that had a high concentration of areas in clusters 4 & 5
• This led to selecting four departments: Petén, Huehuetenango, Alta Verapaz y Quiche.
• A field survey was carried out in these four departments

GLOBAL ICT DEPARTMENT
THE WORLD BANK GROUP
Results of Gap Assessment in Guatemala
Las Brechas de Eficiencia de Mercado se calculan quitando a la población urbana y rural no pobre la densidad total fija y móvil.La Brecha de Acceso Real es la población rural pobre y pobre extrema que requiere de subsidio para poder accesar al servicio (y cuyo gasto en comunicación sí cubre el costo de O&M de TTPP).
BRECHAS DE ACCESO, EN NÚMERO DE HOGARES
Región Brecha de Eficiencia de Mercado Brecha de AccesoUrbano Rural Total (sólo rural)
Metropolitana 0 21,400 21,400 21,339Norte 0 10,653 10,653 66,791Nororiental 14,390 21,819 36,209 44,515Suroriental 16,700 21,841 38,541 73,034Central 19,821 0 19,821 79,817Suroccidental 0 79,697 79,697 150,815Noroccidental 4,541 23,544 28,085 116,415Petén 0 15,534 15,534 17,868TOTAL 55,451 194,488 249,939 570,595TOTAL población 349,343 1,225,274 1,574,617 3,594,749
Backbone Gap: 288 out of 331 Municipalies do not have backone access

GLOBAL ICT DEPARTMENT
THE WORLD BANK GROUP
Estimated Costs of Bridging the Rural Access Gap in Guatemala
(En US Dólares)
Fase I: Piloto Fase II Fase III TotalTeléfonos Públicos Comunitarios 1,577 2,009 1,648 5,234 Teléfonos privados 6,315 6,639 5,331 18,285 POPs de Acceso a Internet 79 129 80 288 Población beneficiada 1,194,823 1,276,649 1,020,419 3,491,891 Monto de subsidio 6,960,319 8,996,392 7,813,710 23,770,421 Monto de Inversión 6,540,390 7,698,739 6,203,222 20,442,351
INDICADORES RESUMEN DE LOS PROYECTOS
Estimated not Actual/Unofficial

GLOBAL ICT DEPARTMENT
THE WORLD BANK GROUP
1% tax on operators could finance programs to fully address the rural access gap in Guatemala
Recaudación Saldo netoFase I Fase II Fase III Total Estimada 1/ anual
Año 0 2,538,724 2,538,724 1,000,000 (1,538,724) Año 1 2/ 2,538,724 3,276,670 5,815,394 4,670,000 (1,145,394) Año 2 846,241 3,276,670 2,896,670 7,019,581 4,903,500 (2,116,081) Año 3 846,241 1,092,223 2,896,670 4,835,134 5,148,675 313,541 Año 4 846,241 1,092,223 965,557 2,904,021 5,406,109 2,502,088 Año 5 846,241 1,092,223 965,557 2,904,021 5,676,414 2,772,393 Año 6 1,092,223 965,557 2,057,780 5,960,235 3,902,455 Año 7 965,557 965,557 6,258,247 5,292,690 1/ Asume una disponibilidad para año 0 de US$ 1 millón en Fondetel.2/ Asume una contribución de 1% de los ingresos brutos del sector.
Desembolsos Ingresos
DESEMBOLSOS E INGRESOS REQUERIDOS POR ESTRATEGIA(US Dólares)
Esquema de desembolsos es: 30% como adelanto ante entrega de cronograma detallado de instalaciones, 30% contra entrega de sistema y 4 pagos anuales de 10%.
Estimated, Not Actual/Unofficial

GLOBAL ICT DEPARTMENT
THE WORLD BANK GROUP
Gigantesco progreso en la obtención de Accesso Universal
Efecto de reducción de distancia ha sido dramático, pero las variantes entre regiones puede ser grande (debido a la altura, terreno e inclinación)
FITEL I FITEL II FITEL III FITEL IV Total/Avg
Approx. # of Sites 213 2,170 2,520 1,614 6,517
Population (m) 0.14 1.6 2.1 2.9 6.74
Subsidy (US$M) 5.1 12.1 30.7 11.4 59.3
Population / site 689 758 827 1,822 1,024
Subsidy / site US$ 23,937 5,575 12,163 7,061 8,266
Subsidy / pop US$ 34.74 7.36 14.71 3.88 8.65
Avg. Distance (prior) 90km 54km 24km NA 56km
Avg. Distance (post) 5km 8km 4km NA 5.7km
FITEL Program Summary Statistics
Impacto de FITEL (1)

GLOBAL ICT DEPARTMENT
THE WORLD BANK GROUP
•FITEL ha reducido la distancia de 5.7 km en promedio, esto es notable en un país con un terreno tan desafiante como Perú
•El impacto de teléfonos FITEL es numeroso, incluyendo un cuidadoso uso de dinero en algunos pueblos donde anteriormente usaban el trueque
Impacto de FITEL (2)

GLOBAL ICT DEPARTMENT
THE WORLD BANK GROUP
•Análisis de costo-beneficio de 1.64 y excedente por consumidor de 13 Soles por mes indica beneficios tangibles significativos
•Beneficios menos tangibles incluyen la mejora del contacto familiar, mejor salud y seguridad (llamadas de emergencia), integración de economías regionales y menor aislamiento
Impacto de FITEL (3)

GLOBAL ICT DEPARTMENT
THE WORLD BANK GROUP
• 70% de encuestados fueron conscientes de los teléfonos públicos en sus comunidades, sólo ~50% lo ha usado en el año pasado (MINAG análisis de encuesta)
• Promedio de gasto en telecomunicaciones es alrededor de 8 Soles por mes por usuario – US$ 2.3 – cerca de las salientes ARPU de muchos usarios de prepago en la ciudad
• Esto es equivalente al ~1.4 % de los ingresos familiares
• Modelo típico de uso ligeramente mayor a 3 llamadas por mes/usuario, 10 minutos por mes en promedio (Suministro-figuras afectadas)
• Más de 3.3 millones de llamadas por mes en teléfonos rurales GTH, 1.9 millón recibidas (58%) y1.4 millón salientes (42%)
Impacto de FITEL (4)

GLOBAL ICT DEPARTMENT
THE WORLD BANK GROUP
•FITEL alcanzó similar (ligeramente menor) subsidio por figuras prepagadas como FDT de Chile, entre US$ 5,600 y 12,000
•FITEL ha usado pilotos y circulado ofertas iniciales como experiencia de aprendizaje, y continua mejorando su programa, diseñando ofertas y marcos regulatorios.
• Tarifas de interconexion asimetricas para operadores rurales
•FITEL ha logrado mantener los costos administrativos de gestión del fondo en un nivel bajo (debajo del 2% del financiamiento) , aparece estable alrededor del 1%
Impacto de FITEL (5)

GLOBAL ICT DEPARTMENT
THE WORLD BANK GROUPComponents of Access Strategy
3. Telefonos Comunitarios/VSAT:Mejorar, mover, fomento uso para otros servicios
4. Telefonia Celular:
Estimular expansion celular
5. Banda Ancha Nacional:
Diagnostico y opciones.
2. Internet y Telecentros:
Mas pilotos y estrategia para asegurar uso productivo
1. Liderazco, dialogo y coordinacion:
Consensuar una estrategia nacional de e-desarollo

GLOBAL ICT DEPARTMENT
THE WORLD BANK GROUP
Priority is universal access not universal service
Voice is the “killer ICT application” demanded by poor cellphone is the world’s most important 2-way ICT commodity
Privatization, Liberalization and Universal Access reforms at the same time: Chile, Peru, Guatemala, Colombia, Brazil
Private sector has lead role to invest in sector. Government roll is to stimulate private investment in less attractive areas.
Slow roll-out of some universal access programs
Rural build-out requirements imposed on privatized firms
Benefit: Service quickly provided to unserved communities
Policy Cost: Exclusivity periods and weaker regulation of incumbent
Universal access fund and agency established
Financing options: (1) government budget --Chile), (2) 1%-2% tax on telecom sector -- Peru, Colombia, Brazil), (2) Other sources – Guatemala.
Options: (1) part of regulator – Peru, Chile, (2) part of Ministry; (3) “independent”
Targeting of funds – Identify access gaps
Allocation of funds -- Output Based Aid (OBA) model/tenders
Universal programs evolve over time
Trends: From large national projects to smaller projects, from supply/infrastructure focus to projects that combine supply/infrastructure with demand generation and productive use.
Recap of LAC experiences
GLOBAL ICT DEPARTMENT
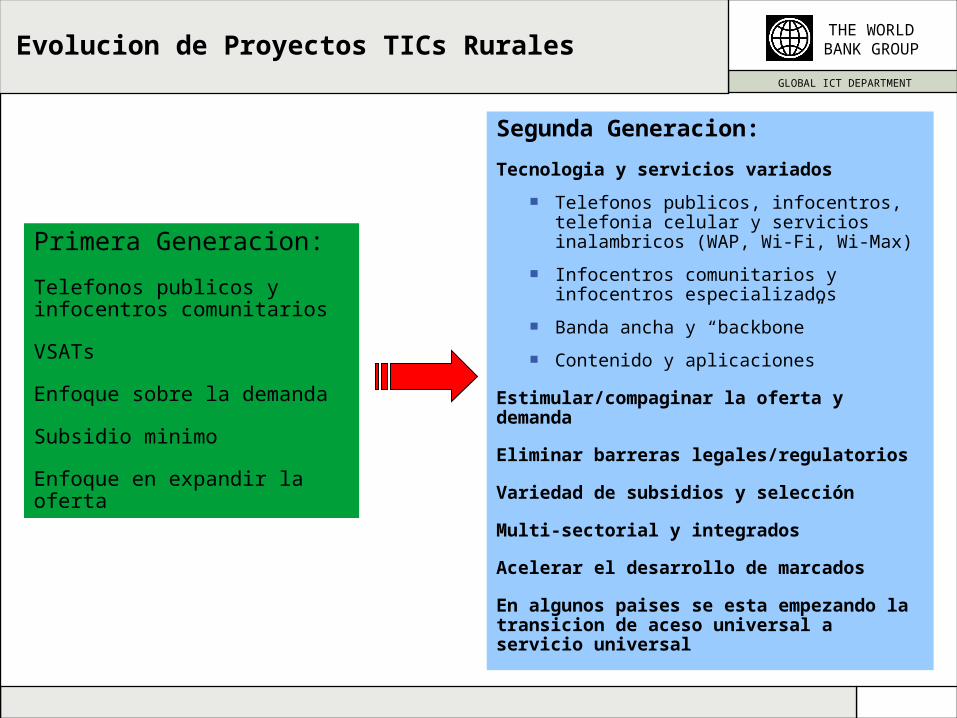
THE WORLD BANK GROUPEvolucion de Proyectos TICs Rurales
Primera Generacion:
Telefonos publicos y infocentros comunitarios
VSATs
Enfoque sobre la demanda
Subsidio minimo
Enfoque en expandir la oferta
Segunda Generacion:
Tecnologia y servicios variados
Telefonos publicos, infocentros, telefonia celular y servicios inalambricos (WAP, Wi-Fi, Wi-Max)
Infocentros comunitarios y infocentros especializados
Banda ancha y “backbone”
Contenido y aplicaciones
Estimular/compaginar la oferta y demanda
Eliminar barreras legales/regulatorios
Variedad de subsidios y selección
Multi-sectorial y integrados
Acelerar el desarrollo de marcados
En algunos paises se esta empezando la transicion de aceso universal a servicio universal