global fertilizer industry: meeting agricultural … fertilizer industry: meeting agricultural...
TRANSCRIPT
Global Fertilizer Industry:Global Fertilizer Industry:Meeting Agricultural Challenges
Ajay S ShriramAjay S Shriram
Sr Vice President, IFA
Chairman & Sr MD, DSCL, India

ContentsContents
• World Agriculture Outlook
• Agriculture Challenges
• Addressing Challenges – The India Story
• Fertilizer Demand Drivers & Emerging Opportunities
• Stewardship Role for the Fertilizer Industry
2
World Agriculture
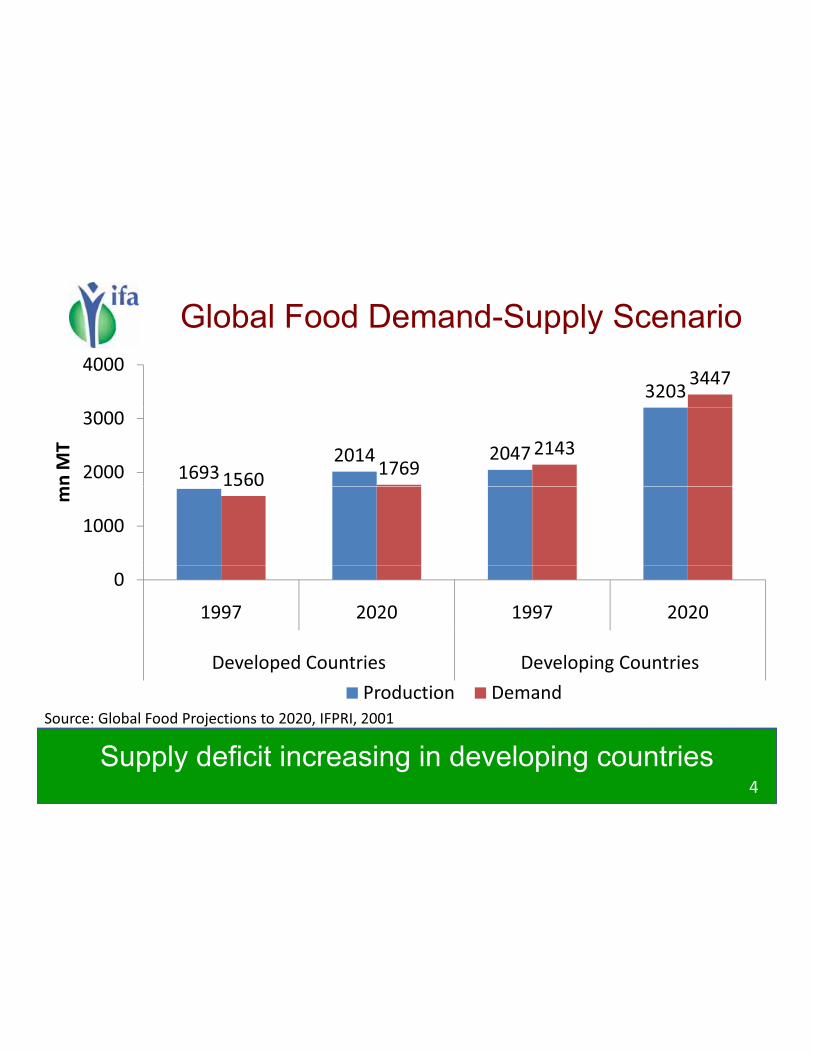
Global Food Demand-Supply Scenariopp y
32033447
4000
16932014 2047
15601769
2143
2000
3000
nMT
1000
m
0
1997 2020 1997 2020
Source: Global Food Projections to 2020, IFPRI, 2001
Developed Countries Developing Countries
Production Demand
4
Supply deficit increasing in developing countries
j , ,
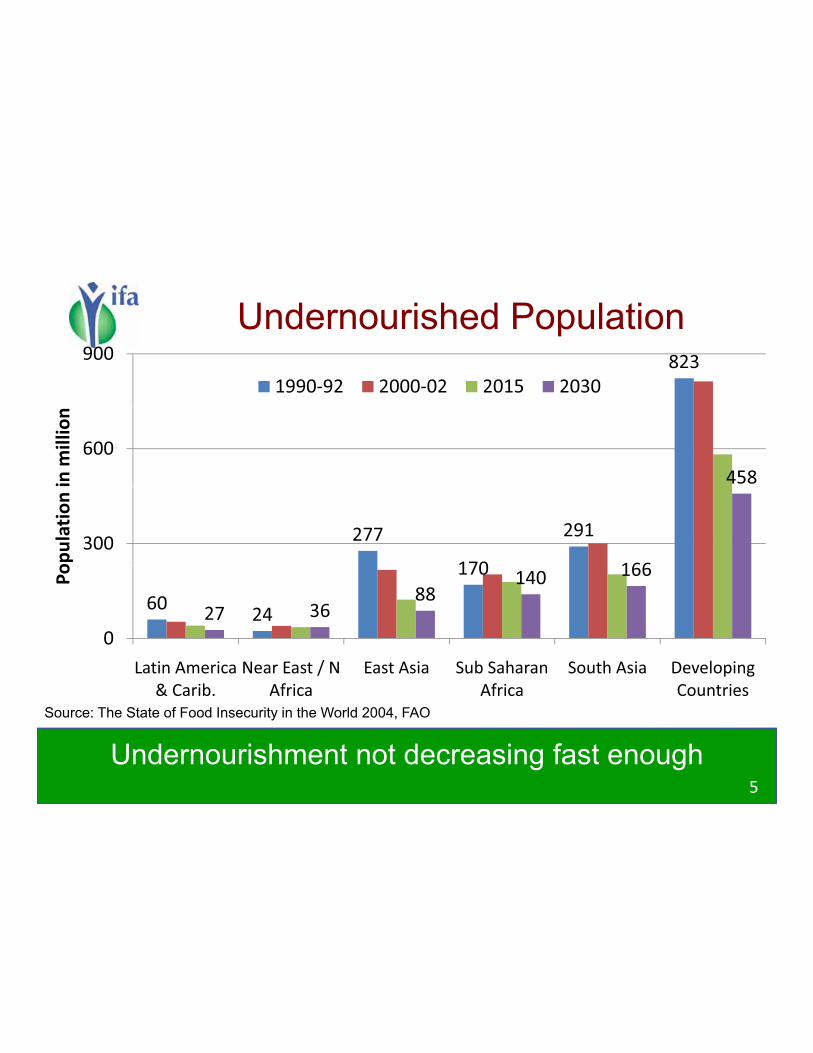
Undernourished PopulationUndernourished Population823900
1990 92 2000 02 2015 2030
458
600
inmillion
277
170
291
166
300
opulation
6024
170
27 3688
140 166
0
Po
Source: The State of Food Insecurity in the World 2004, FAO
Latin America
& Carib.
Near East / N
Africa
East Asia Sub Saharan
Africa
South Asia Developing
Countries
5
Undernourishment not decreasing fast enough
Demographic ChangesDemographic Changes
• Population Growth
– World population to reach 8.13 bn by 2030; 95% of increase in developing and LDCs
D l i t i ill d i i d ld• Developing countries will drive increased worldfood demand
With an expected 40 percent population increase and an– With an expected 40 percent population increase and anaverage annual income growth rate of 4.3 percent
– By 2020, developing countries' demand for cereals for direct human consumption is projected to increase by 47 percent
Source: The World Food Situation, 2006, IFPRI
6

Demographic ChangesDemographic Changes
• Urbanization
– Much of the population increase is expected to be in the cities
Shift from basic staples like maize sorghum etc to– Shift from basic staples like maize, sorghum etc. tocereals like wheat and rice (also fruits & vegetables)
• Income LevelsIncome Levels
– Substantial difference in income growth rates across and within countries / regions
– Poverty likely to be entrenched in South Asia and Latin America and worsen in Sub-Saharan Africa
7
Demographic changes further aggravate nutrition challenges
In Summary …In Summary …
Despite economic growth, the international community faces an increasing challenge of meeting b i f d & t iti d f l ti fbasic food & nutrition needs of a large proportion of
global population – 460 million is the estimated number of undernourished in the developingnumber of undernourished in the developing
countries by 2030
8
Agricultural Challenges

Agricultural ChallengesAgricultural Challenges
• Food Security
• Nutrition Security
• Ecological Issues
• Bio Fuels
• Productivityy
10
Food SecurityFood Security
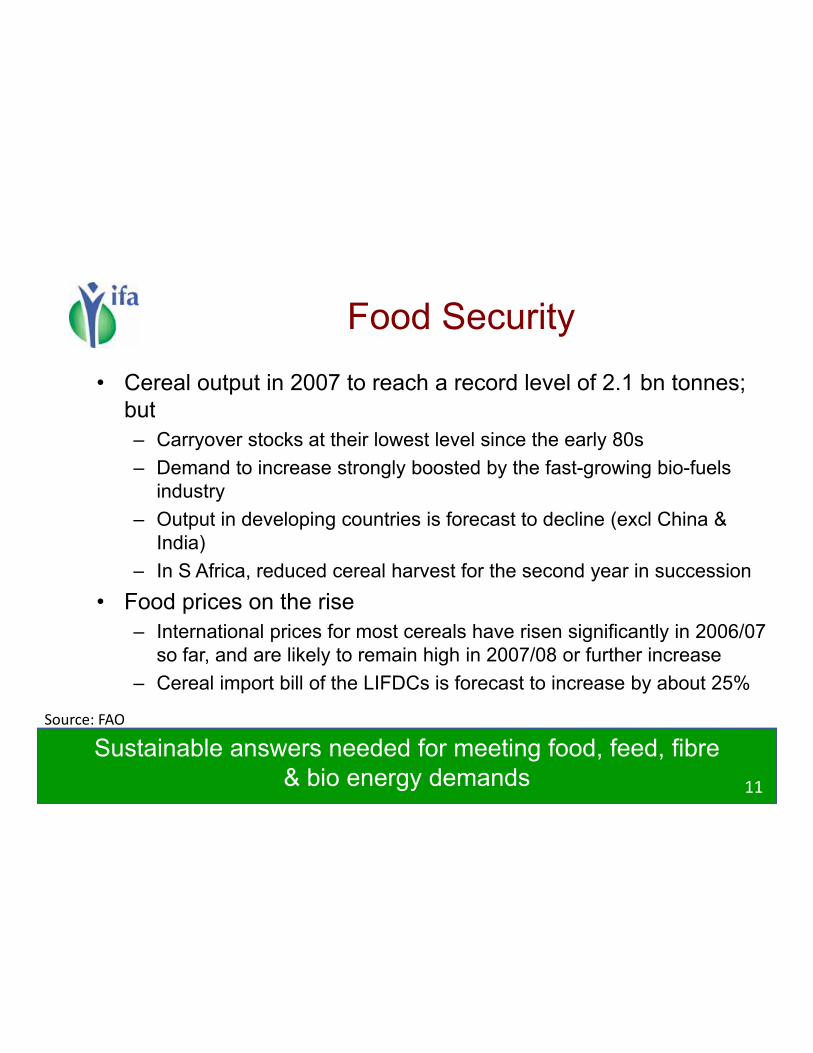
• Cereal output in 2007 to reach a record level of 2.1 bn tonnes; butbut
– Carryover stocks at their lowest level since the early 80s
– Demand to increase strongly boosted by the fast-growing bio-fuels i d tindustry
– Output in developing countries is forecast to decline (excl China & India)
I S Af i d d l h t f th d i i– In S Africa, reduced cereal harvest for the second year in succession
• Food prices on the rise
– International prices for most cereals have risen significantly in 2006/07 so far, and are likely to remain high in 2007/08 or further increase
– Cereal import bill of the LIFDCs is forecast to increase by about 25%
Source: FAO
11
Sustainable answers needed for meeting food, feed, fibre& bio energy demands
Source: FAO

Nutrition SecurityNutrition Security
• Some startling facts2 bn people worldwide have inadequate iodine nutrition– 2 bn people worldwide have inadequate iodine nutrition
– Annually, 140 million preschoolers and more than 7 million pregnant women suffer from vitamin A deficiency
– Iron deficiency annually cause an estimated 111 000– Iron deficiency annually cause an estimated 111,000maternal deaths
• Green revolution concentrated on raising production Specialization in very limited crops and crop genotypes;– Specialization in very limited crops and crop genotypes;Narrow range of nutrients available for consumption
– Displacement of traditional foods, raising issues of nutrition– Problem compounded by urbanizationProblem compounded by urbanization
• Finland has mandated all fertilisers to contain Selenium, which is required to fight the high incidence of cardiovascular disease
Source: UN System, Standing Committee on Nutrition, 2004
12
Malnutrition is the one of the largest contributors to world disease
Source: UN System, Standing Committee on Nutrition, 2004

Ecological Concerns - WaterEcological Concerns Water
• The Crisis
– Population increased 3 fold in the 20th century, but water use has increased 6 fold
Water withdrawal for irrigation has increased to 66% of– Water withdrawal for irrigation has increased to 66% oftotal water use
– Quantity of water (liters) needed to produce 1 kg ofy ( ) p g• Wheat: 1400; Rice: 1000 ; Beef: 13000
• The Projection – 2025
– Water scarcity will cause losses of 350 mn tons of food production
Source: Global Water Outlook to 2025, IFPRI
13
Water use inefficiency will aggravate food insecurity
Source: Global Water Outlook to 2025, IFPRI

Ecological Concerns - LandEcological Concerns Land
• About 11 per cent of the world’s land surface is used for d ticrop production
– Virtually no additional land is available for agricultural expansion in the short term
• Arable land per person is shrinking• Will lead to increasingly more intensive agriculture and its
associated environmental issuesassociated environmental issues
• Land Degradation– About 20 to 30 per cent of irrigated land in the developing world
h b d d b t l i li ithas been damaged by water-logging or salinity
– An estimated 250 million people have been directly affected by desertification and nearly 1 billion are at risk
14
Nutrient mining responsible for 40% of land degradation

Ecological Concerns – NitrogenEcological Concerns Nitrogen
• Fertilizer is one of the major human sources of fixed or reactive nitrogenor reactive nitrogen– Eutrophication of surface water– Nitrate accumulation in ground water
Unwanted ammonia and nitrous oxide emissions to the– Unwanted ammonia and nitrous oxide emissions to theatmosphere
• N leaching due toIntensive cropping– Intensive cropping
– Fertilizer application for over-optimistic yield expectations or as an insurance policyReduced N use efficiency due to deficiencies of secondary /– Reduced N use efficiency due to deficiencies of secondary /micronutrients as well as application timing that does not match crop requirements
15
N losses are due to inappropriate fertilizer use / crop management
Bio FuelsBio Fuels
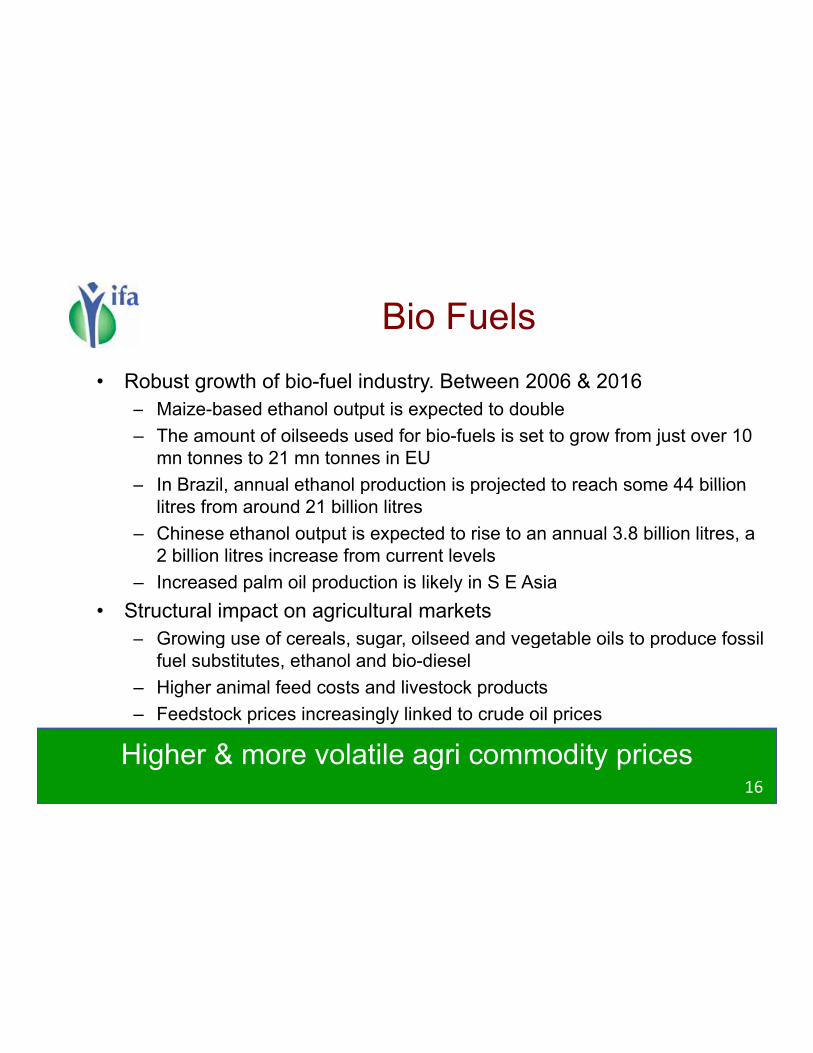
• Robust growth of bio-fuel industry. Between 2006 & 2016
Maize based ethanol output is expected to double– Maize-based ethanol output is expected to double
– The amount of oilseeds used for bio-fuels is set to grow from just over 10 mn tonnes to 21 mn tonnes in EU
– In Brazil annual ethanol production is projected to reach some 44 billion– In Brazil, annual ethanol production is projected to reach some 44 billionlitres from around 21 billion litres
– Chinese ethanol output is expected to rise to an annual 3.8 billion litres, a 2 billion litres increase from current levels
– Increased palm oil production is likely in S E Asia
• Structural impact on agricultural markets
– Growing use of cereals, sugar, oilseed and vegetable oils to produce fossil g , g , g pfuel substitutes, ethanol and bio-diesel
– Higher animal feed costs and livestock products
– Feedstock prices increasingly linked to crude oil prices
16
Higher & more volatile agri commodity prices

Productivity ChallengeProductivity Challenge0.5
0.3
0.4
person
0.2
ectare
/p
0
0.1
h
Source: FAO
0
1960 1970 1980 1990 2000 2010 2020 2030
17
How do we sustainably increase productivity?

Productivity ChallengeProductivity Challenge
1995Updated
2025prediction
Updatedannual rate
change
Population (bn) 5.66 7.90 1.12
p g
Demand for maize, riceand wheat (mn Mt)
1657 2436 1.29
Production area (mn ha) 506 556 0.31
Mean grain yield (t/ha)* 3.27 4.38 0.98
Source: Cassman 2006, Rosegrant et al. 2002. IFPRI
Mean grain yield (t/ha)
* Weighted average for the three major cereals
18
How do we sustainably increase productivity?
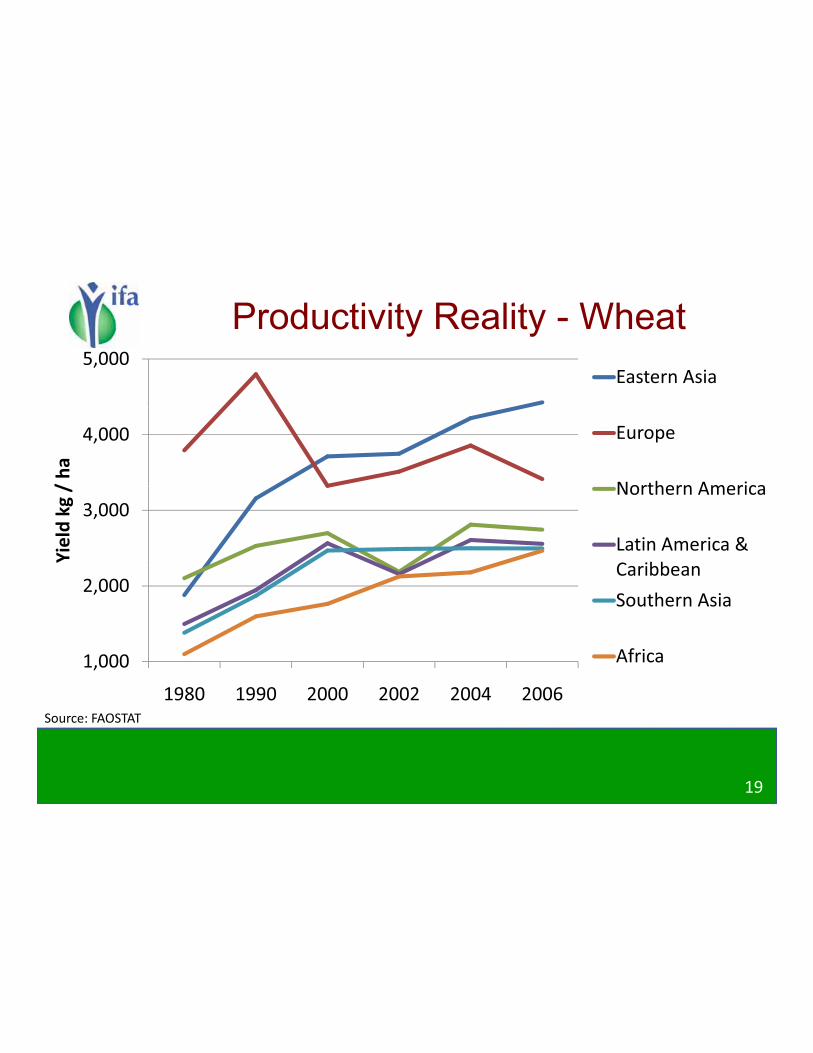
Productivity Reality - WheatProductivity Reality Wheat5,000
Eastern Asia
4,000
/ha
Europe
Northern America3,000
Yieldkg/ Northern America
Latin America &
C ibb2,000
Caribbean
Southern Asia
Source: FAOSTAT
1,000
1980 1990 2000 2002 2004 2006
Africa
19

Productivity Reality - MaizeProductivity Reality Maize11,000
Northern America
7,000
9,000
/ha
Northern America
Eastern Asia
5,000
,
Yieldkg/
Latin America &
Caribbean
S th A i
1 000
3,000
Southern Asia
Africa
Source: FAOSTAT
1,000
1980 1990 2000 2002 2004 2006
20
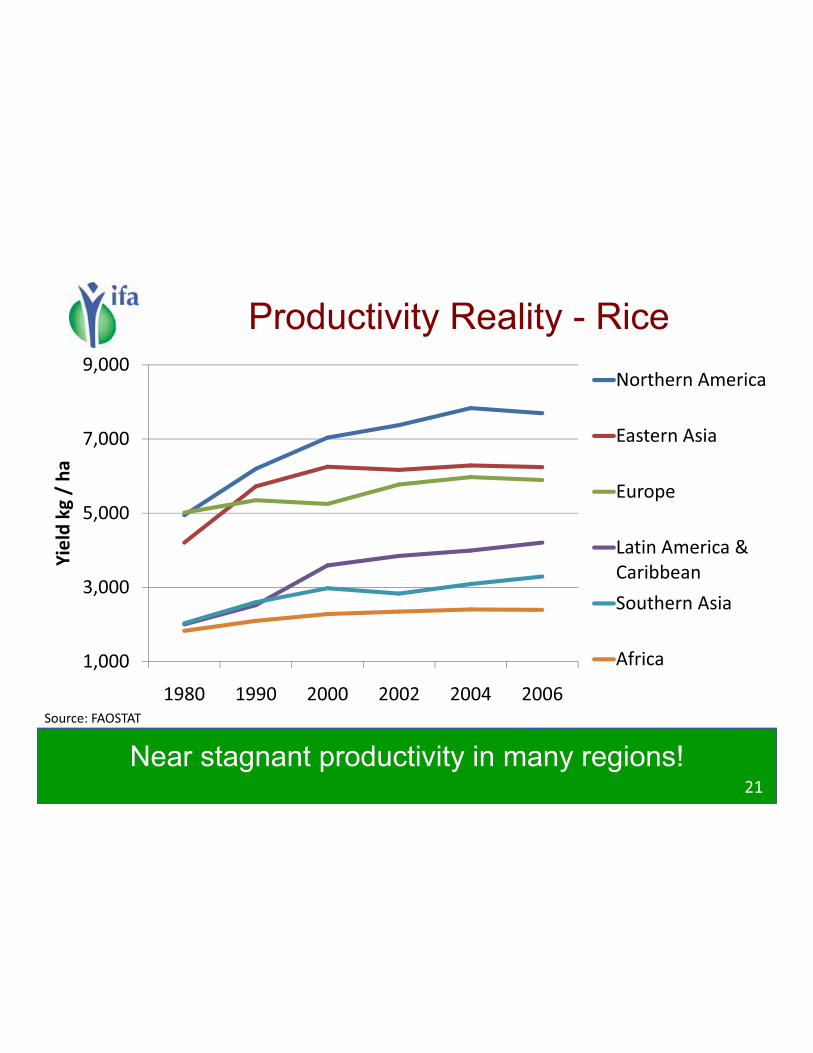
Productivity Reality - RiceProductivity Reality Rice9,000
Northern America
7,000
ha
Eastern Asia
E5,000
Yieldkg/ Europe
Latin America &
C ibb3,000
Caribbean
Southern Asia
Source: FAOSTAT
1,000
1980 1990 2000 2002 2004 2006
Africa
21
Near stagnant productivity in many regions!

Productivity RealityProductivity Reality
• Significant variation in productivity levels across iregions
• Near stagnant growth in productivity in recent years
Si il t d f th lik il d & l• Similar trends for other crops like oil seeds & pulses
A hi i t i bl i i d ti it i• Achieving sustainable increase in productivity requires
– Understanding of geography specific challenges
– Prioritisation of challengesPrioritisation of challenges
22
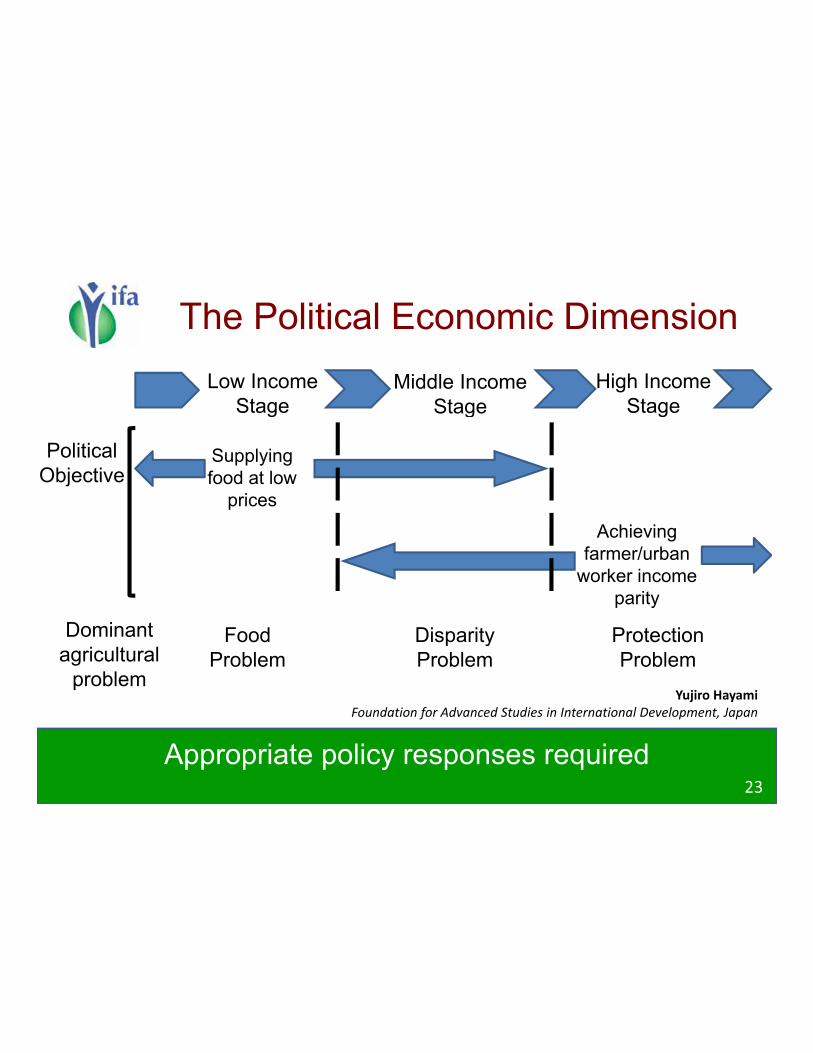
The Political Economic DimensionThe Political Economic Dimension
Low IncomeStage
Middle IncomeStage
High IncomeStageStage Stage Stage
PoliticalObjective
Supplyingfood at low
prices
Achievingfarmer/urban
worker incomeparity
Dominant Food Disparity Protectionagricultural
problemProblem
p yProblem Problem
Yujiro Hayami
Foundation for Advanced Studies in International Development, Japan
23
Appropriate policy responses required
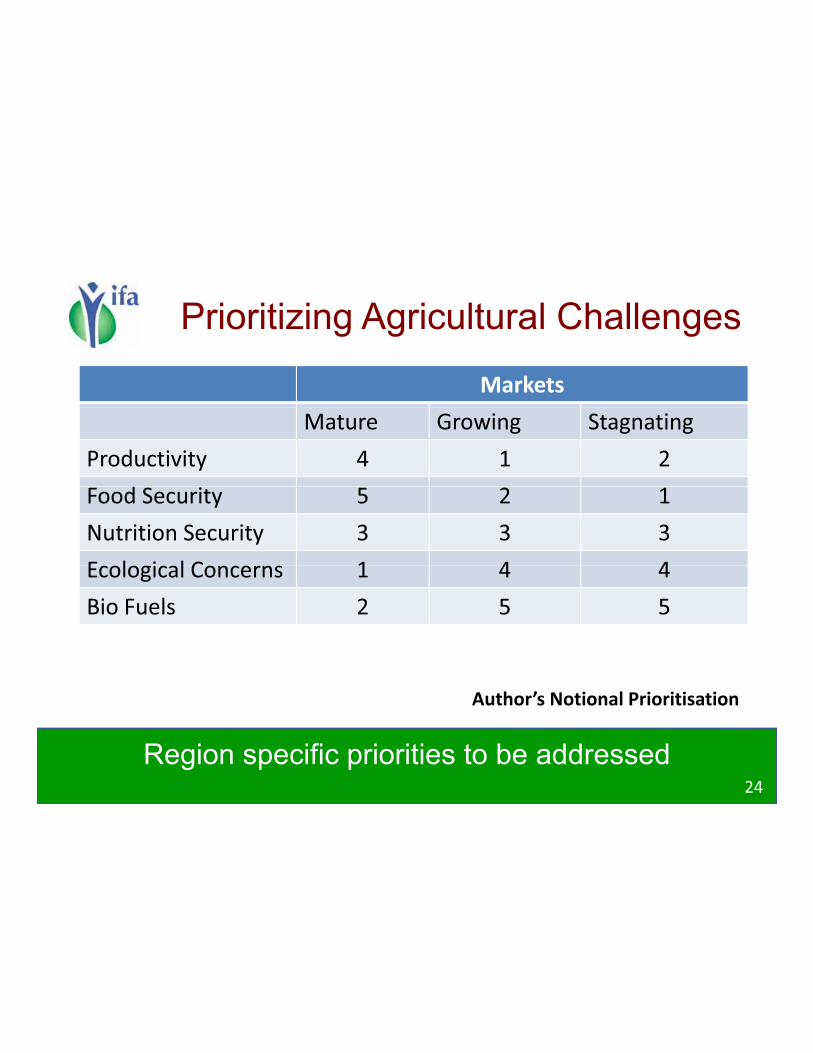
Prioritizing Agricultural ChallengesPrioritizing Agricultural Challenges
Markets
Mature Growing Stagnating
Productivity 4 1 2
Food Security 5 2 1
Nutrition Security 3 3 3
Ecological Concerns 1 4 4Ecological Concerns 1 4 4
Bio Fuels 2 5 5
Author’s Notional Prioritisation
24
Region specific priorities to be addressed

Addressing Challenges – The India Story
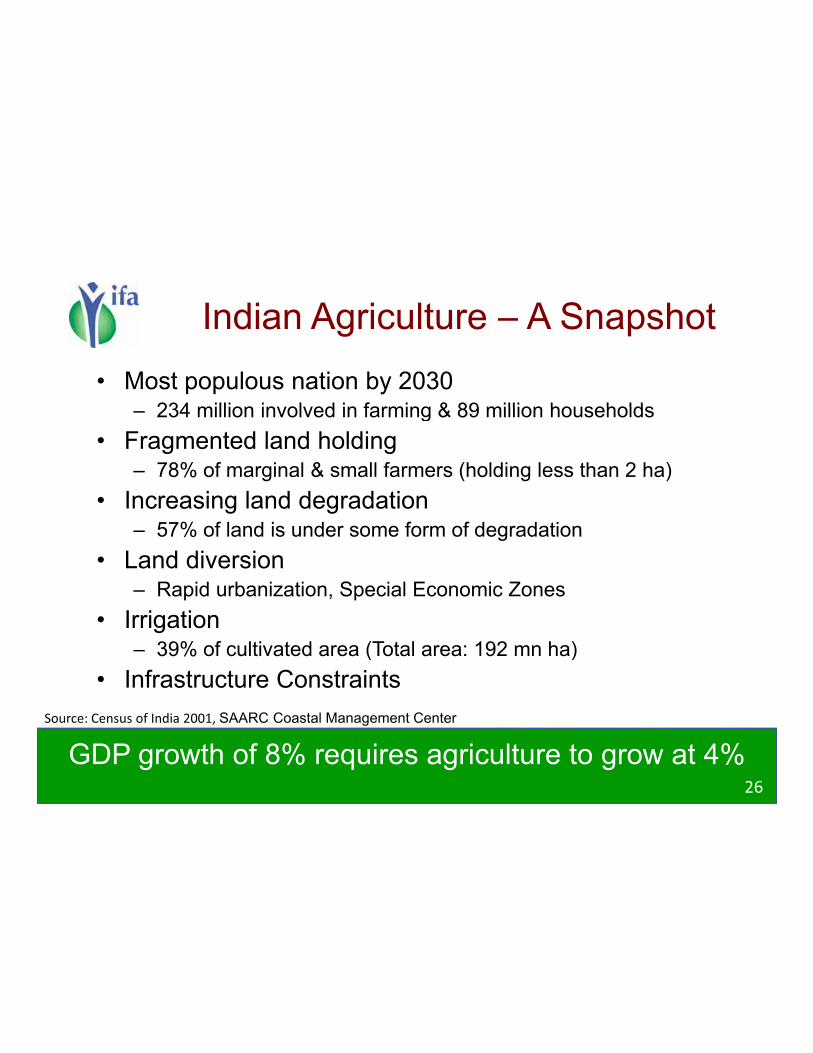
Indian Agriculture – A SnapshotIndian Agriculture A Snapshot
• Most populous nation by 2030234 million involved in farming & 89 million households– 234 million involved in farming & 89 million households
• Fragmented land holding– 78% of marginal & small farmers (holding less than 2 ha)
• Increasing land degradation– 57% of land is under some form of degradation
• Land diversionLand diversion– Rapid urbanization, Special Economic Zones
• Irrigation39% f lti t d (T t l 192 h )– 39% of cultivated area (Total area: 192 mn ha)
• Infrastructure Constraints
Source: Census of India 2001, SAARC Coastal Management Center
26
GDP growth of 8% requires agriculture to grow at 4%
, g
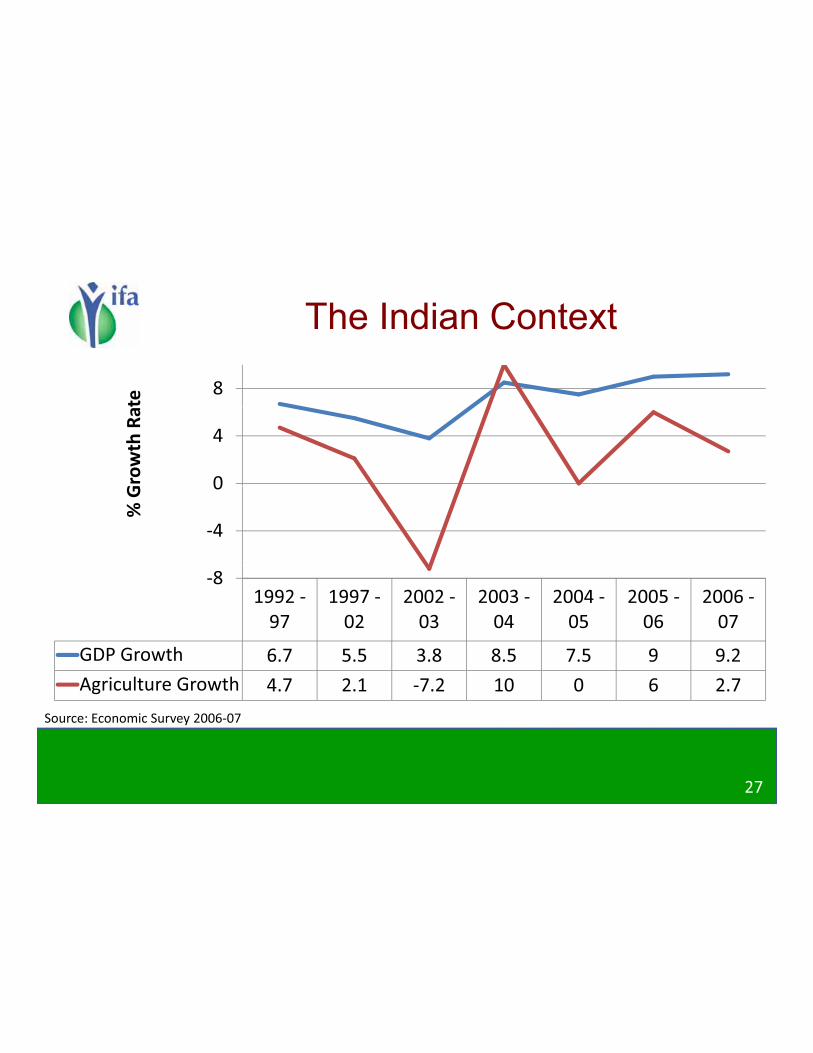
The Indian ContextThe Indian Context
8
te
0
4
Growth
Ra
4
0
%G
1992
97
1997
02
2002
03
2003
04
2004
05
2005
06
2006
07
8
GDP Growth 6.7 5.5 3.8 8.5 7.5 9 9.2
Agriculture Growth 4.7 2.1 7.2 10 0 6 2.7
Source: Economic Survey 2006 07
27
y

The Productivity GapThe Productivity Gap
Current level of productivity
Productivity
requirement to Current level of productivitymeet growing
demand
Source: Ministry of Agriculture & Cooperation, India
28
Rapid productivity growth needed to cater to food requirement
y g p ,

Addressing ChallengesAddressing Challenges
• The response of India has been a mixed bag
• Policy interventions have started recently
– National Food Security Mission 2007
– National Project on Balanced Use of Fertilisers 2007
Mi I i ti T k F 2004– Micro Irrigation Task Force 2004
– National Horticulture Mission 2006
– Promotion of Food Processing / Agri Export Zones 2006– Promotion of Food Processing / Agri Export Zones 2006
– Public Private Partnership Models 2006
29
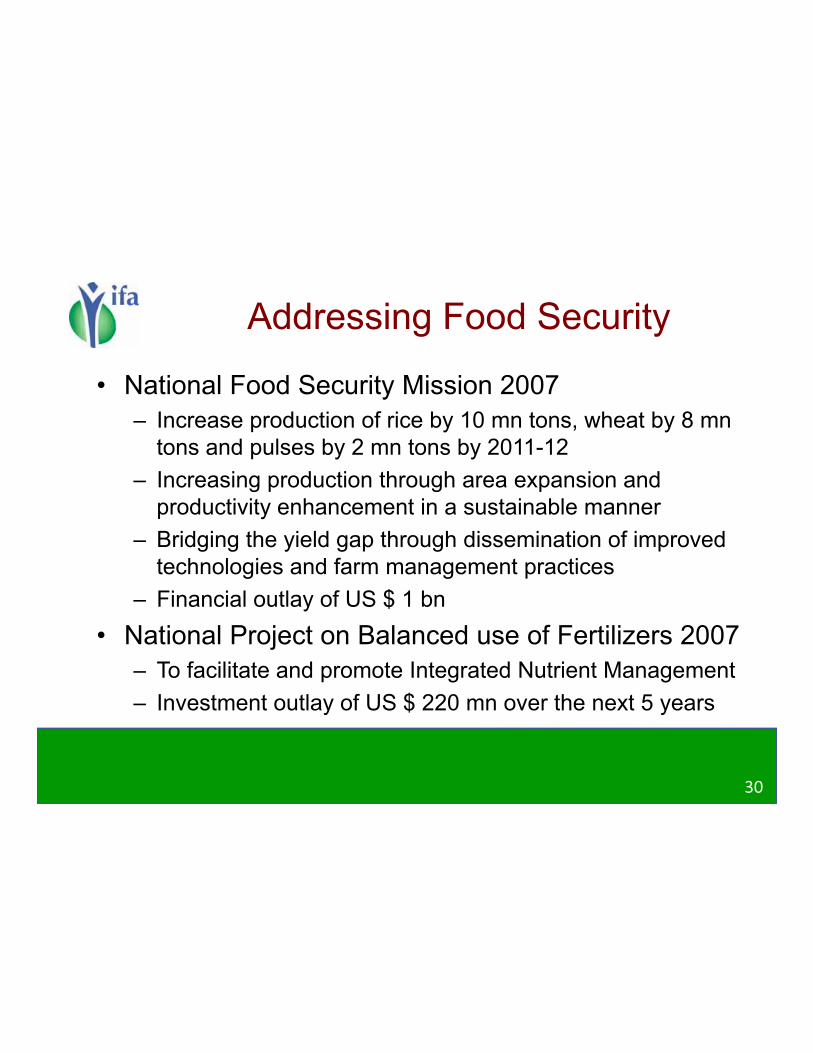
Addressing Food SecurityAddressing Food Security
• National Food Security Mission 2007
– Increase production of rice by 10 mn tons, wheat by 8 mntons and pulses by 2 mn tons by 2011-12
– Increasing production through area expansion andIncreasing production through area expansion andproductivity enhancement in a sustainable manner
– Bridging the yield gap through dissemination of improved technologies and farm management practicestechnologies and farm management practices
– Financial outlay of US $ 1 bn
• National Project on Balanced use of Fertilizers 2007j
– To facilitate and promote Integrated Nutrient Management
– Investment outlay of US $ 220 mn over the next 5 years
30
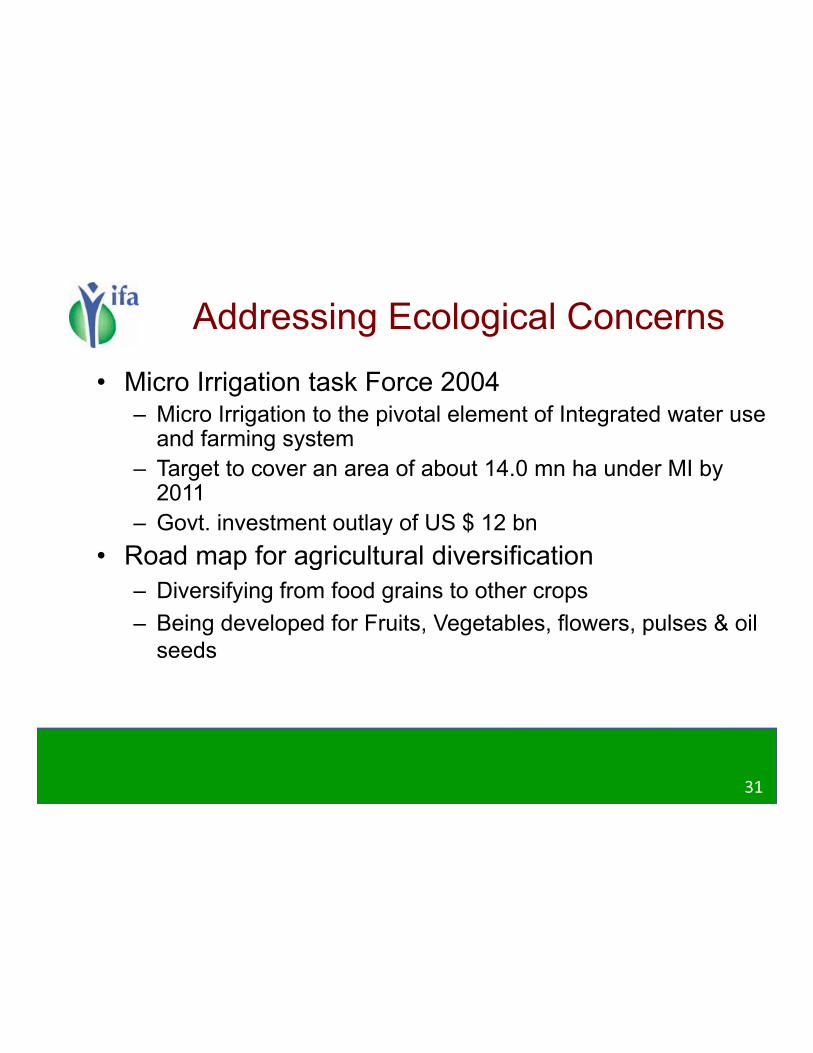
Addressing Ecological ConcernsAddressing Ecological Concerns
• Micro Irrigation task Force 2004Mi I i ti t th i t l l t f I t t d t– Micro Irrigation to the pivotal element of Integrated water use and farming system
– Target to cover an area of about 14.0 mn ha under MI by 20112011
– Govt. investment outlay of US $ 12 bn
• Road map for agricultural diversificationp g
– Diversifying from food grains to other crops
– Being developed for Fruits, Vegetables, flowers, pulses & oil dseeds
31

Addressing Market AccessAddressing Market Access
• Infrastructure DevelopmentNational Highways Development– National Highways Development
– Plans for telecom and power sectors
– Development of inland water ways
N ti l H ti lt Mi i• National Horticulture Mission– End to end approach for forward and backward linkages
– Envisaging Research, Production, Post Harvest management Processing & Marketingmanagement, Processing & Marketing
• Govt. / Private Enterprise for Agricultural Marketing Infrastructure
Pepsi is partnering with Punjab government for farming procurement– Pepsi is partnering with Punjab government for farming, procurementand processing of citrus produce
– Partial dismantling of APMC Act in different states
32

Implications for the Fertilizer IndustryImplications for the Fertilizer Industry
• Most of these initiatives have a far reaching impact on the fertilizer industry
• The Industry needs to understand clearly
– Agricultural challenges
– Opportunities that emerge from these challenges
33
F tili D d D i & E iFertilizer Demand Drivers & EmergingOpportunities
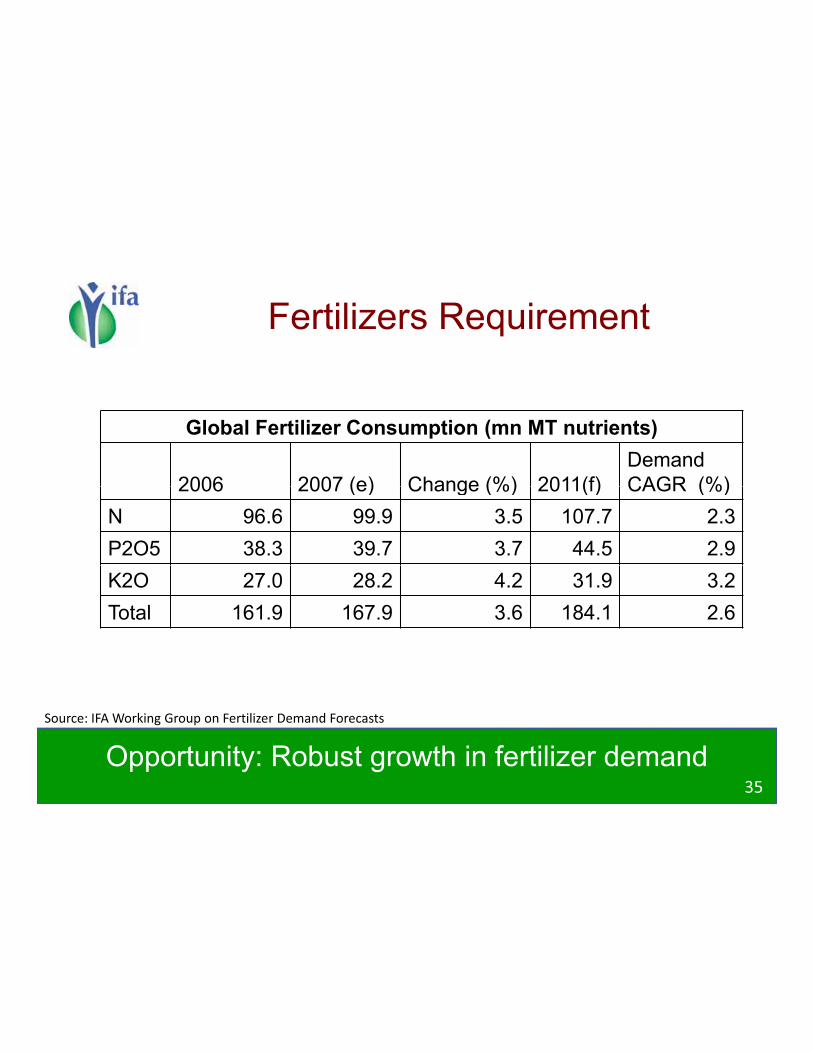
Fertilizers RequirementFertilizers Requirement
Global Fertilizer Consumption (mn MT nutrients)
2006 2007 (e) Change (%) 2011(f)DemandCAGR (%)2006 2007 (e) Change (%) 2011(f) CAGR (%)
N 96.6 99.9 3.5 107.7 2.3
P2O5 38.3 39.7 3.7 44.5 2.9
K2O 27.0 28.2 4.2 31.9 3.2
Total 161.9 167.9 3.6 184.1 2.6
Source: IFA Working Group on Fertilizer Demand Forecasts
35
Opportunity: Robust growth in fertilizer demand
g p

Fertilizers (N+P+K) RequirementFertilizers (N P K) Requirement
E Europe & C Asia
Oceania2006
W Asia
Africa
E Europe & C Asia 2011
N A i
L America & Carribean
W & C Europe
E Asia
S Asia
N America
0 20 40 60 80
Source: IFA Working Group on Fertilizer Demand Forecasts
36
Opportunity: Huge demand in developing countries
g p

Fertilizers & ProductivityFertilizers & Productivity
Country Nutrient
Consumption
N:P:K Yield (ton / ha)
p
kg / ha Rice Wheat Maize Potato
Australia 46.0 3.9 : 4.3 : 1 8.4 1.6 5.6 3.6
Bangladesh 188.6 6.8 : 1.6 : 1 3.6 1.9 5.1 14.4
Brazil 171.9 0.6 : 0.8: 1 3.6 2.0 3.4 20.5
China 275.1 5.3: 2.1 : 1 6.3 4.2 5.1 15.6China 275.1 5.3: 2.1 : 1 6.3 4.2 5.1 15.6
France 215.9 2.5 : 0.8 : 1 5.7 7.6 9.0 45.4
India 104.7 6.9 : 2.6 : 1 3.1 2.7 2.0 17.9
USA 122.4 2.4 : 0.9 : 1 7.8 2.9 10.1 43.8
World 105.5 3.4 : 1.4 : 1 4.0 2.9 4.9 17.4
Source: Fertiliser Statistics 2005-06; Fertiliser Association of India
37
;
Opportunity: Correcting consumption skew
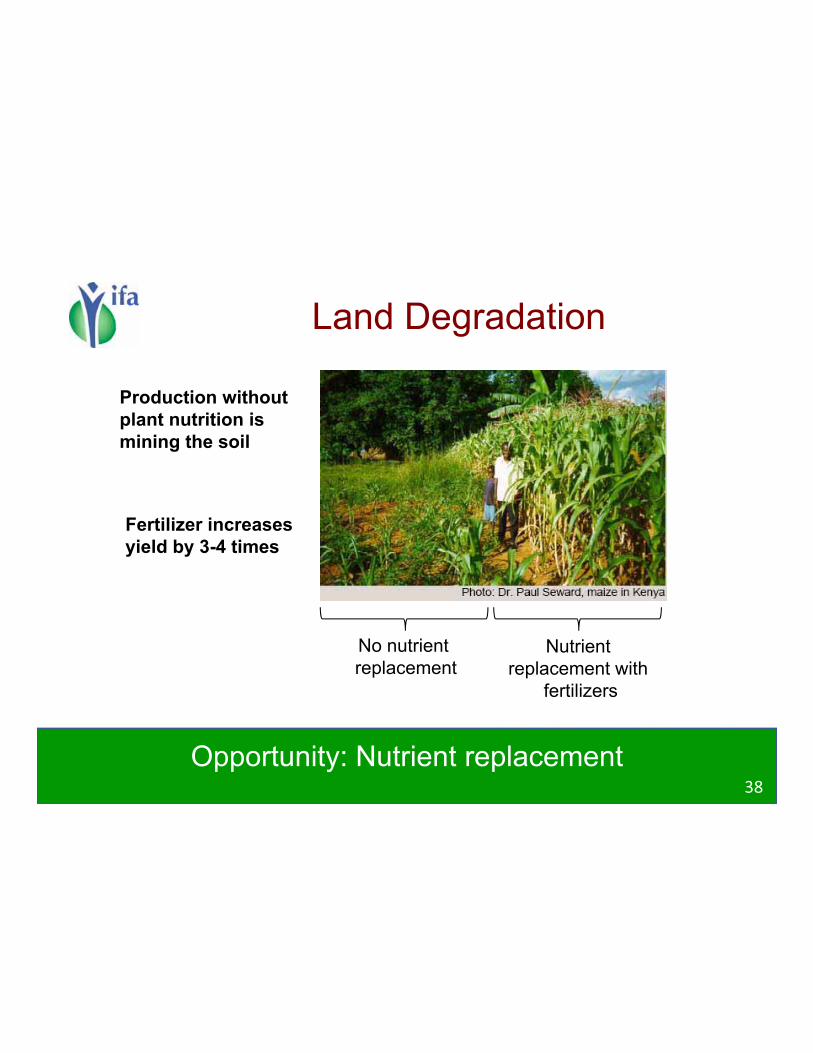
Land DegradationLand Degradation
Production without
plant nutrition is
mining the soil
Fertilizer increases
yield by 3-4 times
NutrientNo nutrient Nutrientreplacement with
fertilizers
No nutrientreplacement
38
Opportunity: Nutrient replacement
Stewardship Role of Fertilizer Industry

Ever-Green revolutionEver Green revolution
“What nations with small farms and resource poor farmers need is the enhancement of productivity in
t it ith t i t d l i l i lperpetuity, without associated ecological or socialharm. The green revolution should become an ever green revolution rooted in the principles ofever-green revolution rooted in the principles of
ecology, economics and social and gender equity.”
M S Swaminathan
“Father of Economic Ecology”
40
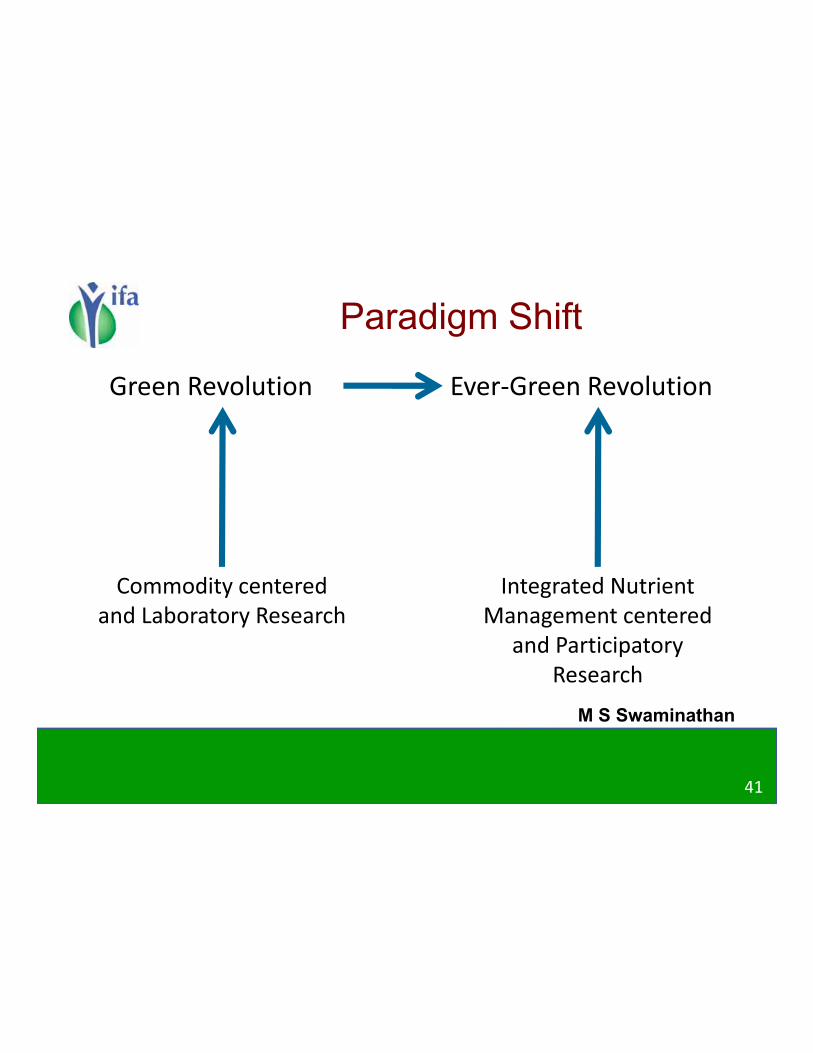
Paradigm ShiftParadigm Shift
Green Revolution Ever Green Revolution
Commodity centered
and Laboratory Research
Integrated Nutrient
Management centered
and Participatoryand Participatory
Research
M S Swaminathan
41

Call for Action 1: FBMPsCall for Action 1: FBMPs
Soil testingRight Rate
Application timingRight Time
Soil TestingRight Product
Soil testingYield goal analysisCrop removal balanceNutrient management
pp gControlled-releasetechnologiesInhibitors
gN, P, K, secondary and micronutrientsEnhanced efficiency Nutrient management
planningPlant tissue analysisA li t lib ti
InhibitorsFertilizer product choice
Right Place
Enhanced efficiency fertilizersNutrient management plans
Applicator calibrationCrop scoutingRecord keeping
Application methodIncorporation of fertilizerB ff t i
Right Place
Source: CFI
Variable rate technologySite-specific management
Buffer stripsConservation tillageCover cropping
42
Maximising yields & profitability; minimising impact on environment

Call for Action 2: Nutrition Security
50% f ld l il
y
• Micronutrient deficiencies are widespread
– 50% of world cereal soilsare deficient in zinc; 30% of global cultivated area is deficient in iron
• Direct impact on crop and human well-being
– Zinc, boron and selenium can be effectively supplied through fertilization
– Eliminating micronutrient deficiencies could improve GDP by 5%, worker productivity by 30% - 70% and reduce maternal deaths by 50% (World Bank)
43
Opportunity: Improving human nutrition through effective fertilization

Call for Action 3: Conservation
• Balanced fertility – increased nutrient use
efficiency
– less likelihood of nutrient loss to the environment due to leaching and/or runoff
Source: The Broadbalk Experiment atSource: The Broadbalk Experiment at
Rothamsted Research (UK)
44
Efficient use of fertilizers & other nutrient sources is key
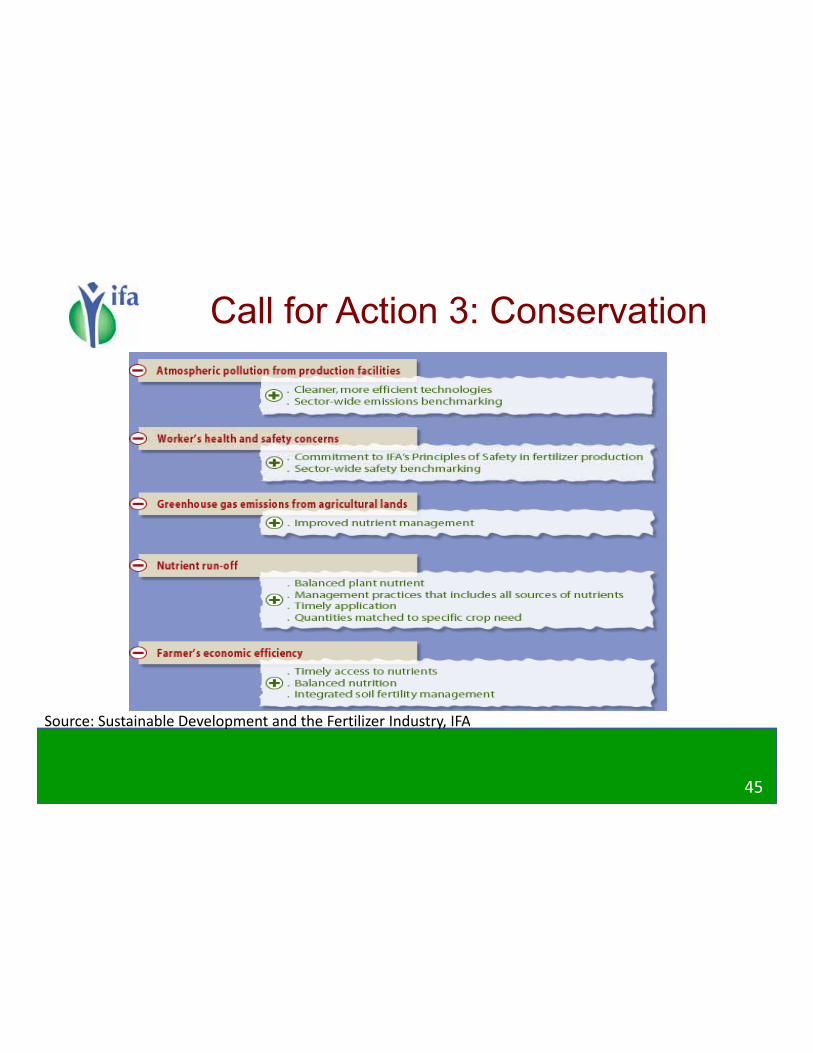
Call for Action 3: Conservation
Source: Sustainable Development and the Fertilizer Industry IFA
45
Source: Sustainable Development and the Fertilizer Industry, IFA

Call for Action 4: Innovation
• More research– Products with improved
efficiency
– Adapted to specific conditions in developing countries / new cropping patterns
• Adoption of existing innovations– Focus on last mile deliveryFocus on last mile delivery
Source: "Fertilizer Requirements in 2015 and 2030" FAO, Rome. 2000
46

Call for Action 5: CollaborationCall for Action 5: Collaboration
• Collaborative approach for enabling environmentPolicy framework for adoption of FBMPs– Policy framework for adoption of FBMPs
– Partnerships for ensuring widespread adoption of appropriate micro nutrients
– Extension services for effective knowledge transfer– Extension services for effective knowledge transfer
• Many countries around the world are introducing policies and legislation that impact the fertilizer industryindustry– Policy change can have wide reaching effects on fertilizer
production and distribution– Stakeholders in the food chain need to stay abreast of global– Stakeholders in the food chain need to stay abreast of global
and local trends, as well as policies and current thinking - not only in the fertilizer industry, but also across the agricultural sector as a whole.
47
Fertilizer industry as a responsible stakeholder

Inevitably, these challenges have to be
dd daddressed.
Can the fertilizer industry take the lead?y
48

IFA Vision 2027 – Moving BeyondIFA Vision 2027 Moving Beyond
• Placing human well-being back at the centre of agricultural policies;agricultural policies;
• Achieving food security for all nations;
• Eradicating micronutrient deficiencies;Eradicating micronutrient deficiencies;
• Focusing attention on adequate, balanced nutrition as the foundation for a long, healthy and productive life;
• Halting and reversing soil degradation;
• Producing bio-energy;
F t i t hi b t• Fostering partnerships betweenfarmers, consumers, governments and scientists in pursuit of these aims
49
Ever-Green revolutionEver Green revolution
“We need a second green revolution, to address the needs of the Third World's poor: a focus on increasingneeds of the Third World s poor: a focus on increasing
productivity from small farms on marginal land with low-input agricultural methods. These technologies, which include financial and political components, may be the key to satisfying the land hunger of the disadvantaged and the desperate who are slashing daily into the rain forest of Amazonia. It may also be the key to arresting the desertification of sub Saharan Africa where humanthe desertification of sub-Saharan Africa, where human
need and climate stress now operate in a deadly partnership.”
Al GoreEarth’s fate is the No. 1 National Security Issue,
Washington Post, October 2007
50