global equity benchmarks: are prospectus … the funds’ relative performance. customized...
TRANSCRIPT
The buck stops here: Vanguard money market funds
1 We defined the term global as an investment mandate without borders or concentration. The term international excludes the fund’s domicile from the opportunity set.
Global equity benchmarks: Are prospectus benchmarks the correct barometer?
Joshua M. Hirt; Ravi G. Tolani; Christopher B. Philips, CFA
Vanguard Research July 2015
■ Around the world, both global and international1 active equity fund managers use a wide variety of benchmarks for measuring their mutual funds’ performance.
■ In many cases, the benchmark selected by an investment manager as a proxy for a specific fund’s performance (that is, the prospectus benchmark) may not be the best reflection of the manager’s actual investing style.
■ In particular, Vanguard’s recent analysis of global equity funds in five unique domiciles suggests that a significant subset of the funds we observed displayed enduring exposure tilts, most distinctly toward emerging-market securities.
■ This analysis found that key performance metrics of these funds deteriorated when we compared them to our customized benchmarks derived from returns-based style analysis.
2 This paper mirrors the methodology and analysis used with U.S. bond funds in previous Vanguard research (Bosse, Wimmer, and Philips, 2013).
When evaluating an active fund or manager’s performance, investors often assume that the fund’s prospectus benchmark accurately reflects the goals, risk posture, and opportunity set of the fund or manager’s investment mandate. After all, a benchmark that reasonably matches a fund’s objectives is the best way to accurately determine if a manager is skillful or has merely benefited from exposure to other risk factors. This is important because performance is often a critical input in selecting a fund to add to a portfolio. Odds are high that when two funds are evaluated side by side, an investor will select the one with the better track record. But what if the higher performance is the result of the fund’s exposure to higher-risk assets and not manager skill? Such knowledge would prove useful in determining whether the fund truly can be considered to complement an investor’s existing lineup over the long term, and whether the higher expenses of active management are justified.
In a recent analysis of active global, international, and emerging-market equity funds and their benchmarks, we asked three simple questions: “How representative are the benchmarks of their global equity mandates?” Can we observe any enduring investment biases relative to those benchmarks?” and “Does comparative performance change if we adjust for these biases?”
Our analysis reviewed the experience of global, international, and emerging-market equity mandates across five unique regions: the United States, Canada, the United Kingdom, Australia, and Hong Kong. Through regression-based analysis, we first looked at a fund’s alignment compared with that of its stated benchmark. We then focused on how investment biases may affect fund returns. (To develop an investment strategy, managers can explicitly draw on numerous existing biases, or factors, such as size—targeting companies of a certain market cap, that is, large-, small-, and mid-cap; value or growth—companies of certain valuation thresholds; volatility—companies exhibiting low share-price volatility; and region—companies in a particular region—to name only a few.) Our study focused specifically on the appearance of regional and size biases. To do this, we identified a fund’s best-fit (that is, customized) benchmark based on five non-overlapping global market segments (North America: large-/mid-cap; Europe: large-/mid-; Pacific: large-/mid-; emerging markets: large-/mid-; and global small-cap). We then analyzed fund-performance characteristics using the stated and customized benchmarks to evaluate the effects and implications of global investment opportunities2 (for perspective on style analysis as a tool, see the box, “Assigning an active fund a customized blend of benchmarks,” on page 3).
2
Notes on risk: Past performance is not a guarantee of future results. The performance of an index is not an exact representation of any particular investment, as you cannot invest directly in an index. All investments are subject to risk, including possible loss of principal. Diversification does not ensure a profit or protect against a loss in a declining market. Investments in securities issued by non-U.S. companies are subject to risks including country-regional risk and currency risk. These risks are especially high in emerging markets.
3 In general, the more highly correlated a fund’s returns are with a given style index, the greater the weighting that index is given in the customized benchmark.
3
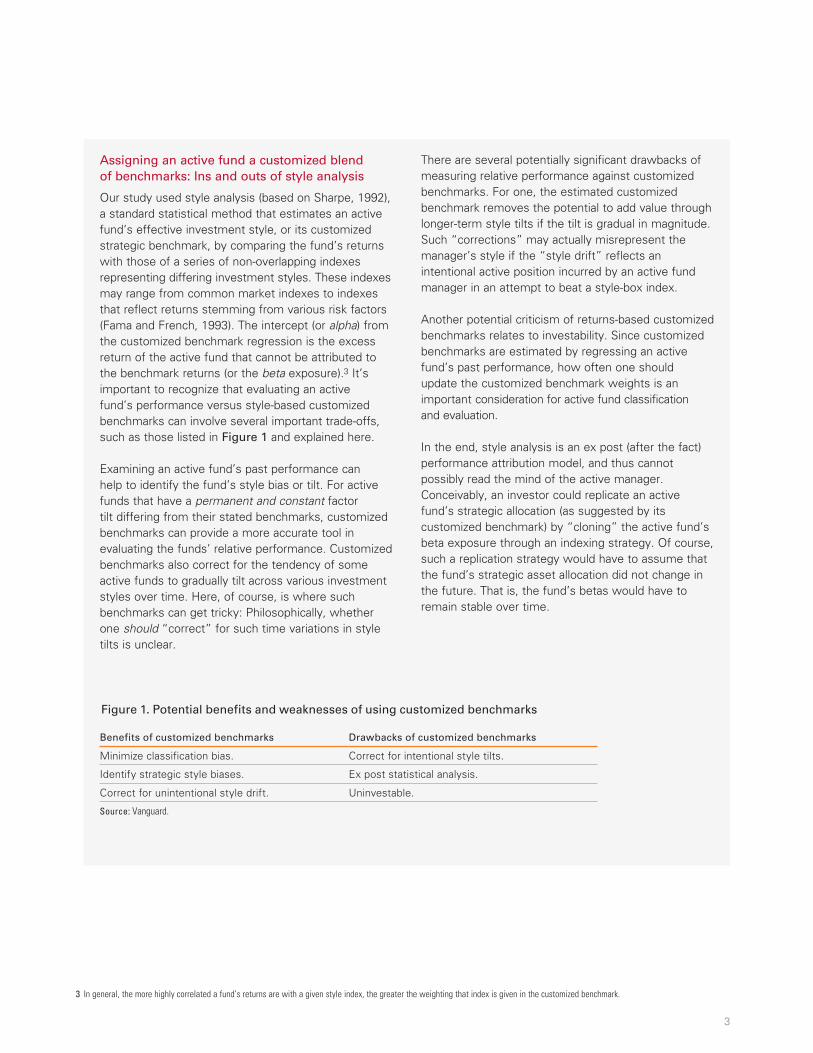
Assigning an active fund a customized blend of benchmarks: Ins and outs of style analysis
Our study used style analysis (based on Sharpe, 1992), a standard statistical method that estimates an active fund’s effective investment style, or its customized strategic benchmark, by comparing the fund’s returns with those of a series of non-overlapping indexes representing differing investment styles. These indexes may range from common market indexes to indexes that reflect returns stemming from various risk factors (Fama and French, 1993). The intercept (or alpha) from the customized benchmark regression is the excess return of the active fund that cannot be attributed to the benchmark returns (or the beta exposure).3 It’s important to recognize that evaluating an active fund’s performance versus style-based customized benchmarks can involve several important trade-offs, such as those listed in Figure 1 and explained here.
Examining an active fund’s past performance can help to identify the fund’s style bias or tilt. For active funds that have a permanent and constant factor tilt differing from their stated benchmarks, customized benchmarks can provide a more accurate tool in evaluating the funds’ relative performance. Customized benchmarks also correct for the tendency of some active funds to gradually tilt across various investment styles over time. Here, of course, is where such benchmarks can get tricky: Philosophically, whether one should “correct” for such time variations in style tilts is unclear.
There are several potentially significant drawbacks of measuring relative performance against customized benchmarks. For one, the estimated customized benchmark removes the potential to add value through longer-term style tilts if the tilt is gradual in magnitude. Such “corrections” may actually misrepresent the manager’s style if the “style drift” reflects an intentional active position incurred by an active fund manager in an attempt to beat a style-box index.
Another potential criticism of returns-based customized benchmarks relates to investability. Since customized benchmarks are estimated by regressing an active fund’s past performance, how often one should update the customized benchmark weights is an important consideration for active fund classification and evaluation.
In the end, style analysis is an ex post (after the fact) performance attribution model, and thus cannot possibly read the mind of the active manager. Conceivably, an investor could replicate an active fund’s strategic allocation (as suggested by its customized benchmark) by “cloning” the active fund’s beta exposure through an indexing strategy. Of course, such a replication strategy would have to assume that the fund’s strategic asset allocation did not change in the future. That is, the fund’s betas would have to remain stable over time.
Figure 1. Potential benefits and weaknesses of using customized benchmarks
Benefits of customized benchmarks Drawbacks of customized benchmarks
Minimize classification bias. Correct for intentional style tilts.
Identify strategic style biases. Ex post statistical analysis.
Correct for unintentional style drift. Uninvestable.
Source: Vanguard.
4 We acknowledge that this methodology introduces survivorship bias; however, our study aimed to determine the impact of benchmark selection on performance results, not to explicitly evaluate the success of an investor selecting a winning fund or manager.
5 Actual percentages for each region’s universe were: United States, 75%; Canada, 88%; United Kingdom, 70%; Australia, 92%; Hong Kong, 77%.
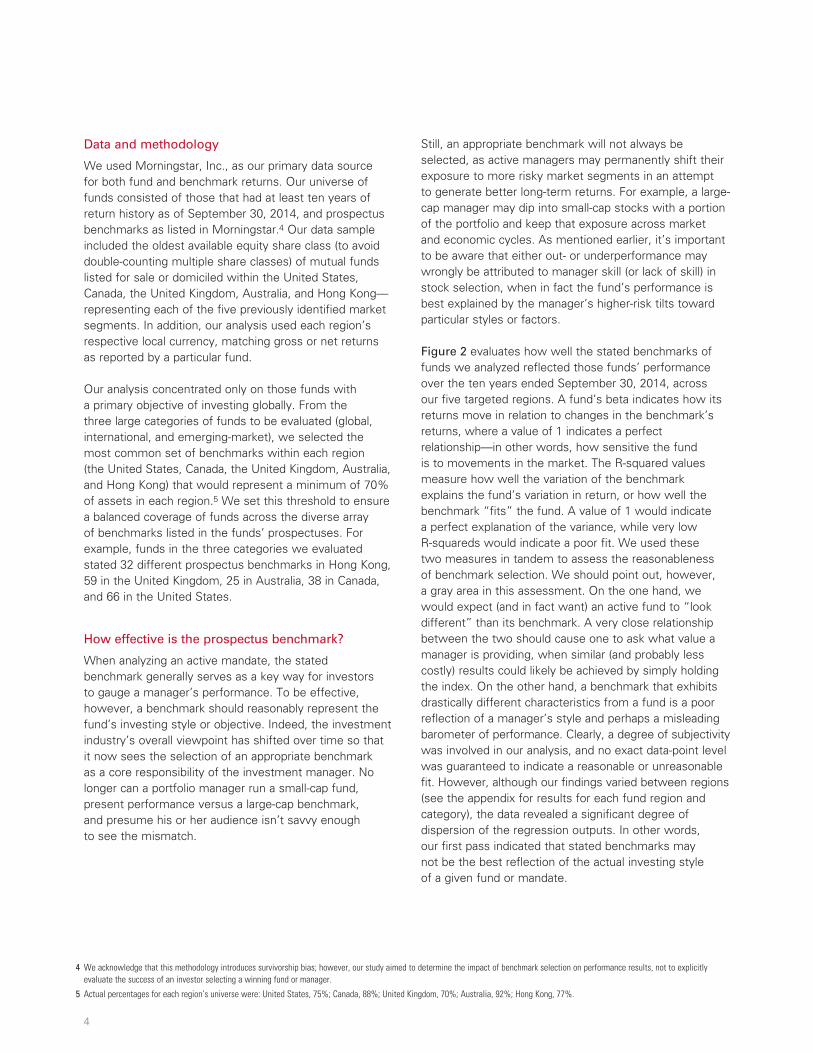
Data and methodology
We used Morningstar, Inc., as our primary data source for both fund and benchmark returns. Our universe of funds consisted of those that had at least ten years of return history as of September 30, 2014, and prospectus benchmarks as listed in Morningstar.4 Our data sample included the oldest available equity share class (to avoid double-counting multiple share classes) of mutual funds listed for sale or domiciled within the United States, Canada, the United Kingdom, Australia, and Hong Kong—representing each of the five previously identified market segments. In addition, our analysis used each region’s respective local currency, matching gross or net returns as reported by a particular fund.
Our analysis concentrated only on those funds with a primary objective of investing globally. From the three large categories of funds to be evaluated (global, international, and emerging-market), we selected the most common set of benchmarks within each region (the United States, Canada, the United Kingdom, Australia, and Hong Kong) that would represent a minimum of 70% of assets in each region.5 We set this threshold to ensure a balanced coverage of funds across the diverse array of benchmarks listed in the funds’ prospectuses. For example, funds in the three categories we evaluated stated 32 different prospectus benchmarks in Hong Kong, 59 in the United Kingdom, 25 in Australia, 38 in Canada, and 66 in the United States.
How effective is the prospectus benchmark?
When analyzing an active mandate, the stated benchmark generally serves as a key way for investors to gauge a manager’s performance. To be effective, however, a bench mark should reasonably represent the fund’s investing style or objective. Indeed, the investment industry’s overall viewpoint has shifted over time so that it now sees the selection of an appropriate benchmark as a core responsibility of the investment manager. No longer can a portfolio manager run a small-cap fund, present performance versus a large-cap benchmark, and presume his or her audience isn’t savvy enough to see the mismatch.
Still, an appropriate benchmark will not always be selected, as active managers may permanently shift their exposure to more risky market segments in an attempt to generate better long-term returns. For example, a large-cap manager may dip into small-cap stocks with a portion of the portfolio and keep that exposure across market and economic cycles. As mentioned earlier, it’s important to be aware that either out- or underperformance may wrongly be attributed to manager skill (or lack of skill) in stock selection, when in fact the fund’s performance is best explained by the manager’s higher-risk tilts toward particular styles or factors.
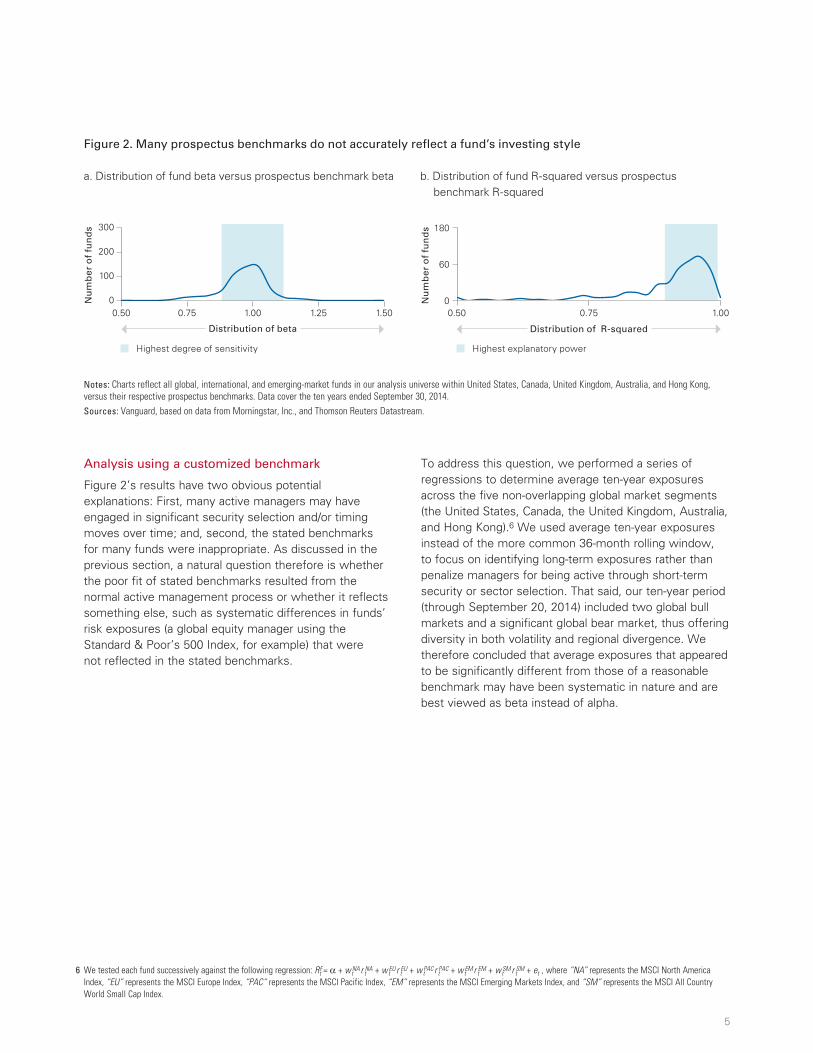
Figure 2 evaluates how well the stated benchmarks of funds we analyzed reflected those funds’ performance over the ten years ended September 30, 2014, across our five targeted regions. A fund’s beta indicates how its returns move in relation to changes in the benchmark’s returns, where a value of 1 indicates a perfect relationship—in other words, how sensitive the fund is to movements in the market. The R-squared values measure how well the variation of the benchmark explains the fund’s variation in return, or how well the benchmark “fits” the fund. A value of 1 would indicate a perfect explanation of the variance, while very low R-squareds would indicate a poor fit. We used these two measures in tandem to assess the reasonableness of benchmark selection. We should point out, however, a gray area in this assessment. On the one hand, we would expect (and in fact want) an active fund to “look different” than its benchmark. A very close relationship between the two should cause one to ask what value a manager is providing, when similar (and probably less costly) results could likely be achieved by simply holding the index. On the other hand, a benchmark that exhibits drastically different characteristics from a fund is a poor reflection of a manager’s style and perhaps a misleading barometer of performance. Clearly, a degree of subjectivity was involved in our analysis, and no exact data-point level was guaranteed to indicate a reasonable or unreasonable fit. However, although our findings varied between regions (see the appendix for results for each fund region and category), the data revealed a significant degree of dispersion of the regression outputs. In other words, our first pass indicated that stated benchmarks may not be the best reflection of the actual investing style of a given fund or mandate.
4
6 We tested each fund successively against the following regression: RFt = α + wt
NA r tNA + wt
EU r tEU + wt
PAC r tPAC + wt
EM r tEM + wt
SM r tSM + et , where “NA” represents the MSCI North America
Index, “EU” represents the MSCI Europe Index, “PAC” represents the MSCI Pacific Index, “EM” represents the MSCI Emerging Markets Index, and “SM” represents the MSCI All Country World Small Cap Index.
Analysis using a customized benchmark
Figure 2’s results have two obvious potential explanations: First, many active managers may have engaged in significant security selection and/or timing moves over time; and, second, the stated benchmarks for many funds were inappropriate. As discussed in the previous section, a natural question therefore is whether the poor fit of stated benchmarks resulted from the normal active management process or whether it reflects something else, such as systematic differences in funds’ risk exposures (a global equity manager using the Standard & Poor’s 500 Index, for example) that were not reflected in the stated benchmarks.
To address this question, we performed a series of regressions to determine average ten-year exposures across the five non-overlapping global market segments (the United States, Canada, the United Kingdom, Australia, and Hong Kong).6 We used average ten-year exposures instead of the more common 36-month rolling window, to focus on identifying long-term exposures rather than penalize managers for being active through short-term security or sector selection. That said, our ten-year period (through September 20, 2014) included two global bull markets and a significant global bear market, thus offering diversity in both volatility and regional divergence. We therefore concluded that average exposures that appeared to be significantly different from those of a reasonable benchmark may have been systematic in nature and are best viewed as beta instead of alpha.
5
Figure 2. Many prospectus benchmarks do not accurately reflect a fund’s investing style
a. Distribution of fund beta versus prospectus benchmark beta b. Distribution of fund R-squared versus prospectus benchmark R-squared
Notes: Charts reflect all global, international, and emerging-market funds in our analysis universe within United States, Canada, United Kingdom, Australia, and Hong Kong, versus their respective prospectus benchmarks. Data cover the ten years ended September 30, 2014.Sources: Vanguard, based on data from Morningstar, Inc., and Thomson Reuters Datastream.
0
60
180
Nu
mb
er o
f fu
nd
s
Nu
mb
er o
f fu
nd
s
Highest degree of sensitivity Highest explanatory power
0
100
200
300
0.50 1.50 0.50 1.00
Distribution of beta Distribution of R-squared
0.75 1.00 1.25 0.75
7 For exposure weights of international and emerging-market funds, see appendix Figure A-2.
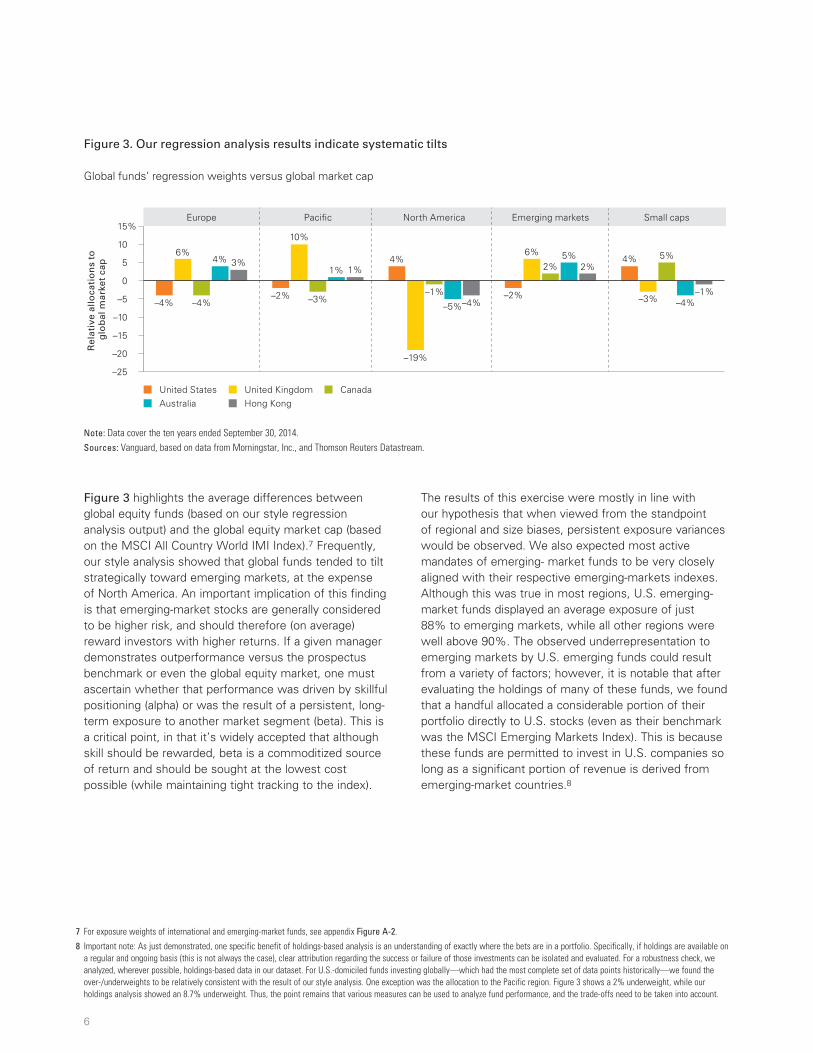
8 Important note: As just demonstrated, one specific benefit of holdings-based analysis is an understanding of exactly where the bets are in a portfolio. Specifically, if holdings are available on a regular and ongoing basis (this is not always the case), clear attribution regarding the success or failure of those investments can be isolated and evaluated. For a robustness check, we analyzed, wherever possible, holdings-based data in our dataset. For U.S.-domiciled funds investing globally—which had the most complete set of data points historically—we found the over-/underweights to be relatively consistent with the result of our style analysis. One exception was the allocation to the Pacific region. Figure 3 shows a 2% underweight, while our holdings analysis showed an 8.7% underweight. Thus, the point remains that various measures can be used to analyze fund performance, and the trade-offs need to be taken into account.
Figure 3 highlights the average differences between global equity funds (based on our style regression analysis output) and the global equity market cap (based on the MSCI All Country World IMI Index).7 Frequently, our style analysis showed that global funds tended to tilt strategically toward emerging markets, at the expense of North America. An important implication of this finding is that emerging-market stocks are generally considered to be higher risk, and should therefore (on average) reward investors with higher returns. If a given manager demonstrates outperformance versus the prospectus benchmark or even the global equity market, one must ascertain whether that performance was driven by skillful positioning (alpha) or was the result of a persistent, long-term exposure to another market segment (beta). This is a critical point, in that it’s widely accepted that although skill should be rewarded, beta is a commoditized source of return and should be sought at the lowest cost possible (while maintaining tight tracking to the index).
The results of this exercise were mostly in line with our hypothesis that when viewed from the standpoint of regional and size biases, persistent exposure variances would be observed. We also expected most active mandates of emerging- market funds to be very closely aligned with their respective emerging-markets indexes. Although this was true in most regions, U.S. emerging-market funds displayed an average exposure of just 88% to emerging markets, while all other regions were well above 90%. The observed underrepresentation to emerging markets by U.S. emerging funds could result from a variety of factors; however, it is notable that after evaluating the holdings of many of these funds, we found that a handful allocated a considerable portion of their portfolio directly to U.S. stocks (even as their benchmark was the MSCI Emerging Markets Index). This is because these funds are permitted to invest in U.S. companies so long as a significant portion of revenue is derived from emerging-market countries.8
6
Figure 3. Our regression analysis results indicate systematic tilts
Global funds’ regression weights versus global market cap
Note: Data cover the ten years ended September 30, 2014.Sources: Vanguard, based on data from Morningstar, Inc., and Thomson Reuters Datastream.
Rel
ativ
e al
loca
tio
ns
to
glo
bal
mar
ket
cap
–25
–20
–15
–10
–5
0
5
10
15%
United States United Kingdom CanadaAustralia
Europe Paci�c North America Emerging markets Small caps
Hong Kong
6%
–4% –4%
4% 3%
–2%
10%
–3%
1% 1%4%
–19%
–1%
–5%–4%–2%
6%
2%5%
2%4%
–3%
5%
–4%–1%

9 Increases in R-squared across regions and categories were: United States—global (10% increase), international (15% increase), emerging markets (45% increase); Canada—global (12% increase), international (13% increase), emerging markets (no change); United Kingdom—global (13% increase), emerging markets (no change); Australia—global (11% increase); Hong Kong—global (9% increase), emerging markets (84% increase).
Based on the output from the regressions, we then created a customized benchmark for each fund. Using these benchmarks, we replicated the analysis in Figure 2 to compare the beta and R-squared of each fund with the new benchmark (see Figure 4). Although not a perfect match across all funds and regions, we found these customized benchmarks to be generally more representative of the fund’s allocation (i.e., the results were less dispersed) for the ten-year period analyzed. Compared with prospectus benchmarks, the number of funds with an R-squared between 0.9 and 1.0 increased across all categories and regions, with the greatest improvement occurring in emerging-markets funds in which the R-squared increased 32%, on average.9 That said, a few funds—particularly in Canada and Australia—remained widely dispersed.
Performance evaluation versus customized benchmarks
Investors often prefer to use index funds for their large-cap equity exposure, while seeking active management for very broad or narrow mandates. For example, it’s frequently assumed that one’s stock selection of U.S. and European large-cap companies should be indexed, whereas global, small-cap, and emerging-market equities should be actively managed. Among emerging markets and smaller companies, the common view is that these markets are less efficient and that therefore active managers stand a better chance of adding value. And within broad global mandates, investors often hold that an active manager can not only engage in security selection but can implement country, regional, and currency bets as well. Over time, the thought is that these managers can alter those exposures to take advantage of changing dynamics and trends in the global marketplace. In other words, it can seem only natural to choose active management to exploit these opportunities.
7
Figure 4. Customized benchmarks better represented a fund’s style
a. Distribution of fund beta versus prospectus b. Distribution of fund R-squared versus prospectus and customized benchmarks and customized benchmarks
Notes: Charts reflect all global, international, and emerging-market funds in our analysis universe within United States, Canada, United Kingdom, Australia, and Hong Kong, versus both their respective prospectus and customized benchmarks as based on style analysis. Data cover the ten years ended September 30, 2014.Sources: Vanguard, based on data from Morningstar, Inc., and Thomson Reuters Datastream.
0.50 1.50 0.50 1.000
100
200
300
0
60
180
Versus prospectus betaVersus customized beta
Versus prospectus R-squaredVersus customized R-squared
Nu
mb
er o
f fu
nd
s
Distribution of beta
Nu
mb
er o
f fu
nd
s
Distribution of R-squared
0.75 1.00 1.25 0.75
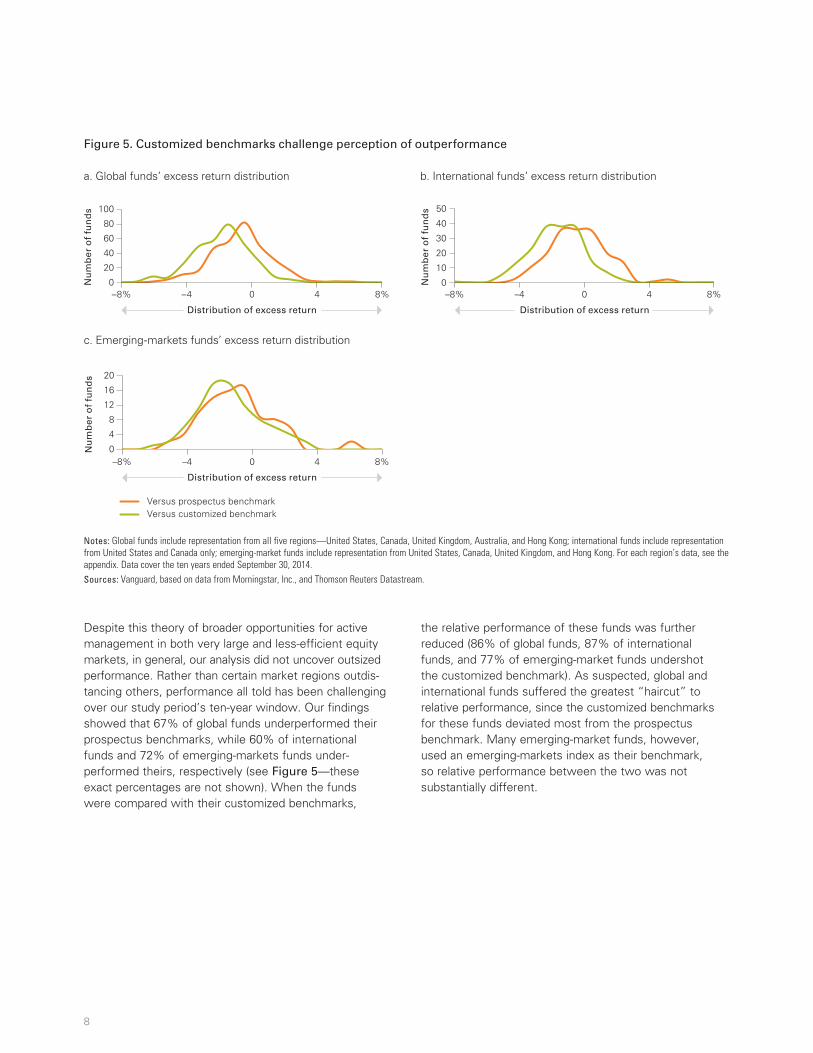
Despite this theory of broader opportunities for active management in both very large and less-efficient equity markets, in general, our analysis did not uncover outsized performance. Rather than certain market regions outdis-tancing others, performance all told has been challenging over our study period’s ten-year window. Our findings showed that 67% of global funds underper formed their prospectus benchmarks, while 60% of international funds and 72% of emerging-markets funds under-performed theirs, respectively (see Figure 5—these exact percentages are not shown). When the funds were compared with their customized benchmarks,
the relative performance of these funds was further reduced (86% of global funds, 87% of international funds, and 77% of emerging-market funds undershot the customized benchmark). As suspected, global and international funds suffered the greatest “haircut” to relative performance, since the customized benchmarks for these funds deviated most from the prospectus benchmark. Many emerging-market funds, however, used an emerging-markets index as their benchmark, so relative performance between the two was not substantially different.
8
Figure 5. Customized benchmarks challenge perception of outperformance
a. Global funds’ excess return distribution b. International funds’ excess return distribution
Notes: Global funds include representation from all five regions—United States, Canada, United Kingdom, Australia, and Hong Kong; international funds include representation from United States and Canada only; emerging-market funds include representation from United States, Canada, United Kingdom, and Hong Kong. For each region’s data, see the appendix. Data cover the ten years ended September 30, 2014. Sources: Vanguard, based on data from Morningstar, Inc., and Thomson Reuters Datastream.
4
8
12
16
20
0
10
20
30
40
50
0
20
40
60
80
100
–8% –4 0 4 8%
Nu
mb
er o
f fu
nd
s
Distribution of excess return
0
20
40
60
80
100
–8% –4 0 4 8%
Nu
mb
er o
f fu
nd
s
Distribution of excess return
0
10
20
30
40
50
–8% –4 0 4 8%
Versus prospectus benchmarkVersus customized benchmark
Nu
mb
er o
f fu
nd
s
Distribution of excess return
4
8
12
16
20
0
4
8
12
16
20
0
10
20
30
40
50
0
20
40
60
80
100
–8% –4 0 4 8%
Nu
mb
er o
f fu
nd
s
Distribution of excess return
0
20
40
60
80
100
–8% –4 0 4 8%
Nu
mb
er o
f fu
nd
s
Distribution of excess return
0
10
20
30
40
50
–8% –4 0 4 8%
Versus prospectus benchmarkVersus customized benchmark
Nu
mb
er o
f fu
nd
s
Distribution of excess return
4
8
12
16
20
0
c. Emerging-markets funds’ excess return distribution
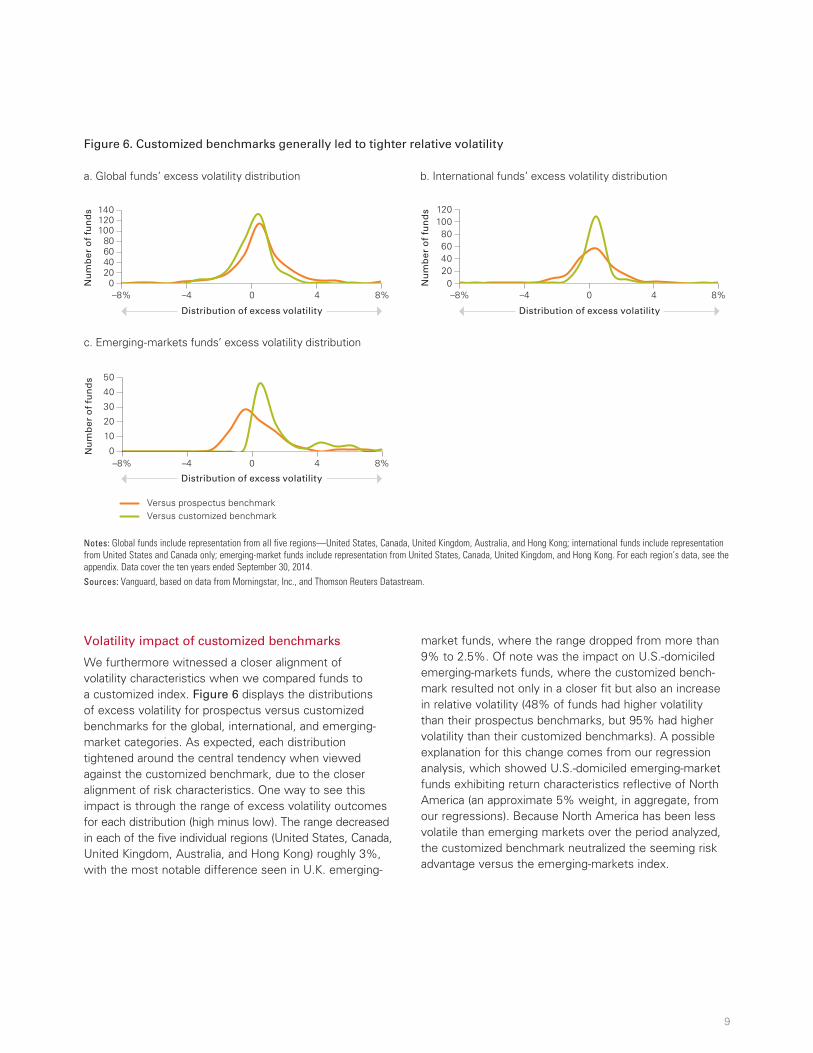
Volatility impact of customized benchmarks
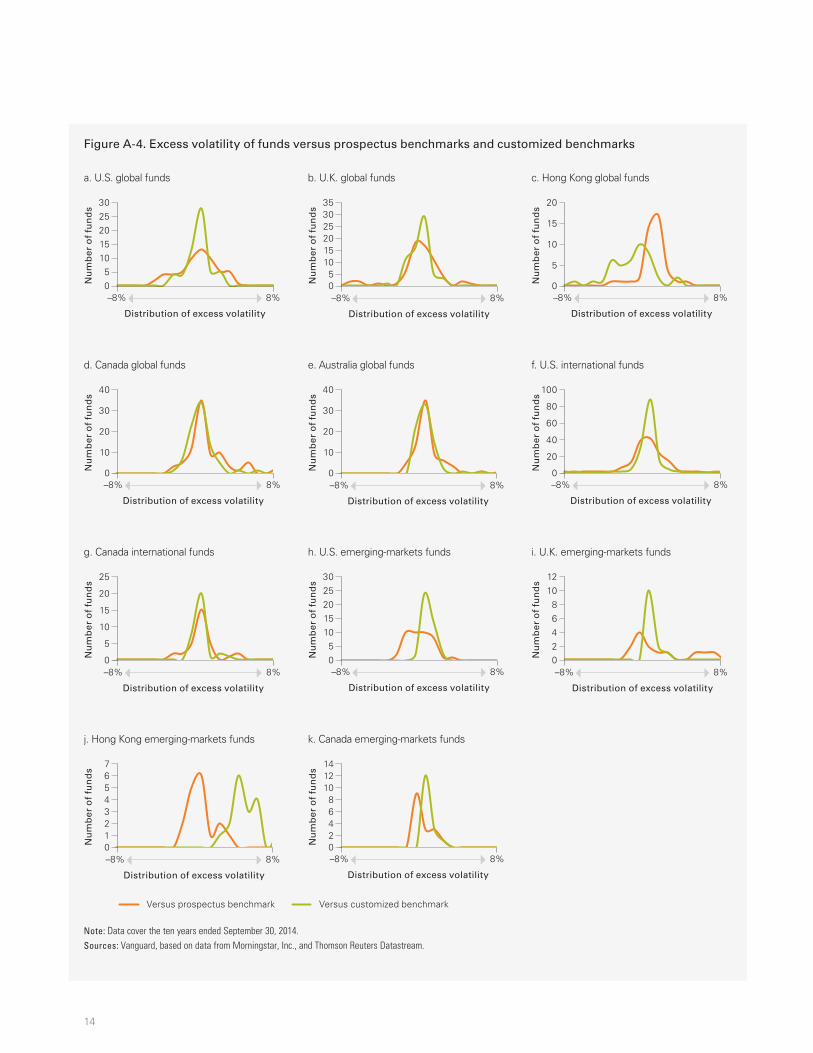
We furthermore witnessed a closer alignment of volatility characteristics when we compared funds to a customized index. Figure 6 displays the distributions of excess volatility for prospectus versus customized benchmarks for the global, international, and emerging-market categories. As expected, each distribution tightened around the central tendency when viewed against the customized benchmark, due to the closer alignment of risk characteristics. One way to see this impact is through the range of excess volatility outcomes for each distribution (high minus low). The range decreased in each of the five individual regions (United States, Canada, United Kingdom, Australia, and Hong Kong) roughly 3%, with the most notable difference seen in U.K. emerging-
market funds, where the range dropped from more than 9% to 2.5%. Of note was the impact on U.S.-domiciled emerging-markets funds, where the customized bench-mark resulted not only in a closer fit but also an increase in relative volatility (48% of funds had higher volatility than their prospectus benchmarks, but 95% had higher volatility than their customized benchmarks). A possible explanation for this change comes from our regression analysis, which showed U.S.-domiciled emerging-market funds exhibiting return characteristics reflective of North America (an approximate 5% weight, in aggregate, from our regressions). Because North America has been less volatile than emerging markets over the period analyzed, the customized benchmark neutralized the seeming risk advantage versus the emerging-markets index.
9
Figure 6. Customized benchmarks generally led to tighter relative volatility
a. Global funds’ excess volatility distribution b. International funds’ excess volatility distribution
Notes: Global funds include representation from all five regions—United States, Canada, United Kingdom, Australia, and Hong Kong; international funds include representation from United States and Canada only; emerging-market funds include representation from United States, Canada, United Kingdom, and Hong Kong. For each region’s data, see the appendix. Data cover the ten years ended September 30, 2014. Sources: Vanguard, based on data from Morningstar, Inc., and Thomson Reuters Datastream.
–8% –4 0 4 8% –8% –4 0 4 8%
Nu
mb
er o
f fu
nd
s
Distribution of excess volatility
020406080
140
Nu
mb
er o
f fu
nd
s
Distribution of excess volatility
020406080
120
–8% 8%
Versus prospectus benchmarkVersus customized benchmark
Nu
mb
er o
f fu
nd
s
10
20
30
40
50
0
100100
–4 0 4
Distribution of excess volatility
120
c. Emerging-markets funds’ excess volatility distribution
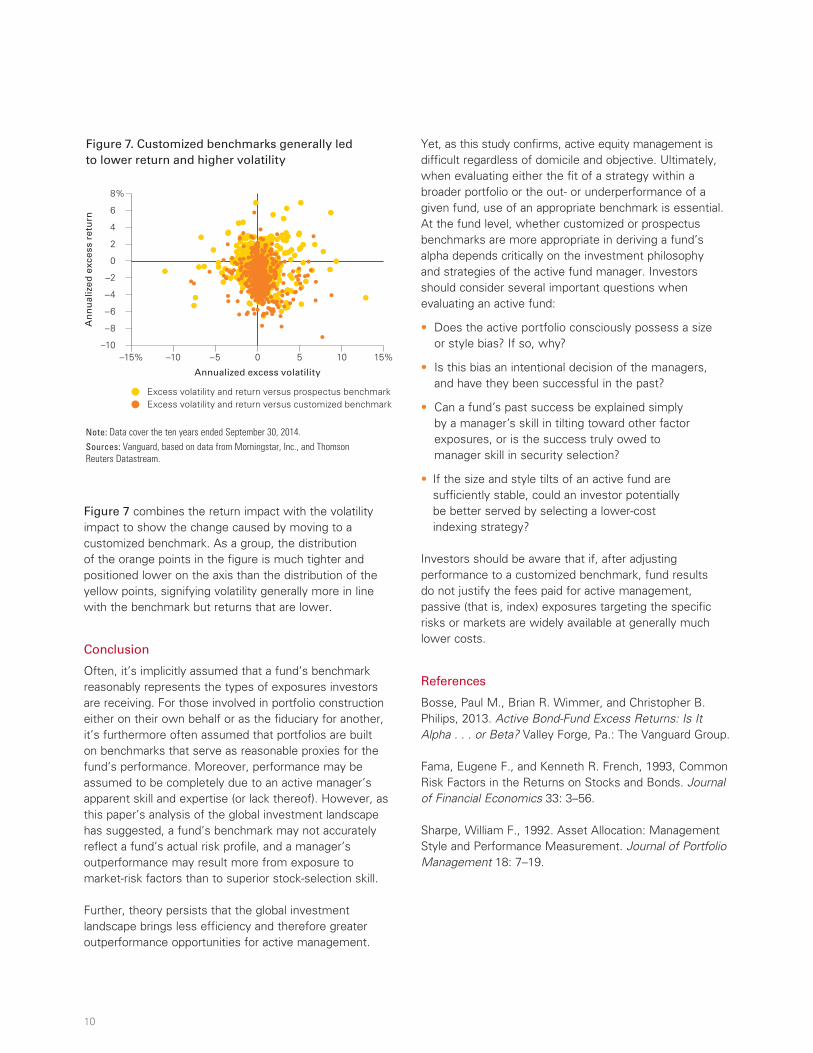
Figure 7 combines the return impact with the volatility impact to show the change caused by moving to a customized benchmark. As a group, the distribution of the orange points in the figure is much tighter and positioned lower on the axis than the distribution of the yellow points, signifying volatility generally more in line with the benchmark but returns that are lower.
Conclusion
Often, it’s implicitly assumed that a fund’s benchmark reasonably represents the types of exposures investors are receiving. For those involved in portfolio construction either on their own behalf or as the fiduciary for another, it’s furthermore often assumed that portfolios are built on benchmarks that serve as reasonable proxies for the fund’s performance. Moreover, performance may be assumed to be completely due to an active manager’s apparent skill and expertise (or lack thereof). However, as this paper’s analysis of the global investment landscape has suggested, a fund’s benchmark may not accurately reflect a fund’s actual risk profile, and a manager’s outperformance may result more from exposure to market-risk factors than to superior stock-selection skill.
Further, theory persists that the global investment landscape brings less efficiency and therefore greater outperformance opportunities for active management.
Yet, as this study confirms, active equity management is difficult regardless of domicile and objective. Ultimately, when evaluating either the fit of a strategy within a broader portfolio or the out- or underperformance of a given fund, use of an appropriate benchmark is essential. At the fund level, whether customized or prospectus benchmarks are more appropriate in deriving a fund’s alpha depends critically on the investment philosophy and strategies of the active fund manager. Investors should consider several important questions when evaluating an active fund:
• Does the active portfolio consciously possess a size or style bias? If so, why?
• Is this bias an intentional decision of the managers, and have they been successful in the past?
• Can a fund’s past success be explained simply by a manager’s skill in tilting toward other factor exposures, or is the success truly owed to manager skill in security selection?
• If the size and style tilts of an active fund are sufficiently stable, could an investor potentially be better served by selecting a lower-cost indexing strategy?
Investors should be aware that if, after adjusting performance to a customized benchmark, fund results do not justify the fees paid for active management, passive (that is, index) exposures targeting the specific risks or markets are widely available at generally much lower costs.
References
Bosse, Paul M., Brian R. Wimmer, and Christopher B. Philips, 2013. Active Bond-Fund Excess Returns: Is It Alpha . . . or Beta? Valley Forge, Pa.: The Vanguard Group.
Fama, Eugene F., and Kenneth R. French, 1993, Common Risk Factors in the Returns on Stocks and Bonds. Journal of Financial Economics 33: 3–56.
Sharpe, William F., 1992. Asset Allocation: Management Style and Performance Measurement. Journal of Portfolio Management 18: 7–19.
10
Figure 7. Customized benchmarks generally led to lower return and higher volatility
Note: Data cover the ten years ended September 30, 2014.Sources: Vanguard, based on data from Morningstar, Inc., and Thomson Reuters Datastream.
An
nu
aliz
ed e
xces
s re
turn
Annualized excess volatility
–10
–8
0
6
8%
–15%
–6
–4
–2
2
4
–10 –5 0 5 10 15%
Excess volatility and return versus prospectus benchmarkExcess volatility and return versus customized benchmark

11
Appendix. Study results for global, international, and emerging-market categories and individual regions
Figure A-1. Improved relationship between R-squared and beta after adjusting benchmarks across regions
Note: Data cover the ten years ended September 30, 2014.Sources: Vanguard, based on data from Morningstar, Inc., and Thomson Reuters Datastream.
a. U.S. global funds b. U.K. global funds c. Hong Kong global funds
R-squared
0
0.4
0.8
1.0
1.2
0.2
0.6
0 0.5 1.0 1.5
Beta
R-squared
0
0.4
0.8
1.0
1.2
0.2
0.6
0 0.5 1.0 1.5
Beta
R-squared
0
0.4
0.8
1.0
1.2
0.2
0.6
0 0.5 1.0 1.5
Beta
d. Canada global funds e. Australia global funds f. U.S. international funds
R-squared
0
0.4
0.8
1.0
1.2
0.2
0.6
0 0.5 1.0 1.5
Beta
R-squared
0
0.4
0.8
1.0
1.2
0.2
0.6
0 0.5 1.5 2.0
Beta
R-squared
0
0.4
0.8
1.0
1.2
0.2
0.6
0 0.5 1.0 1.5
Beta
g. Canada international funds h. U.S. emerging markets funds i. U.K. emerging markets funds
R-squared
0
0.4
0.8
1.0
1.2
0.2
0.6
0 0.5 1.0 1.5
Beta
R-squared
0
0.4
0.8
1.0
1.2
0.2
0.6
Beta
R-squared
Beta
j. Hong Kong emerging markets funds k. Canada emerging markets funds
R-squared
0
0.4
0.8
1.0
1.2
0.2
0.6
Beta Beta
Versus prospectus benchmark Versus customized benchmark
R-squared
0 0.4 0.8 1.20.2 0.6 1.0
0 0.4 0.8 1.20.2 0.6 1.0
1.0
0
0.4
0.8
1.0
1.2
0.2
0.6
0 0.4 0.8 1.20.2 0.6 1.0
0
0.4
0.8
1.0
1.2
0.2
0.6
0 0.4 0.8 1.20.2 0.6 1.0

Paci�cEuropeNorth America Small caps Emerging markets
a. Global funds
Paci�cEuropeNorth America Small caps Emerging markets
b. International funds
Paci�cEuropeNorth America Small caps Emerging markets
c. Emerging-markets funds
United States United Kingdom CanadaAustralia Hong Kong
0
20
40
60
80
100%
Perc
enta
ge o
f po
rtfo
lio
0
20
40
60
80
100%
Perc
enta
ge o
f po
rtfo
lio
0
20
40
60
80
100%
Perc
enta
ge o
f po
rtfo
lio
12
Figure A-2. Ten-year average fund exposures across regional mandates
Notes: No international funds in Australia, the United Kingdom, or Hong Kong met our methodology criteria (see text description, on page 4). Similarly, no emerging-market funds in Australia met our criteria. Data cover the ten years ended September 30, 2014.Sources: Vanguard, based on data from Morningstar, Inc., and Thomson Reuters Datastream.

13
Figure A-3. Distribution of funds’ excess returns versus prospectus benchmarks and customized benchmarks
Note: Data cover the ten years ended September 30, 2014.Sources: Vanguard, based on data from Morningstar, Inc., and Thomson Reuters Datastream.
Versus prospectus benchmark Versus customized benchmark
h. U.S. emerging-markets funds
Nu
mb
er o
f fu
nd
s
02468
1210
–8% 8%
Distribution of excess return
k. Canada emerging-markets funds
Nu
mb
er o
f fu
nd
s
01234
65
–8% 8%
Distribution of excess return
f. U.S. international funds
Nu
mb
er o
f fu
nd
s
0
10
20
30
40
–8% 8%
Distribution of excess return
Nu
mb
er o
f fu
nd
s
0
1
2
3
4
5
–8% 8%
Distribution of excess return
i. U.K. emerging-markets funds
j. Hong Kong emerging-markets funds
Nu
mb
er o
f fu
nd
s
01234
7
56
–8% 8%
Distribution of excess return
g. Canada international funds
Nu
mb
er o
f fu
nd
s
02468
1210
–8% 8%
Distribution of excess return
a. U.S. global funds
Nu
mb
er o
f fu
nd
s
0369
12
1815
–8% 8%
Distribution of excess return
c. Hong Kong global funds
Nu
mb
er o
f fu
nd
s
0369
12
1815
–8% 8%
Distribution of excess return
d. Canada global funds
Nu
mb
er o
f fu
nd
s
0
5
10
15
20
25
–8% 8%
Distribution of excess return
b. U.K. global funds
Nu
mb
er o
f fu
nd
s
0
5
10
15
20
25
–8% 8%
Distribution of excess return
e. Australia global funds
Nu
mb
er o
f fu
nd
s
0369
12
1815
–8% 8%
Distribution of excess return
14
Figure A-4. Excess volatility of funds versus prospectus benchmarks and customized benchmarks
Note: Data cover the ten years ended September 30, 2014.Sources: Vanguard, based on data from Morningstar, Inc., and Thomson Reuters Datastream.
Versus prospectus benchmark Versus customized benchmark
h. U.S. emerging-markets funds
Nu
mb
er o
f fu
nd
s
05
101520
3025
–8% 8%
Distribution of excess volatility
k. Canada emerging-markets funds
Nu
mb
er o
f fu
nd
s
02468
14
1012
–8% 8%
Distribution of excess volatility
f. U.S. international funds
Nu
mb
er o
f fu
nd
s
0
20
40
60
100
80
–8% 8%
Distribution of excess volatility
i. U.K. emerging-markets funds
Nu
mb
er o
f fu
nd
s
02468
1210
–8% 8%
Distribution of excess volatility
j. Hong Kong emerging-markets funds
Nu
mb
er o
f fu
nd
s
01234
7
56
–8% 8%
Distribution of excess volatility
g. Canada international funds
Nu
mb
er o
f fu
nd
s
0
5
10
15
20
25
–8% 8%
Distribution of excess volatility
a. U.S. global funds
Nu
mb
er o
f fu
nd
s
05
101520
3025
–8% 8%
Distribution of excess volatility
c. Hong Kong global funds
Nu
mb
er o
f fu
nd
s
0
5
10
15
20
–8% 8%
Distribution of excess volatility
d. Canada global funds
Nu
mb
er o
f fu
nd
s
0
10
20
30
40
–8% 8%
Distribution of excess volatility
b. U.K. global funds
Nu
mb
er o
f fu
nd
s
05
1015
25
35
20
30
–8% 8%
Distribution of excess volatility
e. Australia global funds
Nu
mb
er o
f fu
nd
s
0
10
20
30
40
–8% 8%
Distribution of excess volatility

Vanguard Research
P.O. Box 2600 Valley Forge, PA 19482-2600
© 2015 The Vanguard Group, Inc. All rights reserved. Vanguard Marketing Corporation, Distributor.
ISGGEBP 072015
Connect with Vanguard® > vanguard.com
For more information about Vanguard funds, visit vanguard.com or call 800-662-2739 to obtain a prospectus. Investment objectives, risks, charges, expenses, and other important information about a fund are contained in the prospectus; read and consider it carefully before investing.
CFA® is a registered trademark owned by CFA Institute.