global equity adr - harding loevner...bonds directly, a step to which it committed in march to...
TRANSCRIPT

GLOBAL EQUITY ADR2020 Second Quarter Report
2020 Second Quarter Report | 1
Sector and geographic allocations are supplemental information only and complement the fully compliant Global Equity ADR Composite GIPS Presentation.
Source: Harding Loevner Global Equity ADR Model; MSCI Inc. and S&P. MSCI Inc. and S&P do not make any express or implied warranties or representations and shall have no liability whatsoever with respect to any GICS data contained herein.
Listen to the Global Equity ADR quarterly review
View other reports at hardingloevner.com/library
Market Review ›
Global markets rebounded sharply in the second quarter as countries emerged from COVID-19 lockdowns and economic data showed signs of a fledgling recovery.
Performance and Attribution ›
Sources of relative return by region and sector.
Perspective and Outlook ›
As the fastest-growing companies hit new highs, it is hard to tell whether the crisis has merely brought forward growth or expanded their addressable market.
Portfolio Highlights ›
Transactions reflect a resolutely bottom-up approach to focusing on companies whose prospects have either been temporarily dented or structurally improved.
Portfolio Holdings ›
Information about the companies held in our portfolio.
Portfolio Facts ›
Contributors, detractors, characteristics, andcompleted transactions.
ONLINE SUPPLEMENTS
WHAT'S INSIDE
1The Composite performance returns shown are preliminary; 2Annualized Returns; 3Inception Date: November 30, 1989 corresponds to that of the linked Global Equity Composite; 4The Benchmark Index; 5Gross of withholding taxes; 6Supplemental Index.
Please read the above performance in conjunction with the footnotes on the last page of this report. Past performance does not guarantee future results. All performance and data shown are in US dollar terms, unless otherwise noted.
COMPOSITE PERFORMANCE (% TOTAL RETURN) FOR PERIODS ENDED JUNE 30, 20201
3 MONTHS YTD 1 YEAR 3 YEARS2 5 YEARS2 10 YEARS2 SINCE INCEPTION2,3
HL GLOBAL EQUITY ADR (GROSS OF FEES) 25.86 3.34 11.73 10.46 10.86 11.81 9.53
HL GLOBAL EQUITY ADR (NET OF FEES) 25.63 2.90 10.81 9.55 9.96 10.91 8.64
MSCI ALL COUNTRY WORLD INDEX4,5 19.39 -5.99 2.64 6.69 7.03 9.73 6.97
MSCI WORLD INDEX5,6 19.54 -5.48 3.40 7.28 7.49 10.56 7.06
(UNDER) / OVER THE BENCHMARK
GEOGRAPHIC EXPOSURE (%)
7Includes countries in less-developed markets outside the Index.
HL GADR MSCI ACWI
EMERGING MARKETS 14.9 12.2
CASH 2.6 —
EUROPE EX-EMU 9.3 8.3
UNITED STATES 58.4 57.6
FRONTIER MARKETS7 0.0 —
MIDDLE EAST 0.0 0.2
JAPAN 6.2 7.0
PACIFIC EX-JAPAN 2.3 3.2
EUROPE EMU 6.3 8.8
CANADA 0.0 2.7
(8.0) (4.0) 0.0 4.0 8.0
(UNDER) / OVER THE BENCHMARK
SECTOR EXPOSURE (%)
HL GADR MSCI ACWI
HEALTH CARE 19.0 12.9
CASH 2.6 —
INDUSTRIALS 12.0 9.4
COMM SERVICES 11.7 9.4
MATERIALS 5.7 4.6
INFO TECHNOLOGY 21.5 20.7
FINANCIALS 13.0 13.4
ENERGY 1.6 3.6
CONS STAPLES 5.5 8.1
REAL ESTATE 0.0 2.9
UTILITIES 0.0 3.2
CONS DISCRETIONARY 7.4 11.8
(8.0) (4.0) 0.0 4.0 8.0

2
sectoral gains mirror the declines from the first quarter. Rather, investors maintained a preference for presumed COVID-19 ben-eficiaries over challenged sectors like Financials, Energy, and Real Estate—and anything travel-related. Information Tech-nology (IT) was again one of the top-performing sectors, with strong returns from both software and hardware stocks. IT has outperformed the overall index by a staggering 1800 basis points for the half year. Consumer Discretionary also did well, helped by e-commerce giants like Amazon.com and eBay, who are ben-efiting from the abrupt shift to greater online shopping. Mate-rials stocks rose with the recovery in certain commodity metal prices. While the oil price war between Russia and Saudi Arabia eased, Energy underperformed slightly, as the industry struggled with collapsing demand. Financials lagged again this quarter, weighed down by looming but as-yet-unknowable defaults, and with revenues depressed by the low interest rate environment.
By geography, the US, Canada, the eurozone, and Pacific ex-Japan (led by Australia, which rebounded with the recovery in commodity prices) performed the best among the major re-gions. The strong returns in the US were once again led by its large IT sector. Many Emerging Market countries outper-formed, partially rebounding from the savage declines of last
MARKET REVIEW
Global markets rebounded sharply in the second quarter follow-ing the precipitous COVID-induced decline in March. Though still elevated relative to the start of the year, equity market volatility fell considerably, and credit spreads narrowed. The market recovery was broad based, with all regions and sectors finishing in positive territory.
As countries emerged from lockdowns, new economic data showed signs of a fledgling recovery. Business activity re-mained weak, but many indicators—unemployment, consumer spending, and service and manufacturing surveys—bounced off the troughs witnessed in April. Despite record coronavi-rus cases in many countries, including the United States and much of Latin America, apparent progress on a vaccine further boosted sentiment.
Economies and stock markets continued to benefit from ex-traordinary fiscal and monetary support, especially in devel-oped markets. Governments in aggregate introduced an ad-ditional US$3 trillion in fiscal stimulus during the quarter to combat weak economic conditions, bumping up the total since the outbreak began to about US$11 trillion, according to the International Monetary Fund (IMF). The US, Japan, and Eu-rope boosted direct cash transfers to citizens and China dusted off its battle-tested financial-crisis playbook, funneling funds to local governments for infrastructure spending. As a result, global governmental debt as a percentage of global GDP is ex-pected to surpass 100% for the first time ever.
Financial conditions also remained highly accommodative across the world, with central banks keeping short-term inter-est rates anchored near zero in every major economy. The US Federal Reserve, having rejoined the near-zero club in March, promised to renew its membership, guiding for ultra-low rates through 2022 in anticipation of a slow and laborious recovery. The Fed also took the unusual step of purchasing corporate bonds directly, a step to which it committed in March to en-hance bond market liquidity. It also ordered banks to limit dividends and suspend share buybacks to preserve capital un-til the cumulative effects of the pandemic on eventual loan losses are clearer. Both the European Central Bank and Bank of Japan expanded their lending packages for cash-strapped firms, whereas the People’s Bank of China cut bank reserve requirements yet again and pumped funds into rural and re-gional lenders.
Currency effects showed a near uniform reversal of the flight to safety experienced in the first quarter. Nearly every major currency appreciated against the US dollar, though currencies of many commodity-exporting countries are still significantly negative for the half year. The British pound also remained negative for the half year as stalled Brexit negotiations contin-ued to weigh on it.
While a nascent economic recovery seems underway, most cycli-cal sectors did not lead the market rally, nor did the pattern of
MARKET PERFORMANCE (USD %)
MARKET 2Q 2020
CANADA 20.4
EMERGING MARKETS 18.2
EUROPE EMU 20.1
EUROPE EX-EMU 11.1
JAPAN 11.6
MIDDLE EAST 20.1
PACIFIC EX-JAPAN 20.2
UNITED STATES 21.8
MSCI ACW INDEX 19.4
TRAILING 12 MONTHS
-7.5
-3.0
-6.4
-6.3
3.5
1.9
-12.6
8.4
2.6
SECTOR PERFORMANCE (USD %)OF THE MSCI ACW INDEX
Source: FactSet (as of June 30, 2020). MSCI Inc. and S&P.
TRAILING 12 MONTHS
9.3
9.7
0.4
-33.3
-17.2
15.2
-7.5
32.4
-4.2
-9.8
-1.6
SECTOR 2Q 2020
COMMUNICATION SERVICES 19.9
CONSUMER DISCRETIONARY 28.7
CONSUMER STAPLES 9.3
ENERGY 18.2
FINANCIALS 12.2
HEALTH CARE 15.5
INDUSTRIALS 17.5
INFORMATION TECHNOLOGY 30.1
MATERIALS 25.8
REAL ESTATE 11.2
UTILITIES 6.9

3
quarter. China, in contrast to its world-beating first quarter, trailed the index performance in the second. Japan also lagged relative to its outperformance from the first quarter, while Eu-rope outside the eurozone was weighed down by poor returns from the United Kingdom and Switzerland.
Like last quarter, style effects showed continued investor pref-erence for growth and, to a lesser extent, quality. Stocks in the group of fastest-growing companies outperformed the slowest-growing by a massive 1850 basis points. While shares of the cohort of highest-quality companies, specifically those with more consistent returns and low leverage, slightly out-performed the index, the effect was not nearly as pronounced as for growth. Expensive stocks once again outperformed the cheapest. The value index flashed a brief period of outper-formance from mid-May through early June, only to retreat toward the end of the quarter.
PERFORMANCE AND ATTRIBUTION
The Global Equity ADR Composite rose 25.9% in the quarter, well ahead of the 19.4% rise of the MSCI All Country World Index (ACWI). The charts to the right attribute the quarter’s performance by sector and region.
Our hefty weight in the market-leading IT sector along with light holdings in the lagging Consumer Staples sector helped relative returns, but good stocks were the key to the quarter’s outperformance. Our stocks in the IT sector did particularly well, led by strong gains from PayPal, which benefited from the lockdown-induced acceleration in e-commerce transac-tions as well as a heightened aversion to handling cash (or even physical credit cards), resulting in strong growth in Pay-Pal’s “card not present” transactions. Additionally, it gained new users as people discovered they could receive government aid payments via its app rather than waiting for a check in the mail. Gains also came from new holding The Trade Desk, a digital advertising platform reporting strong first quarter sales in May, and NVIDIA, which marked the expanding uses of its computer chips from gaming into artificial intelligence with an announcement of a partnership with Mercedes-Benz for autonomous driving.
Good stocks contributed in other sectors as well. In Finan-cials they included US banks First Republic Bank and SVB Financial Group. Among our Health Care investments, DNA sequencing specialist Illumina was boosted by US FDA ap-proval of its diagnostic test for COVID-19, while shares of orth-odontic dentistry supplier Align Technology soared after the
company noted that sale volumes were recovering as countries reopened from lockdowns. Those good results were dented by poor stocks within Consumer Discretionary, where the largest detractors were Chinese ecommerce giant Alibaba and online travel agents Trip.com Group and Booking Holdings (the lat-ter was sold in the quarter).
Viewed by geography, the portfolio posted positive stock se-lection in every region except Pacific ex-Japan. The US con-tributed much of the good relative performance, led by the IT stocks mentioned above, along with ProtoLabs and eBay. Our holdings in Emerging Market internet businesses also added to relative performance, especially Chinese mobile games and so-cial media platforms Tencent and NetEase, along with Russian search provider Yandex. These strong results were tempered by negative stock selection in Pacific ex-Japan, namely from the Hong Kong-listed Asian life insurer AIA Group. Its shares reacted poorly to China’s blunt steps toward increasing politi-cal control over Hong Kong, raising concerns as to whether
Companies held in the portfolio during the quarter appear in bold type; onlythe first reference to a particular holding appears in bold. The portfolio isactively managed therefore holdings shown may not be current. Portfolioholdings should not be considered recommendations to buy or sell anysecurity. It should not be assumed that investment in the security identifiedhas been or will be profitable. To request a complete list of holdings for thepast year, please contact Harding Loevner. A complete list of holdings atJune 30, 2020 is available on page 9 of this report.
-6.0
-3.0
0.0
3.0
6.0
INF
T
CO
MM
FIN
A
IND
U
UTI
L
STP
L
RLS
T
HLT
H
EN
ER
MA
TS
DS
CR
CA
SH
Eff
ect
(%)
Selection Effect Allocation Effect Total Effect
SECTOR PERFORMANCE ATTRIBUTIONSECOND Q UARTE R 2 0 2 0
GLOBAL EQUITY ADR COMPOSITE VS. MSCI ACW INDEX
Total Effect: 6.4 Selection Effect: 5.8 Allocation Effect: 0.6
GEOGRAPHIC PERFORMANCE ATTRIBUTIONSECOND Q UARTE R 2 0 2 0
GLOBAL EQUITY ADR COMPOSITE VS. MSCI ACW INDEX
Source: FactSet; Harding Loevner Global Equity ADR Composite; MSCI Inc. andS&P. The total effect shown here may differ from the variance of the Compositeperformance and benchmark performance shown on the first page of thisreport due to the way in which FactSet calculates performance attribution. Thisinformation is supplemental to the Composite GIPS Presentation.
-6.0
-3.0
0.0
3.0
6.0
US
XE
MU
EM
ER
GE
JAP
AN
EM
U
MID
EA
ST
CA
NA
DA
PA
CX
J
CA
SH
Eff
ect
(%)
Selection Effect Allocation Effect Total Effect
Total Effect: 6.4 Selection Effect: 6.6 Allocation Effect: -0.2

4
AIA’s policy sales in Hong Kong, some of which are made to mainland Chinese buyers looking to diversify their financial wealth, would suffer under the tighter regime.
From both a geographical and sector perspective, the biggest drag on performance this quarter was our cash holding. We kept, on average, 3% of the portfolio in cash during the quarter for potential investment opportunities arising from volatility. While we value the flexibility that provides, when markets rise as much as they did this quarter, it will negatively impact performance.
PERSPECTIVE AND OUTLOOK
The astounding rally in equity markets since the March 23 lows has opened a chasm between resurging prices for risky assets and a beleaguered global economy reeling from the ongoing pandemic. This disparity has bewildered many investors caught flat footed and provoked an outpouring of angst aimed square-ly at the runup in prices. But share prices are not barometers of the current state of affairs. They are a discounting mechanism, a mechanism that invariably races ahead of current events, typically declining ahead of oncoming slowdowns and spring-ing to life well before the first signs of recovery. Under this reckoning, prevailing asset prices are merely seeing across the valley of the current malaise and anticipating an imminent and inevitable turnaround. With lockdowns easing, fledgling signs of a pickup in demand, and burgeoning optimism about vac-cines, investors have copious reasons for raising their gazes to the peaks beyond.
Such an optimistic view, however, ignores the outsized and equivocal role being played by government assistance in revi-talizing risk appetites. Working hand in glove, fiscal and mon-etary authorities the world over have unleashed a torrent of aid in a bid to contain the crisis. Along with the customary fiscal stabilizers that kick-in automatically during downturns, inter-est rates have been slashed, asset purchase programs replen-ished, and outright financial grants extended further than at any other period outside of wartime. By some estimates, global central banks have injected close to US$17 trillion of liquidity into the financial system, while global fiscal support, according to the IMF, currently amounts to over US$11 trillion, a figure that understates the total effect on spending once multipliers are taken into account.
But what’s qualitatively different this time, and triggering added apprehension, is the vastly expanded role of the Fed-eral Reserve Board (FRB) and other central banks in developed countries—i.e., monetary policy writ large. Behind the alpha-bet soup of liquidity facilities and market support programs is an unambiguous expansion of the major central banks’ pre-rogatives and burdens. In addition to their traditional role of inflation guardian and lender of last resort, the central bank has been recast as fiscal partner to elected legislatures and in-vestor of last resort, responsible not just for well-functioning markets but also for capping credit costs and curtailing investor losses. Although the Fed has not yet dipped its toe into buying
equities, should it desire further tools for stimulus the prec-edent has already been set by the Bank of Japan and the Swiss National Bank, along with the Hong Kong Monetary Authority, which bought stocks heavily all the way back in 1998.
Not since the Governorship of Marriner Eccles in the 1930’s and 40’s has US monetary policy found itself bound up so tightly with US fiscal objectives. According to the historian Trevor Jackson, “In terms of crisis governance, the United States is not a country with a central bank; it is a central bank with a country.” Further extending its tendrils into every nook and cranny of the financial system, it added, for the first time, a cross section of corporate bonds to its balance sheet—including those issued by Apple, the antithesis of a struggling enterprise. By undertaking a massive expansion of its balance sheet without triggering inflation, the Fed is walking an increasingly frayed tightrope.
When faced with colossal economic or political shocks, our response is stubbornly to follow the same script: we note the scale of the shock; attempt to assess the company- and indus-try-level implications; stop occasionally to think about how it ought to cause us to change our investment process, inevita-bly concluding that only incremental adjustment is warranted; and eventually (or, better, promptly) return to our knitting. That knitting consists of a resolutely bottom-up, fundamental appraisal of the growth prospects for a select group of high-quality companies, and what they might be worth. The current episode would be no different, if it weren’t for the difficulties we are having in that final piece—ascertaining what an excel-lent company might be worth. We have returned to our knit-ting, but there are faintly audible curses to be heard over the clatter of busy needles.
We have consistently tried to be clear-eyed and disciplined about distinguishing between a company and its shares. The fundamental attributes of great businesses, those with strong competitive positions, attractive growth prospects, sound fi-nances, and able managements, tend to persist through time. Their shares, however, are more fickle, tending to reflect the insecurities and enthusiasms of other investors, connected to the company’s true underlying value only by the stories be-ing told about its future, which are greatly affected by the moods of the storyteller and his audience. We were fortunate to recognize some years ago that, in an environment of scarce growth and low interest rates, companies consistently deliver-ing strong organic revenue growth and profits to match would be highly prized by investors. Those low interest rates would allow investors to discount the profits from distant growth back into the present only modestly diminished by the passage of time.
Not since the Governorship of Marriner Eccles in the 1930’s and 40’s has US monetary policy
found itself bound up so tightly with US fiscal objectives.
5
coincided with the fastest growth in productivity in the nation’s history. But, for this process to proceed, companies that are no longer viable in a post-crisis world must eventually be allowed to fail and the workers redirected toward the new faster grow-ing spheres. The danger is that prolonged and possibly mis-directed government support, designed as a bridge to a non-existent future that looks like the past, might interfere with this painful but ultimately salutatory transition and, in so doing, reduce the longer-term prospects for prosperity.
Another conceivable consequence of central bank largesse is the convergence between growth, quality and momentum investment styles. Most objective metrics of quality typically include measures of corporate profitability, which is more readily achieved when growth avenues are available, and it’s not unusual to see growth and quality styles move together in the stock market. But the ongoing, sustained outperformance of growth investing has led to a greater overlap between the quality-and-growth nexus with portfolios based purely on stock price momentum. Of course, this is nothing exceptional since the mechanical rules underlying momentum portfolios simply overweight the most recent outperformers, of which growth-and-quality companies currently make up a disproportionate share. We typically ignore the overlap between different invest-ment styles, as the ebb and flow of relative style performance is best viewed as creating opportunity for stock selection. But momentum has an unfortunate and, in our view, unsatisfacto-ry longer-term history. Despite a passable overall track record, momentum investing tends occasionally to suffer a spectacular wipeout, wherein multiple years of outperformance are given back in the space of weeks if not days. The last of these oc-curred in April 2009, when a winner-minus-loser momentum portfolio made up of US stocks fell over 45% in a single month while the broad market climbed 10% over the same period.1
Presently, the concern is that momentum crashes seem to oc-cur most frequently after a large market decline, during times of higher than usual uncertainty and when volatility is high—conditions that are too similar to the present environment to be easily dismissed. Although central bank policy of ultra-low in-terest rates may be the proximate cause, momentum’s intrinsic instability makes us nervous that a reckoning may come before current policy has run its course.
So far, the world’s various central banks and government spending programs seem to have fulfilled their mission in calming markets, stabilizing credit institutions, and underpin-ning the economy. Asset prices are flirting with their previous all-time highs, and business activity is beginning the process of recovery. But there is still a long way to go on the latter, and the longer-term economic picture continues to deteriorate. On the present course, should the virus continue to frustrate containment efforts or recovery prove elusive, in the absence of any alternatives it seems likely that authorities will stick to their playbook of liquidity provision and income transfers. Unlike the global financial crisis, where emergency liquid-
At the moment, however, investors are confronted by dramati-cally increased uncertainty about how and when the global economy can recover from the ravages of the global pandemic, and in addition whether the prospects for any given company, assuming it survives to the other side of the chasm, will be radically altered once it is reached. The pandemic has been a boon for companies such as Amazon and Alibaba, which have provided the home delivery lifeline for hundreds of millions of consumers under lockdown. Likewise, the social media plat-form giants Tencent and Facebook have enabled increased in-teractions by people starved for diversion or human connection during isolation, while PayPal and MasterCard (along with AliPay and WeChatPay or Adyen) have accelerated the demise of physical cash transactions.
The problem in trying to value these rapidly growing compa-nies is that we can’t really know whether the crisis has mere-ly brought forward their future growth (which was arguably already embedded in investor expectations and thus in the stock price), or whether it has also expanded their addressable market, thereby extending the duration of their rapid growth. The market’s view is clear: it is apparent that one of the lesser-known effects of COVID-19 is to supercharge the embedded growth expectations for the largest and fastest-growing com-panies. Rising to new highs this quarter, the stock prices of these companies continue to stand near the extremes of valua-tion relative to all other stocks that we highlighted last quarter, even as the entire market has rebounded. So far into the future is the profit growth that some stock prices discount today that our tolerance of high prices begins to feel more like an embrace of fundamental uncertainty: the uncertainty of whether we can even begin to properly analyze the growth dynamics or com-petitive forces that result from new technologies, new business models, or changes in government regulation or taxation not yet on our radar.
That fog of uncertainty is infused with the biggest serving of monetary stimulus ever ladled out from the proverbial punch-bowl. While we are certain that such stimulus is the right course of action by governments aimed at preserving their citizens and the business enterprises and other institutions that make up their economies, we are much less sure that the double-bar-reled fiscal and monetary blunderbuss just fired will not rico-chet to wound investors, especially growth investors, on the far side of the pandemic.
Muscular market interventions are likely to suffer from dimin-ishing returns and there is a distinct possibility that the near-term achievement of higher asset prices has been purchased at the cost of weaker longer-term growth—specifically, a dimin-ished prospect for creative destruction. Within every economic crisis is a silver lining as the business downturn accelerates the demise of marginal businesses and industries. This paves the way for new business models to emerge from the wreckage. Creative destruction clears out the redundant capital and frees up skilled labor, thereby opening the way for new growth vec-tors, like a forest fire clearing the underbrush for new seedlings to grow from the ashes. The 1930’s were devastating but also 1Long/Short portfolio.

6
ity—primarily directed toward banks to repair their balance sheets—was contained within the financial sector, in the cur-rent episode liquidity has been spread far more widely. Under such a scenario, and with the decline in global trade further pressuring aggregate supply, could we see a jump in inflation? Given how low it is today, it wouldn’t take much of a jump to spook markets. The last time US monetary policy was similarly entwined with government spending plans, it took a dramatic increase in inflation ignited by the Korean War for the Federal Reserve finally to put its foot down. After an acquiescent mon-etary policy that lasted throughout the Great Depression and World War II, and a mere three years after the departure of Marriner Eccles, the Federal Reserve, aghast at what it viewed as the carelessness of the Treasury in stoking inflation, de-manded its independence. President Truman caved and signed the Treasury accords splitting the role of debt management from monetary policy, an agreement that is still technically in force today.
The prospect of a burst of inflation may seem like a distant concern in a world still mired in a deflationary shock. So far at least, the efforts to avert a disorderly collapse in financial markets during the pandemic have been a success. A necessary first step to avoid a more damaging economic slowdown. The true cost of that success however may only be revealed slowly over the coming quarters and years.
PORTFOLIO HIGHLIGHTS
Last quarter, we highlighted the wide disparities in valuation commanded by the fastest-growing companies across nearly all markets, and noted the conundrum we are wrestling with dai-
ly: namely, the trade-off between our dedication to investing in growing, high-quality businesses and our appreciation that the price you pay for their shares will strongly influence the return you earn on the investment, at least in the medium term, if not in either the short run or the long run. (See our letter from 1Q18 addressing the latter.) It’s worth pointing out how that conundrum has been expressed in the structure of the portfo-lio over the past few years. In the chart immediately below, we show how the fastest-growing quintiles of companies in the ACW Index have experienced a distinct and growing valuation premium over the rest of the index constituents over the past few years, based on our rankings of a composite of traditional valuation metrics.
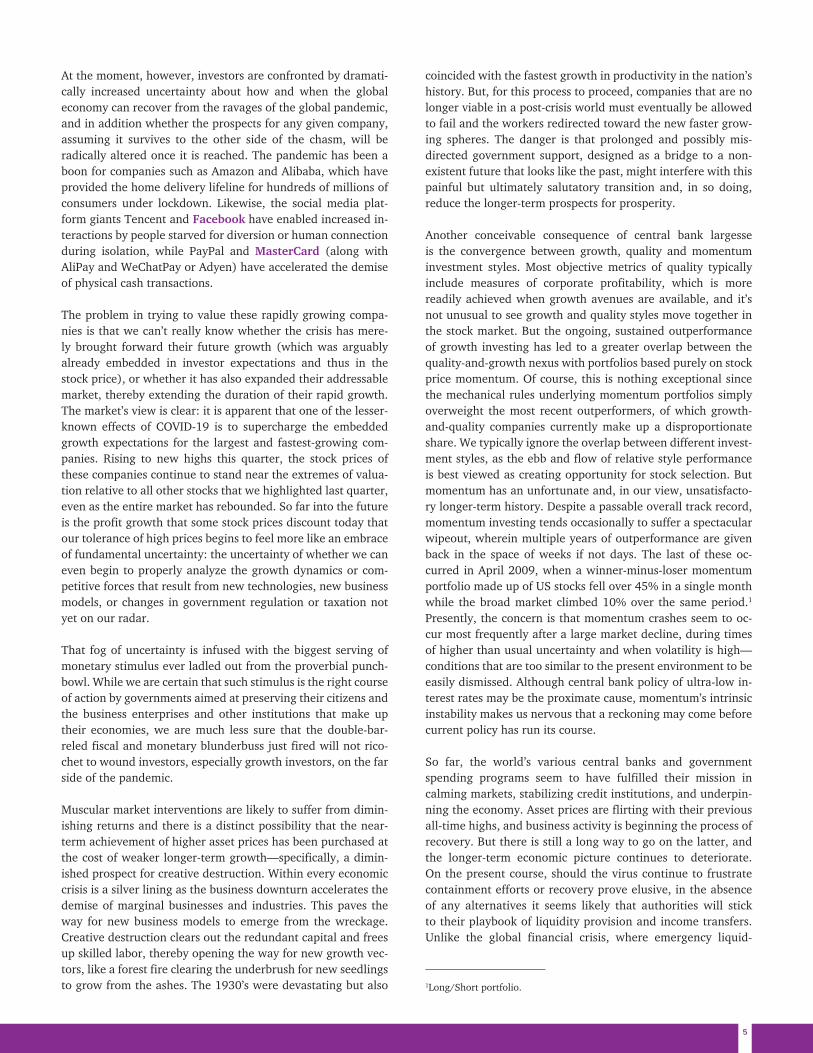
Consistent readers of these quarterly missives will recall that we have worried aloud about the rising prices of shares in the kind of companies we most admire, going back to the 4Q14 letter. But our portfolio valuation statistics have remained fairly high themselves, prompting the question of whether all the handwringing was just that, without follow-through in ac-tions. The next chart, though, shows that we have acted upon our waning enthusiasm for the fastest-growing companies over those same four years, with our aggregate holdings in the speediest quintile shrinking by eleven percentage points since mid-2016, while our holdings in the next lower (but still above average) growth cohort increased by more than four-teen points.
That’s a shift of a tenth of the portfolio from the fastest-growing companies to the merely robustly growing, driven primarily by a desire to avoid the most expensive stocks in our own qualified opportunity set. To be clear, pulling back on those valuation risks has come at a cost: the cohort of fastest-growing compa-
0.2
0.3
0.4
0.5
0.6
0.7
0.8
Che
ap
R
elat
ive
Val
uati
on
Exp
ensi
ve
Quintile 1 (Fastest Growth) Quintile 2 Quintile 3 Quintile 4 Quintile 5 (Slowest Growth) MSCI ACW Index
Source: FactSet; MSCI Inc. and S&P. Data as of June 30, 2020.
VALUATION RANK OF MSCI ACW INDEX BY GROWTH QUINTILES
7
nies has outperformed strongly over most of that period, as it has done once again this quarter.
As for transactions this quarter, as usual, they fall into several buckets. First, there are sales that recognize that the invest-ment thesis we had envisioned is either marred by disappoint-ing growth in fundamentals or is now not expected to work as envisioned. We’d include the sale of Walgreens Boots Alli-ance and Baidu in the former category and the sales of Book-ing Holdings and EssilorLuxottica in the latter category. We believe structural growth challenges from the pandemic will put great strain on potential weaknesses within business and governance models.
In Booking’s case, we believe bargaining power may weaken in its key European market to the extent that large hotel chains use their superior financial strength to consolidate market share in this historically fragmented market characterized by small hotel operators, which has long been favorable for Booking’s pricing power. Further, we are aware of Booking’s historical re-liance on Google for a large percentage of its business. Should Google pursue forward integration in its ever-expanding travel search business, Booking would almost certainly be adversely affected. We believe the odds of either or both risks manifest-ing are materially higher post pandemic than prior—hence our belief that risk-reward has turned unfavorable for Booking rela-tive to the many investment alternatives available to us.
In EssilorLuxottica’s case, we are concerned that underlying governance strains in the merger that have yet to be addressed
may impede effective management decision-making that will be required to address the acute growth challenges facing the group in light of the pandemic. We believe actions mitigating the negatives and capitalizing on the positives from the pan-demic across our companies requires a very high level of effec-tive management decision making. We are not convinced the requisite level of management responsiveness and foresight is probable at EssilorLuxottica while underlying governance is-sues remain unresolved.
Second, there are purchases of high-quality businesses whose growth has been temporarily (in our view) dented or inter-rupted, but whose share price has become very attractive as other investors extrapolate their current woes. We added to existing holdings in three Emerging Market oriented banks in the quarter: Brazil’s Itaú Unibanco and India’s HDFC Bank. Both companies’ shares had fallen sharply as the pandemic gathered force, but we believe their franchises will not only survive the downturn but thrive through the recovery. We also added to Japanese cosmetics producer Shiseido, whose shares have performed poorly even before the pandemic, but whose brands still command strong loyalty across Asia, where con-sumption patterns are likely to return to normal sooner than
The preceding charts divide the Index and Harding Loevner’s Global Equity ADR Portfolio into quintiles according to Harding Loevner’s Growth and Value rankings, which are proprietary measures determined using objective data. Growth rankings are based on historical growth of earnings, sales, and assets, as well as expected changes in earnings and profitability. Value rankings are based on several valuation measures, including price ratios.
-10
-5
0
5
10
15
20
25
30
35
Act
ive
Wei
ght
Quintile 1 (Fastest Growth) Quintile 2
Source: FactSet; Harding Loevner Global Equity ADR Model; MSCI Inc. and S&P. Data as of June 30, 2020.
HL GLOBAL EQUITY ADR PORTFOLIO ACTIVE WEIGHT IN THE TOP TWO GROWTH QUINTILES
We have added to holdings in three Emerging Market-oriented banks. All were early
casualties of the pandemic that we believe will thrive during the recovery.
8
in other regions where the response to COVID-19 has been less well-managed.
Third, we trimmed several US holdings whose very strong share price performance left them both more highly valued and at a larger weight in the portfolio. We reduced NVIDIA, the chipmaker for ultra-fast computer applications, Verisk, the data service provider for insurers, and PayPal, the online pay-ments platform.
Fourth and finally, we returned to buy former holdings once again in Amazon and in Tencent. In Amazon, we return to a company that we’d owned for most of the past decade but had sold twice on valuation grounds and worries about capital in-tensity—most recently just eight months ago. As the corona-virus spread in the US, we reasoned that Amazon was clearly integral to its customers’ ability to weather the lockdown, and any lingering political risk would be assuaged by its prodigious efforts through the crisis. In our view the company’s growth prospects have significantly improved—or been telescoped nearer to the present—by consumer behavioral changes arising from the pandemic, and its scale advantages will allow it to roll out new services at attractive prices that competitors will struggle to match.
In Tencent, we are returning to one of China's strongest digi-tal economy franchises. The digital economy across China is continuing to grow rapidly and may also benefit from a host of behavioral changes post COVID-19 that could extend the duration of its rapid growth. Tencent has multiple long-term growth drivers ranging from expanding its overseas share in mobile games, to accelerating advertising via constant innova-tion across its burgeoning WeChat social media ecosystem, to greater online entertainment subscription growth, to develop-ing more fintech services on top of its already-pervasive elec-tronic payments platform, to offering cloud software services that enable other Chinese enterprises and institutions to de-velop broader digital capabilities. The firm has a wealth of R&D staff developing new technologies along with a broad exter-nal technology investment portfolio, and its financial strength should allow it to exploit those advantages to pursue attractive growth opportunities in several directions at once.
Portfolio Management Team Update
We are pleased to announce that, on January 1, 2021, Jingyi Li will succeed Ferrill Roll, CFA as co-lead portfolio manager of the Global Equity ADR strategy. Peter Baughan, CFA will con-tinue as the strategy’s other co-lead. Portfolio managers Rick Schmidt, CFA, Chris Mack, CFA, and Scott Crawshaw also will continue to support the Global strategy by managing model portfolios. While no longer a portfolio manager on this strat-egy, Ferrill will remain engaged with it in his role as Chief Investment Officer.
Jingyi joined Harding Loevner in 2010. During the years since, he has achieved outstanding results as an analyst and as a port-folio manager on (at various times) three strategies including Global Equity. His analyst responsibilities have included com-panies in the global Industrials and Utilities sectors as well as a variety of Chinese companies. A partner of Harding Loevner, Jingyi is an acknowledged intellectual leader whose trenchant critiques and insight contribute to his colleagues’ investment decision-making as well as his own. Before joining Harding Lo-evner, Jingyi worked in management consulting at Accenture and China International Economics Consultants, and in private equity at New China Capital Management. He graduated from Shanghai Jiaotong University with a BA in International Trade and earned an MBA from the Yale School of Management.
Management Update
At the end of this year, as the natural next step in a long-planned succession, Ferrill Roll, who has shared Chief Invest-ment Officer responsibilities with Simon Hallett, CFA since 2016, will become sole CIO. Simon will continue to contrib-ute actively to Harding Loevner and our clients by engaging in the thought leadership activities he relishes, exploring and educating internal and external audiences on vital investment questions. He will remain a partner of Harding Loevner and continue to advise us on strategic matters as vice chairman of the firm’s Executive Committee.

9
Model Portfolio holdings are supplemental information only and complement the fully compliant Global Equity ADR Composite GIPS Presentation. The portfolio is actively managed therefore holdings shownmay not be current. Portfolio holdings should not be considered recommendations to buy or sell any security. It should not be assumed that investment in the security identified has been or will beprofitable. To request a complete list of portfolio holdings for the past year contact Harding Loevner.
SECTOR/COMPANY/DESCRIPTION COUNTRY END WT (%)
COMMUNICATION SERVICES
ALPHABET Internet products and services US 2.9
DISNEY Diversified media and entertainment provider US 0.9
FACEBOOK Social network US 2.6
NETEASE Gaming and internet services China 1.4
TENCENT Internet and IT services China 2.4
YANDEX Internet products and services Russia 1.5
CONSUMER DISCRETIONARY
ALIBABA E-commerce retailer China 1.9
AMAZON.COM E-commerce retailer US 1.7
EBAY E-commerce retailer US 1.1
NIKE Athletic footwear and apparel retailer US 1.8
TRIP.COM GROUP Online travel services China 1.0
CONSUMER STAPLES
COLGATE PALMOLIVE Consumer products manufacturer US 0.9
ESTÉE LAUDER Cosmetics manufacturer US 1.0
L'ORÉAL Cosmetics manufacturer France 1.1
NESTLÉ Foods manufacturer Switzerland 1.3
SHISEIDO Consumer products manufacturer Japan 1.1
ENERGY
EXXONMOBIL Oil and gas producer US 1.6
FINANCIALS
AIA GROUP Insurance provider Hong Kong 2.3
BANK CENTRAL ASIA Commercial bank Indonesia 1.3
BBVA Commercial bank Spain 0.7
FIRST REPUBLIC BANK Private bank and wealth manager US 2.3
HDFC BANK Commercial bank India 1.6
ICICI BANK Commercial bank India 1.2
ITAÚ UNIBANCO Commercial bank Brazil 2.6
SVB FINANCIAL GROUP Commercial bank US 0.9
HEALTH CARE
ABBOTT LABS Health care products manufacturer US 1.3
ABCAM Life science services UK 1.3
ALCON Eye care products manufacturer Switzerland 1.2
ALIGN TECHNOLOGY Orthodontics products manufacturer US 1.1
ILLUMINA Life science products and services US 2.7
LONZA Life science products developer Switzerland 3.1
SONOVA HOLDING Hearing aids manufacturer Switzerland 0.9
SYSMEX Clinical laboratory equipment manufacturer Japan 1.8
UNITEDHEALTH GROUP Health care products and services US 0.9
VERTEX PHARMACEUTICALS Pharma manufacturer US 3.7
WATERS Analytical instruments manufacturer US 1.0
GLOBAL EQUITY ADR HOLDINGS (AS OF JUNE 30, 2020)
SECTOR/COMPANY/DESCRIPTION COUNTRY END WT (%)
INDUSTRIALS
3M COMPANY Diversified product manufacturer US 0.6
FANUC Industrial robot manufacturer Japan 0.6
JOHN DEERE Industrial equipment manufacturer US 1.1
KONE Elevator and escalator manufacturer Finland 1.0
KUBOTA Industrial and consumer equipment manufacturer Japan 0.9
MAKITA Power tool manufacturer Japan 0.9
NIDEC Electric motor manufacturer Japan 0.9
PROTOLABS Prototype manufacturing services US 1.1
ROPER Diversified technology businesses operator US 2.8
VERISK Risk analytics and assessment services US 2.2
INFORMATION TECHNOLOGY
APPLE Consumer electronics and software developer US 2.6
COGNIZANT IT consultant US 0.7
EPAM IT consultant US 1.1
MASTERCARD Electronic payment services US 2.2
MICROSOFT Consumer electronics and software developer US 3.1
NETWORK INTERNATIONAL Electronic payment services UK 0.7
NVIDIA Semiconductor chip designer US 1.1
PAYPAL Electronic payment services US 5.0
SALESFORCE.COM Customer relationship management software US 1.1
SYNOPSYS Software developer and chip designer US 1.3
THE TRADE DESK Digital advertising management services US 1.5
WORKDAY Enterprise resource planning software US 1.0
MATERIALS
AIR LIQUIDE Industrial gases producer France 1.1
CHR. HANSEN Natural ingredients developer Denmark 0.8
LINDE Industrial gases supplier and engineer US 1.5
SYMRISE Fragrances and flavors manufacturer Germany 2.4
REAL ESTATE
No Holdings
UTILITIES
No Holdings
CASH 2.6

10
The portfolio is actively managed therefore holdings identified above do not represent all of the securities held in the portfolio and holdings may not be current.It should not be assumed that investment in the securities identified has been or will be profitable. The following information is available upon request: (1)information describing the methodology of the contribution data in the charts above; and (2) a list showing the weight and contribution of all holdings duringthe quarter and the last 12 months. Past performance does not guarantee future results. In the charts above, “weight” is the average percentage weight of theholding during the period, and “contribution” is the contribution to overall performance over the period. Contributors and detractors exclude cash and securitiesin the Composite not held in the Model Portfolio. Quarterly data is not annualized. Portfolio attribution and characteristics are supplemental information onlyand complement the fully compliant Global Equity ADR Composite GIPS Presentation. Portfolio holdings should not be considered recommendations to buy orsell any security.
PORTFOLIO CHARACTERISTICS
1Weighted median; 2Trailing five years, annualized; 3Five-year average; 4Weighted harmonic mean; 5Weighted mean. Source (Risk characteristics): eVestment Alliance (eA); Harding Loevner Global Equity ADRComposite, based on the Composite returns; MSCI Inc. Source (other characteristics): FactSet (Run Date: July 5, 2020, based on the latest available data in Factset on this date.); Harding Loevner Global EquityADR Model, based on the underlying holdings; MSCI Inc.
QUALITY & GROWTH HL GADR MSCI ACWI
PROFIT MARGIN1 (%) 16.3 13.6
RETURN ON ASSETS1 (%) 8.6 7.3
RETURN ON EQUITY1 (%) 18.3 16.9
DEBT/EQUITY RATIO1 (%) 55.0 78.2
STD DEV OF 5 YEAR ROE1 (%) 3.6 5.1
SALES GROWTH1,2 (%) 10.3 5.8
EARNINGS GROWTH1,2 (%) 14.0 11.0
CASH FLOW GROWTH1,2 (%) 13.0 9.3
DIVIDEND GROWTH1,2 (%) 7.8 8.2
SIZE & TURNOVER HL GADR MSCI ACWI
WTD MEDIAN MKT CAP (US $B) 54.4 66.3
WTD AVG MKT CAP (US $B) 248.1 247.4
RISK AND VALUATION HL GADR MSCI ACWI
ALPHA2 (%) 3.43 —
BETA2 1.04 —
R-SQUARED2 0.95 —
ACTIVE SHARE3 (%) 88 —
STANDARD DEVIATION2 (%) 15.28 14.38
SHARPE RATIO2 0.64 0.41
TRACKING ERROR2 (%) 3.4 —
INFORMATION RATIO2 1.13 —
UP/DOWN CAPTURE2 116/97 —
2Q20 CONTRIBUTORS TO ABSOLUTE RETURN (%)
2Q20 DETRACTORS FROM ABSOLUTE RETURN (%)
LAST 12 MOS CONTRIBUTORS TO ABSOLUTE RETURN (%)
LAST 12 MOS DETRACTORS FROM ABSOLUTE RETURN (%)
LARGEST CONTRIBUTORS SECTOR AVG. WT. CONTRIBUTION
PAYPAL INFT 4.6 3.18
VERTEX PHARMACEUTICALS HLTH 4.5 1.07
APPLE INFT 2.5 0.98
THE TRADE DESK INFT 1.2 0.98
ALIGN TECHNOLOGY HLTH 1.8 0.92
LARGEST CONTRIBUTORS SECTOR AVG. WT. CONTRIBUTION
PAYPAL INFT 4.3 2.19
VERTEX PHARMACEUTICALS HLTH 3.5 2.18
NVIDIA INFT 1.8 1.96
APPLE INFT 2.6 1.65
MICROSOFT INFT 2.7 1.39
LARGEST DETRACTORS SECTOR AVG. WT. CONTRIBUTION
SONOVA HOLDING HLTH 2.3 -1.08
SCHLUMBERGER ENER 0.9 -1.03
ICICI BANK FINA 2.1 -0.88
BOOKING HOLDINGS DSCR 2.2 -0.81
SASOL MATS 0.3 -0.61
LARGEST DETRACTORS SECTOR AVG. WT. CONTRIBUTION
WALGREENS BOOTS ALLIANCE STPL 0.3 -0.13
BAIDU COMM 0.6 -0.05
UNITEDHEALTH GROUP HLTH 0.1 0.02
ESTÉE LAUDER STPL 0.1 0.02
WATERS HLTH 2.0 0.02
PRICE/EARNINGS4 30.5 19.4
PRICE/CASH FLOW4 25.1 12.1
PRICE/BOOK4 4.3 2.3
DIVIDEND YIELD5 (%) 0.9 2.4TURNOVER3 (ANNUAL %) 24.9 —
POSITIONS SOLD COUNTRY SECTOR
BAIDU CHINA COMM
BOOKING HOLDINGS US DSCR
COGNEX US INFT
ESSILORLUXOTTICA FRANCE DSCR
SCHLUMBERGER US ENER
WALGREENS BOOTS ALLIANCE US STPL
WATERS US HLTH
POSITIONS ESTABLISHED COUNTRY SECTOR
AMAZON.COM US DSCR
EPAM US INFT
SCHNEIDER ELECTRIC* FRANCE INDU
TENCENT CHINA COMM
THERMO FISHER SCIENTIFIC* US HLTH
COMPLETED PORTFOLIO TRANSACTIONS
*Schneider Electric and Thermo Fisher Scientific were initiated in the second quarter but completed in the Global ADR model after June 30, 2020.

400 CROSSING BLVD, FOURTH FLOOR • BRIDGEWATER, NJ 08807T (908)218-7900 • F (908)218-1915 • HARDINGLOEVNER.COM
©2020 HARDING LOEVNER
1Benchmark Index; 2Supplemental Index; 3Variability of the composite and the Index returns over the preceding 36-month period, annualized; 4Asset-weighted standard deviation (gross of fees); 5Total product accounts and assets are 3,330 and $640 million, respectively, at June 30, 2020, include bothseparately managed and unified managed accounts, and are presented as supplemental information; 6The 2020 YTD performance returns and assetsshown are preliminary; 7N.A.–Internal dispersion less than a 12-month period; 8N.M.–Information is not statistically significant due to an insufficientnumber of portfolios in the Composite for the entire year.
The Global Equity ADR Composite contains fully discretionary, dual contract, fee-paying accounts that may also pay a wrap fee to their custodianinvesting in US and non-US equity and equity-equivalent securities and cash reserves. The Composite was re-defined in March 2018, to allow for theinclusion of dual contract wrap portfolios. The percentage of wrap assets in the Composite as of December 31, 2019 was 3.65% and as of December 31,2018 was 42.46%. Securities are held in Depository Receipt (DR) form, including American Depository Receipts (ADRs) and Global Depository Receipts(GDRs), or are otherwise traded on US exchanges. For comparison purposes the Composite return is measured against the MSCI All Country WorldTotal Return Index. From 2001 (when the net index first became available) through December 30, 2012, the index return is presented net of foreignwithholding taxes. Beginning December 31, 2012, Harding Loevner LP presents the gross version of the index to conform the benchmark’s treatment ofdividend withholding with that of the Composite. The exchange rate source of the Composite is Bloomberg. Additional information about the benchmark,including the percentage of composite assets invested in countries or regions not included in the benchmark, is available upon request.
The MSCI All Country World Index is a free float-adjusted market capitalization index that is designed to measure equity market performance in the globaldeveloped and emerging markets. The Index consists of 49 developed and emerging market countries. The MSCI World Index is a free float-adjustedmarket capitalization index that is designed to measure global developed market equity performance. The Index consists of 23 developed market countries.You cannot invest directly in these Indices.
Harding Loevner LP claims compliance with the Global Investment Performance Standards (GIPS®) and has prepared and presented this report incompliance with the GIPS standards. Harding Loevner has been independently verified for the period November 1, 1989 through March 31, 2020.
Verification assesses whether (1) the firm has complied with all composite construction requirements of the GIPS standards on a firm-wide basis and(2) the firm’s policy and procedures are designed to calculate and present performance in compliance with GIPS standards. The Global Equity ADRComposite has been examined for the periods December 1, 1989 through March 31, 2020. The verification and performance examination reports areavailable upon request.
Harding Loevner LP is an investment adviser registered with the Securities and Exchange Commission. Harding Loevner is an affiliate of AffiliatedManagers Group, Inc. (NYSE: AMG), an investment holding company with stakes in a diverse group of boutique firms. The firm maintains a complete listand description of composites, which is available upon request.
Results are based on fully discretionary accounts under management, including those accounts no longer with the firm. Composite performance ispresented gross of withholding taxes on dividends, interest income and capital gains. Additional information is available upon request. Pastperformance does not guarantee future results. Policies for valuing portfolios, calculating performance, and preparing compliant presentations areavailable upon request. Performance for accounts paying a wrap fee is calculated including the trading costs associated with their wrap program.
Under a wrap fee program, a client is charged a specified fee, which is not based directly upon transactions in a client’s account, for investmentadvisory services (which may include portfolio management or advice concerning the selection of other investment advisors) and execution of clienttransactions.
The US dollar is the currency used to express performance. Returns are presented both gross and net of management fees and include thereinvestment of all income. Net returns are calculated using actual fees. Actual returns will be reduced by investment advisory fees and other expensesthat may be incurred in the management of the account. The standard fee schedule generally applied to separate Global Equity ADR accounts is 0.80%annually of the market value up to $20 million; 0.40% of amounts above $20 million. Actual investment advisory fees incurred by clients may vary. Theannual composite dispersion presented is an asset-weighted standard deviation calculated for the accounts in the Composite the entire year.
The Global Equity ADR Composite was created on October 31, 2001.
GLOBAL EQUITY ADR COMPOSITE PERFORMANCE (AS OF JUNE 30, 2020)HL GLOBAL ADR GROSS
(%)
HL GLOBALADR NET
(%)
MSCIACWI1
(%)
MSCIWORLD2
(%)
HL GLOBAL ADR 3-YR STD
DEVIATION3
(%)
MSCI ACWI3-YR STD
DEVIATION3
(%)
MSCI WORLD 3-YR STD
DEVIATION3
(%)
INTERNAL DISPERSION4
(%)
NO. OF ACCOUNTS5
COMPOSITE ASSETS5
($M)
FIRM ASSETS
(%)
2020 YTD6 3.34 2.90 -5.99 -5.48 16.64 16.03 16.02 N.A.7 5 23 0.04
2019 28.18 27.18 27.30 28.40 12.51 11.21 11.13 N.M.8 5 23 0.04
2018 -9.05 -9.85 -8.93 -8.20 11.85 10.48 10.39 N.M. 2 2 0.00
2017 32.97 32.00 24.62 23.07 11.33 10.37 10.24 N.M. 3 3 0.01
2016 5.91 5.04 8.48 8.15 11.56 11.07 10.94 N.M. 3 2 0.00
2015 2.89 2.07 -1.84 -0.32 11.22 10.78 10.80 N.M. 5 4 0.01
2014 6.34 5.47 4.71 5.50 10.90 10.48 10.21 N.M. 5 4 0.01
2013 20.91 19.95 23.44 27.37 14.53 13.92 13.52 0.1 7 5 0.02
2012 18.53 17.56 16.80 16.54 17.52 17.11 16.72 0.5 7 4 0.02
2011 -8.70 -9.41 -6.86 -5.02 20.15 20.59 20.16 0.2 15 8 0.06
2010 13.33 12.44 13.21 12.34 22.87 24.51 23.74 0.8 37 31 0.28

12
This page intentionally left blank.